the rural development programme for england 2007 …
TRANSCRIPT
1
THE RURAL DEVELOPMENTPROGRAMME FOR ENGLAND 2007-2013
Annex to Chapter 3.4
Impacts of the previous programming period: EAGGF resources and other measures deployed to support rural development.
1. This Annex summarises information on expenditure under EuropeanAgricultural Guidance and Guarantee Fund (EAGGF) financed measures over the programming period 2000 -2006, and gives details of the known impact of this funding, details of the outputs arising from the schemes funded, and evaluations of the schemes and Programmes. It also provides information on other EU and domestic funding which supported rural development measures that were in operation concurrently with the England Rural Development Programme (ERDP) 2000-2006.
EAGGF Guarantee Section
2. In the programming period 2000–2006 the Rural DevelopmentRegulation (Council Regulation (EC) No 1257/1999) was implemented in England through ERDP.
3. Over the programming period, a total of £1.6 billion (€2.34 billion) wasallocated to the ERDP. Of this, £628m (€905m) was provided by the EAGGF Guarantee Section. The remainder of the Programme’s funding was made up from Community and additional national modulation of Pillar 1 direct support payments and national exchequer expenditure.
ERDP Outputs and Impacts
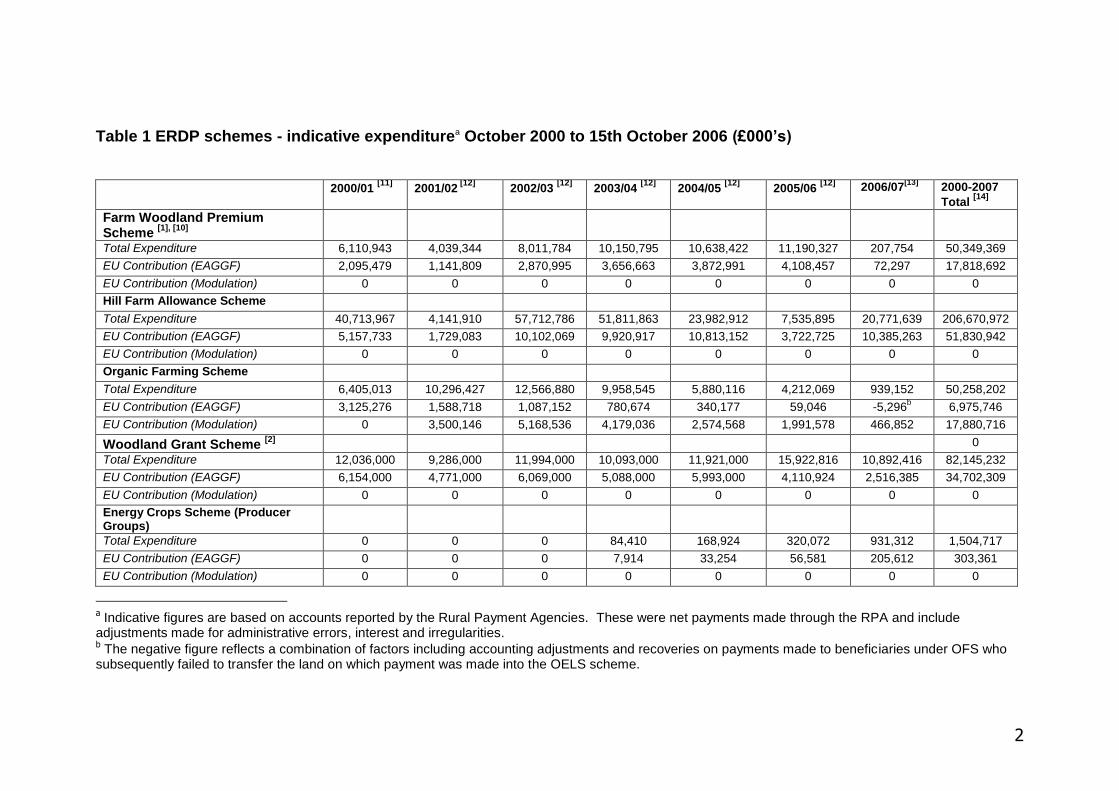
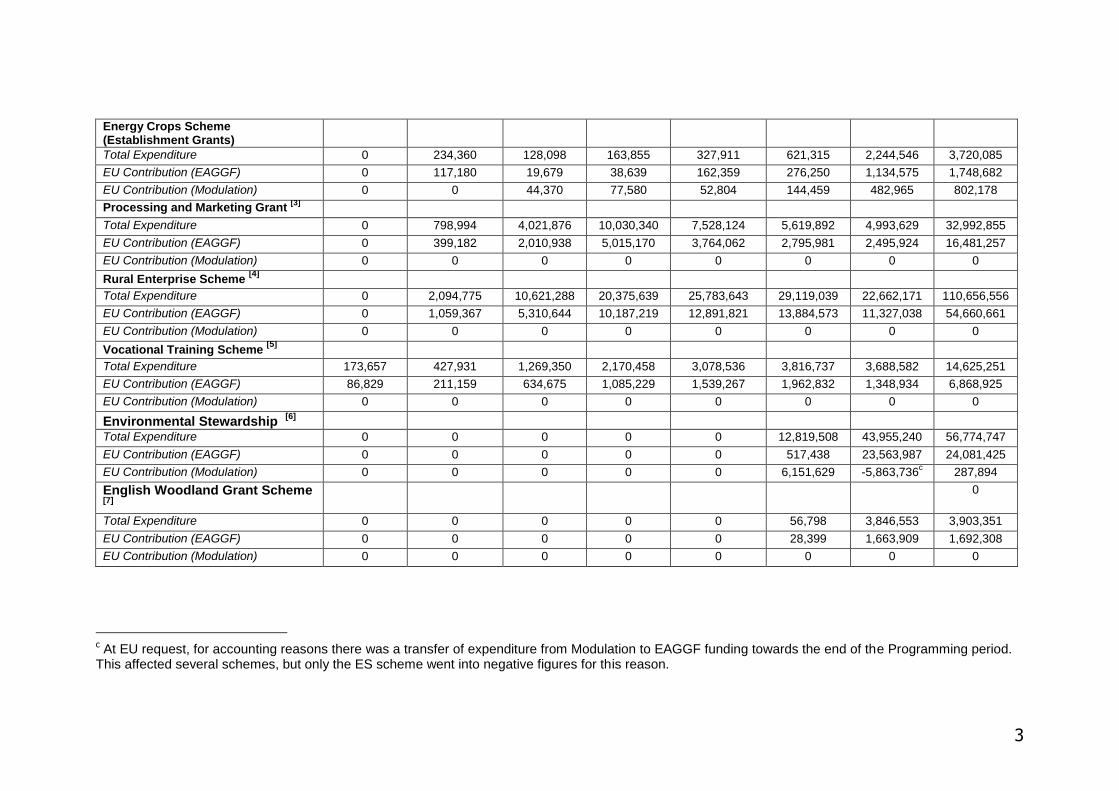
4. Table 1, shows expenditure for schemes financed under the ERDP inthe 2000/01 to 2006/07 periods. Where appropriate the area of land covered by these schemes in 2006 is shown in Table 2.
2
Table 1 ERDP schemes - indicative expenditurea October 2000 to 15th October 2006 (£000’s)
2000/01 [11]
2001/02 [12]
2002/03 [12]
2003/04 [12]
2004/05 [12]
2005/06 [12] 2006/07
[13]2000-2007
Total [14]
Farm Woodland Premium Scheme
[1], [10]
Total Expenditure 6,110,943 4,039,344 8,011,784 10,150,795 10,638,422 11,190,327 207,754 50,349,369
EU Contribution (EAGGF) 2,095,479 1,141,809 2,870,995 3,656,663 3,872,991 4,108,457 72,297 17,818,692
EU Contribution (Modulation) 0 0 0 0 0 0 0 0
Hill Farm Allowance Scheme
Total Expenditure 40,713,967 4,141,910 57,712,786 51,811,863 23,982,912 7,535,895 20,771,639 206,670,972
EU Contribution (EAGGF) 5,157,733 1,729,083 10,102,069 9,920,917 10,813,152 3,722,725 10,385,263 51,830,942
EU Contribution (Modulation) 0 0 0 0 0 0 0 0
Organic Farming Scheme
Total Expenditure 6,405,013 10,296,427 12,566,880 9,958,545 5,880,116 4,212,069 939,152 50,258,202
EU Contribution (EAGGF) 3,125,276 1,588,718 1,087,152 780,674 340,177 59,046 -5,296b
6,975,746
EU Contribution (Modulation) 0 3,500,146 5,168,536 4,179,036 2,574,568 1,991,578 466,852 17,880,716
Woodland Grant Scheme [2] 0
Total Expenditure 12,036,000 9,286,000 11,994,000 10,093,000 11,921,000 15,922,816 10,892,416 82,145,232
EU Contribution (EAGGF) 6,154,000 4,771,000 6,069,000 5,088,000 5,993,000 4,110,924 2,516,385 34,702,309
EU Contribution (Modulation) 0 0 0 0 0 0 0 0
Energy Crops Scheme (Producer Groups)
Total Expenditure 0 0 0 84,410 168,924 320,072 931,312 1,504,717
EU Contribution (EAGGF) 0 0 0 7,914 33,254 56,581 205,612 303,361
EU Contribution (Modulation) 0 0 0 0 0 0 0 0
a Indicative figures are based on accounts reported by the Rural Payment Agencies. These were net payments made through the RPA and include adjustments made for administrative errors, interest and irregularities. b The negative figure reflects a combination of factors including accounting adjustments and recoveries on payments made to beneficiaries under OFS who subsequently failed to transfer the land on which payment was made into the OELS scheme.
3
Energy Crops Scheme (Establishment Grants)
Total Expenditure 0 234,360 128,098 163,855 327,911 621,315 2,244,546 3,720,085
EU Contribution (EAGGF) 0 117,180 19,679 38,639 162,359 276,250 1,134,575 1,748,682
EU Contribution (Modulation) 0 0 44,370 77,580 52,804 144,459 482,965 802,178
Processing and Marketing Grant [3]
Total Expenditure 0 798,994 4,021,876 10,030,340 7,528,124 5,619,892 4,993,629 32,992,855
EU Contribution (EAGGF) 0 399,182 2,010,938 5,015,170 3,764,062 2,795,981 2,495,924 16,481,257
EU Contribution (Modulation) 0 0 0 0 0 0 0 0
Rural Enterprise Scheme [4]
Total Expenditure 0 2,094,775 10,621,288 20,375,639 25,783,643 29,119,039 22,662,171 110,656,556
EU Contribution (EAGGF) 0 1,059,367 5,310,644 10,187,219 12,891,821 13,884,573 11,327,038 54,660,661
EU Contribution (Modulation) 0 0 0 0 0 0 0 0
Vocational Training Scheme [5]
Total Expenditure 173,657 427,931 1,269,350 2,170,458 3,078,536 3,816,737 3,688,582 14,625,251
EU Contribution (EAGGF) 86,829 211,159 634,675 1,085,229 1,539,267 1,962,832 1,348,934 6,868,925
EU Contribution (Modulation) 0 0 0 0 0 0 0 0
Environmental Stewardship [6]
Total Expenditure 0 0 0 0 0 12,819,508 43,955,240 56,774,747
EU Contribution (EAGGF) 0 0 0 0 0 517,438 23,563,987 24,081,425
EU Contribution (Modulation) 0 0 0 0 0 6,151,629 -5,863,736c 287,894
English Woodland Grant Scheme [7]
0
Total Expenditure 0 0 0 0 0 56,798 3,846,553 3,903,351
EU Contribution (EAGGF) 0 0 0 0 0 28,399 1,663,909 1,692,308
EU Contribution (Modulation) 0 0 0 0 0 0 0 0
c At EU request, for accounting reasons there was a transfer of expenditure from Modulation to EAGGF funding towards the end of the Programming period. This affected several schemes, but only the ES scheme went into negative figures for this reason.

4
Countryside Stewardship Scheme
[8]
Total Expenditure 25,818,838 41,517,591 53,061,374 72,731,788 106,375,164 118,705,581 12,777,165 430,987,502
EU Contribution (EAGGF) 7,865,765 10,615,010 10,120,167 9,839,542 8,570,716 7,586,805 16,425,491 71,023,496
EU Contribution (Modulation) 0 3,311,765 9,803,620 18,324,578 31,421,560 37,129,771 126,501 100,117,795
Environmentally Sensitive Areas Scheme
[9
Total Expenditure 32,957,858 41,298,799 53,201,487 60,525,832 69,112,979 68,413,132 21,195,631 346,705,719
EU Contribution (EAGGF) 14,708,117 15,651,107 13,347,871 8,320,203 8,854,122 6,301,062 3,534,098 70,716,580
[1] FWPS closed to new applications on 30/06/2005.
[2] WGS closed to new applications on 28/06/2004. [3], [4] & [5] Closed to new applications June 2006.
[6] ES opened to applications from 01/08/2005.
[7] EWGS opened to applications on 01/07/2005.
[8] CSS closed to new applicants in 2004.
[9] ESA closed to new applicants in 2004.
[10] Forecast for 2006/07 includes WGS, FWPS and EWGS.
[11] Expenditure 1 Oct 2000 to 31 March 2001.
[12] Expenditure 1 April to 31 March. [13] These were net payments made through the RPA and include adjustments made for administrative errors, interest and irregularities.

5
Table 2 - Area of Land covered by ERDP Programme Agreements (ha)
2000/01 2001/02 2002/03 2003/04 2004/05 2005/06 2006/07 2000-2007 Total
Arable Steward-ship Scheme
4
358 535 566 572 541 195 0
Farm Woodland Premium Scheme
5
3475 4783 4699 4933 1947 611 1 20404
Hill Farm Allowance
6 - 1278892 122835
1 1241924 124225
6 1244196 1245000 Not
applicable Organic Farming Scheme
7-
179064 198175 141807 140989 50084 46063 -
Woodland Grant Scheme
8
39347 48840 28330 56641 65698 41167 1345 281368
Energy Crops Scheme (Establish-ment Grants) (Total)
-
233 117 94 409 948 2737 4538
Short Rotation Coppice (SRC)
- 233 65 - 107 290 392 1181
Miscanthus - 0 52 94 302 658 2345 3357
Environ-mental Steward-ship
9 - - - - - 1540537 3668526 Not
applicable English Woodland Grant Scheme
0 0 0 0 0 69874 34536 Not applicable
New - - - - - 4952 1482
Existing - - - - - 64922 33054
Country-side Steward-ship Scheme
10
159496 254715 333829 456115 508272 508410 501225 Not applicable
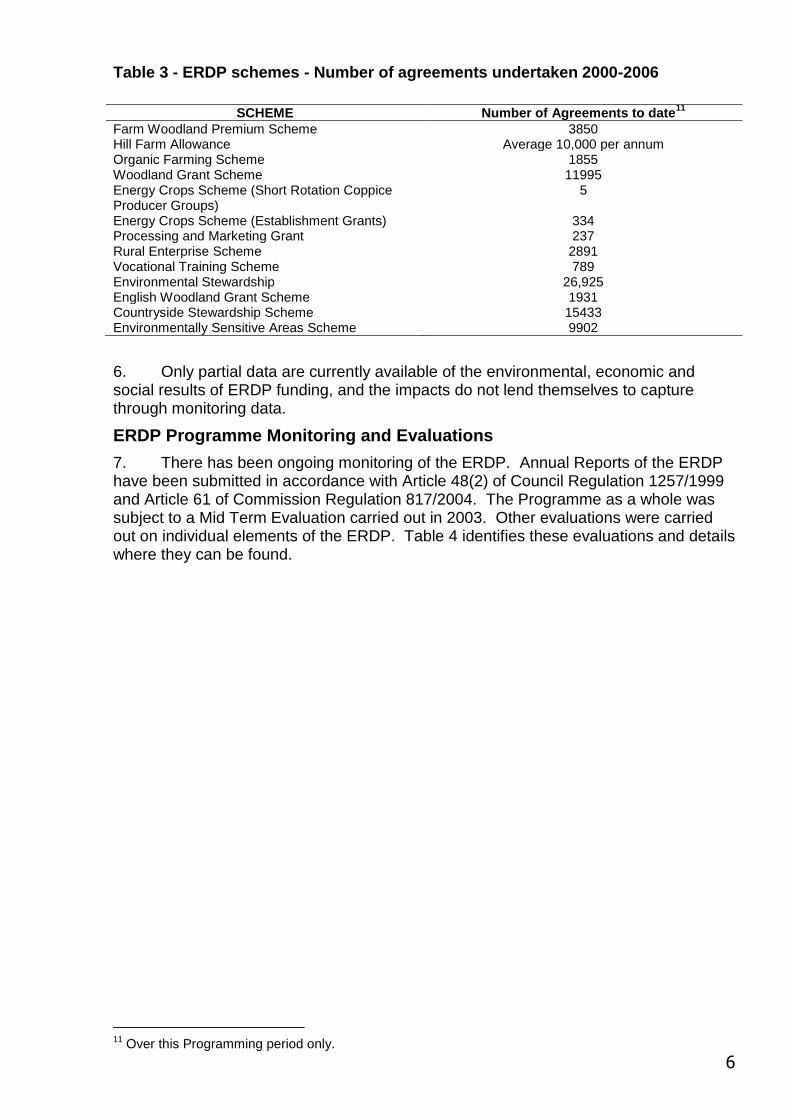
5. A summary of the number of agreements undertaken for each scheme under theERDP over the period 2000-2005 is at Table 3.
4 ASS was a limited pilot scheme that closed to new entrants in 2000. 5 FWPS closed to new applications on 30/06/05. Table shows hectarage for agreements post 2000 only. 6 HFA opened to new applicants from 2001. 7 OFS closed to new applicants in March 2005. 8 WGS closed to new applications on 28/06/2004. 9 ES opened to applications from 01/08/2005.
10 CSS closed to new applicants in 2004.
6
Table 3 - ERDP schemes - Number of agreements undertaken 2000-2006
SCHEME Number of Agreements to date11
Farm Woodland Premium Scheme 3850 Hill Farm Allowance Average 10,000 per annum Organic Farming Scheme 1855 Woodland Grant Scheme 11995 Energy Crops Scheme (Short Rotation Coppice Producer Groups)
5
Energy Crops Scheme (Establishment Grants) 334 Processing and Marketing Grant 237 Rural Enterprise Scheme 2891 Vocational Training Scheme 789 Environmental Stewardship 26,925 English Woodland Grant Scheme 1931 Countryside Stewardship Scheme 15433 Environmentally Sensitive Areas Scheme 9902
6. Only partial data are currently available of the environmental, economic andsocial results of ERDP funding, and the impacts do not lend themselves to capture through monitoring data.
ERDP Programme Monitoring and Evaluations
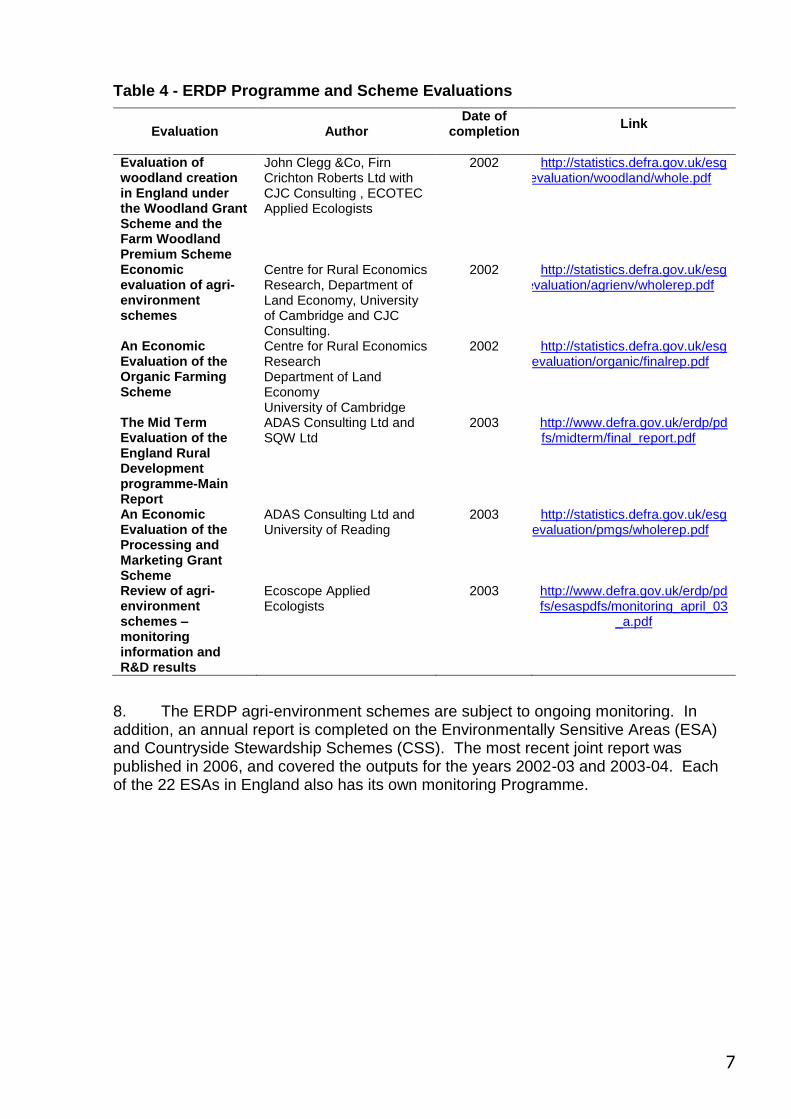
7. There has been ongoing monitoring of the ERDP. Annual Reports of the ERDPhave been submitted in accordance with Article 48(2) of Council Regulation 1257/1999 and Article 61 of Commission Regulation 817/2004. The Programme as a whole was subject to a Mid Term Evaluation carried out in 2003. Other evaluations were carried out on individual elements of the ERDP. Table 4 identifies these evaluations and details where they can be found.
11 Over this Programming period only.
7
Table 4 - ERDP Programme and Scheme Evaluations
Evaluation Author Date of
completion Link
Evaluation of woodland creation in England under the Woodland Grant Scheme and the Farm Woodland Premium Scheme
John Clegg &Co, Firn Crichton Roberts Ltd with CJC Consulting , ECOTEC Applied Ecologists
2002 http://statistics.defra.gov.uk/esg/evaluation/woodland/whole.pdf
Economic evaluation of agri-environment schemes
Centre for Rural Economics Research, Department of Land Economy, University of Cambridge and CJC Consulting.
2002 http://statistics.defra.gov.uk/esg/evaluation/agrienv/wholerep.pdf
An Economic Evaluation of the Organic Farming Scheme
Centre for Rural Economics Research Department of Land Economy University of Cambridge
2002 http://statistics.defra.gov.uk/esg/evaluation/organic/finalrep.pdf
The Mid Term Evaluation of the England Rural Development programme-Main Report
ADAS Consulting Ltd and SQW Ltd
2003 http://www.defra.gov.uk/erdp/pdfs/midterm/final_report.pdf
An Economic Evaluation of the Processing and Marketing Grant Scheme
ADAS Consulting Ltd and University of Reading
2003 http://statistics.defra.gov.uk/esg/evaluation/pmgs/wholerep.pdf
Review of agri-environment schemes – monitoring information and R&D results
Ecoscope Applied Ecologists
2003 http://www.defra.gov.uk/erdp/pdfs/esaspdfs/monitoring_april_03
_a.pdf
8. The ERDP agri-environment schemes are subject to ongoing monitoring. Inaddition, an annual report is completed on the Environmentally Sensitive Areas (ESA) and Countryside Stewardship Schemes (CSS). The most recent joint report was published in 2006, and covered the outputs for the years 2002-03 and 2003-04. Each of the 22 ESAs in England also has its own monitoring Programme.

8
Table 5 - Other Agri-environmental evaluations 2000-2006
Scheme Researcher Date of
completion Link/ISBN
Countryside Stewardship and Environmentally Sensitive Areas Schemes-Report on performance 2003/04 and 2004/05
Rural Development
Service, Defra
2006 http://www.defra.gov.uk/erdp/pdfs/css/css_esas_ann_rep_04-05.pdf
Countryside Stewardship and Environmentally Sensitive Areas Schemes-Report on performance 2002/03
Defra April 2004 http://www.defra.gov.uk/erdp/pdfs/css/css_esas_ann_rep_03.pdf
ESA Economic Evaluation and Monitoring Reports
Various Various http://www.defra.gov.uk/erdp/schemes/esas/monitoring/econeval.htm
EAGGF GUIDANCE SECTION
EAGGF Guidance Section Outputs and Impacts
9. European Union Structural Funds including the European Regional DevelopmentFund (ERDF), European Social Fund (ESF), European Agricultural Guidance and Guarantee Fund (EAGGF – Guidance Section) provided grant aid towards, or support for, a variety of measures including regional and local infrastructure, training, business support and diversification of economic activity in areas facing difficulty, together with support for farming in Less Favoured Areas (LFA). The ERDF contributed around 70% of the total Structural Funds support in England. EAGGF (Guidance Section) and ESF made up the remaining 30%, the breakdown of funding varying slightly between Programmes.
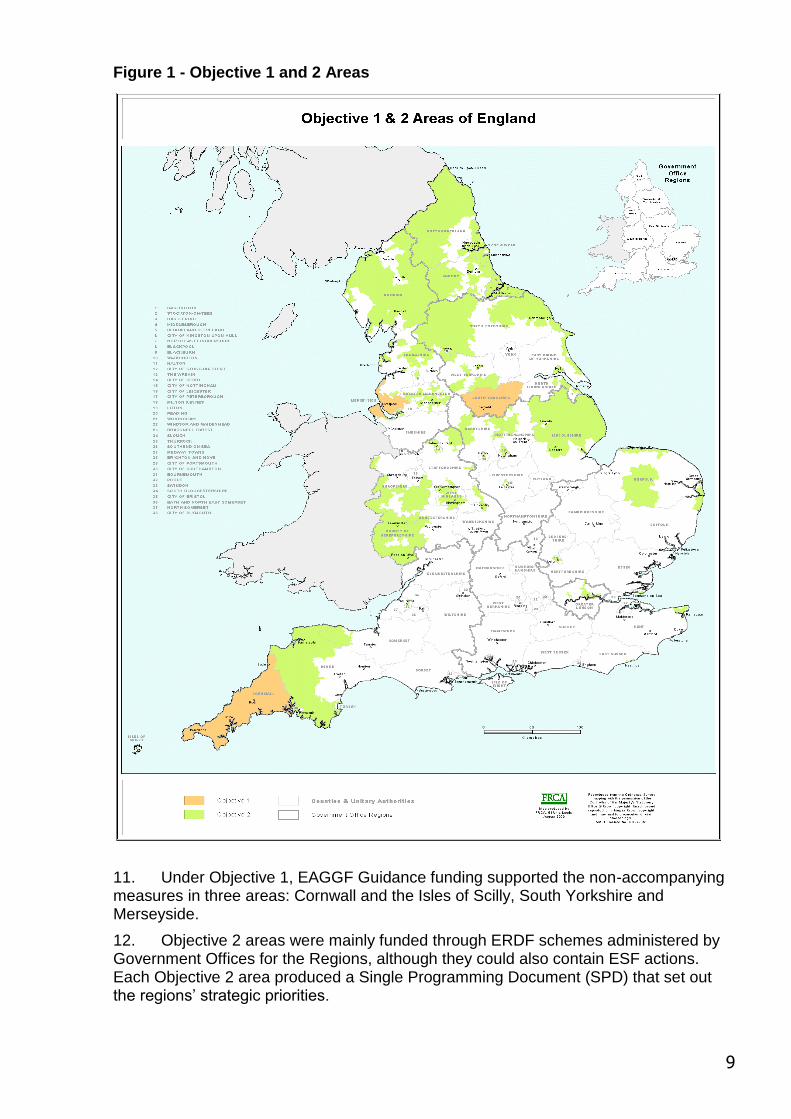
10. Support was targeted to Objective 1 and Objective 2 areas. There were threeObjective 1 areas in England. There were Objective 2 areas in all nine Government Office regions. Figure 1 shows the respective areas for the 2000-2006 programming period.
9
Figure 1 - Objective 1 and 2 Areas
11. Under Objective 1, EAGGF Guidance funding supported the non-accompanyingmeasures in three areas: Cornwall and the Isles of Scilly, South Yorkshire and Merseyside.
12. Objective 2 areas were mainly funded through ERDF schemes administered byGovernment Offices for the Regions, although they could also contain ESF actions. Each Objective 2 area produced a Single Programming Document (SPD) that set out the regions’ strategic priorities.

10
13. The types of activity funded through Objective 2 programmes included activitiesthat were similar to, and overlapped with, some measures of the ERDP, notably but not exclusively the Rural Enterprise Scheme (RES). To avoid duplication of funding in Objective 2 areas, funding under these measures was split between ERDF schemes and RES, according to the exact nature of the project activity. All other RES measures operated normally in Objective 2 areas.
Objective 1 Outputs
14. The UK Objective 1 programme budget for 2000-2006 was in excess of €5,500million (at 1999 rates of exchange). Table 6 details the EAGGF and Exchequer match-funding element for England and the number of projects supported.
Table 6 - EAGGF Funding for Objective 1 on year-by-year basis12
Region Year EAGGF
Expenditure (£)
Exchequer match funding
(£)
Total Allocation
13
No. Of approved
Projects per calendar year
Government Office South West
2000 0 0 9,887,068 1 2001 262,078 269,930 8,674,648 28 2002 7,389,546 7,437,491 8,187,008 28 2003 7,992,338 7,961,837 7,405,448 19 2004 8,723,692 8,433,590 6,310,596 25 2005 8,858,354 9,107,585 6,271,184 30
Government Office Yorkshire and Humberside
2000 0 0 2,362,048 0 2001 43,310 53,250 2,320,632 4 2002 1,246,807 1,233,913 2,275,876 6 2003 2,886,133 1,001,198 2,231,788 3 2004 1,902,796 1,738,955 1,974,608 0 2005 2,273,235 1,875,063 2,130,252 0
Government Office North West
2000 0 0 534,400 0 2001 802 1,249 534,400 1 2002 293,443 294,122 534,400 2 2003 600,754 625,371 534,400 9 2004 509,408 274,425 467,600 14 2005 551,084 517,316 534,400 11
Evaluation of the Impact of Objective 1 and 2 in England
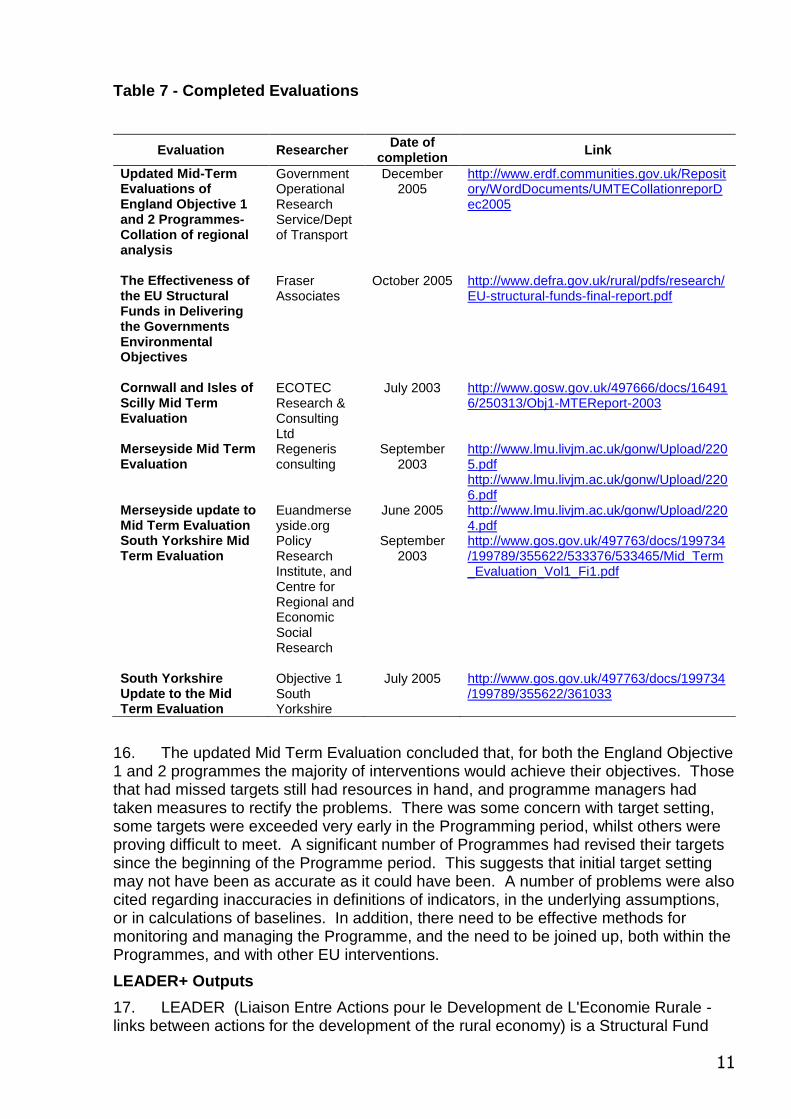
15. Structural Fund support has been subject to evaluation and review. Table 7identifies these and where they can be found.
12 The EAGGF expenditure and associated exchequer match funding is in sterling and is taken from the Commission draw down returns; it includes all UK public funding. 13 Allocations are taken from the original SPDs and converted from euros into sterling using the exchange rate of 0.668
11
Table 7 - Completed Evaluations
Evaluation Researcher Date of
completion Link
Updated Mid-Term Evaluations of England Objective 1 and 2 Programmes-Collation of regional analysis
Government Operational Research Service/Dept of Transport
December 2005
http://www.erdf.communities.gov.uk/Repository/WordDocuments/UMTECollationreporDec2005
The Effectiveness of the EU Structural Funds in Delivering the Governments Environmental Objectives
Fraser Associates
October 2005 http://www.defra.gov.uk/rural/pdfs/research/EU-structural-funds-final-report.pdf
Cornwall and Isles of Scilly Mid Term Evaluation
ECOTEC Research & Consulting Ltd
July 2003 http://www.gosw.gov.uk/497666/docs/164916/250313/Obj1-MTEReport-2003
Merseyside Mid Term Evaluation
Regeneris consulting
September 2003
http://www.lmu.livjm.ac.uk/gonw/Upload/2205.pdf http://www.lmu.livjm.ac.uk/gonw/Upload/2206.pdf
Merseyside update to Mid Term Evaluation
Euandmerseyside.org
June 2005 http://www.lmu.livjm.ac.uk/gonw/Upload/2204.pdf
South Yorkshire Mid Term Evaluation
Policy Research Institute, and Centre for Regional and Economic Social Research
September 2003
http://www.gos.gov.uk/497763/docs/199734/199789/355622/533376/533465/Mid_Term_Evaluation_Vol1_Fi1.pdf
South Yorkshire Update to the Mid Term Evaluation
Objective 1 South Yorkshire
July 2005 http://www.gos.gov.uk/497763/docs/199734/199789/355622/361033
16. The updated Mid Term Evaluation concluded that, for both the England Objective1 and 2 programmes the majority of interventions would achieve their objectives. Those that had missed targets still had resources in hand, and programme managers had taken measures to rectify the problems. There was some concern with target setting, some targets were exceeded very early in the Programming period, whilst others were proving difficult to meet. A significant number of Programmes had revised their targets since the beginning of the Programme period. This suggests that initial target setting may not have been as accurate as it could have been. A number of problems were also cited regarding inaccuracies in definitions of indicators, in the underlying assumptions, or in calculations of baselines. In addition, there need to be effective methods for monitoring and managing the Programme, and the need to be joined up, both within the Programmes, and with other EU interventions.
LEADER+ Outputs
17. LEADER (Liaison Entre Actions pour le Development de L'Economie Rurale -links between actions for the development of the rural economy) is a Structural Fund
12
financed under the EAGGF Guidance Section to assist rural communities in improving the quality of life and economic prosperity in their local area. 25 areas in England have benefited from the funding.
18. In 2001, the initial funding allocation for LEADER+ was approximately £33million. This rose to £38 million owing to exchange rate fluctuations and indexation. Including the EAGGF allocated to the Programme there were additional contributions from Defra match funding and other sources, e.g. local authorities, other government departments, RDAs and the private sector.
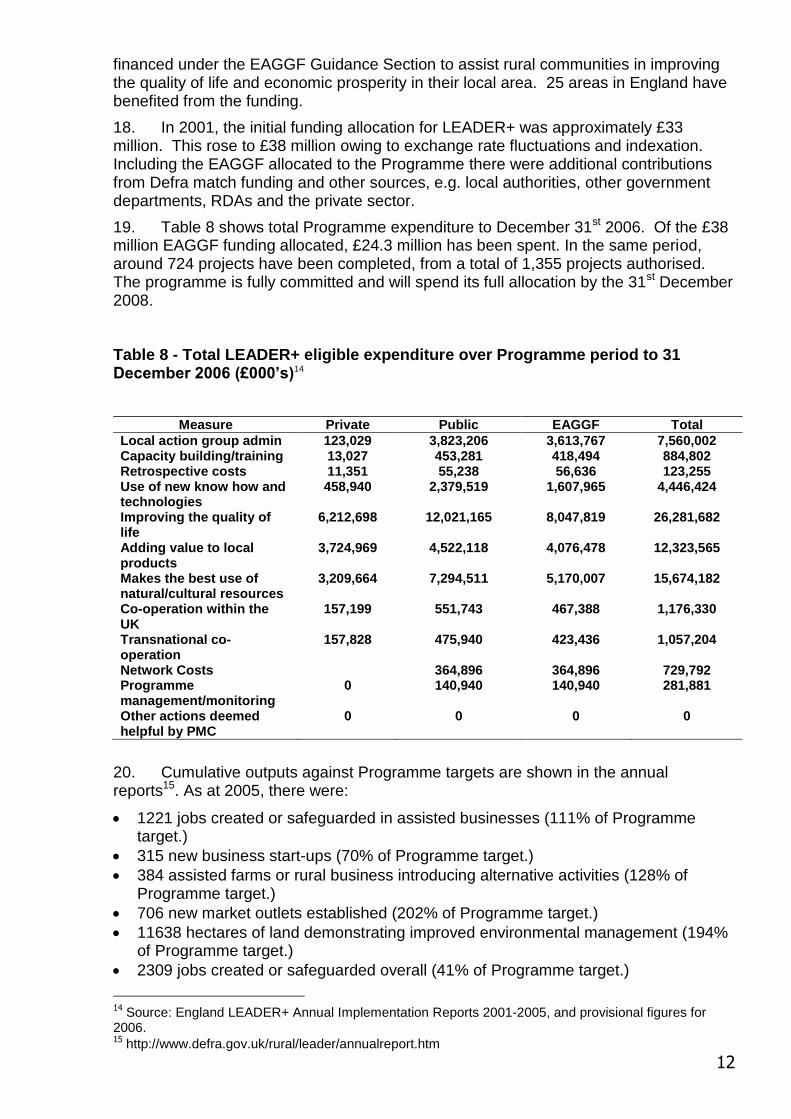
19. Table 8 shows total Programme expenditure to December 31st 2006. Of the £38million EAGGF funding allocated, £24.3 million has been spent. In the same period, around 724 projects have been completed, from a total of 1,355 projects authorised. The programme is fully committed and will spend its full allocation by the 31st December 2008.
Table 8 - Total LEADER+ eligible expenditure over Programme period to 31 December 2006 (£000’s)14
Measure Private Public EAGGF Total
Local action group admin 123,029 3,823,206 3,613,767 7,560,002 Capacity building/training 13,027 453,281 418,494 884,802 Retrospective costs 11,351 55,238 56,636 123,255 Use of new know how and technologies
458,940 2,379,519 1,607,965 4,446,424
Improving the quality of life
6,212,698 12,021,165 8,047,819 26,281,682
Adding value to local products
3,724,969 4,522,118 4,076,478 12,323,565
Makes the best use of natural/cultural resources
3,209,664 7,294,511 5,170,007 15,674,182
Co-operation within the UK
157,199 551,743 467,388 1,176,330
Transnational co-operation
157,828 475,940 423,436 1,057,204
Network Costs 364,896 364,896 729,792 Programme management/monitoring
0 140,940 140,940 281,881
Other actions deemed helpful by PMC
0 0 0 0
20. Cumulative outputs against Programme targets are shown in the annualreports15. As at 2005, there were:
1221 jobs created or safeguarded in assisted businesses (111% of Programmetarget.)
315 new business start-ups (70% of Programme target.)
384 assisted farms or rural business introducing alternative activities (128% ofProgramme target.)
706 new market outlets established (202% of Programme target.)
11638 hectares of land demonstrating improved environmental management (194%of Programme target.)
2309 jobs created or safeguarded overall (41% of Programme target.)
14 Source: England LEADER+ Annual Implementation Reports 2001-2005, and provisional figures for 2006. 15 http://www.defra.gov.uk/rural/leader/annualreport.htm

13
LEADER+ Evaluation and Impacts
21. Evaluations of the LEADER+ Programme are identified in Table 9 below.
Table 9 - Evaluations of the LEADER+ Programme
Evaluation Researcher Date of
completion
Link
The Mid Term Evaluation of the LEADER + Programme
ADAS Consulting Ltd & SQL Ltd
December 2003 http://defraweb/rural/pdfs/leader/leader_mte.pdf
Mid term Evaluation update of the LEADER + community initiative Programme in England
The Rural Development Company in association with Fraser Associates and University of Gloucestershire
December 2005 http://www.defra.gov.uk/rural/pdfs/leader/mte_finalrep.pdf
22. Lessons learned during the LEADER+ Programme suggest that the LEADER+ Programme in England supported the development and delivery of an extensive body of relevant and valued development work, but neither captured the results and lessons well nor used this as effectively as it might.
23. The Defra commissioned report, An Evidence Base for Mainstreaming LEADER in England, produced by the Rural Development Company in association with Fraser Associates and University of Gloucestershire,16 support these conclusions.
National Rural Development Funding Streams
24. Other national funding streams have had an impact on rural development over the 2000-2006 period. Some of these funding programmes were aimed specifically at rural communities whilst others were applied nationally but had a rural component or provided support for specific projects affecting rural areas.
Rural Development activities of Regional Development Agencies Single Pot
25. Until 2002, there was a number of national rural development funding streams, for example, the Single Regeneration Budget (SRB). After 2002, responsibility for rural economies was largely transferred to the RDAs, with the numerous funding streams subsumed into one budget, known as the ‘Single Pot’, which was divided between the RDAs according to a funding formula. Each RDA used its Single Pot allocation according to regional need.
26. The RDAs have five statutory objectives:
to further economic development and the regeneration of its region;
to promote business efficiency and competitiveness in its region;
to promote employment in its region;
16 http://www.defra.gov.uk/rural/pdfs/leader/mainstreamingleader.pdf

14
to enhance the development and application of skills relevant to employment in itsregion, and
to contribute to the achievement of sustainable development in the UK where it isrelevant to its region to do so
27. The RDAs’ purposes apply as much in relation to its rural parts as its non-ruralareas.
RDA Outputs
28. RDA outputs are currently focussed on the following measurables:
employment creation (jobs created or safeguarded)
employment support (number of people assisted to get a job)
business creation (new businesses created)
business support (no. of business assisted to improve their performance)
regeneration including Brownfield land (either remediated or put back into effectiveuse)
skills (number of people assisted in their skills development)
RDA Evaluations
29. An evaluation of the RDAs was undertaken in 2006 by SQW Ltd17. Thisreviewed the methodology behind existing evaluations, and made recommendations as to how these should be carried out in the future.
The Redundant Building Grant Scheme
30. The Redundant Building Grant (RBG) complemented the ERDP farmdiversification objectives. The RBG scheme began in the early 1980’s, and was administered on a regional basis.
31. The grant was available in most regions. Any building was eligible which wasplanned to be converted for use by a business, such as manufacturing, services, craft, business and office-based activities. The normal grant contribution was 25% of costs.
Planning Consultancy Advice Scheme
32. The Planning Consultancy Advice Scheme was designed to provide farmers withassistance towards planning applications for RES diversification projects. The scheme ran from 2001/2002 to 2003/2004, and was delivered through Defra’s Rural Development Service. It offered one day’s free planning consultancy advice (initially up to £800 excluding VAT, reducing to £600 from 2003/2004) from an independent consultant, being a member of a recognised professional institution. The scheme was Treasury funded.
33. An evaluation in 200318 reported that the scheme was popular, but that the oneday of consultancy was in certain cases insufficient, and that the quality of the advice could be variable. The scheme was also not meeting its main objective of bringing forward RES applications, with only about 4% of participants actually applying for RES with only a third of applicants taking their plans forward to a planning application.
17 DTI Occasional paper No.2 ‘Evaluating the Impact of England’s Regional Development Agencies-Developing a methodology and evaluation framework’ (PA Consulting/SQW Ltd February 2006). 18 Review of the Defra Planning Consultancy Advice (PCA) Scheme and Other Planning Advisory Approaches, (Land Use Consultants/ Kernon Countryside Consultants, November 2003)

15
Agricultural Development Scheme (ADS)
34. The ADS was a grant scheme designed to allow farmers and growers to improvetheir competitiveness through better marketing. The first two rounds (up to November 2001) spent £5 million. A further evaluation of the later rounds (3 and 4) is due to be published in 2007.
35. An evaluation took place in 2003. Details are at Table 10.
Table 10 - Evaluation of the Agricultural Development Scheme
Evaluation Researcher Date of
completion Link
An Economic evaluation of the Agricultural Development Scheme
ADAS consulting
Ltd /University of
Reading
July 2003 http://statistics.defra.gov.uk/esg/evaluation/ads/default.asp
36. The ADS evaluation concluded that market failure did exist in relation tocollaborative working in the food chain, and that additionality was relatively high from projects supported. Wider conclusions related to the need to reduce bureaucracy, in part around the interaction between the Scheme and activities funded under the ERDP, and to improve the use of experts in assessing applications.
National Support for Environmental Maintenance and Improvement
37. There were three main national mechanisms, which provided support forenvironmental maintenance and improvement:
English Nature management agreements;
National Park management agreements;
the Countryside Agency’s Land Management Initiative
English Nature management agreements
38. The aim of English Nature’s management agreements is to safeguard andmanage land of national nature conservation value, including Sites of Special Scientific Interest (SSSI), to protect and enhance the habitats, species and features for which these sites are designated. There are different types of agreements, for land designated as a SSSI, undesignated land adjacent to an SSSI, or land, which is also proposed for declaration as a National Nature Reserve.
39. Management agreements compensate land managers for the opportunity costsincurred in maintaining the nature conservation and natural heritage interest of the site. The occupier may have a statutory entitlement to be offered this from of agreement. These agreements are being phased out in favour of more positive management agreements, which pay for active management to achieve wildlife gain. The majority of these fall under the Wildlife Enhancement Scheme, which has a standard menu of annual management payments. The scheme also includes provision for specific management works such as hedge laying, scrub control and water level management works.
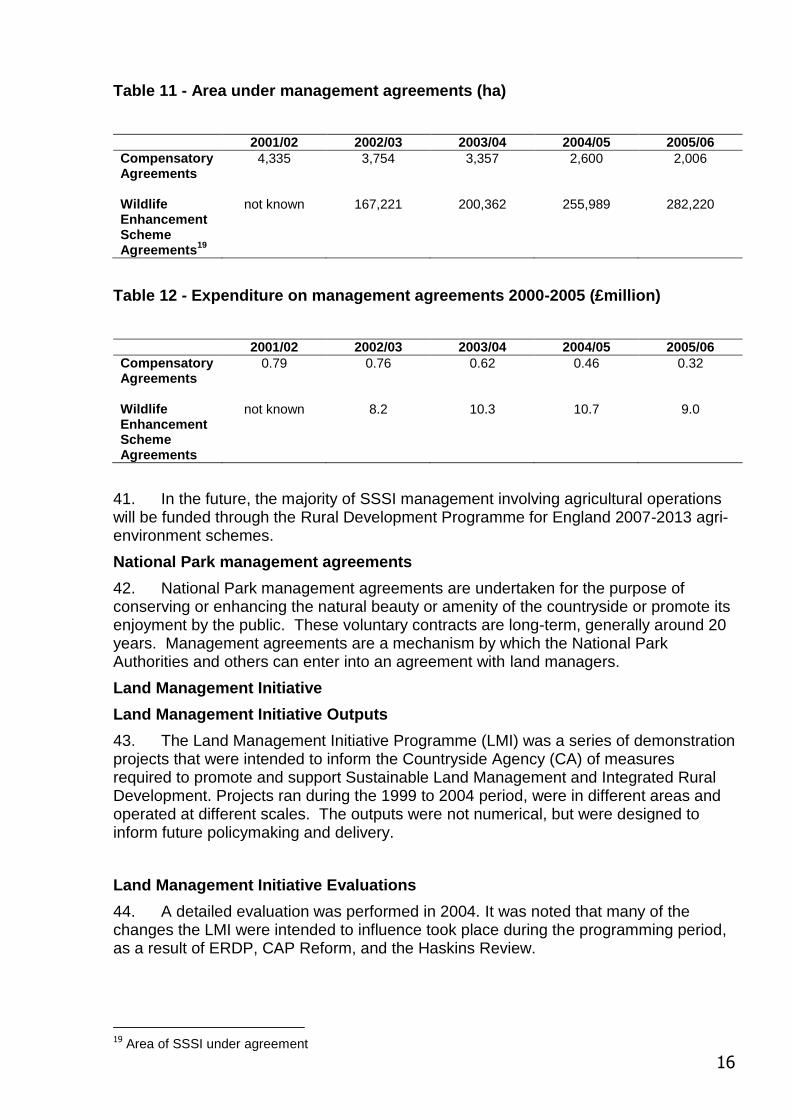
40. Table 11 provides details of the area under English Nature agreements in eachcategory, and Table 12 provides details of the total expenditure on English Nature management agreements from 2001 to 2005.
16
Table 11 - Area under management agreements (ha)
2001/02 2002/03 2003/04 2004/05 2005/06
Compensatory Agreements
4,335 3,754 3,357 2,600 2,006
Wildlife Enhancement Scheme Agreements
19
not known 167,221 200,362 255,989 282,220
Table 12 - Expenditure on management agreements 2000-2005 (£million)
2001/02 2002/03 2003/04 2004/05 2005/06
Compensatory Agreements
0.79 0.76 0.62 0.46 0.32
Wildlife Enhancement Scheme Agreements
not known 8.2 10.3 10.7 9.0
41. In the future, the majority of SSSI management involving agricultural operations will be funded through the Rural Development Programme for England 2007-2013 agri-environment schemes.
National Park management agreements
42. National Park management agreements are undertaken for the purpose of conserving or enhancing the natural beauty or amenity of the countryside or promote its enjoyment by the public. These voluntary contracts are long-term, generally around 20 years. Management agreements are a mechanism by which the National Park Authorities and others can enter into an agreement with land managers.
Land Management Initiative
Land Management Initiative Outputs
43. The Land Management Initiative Programme (LMI) was a series of demonstration projects that were intended to inform the Countryside Agency (CA) of measures required to promote and support Sustainable Land Management and Integrated Rural Development. Projects ran during the 1999 to 2004 period, were in different areas and operated at different scales. The outputs were not numerical, but were designed to inform future policymaking and delivery.
Land Management Initiative Evaluations
44. A detailed evaluation was performed in 2004. It was noted that many of the changes the LMI were intended to influence took place during the programming period, as a result of ERDP, CAP Reform, and the Haskins Review.
19 Area of SSSI under agreement

17
Table 13 - Evaluation of the Land Management Initiatives
Evaluation Researcher Date of
completion Link
Lessons from the Land Management Initiatives (LMIs) –Sustainable Land Management and Integrated Rural Development
Land Use Consultants, December
December 2004
http://www.countryside.gov.uk/Images/LMI%20Lessons%20final_tcm2-22118.pdf
The Historic Environment
45. English Heritage is an executive non-departmental public body sponsored by the Department for Culture, Media and Sport (DCLG), although both Defra and DCLG are joint signatories for its funding agreement. It administers a variety of grant schemes, relating to both the urban and rural historic environment, and has recognised the value of agri-environment measures. It is noted that historic environment sites and archaeological sites tend to be better preserved in areas under ESA or CSA agreements. The schemes currently include repair grants for places of worship, repair funding for some cathedrals, grants for the care and conservation of a range of historic buildings, monuments and landscapes, and assistance in the repair of war memorials.
46. English Heritage also runs a number of schemes to develop the voluntary sector, joint funding with Local Authorities, (for either area funding, grants to underwrite repairs or acquisition of historic buildings in decay, and in recruiting conservation staff). There is also a national strategic budget supporting research for policymaking and national initiatives.
47. English Heritage also distributes funds received from aggregates extraction levies, introduced in 2002, for projects which aim to reduce the impact of aggregates extraction upon the Historic Environment.
The Historic Environment Expenditure
48. Expenditure for Buildings and Monuments Grants, Heritage Economic Regeneration Schemes (and CAPS) and the Churches Grant Scheme cannot be disaggregated to reflect rural and urban expenditure. The figures in Table 14 relate to the entire expenditure, the majority of which was on urban targets. It should be noted, however, that many of the places of worship are listed buildings in rural areas, as are many of the historic buildings.

18
Table 14 - English Heritage Expenditure 2000-2005
2000 2001 2002 2003 2004 2005
Repair Grants for Places of Worship
13,700,000 3,200,000 6,300,000 9,227,000 9,194,000 9,141,000
Cathedral Repairs
2,900,000 2,500,000 2,000,000 1,943,000 2,074,000 981,000
Historic Buildings, Monuments and Designed Landscapes
13,300,000 11,400,000 10,400,000 8,525,000 7,566,000 9,030,000
War Memorials 0 0 0 21,000 37,000 50,000 Capacity Building for the Voluntary Sector
1,600,000 1,600,000 1,000,000 1,300,000 1,637,000 1,875,000
Local Authorities - Area Partnership Funding
8,600,000 9,600,000 6,600,000 9,817,000 7,652,000 4,327,000
Local Authority Grants for Conservation Staff (figures included in HEEP figures below)
153,666 171,779 182,532 280,683 265,769 252,543
Historic Environment Enabling Programme (figures include LA Grants for Conservation Staff)
4,555,900 5,472,589 5,411,320 4,919,118 4,693,089 5,264,394
Aggregates Levy Sustainability Fund
n/a n/a 5,192,340 3,949,475 4,004,006 3,784,374