the school-to-work transition of canadian post...
TRANSCRIPT

Journal of Higher Education Policy and ManagementVol. 26, No. 1, March 2004
The School-to-Work Transition ofCanadian Post-secondary Graduates: Adynamic analysis
Ross Finnie*Queen’s University and Statistics Canada, Canada
This paper reports the results of an empirical analysis of the school-to-work transition ofCanadian post-secondary graduates based on three waves of the National GraduatesSurveys, representing those who successfully completed their programmes at Canadiancolleges and universities in 1982, 1986, and 1990. Information was gathered duringinterviews conducted two and five years after graduation for each group, thus facilitating adynamic analysis of the critical early post-graduation years. The analysis is generally brokendown by sex and specific level of education (college, bachelor’s, master’s, PhD) Outcomesanalysed include: the number and characteristics of graduates (by level and sex); thenumber of graduates who went on to further degrees and the types of degrees thus obtained;the job–education skill match and the relationship between the current job’s educationalprerequisites and graduates’ qualifications; job satisfaction and the overall evaluation of theeducational programme; and inter-provincial mobility in the post-graduation years. Variousimplications of the findings are discussed.
Introduction
Graduating from college or university and moving into the labour force is animportant transition at both the individual and social levels, as graduates beginto put their training into practice and thus build their labour market careers,while at the same time comprising an important element of the nation’seconomic performance both today and into the future. Yet our understandingof this transition—especially its dynamic aspects—is still quite limited1.
The contribution of this paper is, then, to report the results of an empiricalanalysis of the early post-schooling experiences of several recent “generations”of Canadian post-secondary graduates. The study is based on three waves ofthe National Graduates Surveys (NGS), which comprise large, representativesamples of those who successfully completed their programmes at Canadiancolleges or universities in 1982, 1986, and 1990, with information gathered
* Correspondence: Ross Finnie, School of Policy Studies, Queen’s University, Kingston, ON,Canada, K7L 3N6. Email: [email protected]
ISSN 1360-080X (print)/ISSN 1469-9508 (online)/04/010035-24 2004 Association for Tertiary Education ManagementDOI: 10.1080/1360080042000182528
36 R. Finnie
during interviews conducted two and five years after graduation for each groupof graduates (1984–1987, 1988–1991, 1992–1995). The analysis is based on ahuman capital perspective, thus focusing on the various uses to which thedifferent skills developed in college and university are employed and developedfurther in the post-graduation years.
The NGS databases are particularly well suited to this undertaking, for anumber of reasons. First, their size and representative structure allow for adetailed level of analysis and the generalisation of the findings to the overallpopulation of post-secondary graduates. Second, they contain a wide range ofinteresting variables, including a number of job and education programmesatisfaction measures, thus allowing for a more multi-faceted analysis thanusual. Third, the longitudinal structure of the surveys (deriving from the twointerviews carried out for each cohort) and the availability of data for threedifferent graduating classes provide the opportunity for a dynamic analysis foreach set of graduates and the comparison of outcomes over a period generallythought to have been one of significant educational and labour market changes,especially for younger workers2.
The results of this paper should, therefore, be of interest to a variety ofreaderships. Labour market scholars should be interested in the dynamicpicture the results provide of early career outcomes, informed as they are fromthe human capital perspective employed in the analysis. Second, educationpolicy experts and university administrators should find the analysis relevant toa variety of education-related issues concerning how well colleges and universi-ties have been doing in preparing young people for interesting, meaningful, andproductive careers at a time of shifting labour markets and an evolvingpost-secondary system. Finally, graduates who have been through the tran-sition might be interested in comparing their own experiences with those ofothers, while current and future students should be able to make moreinformed choices by knowing better what to expect in the post-graduationyears.
The paper is laid out in a straightforward fashion. The next section describesthe National Graduates Surveys databases and the construction of the samplesused in the analysis. This is followed by the presentation of the empiricalfindings. A short concluding section summarizes the major findings and putsthem in context.
The Data3
The National Graduates Surveys
The National Graduates Surveys (and Follow-up) databases are well suited tothis analysis, for the reasons mentioned above: their size (over 30,000 individ-uals in each survey) and representativeness allow for an in-depth analysis andthe extension of the findings to the general population of graduates4; thevariables available on the files facilitate a multi-faceted analysis; the longitudi-

School-to-Work Transition of Canada Graduates 37
nal element provides for a dynamic tracking of the school-to-work transitionwith a perspective precisely situated for the two specific points in time relativeto graduation represented by the two interview dates while covering a relativelyextended period of time (the first five years after leaving school); and theavailability of data for three different cohorts permits us to track these pro-cesses for graduates who left school in the 1980s and 1990s.
In summary, the NGS databases uniquely provide for a focused, detailed,and dynamic analysis of Canadian post-secondary graduates in the critical earlyyears following graduation from the early 1980s into the mid-1990s. The dataare, in fact, not only interesting and unique in a Canadian context, but, to thebest of this author’s understanding, unequalled in the world in terms ofoffering large representative surveys covering various elements of the school-to-work transition over the last decade and a half.
Selection of the Working Samples
In the first part of the analysis, which focuses on the characteristics of graduates(by level, sex, and field of study), virtually no restrictions are imposed on thedata apart from deleting the very few observations for which the relevantinformation is missing. After this, however, the analysis is limited to graduateswho were successfully contacted and who completed both interviews so thatthe tracking of outcomes from two to five years following graduation would notmix the “composition effects” resulting from any changes in the samples withthe actual dynamics of the school-to-work transition5.
After documenting the number of graduates who had obtained additionaldegrees by either of the two interviews, those individuals were excluded fromthe analysis. Such graduates no longer belonged to the original educationgroup (e.g. a bachelor’s graduate might have become a master’s graduate andperhaps changed disciplines) and had in any event been mixing school andwork in a way likely to affect the labour market outcomes upon which much ofthe analysis is focused. Including ongoing students would also have thrown offthe precise post-graduation time frame corresponding to the two interviewdates (i.e. two and five years after graduation) which holds for the non-continu-ing group. Finally, little would be gained from including those who obtainedfurther degrees, since such individuals are already represented in the NGSdatabases at those later degree levels.
Third, for the analysis of job-related outcomes, part-time workers who citedschool as the reason for their only partial involvement in the labour marketwere excluded from the relevant period’s calculations on the grounds that suchindividuals were—by definition—still principally students and had thereforenot yet entered the school-to-work transition phase of their careers in earnest6.Other part-time workers are, on the other hand, included in the study, thuslending it a broad labour market base. The few individuals who were otherthan regular paid workers (family workers, volunteers, etc.) or who hadunreasonably low earnings were also dropped at this stage7.
38 R. Finnie
Finally, observations were deleted on a variable-by-variable basis where therequired information was missing, typically resulting in a very small number ofadditional deletions.
The Variables Used in the Analysis
The measures employed in the analysis are as follows8.
Further studies. A straightforward indicator of having received another collegeor university diploma since graduation in the baseline year (1982, 1986, or1990).
The job–education skill match. The extent to which the skills learned in schoolwere used in the current job held, as reported by the graduate. The specificfigures reported below represent the means of an index running from 0 to 100created by the author from the categorical information available in the rawNGS data derived from the question “Do you use any of the skills acquiredthrough the education programme in your job?”, with higher values indicatingcloser job–education skill matches. More specifically, for the 1982 and 1986cohorts, the responses of “no” and “yes” were assigned index values of 0 and100 (corresponding to the response options available for those surveys), whilefor the 1990 cohort, values of 0 (“not at all”), 33 1/3 (“very little”), 66 2/3 (“tosome extent”), or 100 (“to a great extent”) were assigned. The measure istherefore consistent for both years of each cohort, but is not necessarily directlycomparable across the two earlier cohorts and the last cohort.
The educational prerequisites of the job versus the individual’s qualifications. Thelevel of education required for the job (“When you were hired … what were theminimum educational qualifications required?”) compared with the diplomaobtained at graduation. The response options varied across the survey years,but were converted to the broader categories (below college, college, bache-lor’s, master’s, and PhD) that correspond to the degree level informationavailable for the 1982 cohort in order to have the most consistent measurepossible across surveys.
Job satisfaction. This measure represents an index similar to the one con-structed for the job–education skill match, in this case based on individuals’responses to the question “Considering all aspects of your job, how satisfied areyou with it?”, with higher values indicating greater overall job satisfaction. Themeasures should be directly comparable across all survey years, since theresponse options were relatively similar: “very satisfied”, “satisfied”,“dissatisfied”, “very dissatisfied” in the 1986 and 1990 survey years (1988–1991 and 1992–1995); “not satisfied” and “not at all satisfied” representingthe last two options for the first cohort.
School-to-Work Transition of Canada Graduates 39
Overall evaluation of the education programme. Based on the question “Givenyour experience since completing the requirements for the diploma/de-gree … would you have selected the same educational program, a differentprogram, or no program?” for the 1982 and 1986 cohorts, and a similarquestion regarding the specific field of study for the 1990 cohort, with thesedifferent treatments driven by the different information available across thevarious surveys. The tables report the mean score of an index constructed fromthe responses to these questions similar to those created for the job–educationskill match and job satisfaction variables discussed above, essentially represent-ing the percentage of graduates who said they would have chosen the sameprogramme again.
Inter-provincial migration. A straightforward measure of a change in the prov-ince of residence (i) from graduation to the first interview, (ii) between the twointerviews, (iii) over either period.
The Empirical Findings
The discussion of the empirical findings is structured along three principalthemes:
• the general nature of the outcomes and their evolution from two to five yearsfollowing graduation;
• differences by level of education and sex;• comparisons of the results across cohorts.
The Distribution of Graduates by Sex and Level of Post-secondary Study
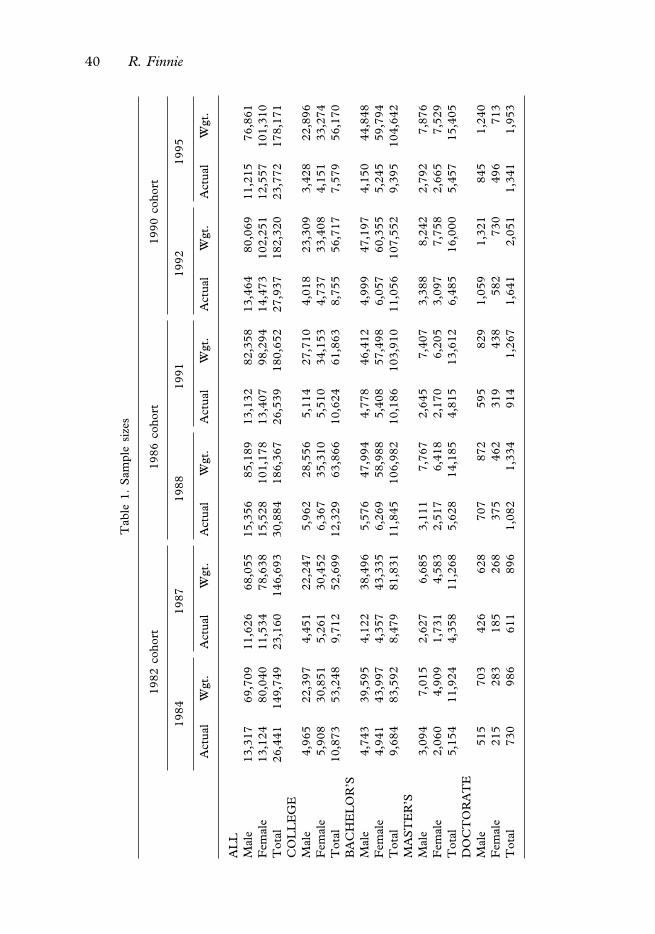
Sample sizes and the underlying populations of graduates. Table 1 shows thesample sizes for each of the cohorts. The unweighted numbers represent thenumber of individuals included in each of the NGS databases (with essentiallyno restrictions imposed), while the weighted numbers represent estimates ofthe underlying national population of graduates in each of the relevant years.(As noted above, all results presented below reflect those weights.)
The first striking aspect of these numbers is the size of the samples,indicating how the NGS databases facilitate the sort of detailed and robustanalysis that would be impossible with other more general surveys. Even at thePhD level (where the NGS databases have come to represent almost completecensuses of the population of graduates) there are between 600 and 1650observations across the various surveys, while the sample sizes are well into thethousands at the other levels (college, bachelor’s, master’s).
Also notable are the increases in the overall (weighted) number of graduatesover time, from approximately 149,700 for the first cohort (based on the 1984weighted numbers) to 182,300 in the most recent group (1992 weightednumbers), an increase of 21.8%, although the later numbers are down slightly
40 R. Finnie
Tab
le1.
Sam
ple
size
s
1982
coho
rt19
86co
hort
1990
coho
rt
1984
1987
1988
1991
1992
1995
Act
ual
Wgt
.A
ctua
lW
gt.
Act
ual
Wgt
.A
ctua
lW
gt.
Act
ual
Wgt
.A
ctua
lW
gt.
AL
L13
,317
69,7
0911
,626
68,0
5515
,356
85,1
89M
ale
13,1
3282
,358
13,4
6480
,069
11,2
1576
,861
13,1
2480
,040
11,5
3478
,638
15,5
2810
1,17
8F
emal
e13
,407
98,2
9414
,473
102,
251
12,5
5710
1,31
0T
otal
26,4
4114
9,74
923
,160
146,
693
30,8
8418
6,36
726
,539
180,
652
27,9
3718
2,32
023
,772
178,
171
CO
LL
EG
E4,
965
22,3
974,
451
22,2
475,
962
28,5
56M
ale
5,11
427
,710
4,01
823
,309
3,42
822
,896
Fem
ale
5,90
830
,851
5,26
130
,452
6,36
735
,310
5,51
034
,153
4,73
733
,408
4,15
133
,274
Tot
al10
,873
53,2
489,
712
52,6
9912
,329
63,8
6610
,624
61,8
638,
755
56,7
177,
579
56,1
70B
AC
HE
LO
R’S
4,74
339
,595
4,12
238
,496
5,57
647
,994
4,77
8M
ale
46,4
124,
999
47,1
974,
150
44,8
484,
941
43,9
974,
357
43,3
356,
269
58,9
88F
emal
e5,
408
57,4
986,
057
60,3
555,
245
59,7
94T
otal
9,68
483
,592
8,47
981
,831
11,8
4510
6,98
210
,186
103,
910
11,0
5610
7,55
29,
395
104,
642
MA
ST
ER
’S3,
094
7,01
52,
627
6,68
53,
111
7,76
7M
ale
2,64
57,
407
3,38
88,
242
2,79
27,
876
Fem
ale
2,06
04,
909
1,73
14,
583
2,51
76,
418
2,17
06,
205
3,09
77,
758
2,66
57,
529
Tot
al5,
154
11,9
244,
358
11,2
685,
628
14,1
854,
815
13,6
126,
485
16,0
005,
457
15,4
05D
OC
TO
RA
TE
Mal
e51
570
342
662
870
787
259
582
91,
059
1,32
184
51,
240
Fem
ale
215
283
185
268
375
462
319
438
582
730
496
713
730
986
611
896
1,08
21,
334
Tot
al91
41,
267
1,64
12,
051
1,34
11,
953

School-to-Work Transition of Canada Graduates 41
Table 2. The distribution of graduates and percentage of female graduates by level ofeducationa
1982 cohort 1986 cohort 1990 cohort
% by level % female % by level % female % by level % female
College 35.6 58 34.3 55 5931.1Bachelor’s 55.8 53 57.4 55 59.0 56Master’s 8.0 4841 8.87.6 46Doctorate 0.7 29 1.10.7 3635
a The percentages in this and all following tables do not necessarily add up to 100 owingto rounding.
(2.2%) from the middle cohort (186,400 graduates). The number of post-sec-ondary graduates thus increased significantly from the early 1980s to themiddle of that decade, then dropped off slightly in the early 1990s.
The distribution of graduates by degree level9. The overall numbers of graduatesreflect both the size of the underlying populations of young people of school-going age and the associated participation rates. This is, however, not the bestplace to investigate the relevant trends (the NGS data holding no particularadvantage over other data sources in this respect), whereas it is worth consid-ering the distribution of graduates by degree level, shown more explicitly inTable 2, as a lead-in to the other findings presented below.
College graduates comprised a declining share of post-secondary graduatesover time, falling from 35.6% of all graduates in 1982 to 31.1% in 1990. Thesedeclines were matched by increases in the shares of graduates at the otherlevels: from 55.8% to 59.0% on the part of bachelor’s graduates, from 8.0% to8.8% at the master’s level, and from 0.6% to 1.1% for PhD graduates.
The overall rise in the number of post-secondary graduates across cohortsnoted above was, therefore, mostly driven by increases at the bachelor’s level,these making up approximately 24,000 (or a more than proportionate 74%) ofthe 32,600 increase. On the other hand, the increases in the numbers ofgraduates were, in proportional terms, even greater at the master’s and PhDlevels. That is, the rise in the number of master’s graduates (from 11,900 to16,000) made up 12.6% of the total increase in the number of graduates from1982 to 1990, but this is considerably higher than their 8–9% share of thenumber of graduates in each of those years. Similarly, the increases at the PhDlevel (from 986 in 1982 to 2051 in 1990) made up 3.3% of the total expansionof post-secondary graduates, but this was far in excess of their 0.7–1.1% sharesof the total number of post-secondary graduates in those two cohorts.
The growth rates in the numbers of graduates from 1982 to 1990 thus rosemonotonically with degree level: 6.6% at the college level, 28.7% at thebachelor’s level, 34.2% at the master’s level, and a rather remarkable 108.0%

42 R. Finnie
at the PhD level. Any general discussion of post-secondary education inCanada should probably take such trends into account.
What, in particular, does the decline in the number of college diplomas infavour of the observed increases in bachelor’s level graduates mean in terms ofequipping the next generations of labour force participants with the job skillsthey will need in the most efficient manner? Is it, for example, possible thatsome of the “new” bachelor’s graduates might have been better off attendingcollege, with the monetary savings from such a shift (colleges are considerablyless costly to operate than universities) ploughed back into the system in amanner that increased the quality of education (and/or decreased the cost) atall levels? Are these shifts being driven by “credential creep”?
A different set of questions relates to the role of graduate level education inthe new “knowledge-based economy”. Are the relatively large proportionalincreases at the master’s and PhD levels a positive development in this regard?If the direction of change is correct, is its magnitude great enough, and are wecreating the right types of upper-level graduates (e.g. enough science/technicalgraduates)? These numbers provide a stepping-off point for many such ques-tions and further analysis10.
The share of female graduates. Table 2 also shows the percentage of femalegraduates at each level. Women made up the clear majority of graduates at thecollege and bachelor’s in each cohort, while they closed the gaps that exist atthe higher degree levels over time. In the latest cohort, women made up 59%and 56%, respectively, of graduates at the college and bachelor’s levels, justunder one-half at the master’s level (48%), and just over one-third at the PhDlevel (36%). Perhaps women have been gradually responding to the higherrates of return to post-secondary education they have enjoyed (e.g. Vaillan-court, 2002). In any event, the nature of the skills women hold will becomeincreasingly important to the nation’s economic performance as they compriserising shares of the body of post-secondary graduates and their rates of labourforce participation continue to increase11.
Further Studies
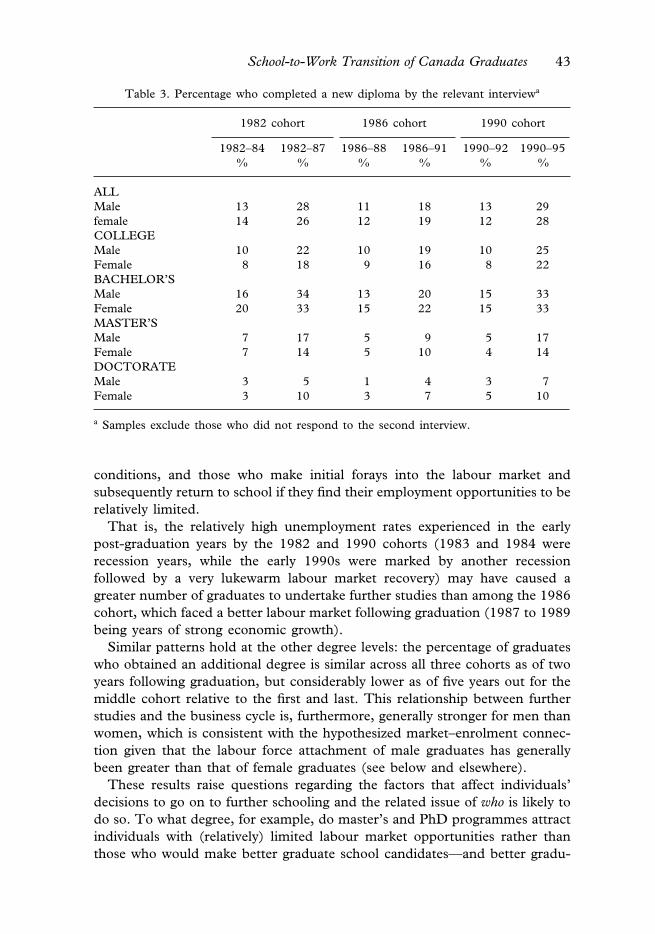
New diplomas. Looking at Table 3, which shows the percentage of graduateswho obtained a new diploma between graduation in the survey base year(1982, 1986, or 1990) and either of the two interviews following graduation,we see that bachelor’s level graduates were the most likely to go on to completeanother degree, with rates mostly in the 15% range as of two years followinggraduation, and from 20% to 34% by five years later.
The rates are uniformly lower for the second cohort, but only as of thesecond interview. These findings suggest there might be roughly two types ofbachelor’s graduates who continue with their studies: those who go straightthrough after finishing their undergraduate degrees and who might be commit-ted to this path more or less regardless of the prevailing labour market
School-to-Work Transition of Canada Graduates 43
Table 3. Percentage who completed a new diploma by the relevant interviewa
1982 cohort 1986 cohort 1990 cohort
1982–84 1982–87 1986–88 1986–91 1990–92 1990–95% % % % % %
ALLMale 13 28 11 18 13 29female 14 2826 1212 19COLLEGEMale 10 2522 1010 19Female 8 18 9 16 8 22BACHELOR’SMale 16 3334 1513 20Female 20 33 1515 3322MASTER’SMale 7 17 5 9 5 17Female 7 14 5 10 4 14DOCTORATEMale 3 5 1 34 7Female 3 10 3 7 5 10
a Samples exclude those who did not respond to the second interview.
conditions, and those who make initial forays into the labour market andsubsequently return to school if they find their employment opportunities to berelatively limited.
That is, the relatively high unemployment rates experienced in the earlypost-graduation years by the 1982 and 1990 cohorts (1983 and 1984 wererecession years, while the early 1990s were marked by another recessionfollowed by a very lukewarm labour market recovery) may have caused agreater number of graduates to undertake further studies than among the 1986cohort, which faced a better labour market following graduation (1987 to 1989being years of strong economic growth).
Similar patterns hold at the other degree levels: the percentage of graduateswho obtained an additional degree is similar across all three cohorts as of twoyears following graduation, but considerably lower as of five years out for themiddle cohort relative to the first and last. This relationship between furtherstudies and the business cycle is, furthermore, generally stronger for men thanwomen, which is consistent with the hypothesized market–enrolment connec-tion given that the labour force attachment of male graduates has generallybeen greater than that of female graduates (see below and elsewhere).
These results raise questions regarding the factors that affect individuals’decisions to go on to further schooling and the related issue of who is likely todo so. To what degree, for example, do master’s and PhD programmes attractindividuals with (relatively) limited labour market opportunities rather thanthose who would make better graduate school candidates—and better gradu-

44 R. Finnie
ate-level graduates—per se? Could a different set of incentives (e.g. graduateprogramme scholarships) affect these patterns?
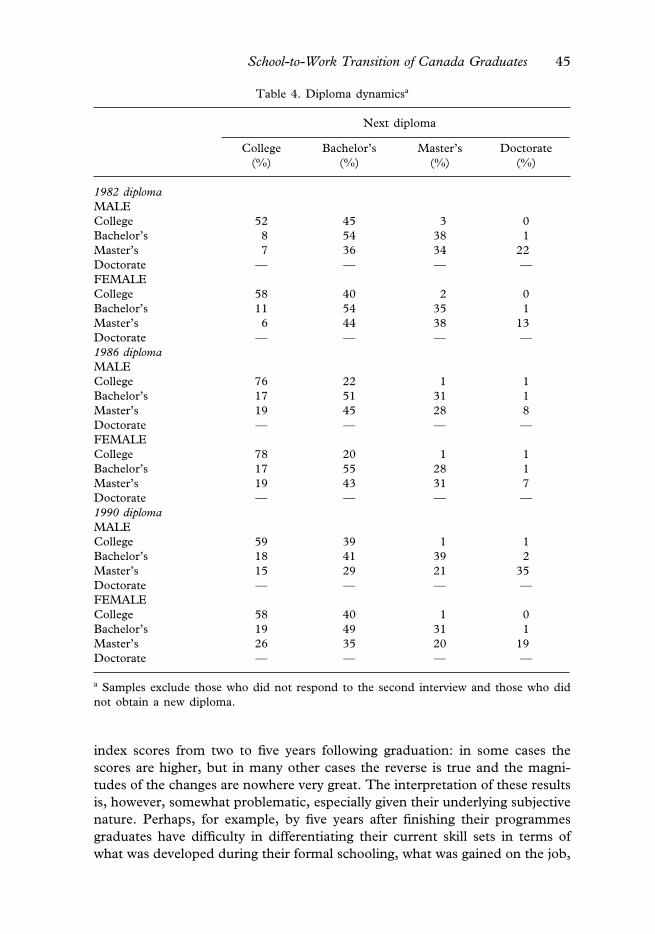
Diploma dynamics. Perhaps the most initially intriguing aspect of the detailedpatterns of new diplomas (Table 4) is the rather high proportion at the sameor lower level than the degree obtained in the survey base year. Amongbachelor’s graduates, for example, just 30–40% of the new diplomas were atthe master’s or PhD level, the rest being at the college or (again) bachelor’slevel.
There are, however, many reasons for these relatively high rates of “non-pro-gression”: some individuals first obtain a certificate and then continue on to theformal bachelor’s degree; others do an additional year or so beyond theiroriginal programme to pick up a different field of concentration, otherwiseround out their qualifications, or just bide time; and first professional degreesare included at the bachelor’s level (consistent with their treatment in the NGSdata and most standard education statistics). It is, therefore, perhaps not sosurprising that approximately one-half of all new diplomas obtained by bache-lor’s graduates were at that same (broad) level, these representing quitedifferent educational pathways12.
Perhaps of greater interest, then, are the patterns of clear “backtracking”.For example, as many as 26% of the new diplomas obtained by master’sgraduates were at the college level (females, 1990 cohort), and another 29–45% were at the bachelor’s level—although the latter again include firstprofessional degrees (as mentioned above), and not all individuals who contin-ued on to a PhD (a “normal” path) would have completed their studies by thesecond interview date, thus biasing the numbers registered for that pathwaydownward. For bachelor’s graduates, around 10% of all new degrees were atthe college level for the first cohort, but the figures rose to between 15% and20% for the two later cohorts.
We might, therefore, generally conclude that “non-standard” post-secondaryeducational pathways have not been uncommon and have increased in numberover time. This is an issue that clearly merits further study. What, in particular,are the implications of these findings regarding the different types and combi-nations of human capital individuals have been obtaining (presumably toadvance their careers) and the best means for the post-secondary system tohelp the related individual and social objectives?
The Job–Education Skill and Qualification Matches
The job–education skill use index. The job–education skill match scores (Table 5)are, overall, quite high, and suggest that individuals’ post-secondary educationshave indeed resulted in the development of skills that have proved useful intheir early labour market careers, especially at the master’s and PhD levels.There is no obvious pattern between men and women except, perhaps, for thescores to be somewhat higher for the latter at the college level.
With respect to the dynamic element, there were no dramatic increases in the
School-to-Work Transition of Canada Graduates 45
Table 4. Diploma dynamicsa
Next diploma
Master’sCollege DoctorateBachelor’s(%)(%) (%)(%)
1982 diplomaMALECollege 52 45 3 0Bachelor’s 8 54 38 1Master’s 227 3436Doctorate — — ——FEMALECollege 58 40 2 0Bachelor’s 11 54 35 1Master’s 136 3844Doctorate —— ——1986 diplomaMALECollege 76 22 1 1Bachelor’s 117 3151Master’s 19 45 828Doctorate —— ——FEMALECollege 78 20 1 1Bachelor’s 117 2855Master’s 3119 743Doctorate —— ——1990 diplomaMALECollege 159 139Bachelor’s 3918 241Master’s 3515 2129Doctorate — — — —FEMALECollege 058 140Bachelor’s 3119 149Master’s 1926 2035Doctorate — — — —
a Samples exclude those who did not respond to the second interview and those who didnot obtain a new diploma.
index scores from two to five years following graduation: in some cases thescores are higher, but in many other cases the reverse is true and the magni-tudes of the changes are nowhere very great. The interpretation of these resultsis, however, somewhat problematic, especially given their underlying subjectivenature. Perhaps, for example, by five years after finishing their programmesgraduates have difficulty in differentiating their current skill sets in terms ofwhat was developed during their formal schooling, what was gained on the job,

46 R. Finnie
Table 5. Index of the job–education skill matcha
1982 cohort 1986 cohort 1990 cohort
1984 1987 1988 1991 1992 1995
ALLMale 81 86 84 87 71 70Female 84 7487 7486 87COLLEGEMale 77 6982 7183 86Female 85 88 87 88 77 75BACHELOR’SMale 82 6987 6983 86Female 82 86 84 7185 72MASTER’SMale 90 93 91 93 78 77Female 90 92 92 94 82 80DOCTORATEMale 96 98 96 9097 89Female 93b 98 95b 98 91 91
a Samples exclude those who did not respond to the second interview, those who obtaineda new diploma by the relevant interview, and those who worked part-time due to school.b The means with no letter superscript have standard errors below 1, while those with asuperscript have standard errors between 1 and 2.
and what is a combination of the two. Or individuals may be using differentskills from those gained at school but ones that could never have beendeveloped except by building upon that more fundamental base.
For these reasons and others, the evolution of the job–education skill matchscores over the early years in the labour market should be interpreted withcaution, and other, more explicit questions—probably tailored to each disci-pline/occupation—would likely be required to get at this interesting and im-portant dynamic in a more meaningful way. Due to the change in the questionsasked between the first two and last cohorts (see above), no comment can beoffered on this other dynamic element.
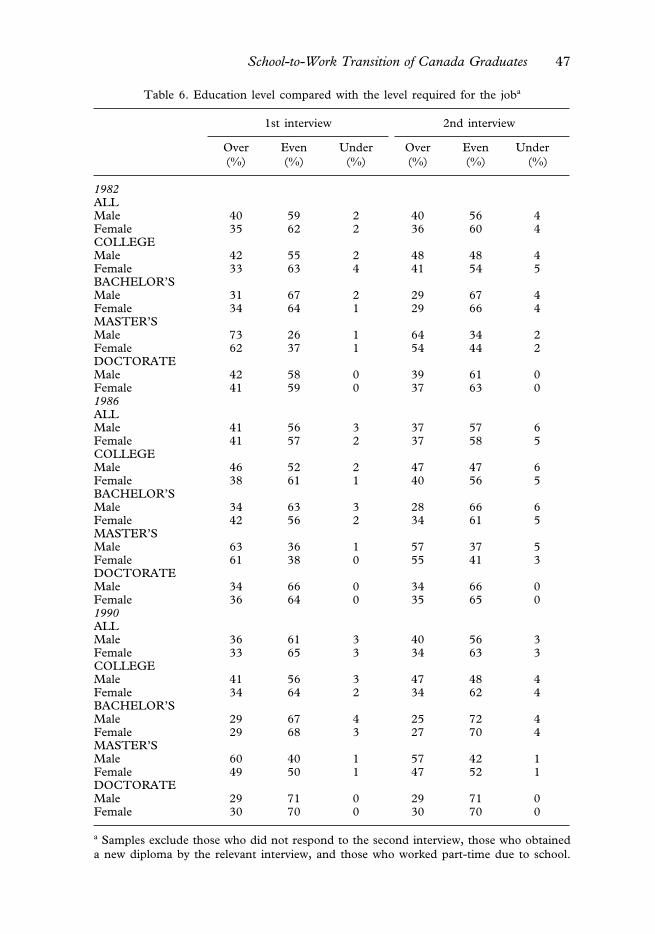
Job prerequisites and graduates’ qualifications. Another measure of the job–edu-cation match is represented in the comparisons of graduates’ educationalattainment with the prerequisites of the job held (Table 6). The measures thathave been constructed for this study (defined above) should tell us somethingabout the usefulness of graduates’ schooling in obtaining employment, theefficiency of the labour market in matching graduates to jobs, and relatedissues. The measures do not, however, identify the underlying factors atwork—for example, do they represent the matching of graduates’ actual skillswith those required in the labour market, credentials effects, or other phenom-ena? The data presented here cannot, unfortunately, provide the answers tosuch questions. The results are, however, interesting nonetheless.
School-to-Work Transition of Canada Graduates 47
Table 6. Education level compared with the level required for the joba
1st interview 2nd interview
Over Even Under Over Even Under(%) (%) (%) (%) (%) (%)
1982ALLMale 40 59 2 40 56 4Female 35 462 602 36COLLEGEMale 42 55 2 48 48 4Female 33 563 544 41BACHELOR’SMale 31 67 2 29 67 4Female 34 464 661 29MASTER’SMale 73 26 1 64 34 2Female 62 237 441 54DOCTORATEMale 42 58 0 39 61 0Female 41 059 630 371986ALLMale 41 656 573 37Female 41 57 2 37 58 5COLLEGEMale 46 4752 62 47Female 38 561 561 40BACHELOR’SMale 34 63 3 28 66 6Female 42 556 612 34MASTER’SMale 63 36 1 57 37 5Female 61 338 410 55DOCTORATEMale 34 66 0 34 66 0Female 36 064 650 351990ALLMale 36 5661 33 40Female 33 365 633 34COLLEGEMale 41 56 3 47 48 4Female 34 464 622 34BACHELOR’SMale 29 67 4 25 72 4Female 29 468 703 27MASTER’SMale 60 40 1 57 42 1Female 49 150 521 47DOCTORATEMale 29 071 710 29Female 7030 070 0 30
a Samples exclude those who did not respond to the second interview, those who obtaineda new diploma by the relevant interview, and those who worked part-time due to school.
48 R. Finnie
At first look, a substantial proportion of graduates appear to have beenover-qualified for their jobs in terms of the required levels of education (theover-qualification measure is focused on here, principally because the “under-qualified” outcome is quite rare, thus leaving the “evenly qualified” measure aspretty much the obverse of the first), these rates varying from 35% to 41% forgraduates of all educational levels taken together (varying along this fairlynarrow range by sex, cohort, and interview year.) Interestingly, master’sgraduates have generally had the highest rates of over-qualification, bachelor’sand PhD graduates the lowest rates, and college graduates have generally beenin the middle.
These results could, however, at least partly reflect a certain ambiguityregarding formal educational prerequisites versus the true requirements ofmany jobs. In the case of master’s graduates, for example, it might often be thecase that only a bachelor’s degree is officially required to apply for a position,but that a master’s degree is needed to successfully compete for the spot. Therelatively high over-qualification rates among master’s graduates should, there-fore, be interpreted with caution, especially with respect to any temptation toconclude that these results show that we have been producing too manygraduates at this level. Similar reasoning might—perhaps to differing degrees—apply at the other levels. Comparisons by sex should, on the other hand, bemore meaningful, and these indicate that being over-qualified has been some-what more common among men than women at the college and master’s levels,whereas the differences have more typically gone slightly in the other directionat the bachelor’s and PhD levels.
As for the changes in the qualifications measure in the years followinggraduation, a significant level of ambiguity again applies, especially since theunderlying questions asked about the required qualifications “when first hired”(the only measure that is consistent across all survey years). While, therefore,the results are interesting, we should probably interpret with caution thefindings that over-qualification rates would appear to have generally increasedin the years following graduation at the college and bachelor’s level, to havedecreased among master’s graduates, and to have remained fairly steady for thePhD groups. The master’s results might, however, reflect something of a“correction” for the apparently odd findings (high rates of over-qualification)discussed above13.
The observed tendency towards moderately lower rates of over-qualificationfor the later cohorts is perhaps more meaningful, and in any event offers nosupport for the notion that the quality of jobs being found by graduates hasbeen deteriorating in recent years. If anything, graduates’ jobs appear to havebeen getting better, not worse. The underlying increases in the educationallevels required in the jobs graduates have been finding could, however, alsorepresent “qualification creep”, whereby job requirements have been arbitrarilyraised. Sorting out these different possibilities is, unfortunately, a task thatremains beyond the scope of the present research undertaking.
School-to-Work Transition of Canada Graduates 49
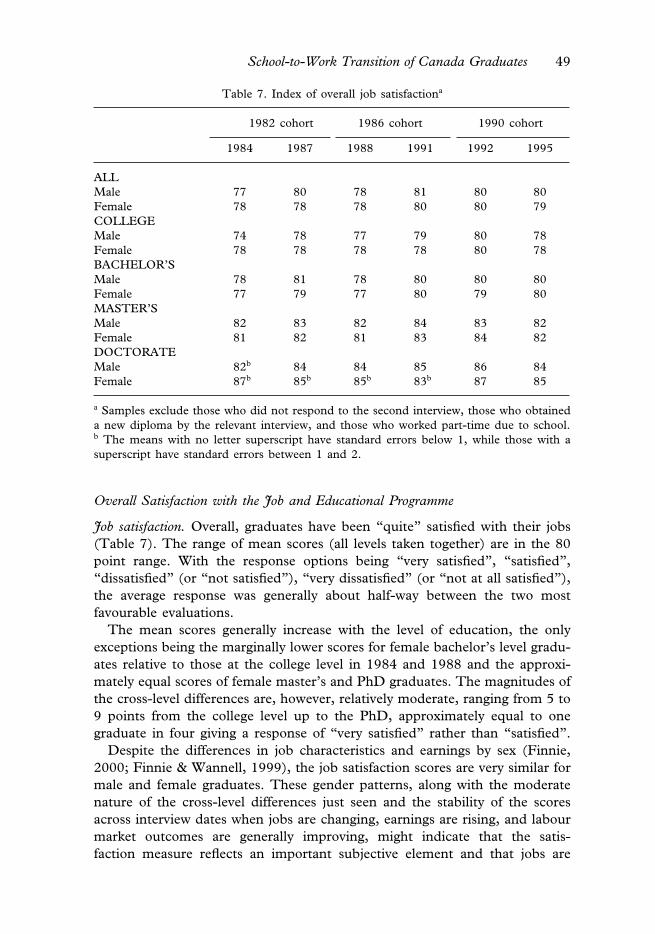
Table 7. Index of overall job satisfactiona
1982 cohort 1986 cohort 1990 cohort
1984 1987 1988 1991 1992 1995
ALLMale 77 80 78 81 80 80Female 78 7978 8078 80COLLEGEMale 74 7878 8077 79Female 78 78 78 78 80 78BACHELOR’SMale 78 8081 8078 80Female 77 79 77 7980 80MASTER’SMale 82 83 82 84 83 82Female 81 82 81 83 84 82DOCTORATEMale 82b 84 84 8685 84Female 87b 85b 85b 83b 87 85
a Samples exclude those who did not respond to the second interview, those who obtaineda new diploma by the relevant interview, and those who worked part-time due to school.b The means with no letter superscript have standard errors below 1, while those with asuperscript have standard errors between 1 and 2.
Overall Satisfaction with the Job and Educational Programme
Job satisfaction. Overall, graduates have been “quite” satisfied with their jobs(Table 7). The range of mean scores (all levels taken together) are in the 80point range. With the response options being “very satisfied”, “satisfied”,“dissatisfied” (or “not satisfied”), “very dissatisfied” (or “not at all satisfied”),the average response was generally about half-way between the two mostfavourable evaluations.
The mean scores generally increase with the level of education, the onlyexceptions being the marginally lower scores for female bachelor’s level gradu-ates relative to those at the college level in 1984 and 1988 and the approxi-mately equal scores of female master’s and PhD graduates. The magnitudes ofthe cross-level differences are, however, relatively moderate, ranging from 5 to9 points from the college level up to the PhD, approximately equal to onegraduate in four giving a response of “very satisfied” rather than “satisfied”.
Despite the differences in job characteristics and earnings by sex (Finnie,2000; Finnie & Wannell, 1999), the job satisfaction scores are very similar formale and female graduates. These gender patterns, along with the moderatenature of the cross-level differences just seen and the stability of the scoresacross interview dates when jobs are changing, earnings are rising, and labourmarket outcomes are generally improving, might indicate that the satis-faction measure reflects an important subjective element and that jobs are
50 R. Finnie
evaluated in a relative manner—presumably as compared with individuals’expectations, which would vary across sex–education groups and over time.
What we cannot know from this analysis, unfortunately, is whether thedifferences in satisfaction levels by sex reflect a situation where women aregetting the jobs they in fact want and deserve given their different preferencesand the (chosen?) different nature of their human capital investments and otherlabour market characteristics (e.g. different fields of study, weaker labour forceattachment, etc.), or whether they are simple resigned to a certain level oflabour market discrimination and feel satisfied with their jobs given thesystemic disadvantages they face.
The job satisfaction scores generally rose slightly from the first cohortthrough the third, thus lending further support to the notion that post-second-ary graduates have not experienced any significant deterioration in labourmarket outcomes over this period. On the other hand, the data also indicateslight differences as of the first and second interviews in this regard: the mostrecent cohort had uniformly stable or higher job satisfaction scores relative tothe first cohort as of the two-year interviews, whereas the later cohort’s scoresare no greater than one index point higher than those of the first cohort andsome of the changes are negative as of the five-year interviews. These resultsmight, therefore, suggest that the gains that graduates typically enjoy in theearly years following graduation have perhaps been slightly attenuated for themost recent group of graduates. Otherwise put, perhaps graduates’ longer-runoutcomes have been more stable or even declined relative to their moreimmediate post-graduate situations in recent years.
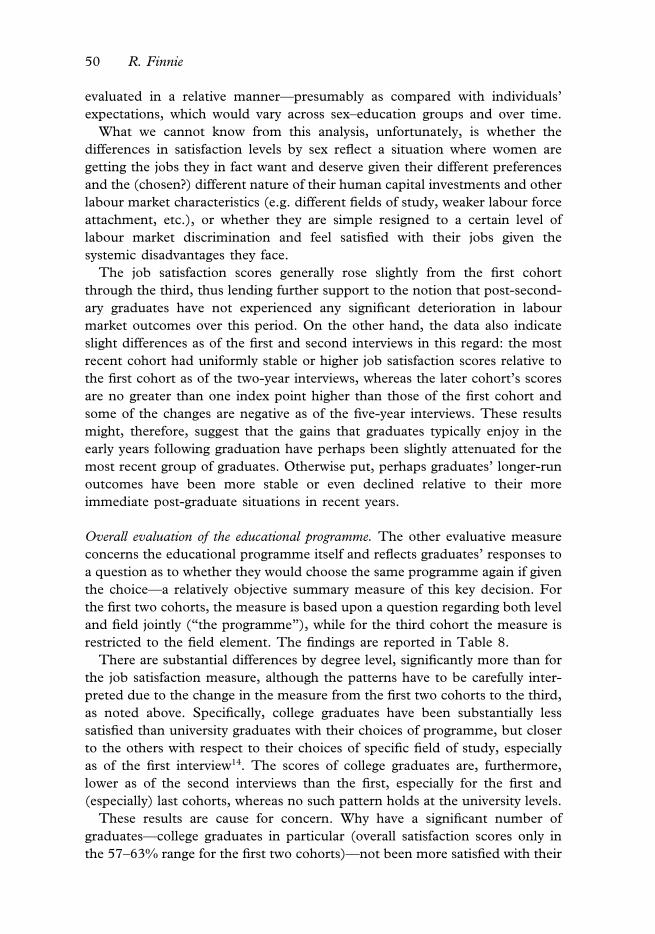
Overall evaluation of the educational programme. The other evaluative measureconcerns the educational programme itself and reflects graduates’ responses toa question as to whether they would choose the same programme again if giventhe choice—a relatively objective summary measure of this key decision. Forthe first two cohorts, the measure is based upon a question regarding both leveland field jointly (“the programme”), while for the third cohort the measure isrestricted to the field element. The findings are reported in Table 8.
There are substantial differences by degree level, significantly more than forthe job satisfaction measure, although the patterns have to be carefully inter-preted due to the change in the measure from the first two cohorts to the third,as noted above. Specifically, college graduates have been substantially lesssatisfied than university graduates with their choices of programme, but closerto the others with respect to their choices of specific field of study, especiallyas of the first interview14. The scores of college graduates are, furthermore,lower as of the second interviews than the first, especially for the first and(especially) last cohorts, whereas no such pattern holds at the university levels.
These results are cause for concern. Why have a significant number ofgraduates—college graduates in particular (overall satisfaction scores only inthe 57–63% range for the first two cohorts)—not been more satisfied with their
School-to-Work Transition of Canada Graduates 51
Table 8. Index of the overall evaluation of the education programmea
1982 cohort 1986 cohort 1990 cohort
1984 1987 1988 1991 1992 1995(%) (%) (%) (%) (%) (%)
ALLMale 70 68 70 64 80 68Female 68 6564 7869 63COLLEGEMale 63 6859 8065 64Female 65 57 67 63 76 65BACHELOR’SMale 72 7270 7571 71Female 69 68 7469 7170MASTER’SMale 83 83 83 82 87 84Female 77 79 80 81 85 81DOCTORATEMale 81b 84b 83b 85b82b 82b
Female 79c 84c 78c 81b 86b 82b
a Samples exclude those who did not respond to the second interview.b The means with no letter superscript have standard errors below 1, those with superscriptb
have standard errors between 1 and 2.c Those with superscriptc have standard errors between 2 and 3.
overall programme choices? What would they have preferred? Are there re-forms that could be implemented to the college system or are there other bettermeans for equipping individuals with the human capital they need, such asexpansions of the sorts of apprenticeship, training, or other job experienceprogrammes that are so much more common in Western and NorthernEurope? In short, Canada has a very extensive college system relative to mostother Western countries: how well it is doing its job?
The cross-cohort patterns among university graduates further indicate rela-tively high levels of satisfaction with their choice of degree programmes, seenin the small differences in the scores in the years the level element is included(1984–1987, 1988–1991) and the years it is excluded (1992–1995)15. Thisinference also allows us to interpret the reported scores as coming close torepresenting the percentage of university graduates who said they would choosethe same field again (the 1992 and 1995 results represent this directly), thesevarying from 68% to 75% for bachelor’s graduates, from 77% to 85% at themaster’s level, and from 79% to 86% at the PhD level. In most cases, womentend to have somewhat lower scores than men.
Finally, while the different constructions of the measures in the first two andthird cohorts mean that we should be very cautious in comparing the levelsacross these different groups, the changes between the first and second inter-view were uniformly less favourable for the later cohort relative to the earlier

52 R. Finnie
two. That is, all scores declined from 1992 to 1995, whereas this was not thecase for the earlier groups, which might (again) hint at at least a smallishchange in the evolution of outcomes for graduates over the early years in thelabour market.
The Inter-provincial Mobility of Graduates
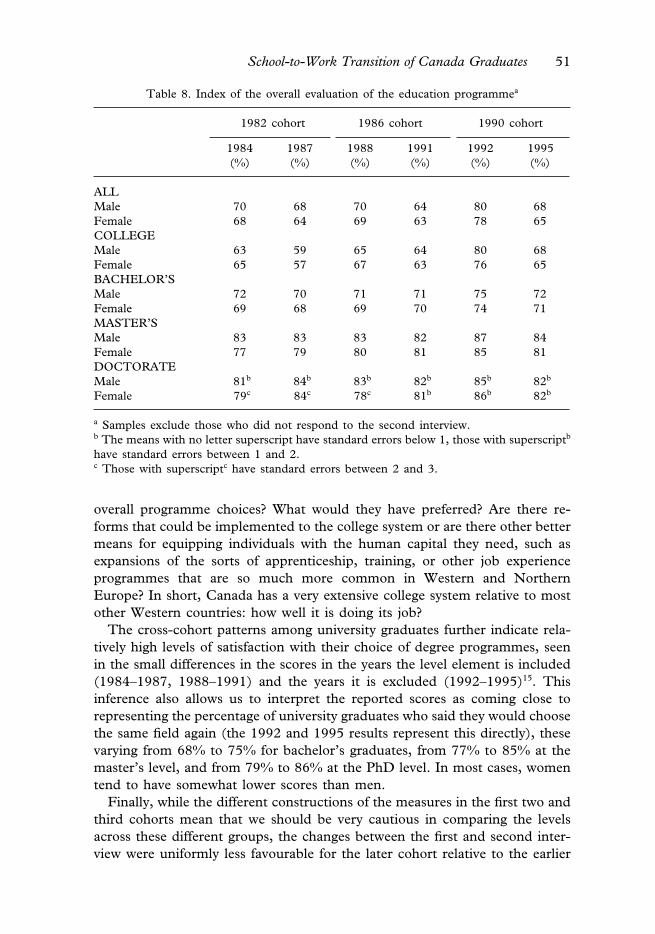
Table 9 presents the inter-provincial migration of graduates. Probably the moststriking aspect of the findings is the large differences by level of education: just6% or 7% of college graduates moved in the five years following graduation,rates varied from 11% to 18% among the bachelor’s and master’s levelgraduates, while between 21 and 34% of the PhD level graduates changed theirprovince of residence (the rates varying by sex and particular cohort). The ratesat the highest degree level were, therefore, 3 to 5 times greater than those at thelowest level.
These patterns presumably reflect the geographical extent of the relevantlabour submarkets corresponding to level of education. College graduates areclearly in more local markets, PhD graduates operate at the national level to amuch greater degree, and bachelor’s and master’s graduates lie in-betweenthese others. While the general nature of these patterns might have beenpredicted, the magnitudes are interesting.
These results are relevant to various policy issues regarding the costs andbenefits of post-secondary education in Canada. In a context where post-sec-ondary education is exclusively a provincial jurisdiction (although supported bythe federal government in the form of the block grants, the Canada StudentLoans Program, the federal granting agencies, and in other ways), the findingsshow that significant numbers of graduates have been leaving the provincesthat have financed their schooling, and that it has been those individuals inwhich the greatest investments have been made who have been leaving at thegreatest rates16.
The flows have, furthermore, been asymmetric, with certain provinces beingnet gainers and others net losers in terms of graduate flows (Burbidge & Finnie,2001). That said, mobility is generally desirable at not only the individual level,but also in terms of economic efficiency and the other benefits (economic,cultural, social, political) that result when young people (in particular) moveacross the country towards their greatest opportunities. These findings thusprovide an interesting point of departure for discussions regarding the fairnessand efficiency of the financing of post-secondary education in Canada. Should,for example, there be a system whereby those provinces that provide greater(proportional) shares of the nation’s post-secondary education are compen-sated for the related expenditures?17
As for other specific patterns, there was generally more mobility over the twoyears between graduation and the first interview than over the following threeyears, thus indicating a situation of declining marginal mobility over time. Thisis not surprising, since many graduates are likely to move at the precise point
School-to-Work Transition of Canada Graduates 53
Table 9. Percentage who migrated between provinces
Graduation to 1st Graduation to 2nd1st interview to 2ndinterview interview interview
(%) (%)(%)
1982ALLMale 11 7 13
11Female 79COLLEGE
7Male 564Female 75
BACHELOR’SMale 13 9 16Female 11 8 14MASTER’SMale 15 8 17
14Female 713DOCTORATE
24Male 111811Female 2320
1986ALLMale 9 7 12
10Female 77COLLEGE
7Male 555Female 74
BACHELOR’S14Male 810
7Female 118MASTER’S
17Male 914Female 11 7 14DOCTORATE
34Male 1625Female 15 11 211990ALL
13Male 711Female 9 6 11COLLEGE
7Male 46Female 4 3 6BACHELOR’S
8Male 141214Female 811
MASTER’SMale 15 9 18
13Female 612DOCTORATE
32Male 12279Female 2522

54 R. Finnie
of graduation, while mobility would presumably diminish as more satisfactoryjobs were found, the preferred province was moved to, personal roots becameestablished, and so on.
Male graduates have generally been somewhat more mobile than females,presumably for a number of economic and non-economic reasons. Theirgreater attachment to the labour market and associated career orientationwould, for example, presumably cause them to move more often in response toemployment opportunities in other provinces, while the “psychological costs”of moving might also be smaller18.
Finally, there are no obvious cross-cohort trends in mobility patterns, seenbest in the cumulative totals. This might be a somewhat surprising finding forsome, coming as it does in a context where increased mobility of all sorts seemsto be taken as a matter of fact19. The exception to this rule is the case of PhDgraduates, for whom mobility did rise over time.
Conclusion
This paper has presented the findings of a multi-faceted empirical analysis ofthe school-to-work transition of post-secondary graduates in Canada in the1980s and 1990s based on the National Graduates Surveys. The principal goalof the paper has been to exploit the large sample sizes and their representativenature, their longitudinal aspect, the interesting mix of variables included onthe files, and the availability of data for three separate cohorts to provide adynamic view of the school-to-work transition of post-secondary graduates, tocompare the patterns by level of education and sex, and to see if thesetendencies have shifted from the early 1980s into the mid-1990s.
The major findings and some of their implications may be summarised asfollows:
• There was an increase in the number of post-secondary graduates over thisperiod and a shift in their composition towards university, rather thancollege, graduates. The particularly large gains at the graduate level maypresumably be seen as a positive development in the context of the emerging“knowledge-based economy”. It is less clear if the decline in the share ofcollege graduates is a good thing in terms of providing individuals withproductive careers and employers with the workers they need in the mostefficient manner. For example, any pure “credentials effect” would representa socially inefficient situation and needless costs for individuals seeking thehuman capital investments required for today’s economy (and tomorrow’s)jobs.
• Women constituted a majority of graduates at the college and bachelor’slevels (pushing 60% in some cases) in all cohorts. They also made upincreasing shares at the master’s and PhD levels, those trends, along withtheir majority representation at the undergraduate level, suggesting that
School-to-Work Transition of Canada Graduates 55
women might constitute a still growing share of higher level graduates in theyears to come.
• Many graduates (e.g. as much as a third at the bachelor’s level) obtainedadditional diplomas in the years following graduation, and prevailing labourmarket conditions appear to play a significant role in this dynamic.“Backtracking” has been perhaps surprisingly common (e.g. as many asone-quarter of the female master’s graduates subsequently obtained a collegediploma) and appears to have become more common over time, raisingquestions about individuals’ educational choices and the role of the differenttypes of post-secondary education in the overall development of the nation’sstock of human capital.
• The job–education skill match scores are, overall, quite high, especially at themaster’s and PhD levels. The absence of any clear time trends suggest that,contrary to common belief, the quality of graduates’ jobs has not beendeclining over time. The observed stability of the relationship between theeducational prerequisites of the jobs graduates have been obtaining with thedegrees held offers further support of this notion.
• Job satisfaction scores are generally higher at the more advanced degreelevels but seem to incorporate a significant relative element (by sex, level).The cross-cohort trends are generally in a slightly upward direction, furthersupporting the notion that there has been no significant deterioration in thequality of graduates’ jobs over this period.
• Graduates generally express high levels of overall satisfaction with theireducational choices, most graduates saying they would choose the sameprogramme again. These scores fall off at the college level, however, begginga variety of policy-related questions.
• The extent of inter-provincial mobility of graduates rises with the educa-tional level, presumably reflecting the more national scope of the labourmarkets faced by individuals with more education. The significant levels ofinter-provincial mobility raise a number of issues regarding the costs andbenefits of post-secondary education, which is primarily provinciallyfunded—since the “product” (i.e. graduates) often moves from the provincethat has funded the investment.
The results reported in this study point to any number of further avenues ofresearch, including analysing any of the outcomes reported here in more detailor using more sophisticated empirical methods to get at their determinants andtheir evolution over time. This paper was intended to provide an overview ofthe school-to-work transition of post-secondary graduates and thus provides apoint of departure to further studies rather than an exhaustive analysis of anyparticular aspect.
Perhaps the most intriguing general result is, however, the absence of anyclear evidence of a deterioration in outcomes across the three cohorts, a findingthat is consistent with the findings of related work that focuses on othermeasures, including labour market outcomes (Finnie, 1999a; 2000a). It will be

56 R. Finnie
interesting to continue to track these trends over time as new NGS databasesbecome available.
Acknowledgements
This research was made possible by financial support received from the HumanCapital and Education Studies Division of Human Resources DevelopmentCanada (Applied Research Branch). A Social Sciences and Humanities Re-search Council grant provided assistance for an earlier phase of the work.Helpful comments were received from Chris Ferrall, Doug Giddings, PhilipJennings, Garnett Picot, Ted Wannell, and two anonymous reviewers. Excel-lent research assistance was provided by Michel Villeneuve, Marc Frenette,and Roger Sceviour.
Notes
1. See Krahn (1996) for a review of the existing evidence in the Canadian context, andOECD (1996) for an international perspective.
2. Beaudry and Green (1997), Beach and Slotsve (1996), Finnie (1997), Morissette andBerube (1996), Morissette, Myles, and Picot (1995), Picot (1998), Riddell (1995),and Zyblock (1996) all report that the earnings levels of younger workers have beendeclining in relative and/or absolute terms; while Beaudry and Green (1997), Moris-sette and Berube (1996), and a series of papers by Finnie and various colleagues (e.g.Beach & Finnie, 1998; Finnie, 2001; 2003) indicate that younger workers’ move-ments up the earnings ladder over the early years in the labour market have alsoslowed.
3. See Finnie (1999b) for more details on the material covered in this section.4. The NGS databases are based on a stratified sampling scheme (by province, level of
education, and field of study). All results reported below reflect the appropriatesample weights.
5. See Finnie (2000) for further discussion of the relevant issues. Response rates werearound 80% for the first interview, and 80–90% of these individuals were successfullyinterviewed a second time (as documented in Table 1, presented below).
6. An analysis of the 1982 cohort, for which enrolment status as of the interview datesis given in the NGS files (which is not the case for the later cohorts), revealed thatmost individuals eliminated by this restriction were in fact full-time students and,conversely, that most full-time students were eliminated by this condition, preciselyas wished.
7. The latter condition was defined as being a full-time worker having less than C$5000in annual earnings (the equivalent of a wage of about C$3.20 per hour for 30 hoursof work per week over 52 weeks).
8. Further documentation, including the detailed construction of each of the measures,the comparability of the measures across survey years, and an explanation of how thevariables used here differ from similar measures available directly on the NGS files,is found in Finnie (1999b).
9. See Finnie (2001) and Finnie and Frenette (2003) for further discussion of thedistribution of graduates by discipline and an analysis of outcomes along thisdimension.
10. See Lavoie and Finnie (1999) for the case of science and technical graduates inparticular.
School-to-Work Transition of Canada Graduates 57
11. See Finnie and Wannell (1999) for a focus on differences in labour market outcomesby sex.
12. Tighter degree categories could be defined in certain years, thus allowing, forexample, the differentiation of certificates and other related awards from formalbachelor’s degree, the identification of first professional degrees, and so on, and thesame could be done at the other degree levels. Such an exercise could, however, notbe carried out in a consistent fashion across all three cohorts due to the differencesin the degree categories (original and/or subsequent) across surveys. Considerableuncertainty would, furthermore, remain even after the construction of such precisepathways, since the same diploma can mean different things in different situations,including different rules across different institutions (e.g. at some universities asecond bachelor’s degree is never awarded and certificates are given instead, whilecertificates unambiguously represent shorter “sub-bachelor’s” programme at otherinstitutions). In short, such a greater detailing of educational pathways would beinteresting, but comprise a relatively complex yet uncertain exercise.
13. For example, perhaps a significant proportion of master’s graduates gain promotionsinto positions that more clearly require the advanced degree.
14. This evaluation is, however, tempered by its underlying assumption that the cross-co-hort differences in scores are principally driven by the change in the nature of themeasure (programme and field versus field alone), as opposed to any shift in theactual underlying evaluations with respect to field over this period.
15. That is, since moving from the level-included measure to the level-excluded measureresults in little change in the index scores, the level effects themselves would appearto be small (i.e. few graduates would have chosen differently in this regard). Thisnotion is supported by the results for the programme level alone in the years for whichthis information is available.
16. Of course many graduate students undertake their advanced studies in provincesother than where they completed their first degrees, meaning that the total invest-ments in master’s and PhD graduates are often shared by at least two provinces—withthe associated losses thus similarly divided.
17. Burbidge and Finnie (2001) focus on this issue for the case of bachelor’s levelgraduates.
18. Such issues are discussed in the context of mobility patterns for the entire population(not just post-secondary graduates) in Finnie (1999c).
19. The finding is, however, consistent with the results reported in Finnie (1999c).
References
Beaudry, P., & Green, D. (1997). Cohort patterns in Canadian earnings: Assessing the roleof skill premia in inequality trends. Mimeo, Department of Economics, University ofBritish Columbia.
Beach, C. M., & Finnie, R. (1998). Earnings mobility 1982–1994. Canadian BusinessEconomics, 6(4), 3–25.
Beach, C. M., & Slotsve, G. A. (1996). Are we becoming two societies? Toronto: C. D. HoweInstitute.
Burbidge, J., & Finnie, R. (2001). The geographical mobility of baccalaureate graduates:Evidence from three cohorts of the National Graduates Surveys, 1982, 1986, 1990.Canadian Journal of Regional Science, XXIII(3), 377–401.
Finnie, R. (1997). Stasis and change: Trends in individuals’ earnings inequality, 1982–92.Canadian Business Economics, 5(4), 84–107.
Finnie, R. (1999a) Holding their own: Trends in the employment rates and earnings levelsof recent post-secondary graduates in Canada. Canadian Business Economics, 7(4),pp. 48–64.
58 R. Finnie
Finnie, R. (1999b). A dynamic analysis of the school-to-work transition of Canadianpost-secondary graduates. Human Resources Development Canada (Applied Re-search Branch) Working Paper Research Paper R–99–14-E.
Finnie, R. (1999c). The patterns of inter-provincial migration in Canada 1982–95: Evi-dence from longitudinal tax-based data. Canadian Studies in Population, 26(2) (1999),205–235.
Finnie, R. (2000). From school to work: The evolution of early labour market outcomes ofCanadian post-secondary graduates. Canadian Public Policy, 26(2), pp. 197–224.
Finnie, R. (2001). Fields of plenty, fields of lean: The early labour market outcomes ofCanadian university graduates. Canadian Journal of Higher Education, 31(1), 141–176.
Finnie, R. (2003). Earnings mobility in Canada. Journal of Income Distribution, 11(1),77–101.
Finnie, R., & Frenette, M. (2003). Earnings differences by major field of study: Evidencefrom three cohorts of tecent Canadian graduates. Economics of Education Review,22(2), 179–98.
Finnie, R., & Wannell, T. (1999). The gender earnings gap amongst Canadian bachelor’slevel university graduates: A cross-cohort, longitudinal analysis. In R Chaykowski &Lisa Powell (Eds.), Women and work (pp. 1–50). John Deutsch Institute, Queen’sUniversity, McGill-Queen’s University Press.
Krahn, H. (1996). School–work transitions: Changing patterns and research needs. Dis-cussion paper prepared for the Applied Research Branch of Human ResourcesDevelopment Canada.
Lavoie, M., & Finnie, R. (1999). Is it worth doing a science or technology degree inCanada? Empirical evidence and policy implications. Canadian Public Policy, 25(1),101–121.
Morissette, R., & Berube, C. (1996). Longitudinal aspects of earnings inequality in Canada.Analytical Studies Branch, Statistics Canada, Research Paper No. 94.
Morissette, R., Myles, J., & Picot, G. (1995). Earnings polarization in Canada, 1969–1991.In K. G. Banting & C. M. Beach (Eds.), Labour market polarization and social policyreform (pp. 1–20). Kingston, Canada: School of Policy Studies, Queen’s University.
OECD (1996). Employment outlook. Paris.Picot, G. (1998). What is happening to earnings inequality in the 1990s? Canadian Business
Economics, 5(4), 3–16.Riddell, C. (1995). Human capital formation in Canada: Recent developments and policy
responses. In K. G. Banting & C. M. Beach (Eds.), Labour market polarization andsocial policy reform (pp. 125–172). Montreal: McGill-Queen’s University Press.
Vaillancourt, F., & Bourdeau-Primeau, S. (2002). The returns to education in Canada:1990 and 1995. In D. Laidler (Ed.), Renovating the ivory tower: Canadian universitiesand the knowledge economy (pp. 215–240). Toronto: C. D. Howe Institute.
Zyblock, M. (1996). Individual earnings inequality and polarization: An exploration intosub-population trends in Canada, 1981 to 1993. Canadian Business Economics, 5(4).