the science of instagram analytics - evan james, social bakers
TRANSCRIPT

The Science of Instagram Analytics
@evanjames11
Evan James
Head of North America
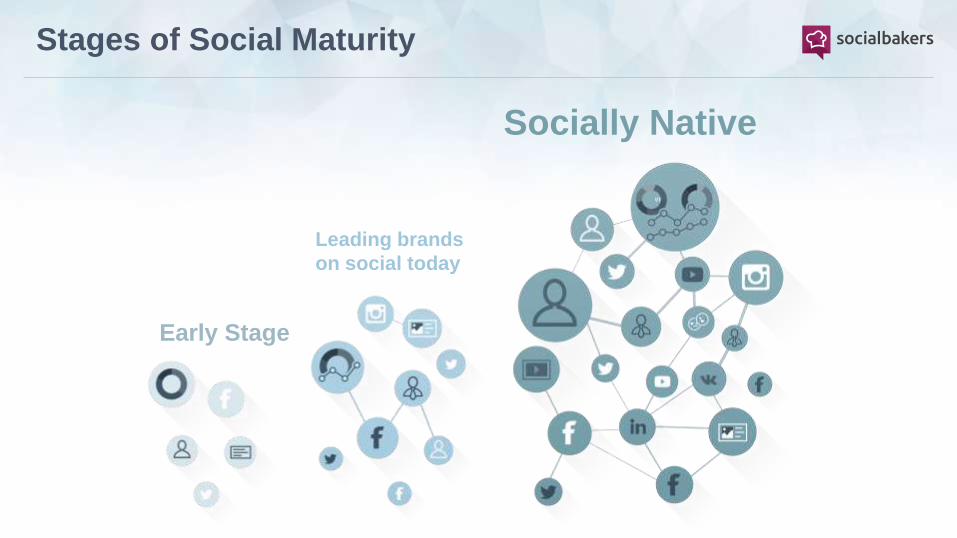
Stages of Social Maturity
Socially Native
Early Stage
Leading brands
on social today
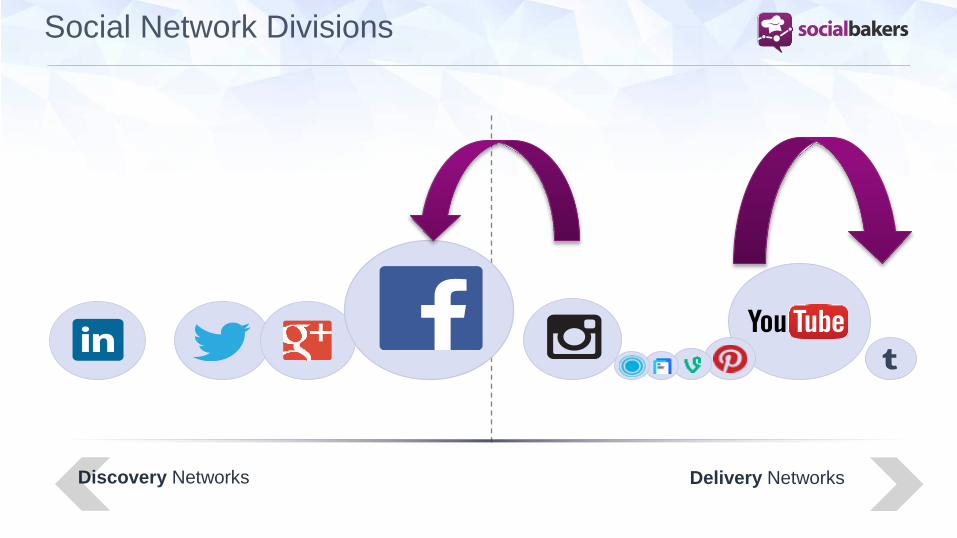
Social Network Divisions
Delivery NetworksDiscovery Networks

The network is in a “development” stage
Content strategy should focus on interactions
Don’t measure in isolation
Turn insight into action
Key Traits of Instagram

The Instagram Landscape in 2015
DevelopingKey focus now
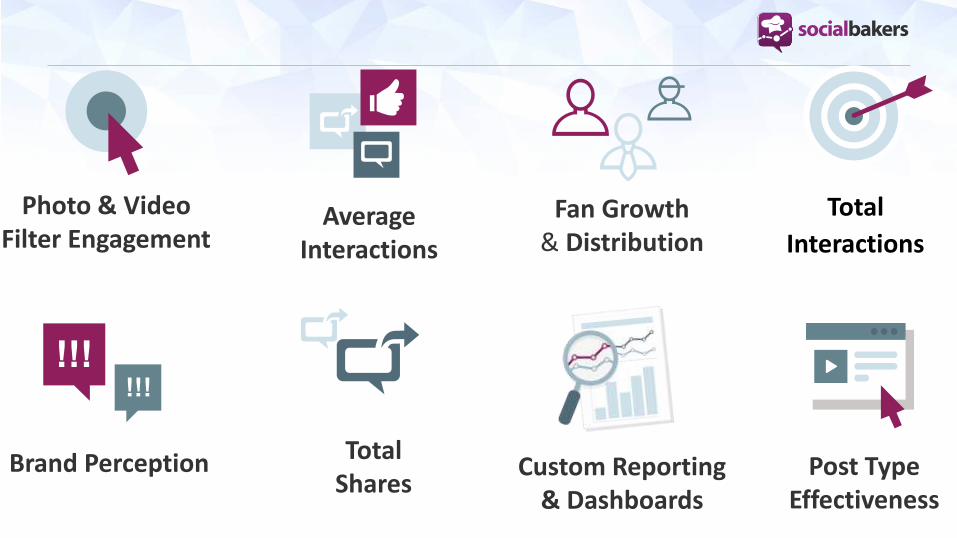
Photo & Video Filter Engagement
AverageInteractions
Fan Growth& Distribution
Total
Interactions
Brand Perception TotalShares
Post Type Effectiveness
Custom Reporting & Dashboards
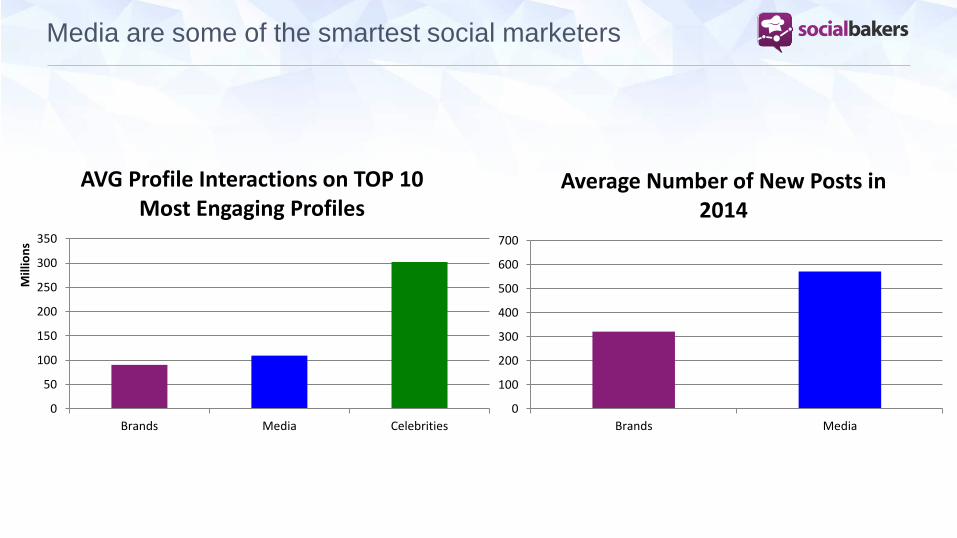
Media are some of the smartest social marketers
0
100
200
300
400
500
600
700
Brands Media
Average Number of New Posts in 2014
0
50
100
150
200
250
300
350
Brands Media Celebrities
Mill
ion
s
AVG Profile Interactions on TOP 10 Most Engaging Profiles

Photo or Video?
95%
89%
0% 10% 20% 30% 40% 50% 60% 70% 80% 90% 100%
Brands
Media
Post Type Distribution
image video
0.000%
0.500%
1.000%
1.500%
2.000%
2.500%
3.000%
3.500%
image video
Brands - Average of Post ER
0.000%
0.500%
1.000%
1.500%
2.000%
2.500%
3.000%
image video
Media - Average of Post ER

Normal Filters Dominate
0%
1%
1%
2%
2%
3%
3%
4%
Brands - Image Filter Usage
81%
90%
0% 10% 20% 30% 40% 50% 60% 70% 80% 90% 100%
image
video
Brands - Filter Usage
Normal Others
0%
1%
1%
2%
2%
3%
Brands - Video Filter Usage

Filter Usage Is Highly Dependent On Industry
50% 55% 60% 65% 70% 75% 80% 85% 90% 95%
Services
Alcohol
Auto
Retail
Beauty
Beverages
All Brands
Fashion
Electronics
Ecommerce
Sporting Goods
Share of Normal Filter
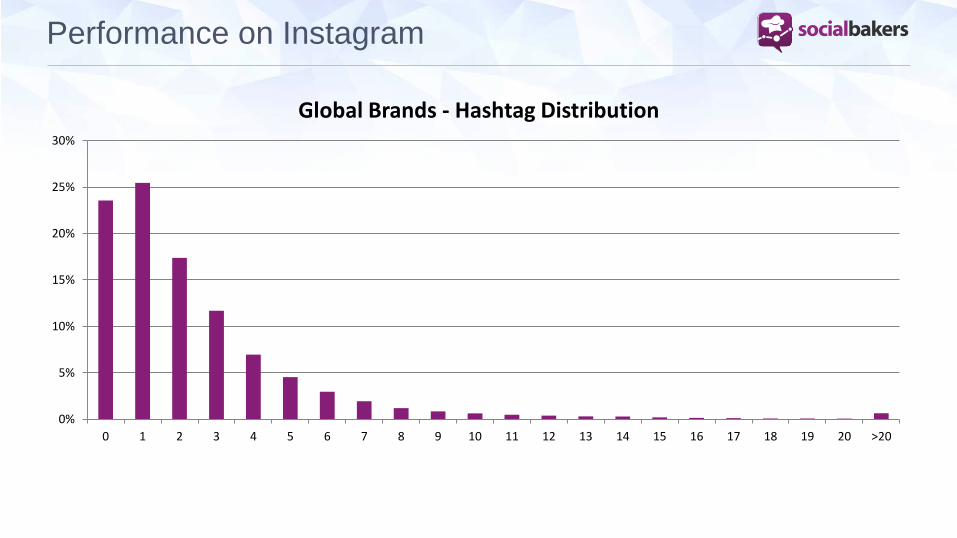
Performance on Instagram
0%
5%
10%
15%
20%
25%
30%
0 1 2 3 4 5 6 7 8 9 10 11 12 13 14 15 16 17 18 19 20 >20
Global Brands - Hashtag Distribution

Hashtags: Also Depends On Your Industry
0%
10%
20%
30%
40%
50%
60%
Fashion Beauty Ecommerce Retail Auto Alcohol Sporting Goods Electronics Beverages Services
0#
1#
2#
3#
>4#

90% of Posts < 300 Characters
0%
2%
4%
6%
8%
10%
12%
14%
16%
Brands - Number of Post Characters
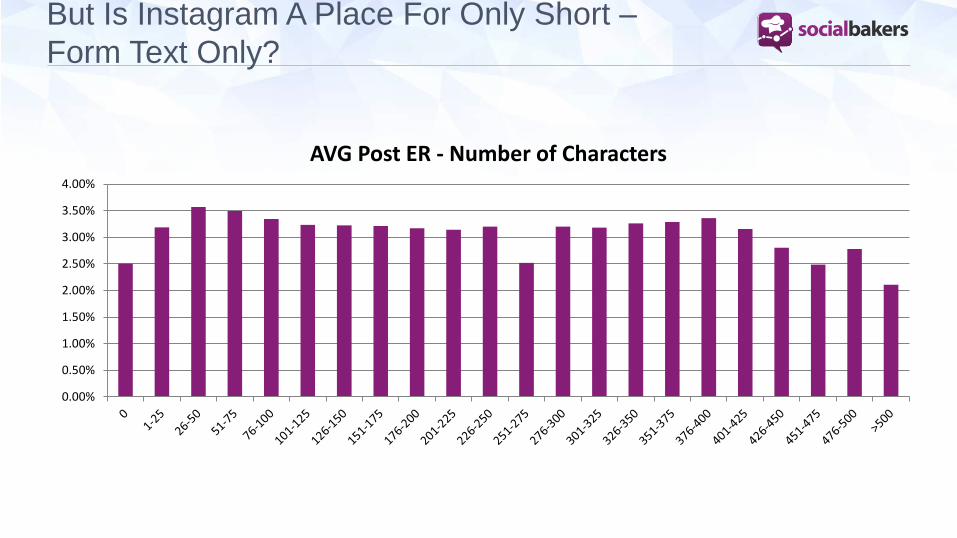
But Is Instagram A Place For Only Short –
Form Text Only?
0.00%
0.50%
1.00%
1.50%
2.00%
2.50%
3.00%
3.50%
4.00%
AVG Post ER - Number of Characters

Anyone can shoot & publish, but
brands need high-quality photos & videos
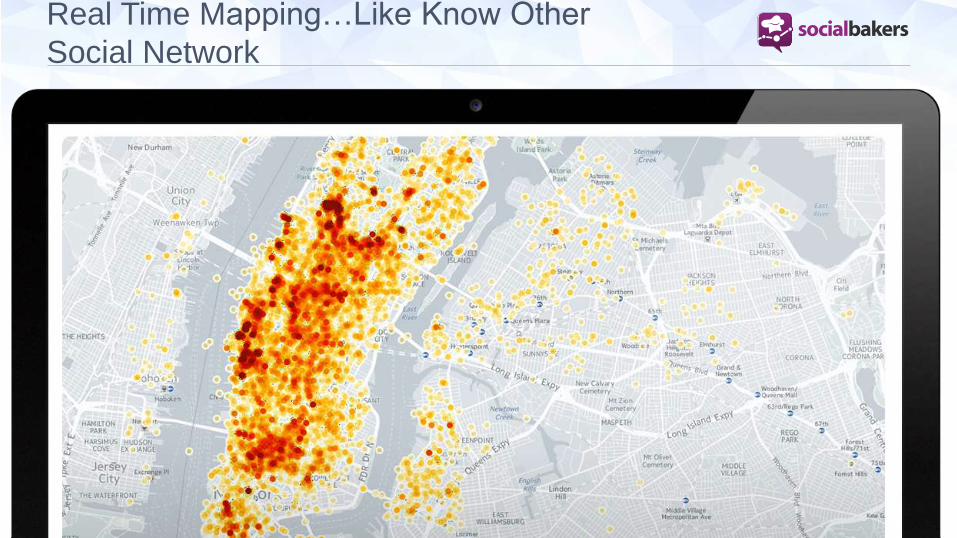
Real Time Mapping…Like Know Other
Social Network

@socialbakers at #SMWNYC
Socialbakers AnalyticsC
ore
An
aly
tic
s
Ad
va
nc
ed
Re
po
rtin
g
Pre
miu
m
An
aly
tic
s
Promoted Post
Detection
Social Health
Index
Inspiration
Pack
Data
Exports
Executive
Dashboard
Command
Center
Social Media
Dashboard
Over 100
Social KPIs
Industry
Benchmarks
Competitor
Comparison
Custom Labels
and Filters
Integrated Facebook
Insights
@socialbakers at #SMWNYC
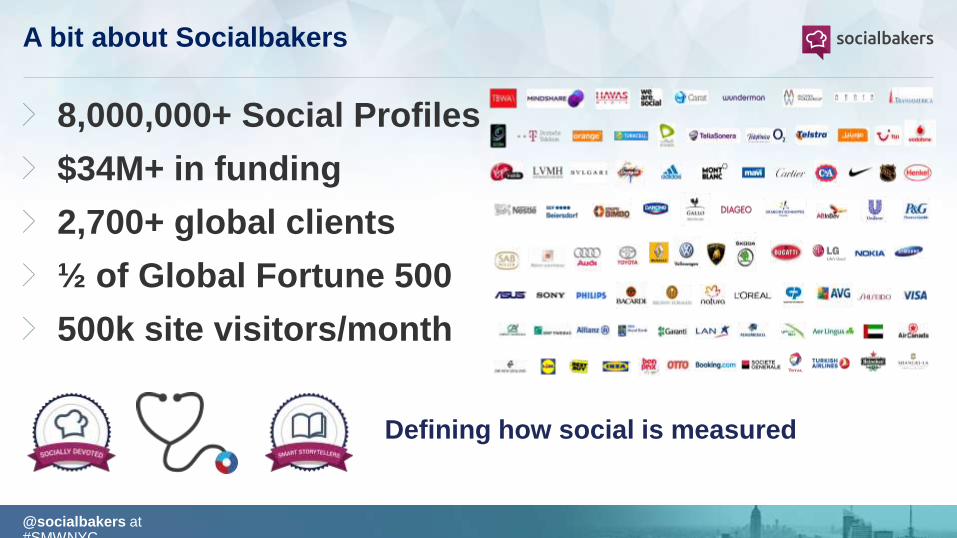
A bit about Socialbakers
Defining how social is measured
8,000,000+ Social Profiles
$34M+ in funding
2,700+ global clients
½ of Global Fortune 500
500k site visitors/month

EngageX
Jan Rezab @janrezabSocialbakers CEO

Don’t blindly publish
Interactions are king
Measure in context
Be flexible
Takeaways

0
500
1000
1500
2000
2500
0
50
100
150
200
250
300
My Typical Ending Slide For A Larger Social Network
Total Interactions (Thousands)
Total Visits (Millions)
0
30000
60000
90000
120000
150000
Interactions
Correlate with Conversions
Increased Facebook Average Quarterly
Interactions
Socially Devoted
Non-Socially Devoted
Q12014
Q22014
Q32014
Q42014
Sep
2014
Oct
2014
Nov
2014

But With Instagram Social Marketing Is For The Taking

Thank You!
@evanjames11
Evan James
Head of North American
Marketing