the science of poultry and meat...
TRANSCRIPT
Chapter 2GLOBAL PERSPECTIVE
The Science ofPoultry and Meat Processing
University of GuelphShai Barbut PhD
Chapters1. AUTOMATION2. GLOBAL PERSPECTIVE3. STRUCTURE* AND MUSCLE PHYSIOLOGY4. LIVE BIRD HANDLING*5. PRIMARY PROCESSING OF POULTRY*6. HACCP IN PRIMARY PROCESSING*7. INSPECTION AND GRADING*8. STUNNING*9. PORTIONING, DEBONING AND FRESH MEAT
COMPOSITION*10. FURTHER PROCESSING – EQUIPMENT11. HEAT PROCESSING, COOLING AND PRESERVATION
METHODS12. HACCP IN COOKED MEAT OPERATIONS13. PRINCIPLES OF MEAT PROCESSING14. BATTERING AND BREADING – PRODUCTION UNDER
HACCP15. MICROBIOLOGY AND SANITATION16. EVALUATING TEXTURE AND SENSORY ATTRIBUTES17. EVALUATING WATER/FAT BINDING AND COLOUR18. WASTE TREATMENT AND BY-PRODUCTS
* Topics focussing on poultry. Rest of the chapters are related to both red meat and poultry.
Preface The aim of The Science of Poultry and Meat Processing book is to provide students and industry personnel with a comprehensive view of the modernized primary poultry meat industry and further processing of both red meat and poultry. An emphasis is placed on basic concepts as well as recent advancements such as automation (e.g. increasing poultry line speed from 3,000 to 13,000 birds per hour over the last 40 years) and food safety (e.g. HACCP in primary and the further processing areas). The book also includes chapters explaining basic muscle biology, protein gelation, heat and mass transfer, microbiology, as well as meat colour and texture to help the reader understand the underlying scientific concepts of meat processing. The Science of Poultry and Meat Processing book is based on over two decades of university teaching experiences, and is designed to be used as a course textbook by students, as well as a resource for professionals working in the food industry. The book is available online, at no cost, to any interested learner. Using this format has also allowed me to include many colour pictures, illustrations and graphs to help the reader.
ii
The book is dedicated to my past and current students who have inspired me to learn more and conduct challenging research projects. I see this as an opportunity to give back to the field that I have received so much from as a student and as a faculty member. Looking back, I have learned a great deal from my MSc and PhD advisor, Dr. A. Maurer, who was the student of Dr. R. Baker - the father of poultry processing in North America. I would also like to thank Dr. H. Swatland with whom I worked for almost 20 years, for the many challenging scientific discussions.
Writing The Science of Poultry and Meat Processing book was a long process, which also included having all chapters peer reviewed. I appreciate the help of my colleagues, but I still take responsibility for any inaccuracy in the book. If you have comments or suggestions, I would appreciate hearing from you ([email protected]), as I am planning to revise and update a few chapters on a yearly basis.
I would like to thank the many people who have helped me during the writing process. To Deb Drake who entered all of the material for the book, to Mary Anne Smith who assisted in editing, and to ArtWorks Media for the design and desktop publishing of the book. I greatly appreciate the help of my colleagues who reviewed chapters and provided useful discussions. They include Mark B., Ori B., Sarge B., Gregoy B., Joseph C., Mike D., Hans G., Theo H., Melvin H., Myra H., Walter K., Roland K., Anneke L., Massimo M., Johan M., Erik P., Robert R., Uwe T., Rachel T., Jos V., Keith W., and Richard Z. I would also like to thank my family for their love and support during the entire process.
About the Author Shai Barbut is a professor in the Department of Food Science at the University of Guelph in Ontario, Canada. He received his MSc and PhD at the University of Wisconsin in meat science and food science. He specializes in primary and further processing of poultry and red meat. His research focuses on factors affecting the quality of meat, as well as protein gelation with an emphasis on structure / function relationships, rheological properties and food safety aspects. He has published over two hundred peer reviewed research papers and is the author of the Poultry Products Processing – An Industry Guide textbook. He is a fellow of the Institute of Food Technologists and has received awards from the Meat Science Association, Poultry Science Association, and the Canadian Institute of Food Science and Technology. He is involved in a number of government committees as well as academic and industrial research projects.
iii

iv
© 2015 Shai Barbut
This work is licensed under the Creative Commons licenses noted below. To view a copy of these detailed licenses, visit creativecommons.org. Briefly, this license allows you to download the work and share with others as long as you credit the copyright owner.
You can’t change the content in any way or use it commercially. Other than as provided by these licenses, no part of this book may be reproduced, transmitted, or displayed by any electronic or mechanical means without the prior written permission of the copyright owner, except in the case of brief quotations embodied in critical reviews and certain other non-commercial uses permitted by copyright law.
© 2015 Shai Barbut
This work is licensed under the Creative Commons licenses noted below. To view a copy of these detailed licenses, visit creativecommons.org. Briefly, this license allows you to download the work and share with others as long as you credit the copyright owner. You can’t change the content in any way or use it commercially. Other than as provided by these licenses, no part of this book may be reproduced, transmitted, or displayed by any electronic or mechanical means without the prior written permission of the copyright owner, except in the case of brief quotations embodied in critical reviews and certain other non-commercial uses permitted by copyright law.
Effective July 1, 2015, this book will be subject to a CC-BY-NC-ND license. This book contains information from authentic and highly regarded sources and a wide variety of references are listed. Reasonable efforts have been made to publish reliable data and information, but the author cannot assume responsibility for the validity of all materials or for the consequences of their use.
Library and Archives Canada Cataloguing in Publication
Barbut, Shai, author
The science of poultry and meat processing / Shai Barbut, PhD.
Includes bibliographical references and index.
Issued in print and electronic formats.
ISBN 978-0-88955-625-6 (bound).
ISBN 978-0-88955-626-3 (pdf).
1. Poultry--Processing. 2. Meat industry and trade. I. Title.
TS1968.B37 2016 664'.93
C2015-903906-1 C2015-903907-X
Effective July 1, 2015, this book will be subject to a CC-BY-NC-ND license. This book contains information from authentic and highly regarded sources and a wide variety of references are listed. Reasonable efforts have been made to publish reliable data and information, but the author cannot assume responsibility for the validity of all materials or for the consequences of their use.
Library and Archives Canada Cataloguing in Publication
Barbut, Shai, author The science of poultry and meat processing / Shai Barbut, PhD. Includes bibliographical references and index. Issued in print and electronic formats. ISBN 978-0-88955-625-6 (bound). ISBN 978-0-88955-626-3 (pdf). 1. Poultry--Processing. 2. Meat industry and trade. I. Title. TS1968.B37 2016 664’.93 C2015-903906-1 C2015-903907-X
2GLOBAL PERSPECTIVE
2.1 Introduction
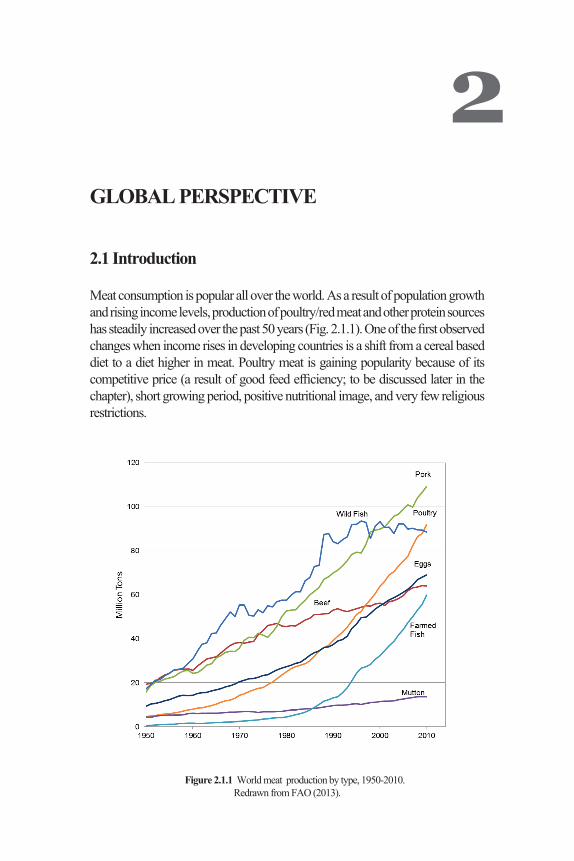
Meat consumption is popular all over the world. As a result of population growth and rising income levels, production of poultry/red meat and other protein sources has steadily increased over the past 50 years (Fig. 2.1.1). One of the first observed changes when income rises in developing countries is a shift from a cereal based diet to a diet higher in meat. Poultry meat is gaining popularity because of its competitive price (a result of good feed efficiency; to be discussed later in the chapter), short growing period, positive nutritional image, and very few religious restrictions.
16
Figure 2.1.1 World animal protein production by type, 1950-2010. Redrawn from FAO (2013).
Figure 2.1.2 Poultry meat can be prepared and presented in many shapes and forms. Showinghere BBQ chicken wings, oven roasted chicken breast filet and turkey nuggets.Photo Barbut and Jinde.
Figure 2.1.1 World meat production by type, 1950-2010.Redrawn from FAO (2013).

2-2 CHAPTER 2: GLOBAL PERSPECTIVE
Figure 2.1.1 shows the increase in consumption in all meat sources, including poultry, which has been a major contributor. It is expected that by 2020 poultry meat production will surpass production of all other meats including pork (FAO, 2013). This projection is based on the development of new mega poultry growing complexes in countries such as China, Russia, and India where population growth is expected to be highest. Currently, a substantial proportion of poultry production (Fig. 2.1.2) is done by a few large, specialized, international companies who most often use a vertical integration model (i.e., the same company owns multiple components along the supply chain such as the hatchery, feed meal, growing operation, processing plant, and distribution). This model helps to increase efficiency and maximize profit.
This chapter focuses on current and projected consumption of different meats with poultry as an example (explaining the major reasons for the tremedous increase in poultry meat production over the past few decades).
17
Figure 2.2.1 Demand in the rich world is satiated. Data from OECD-FAO (2013) plotted byAnonymous (2014).
Figure 2.1.2 Poultry meat can be prepared and presented in many shapes andforms. Showing here BBQ chicken wings, oven roasted chicken breast filet
and turkey nuggets. Photo Barbut and Jinde.
2.2 Poultry Meat Consumption
As indicated above, poultry meat is popular around the world but consumption varies by country/region (Figs 2.2.1 and 2.2.2). This is true for all meats, and in the poultry market there are major differences in consumption between countries such

2-3THE SCIENCE OF POULTRY AND MEAT PROCESSING – BARBUT
as Brazil and the USA (where 44.4 and 41.0 kg meat/capita/year are consumed, respectively) and China and India (where 11.1 and 2.0 kg meat/capita/year are consumed, respectively). Consumption differences are the result of factors such as income level, availability, tradition, and eating habits (Swatland, 2010). It is beyond the scope of this chapter to discuss these differences in detail, but the reader should be aware that factors such as tradition and religious restrictions can play an enormous role. For example, in countries like Israel and Saudi Arabia pork meat is unacceptable due to Jewish and Muslim regulations, respectively.
18
Figure 2.2.1 Demand in the rich world is satiated.Data from OECD-FAO (2013) plotted by Anonymous (2014).
19
Figure 2.2.2 Demand in the developing world is rising steeply. Data from OECD-FAO (2013)plotted by Anonymous (2014).
Figure 2.2.3 World total poultry meat production (x 1,000 metric tons of ready to cook meat). Data from OECD-FAO (2013).Figure 2.2.2 Demand in the developing world is rising steeply.
Data from OECD-FAO (2013) plotted by Anonymous (2014).

2-4 CHAPTER 2: GLOBAL PERSPECTIVE
Total global poultry meat production has increased by almost 400% over the past 50 years. Figure 2.2.3 illustrates the increase expressed as ready to cook meat (i.e., after feather removal and evisceration). It is expected that within the next 10 years it will increase by another 25% (or a 500% increase since 1960). This projection is based on the world’s population increasing by 1 billion people, especially in the developing countries (85% of the increase is expected in Asia and Africa).
20
Figure 2.3.1 Broiler growth rate – days to get to 2.27 kg (5.0 lb) during different months of theyear (January to December) in the US. From Donohue (2014).
Figure 2.3.2 Cross section of a broiler carcass showing the breast area and proportion in a 1970and a 2008 broiler.
Figure 2.2.3 World total poultry meat production (million metric tons of ready tocook meat). Data from OECD-FAO (2013).
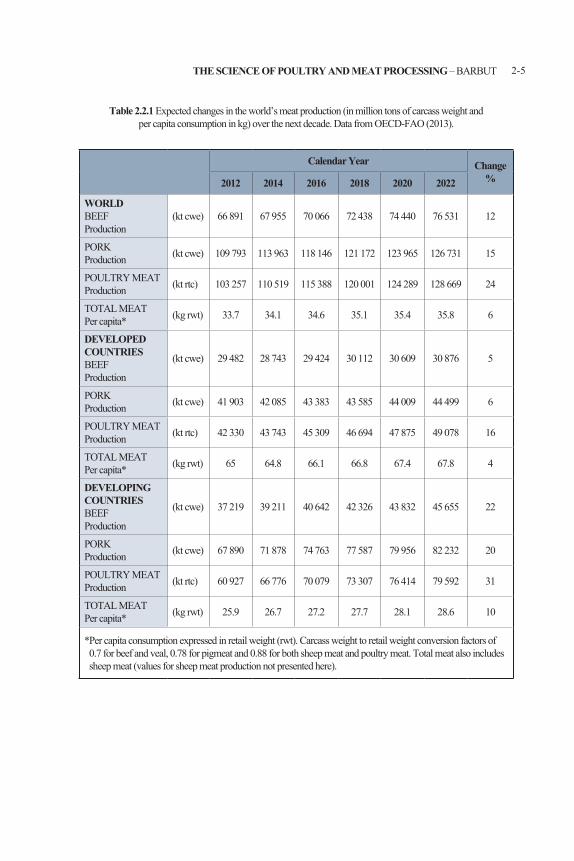
Table 2.2.1 first shows the expected increases in meat consumption around the world, and then breaks down the information by developed and developing countries. Overall meat production (beef, pork, poultry, lamb/mutton) is expected to grow from 295 to 350 million tons within the next decade (18%), but the relative proportion of poultry meat will be much higher than beef and pork (24% versus 12% and 15%, respectively). It is clear that most of the expected growth in meat consumption will occur in developing countries; expected increases of 31% in poultry, 22% in beef and 20% in pork. This is large compared to the expected increases in the developed countries; 16%, 5% and 6%, respectively. The growth reflects both the expected increase in per capita consumption and the rise in income. In developed countries consumers have enough income to purchase all/most of the meat that they would like to consume. By 2020, per capita poultry and red meat consumption in developing countries is still expected to be lower than in developed countries but the balance is changing every year.
2-5THE SCIENCE OF POULTRY AND MEAT PROCESSING – BARBUT
Table 2.2.1 Expected changes in the world’s meat production (in million tons of carcass weight andper capita consumption in kg) over the next decade. Data from OECD-FAO (2013).
Calendar Year Change%2012 2014 2016 2018 2020 2022
WORLDBEEFProduction
(kt cwe) 66 891 67 955 70 066 72 438 74 440 76 531 12
PORK Production (kt cwe) 109 793 113 963 118 146 121 172 123 965 126 731 15
POULTRY MEATProduction (kt rtc) 103 257 110 519 115 388 120 001 124 289 128 669 24
TOTAL MEATPer capita* (kg rwt) 33.7 34.1 34.6 35.1 35.4 35.8 6
DEVELOPEDCOUNTRIESBEEFProduction
(kt cwe) 29 482 28 743 29 424 30 112 30 609 30 876 5
PORKProduction (kt cwe) 41 903 42 085 43 383 43 585 44 009 44 499 6
POULTRY MEATProduction (kt rtc) 42 330 43 743 45 309 46 694 47 875 49 078 16
TOTAL MEATPer capita* (kg rwt) 65 64.8 66.1 66.8 67.4 67.8 4
DEVELOPINGCOUNTRIESBEEFProduction
(kt cwe) 37 219 39 211 40 642 42 326 43 832 45 655 22
PORKProduction (kt cwe) 67 890 71 878 74 763 77 587 79 956 82 232 20
POULTRY MEATProduction (kt rtc) 60 927 66 776 70 079 73 307 76 414 79 592 31
TOTAL MEATPer capita* (kg rwt) 25.9 26.7 27.2 27.7 28.1 28.6 10
* Per capita consumption expressed in retail weight (rwt). Carcass weight to retail weight conversion factors of 0.7 for beef and veal, 0.78 for pigmeat and 0.88 for both sheep meat and poultry meat. Total meat also includes sheep meat (values for sheep meat production not presented here).
2-6 CHAPTER 2: GLOBAL PERSPECTIVE
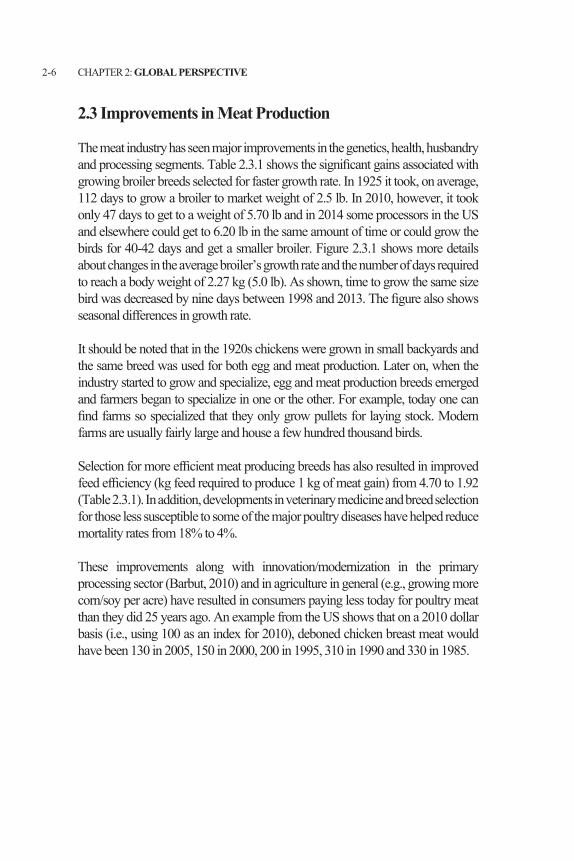
2.3 Improvements in Meat Production
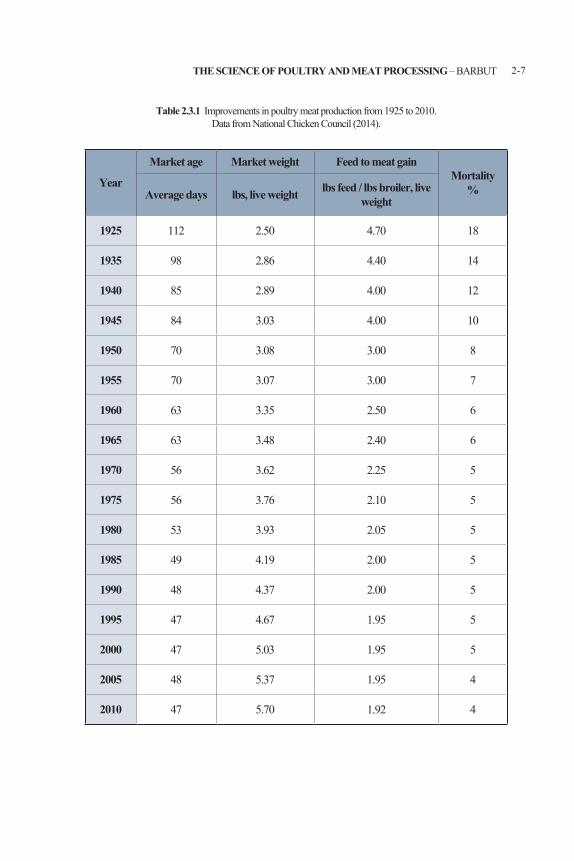
The meat industry has seen major improvements in the genetics, health, husbandry and processing segments. Table 2.3.1 shows the significant gains associated with growing broiler breeds selected for faster growth rate. In 1925 it took, on average, 112 days to grow a broiler to market weight of 2.5 lb. In 2010, however, it took only 47 days to get to a weight of 5.70 lb and in 2014 some processors in the US and elsewhere could get to 6.20 lb in the same amount of time or could grow the birds for 40-42 days and get a smaller broiler. Figure 2.3.1 shows more details about changes in the average broiler’s growth rate and the number of days required to reach a body weight of 2.27 kg (5.0 lb). As shown, time to grow the same size bird was decreased by nine days between 1998 and 2013. The figure also shows seasonal differences in growth rate.
It should be noted that in the 1920s chickens were grown in small backyards and the same breed was used for both egg and meat production. Later on, when the industry started to grow and specialize, egg and meat production breeds emerged and farmers began to specialize in one or the other. For example, today one can find farms so specialized that they only grow pullets for laying stock. Modern farms are usually fairly large and house a few hundred thousand birds.
Selection for more efficient meat producing breeds has also resulted in improved feed efficiency (kg feed required to produce 1 kg of meat gain) from 4.70 to 1.92 (Table 2.3.1). In addition, developments in veterinary medicine and breed selection for those less susceptible to some of the major poultry diseases have helped reduce mortality rates from 18% to 4%.
These improvements along with innovation/modernization in the primary processing sector (Barbut, 2010) and in agriculture in general (e.g., growing more corn/soy per acre) have resulted in consumers paying less today for poultry meat than they did 25 years ago. An example from the US shows that on a 2010 dollar basis (i.e., using 100 as an index for 2010), deboned chicken breast meat would have been 130 in 2005, 150 in 2000, 200 in 1995, 310 in 1990 and 330 in 1985.
2-7THE SCIENCE OF POULTRY AND MEAT PROCESSING – BARBUT
Table 2.3.1 Improvements in poultry meat production from 1925 to 2010.Data from National Chicken Council (2014).
Year
Market age Market weight Feed to meat gainMortality
%Average days lbs, live weight lbs feed / lbs broiler, live weight
1925 112 2.50 4.70 18
1935 98 2.86 4.40 14
1940 85 2.89 4.00 12
1945 84 3.03 4.00 10
1950 70 3.08 3.00 8
1955 70 3.07 3.00 7
1960 63 3.35 2.50 6
1965 63 3.48 2.40 6
1970 56 3.62 2.25 5
1975 56 3.76 2.10 5
1980 53 3.93 2.05 5
1985 49 4.19 2.00 5
1990 48 4.37 2.00 5
1995 47 4.67 1.95 5
2000 47 5.03 1.95 5
2005 48 5.37 1.95 4
2010 47 5.70 1.92 4

2-8 CHAPTER 2: GLOBAL PERSPECTIVE
20
Figure 2.3.1 Broiler growth rate – days to get to 2.27 kg (5.0 lb) during different months of the
year (January to December) in the US. From Donohue (2014).
Figure 2.3.2 Cross section of a broiler carcass showing the breast area and proportion in a 1970
and a 2008 broiler.
Figure 2.3.1 Broiler growth rate – days to get to 2.27 kg (5.0 lb) during differentmonths of the year (January to December) in the US. From Donohue (2014).
Figure 2.3.2 illustrates the conformational changes of a broiler carcass raised in 1970 and in 2008. As can be seen in Table 2.3.1, average body weight increased from 3.6 to 5.7 lb (i.e., about 50%), but it should be noted that the proportion of breast meat has also increased. The data shown in Figure 2.3.3 illustrate the increase in percent yield of broiler meat in the US from 1997 to 2013. Table 2.3.2 shows other parameters that demonstrate the continuous work of breeders, farmers, nutritionists, veterinarians, and meat processors in improving yield.
21
Figure 2.3.3 Percent yield of broiler meat as a portion of carcass weight without giblets (WOG)
in the US from 1997 to 2013. Data from Donohue (2014).
Figure 2.4.1 Changes in marketing whole broilers, cut up parts, and further processed products
in the USA from 1962 to 2012. Data from National Chicken Council (2014).
Figure 2.3.2 Cross section of a broiler carcass showing the breast area andits proportion in a 1970 and a 2008 broiler. Source unknown.

2-9THE SCIENCE OF POULTRY AND MEAT PROCESSING – BARBUT
21
Figure 2.3.3 Percent yield of broiler meat as a portion of carcass weight without giblets (WOG)
in the US from 1997 to 2013. Data from Donohue (2014).
Figure 2.4.1 Changes in marketing whole broilers, cut up parts, and further processed products
in the USA from 1962 to 2012. Data from National Chicken Council (2014).
Figure 2.3.3 Percent yield of broiler meat as a portion of carcass weight withoutgiblets (WOG) in the US from 1997 to 2013. Data from Donohue (2014).
Table 2.3.2 Changes in relative percentage of various portions of broilers in US.Data from Donohue (2014).
1995 2005 2013
Live weight (lb) 4.8 5.8 6.0
Front half (live) 35.0 40.0 43.5
Front half(without giblet) 51.5 55.0 57.0
White meat 15.0 20.0 23.0
Wings 7.5 7.5 8.0
Leg Quarter 13.0 12.5 13.0
2-10 CHAPTER 2: GLOBAL PERSPECTIVE
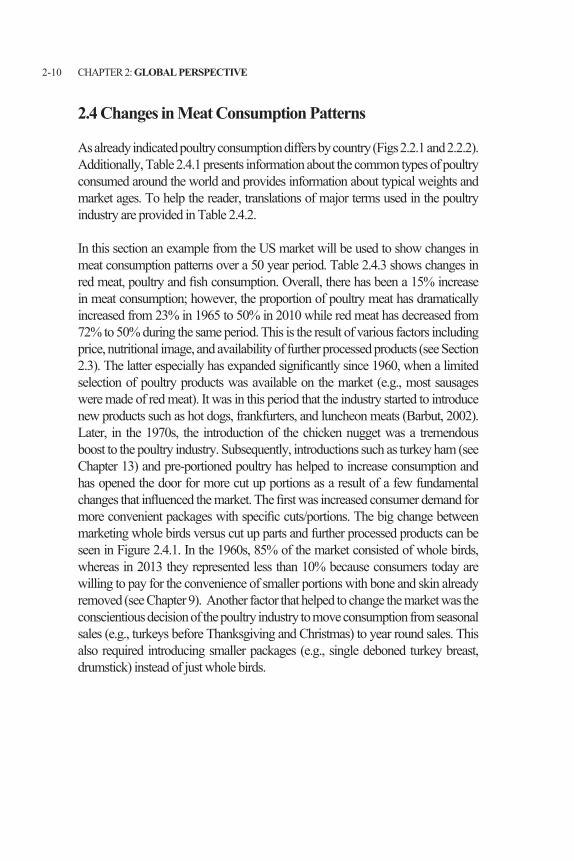
2.4 Changes in Meat Consumption Patterns
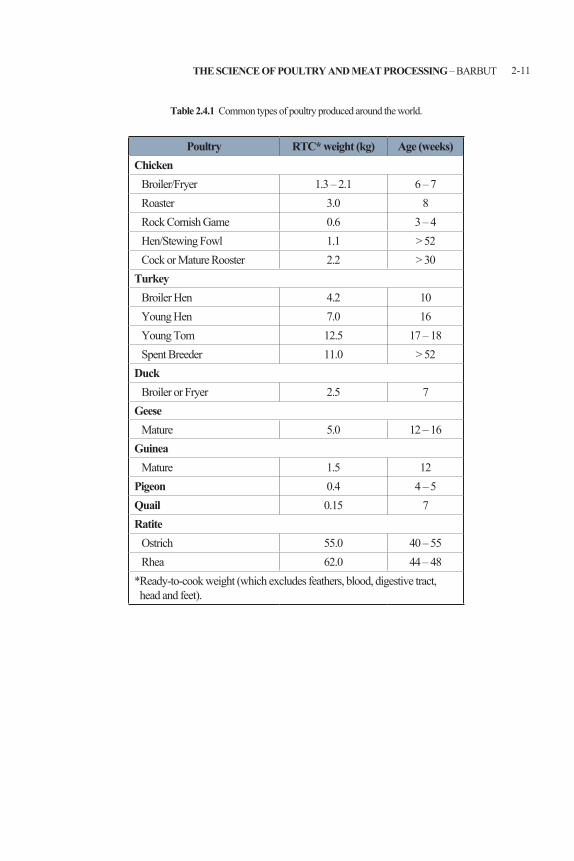
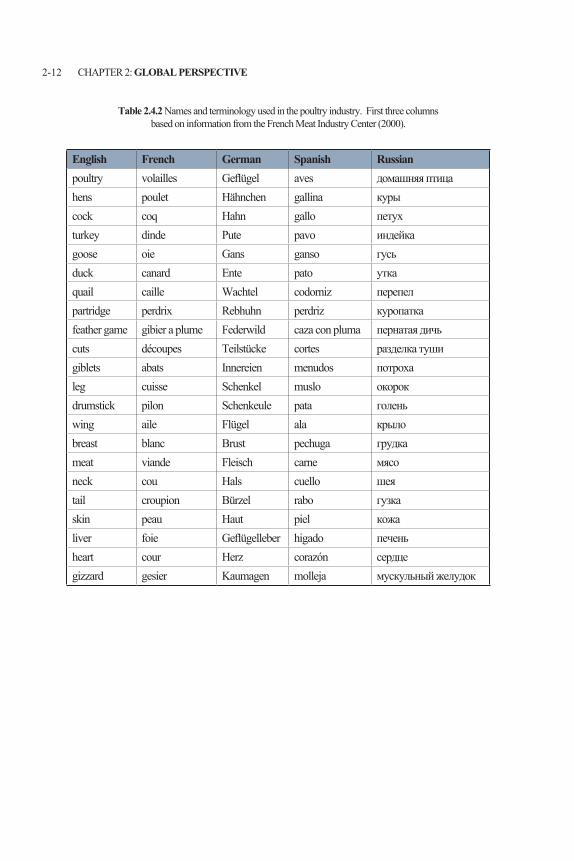
As already indicated poultry consumption differs by country (Figs 2.2.1 and 2.2.2). Additionally, Table 2.4.1 presents information about the common types of poultry consumed around the world and provides information about typical weights and market ages. To help the reader, translations of major terms used in the poultry industry are provided in Table 2.4.2.
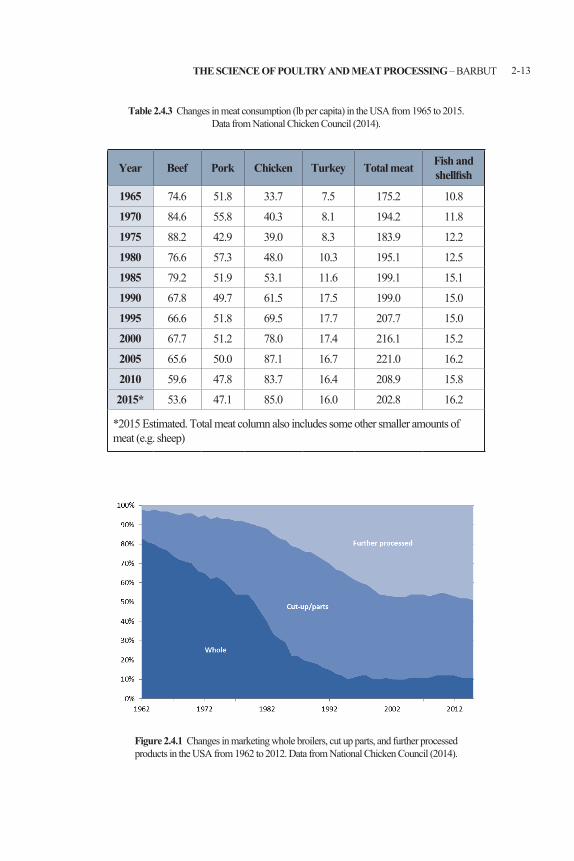
In this section an example from the US market will be used to show changes in meat consumption patterns over a 50 year period. Table 2.4.3 shows changes in red meat, poultry and fish consumption. Overall, there has been a 15% increase in meat consumption; however, the proportion of poultry meat has dramatically increased from 23% in 1965 to 50% in 2010 while red meat has decreased from 72% to 50% during the same period. This is the result of various factors including price, nutritional image, and availability of further processed products (see Section 2.3). The latter especially has expanded significantly since 1960, when a limited selection of poultry products was available on the market (e.g., most sausages were made of red meat). It was in this period that the industry started to introduce new products such as hot dogs, frankfurters, and luncheon meats (Barbut, 2002). Later, in the 1970s, the introduction of the chicken nugget was a tremendous boost to the poultry industry. Subsequently, introductions such as turkey ham (see Chapter 13) and pre-portioned poultry has helped to increase consumption and has opened the door for more cut up portions as a result of a few fundamental changes that influenced the market. The first was increased consumer demand for more convenient packages with specific cuts/portions. The big change between marketing whole birds versus cut up parts and further processed products can be seen in Figure 2.4.1. In the 1960s, 85% of the market consisted of whole birds, whereas in 2013 they represented less than 10% because consumers today are willing to pay for the convenience of smaller portions with bone and skin already removed (see Chapter 9). Another factor that helped to change the market was the conscientious decision of the poultry industry to move consumption from seasonal sales (e.g., turkeys before Thanksgiving and Christmas) to year round sales. This also required introducing smaller packages (e.g., single deboned turkey breast, drumstick) instead of just whole birds.
2-11THE SCIENCE OF POULTRY AND MEAT PROCESSING – BARBUT
Table 2.4.1 Common types of poultry produced around the world.
Poultry RTC* weight (kg) Age (weeks)Chicken Broiler/Fryer 1.3 – 2.1 6 – 7 Roaster 3.0 8 Rock Cornish Game 0.6 3 – 4 Hen/Stewing Fowl 1.1 > 52 Cock or Mature Rooster 2.2 > 30Turkey Broiler Hen 4.2 10 Young Hen 7.0 16 Young Tom 12.5 17 – 18 Spent Breeder 11.0 > 52Duck Broiler or Fryer 2.5 7Geese Mature 5.0 12 – 16Guinea Mature 1.5 12Pigeon 0.4 4 – 5Quail 0.15 7Ratite Ostrich 55.0 40 – 55 Rhea 62.0 44 – 48* Ready-to-cook weight (which excludes feathers, blood, digestive tract, head and feet).
2-12 CHAPTER 2: GLOBAL PERSPECTIVE
Table 2.4.2 Names and terminology used in the poultry industry. First three columnsbased on information from the French Meat Industry Center (2000).
English French German Spanish Russianpoultry volailles Geflügel aves домашняя птицаhens poulet Hähnchen gallina курыcock coq Hahn gallo петухturkey dinde Pute pavo индейкаgoose oie Gans ganso гусьduck canard Ente pato уткаquail caille Wachtel codorniz перепелpartridge perdrix Rebhuhn perdriz куропаткаfeather game gibier a plume Federwild caza con pluma пернатая дичьcuts découpes Teilstücke cortes разделка тушиgiblets abats Innereien menudos потрохаleg cuisse Schenkel muslo окорокdrumstick pilon Schenkeule pata голеньwing aile Flügel ala крылоbreast blanc Brust pechuga грудкаmeat viande Fleisch carne мясоneck cou Hals cuello шеяtail croupion Bürzel rabo гузкаskin peau Haut piel кожаliver foie Geflügelleber higado печеньheart cour Herz corazón сердцеgizzard gesier Kaumagen molleja мускульный желудок
2-13THE SCIENCE OF POULTRY AND MEAT PROCESSING – BARBUT
Table 2.4.3 Changes in meat consumption (lb per capita) in the USA from 1965 to 2015.Data from National Chicken Council (2014).
Year Beef Pork Chicken Turkey Total meat Fish andshellfish
1965 74.6 51.8 33.7 7.5 175.2 10.8
1970 84.6 55.8 40.3 8.1 194.2 11.8
1975 88.2 42.9 39.0 8.3 183.9 12.2
1980 76.6 57.3 48.0 10.3 195.1 12.5
1985 79.2 51.9 53.1 11.6 199.1 15.1
1990 67.8 49.7 61.5 17.5 199.0 15.0
1995 66.6 51.8 69.5 17.7 207.7 15.0
2000 67.7 51.2 78.0 17.4 216.1 15.2
2005 65.6 50.0 87.1 16.7 221.0 16.2
2010 59.6 47.8 83.7 16.4 208.9 15.8
2015* 53.6 47.1 85.0 16.0 202.8 16.2
*2015 Estimated. Total meat column also includes some other smaller amounts of meat (e.g. sheep)
22
Figure 2.4.1 Changes in marketing whole broilers, cut up parts, and further processedproducts in the USA from 1962 to 2012. Data from National Chicken Council (2014).
2-14 CHAPTER 2: GLOBAL PERSPECTIVE
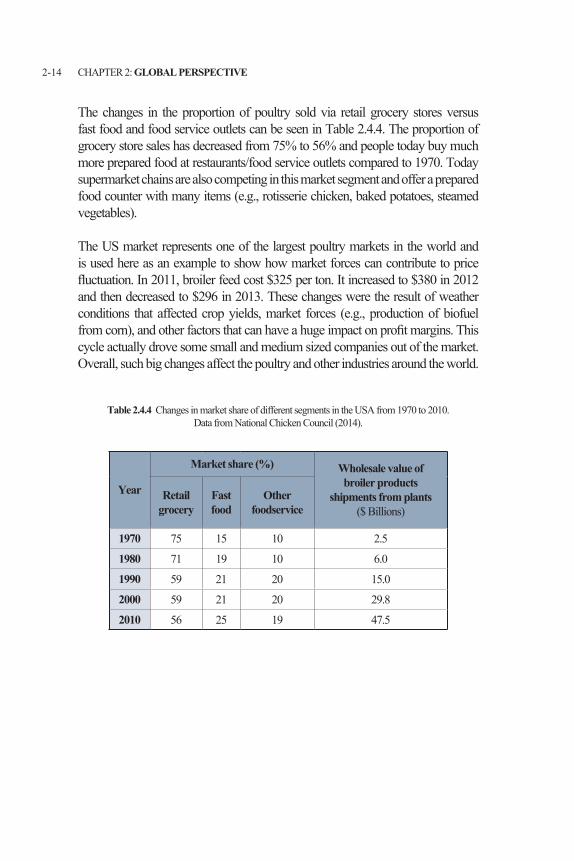
The changes in the proportion of poultry sold via retail grocery stores versus fast food and food service outlets can be seen in Table 2.4.4. The proportion of grocery store sales has decreased from 75% to 56% and people today buy much more prepared food at restaurants/food service outlets compared to 1970. Today supermarket chains are also competing in this market segment and offer a prepared food counter with many items (e.g., rotisserie chicken, baked potatoes, steamed vegetables).
The US market represents one of the largest poultry markets in the world and is used here as an example to show how market forces can contribute to price fluctuation. In 2011, broiler feed cost $325 per ton. It increased to $380 in 2012 and then decreased to $296 in 2013. These changes were the result of weather conditions that affected crop yields, market forces (e.g., production of biofuel from corn), and other factors that can have a huge impact on profit margins. This cycle actually drove some small and medium sized companies out of the market. Overall, such big changes affect the poultry and other industries around the world.
Table 2.4.4 Changes in market share of different segments in the USA from 1970 to 2010. Data from National Chicken Council (2014).
Year
Market share (%) Wholesale value of broiler products
shipments from plants($ Billions)
Retailgrocery
Fast food
Otherfoodservice
1970 75 15 10 2.5
1980 71 19 10 6.0
1990 59 21 20 15.0
2000 59 21 20 29.8
2010 56 25 19 47.5
2-15THE SCIENCE OF POULTRY AND MEAT PROCESSING – BARBUT
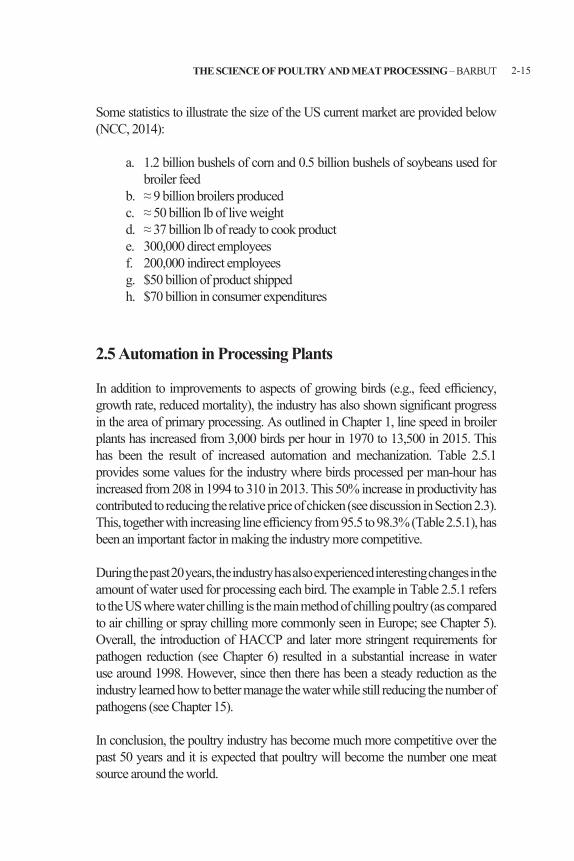
Some statistics to illustrate the size of the US current market are provided below (NCC, 2014):
a. 1.2 billion bushels of corn and 0.5 billion bushels of soybeans used for broiler feed
b. ≈ 9 billion broilers producedc. ≈ 50 billion lb of live weightd. ≈ 37 billion lb of ready to cook producte. 300,000 direct employeesf. 200,000 indirect employeesg. $50 billion of product shippedh. $70 billion in consumer expenditures
2.5 Automation in Processing Plants
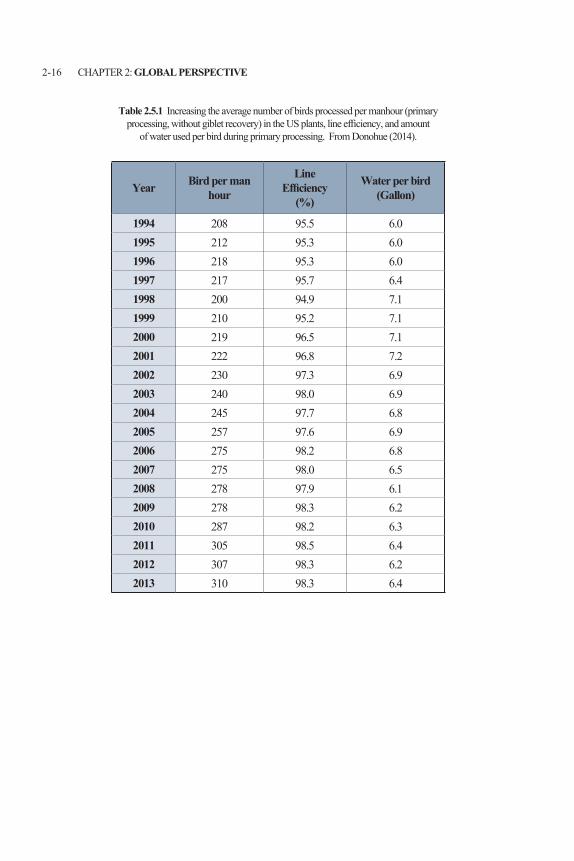
In addition to improvements to aspects of growing birds (e.g., feed efficiency, growth rate, reduced mortality), the industry has also shown significant progress in the area of primary processing. As outlined in Chapter 1, line speed in broiler plants has increased from 3,000 birds per hour in 1970 to 13,500 in 2015. This has been the result of increased automation and mechanization. Table 2.5.1 provides some values for the industry where birds processed per man-hour has increased from 208 in 1994 to 310 in 2013. This 50% increase in productivity has contributed to reducing the relative price of chicken (see discussion in Section 2.3). This, together with increasing line efficiency from 95.5 to 98.3% (Table 2.5.1), has been an important factor in making the industry more competitive.
During the past 20 years, the industry has also experienced interesting changes in the amount of water used for processing each bird. The example in Table 2.5.1 refers to the US where water chilling is the main method of chilling poultry (as compared to air chilling or spray chilling more commonly seen in Europe; see Chapter 5). Overall, the introduction of HACCP and later more stringent requirements for pathogen reduction (see Chapter 6) resulted in a substantial increase in water use around 1998. However, since then there has been a steady reduction as the industry learned how to better manage the water while still reducing the number of pathogens (see Chapter 15).
In conclusion, the poultry industry has become much more competitive over the past 50 years and it is expected that poultry will become the number one meat source around the world.
2-16 CHAPTER 2: GLOBAL PERSPECTIVE
Table 2.5.1 Increasing the average number of birds processed per manhour (primaryprocessing, without giblet recovery) in the US plants, line efficiency, and amount
of water used per bird during primary processing. From Donohue (2014).
Year Bird per manhour
LineEfficiency
(%)
Water per bird(Gallon)
1994 208 95.5 6.01995 212 95.3 6.01996 218 95.3 6.01997 217 95.7 6.41998 200 94.9 7.11999 210 95.2 7.12000 219 96.5 7.12001 222 96.8 7.22002 230 97.3 6.92003 240 98.0 6.92004 245 97.7 6.82005 257 97.6 6.92006 275 98.2 6.82007 275 98.0 6.52008 278 97.9 6.12009 278 98.3 6.22010 287 98.2 6.32011 305 98.5 6.42012 307 98.3 6.22013 310 98.3 6.4
2-17THE SCIENCE OF POULTRY AND MEAT PROCESSING – BARBUT
References
Anonymous. 2014. Meat. Wikipedia. Accessed March 2015.
Barbu t, S. 2010. Past and future of poultry meat harvesting technologies. World’s Poult. Sci. J. 66:399.
Barbu t, S. 2002. Poultry Meat Processing. CRC Press. New York, NY.
Donoh ue, M. 2014. Performance trends for the poultry & egg industry. Presentation at the International Production and Processing Expo. Atlanta, GA. Jan 29, 2014.
FAO. 2013. World Agriculture: Towards 2015/2030 - An FAO perspective. http://www.oecd.org/site/oecd-faoagriculturaloutlook/highlights-2013-EN.pdf
Frenc h Meat Industry Center. 2000. Le site de référence de la filiére des viandes français. MHR-viandes, France.
NCC. 2014. About the Industry – Statistics – Per Capita Consumption of Poultry & Livestock. National Chicken Council. Washington, D.C. http://www.nationalchickencouncil.org/ Accessed March 2014.
OECD- FAO. 2013. Agricultural Outlook 2013-2022: Highlights. http://stats.oecd.org/Index.aspx?DataSetCode=HIGH_AGLINK_2013. Accessed February 2015.
Swatl and, H. 2010. Meat products and consumption culture in the West. Meat Sci. 86(1):80.