the second phase construction of kansai international …
TRANSCRIPT
805
i) Kansai International Airport Land Development Co., Ltd., Osaka, Japan.The manuscript for this paper was received for review on May 19, 2010; approved on October 12, 2010.
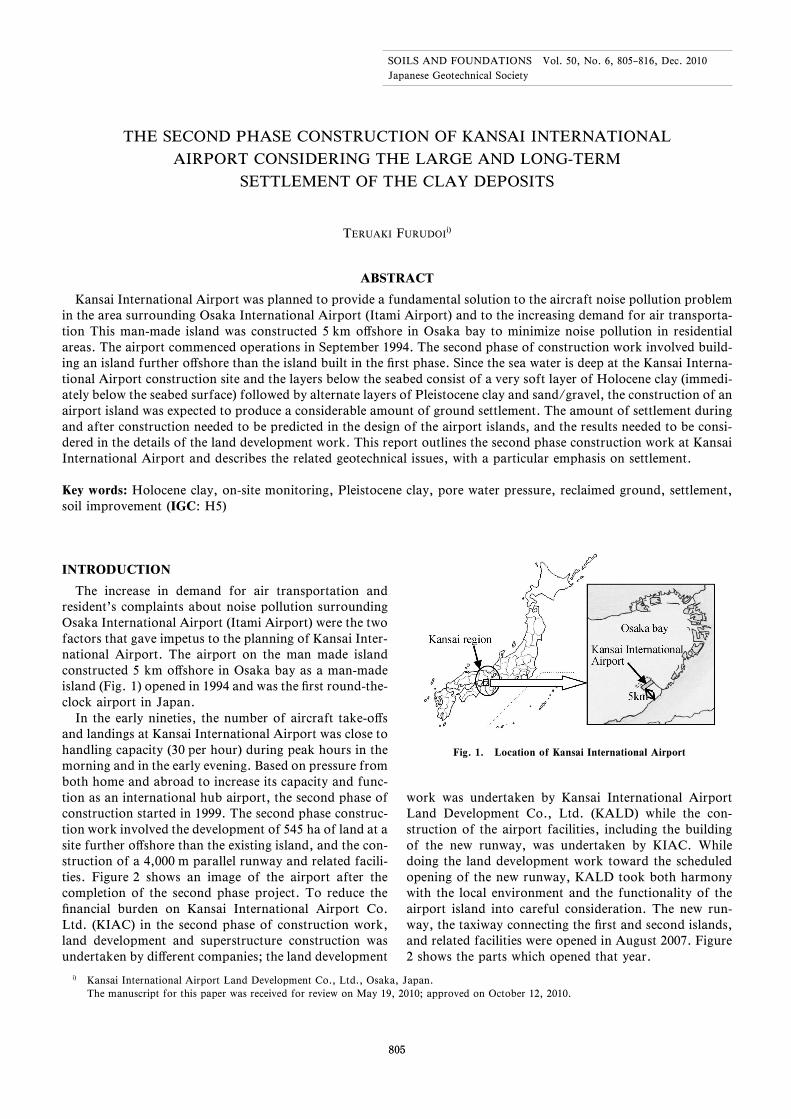
Fig. 1. Location of Kansai International Airport
805
SOILS AND FOUNDATIONS Vol. 50, No. 6, 805–816, Dec. 2010Japanese Geotechnical Society
THE SECOND PHASE CONSTRUCTION OF KANSAI INTERNATIONALAIRPORT CONSIDERING THE LARGE AND LONG-TERM
SETTLEMENT OF THE CLAY DEPOSITS
TERUAKI FURUDOIi)
ABSTRACT
Kansai International Airport was planned to provide a fundamental solution to the aircraft noise pollution problemin the area surrounding Osaka International Airport (Itami Airport) and to the increasing demand for air transporta-tion This man-made island was constructed 5 km oŠshore in Osaka bay to minimize noise pollution in residentialareas. The airport commenced operations in September 1994. The second phase of construction work involved build-ing an island further oŠshore than the island built in the ˆrst phase. Since the sea water is deep at the Kansai Interna-tional Airport construction site and the layers below the seabed consist of a very soft layer of Holocene clay (immedi-ately below the seabed surface) followed by alternate layers of Pleistocene clay and sand/gravel, the construction of anairport island was expected to produce a considerable amount of ground settlement. The amount of settlement duringand after construction needed to be predicted in the design of the airport islands, and the results needed to be consi-dered in the details of the land development work. This report outlines the second phase construction work at KansaiInternational Airport and describes the related geotechnical issues, with a particular emphasis on settlement.
Key words: Holocene clay, on-site monitoring, Pleistocene clay, pore water pressure, reclaimed ground, settlement,soil improvement (IGC: H5)
INTRODUCTION
The increase in demand for air transportation andresident's complaints about noise pollution surroundingOsaka International Airport (Itami Airport) were the twofactors that gave impetus to the planning of Kansai Inter-national Airport. The airport on the man made islandconstructed 5 km oŠshore in Osaka bay as a man-madeisland (Fig. 1) opened in 1994 and was the ˆrst round-the-clock airport in Japan.
In the early nineties, the number of aircraft take-oŠsand landings at Kansai International Airport was close tohandling capacity (30 per hour) during peak hours in themorning and in the early evening. Based on pressure fromboth home and abroad to increase its capacity and func-tion as an international hub airport, the second phase ofconstruction started in 1999. The second phase construc-tion work involved the development of 545 ha of land at asite further oŠshore than the existing island, and the con-struction of a 4,000 m parallel runway and related facili-ties. Figure 2 shows an image of the airport after thecompletion of the second phase project. To reduce theˆnancial burden on Kansai International Airport Co.Ltd. (KIAC) in the second phase of construction work,land development and superstructure construction wasundertaken by diŠerent companies; the land development
work was undertaken by Kansai International AirportLand Development Co., Ltd. (KALD) while the con-struction of the airport facilities, including the buildingof the new runway, was undertaken by KIAC. Whiledoing the land development work toward the scheduledopening of the new runway, KALD took both harmonywith the local environment and the functionality of theairport island into careful consideration. The new run-way, the taxiway connecting the ˆrst and second islands,and related facilities were opened in August 2007. Figure2 shows the parts which opened that year.

806
Fig. 2. Image of Kansai International Airport after completion of the second phase project
Fig. 3. General overview of seabed under airport islands
806 FURUDOI
THE SECOND PHASE PROJECT OF KANSAIINTERNATIONAL AIRPORT
Geotechnical ConditionsThe water depth at the construction site ranges from 18
m to 20 m. Figure 3 outlines the layers below the seabedof the construction site. The layers are formed in a similarmanner throughout the site, with a monocline structuregentle inclining downward from the land side to theoŠshore side. The order and thickness of the layers arequite uniform along a line parallel to the shoreline. Im-mediately below the seabed, there is a soft layer of Holo-cene clay between 20 m and 25 m in thickness. The Holo-cene clay is mostly in normally consolidated conditionwith a natural water content (wn) of 80z to 120z andunconˆned compressive strength (qu) of 4z (kPa), where zrepresents the depth from the seabed in meters. Immedi-ately below this Holocene clay layer, there are alternate
layers of Pleistocene clay, with an OCR of around 1.3,and sand/gravel.
Overview of the Second Phase ProjectIn the ˆrst phase of the project involved the reclama-
tion of about 510 ha to construct the ˆrst airport island,complete with one 3,500 m runway, takeoŠ/landing facil-ities and terminal facilities. This ˆrst island was sur-rounded by an 11-km long seawall. About 180 million m3
of soil was required for the construction of this island.The completion of large-scale reclamation work in deepwaters and subsequent construction work of airport facil-ities within a little more than seven years was an ex-tremely challenging and unprecedented task. It was possi-ble thanks to various operational improvements and alsoinnovations in marine technology.
The second phase construction was begun in July 1999to complement the operation of the Kansai InternationalAirport by adding an additional 4000 m runway andapron. This second phase project involved the construc-tion of a larger man-made island of 545 ha oŠ the existingairport island. Since the compressible clay layers werethicker at the second phase construction site than at theˆrst one, the new second island was expected to settlemore than the ˆrst island; the total amount of settlementof the second island was predicted to be about 18 m. Fur-thermore, deeper water and larger anticipated settlementrequired a thicker layer of reclamation soil. The averagethickness of the reclamation layer amounted to morethan 40 m and around 250 million m3 of soil was re-quired. Because of the deeper water and larger settle-ment, the second phase project was conducted undertougher conditions than those encountered in the ˆrstphase. Table 1 compares the ˆrst and second phase con-struction projects in terms of scale and natural condi-
807
Table 1. Comparison of scale and natural conditions between the ˆrstand the second phase construction
Natural conditions Scale
Waterdepth
Thickness ofcompressible
clay
Reclamation SeawalllengthArea Volume
1st phase 18 m 150–200 m 510 ha 180 Mm3 11 km
2nd phase 20 m 250–300 m 545 ha 250 Mm3 13 km
(M: million)
Fig. 4. Construction schedule of the second phase airport develop-ment
Fig. 5. Procedure of second phase construction
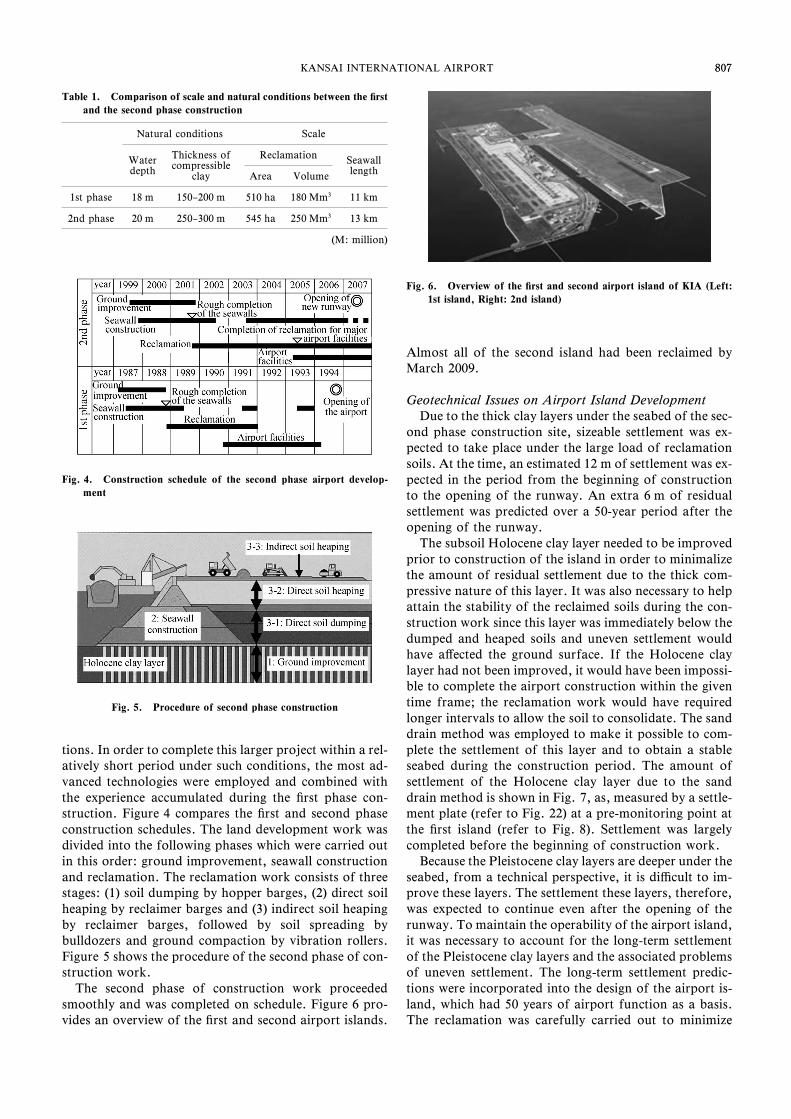
Fig. 6. Overview of the ˆrst and second airport island of KIA (Left:1st island, Right: 2nd island)
807KANSAI INTERNATIONAL AIRPORT
tions. In order to complete this larger project within a rel-atively short period under such conditions, the most ad-vanced technologies were employed and combined withthe experience accumulated during the ˆrst phase con-struction. Figure 4 compares the ˆrst and second phaseconstruction schedules. The land development work wasdivided into the following phases which were carried outin this order: ground improvement, seawall constructionand reclamation. The reclamation work consists of threestages: (1) soil dumping by hopper barges, (2) direct soilheaping by reclaimer barges and (3) indirect soil heapingby reclaimer barges, followed by soil spreading bybulldozers and ground compaction by vibration rollers.Figure 5 shows the procedure of the second phase of con-struction work.
The second phase of construction work proceededsmoothly and was completed on schedule. Figure 6 pro-vides an overview of the ˆrst and second airport islands.
Almost all of the second island had been reclaimed byMarch 2009.
Geotechnical Issues on Airport Island DevelopmentDue to the thick clay layers under the seabed of the sec-
ond phase construction site, sizeable settlement was ex-pected to take place under the large load of reclamationsoils. At the time, an estimated 12 m of settlement was ex-pected in the period from the beginning of constructionto the opening of the runway. An extra 6 m of residualsettlement was predicted over a 50-year period after theopening of the runway.
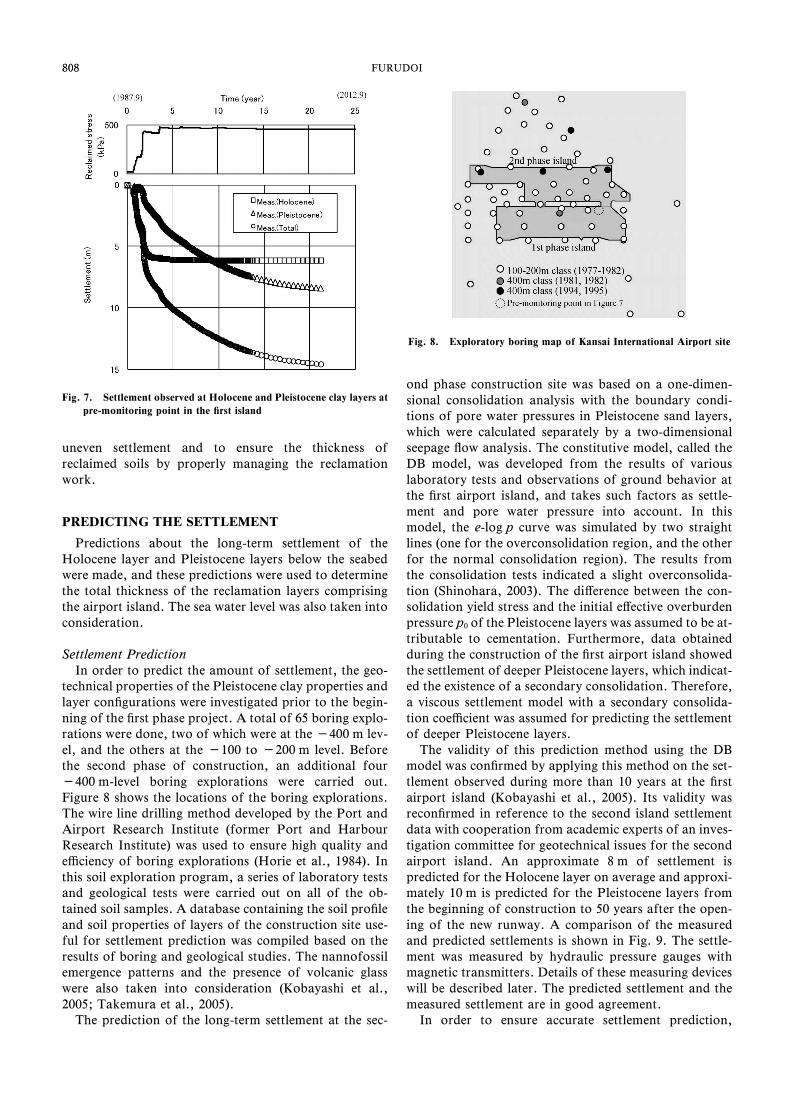
The subsoil Holocene clay layer needed to be improvedprior to construction of the island in order to minimalizethe amount of residual settlement due to the thick com-pressive nature of this layer. It was also necessary to helpattain the stability of the reclaimed soils during the con-struction work since this layer was immediately below thedumped and heaped soils and uneven settlement wouldhave aŠected the ground surface. If the Holocene claylayer had not been improved, it would have been impossi-ble to complete the airport construction within the giventime frame; the reclamation work would have requiredlonger intervals to allow the soil to consolidate. The sanddrain method was employed to make it possible to com-plete the settlement of this layer and to obtain a stableseabed during the construction period. The amount ofsettlement of the Holocene clay layer due to the sanddrain method is shown in Fig. 7, as, measured by a settle-ment plate (refer to Fig. 22) at a pre-monitoring point atthe ˆrst island (refer to Fig. 8). Settlement was largelycompleted before the beginning of construction work.
Because the Pleistocene clay layers are deeper under theseabed, from a technical perspective, it is di‹cult to im-prove these layers. The settlement these layers, therefore,was expected to continue even after the opening of therunway. To maintain the operability of the airport island,it was necessary to account for the long-term settlementof the Pleistocene clay layers and the associated problemsof uneven settlement. The long-term settlement predic-tions were incorporated into the design of the airport is-land, which had 50 years of airport function as a basis.The reclamation was carefully carried out to minimize
808
Fig. 7. Settlement observed at Holocene and Pleistocene clay layers atpre-monitoring point in the ˆrst island
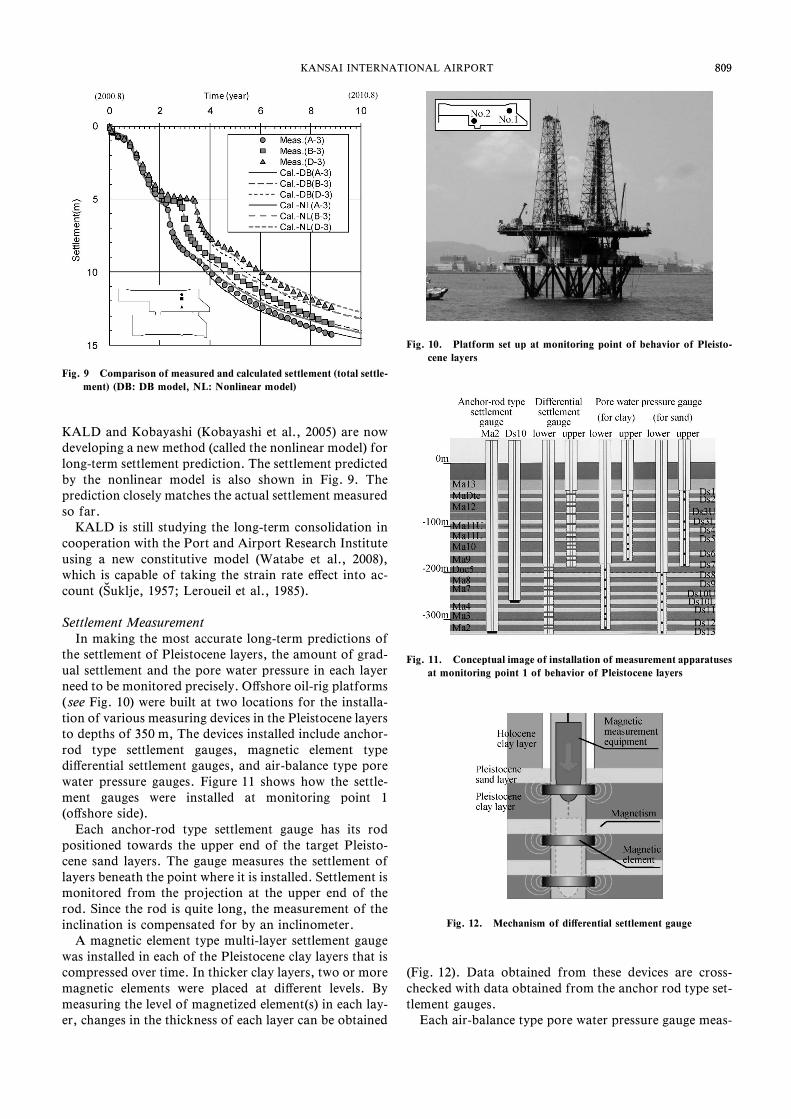
Fig. 8. Exploratory boring map of Kansai International Airport site
808 FURUDOI
uneven settlement and to ensure the thickness ofreclaimed soils by properly managing the reclamationwork.
PREDICTING THE SETTLEMENT
Predictions about the long-term settlement of theHolocene layer and Pleistocene layers below the seabedwere made, and these predictions were used to determinethe total thickness of the reclamation layers comprisingthe airport island. The sea water level was also taken intoconsideration.
Settlement PredictionIn order to predict the amount of settlement, the geo-
technical properties of the Pleistocene clay properties andlayer conˆgurations were investigated prior to the begin-ning of the ˆrst phase project. A total of 65 boring explo-rations were done, two of which were at the -400 m lev-el, and the others at the -100 to -200 m level. Beforethe second phase of construction, an additional four-400 m-level boring explorations were carried out.Figure 8 shows the locations of the boring explorations.The wire line drilling method developed by the Port andAirport Research Institute (former Port and HarbourResearch Institute) was used to ensure high quality ande‹ciency of boring explorations (Horie et al., 1984). Inthis soil exploration program, a series of laboratory testsand geological tests were carried out on all of the ob-tained soil samples. A database containing the soil proˆleand soil properties of layers of the construction site use-ful for settlement prediction was compiled based on theresults of boring and geological studies. The nannofossilemergence patterns and the presence of volcanic glasswere also taken into consideration (Kobayashi et al.,2005; Takemura et al., 2005).
The prediction of the long-term settlement at the sec-
ond phase construction site was based on a one-dimen-sional consolidation analysis with the boundary condi-tions of pore water pressures in Pleistocene sand layers,which were calculated separately by a two-dimensionalseepage ‰ow analysis. The constitutive model, called theDB model, was developed from the results of variouslaboratory tests and observations of ground behavior atthe ˆrst airport island, and takes such factors as settle-ment and pore water pressure into account. In thismodel, the e-log p curve was simulated by two straightlines (one for the overconsolidation region, and the otherfor the normal consolidation region). The results fromthe consolidation tests indicated a slight overconsolida-tion (Shinohara, 2003). The diŠerence between the con-solidation yield stress and the initial eŠective overburdenpressure p0 of the Pleistocene layers was assumed to be at-tributable to cementation. Furthermore, data obtainedduring the construction of the ˆrst airport island showedthe settlement of deeper Pleistocene layers, which indicat-ed the existence of a secondary consolidation. Therefore,a viscous settlement model with a secondary consolida-tion coe‹cient was assumed for predicting the settlementof deeper Pleistocene layers.
The validity of this prediction method using the DBmodel was conˆrmed by applying this method on the set-tlement observed during more than 10 years at the ˆrstairport island (Kobayashi et al., 2005). Its validity wasreconˆrmed in reference to the second island settlementdata with cooperation from academic experts of an inves-tigation committee for geotechnical issues for the secondairport island. An approximate 8 m of settlement ispredicted for the Holocene layer on average and approxi-mately 10 m is predicted for the Pleistocene layers fromthe beginning of construction to 50 years after the open-ing of the new runway. A comparison of the measuredand predicted settlements is shown in Fig. 9. The settle-ment was measured by hydraulic pressure gauges withmagnetic transmitters. Details of these measuring deviceswill be described later. The predicted settlement and themeasured settlement are in good agreement.
In order to ensure accurate settlement prediction,
809
Fig. 9 Comparison of measured and calculated settlement (total settle-ment) (DB: DB model, NL: Nonlinear model)
Fig. 10. Platform set up at monitoring point of behavior of Pleisto-cene layers
Fig. 11. Conceptual image of installation of measurement apparatusesat monitoring point 1 of behavior of Pleistocene layers
Fig. 12. Mechanism of diŠerential settlement gauge
809KANSAI INTERNATIONAL AIRPORT
KALD and Kobayashi (Kobayashi et al., 2005) are nowdeveloping a new method (called the nonlinear model) forlong-term settlement prediction. The settlement predictedby the nonlinear model is also shown in Fig. 9. Theprediction closely matches the actual settlement measuredso far.
KALD is still studying the long-term consolidation incooperation with the Port and Airport Research Instituteusing a new constitutive model (Watabe et al., 2008),which is capable of taking the strain rate eŠect into ac-count ( ½Suklje, 1957; Leroueil et al., 1985).
Settlement MeasurementIn making the most accurate long-term predictions of
the settlement of Pleistocene layers, the amount of grad-ual settlement and the pore water pressure in each layerneed to be monitored precisely. OŠshore oil-rig platforms( see Fig. 10) were built at two locations for the installa-tion of various measuring devices in the Pleistocene layersto depths of 350 m, The devices installed include anchor-rod type settlement gauges, magnetic element typediŠerential settlement gauges, and air-balance type porewater pressure gauges. Figure 11 shows how the settle-ment gauges were installed at monitoring point 1(oŠshore side).
Each anchor-rod type settlement gauge has its rodpositioned towards the upper end of the target Pleisto-cene sand layers. The gauge measures the settlement oflayers beneath the point where it is installed. Settlement ismonitored from the projection at the upper end of therod. Since the rod is quite long, the measurement of theinclination is compensated for by an inclinometer.
A magnetic element type multi-layer settlement gaugewas installed in each of the Pleistocene clay layers that iscompressed over time. In thicker clay layers, two or moremagnetic elements were placed at diŠerent levels. Bymeasuring the level of magnetized element(s) in each lay-er, changes in the thickness of each layer can be obtained
(Fig. 12). Data obtained from these devices are cross-checked with data obtained from the anchor rod type set-tlement gauges.
Each air-balance type pore water pressure gauge meas-

810
Fig. 13. Mechanism of pore water pressure gauge
Fig. 14. Excess pore water pressure of Pleistocene sand layers ob-served at monitoring point 1
Fig. 15. Strain change of each layer at monitoring point 1
810 FURUDOI
ures the pore water pressure by detecting the pressurevalue of the gas within the instrument and balancing itwith the pressure of the water surrounding the instrument(Fig. 13). A pore water pressure gauge was placed in eachof the Pleistocene clay and sand layers to enable theprogress of consolidation in the clay layers and thepermeability (drainage) of sand layers to be monitored.The changes of excess pore water pressure in the Pleisto-cene sand layers at monitoring point 2 are shown in Fig.
14. The earth pressure was also measured on the upperplane of the sand blanket at point 2 by an earth pressuregauge with a diameter of 1000 mm. The results show thatnot all sand layers function as permeable layers.
Figure 15 shows the change in the strain of each layerwith time. The tendency varied with each layer. Settle-ment in the MaDtc near the permeable layers Ds1 appearsto have almost completed. On the other hand, in Ma10far from permeable layers there is a small strain.
OVERVIEW OF THE LAND DEVELOPMENT WORK
Ground Improvement WorkIn the second phase project, as in the ˆrst phase,
ground improvement by the sand drain method was ap-plied to most parts of the seawall construction area andall of the reclamation area. In the beginning, a sand layerapproximately 1.5 m-thick was spread evenly over theseabed, blanketing the entire construction site as a perme-able layer for drained water. Once the sand blanket waslaid, sand piles were driven into the seabed. Using eightlarge sand piling barges, each capable of driving 12 sandpiles at a time, about 1.2 million sand piles of 40 cm di-ameter were driven into the Holocene clay layer, eachwith an average thickness of approximately 25 m. Thespacing of the sand piles was set at 2.5 m×2.5 m on asquare grid, with which the settlement of the Holocenelayer was expected to be completed during the construc-tion period. In the area beneath the seawall, however,spacing was set at 1.6 m×2.5 m rectangular grids toachieve the early strengthening of Holocene clay with ac-celerated consolidation. The spacing was decided afterconsidering the seawall construction procedures.
Based on the experience from the ˆrst phase, we de-cided to drive the sand piles until they reached a sand lay-er below the Holocene layer so as to ensure eŠectivedrainage through it. We carefully controlled the sand piledriving operation to make sure that the pile driver shaftsreached the sand layer. This was conˆrmed by monitor-ing the penetration resistance as estimated from thepenetration speed or load. The criterion of the penetra-tion resistance used by each sand piling barge was deter-mined by penetration tests carried out at sites where theHolocene clay layer thickness had been obtained by bor-ing. Since each sand pile was very long and thin, extend-ing a length of 20 m or more, we prevented its discon-tinuity by vibrating the casing pipe using a vibro-ham-mer. Sand piles were driven into prescribed points bylinking the position control systems of sand piling bargeswith the RTK-GPS.
Sea sands with a ˆne-grain fraction content of less than10z were used for both the sand blanket and sand pilesto facilitate drainage. As discussed above, the settlementof the second-phase airport island is progressing aspredicted, which suggests that the ground improvementwas successfully carried out.
Seawall Construction WorkA seawall surrounds the 13 km long perimeter of the
811
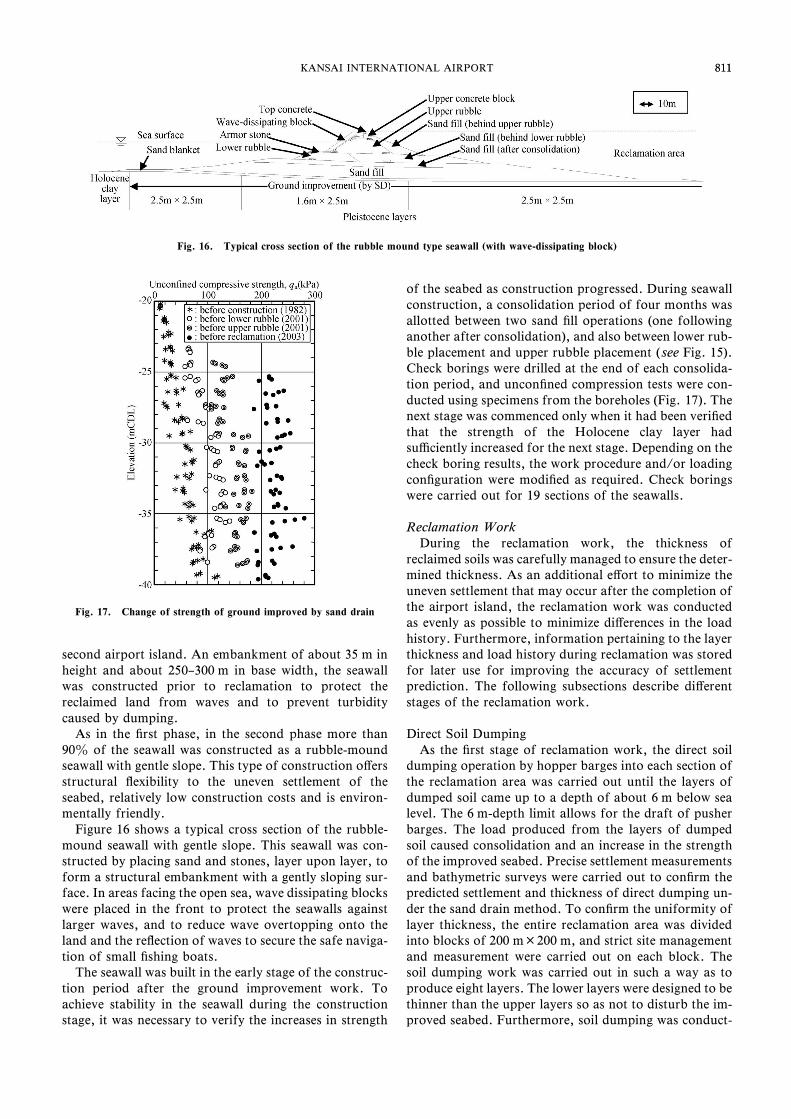
Fig. 16. Typical cross section of the rubble mound type seawall (with wave-dissipating block)
Fig. 17. Change of strength of ground improved by sand drain
811KANSAI INTERNATIONAL AIRPORT
second airport island. An embankment of about 35 m inheight and about 250–300 m in base width, the seawallwas constructed prior to reclamation to protect thereclaimed land from waves and to prevent turbiditycaused by dumping.
As in the ˆrst phase, in the second phase more than90z of the seawall was constructed as a rubble-moundseawall with gentle slope. This type of construction oŠersstructural ‰exibility to the uneven settlement of theseabed, relatively low construction costs and is environ-mentally friendly.
Figure 16 shows a typical cross section of the rubble-mound seawall with gentle slope. This seawall was con-structed by placing sand and stones, layer upon layer, toform a structural embankment with a gently sloping sur-face. In areas facing the open sea, wave dissipating blockswere placed in the front to protect the seawalls againstlarger waves, and to reduce wave overtopping onto theland and the re‰ection of waves to secure the safe naviga-tion of small ˆshing boats.
The seawall was built in the early stage of the construc-tion period after the ground improvement work. Toachieve stability in the seawall during the constructionstage, it was necessary to verify the increases in strength
of the seabed as construction progressed. During seawallconstruction, a consolidation period of four months wasallotted between two sand ˆll operations (one followinganother after consolidation), and also between lower rub-ble placement and upper rubble placement ( see Fig. 15).Check borings were drilled at the end of each consolida-tion period, and unconˆned compression tests were con-ducted using specimens from the boreholes (Fig. 17). Thenext stage was commenced only when it had been veriˆedthat the strength of the Holocene clay layer hadsu‹ciently increased for the next stage. Depending on thecheck boring results, the work procedure and/or loadingconˆguration were modiˆed as required. Check boringswere carried out for 19 sections of the seawalls.
Reclamation WorkDuring the reclamation work, the thickness of
reclaimed soils was carefully managed to ensure the deter-mined thickness. As an additional eŠort to minimize theuneven settlement that may occur after the completion ofthe airport island, the reclamation work was conductedas evenly as possible to minimize diŠerences in the loadhistory. Furthermore, information pertaining to the layerthickness and load history during reclamation was storedfor later use for improving the accuracy of settlementprediction. The following subsections describe diŠerentstages of the reclamation work.
Direct Soil DumpingAs the ˆrst stage of reclamation work, the direct soil
dumping operation by hopper barges into each section ofthe reclamation area was carried out until the layers ofdumped soil came up to a depth of about 6 m below sealevel. The 6 m-depth limit allows for the draft of pusherbarges. The load produced from the layers of dumpedsoil caused consolidation and an increase in the strengthof the improved seabed. Precise settlement measurementsand bathymetric surveys were carried out to conˆrm thepredicted settlement and thickness of direct dumping un-der the sand drain method. To conˆrm the uniformity oflayer thickness, the entire reclamation area was dividedinto blocks of 200 m×200 m, and strict site managementand measurement were carried out on each block. Thesoil dumping work was carried out in such a way as toproduce eight layers. The lower layers were designed to bethinner than the upper layers so as not to disturb the im-proved seabed. Furthermore, soil dumping was conduct-

812
Fig. 18. Procedures of the soil dumping and heaping
Fig. 19. Direct soil heaping
812 FURUDOI
ed in a manner that would reduce diŠerences in the loadhistory among adjacent blocks. The direct soil dumpingwork produced a reclamation layer with the thickness ofabout 14–15 m.
Direct Soil HeapingSince the hopper barges could not navigate in areas
that are shallower than 6 m, the continuation of soildumping operation in this uniform manner had to be ter-minated at this depth. Subsequently, therefore, direct soilheaping was conducted, which meant heaping soil up to acertain height that allowed for stability in the reclamationlayer. To reduce the cost, a further direct soil dumpingoperation using smaller hopper barges was carried outuntil the dumped soil came up to a depth of 3 m below sealevel, which was the depth limit for the draft of reclaimerbarges. Then, the direct heaping operation was carriedout on the ground reclaimed up to a depth of 3 m. Soilswere transshipped using large backhoes from box typesand barges into hoppers of reclaimer barges, and thentransported to a prescribed area by means of spreadermachinery equipped with belt conveyers. Figure 18 showsthe procedures of the soil dumping and heaping worktypical in the reclamation process. In soil heaping work,the site management blocks of 200 m×200 m were fur-ther divided into smaller management blocks of 40 m×40m in consideration of the length of the spreader installedon the reclamation barges (Fig. 19). Information pertain-ing to the layer thickness and load history was gathered inunits of these smaller blocks. The direct soil dumpingoperation by small hopper barges and the soil heapingoperation by reclaimer barges were conducted one afteranother for each 40 m×40 m block.
Direct soil dumping by small hopper barges and soilheaping by reclaimer barges increased the reclamationlayer thickness by 17–19 m. This thickness was deter-mined in consideration of the lift capability of reclaimerbarges and of the required stability of the improved sub-soil. For the prescribed layer thickness to be achieved, thecrest height of the reclamation ground was determinedtaking into consideration the increase of strength up tothe period of soil heaping operation, with reference to theload history for each 40 m×40 m block. Since the heapedsoil produced a large load, load history diŠerences in thesoil heaping operation caused uneven settlement. Thus,
the soil heaping operation was started at sites for keyfacilities, such as the runway and access taxiway, and thisinitial stage of soil heaping was conducted intensively byeleven reclaimer barges in these areas in order tominimize the diŠerence of load history among blocks ad-jacent to each other.
Since the increments of the load produced by soil heap-ing were larger than increments in earlier work stages, itwas necessary to ensure that the strength of the subsoilwas stable enough to allow the soil heaping work to be-gin. The direct soil dumping by small hopper barges wascarried out for one block ahead of soil heaping byreclaimer barges, as shown in Fig. 17. The dumped soilacted as a counterweight to the heaped soil. Check bor-ings were carried out to conˆrm soil strength before thesoil heaping. Stability analyses were carried out on each40 m×40 m block.
Indirect Soil HeapingIn the process of reclamation work, direct soil heaping
was continued until the emerged ground reached a heightlimit that was determined in consideration of the groundstability and the lift capacity of reclaimer barges. Indirectheaping began after the direct heaping. The indirectheaping work consists of heaping soils from reclaimerbarges along seawalls, transporting them to work areasby large dump trucks, spreading them by bulldozers andcompacting them by heavy vibration rollers. Since the toplayer of the reclamation soil serves as the foundation forairport facilities, it had to be improved. In the ˆrst air-port island project, improvement of the ground by theSCP method, weight-dropping method, and MVT (Mam-moth Vibro-Tamper) method were carried out after in-direct heaping. For the second island, estimated settle-ment was very large (18 m), and so the thickness of in-direct heaping was larger than that of the ˆrst island.Ground improvement by heavy vibration rollers was per-formed in parallel with transport and spreading work bydumps and bulldozers, which was the optimum methodin view of the improvement of soils, cost and worke‹ciency. This ground compaction work in the ˆnal stageof land development was commenced on the runway andthe access taxiway of the second phase construction site.
The ground compaction work was carried out by

813
Fig. 20. Indirect soil heaping
Fig. 21. Quality control in indirect soil heaping
813KANSAI INTERNATIONAL AIRPORT
spreading and compacting soil, layer upon layer. The soilfor reclamation included gravels, the maximum size ofwhich was as large as 300 mm in diameter. To ensureeŠective compaction of this type of soil, test works werecarried out to determine the eŠective work process. Testsincluded radioisotope measurements of soil density, in-situ soil density measurement by water replacement, andthe plate-loading test. The ground density, water content,sub-grade reaction modulus and elastic modulus obtainedthrough these tests were used to conˆrm the eŠectivenessof compacting the ground with vibration rollers. The testdata were referred to when determining the layer thick-ness, types of heavy machineries to be used, the numberof rolling operations, and the site management methodol-ogy for quality control. Speciˆcally, each compacted lay-er was set as 60 cm-thick, with each layer compacted byvibration rollers eight times before adding another layer.
In order to give each layer exactly the prescribed thick-ness and stiŠness of soils to serve su‹ciently as the foun-dation, the position and elevation of the soil-spreadingbulldozers and soil-compacting vibration rollers werecontrolled with GPS equipment installed on them (Fig.20). Furthermore, in order to develop a stiŠ and highlyuniform ground, site management focused on the carefulmanagement of the water content and the ground stiŠ-ness. The water content of soil transported from excava-tion sites was measured and controlled as follows: if thewater content was too low, water was added from recla-
mation barges when heaping the soil at storage locations;if the water content was too high, the soil was exposed toair.
After compacting the ground by vibration rollers, thedensity and water content of the soils were measured us-ing a radioisotope device on each 40 m×40 m block.Figures 21(a) and (b) show the measured dry density andwater content of the ˆnal layer produced by the compac-tion work. While the process control criterion for the drydensity was set to 90z of the maximum dry density, allmeasurements exceeded this level, suggesting that theground was well compacted. In addition, the stiŠness dis-tribution of surface layers was monitored using ac-celerometers installed on vibration rollers. Figure 21(c)shows the relative frequency distribution of the acceler-ation-based stiŠness measured on 2 m-size meshes. Eventhough the measurements show a large distribution be-tween 40 and 60 MN/m2, this is attributable to diŠerencesor variations in the water content, grain size and the stiŠ-ness of lower layers.
The reclamation work on sites for facilities scheduledto open in 2007 was completed in the summer of 2005.For the remaining sites, ground compaction work wasalmost completed in March 2009.

814
Fig. 22. Typical settlement plate
Fig. 23. Hydraulic pressure gauge with a magnetic transmitter
Fig. 24. Arrangement plan of settlement measuring devices
Fig. 25. Conceptual scheme of bathymetric survey
814 FURUDOI
NEW TECHNOLOGIES FOR CONSTRUCTIONMANAGEMENT
When conducting large-scale, rapid reclamation workon soft ground, it is important that the settlement of theseabed during the construction period is monitored ac-curately. Two types of settlement measuring devices—settlement plates and hydraulic pressure gauges withmagnetic transmitters—were installed at many points onthe second phase construction site.
The settlement plate is one of the most basic settlementmeasuring devices. Figure 22 shows a typical settlementplate. It consists of a bottom plate and an upright cylin-der. Settlement plates are placed on the sand blanket im-mediately following ground improvement. The settle-ment of the seabed is determined through the water depth(or height) on the top of the cylinder. The settlementplates, besides being used for measuring the settlement,served as a guide for check borings. Settlement plateswere used extensively in the past, but have some disad-vantages; for example, they were obstacles to the naviga-tion of hopper barges and other work vessels.
In view of these disadvantages of settlement plates, wemade extensive use of hydraulic pressure gauges withmagnetic transmitters (referred to here as magnetic settle-ment devices). These devices automatically measure thewater pressure at two-hour intervals and transmit datavia a magnetic transmitter to a receiving unit (Fig. 23).This method has several advantages: the device can beplaced anywhere because it is not an obstacle to work ves-sels; and the device can measure settlement continuouslybecause it stores data in its internal memory. Since themagnetic settlement devices had not been used extensivelyin a large scale project before, the functions andapplicability of the device were conˆrmed in the seawallarea, and then the device was used on the seabed of thereclamation area. To monitor the distribution of settle-ment of the second island, the magnetic settlementdevices were placed in a rectangular grid of 350 m×250m (Fig. 24).
One of the technical challenges for the second phaseconstruction was to conduct land reclamation as evenlyand uniformly as possible in order to minimize any un-even settlement that might occur both during and afterconstruction. The spatial distribution of the thickness ofdumped soils was obtained in order to estimate settlementwith more accuracy. In order to achieve the evenness anduniformity of the reclamation, advanced technologies su-
perior to those employed during the ˆrst phase construc-tion, such as GPS, a narrow multi-beam echo sounderand the earlier-mentioned magnetic settlement devices,were used extensively in the second phase construction.
The monitoring of the layer of dumped soils was car-ried out by a narrow multi-beam echo sounder before andafter dumping operation by a hopper barge. This soundersimultaneously emits 60 beams of ultrasonic waves withan acute directive angle of 1.59, like a fan with an open-ing angle of 909, and conducts a bathymetric survey in aplane, as shown in Fig. 25 (in the past, only a linear sur-vey was performed). The positions were determined usingthe GPS: compensation for the pitching and rolling mo-tions of ships was possible.
The information database stores the shape patterns ofthe soil dumped on the seabed at various depths from

815
Fig. 26. Settlement of 1st and 2nd islands
815KANSAI INTERNATIONAL AIRPORT
each of the hopper barges, as well as the results from pre-and after-dumping bathymetric surveys. It became possi-ble to predict the conˆguration of dumped soils throughpreliminary simulation using the database, which helpedto achieve the evenness and uniformity of dumped soilsby setting position of dumping in advance.
The optimum dumping location, the water depth, thedirection of the bow and so on could be determinedthrough preliminary dumping simulations. Each hopperbarge was led to designated dumping positions by a GPS-based navigation management support system.
PRESENT CONDITION OF SETTLEMENT
As mentioned earlier, the construction of the 2nd is-land was carried out after making highly accurate predic-tions of settlement and by the careful management of lay-er thickness, and the production of a strong surface layer.In this section, we introduce the present condition of set-tlement by comparing the ˆrst phase island with the sec-ond phase island.
Figure 26 shows the change in settlement of the ˆrstand second phase islands with time. The settlement in theˆrst island much varied with the location. On the otherhand, the settlement in the second phase island showedalmost same tendency regardless of location, exceptwhere direct soil heaping had taken place. This indicatesthat the construction of the second phase island resultedin very little diŠerence in the construction history. In ad-dition, it is important that the peak volume of soil wastransported to avoid the discontinuity of the soil supplyfrom the initial stage of construction.
Black line in Fig. 26 shows the settlement around thesecond runway. The construction of the second runwaywas carried out to avoid diŠerences in the constructionhistory. Therefore, the performance of settlement wasalmost the same. The diŠerence of settlement after directsoil heaping was attributable to the diŠerence of the
thickness and the geological properties.
SUMMARY
The construction of the second phase island was car-ried out based on a precise construction plan for themanagement of the settlement of the seabed, the stabilityof the ground and reclamation thickness, considering theexperiences accumulated during the ˆrst phase construc-tion. As a result of the management, settlement has beenobserved to be within the predicted values, and the con-struction of the land development except the superstruc-ture was completed smoothy, without problems, which isbelieved to contribute to advance of issues related toreclamation on soft deposit in future.
The second phase construction of the land develop-ment is almost completed. However, we will be connectedwith the settlement for a long time. We consider itresponsibility to accumulate the observational data andto solve the unknown and academic problems in KansaiInternational Airport.
ACKNOWLEGEMENT
In the construction of Kansai International Airport agreat deal of support was given from a wide range of sup-porters. We would like to thank all of the people con-cerned.
REFERENCES
1) Horie, H., Zen K., Ishii, I. and Matsumoto, K. (1984): Engineeringproperties of marine clay in Osaka bay, Technical Note of the Portand Harbor Research Institute, No. 498 (in Japanese).
2) Kobayashi, M., Furudoi, T., Suzuki, S. and Watabe, Y. (2005):Modeling of consolidation characteristics of clays for settlementprediction of Kansai International Airport. Proc. Symp. Geo-technical Aspects of Kansai International Airport, 65–76.
3) Leroueil, S., Kabbaj, M., Tavenas, F. and Bouchard, R. (1985):

816816 FURUDOI
Closure to ``Stress-strain-strain rate relation for the compressibilityof sensitive natural clays''. G áeotechnique, 35(2), 159–180.
4) Shinohara, M. (2003): Settlement analysis and intelligent sitemanagement of the second-phase land reclamation works for KansaiInternational Airport, Soft Ground Engineering in Coastal Areas(Proceedings of the Nakase Memorial Symposium), 159–167.
5) ½Suklje, L. (1957): The analysis of the consolidation process by theisotache method, Proc. 4th Int. Conf. on Soil Mech. Found. Engng.,
London, 1, 200–206.6) Takemura, K. and Nakaseko, K. (2005): Subsurface geology of Kan-
sai International Airport, central Japan, Proc. Symp. GeotechnicalAspects of Kansai International Airport, 17–22.
7) Watabe, Y., Udaka, K. and Morikawa, Y. (2008): Strain rate eŠecton long-term consolidation of Osaka bay clay, Solis and Founda-tions, 48(4), 496–509.