the shape of things to come - clark county€¦ · the shape of things to come: a window into...
TRANSCRIPT

THE SHAPE OF THINGS TO COME: A WINDOW INTO DESERT TORTOISE CONNECTIVITY IN AN INCREASINGLY URBAN WORLD
Kirsten Dutcher, Jill Heaton, & Ken Nussear2015-UNR-1580A-Desert Tortoise Connectivity Modeling

PROJECT PURPOSE & STATUS
Understand the effects of corridors
& quantify connectivity in disturbed habitat
Final report & deliverable submitted
Support provided by Clark County DCP, funded by SNPLMA, to further the Clark County MSHCP

GENETIC CONNECTIVITY
Panmixia Isolation-by-Distance Isolation

GENE FLOW, BARRIERS, & CORRIDORS
Gene Flow Gene Flow

MAIN CONNECTIVITY TAKEAWAYS
Effect of population density & addition of corridors
Impacts of habitat disturbance on population size & gene flow
Indicators of corridor success/failure
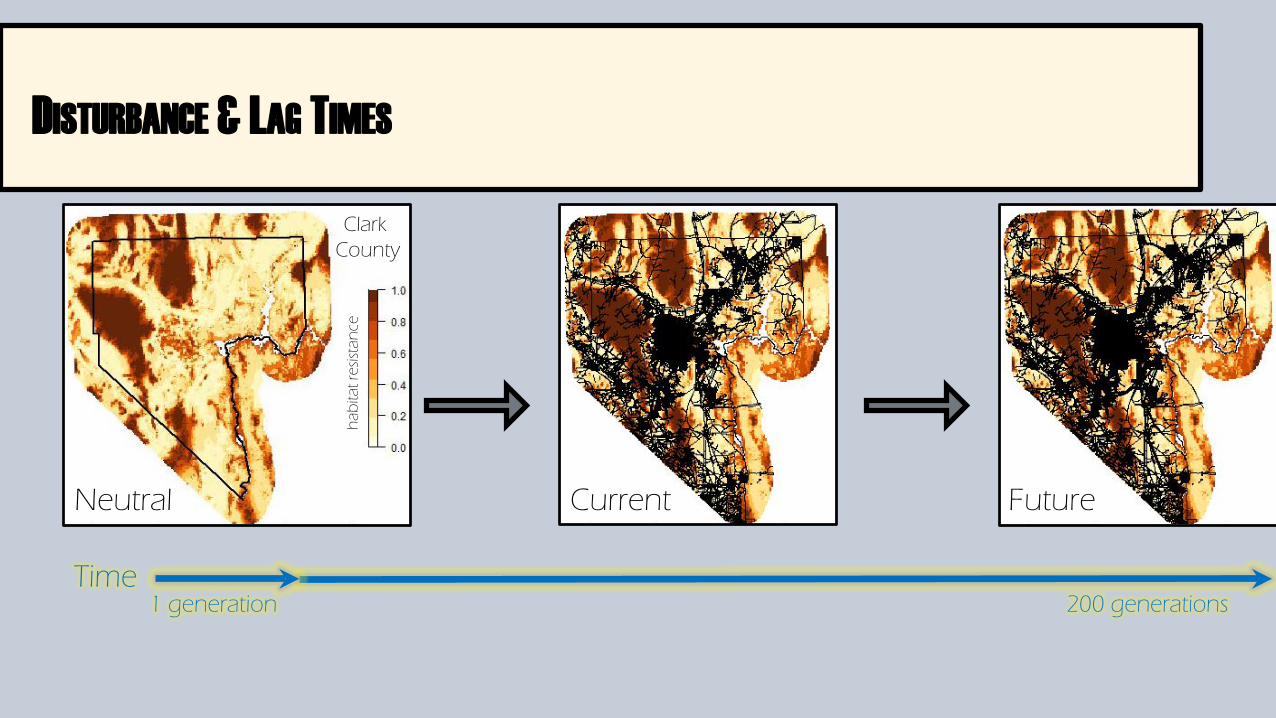
DISTURBANCE & LAG TIMES
200 generations1 generationTime
FutureCurrentNeutral
Clark County
hab
itat r
esist
ance

FORWARD-IN-TIME SIMULATION MODELING
Genotypes - 20 microsatellite loci
Time - 200 tortoise generations
Resistance surface - 0 to 1

PROOF-OF-CONCEPT MODELS
Absolute Barrier Permeable Barrier
Population densities: low (3/km2), moderate (14/km2)
Neutral
hab
itat r
esist
ance

POPULATION & GENETIC ANALYSES
Population Size
Time series
Genetic Structure
Generation 200
ex: K = 2
Genetic Diversity
Ho ~ 0.8
Dutcher et al. in reviewHagerty 2008

POPULATION SIZE & GENETIC DIVERSITY
Moderate
Density (14/km2)
Low
Density(3/km2)
f
f
ff
Generations
Generations
NN
8600
8000
1800
400
Population Dynamics over Time
f
f
ff
Generations
Generations
Ho
Ho
0.79
50.
770
0.8
0.3
Observed Heterozygosity over Time

POPULATION GENETIC STRUCTURE
Neutral
Moderate K = 1
(14/km2)
Low K = 3(3/km2)
Absolute Barrier
K = 2
K = 2
Permeable Barrier
K = 2
K = 2

TAKEAWAY: EFFECT OF POPULATION DENSITY & ADDITION OF CORRIDORS
The addition of corridors improves connectivity
Higher densities improves connectivity
1 migrant/generation former gene flow

CLARK COUNTY MODELED LANDSCAPE LOCATIONS
Locations: 17
Area of each: 525 to 625 km2
Density: 1 to 24/km2hab
itat r
esist
ance

RESISTANCE SURFACES
Clark County
Adapted from Nussear et al. 2009
Neutral Current FutureCurrent Future
hab
itat r
esist
ance

BOUNDING THE LANDSCAPE
hab
itat r
esist
ance
Jean/Roach
Laughlin

RESISTANCE SURFACES
Laughlin
Jean/Roach
Current Future

RESISTANCE SURFACES
Laughlin
Jean/Roach
Current Future

POPULATION SIZE & GENETIC DIVERSITY
Laughlin
Jean/Roach
Population Dynamics over Time
ff
f
f
NN
1000
085
0060
0090
00Generations
Generations
Observed Heterozygosity over Time
ff
f
f
Ho
Ho
0.77
00.
790
0.70
0.78
Generations
Generations

POPULATION GENETIC STRUCTURE
Neutral
Laughlin K = 2
Jean/Roach K = 2
Current
K = 3
K = 2
Future
K = 3
K = 3

TAKEAWAY: IMPACT OF DISTURBANCE ON POPULATION SIZE & GENE FLOW
Disturbance reduces population size, diversity, & connectivity
Pay attention to population size
Photo courtesy of USGS

CORRIDOR SUCCESS INDEX (CSI)
1 CSI 0
FST = 0.002
Neutral Landscape
FST = 0.014
Absolute Barrier

HIGH LEVELS OF GENETIC CONNECTIVITY (CSI = 0.7-1)
Current
LaughlinEldorado ValleyTrout CanyonSandy ValleySearchlightIndian SpringsLas Vegas NorthCoyote SpringsMoapa Valley
Future
LaughlinEldorado ValleyTrout Canyon
SearchlightIndian Springsh
abita
t res
istan
ce

INTERMEDIATE CONNECTIVITY (CSI = 0.35-0.69)
Current
BCCE
Dry Lake
Mesquite
Future
Dry Lake
Mesquite
Coyote Springs
Sandy Valleyhab
itat r
esist
ance

LOW/NO CONNECTIVITY (CSI < 0.35)
Current
Ivanpah Valley
Las Vegas West
Las Vegas East
Red Rock
Jean/Roach
Future
Ivanpah Valley
Las Vegas West
Las Vegas East
Red Rock
Jean/Roach
BCCE
Moapa Valley
Las Vegas North
hab
itat r
esist
ance

LANDSCAPE METRICS
Number of habitat patches – measure of fragmentation
Percent habitat area – measure of habitat loss

FRAGMENTATION & CONNECTIVITY
b
b
b b
bNumber of Suitable Habitat Patches
Loss
of H
o
Loss
of N
Incr
ease
in F
ST
Loss of Individuals Loss of Genetic Diversity Increase in Genetic Differentiation
Increasing Fragmentation

HABITAT LOSS & CONNECTIVITY
b
b
b b
b
Loss of Individuals Loss of Genetic Diversity Increase in Genetic Differentiation
Loss
of N
Loss
of H
o
Incr
ease
in F
ST
% Suitable Habitat Area
Increasing Habitat
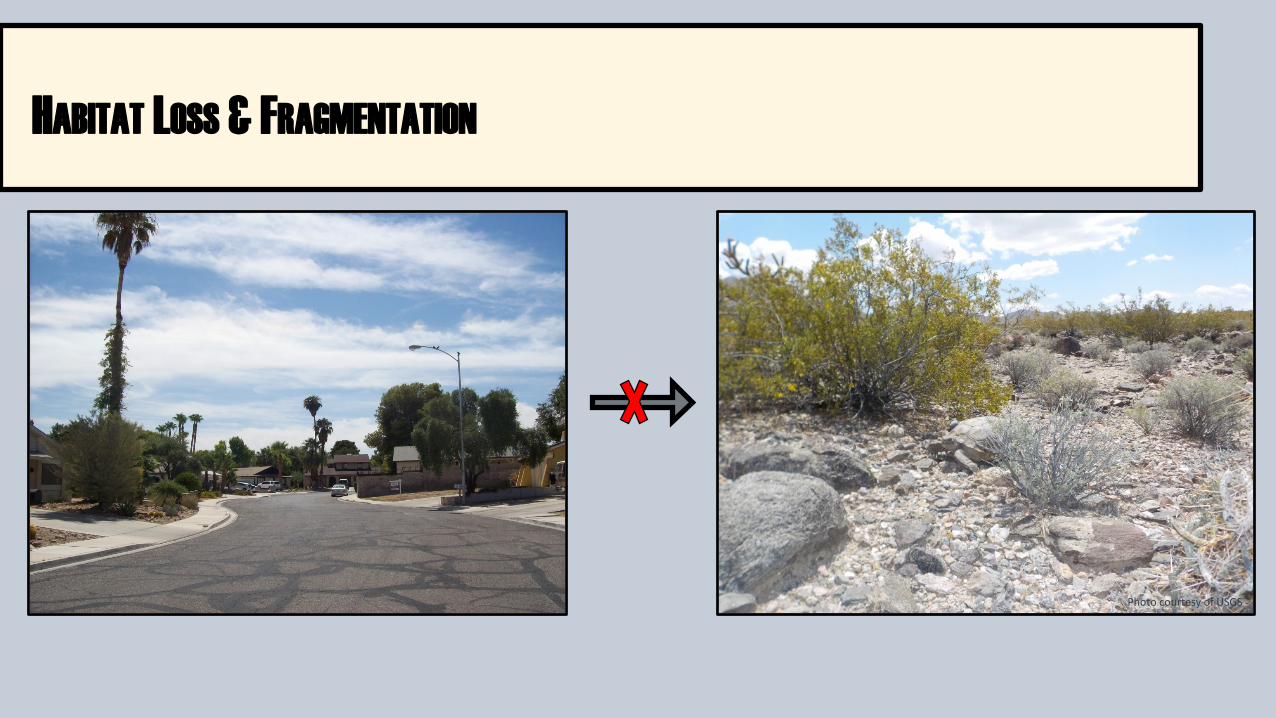
HABITAT LOSS & FRAGMENTATION
Photo courtesy of USGS

TAKEAWAY: INDICATORS OF CORRIDOR SUCCESS/FAILURE
More habitat + less fragmentation = more connectivity
Landscape dependent
individual management units
Photo courtesy of USGS

MANAGEMENT RECOMMENDATIONS
Low/no connectivity landscapes – prioritize for restoration
Intermediate connectivity – strategically restore connectivity
High connectivity – maintain existing habitat

THANK YOU
Photo courtesy of USGS
Scott CambrinKimberley Jenkins
Lee BiceTodd Esque
Kristina DrakeFelicia Chen
Ben GottsackerAmanda McDonald
Sara MurrayJordan Swart
Marjorie MatocqAnna MitelbergAmy Vandergast


POPULATION & GENETIC ANALYSES
Population Size Genetic Structure
Generation 200
K = 2
Time series
Genetic Differentiation
FST
~ 0
FST
> 0
Genetic Diversity
Ho ~ 0.8
N = 10

POPULATION, HETEROZYGOSITY, & DIFFERENTIATION
Moderate
Density
Low
Density
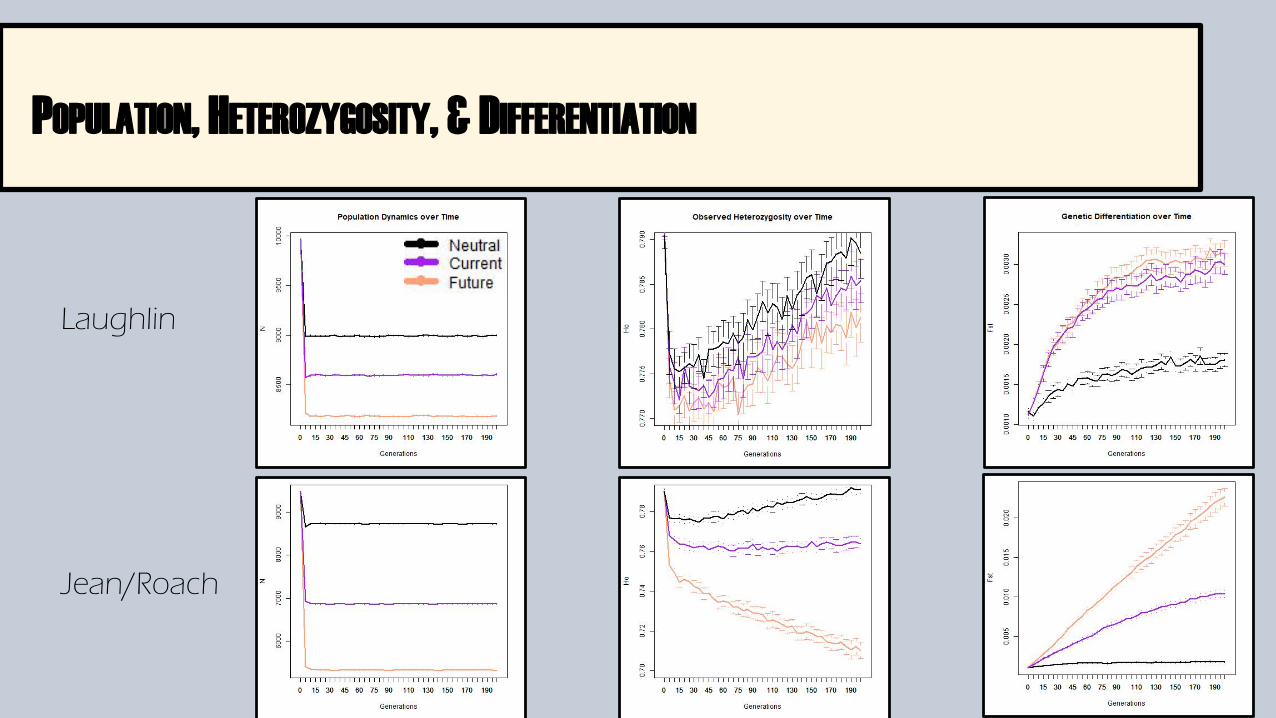
POPULATION, HETEROZYGOSITY, & DIFFERENTIATION
Laughlin
Jean/Roach