the shifting enrollment landscape - eab€¦ · the shifting enrollment landscape ... four-year...
TRANSCRIPT
©2016 EAB • All Rights Reserved • 32367B
2017 Navigate Summit
The Shifting Enrollment LandscapeNew Disciplines for Marketing and Recruiting
©2016 EAB • All Rights Reserved • 32367B
John Tannous
Director. EAB Strategic
Research

©2016 EAB • All Rights Reserved • 32367B
3
7.0M
5.9M
5
6
6
7
7
2010 2011 2012 2013 2014 2015
Growing Pressure to Recover Enrollments
Persistent Loss of Tuition Revenue Destabilizes College Budgets
Source: National Student Clearinghouse, “Current Term Enrollment Estimates,” 2015; National Student Clearinghouse, “Current Term Enrollment Estimates,” 2012; Smith A, “Mergers without Rancor?” Inside Higher Ed, 2015; Smith A, “Too Few Students,” Inside Higher Ed, 2015; EAB interviews and analysis.
Five Years of Enrollment Declines
Fall Enrollment at Two-Year Public Colleges, 2010–2015
0
Amid Funding Volatility, No Easy Costs Left to Cut
16%Community college enrollment decline, 2010–2015
College closures
5.5M
6.0M
6.5M
7.0M
Faculty and staff layoffs
Institutional mergers
Program sunsetting
Branch campus closures

©2016 EAB • All Rights Reserved • 32367B
4Facing Headwinds from Both Sides
Economic and Demographic Trends Hold Down College Enrollments
Source: Bureau of Labor Statistics, “Labor Force Statistics from the Current Population Survey,” http://data.bls.gov/timeseries/LNS14000000; National Student Clearinghouse, “Current Term Enrollment Estimates,” 2015; National Student Clearinghouse, “Current Term Enrollment Estimates,” 2012; National Center for Education Statistics, “Projections of Education Statistics to 2022,” 2014; EAB interviews and analysis.
Adult Learners Returning to Workforce
U.S. Unemployment Rate vs. Fall Enrollment of Students Age 25+ at Community Colleges
2.9M 2.1M
9.6%
5.3%
2010 2011 2012 2013 2014 2015
Age 25+ Enrollments Unemployment
High School Classes Shrinking
U.S. High School Graduates (in Millions)1
2.0
2.5
3.0
3.5
4.0
2000 2005 2010 2015 2020
1) Figures from 2012 onward are projections
Peaked in 2010
3% decline projected from 2010–2020
0
©2016 EAB • All Rights Reserved • 32367B
5
Market share down to 38% in response to rise of for-profits and market-driven non-profits
Market share hovered between 40–44%, running countercyclical to economic trends
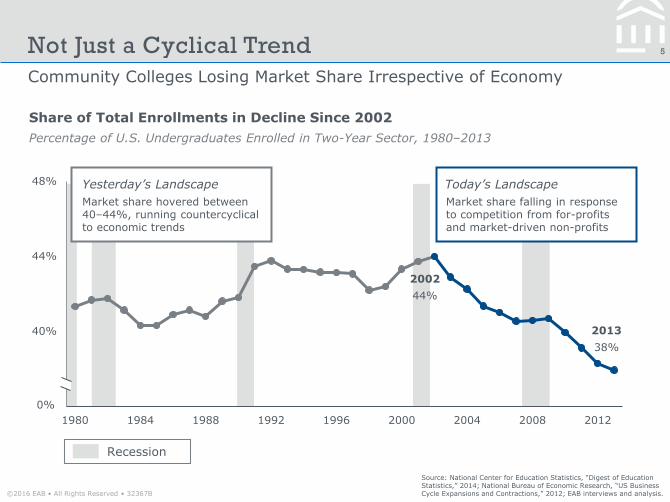
2002
44%
2013
38%
36%
40%
44%
48%
1980 1984 1988 1992 1996 2000 2004 2008 2012
Community Colleges Losing Market Share Irrespective of Economy
Source: National Center for Education Statistics, “Digest of Education Statistics,” 2014; National Bureau of Economic Research, “US Business Cycle Expansions and Contractions,” 2012; EAB interviews and analysis.
Not Just a Cyclical Trend
Percentage of U.S. Undergraduates Enrolled in Two-Year Sector, 1980–2013
Share of Total Enrollments in Decline Since 2002
Today’s LandscapeYesterday’s Landscape Today’s Landscape
Market share falling in response to competition from for-profits and market-driven non-profits
Yesterday’s Landscape
Market share hovered between 40–44%, running countercyclical to economic trends
Recession
0%

©2016 EAB • All Rights Reserved • 32367B
6
Source of Competition Shifts from For-Profit to Four-Year Sector
Source: National Student Clearinghouse, “Current Term Enrollment Estimates,” 2015; National Student Clearinghouse, “Current Term Enrollment Estimates,” 2012; EAB interviews and analysis.
Universities Capturing Market Share
More Students Heading to Universities
Market Share of Postsecondary Enrollments by Sector
38%
17%
8%
34%
42%
20%
6%
31%
Four-Year Public Four-Year Private Four-Year For-Profit Two-Year Public
Fall 2010 Fall 2015
“There’s a presumption among community colleges that we don’t compete with universities,but rather we compete with life. I don’t know if that’s true. They’re eating our lunch.”
Janet Gullickson, President Spokane Falls Community College
©2016 EAB • All Rights Reserved • 32367B
7
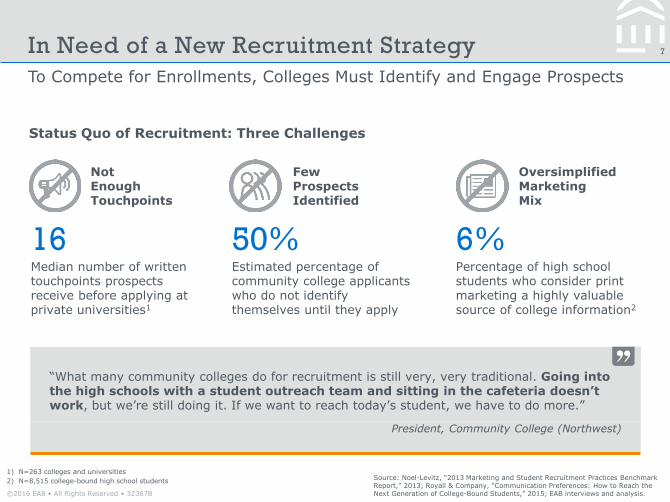
To Compete for Enrollments, Colleges Must Identify and Engage Prospects
Source: Noel-Levitz, “2013 Marketing and Student Recruitment Practices Benchmark Report,” 2013; Royall & Company, “Communication Preferences: How to Reach the Next Generation of College-Bound Students,” 2015; EAB interviews and analysis.
1) N=263 colleges and universities
2) N=8,515 college-bound high school students
In Need of a New Recruitment Strategy
“What many community colleges do for recruitment is still very, very traditional. Going into the high schools with a student outreach team and sitting in the cafeteria doesn’t work, but we’re still doing it. If we want to reach today’s student, we have to do more.”
President, Community College (Northwest)
Status Quo of Recruitment: Three Challenges
Not Enough Touchpoints
Median number of written touchpoints prospects receive before applying at private universities1
16
Few Prospects Identified
Estimated percentage of community college applicants who do not identify themselves until they apply
50%
Oversimplified Marketing Mix
Percentage of high school students who consider print marketing a highly valuable source of college information2
6%

©2016 EAB • All Rights Reserved • 32367B
ROAD MAP8
1
2
3
Increasing Applicant Conversion
Competing for Prospect Mindshare
Capturing Stealth Prospects and Generating Leads
Lead
Inquiry
Applicant
Enrollment
Finding Our Place on the Enrollment Funnel
©2016 EAB • All Rights Reserved • 32367B
9
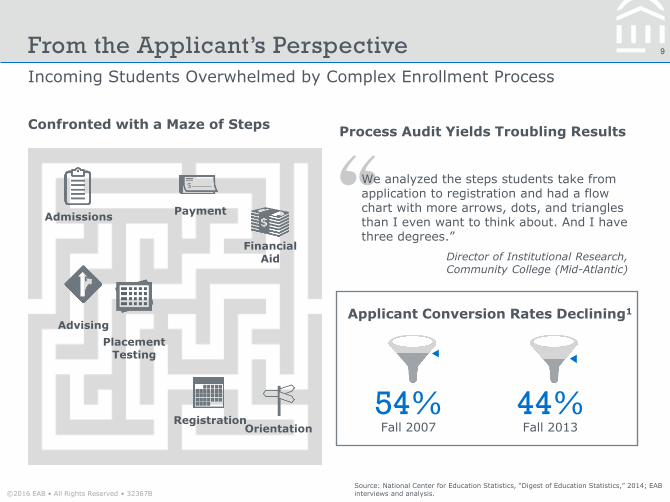
Incoming Students Overwhelmed by Complex Enrollment Process
Source: National Center for Education Statistics, “Digest of Education Statistics,” 2014; EAB interviews and analysis.
From the Applicant’s Perspective
Admissions
Placement Testing
Advising
Financial Aid
OrientationRegistration
Payment
Confronted with a Maze of Steps
Applicant Conversion Rates Declining1
54% 44%Fall 2007 Fall 2013
Director of Institutional Research,Community College (Mid-Atlantic)
We analyzed the steps students take from application to registration and had a flow chart with more arrows, dots, and triangles than I even want to think about. And I have three degrees.”
Process Audit Yields Troubling Results

©2016 EAB • All Rights Reserved • 32367B
10
Lake-Sumter Sends Calls-to-Action for Each Remaining Enrollment Step
Source: EAB interviews and analysis.
1) Assumes students enrolled in an average of 20 credits per year at in-state tuition rate
Missing Step Enrollment Prompts
Short Email Goes Long Way
Applicant conversion rate in 2015, compared to 59% in 2013
62%
Reaching Applicants at Little Cost
Draft Email: Admissions staffdraft brief email template with instructions to complete selected step
2
Identify Recipients: Admissions staff download list of applicants missing selected step from SIS
3
Over half of applicants receive at least one email prompt and may respond for further clarification
25Minutes to
complete steps
1Select Topic: Each prompt focuses on one step such as FAFSA, orientation, registration, or course payment
Conduct Mail Merge: Staff send out emails personalized with applicants’ names
4Estimated additional
tuition revenue per year1
$191K

©2016 EAB • All Rights Reserved • 32367B
11
Informal, Jargon-Free, and Personalized Messages Prioritize Clarity
Source: EAB interviews and analysis.
Not Your Typical Administrative Letter
Hi Jane,
All new LSSC students are required to attend orientation. If you haven’t already registered for orientation, please do so by clicking here and following the instructions by August 1. If you have already scheduled your orientation session, please disregard this message and we will see you soon!
Let me know if you have any questions.
John
John DoeDirector of AdmissionsLake-Sumter State College1234 Street AddressCity, ST 12345Office: (123) [email protected]
Like us on Facebook for the latest LSSC news and events!
Embed links to facilitate quick action
Include admissions director’s signature for authority
Prompting Next Steps with Brief Emails
Sample Email for Applicants Missing Orientation
Capture applicant’s attention with her name
Keep body of email to 4 or fewer sentences
Use informal language to improve readability
1
3
5
6
2
Add urgency with deadline—real or artificial
4

©2016 EAB • All Rights Reserved • 32367B
12
Applicants Hesitate to Seek Help with Removable Hurdles
Source: EAB interviews and analysis.
Uncovering Barriers to Enrollment
Identifying Leaks in the Pipeline
Common Enrollment Challenges for Applicants
Need assistance understanding highly technical FAFSA questions
Confused by academic jargon in course catalog and registration portal
Unable to book advisor meetings that fit into work schedule
Unaware of available resources, such as child care and transportation
From Telling to Asking
“We were doing a good job at customer service in terms of reminding the student, ‘You need to fill out this form, and you need to fill out that form.’ But we weren’t finding out why the student wasn’t filling out those forms—what might have changed in their lives since they started applying, and what might be causing delays in taking the next step in the admissions process.”
Marketing Director,Community College (Midwest)

©2016 EAB • All Rights Reserved • 32367B
13
Glendale Addresses Barriers to Enrollment Before Classes Start
Non-Registrant Phone Survey
Source: EAB interviews and analysis.
What Prevents Our Applicants from Registering?
Surveys non-registering applicants to uncover why they do not enroll
Provides call center with 4-question script; last question asks if applicants need assistance from college staff
Converting Lost Applicants
621 Applicants contacted
121 Applicants enrolled
$111K Estimated tuition revenue generated1
• Summer phone bank staffed by 1 supervisor and 5 part-time call agents
• 4-hour training teaches agents to answer FAQs and refer applicants to relevant services
• In-house solution provides applicants with personal touchpoints from college personnel
Developing an In-House Alternative
Hires call center to conduct survey two weeks before classes start for $3,500
1) Assumes students enrolled in an average of 20 units per year at in-state tuition rate

©2016 EAB • All Rights Reserved • 32367B
ROAD MAP14
1
2
3
Increasing Applicant Conversion
Competing for Prospect Mindshare
Capturing Stealth Prospects and Generating Leads
Lead
Inquiry
Applicant
Enrollment
Finding Our Place on the Enrollment Funnel

©2016 EAB • All Rights Reserved • 32367B
15
Competitors Prioritize Early, Frequent, and Personalized Outreach
Source: Noel-Levitz, “2013 Marketing and Student Recruitment Practices Benchmark Report for Four-Year and Two-Year Institutions,” 2013; EAB interviews and analysis.
1) N=263 colleges and universities
In Need of Pre-Application Touchpoints
5
11
16
Two-Year
Public
Four-Year
Public
Four-Year
Private
Lagging Behind Public and Private Universities
Number of Written Contacts with Prospects Before Application1
Viewbooks delivered to ACT/ SAT test-takers
Emails sent in response to
online inquiries
Personalized letters mailed after
campus visits
For-Profits SettingImpossibly High Bar
One Prospect’s Story
Visited for-profit university’s booth during college fair
Filled out electronic inquiry form
Received follow-up email from university before leaving booth
Two-Year Public
Four-Year Public
Four-Year Private

©2016 EAB • All Rights Reserved • 32367B
16
Sends financial aid award estimates to all prospects who list SFCC on FAFSA
SFCC Sends Personalized Award Letters to Prospects Who Submit FAFSA
Preliminary Financial Aid Estimates
Early Outreach to a Targeted Prospect Pool
Mails letters out within one week of receiving prospect’s FAFSA record
Calculates net cost of attendance for each prospect based on Pell eligibility
Letters Highlight Low Cost of Attendance
Possible Additional Funding Sources
Tuition and Fees $5,389
Estimated Pell Award $5,645
Net Cost $0.00
• State grants
• Institutional grants
• Work-study earnings
• Student loans
Financial Aid Estimate Letter (Simplified)
10K+Number of financial aid estimates sent out per year
Source: EAB interviews and analysis.

©2016 EAB • All Rights Reserved • 32367B
17
Early Financial Aid Estimates Promote Application and Matriculation
Making a Competitive First Offer
Putting University Costs In Perspective
“When students start hearing from the four-year universities they applied to, they see that the cost of attendance is $20,000 once they include the dorms and all the other things they might have to pay for if they leave town. We get our preliminary letter to them first. Hopefully their parents are looking at our letter. Then, as those other award letters come in, they have a little more perspective.”
Marjorie Davis, Director of Financial AidSpokane Falls Community College
Driving Enrollment Growth
FTE at Spokane Falls Community College
Source: EAB interviews and analysis.
4,101 4,342
Fall 2013 Fall 2014
First class that received financial aid estimates

©2016 EAB • All Rights Reserved • 32367B
18
During our College Preview Day, we bring over 1,000 students to campus. We used to have them each fill out a little sheet of paper with their interests.
Then, we’d put those papers in a box and store the box away. We actually never followed up with those prospects. We had no idea if they applied, let alone enrolled.”
Inability to Track Prospects Hampers Engagement Strategy
Letting Warm Leads Go Cold
A Wealth of Prospect Information…
Recruitment events
High school seniors
Dual enrollment students
Online inquiry form
ACT/SAT test-takers
Call center inquiries
GED completersVice President of Instruction,
Community College (West Coast)
…But No Place to Store It
Source: EAB interviews and analysis.
©2016 EAB • All Rights Reserved • 32367B
19
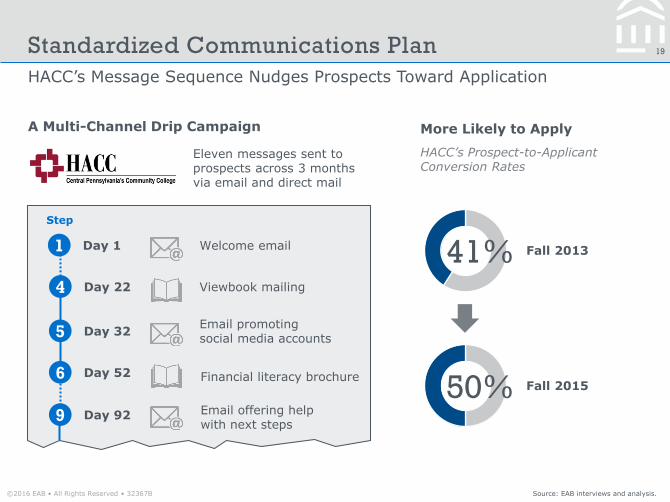
HACC’s Message Sequence Nudges Prospects Toward Application
Standardized Communications Plan
Email offering help with next steps
More Likely to Apply
HACC’s Prospect-to-Applicant Conversion Rates
41% Fall 2013
50% Fall 2015
Source: EAB interviews and analysis.
A Multi-Channel Drip Campaign
Step
1 Day 1 Welcome email
4 Day 22 Viewbook mailing
6 Day 52 Financial literacy brochure
9 Day 92
5 Day 32Email promoting social media accounts
Eleven messages sent to prospects across 3 months via email and direct mail
Email offering help with next steps

©2016 EAB • All Rights Reserved • 32367B
20
Pre-Planned Communications Designed Around Prospects’ Preferences
Moving Beyond Ad Hoc Messaging
Timing Modality Content
Deliver first message on same day of inquiry
Space messages out across several weeks to stay top-of-mind without overwhelming prospects
Use various channels (e.g., direct mail, email, automated voicemail) to accommodate prospects’ diverse preferences
Send important content through more than one channel to ensure delivery
Address pre-application priorities, including program selection and financial aid
Focus on promoting the college—post-application messages will explain enrollment logistics
Key Takeaways on Prospect Engagement
Source: EAB interviews and analysis.
Lessons from the Implementation of HACC’s Communications Plan

©2016 EAB • All Rights Reserved • 32367B
21
Ignoring High Quality Leads
“We had so many prospects who were starting applications but weren’t finishing. We realized that this was a huge pool of high-quality warm leads that we were ignoring.”
Director of Marketing, Public Institution
Prospects with Incomplete Applications Slipping Through the Cracks
An Untapped Source of Warm Leads
50%Estimated percentage of applications never completed at a Mid-Atlantic community college
Large Share of Applications Stalled
Why Do Prospects Leave Applications Unfinished?
Simply forgot to return after navigating away
Got stuck on a question (e.g., intended major, financial plans)
Didn’t realize there were multiple pages
Couldn’t pay application fee to submit form
Source: EAB interviews and analysis.

©2016 EAB • All Rights Reserved • 32367B
22
Promoting Completion of Applications Through Multi-Channel Outreach
Stalled Application Reminders
Consists ofmultiple pages
Requests applicant contact info on early pages
Allows applicants to save work in progress
No Shortage of Communication Options
• Provide link to complete application
• Invite prospects to recruitment events
Text Message
• Acknowledge started applications
• Remind prospects of upcoming deadlines
Phone Call
• Address barriers to completing application
• Answer complex questions
Prerequisites Features of Online Applications
Source: EAB interviews and analysis.

©2016 EAB • All Rights Reserved • 32367B
23
Marketing Automation Software
• Automatically sends emails to prospective students
• Generates communication analytics to assess impact
Customer Relationship Management Platforms
• Monitors and tracks prospective student’s enrollment status
• Stores contact information for customized outreach
Incre
ase E
nro
llm
ents
Genera
te L
eads
Lead and Inquiry Management Software Toolkit Available in EAB Library
Source: Capterra, “What’s the Difference Between CRM and Marketing Automation Software?” http://blog.capterra.com/whats-difference-between-crm-and-marketing-automation-software/; EAB interviews and analysis.
Additional Resources for Prospect Engagement
Sample Tools
Communications Plan Builder
RFP Creation Template
CRM Vendor Selection Scorecard
CRM Training Curriculum Outline
Sample Tools
MA Software Primer
MA Readiness Diagnostic
MA Vendor Guide
MA Risk and Adoption Planner

©2016 EAB • All Rights Reserved • 32367B
ROAD MAP24
1
2
3
Increasing Applicant Conversion
Competing for Prospect Mindshare
Capturing Stealth Prospects and
Generating Leads
Lead
Inquiry
Applicant
Enrollment
Finding Our Place on the Enrollment Funnel
©2016 EAB • All Rights Reserved • 32367B
25
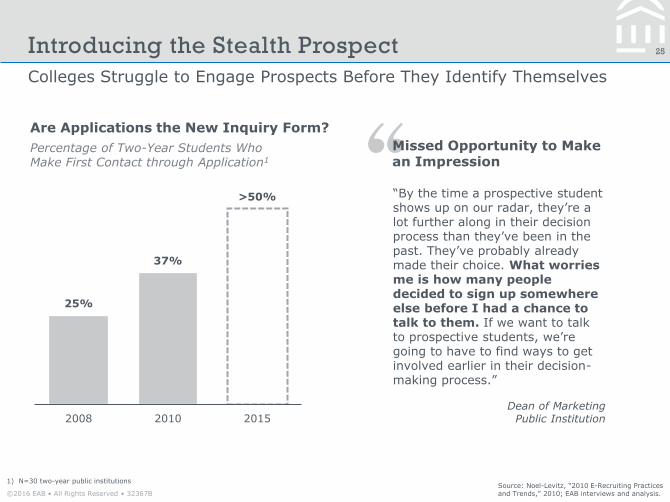
Colleges Struggle to Engage Prospects Before They Identify Themselves
Source: Noel-Levitz, “2010 E-Recruiting Practices and Trends,” 2010; EAB interviews and analysis.
1) N=30 two-year public institutions
Introducing the Stealth Prospect
Are Applications the New Inquiry Form?
Percentage of Two-Year Students Who Make First Contact through Application1
25%
37%
>50%
2008 2010 2015
“By the time a prospective student shows up on our radar, they’re a lot further along in their decision process than they’ve been in the past. They’ve probably already made their choice. What worries me is how many people decided to sign up somewhere else before I had a chance to talk to them. If we want to talk to prospective students, we’re going to have to find ways to get involved earlier in their decision-making process.”
Dean of MarketingPublic Institution
Missed Opportunity to Make an Impression
©2016 EAB • All Rights Reserved • 32367B
26
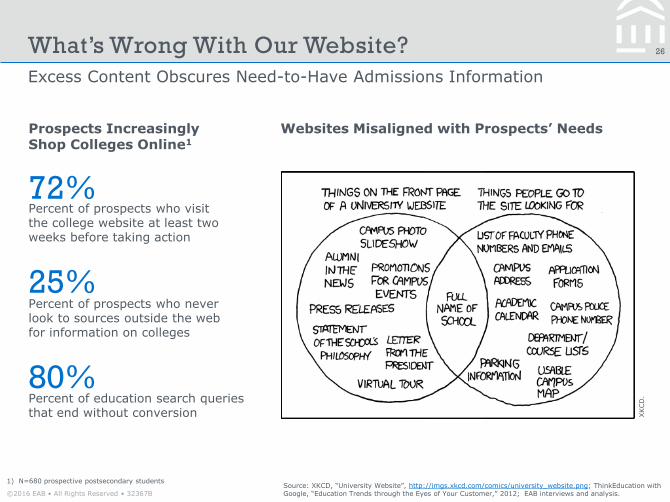
Excess Content Obscures Need-to-Have Admissions Information
Source: XKCD, “University Website”, http://imgs.xkcd.com/comics/university_website.png; ThinkEducation with Google, “Education Trends through the Eyes of Your Customer,” 2012; EAB interviews and analysis.
1) N=680 prospective postsecondary students
What’s Wrong With Our Website?
Websites Misaligned with Prospects’ Needs
72%Percent of prospects who visit the college website at least two weeks before taking action
Percent of prospects who never look to sources outside the web for information on colleges
25%
80%Percent of education search queries that end without conversion
Prospects Increasingly Shop Colleges Online1
XKCD
.
©2016 EAB • All Rights Reserved • 32367B
27
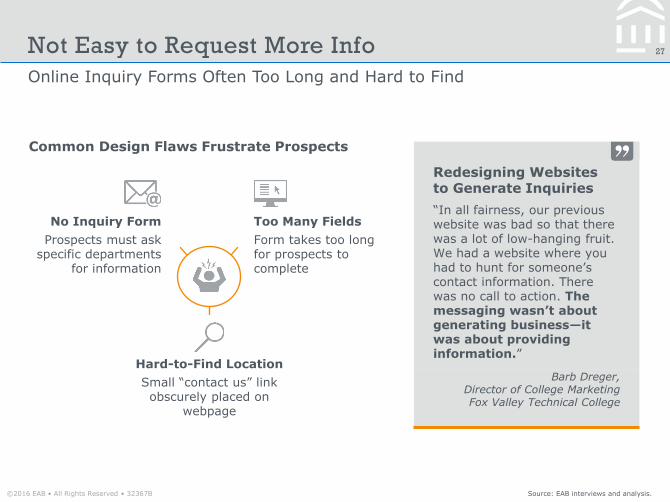
Online Inquiry Forms Often Too Long and Hard to Find
Source: EAB interviews and analysis.
Not Easy to Request More Info
Redesigning Websites to Generate Inquiries
“In all fairness, our previous website was bad so that there was a lot of low-hanging fruit. We had a website where you had to hunt for someone’s contact information. There was no call to action. The messaging wasn’t about generating business—it was about providing information.”
Barb Dreger, Director of College MarketingFox Valley Technical College
Common Design Flaws Frustrate Prospects
Hard-to-Find Location
Small “contact us” link obscurely placed on
webpage
No Inquiry Form
Prospects must ask specific departments
for information
Too Many Fields
Form takes too long for prospects to complete

©2016 EAB • All Rights Reserved • 32367B
28
Fox Valley Tech Places Four-Step Form on Academic Program Pages
Source: EAB interviews and analysis.
Prospect-Centered Inquiry Form
Inquiry Form Optimized to Drive Inquiries
Increase in leads since 2014 website redesign
900%
Unduplicated inquiries received in 2015
4,611
More Appealing To Prospects
Form placed prominently on every academic program page
Mobile-responsive design allows submission from any device
Questions divided into four short pages with progress bar to promote completion

©2016 EAB • All Rights Reserved • 32367B
29
More Resources on Inquiry Form Design Available in EAB Library
Source: EAB interviews and analysis.
Implementing the Practice at Home
Optimizing How We Gather Information
Indicate Required Fields: Form appears more manageable and differentiates prospect interest
1
4 Consider Implicit Welcome Message: A question about military status can signal willingness to accommodate veterans
2 Ask for Broad Program Interest: College receives useful follow-up information without forcing prospects to commit to a specific credential
3 Build Drop-Down Menus: Careful design choices help save space and encourage form completion
Design Principles of Inquiry Forms
Screenshot of Inquiry Form Builder Tool
Included in COE Forum’s Lead and Inquiry Management Software Toolkit
Provides sample inquiry form fields and implementation insights
Outlines how to design and organize an inquiry form
©2016 EAB • All Rights Reserved • 32367B
30
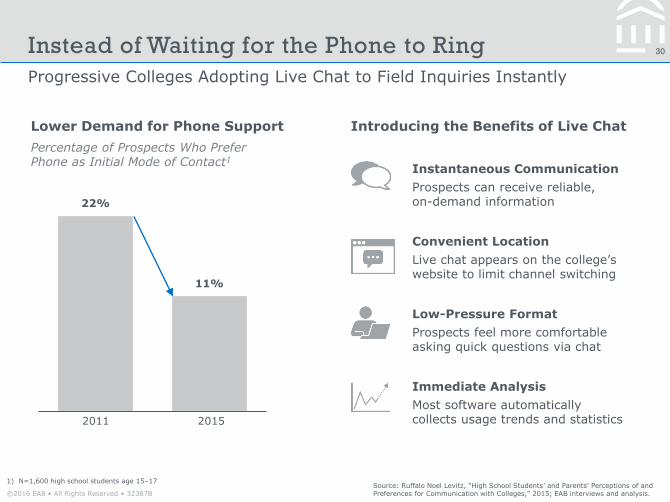
Progressive Colleges Adopting Live Chat to Field Inquiries Instantly
Source: Ruffalo Noel Levitz, “High School Students’ and Parents’ Perceptions of and Preferences for Communication with Colleges,” 2015; EAB interviews and analysis.
1) N=1,600 high school students age 15–17
Instead of Waiting for the Phone to Ring
Lower Demand for Phone Support
22%
11%
2011 2015
Percentage of Prospects Who Prefer Phone as Initial Mode of Contact1
Introducing the Benefits of Live Chat
Instantaneous Communication
Prospects can receive reliable, on-demand information
Convenient Location
Live chat appears on the college’s website to limit channel switching
Immediate Analysis
Most software automatically collects usage trends and statistics
Low-Pressure Format
Prospects feel more comfortable asking quick questions via chat
©2016 EAB • All Rights Reserved • 32367B
31
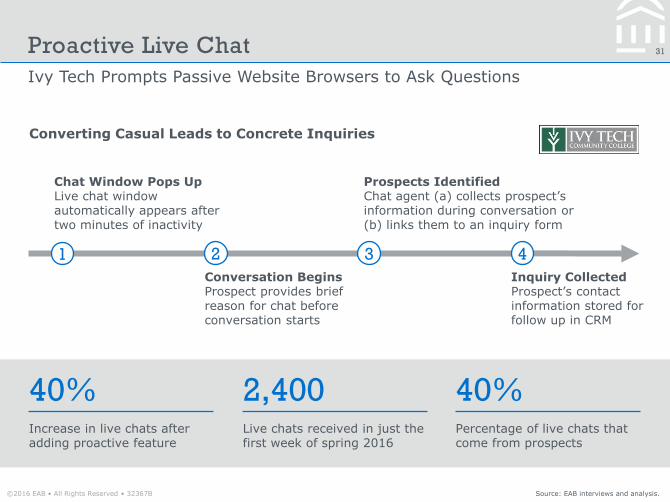
40%Increase in live chats after adding proactive feature
Ivy Tech Prompts Passive Website Browsers to Ask Questions
Source: EAB interviews and analysis.
Proactive Live Chat
40%Percentage of live chats that come from prospects
2,400Live chats received in just the first week of spring 2016
Chat Window Pops UpLive chat window automatically appears after two minutes of inactivity
Conversation BeginsProspect provides brief reason for chat before conversation starts
Prospects IdentifiedChat agent (a) collects prospect’s information during conversation or (b) links them to an inquiry form
1 2 3 4
Inquiry CollectedProspect’s contact information stored for follow up in CRM
Converting Casual Leads to Concrete Inquiries

©2016 EAB • All Rights Reserved • 32367B
32
Many Options to Introduce Live Chat Without Breaking the Bank
Source: EAB interviews and analysis.
Seeking a Solution for Your Campus
Selective Pop-Up
Embed live chat feature on select web pages
Student Workers
Hire and train students to operate the live chat
Double Agents
Reassign or cross-train call center
workers for live chat
Limited Calendar
Only offer live chat during peak
registration months
Personnel
Logistics
Simultaneous Windows
Train chat staff to respond multiple live chats at once
Strategic Hours
Only offer live chat during peak website visiting hours
• Blackboard provides live chat agents as part of call center contract
• Up to twice as many agents monitor live chat during peak enrollment
• Agents are trained according to Ivy Tech’s specifications
Ivy Tech’s Live Chat Staffing Model
Six Strategies to Minimize Implementation Costs

©2016 EAB • All Rights Reserved • 32367B
33
Students Increasingly Seeking College Information on Digital Channels
Source: Ruffalo Noel Levitz, “2015 E-Expectations Report,” 2015; Gil R, “The 2015 Social Admissions Report,” 2015; EAB interviews and analysis.
1) N=3,000+ high school juniors and seniors
2) N=1,611 high school seniors
Meeting Prospects Where They Are
Moving Beyond the High School Visit
“I recently attended a statewide admission directors’ meeting to discuss the allocation of resources. A lot of the colleges were saying that they’re seriously considering stopping high school visits. The younger generation does not want to talk to you face-to-face anymore. Perhaps something completely digital would be a good alternative.”
Marlene BarlowDirector of Admissions, Bucks County
Community College
Percentage of high school seniors who prefer to read about colleges online vs. in print materials162%
A Diverse Range of Online Resources
Percentage of high school seniors who have researched colleges through Facebook267%
Percentage of high school juniors who have clicked on a paid interactive ad from a college143%

©2016 EAB • All Rights Reserved • 32367B
34
Across Industries, Online Advertising Eclipses Traditional Media
Source: Johnson B, “Digital Marketing Strategy: Building Brand Strength & Enrollments,” 2015; EAB interviews and analysis.
The Rapid Rise of Digital Marketing
25%
12%
10% 10%
5%
Internet Newspaper Magazine Radio Outdoor
Newspapers and Billboards No Longer Dominate
Percentage of US Ad Spend by Channel in 2014Expect More Pop-Ups
8%in 2007
Online Ad Spend as Share of Total U.S. Ad Spend
34%in 2017

©2016 EAB • All Rights Reserved • 32367B
35
Digital Ads Enable Segmentation by Demographics, Location, and Behavior
Source: EAB interviews and analysis.
Entering an Era of Hypertargeting
Demographics
Adjust target audience based on age, gender, education, or income
Behavior
Present ads to particular groups of individuals based on past browsing activity
• Advertise automotive technology certificate to adult males age 17‒25
Example:
Location
Place ads in designated regions, neighborhoods, or individual buildings
• Promote branch campus programs to individuals within 50-mile radius
Example:
• Insert jazz studies ads on Facebook newsfeeds of those who list “jazz” as an interest
Example:

©2016 EAB • All Rights Reserved • 32367B
36
NCC Promotes Training to Job Seekers Located Near Sponsoring Employer
Source: EAB interviews and analysis.
Mobile Geofencing Ads
Tuition revenue earned
$8,925Click-throughsgenerated
1,700Prospects at info session
31
Precise Targeting Yields More Leads
Employer Partner
Job Centers
Mobile devices within 60 miles of local hospital received ads
Two job centers outside radius also included in campaign
A New Way to Deliver Ads
• Promoted Certified Nurse Aide program through 4-week geofencing campaign
• Partnered with advertising vendor UpSnap to serve ads on 50+ popular mobile apps and websites
High Return on a Low Investment
Geofencing: Creating a virtual barrier around a location to serve ads to devices within it
Ads served to users aged 18–45 daily from 8am–10pm
Students enrolled in training
15
Outcomes from $1,200 Ad Campaign

©2016 EAB • All Rights Reserved • 32367B
37
Brainstorming Creative Uses for Geofencing in College Marketing
Source: EAB interviews and analysis.
An Endlessly Versatile Solution
High School Athletic Events
Captive Audiences
Industry Conventions
High School Graduations
University Campuses
Large Employers
College Fairs
Downsizing Employer
Traditional-Age Students
Adult Learners
Target locations where people occupy themselves with their phones while waiting in line
Bored at the DMV?
Advertise summer or winter courses to students enrolled at local universities
Home for the Summer?

©2016 EAB • All Rights Reserved • 32367B
38
Prospects Rapidly Turning to Online Networks for College Research
Source: Hempel J, “How Facebook is Taking Over Our Lives,” Fortune, 2009; Elon University School of Communications, “Imagining the Internet,” www.elon.edu; Rogers G, “The 2015 Social Admissions Report,” Chegg, 2015; EAB interviews and analysis.
1) N=1,611 high school seniors
Social Media Too Big to Ignore
A Sudden Surge in Popularity
Facebook5 years
Internet8 years
Television38 years
Telephone89 years
Time
Users
More Than Just Selfies
Percentage of High School Seniors Using Social Media to Research Colleges1
67%
62%
48%
46%
YouTube
Time Taken to Reach to 150 Million Users

©2016 EAB • All Rights Reserved • 32367B
39
Clark Compiles Student and Alumni Stories Shared on Social Media
Source: “Penguins Fly,” Clark College, http://www.clark.edu/penguinsfly; EAB interviews and analysis.
Crowdsourced Prospect Engagement Campaign
The Campaign’s Central Hub
CLARK C
OLLEG
E.
Screenshot of Penguins Fly Landing Page
A Multi-Platform Social Media Campaign
• Current students and alumni posted about their Clark experience on Facebook, Instagram, and Twitter
• Campaign landing page used Storify, a social media aggregation tool, to display a live feed of posts from all platforms
• “Apply Now” and “Request Information” buttons on landing page encouraged prospects to take steps toward enrollment
©2016 EAB • All Rights Reserved • 32367B
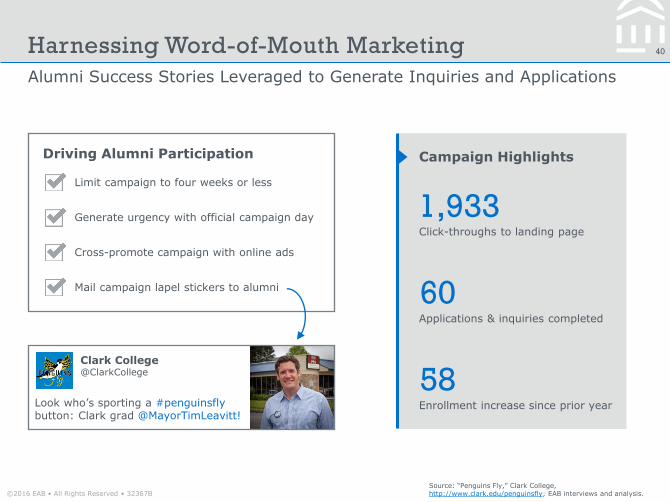
40
Alumni Success Stories Leveraged to Generate Inquiries and Applications
Harnessing Word-of-Mouth Marketing
1,933Click-throughs to landing page
60Applications & inquiries completed
Limit campaign to four weeks or less
Generate urgency with official campaign day
Cross-promote campaign with online ads
Mail campaign lapel stickers to alumni
Clark College@ClarkCollege
Look who’s sporting a #penguinsfly button: Clark grad @MayorTimLeavitt!
Driving Alumni Participation Campaign Highlights
58Enrollment increase since prior year
Source: “Penguins Fly,” Clark College, http://www.clark.edu/penguinsfly; EAB interviews and analysis.

LEGAL CAVEAT
EAB is a division of The Advisory Board Company. The Advisory Board Company has made efforts to verify the accuracy of the information it provides to members. This report relies on data obtained from many sources, however, and The Advisory Board Company cannot guarantee the accuracy of the information provided or any analysis based thereon. In addition, The Advisory Board Company is not in the business of giving legal, medical, accounting, or other professional advice, and its reports should not be construed as professional advice. In particular, members should not rely on any legal commentary in this report as a basis for action, or assume that any tactics described herein would be permitted by applicable law or appropriate for a given member’s situation. Members are advised to consult with appropriate professionals concerning legal, medical, tax, or accounting issues, before implementing any of these tactics. Neither The Advisory Board Company nor its officers, directors, trustees, employees, and agents shall be liable for any claims, liabilities, or expenses relating to (a) any errors or omissions in this report, whether caused by The Advisory Board Company or any of its employees or agents, or sources or other third parties, (b) any recommendation or graded ranking by The Advisory Board Company, or (c) failure of member and its employees and agents to abide by the terms set forth herein.
The Advisory Board Company, EAB, and Education Advisory Board are registered trademarks of The Advisory Board Company in the United States and other countries. Members are not permitted to use this trademark, or any other trademark, product name, service name, trade name, and logo of The Advisory Board Company without prior written consent of The Advisory Board Company. All other trademarks, product names, service names, trade names, and logos used within these pages are the property of their respective holders. Use of other company trademarks, product names, service names, trade names, and logos or images of the same does not necessarily constitute (a) an endorsement by such company of The Advisory Board Company and its products and services, or (b) an endorsement of the company or its products or services by The Advisory Board Company. The Advisory Board Company is not affiliated with any such company.
IMPORTANT: Please read the following.
The Advisory Board Company has prepared this report for the exclusive use of its members. Each member acknowledges and agrees that this report and the information contained herein (collectively, the “Report”) are confidential and proprietary to The Advisory Board Company. By accepting delivery of this Report, each member agrees to abide by the terms as stated herein, including the following:
1. The Advisory Board Company owns all right, title, and interest in and to this Report. Except as stated herein, no right, license, permission, or interest of any kind in this Report is intended to be given, transferred to, or acquired by a member. Each member is authorized to use this Report only to the extent expressly authorized herein.
2. Each member shall not sell, license, republish, or post online or otherwise this Report, in part or in whole. Each member shall not disseminate or permit the use of, and shall take reasonable precautions to prevent such dissemination or use of, this Report by (a) any of its employees and agents (except as stated below), or (b) any third party.
3. Each member may make this Report available solely to those of its employees and agents who (a) are registered for the workshop or membership program of which this Report is a part, (b) require access to this Report in order to learn from the information described herein, and (c) agree not to disclose this Report to other employees or agents or any third party. Each member shall use, and shall ensure that its employees and agents use, this Report for its internal use only. Each member may make a limited number of copies, solely as adequate for use by its employees and agents in accordance with the terms herein.
4. Each member shall not remove from this Report any confidential markings, copyright notices, and/or other similar indicia herein.
5. Each member is responsible for any breach of its obligations as stated herein by any of its employees or agents.
6. If a member is unwilling to abide by any of the foregoing obligations, then such member shall promptly return this Report and all copies thereof to The Advisory Board Company.

Education Advisory Board
2445 M Street NW, Washington DC 20037
P 202.266.6400 | F 202.266.5700 | eab.com