the shifting long wave - why generation wave has supplanted the k-wave for now
TRANSCRIPT

8/7/2019 The Shifting Long Wave - Why Generation Wave Has Supplanted the K-Wave For Now
http://slidepdf.com/reader/full/the-shifting-long-wave-why-generation-wave-has-supplanted-the-k-wave-for 1/20
Technology cycles that bring clus-ters of radical new technologiesthat change our communication,transportation and energy infra-structures—and ultimately bringnew business models and con-sumer lifestyles—have been thekey driver of rising standards of living throughout history alongwith broader rises in populationand demographic trends. Thesetechnology cycles increasingly have been influenced and driven
by rising demographic cycles of more affluent citizens with muchgreater impacts on the economy than in feudal eras of the pastwhen a few garnered most of thegains. New generations of younger,more innovative new workers andentrepreneurs first bring new tech-nologies as they first enter theworkforce and then move into theirpeak income and spending cycleswherein they progressively adoptsuch new technologies into the
mainstream economy. We coveredthis topic in Chapter 2 of our newbook, The Great Depression Ahead,
but will elaborate more in this spe-cial report.
A major change in economic cycleshas occurred over the last century,as the mass production revolutionof the early 1900s has shifted thepower of income, spending, andinnovation to much broader seg-ments of our society and economy,especially from the 1940s onward.The massive baby boom since themid-1930s and the industrializa-tion increasingly of billions of peo-ple in Asia have created an acceler-ated economic trend of inflation,growth, technological progress,and globalization — as occurred inpast population surges in history.Demographics have driven the
economy into hyper growth anhyper innovation. Hence, the tecnology and inflation cycle we anow in will continue to be modramatic and extended than tcycles economists have studiover the last 200 years. This cycof hyper growth will peak in moof the Western world by 2010 anglobally by around 2065 by demgraphic projections based ofalling birth rates and rising lexpectancies around the world,
we covered in Chapter 6 of the nebook.
New, mass-affluent generationow are having a much greatimpact on innovation, technolgy adoption cycles, econombooms, and inflation than in thpast. That situation changeconomic forecasting in a bway, making long-term cyclmore predictable, even in faster changing and more com
plex economy. The biggeinsight is that the New EconomCycle has been stretched fro58 to 60 years to around 8years since the GreDepression. This seems to occwith larger and more powerfgenerations in a RevolutionaCycle about every 250 yearThe last such cycle occurraround the American anIndustrial Revolutions in thmid to late 1700s. The previoone occurred in the early 150with the Protestant anCapitalist Revolutions.
Economic cycles have been shiftidramatically in the last centufrom a 58- to 60-year basic innovtion or technology cycle, TKondratieff Wave, to a more domnant 80- to 84-year GeneratiWave Cycle. This shift has grea
© Copyright 2008, HS Dent Publishing
The Shifting Long WaveWhy the Generation Wave Has Supplanted
the Kondratieff Wave...for Now
Basic Cycles in Technology Innovation -- Historically Every 60 Years or So
The Apparent Failure of the K-Wave: ABubble Boom Instead of a Deflationary
Bust in the 1990s
The Kondratieff Wave Explained inSimple Terms
The Spring Season
The Summer Season
The Autumn Season
The Winter Season
The Kondratieff Wave and Stock Cycles
The Demographic Supercharger
The Great Chicken and Egg Argument:Supply vs. Demand Economics
The Rise of U.S. Leadership inTechnology and Innovation
The Rise of Mass Affluence andInfluence
The Generation Wave Explained inSimple Terms
The Rise of the 80-Year Generation-Driven New Economy Cycle
The Innovation Season
The Growth Boom Season
The Shakeout Season
The Maturity Boom
The Last Generation Wave Cycle
The Next New Economy Cycle
2
3
3
4
4
5
5
5
6
10
11
13
14
15
16
16
17
17
17
20
Table of Contents
Special Report
Harry S. Dent, Jr.Author of
The Great Depression Ahead
The Next Great Bubble BoomThe Roaring 2000s
The Great Boom Ahead
HS Dent Publishing

8/7/2019 The Shifting Long Wave - Why Generation Wave Has Supplanted the K-Wave For Now
http://slidepdf.com/reader/full/the-shifting-long-wave-why-generation-wave-has-supplanted-the-k-wave-for 2/20
altered the patterns of our econo-my both in spending and innova-tion trends, and is the greatest rea-son why so many respected fore-casters were wrong about theirprediction for a great depression
for the 1990s, while we were cor-rect in predicting the opposite: oneof the greatest booms in history.But after 2009, this GenerationWave-based New Economy Cycle isset to peak in its Growth BoomSeason and finally move into theShakeout Season or deflationary depression in the 2010s.
Basic Cycles inTechnology Innovation
— Historically Every60 Years or So
Very broad innovations in tech-nologies that change our infra-structures in energy, transporta-tion, and communication haveemerged nearly every 60 yearssince we could more accurately measure them back to the late1700s (Chart 1). Out of this cyclecame the Kondratieff Wave (K-
wave) theory of new technology emergence, which clearly dominat-ed in the 1800s and early 1900s,and is very likely to have dominat-ed for a long time before that.Inflation cycles in a more commod-
ity dominated economy largely have been shown to follow andeven define these technology cyclesand the stages or seasons they proceed through due to rising andfalling investment, consumption,
and productivity rates.
But as broadly accurate as thatcycle was until the early 1900s, weare going to show that we havebeen in the process of shifting tothe increasing dominance of a newGeneration Wave (G-wave) Cycle.Every other generation (or aboutevery 80 to 84 years) new individu-alistic generations bring radical,broader-based consumer indus-tries and lifestyles that drive new
industries and new work/businessmodels. These models create neweconomies, which generate risingproductivity and standards of liv-ing for decades to come—just asthe K-wave did in the past. Thenext, more conformist generationrefines those technologies, indus-tries, and business models andmoves them fully mainstream aswe will cover more at the end of this Appendix.
This shift has occurred as broaderlevels of consumers and workershave advanced to much higher lev-els of income and influence in thenew mass production and now
information-driven economy thhas emerged powerfully in the lacentury, driven by accelerated poulation growth and urbanizatioThis new impact began initiawith the immigrant-driven Hen
Ford Generation in the early 190in the US, but emerged more fuwith the first mass, middle-clasociety of the Bob Hope Generatiwhich dominated our economwith their rising spending and prductivity wave from 1942 to 196
However, the stages of both tolder K-wave Cycle and the new wave Cycle follow the same foustage life-cycle progression of prductivity and inflation trends, tw
booms, and two busts, as do product and technology life cyclthroughout history, which makthem both more predictabDemographic cycles of earninspending, borrowing, and invesment in many areas of our econmy create even greater levels forecasting and cycle changeDespite the increasing dominanof the new G-wave Cycles in tecnology, spending and productivitthe old K-wave Cycle is still effect, so we need to understanboth to predict future trends moaccurately – especially as they hapen to move more in alignmeagain in the decades ahead.
Basic technological industries ancommodity prices like oil follow tK-wave Cycles to a greater degrin modulations of approximate 3to 60-year cycles. Other majomore consumer-oriented techno
gy applications, such automobileelectrical appliances, radio, Tand now the Internet, homPCs/portable computers, wirelesand broadband, follow both the wave and the 40- to 80-year wave cycles that revolve arounnew generations and neeconomies. Broader new consumindustries and leaders, from WaMart to Starbucks to Dell Charles Schwab, clearly follow tG-wave Cycles.
© Copyright 2008, HS Dent Publishing
2
Chart 1
Cycles in Basic Innovation
Source: Gerhard Mensch

8/7/2019 The Shifting Long Wave - Why Generation Wave Has Supplanted the K-Wave For Now
http://slidepdf.com/reader/full/the-shifting-long-wave-why-generation-wave-has-supplanted-the-k-wave-for 3/20
We are trying to explain why atheory, the Kondratieff Wave,that worked well for more than acentury suddenly fell out of favor and gave wrong forecastsfrom the 1990s on in the econo-
my. This happened not becausethe theory was wrong or invalidbut because our economy andlives have changed so much inthe last century and an equallyvalid Generation Cycle started todominate. This shift coincideswith our 250-year RevolutionaryCycle, wherein larger new gener-ations stretch the New EconomyCycle due to their strongerdemographic force and longer40-year cycles.
Best-selling authors and econo-mists that have been following theKondratieff Wave Cycle, from RaviBhatra to James Dale Davidson toRobert Prechter, have made pre-mature forecasts—especially sincethe late 1980s, during which they expected the U.S. to enter a long-term deflationary bear market, or“winter” season. But these fore-casters understand long term eco-nomic cycles much better than
most economists who have no clueof clock-like longer term cyclesthat are so critical to our economy.The reason that those forecastshave been so off is that such tech-nology cycles have increasingly “stretched” into an approximate80-year G-wave Cycle driven moreby the radical innovation, spend-ing, and adoption cycles of newindividualistic generations thatcome every 80 to 84 years. Thisgeneration cycle has been docu-mented in great academic and his-torical depth by Neil Howe andWilliam Strauss in many books,starting with Generations in 1984,as well as in our books, startingwith The Great Boom Ahead in1992.
The Apparent Failureof the K-Wave: A
Bubble Boom Insteadof a Deflationary Bust
in the 1990sI first started analyzing economiccycles, focusing on the Kondratieff Wave, in my studies at college andgraduate school in the mid to late1970s. The K-wave was the bestexplanation for economic cycles Icould find since JosephSchumpeter’s breakthroughinsights about cycles of “creativedestruction,” wherein radical newtechnologies replace older tech-
nologies and create new long-termproductivity cycles that drive high-er standards of living throughouthistory. The K-Wave Cycle wouldhave predicted that inflation ratesand price levels would peak in themid- to late 1970s and lead to adisinflation cycle. That cycle wouldshow a final boom in the 1980sthat would lead to a brutal down-turn and depression/deflationcycle from the 1990s into the early 2000s—just as Ravi Bhatra,
Robert Prechter, James DaleDavidson, and many others werepredicting in the late 1980s.
Our new research into genera-tion cycles of spending, innova-tion, and productivity in the midto late 1980s suggested stronglythat this boom was going toaccelerate dramatically and thatwe were not going to enter adeflationary phase and depres-sion in the 1990s, despite themilder slowdown in the early1990s, which we also predictedand which seemed to corrobo-rate the K-wave Cycle at first.
Our predictions in the late 1980sand early 1990s were that we wereabout to continue into the greatestboom in history, with furtherdeclines in inflation rather than
deflation, and that the huge U.government deficits of the ear1990s would disappear into supluses between 1998 and 200while Japan continued to decliagainst worldwide trends. That s
uation would be good for the stomarket and economy in the 199and into this decade, as BaBoomers continued to spend moand the next technology revolutimoved mainstream! After the craof 2000-2002, most economisand investors naturally assumthat the great boom was over, juas many did after the crash 1987. However, our research sugested another bubble ahebefore an overall long-term pe
around 2009.
How do we reconcile these two prdictable cycles, which follow simlar phases in innovation, growboom, shake-out, and maturboom—and then plateau andecline while the next technologcal or economic cycle is emergin
The Kondratieff Wave
Explained in SimpleTerms
We have to start with TKondratieff Wave Cycle and its hitory, as that was the best preditive cycle prior to the 1940s Chart A.1. This K-Wave theory woriginated by Nikolai Kondratiewho was born in Russia in 18and died in 1938. He studied infltion and technological cycle
which he increasingly documentfrom the late 1700s forward. Hfound cycles of inflation and prilevels that proceeded through fostages: spring, summer, autumand winter. These stages ultimatly were driven by basic innovatioin new technologies, which eventally brought higher productivand lower prices as they movinto critical mass and higher pen
3
© Copyright 2008, HS Dent Publishing

8/7/2019 The Shifting Long Wave - Why Generation Wave Has Supplanted the K-Wave For Now
http://slidepdf.com/reader/full/the-shifting-long-wave-why-generation-wave-has-supplanted-the-k-wave-for 4/20
tration into the economy butbrought inflation and shortages intheir earlier stages.
Like Isaac Newton, Kondratieff observed a rather clock-like cycle,
in which wholesale and commodity prices of goods rose for a period of time—when old technologies werematuring and slowing in produc-tivity—and when new technologieswere first emerging rapidly. Pricesfell with higher productivity ratesand rising supply, as the new tech-nologies increasingly becameaffordable to the mainstream anddominant. Eventually, the newtechnologies would over expand ina bubble boom, creating excess
supply and resulting in deflation inprices. This occurrence ushered ina long cycle of consolidation withinolder industries, during which newtechnologies were first innovatedand would begin to emerge again,slowly at first and extending olderindustries before creating largenew ones for decades to come.Chart 2 shows this Kondratieff Wave Cycle in its most basic out-line, around rising and falling pricelevels or inflationary cycles.
The 58- to 60-year Kondratieff Wave Cycle can more simply beseen as two 29- to 30-yearCommodity Cycles, the firstmore recessive and the secondmore dominant. The first repre-
sents a secondary or more minorpeak in inflation that follows adeflationary “winter” season andoccurs into a “spring” boom.The second represents a primaryor “summer” peak and leads to amore bubble-like autumn boomdue to falling inflation and inter-est rates that leverage asset val-ues just as the new technologiesfirst become dominant and ubiq-uitous. The bursting of that bub-ble leads to a deflationary “win-
ter” cycle and bubble bust again.Primary commodity and infla-tion peaks include 1864, 1920,and 1980. Secondary peaksinclude 1834, 1891, and 1951,and another secondary peak ispredicted for late 2009/early2010. The next primary peakshould occur around 2039/2040.
The Spring Season
To understand this cycle, compareinflation to temperatures in sea-
sonal/climatic cycles. When infltion is first rising after a falliwinter or deflation cycle, things aheating up again. New technologiare emerging into the economy, “blossoming” after their inventi
or incubation stage in the last witer season that occurs followithe decline, or broad shake-out, the last technological growth cycGrowth and demand are risifrom the new technology cycwhich first and foremost extenthe applications of older, maturitechnologies.
Supply lags behind growindemand at first, as it takes timand investments to ramp up t
new technologies and industrieFurthermore, waning productivfrom the larger, older industritrumps the rising productivity the smaller, new emerging indutries. Hence, a new boom appeafrom the ashes of the last grebust and depression or winteThat is spring and corresponds the Maturity Boom Season of o80-Year New Economy Cycle or wave. Inflation rises more substatially initially, and the first com
modity cycle (secondary peak) toout early on in this boom as thproductivity of the new technolgies as they emerge initially inthe mainstream (on an S-curpattern, as we showed in Chapt2) lowers commodity prices aninflation rates. That is the trend this season—a boom with modesly rising inflation. The new indutries of the future are just emering, while the older industries afully maturing.
The Summer Season
Truly radical offshoots of the netechnologies emerge in this staand require massive investment fexpansion by many new grow
4
© Copyright 2008, HS Dent Publishing
Chart 2
The Basic Kondratieff Cycle1800-1975
Source: The Media General Financial Weekly, August 1972
8/7/2019 The Shifting Long Wave - Why Generation Wave Has Supplanted the K-Wave For Now
http://slidepdf.com/reader/full/the-shifting-long-wave-why-generation-wave-has-supplanted-the-k-wave-for 5/20
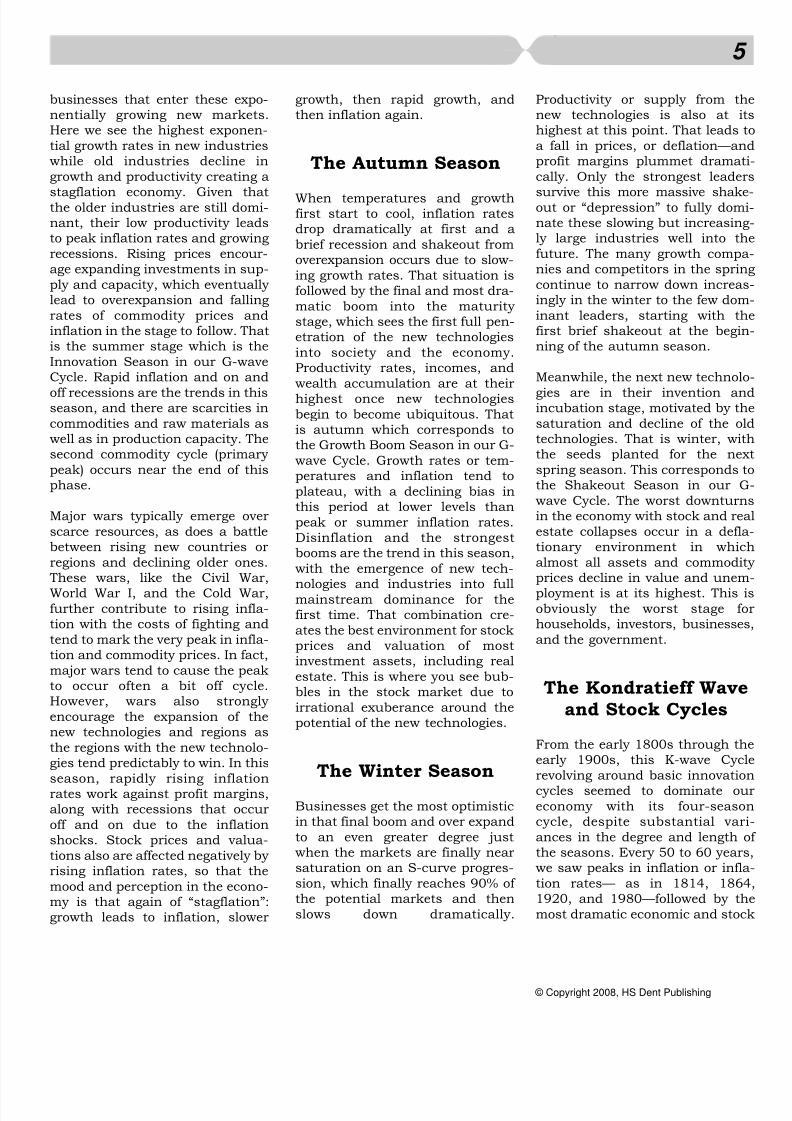
businesses that enter these expo-nentially growing new markets.Here we see the highest exponen-tial growth rates in new industrieswhile old industries decline ingrowth and productivity creating a
stagflation economy. Given thatthe older industries are still domi-nant, their low productivity leadsto peak inflation rates and growingrecessions. Rising prices encour-age expanding investments in sup-ply and capacity, which eventually lead to overexpansion and fallingrates of commodity prices andinflation in the stage to follow. Thatis the summer stage which is theInnovation Season in our G-waveCycle. Rapid inflation and on and
off recessions are the trends in thisseason, and there are scarcities incommodities and raw materials aswell as in production capacity. Thesecond commodity cycle (primary peak) occurs near the end of thisphase.
Major wars typically emerge overscarce resources, as does a battlebetween rising new countries orregions and declining older ones.These wars, like the Civil War,
World War I, and the Cold War,further contribute to rising infla-tion with the costs of fighting andtend to mark the very peak in infla-tion and commodity prices. In fact,major wars tend to cause the peakto occur often a bit off cycle.However, wars also strongly encourage the expansion of thenew technologies and regions asthe regions with the new technolo-gies tend predictably to win. In thisseason, rapidly rising inflationrates work against profit margins,along with recessions that occuroff and on due to the inflationshocks. Stock prices and valua-tions also are affected negatively by rising inflation rates, so that themood and perception in the econo-my is that again of “stagflation”:growth leads to inflation, slower
growth, then rapid growth, andthen inflation again.
The Autumn Season
When temperatures and growthfirst start to cool, inflation ratesdrop dramatically at first and abrief recession and shakeout fromoverexpansion occurs due to slow-ing growth rates. That situation isfollowed by the final and most dra-matic boom into the maturity stage, which sees the first full pen-etration of the new technologiesinto society and the economy.Productivity rates, incomes, andwealth accumulation are at theirhighest once new technologiesbegin to become ubiquitous. Thatis autumn which corresponds tothe Growth Boom Season in our G-wave Cycle. Growth rates or tem-peratures and inflation tend toplateau, with a declining bias inthis period at lower levels thanpeak or summer inflation rates.Disinflation and the strongestbooms are the trend in this season,with the emergence of new tech-
nologies and industries into fullmainstream dominance for thefirst time. That combination cre-ates the best environment for stockprices and valuation of mostinvestment assets, including realestate. This is where you see bub-bles in the stock market due toirrational exuberance around thepotential of the new technologies.
The Winter Season
Businesses get the most optimisticin that final boom and over expandto an even greater degree justwhen the markets are finally nearsaturation on an S-curve progres-sion, which finally reaches 90% of the potential markets and thenslows down dramatically.
Productivity or supply from tnew technologies is also at highest at this point. That leads a fall in prices, or deflation—anprofit margins plummet dramacally. Only the strongest leade
survive this more massive shakout or “depression” to fully domnate these slowing but increasinly large industries well into tfuture. The many growth compnies and competitors in the spricontinue to narrow down increaingly in the winter to the few dominant leaders, starting with tfirst brief shakeout at the begining of the autumn season.
Meanwhile, the next new technol
gies are in their invention anincubation stage, motivated by tsaturation and decline of the otechnologies. That is winter, withe seeds planted for the nespring season. This corresponds the Shakeout Season in our wave Cycle. The worst downturin the economy with stock and reestate collapses occur in a defltionary environment in whialmost all assets and commodprices decline in value and unem
ployment is at its highest. This obviously the worst stage fhouseholds, investors, businesseand the government.
The Kondratieff Waveand Stock Cycles
From the early 1800s through tearly 1900s, this K-wave Cycrevolving around basic innovati
cycles seemed to dominate oeconomy with its four-seasocycle, despite substantial vaances in the degree and length the seasons. Every 50 to 60 yearwe saw peaks in inflation or infltion rates— as in 1814, 1861920, and 1980—followed by tmost dramatic economic and sto
5
© Copyright 2008, HS Dent Publishing

8/7/2019 The Shifting Long Wave - Why Generation Wave Has Supplanted the K-Wave For Now
http://slidepdf.com/reader/full/the-shifting-long-wave-why-generation-wave-has-supplanted-the-k-wave-for 6/20
booms and bubbles into theautumn season, which lead to theworst periods of deflation, contrac-tion, shakeouts, and consolida-tions in business and the economy in the winter season. Then, new
technologies and growth industriesemerge again and create the nextrising inflation and expansioncycle, which follows in four stagesof alternating booms and busts, inphases of mild inflation (springboom), rapid inflation (mild sum-mer bust), disinflation (strongestautumn boom), and deflation(greatest winter bust).
Chart 3 shows how the stock mar-ket has correlated with past
Kondratieff and inflation cyclesinto the early 1900s. Note that thestock market tends to boom whenprice levels are more stable orwhen supply and demand are morein balance and that stronger infla-tion and deflation periods lead todownturns and stock declines.Major inflation peaks occurred in1814, 1864, 1920 and 1980, withwars ending just before or at thepeaks. The War of 1812 was aminor war and likely caused that
first cycle to peak late as the peakof inflation would have been moreexpected around 1804. Otherwise,
these peaks come very close toevery 58 – 60 years. The worstdeclines come in the winter ordeflationary cycles. The strongeststock booms and bubbles occur inthe autumn season following the
summer, after the first secondary recession or brief shakeout, andduring the time that new technolo-gies first move fully into the main-stream economy. These autumnbooms, like 1816-1835, 1864-1873, and 1921-1929, see disinfla-tion or falling interest rates, whichleverage stock and real estate val-ues. Strong productivity from thenew technologies moving main-stream also creates these “bubblebooms,” with strongly rising earn-
ings, productivity, and economicgrowth.
We are in the most extendedautumn or bubble boom in mod-ern history, according to theKondratieff Wave, from 1983 toaround 2009, following the mostextended spring boom from 1942to 1968. That autumn seasonneeds some major explaining,and only the new G-wave Cyclecan explain it, by means of
extended Spending Wave Cyclesfor the last two mass affluentgenerations!
Note that, starting in 1949, ChaA.3 uses commodity prices insteof the broader Producer Price Wholesale Price IndeFurthermore, since then, commoity prices have continued to pea
in near 30-year cycles with moprimary peaks in near 60-yecycles. The secondary peak aftthe primary peak in 1920 occurrin 1951 (31 years later), and thnext primary peak was in 1980 (years later). However the broadProducer Price (PPI) and ConsumPrice (CPI) indices have kept goinup from 1933 to the present, andwill likely be 2010 before pricdecline into the next deflationacycle, which we are predicting to
between 2010 and 2023 or sgiven declining Baby Boom spening and dramatic slowing of tworkforce due to Baby Boomretirement in the next two decade
The reason for that switch was thbroader inflation measures like tPPI and the CPI have related moto G-wave Cycles that concentraed in higher value added producand services with lower and lowcommodity content. Hence, th
started to diverge from the K-wapatterns, whereas commodiprices, which are more related basic innovation and technolocycles, are still following the wave. The broader PPI and Cprice levels are reflecting the risispecialization of labor, which raes the costs of goods beyond mecommodity prices in a new demgraphic-driven, hyper-growth tecnological and inflationary cycle.
The DemographicSupercharger
The dramatic Baby BooGeneration here and around tworld has shifted our economy ina new pattern of higher growt
6
© Copyright 2008, HS Dent Publishing
Chart 3
Kondratieff and Stock MarketCycles since 1789
Source: Ian Gordon-The Long Wave Analyst

8/7/2019 The Shifting Long Wave - Why Generation Wave Has Supplanted the K-Wave For Now
http://slidepdf.com/reader/full/the-shifting-long-wave-why-generation-wave-has-supplanted-the-k-wave-for 7/20
inflation, and innovation since the1930s. Chart 4 shows inflationtrends over the last 1,000 yearsand brings two important insightsinto economic cycles. First, wehave seen extended periods of
accelerated demographic growthand inflation with economicprogress to follow in the past: fromaround AD 960 to 1220, and fromaround AD 1440 to 1650. Theseperiods also followed major tech-nological innovations, like theheavy plough, three-field rotation,and the stirrup in the mid to late900s; and the printing press, gun-powder, and tall sailing ships inthe mid to late 1400s, also as wediscussed in Chapter 3. There is
an approximate 500-year cycle of macro innovation at work herethat included the computer, DNA,the A-bomb, TV, the jet engine,and radar invented in the 1940sand early 1950s—following theprinting press by about 500 years.Since the mid 1890s and the mid1930s, inflationary trends havebeen accelerating again, as in pastperiods of macro innovation andsurging population growth.
We can also see evidence of the250-year Revolutionary Cycle wediscussed in Chapter 3, with therising inflationary trends in thesecond half of the last 500-yearcycle, in the mid to late 1700s,that launched the American andIndustrial Revolutions. That risinginflation cycle strongly suggests alarger generation, like the Baby Boom of today, coming along andstretching innovation, growth, and
institutional change as they age.And, in fact, long-term populationgrowth did start to accelerate inthe 1700s. So, it does seem thatevery 250 years we get larger gen-erations that exaggerate the demo-graphic trends and stretch themore typical 58- to 60-yearKondratieff Cycles around two 40-year Generation Waves to anapproximate 80-year New
Economy Cycle, as we are witness-ing today.
From the perspective of this250-year Revolutionary Cycle,the Kondratieff Wave did not dis-appear, it just got “stretched” orsupplanted temporarily by an80-year Generation Wave Cycleconsisting of two 40-yearSpending Wave Cycles, insteadof the more typical two 29- to
30-year Commodity Cycles. Thisnew, stretched cycle follows thesame four-stage life cycle andpattern of the past. Our globaldemographic trends suggest thatwe will turn back toward the pre-vious and more consistent 60-year cycle in the future, as birthand generational cycles slowagain and become less dominantand the global demographictrends in rising Asia shift the G-wave internationally. Hence, the
Kondratieff Wave still lives!
The second insight is that inflationis not a negative trend to be “avoid-ed at all costs,” as most econo-mists see it. In the long term, infla-tion correlates clearly with our ris-ing standard of living and, in fact,finances growth in productivity for
decades into the future. There wa dramatic boom from Greek scence into the Roman Empire thcaused rising inflation and ecnomic growth for over 1,000 yearSince the Dark Ages of deflatioand economic contraction froaround AD 450 to 950, we haseen a dramatic boom with risininflation for over 1,000 years.
Inflation is simply the econ
my’s means of financing negenerations, technologies, aninfrastructures, which evolvinto new business models aneconomies with greater speciaization of labor and higher stadards of living. These netrends require high investmenat first, which pay off in highproductivity on a two- to thredecade lag historically.
Larger populations, technologicadvances, and new infrastructurfor communication, transporttion, energy, and production, allolarger and more sophisticatorganizational systems, which turn allow greater specialization labor and trade. This trend firstarted when hunting and gatheing bands first settled into smatowns and growing cities in th
7
© Copyright 2008, HS Dent Publishing
Chart 4
1000
Consumer Prices in Britain 950–1985
C o m m e r c i a l
Revolut ion
Capi ta l is tR e v o l u t i o n
Informat ionRevolut ion
Consumer Prices
12 00 1 40 0 1 60 0 1 80 0 20 00
4 0 0 0
1 0 0 0
2 0 0
5 0
Inflation in Great Britain over 1000 Years
Source: E.H. Phelps Brown & Sheila V. Hopkins

8/7/2019 The Shifting Long Wave - Why Generation Wave Has Supplanted the K-Wave For Now
http://slidepdf.com/reader/full/the-shifting-long-wave-why-generation-wave-has-supplanted-the-k-wave-for 8/20
specialization. Inflation financesnew technologies and infrastruc-tures before they start to pay off inhigher productivity and tax rev-enues. The truth is that inflation isthe best long term leading indica-
tor of economic progress! We feelthe pain of it at first through risingprices that go to finance newinvestments (forced savings),which aren’t offset with risingincomes to the same degree atfirst. On a near 30-year lag today,we do get the benefits—big time!Inflation will be at its highest whena new generation is just enteringthe workforce, around age 20.5today, and then productivity,income, and spending will be at its
highest around age 48 today..
In our past books and in Chapter 2of The Great Depression Ahead , wehave shown more conclusively howinflation correlates with workforceentry and how the economy andstock market correlate with a lag inbirths for the peak in spending of the average household. Into the1970s, the Baby Boom caused thehighest sustained inflation rates inhundreds of years. Now we are pre-
dicting that this unprecedentedbubble boom will peak around2010, 30 years after the peak of inflation rates in 1980 and 48 to
49 years after the peak of the baboom birth cycle in 1961.
Economists looking for our preent inflation, technology, anboom cycles to be similar
cycles of the past 200 years cotinue to be shocked by bomore extreme and more extened cycles in inflation and ecnomic growth. Acceleratedemographic trends and maaffluence are the cause—antheir impacts can be documened and projected forward. Thistypical of the early stages of th500-year Mega Innovation Cyclwhich occurred in the la1400s/1500s as well. Wh
should be expected in the netwo decades on the 250-yeRevolutionary Cycle is a sociapolitical, and business revoltion similar to the American anIndustrial Revolution, and thProtestant and Capitalist revoltions of the early 1500s, wherin people in developed anemerging countries demanhigher levels of rights, freedomand input into the system at alevels from the workplace to po
itics.
Chart 5 demonstrates this pardox of strongly rising productiviin an era of dramatically risiinflation. It shows rising GDP pcapita in the U.S. since 190which is the best indicator of orising standard of living—and tresults are impressive. Despdramatically rising inflation leveespecially since the early 1930our standard of living has beincreasing steadily and dramacally due to increasing specializtion of labor and rising incomeAgain, we pay more as we delegatasks to others, but we can affomore due to our rising incomfrom specialization and highevalue-added jobs. This is also oof the central principles of managment – delegation.
8
Agricultural Age starting around10,000 years ago in towns likeJericho. When we as workers moveinto larger, more urban areas andspecialize more, we become moreproductive and earn more. Old jobs
like hunting and farming arereplaced by factory jobs, then cler-ical jobs, and then professionaland managerial jobs, whichincreasingly are more specialized.However, as we add more special-ists to the chain of production of goods and services, the prices goup, because we delegate moretasks to middlemen and produceless of those products directly our-selves. Hence, the costs of mostgoods rise, but incomes through
expanding productivity rise evenhigher. That’s how inflation andrising productivity go hand andhand— but again, on a lag – that’swhy most economists and peoplemiss this correlation, just likebirths and rising spending 40 to 50years later.
Inflation finances the cost of rais-ing young people and incorporat-ing them into the workforce beforethey become productive workers
and high-spending consumers.Inflation finances wars that free upcountries to grow or create largerempires and markets for trade and
© Copyright 2008, HS Dent Publishing
Chart 5
1000
10000
100000
1900
1910
1920
1930
1940
1950
1960
1970
1980
1990
2000
2010
2020
2030
2040
2050
2060
$100,000
US Real GDPper Capita1900-2050
Source: The First Measured Century, by Caplow, Hicks, and Wattenberg

8/7/2019 The Shifting Long Wave - Why Generation Wave Has Supplanted the K-Wave For Now
http://slidepdf.com/reader/full/the-shifting-long-wave-why-generation-wave-has-supplanted-the-k-wave-for 9/20
What has really occurred heresince the 1930s was that the G-wave was increasingly dominatingand affecting broader price trendsthrough workforce growth (exag-gerated by the baby boom into the
1970s), which is inflationary atfirst with the high costs of raisingand incorporating new workers,followed by rising labor productivi-ty into this decade, which leads todisinflation on a lag for peak pro-ductivity rates (peaking in the midto late 40s age ranges today) in anincreasingly affluent, middle classeconomy. In 1989, we generated anew inflation indicator that corre-lates (outside of major war periods)with rising and slowing workforce
growth on a 2.5-year lag in Chart6. This indicator explains why general inflation rates rose to suchextreme rates into 1980 and havedeclined despite a booming econo-my since 1983. A projection of workforce growth would forecast adeflation in prices, as the Baby Boomers retire faster than theEcho Boom Generation enters theworkforce into 2023, after a minorrise in inflation from 2006 into2009.
Commodity prices correlate morewith the most basic industries, inline with the K-wave Cycle andemerging countries, which arefocused more on those industries.The biggest reason, which has hadonly a minor effect on broaderprice levels, is that commodity prices have become a much small-er percentage of our economy since1900 as we show in Chart 7.Commodities as a percentage of GDP have fallen from just over20% in 1904 to near 5% today. Oilin 2008 as high as $147 a barrelhad only a minor impact on infla-tion, the economy, and stockprices—as opposed to $40 priceshaving a more substantial impactin the late 1970s—and commodity price indices would have had a
much more major impact as we goback further in history.
Whereas new technologies definite-ly reduce the price of commoditiesand inputs, including semiconduc-tor chips and DRAMs today, newconsumer industries like softwareand the Internet tend to raise thelevel of quality, service, and con-venience, which consumers receiveat the same level of output andwhich are more affected by the
labor productivity of larger pecentages of clerical, technical, prfessional, and service workers.
We would suggest that PPI anCPI inflation rates would lower today if they were moaccurately adjusted for qualitcustomization, and convenien— intangible values that aharder to measure in economstatistics.
9
© Copyright 2008, HS Dent Publishing
Chart 6
0.00%
0.50%
1.00%
1.50%
2.00%
2.50%
3.00%
3.50%
4.00%
Apr-53
Apr-55
Apr-57
Apr-59
Apr-61
Apr-63
Apr-65
Apr-67
Apr-69
Apr-71
Apr-73
Apr-75
Apr-77
Apr-79
Apr-81
Apr-83
Apr-85
Apr-87
Apr-89
Apr-91
Apr-93
Apr-95
Apr-97
Apr-99
Apr-01
Apr-03
Apr-05
Apr-07
Apr-09
-2.00%
0.00%
2.00%
4.00%
6.00%
8.00%
10.00%
12.00%
14.00%
16.00%INFLAT ION (CPI)
LABOR FORCE
GROWTH
2.5-YR LAG
Inflation Indicator
Source: Bureau of Labor Statistics and Census Bureau
Chart 7
0.00%
5.00%
10.00%
15.00%
20.00%
25.00%
1900 1910 1920 1930 1940 1950 1960
Consumption of Raw Materials as a % of GDP(in constant 1967 dollars)
Source: US Bureau of the Census, 1975, Series S 15-24, pp. 818-819

8/7/2019 The Shifting Long Wave - Why Generation Wave Has Supplanted the K-Wave For Now
http://slidepdf.com/reader/full/the-shifting-long-wave-why-generation-wave-has-supplanted-the-k-wave-for 10/20
The Great Chicken andEgg Argument: Supplyvs. Demand Economics
Now we will look briefly at the
alternating cycles of demand andsupply that new technology anddemographic cycles naturally cre-ate. These cycles, in turn, linkinflation cycles to the K-wave andthe emerging G-wave cycles, whichincreasingly dominate our econo-my. We all are familiar with thesupply side vs. demand-sidedebates in economics and politics.
According to the supply side (or asmore Republican economists say),
lowering taxes and encouraginginvestment will create new innova-tion, industries, and technologies,which will lead to higher productiv-ity, job growth, and wage gains.Encouraging saving and invest-ment first rather than consump-tion or welfare will have the long-term effect of higher incomes,wealth, and consumption: a risingtide will raise all boats. Risingwealth and incomes will createhigher tax revenues for the govern-ment down the road to pay for theinitial loss in tax revenues tofinance the supply-side strategy.
Hence, the whole system willexpand and be better off long term.
The demand-side or Democraticmodel says that the affluent con-sumer and business sectors of our
economy already naturally do well.The problem in our economy isthat earners of lower wages do notshare to the same degree in oureconomy, which is unfair. If yougive these people benefits, educa-tion, and welfare to stimulate theirdemand, that rising demand willcause spending to grow muchfaster than if you let businessesand affluent people earn more inthe free market economy. Why?They save or reinvest more and
spend a smaller percentage of theirincomes or profits – and a society with greater equality is a happierand more peaceful one.
John Maynard Keynes becamefamous from the 1930s on foradding the liberal premise thatgovernments can stimulate theeconomy out of a downturn andiron out economic cycles by lower-ing interest rates and initiatinggovernment spending and work
programs that would stimulatedemand in downturns or, con-versely, raise interest rates in
strong upturns to curb excessethat is the primary role of tFederal Reserve today. TPharaohs in ancient Egypt weknown for building pyramids aninfrastructures in down agricultu
al cycles to utilize excess labor.
The truth is that technology, geeration, and economic cyclalready naturally stimulademand and supply in alternaticycles that have a clear logic anthat work better than governmeplanning either on the supply the demand side. It is not tchicken or the egg—it is bosimultaneously! They respond each other in dualistic cycles an
are often out of phase with eaother, which creates cycles in infltion (when demand exceeds suply), moderate prices and booperiods (when demand and suppare more in balance), and deflatiand bust (when supply exceedemand).
Chart 8 shows theoretically hocycles in demand and supply folow each other on a lag, reactingeach other in a dynamic equilib
um—like a sailor tacking into twinds and trying to adjust and stay on schedule to his destinatiahead. You can argue that suppleads demand or demand leasupply, but they simultaneouslead and lag each other. Only alternate cycles do they come inequilibrium or increasing balanof supply and demand, and thatwhen the economy feels most track and prosperous. These altenating cycles create spring, summer, autumn, and winter season
New technologies create new proucts that consumers will hademand for and new jobs to prduce greater income and produtivity. However, rising demanfrom demographic growth in neconsumers and new generatio
10
© Copyright 2008, HS Dent Publishing
Chart 8
Supply / Demand Cycles andChanging Seasons
Source: HS Dent Foundation

8/7/2019 The Shifting Long Wave - Why Generation Wave Has Supplanted the K-Wave For Now
http://slidepdf.com/reader/full/the-shifting-long-wave-why-generation-wave-has-supplanted-the-k-wave-for 11/20
entering their peak productivity and spending years also createsthe need for rising innovation andcapacity expansions from busi-nesses. The innovations from theyounger age ranges of new genera-
tions also naturally lead to risingdemand as the generations growup and have higher incomes toadopt those technologies.
We simply have an ongoing cycle of supply and demand, as is con-veyed in Chart A.8, and the chick-en-and-egg argument is not really relevant except for one overridingprinciple from our research:Demographic trends drive innova-tion when we are younger, creating
new potential demand vs. tightersupply at first and then greatersupply as we age and become moreproductive. But demographicgrowth also drives basic demandand needs from rising populationand incomes as we age, up to apoint—around age 46 to 50today—or age 48 on average. Then,aging generations and populationssave more and create investmentcapital for the next generation touse for the innovation of new tech-nologies and industries for growthagain. The U.S. has both had thelargest Baby Boom Generation inthe Western world and the politicaland financial structures that havesupported the strongest innovationover the last 200 years, and that iswhy we lead the world today!
Excess demand in one cycle cre-ates the incentive for invest-ment and excess supply in the
next, and excess supply createsa cycle of consolidation andlower prices to stimulatedemand again. Governments arenot good at anticipating suchcycles and hence react too lateand tend to often do more harmthan good, either throughdemand-oriented policies or sup-ply-oriented. But at least we can
predict when they will respondand the next cycle will be a liber-al demand and consumer incomeredistribution cycle or “NewDeal” in the Next GreatDepression ahead with major
infrastructure projects – likebuilding pyramids in thedroughts in Egypt.
The Rise of U.S.Leadership in
Technology andInnovation
The U.S. cycle of innovation leader-
ship started with the landmarkAmerican Revolution in democracy in the 1760s to 1770s and then fol-lowed in new technologies, firstwith the cotton gin; thensteamships; the McCormickReaper; cross-country railroads;the telegraph and steel; electricity,phones, and automobiles; theInformation Revolution, frommainframes to PCs to the Internetto broadband; and presently toalternative energy technologies;
and ultimately biotech, nanotech-nology and robotics. More critical,new business models also increas-ingly were led by the U.S. after thefactory model in Great Britain fromthe standardization of parts andmass production by Samuel Colt,scientific work management by Frederick Taylor, the large scaleR&D lab by Thomas Edison, theassembly line by Henry Ford, themodern corporation by AlfredSloan, and even more decentral-
ized product and profit divisions by GE.
Currently, the U.S. is leading theemergence of the “NetworkCorporation”. This business modelcollaborates among different busi-nesses large and small and inno-vates more horizontally than verti-
cally—with decision-making drivmore from the bottom up or cutomer back than from the top dow(as we have described in T
Roaring 2000s and The Next Gre
Bubble Boom , and as does Thom
Freidman in his recent book, TWorld Is Flat ). That model wincreasingly pass to emergiAsian countries like China anIndia over the coming decadealong with their growing leadershin new technologies. This is tbusiness side of the 250-yecycle, along with the “LeaProduction” Revolution, described by Paul Hawkens, AmoLovins and L. Hunter Lovins Natural Capitalism (1999).
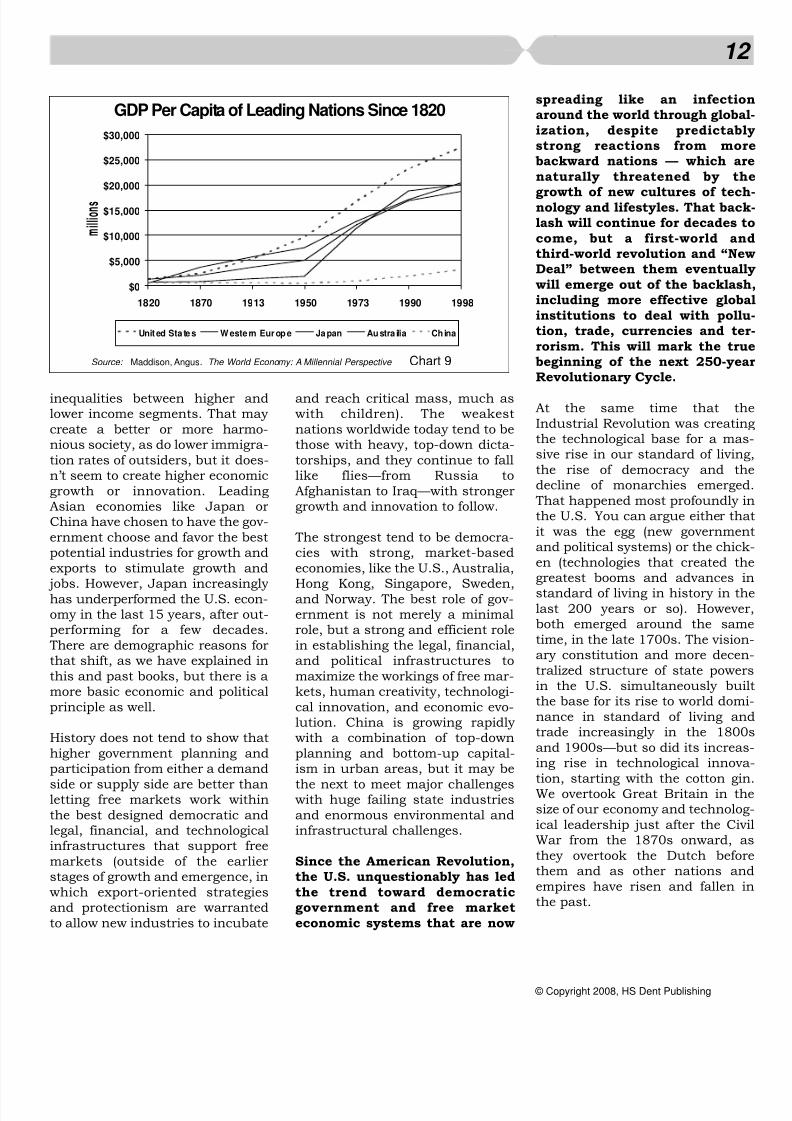
One of the reasons that the U.economy has outperformed trest of the world in the last twcenturies is that we have less goernment planning and encourafreer markets than maturinations in Europe or most emering nations in Asia. Also, we are immigrant and entrepreneurnation that has aspired more to tnew rather than to preserving tpast. Chart 9 shows the rise GDP per capita in select countriaround the world since 1820. TU.S. and similar spin-off animmigrant countries, like Austraand New Zealand, have seen thighest rates of growth, with Chin(the new, most rapid up-ancomer) out of dramatic new aspirtions to catch up and reclaim thepast heritage. European countrilike France, Great Britain anGermany and countries like Japa
have been “playing catch up” withe U.S. since World War II, bthe U.S. still has the highest stadard of living of any major counttoday. How did we achieve this?
Many maturing European natiohave sought to raise taxes anhave their governments stimulademand in the name of equalizi
11
© Copyright 2008, HS Dent Publishing
8/7/2019 The Shifting Long Wave - Why Generation Wave Has Supplanted the K-Wave For Now
http://slidepdf.com/reader/full/the-shifting-long-wave-why-generation-wave-has-supplanted-the-k-wave-for 12/20
inequalities between higher andlower income segments. That may create a better or more harmo-nious society, as do lower immigra-tion rates of outsiders, but it does-n’t seem to create higher economicgrowth or innovation. LeadingAsian economies like Japan orChina have chosen to have the gov-ernment choose and favor the bestpotential industries for growth andexports to stimulate growth and
jobs. However, Japan increasingly has underperformed the U.S. econ-omy in the last 15 years, after out-performing for a few decades.There are demographic reasons forthat shift, as we have explained inthis and past books, but there is amore basic economic and politicalprinciple as well.
History does not tend to show thathigher government planning andparticipation from either a demand
side or supply side are better thanletting free markets work withinthe best designed democratic andlegal, financial, and technologicalinfrastructures that support freemarkets (outside of the earlierstages of growth and emergence, inwhich export-oriented strategiesand protectionism are warrantedto allow new industries to incubate
and reach critical mass, much aswith children). The weakestnations worldwide today tend to bethose with heavy, top-down dicta-torships, and they continue to falllike flies—from Russia toAfghanistan to Iraq—with strongergrowth and innovation to follow.
The strongest tend to be democra-cies with strong, market-basedeconomies, like the U.S., Australia,
Hong Kong, Singapore, Sweden,and Norway. The best role of gov-ernment is not merely a minimalrole, but a strong and efficient rolein establishing the legal, financial,and political infrastructures tomaximize the workings of free mar-kets, human creativity, technologi-cal innovation, and economic evo-lution. China is growing rapidly with a combination of top-downplanning and bottom-up capital-ism in urban areas, but it may be
the next to meet major challengeswith huge failing state industriesand enormous environmental andinfrastructural challenges.
Since the American Revolution,the U.S. unquestionably has ledthe trend toward democraticgovernment and free marketeconomic systems that are now
spreading like an infectioaround the world through globaization, despite predictabstrong reactions from mobackward nations — which anaturally threatened by th
growth of new cultures of tecnology and lifestyles. That baclash will continue for decades come, but a first-world anthird-world revolution and “NeDeal” between them eventualwill emerge out of the backlasincluding more effective globinstitutions to deal with polltion, trade, currencies and terorism. This will mark the trubeginning of the next 250-yeRevolutionary Cycle.
At the same time that tIndustrial Revolution was creatithe technological base for a masive rise in our standard of livinthe rise of democracy and tdecline of monarchies emergeThat happened most profoundly the U.S. You can argue either thit was the egg (new governmeand political systems) or the chicen (technologies that created tgreatest booms and advances
standard of living in history in tlast 200 years or so). Howeveboth emerged around the samtime, in the late 1700s. The visioary constitution and more decetralized structure of state powein the U.S. simultaneously buthe base for its rise to world domnance in standard of living antrade increasingly in the 180and 1900s—but so did its increaing rise in technological innovtion, starting with the cotton giWe overtook Great Britain in tsize of our economy and technoloical leadership just after the CiWar from the 1870s onward, they overtook the Dutch befothem and as other nations anempires have risen and fallen the past.
12
© Copyright 2008, HS Dent Publishing
Chart 9
$0
$5,000
$10,000
$15,000
$20,000
$25,000
$30,000
1820 1870 1913 1950 1973 1990 1998
millions
Unit ed Sta te s W este rn Europe Ja pan Austra ilia Ch ina
GDP Per Capita of Leading Nations Since 1820
Source: Maddison, Angus. The World Economy: A Millennial Perspective

8/7/2019 The Shifting Long Wave - Why Generation Wave Has Supplanted the K-Wave For Now
http://slidepdf.com/reader/full/the-shifting-long-wave-why-generation-wave-has-supplanted-the-k-wave-for 13/20
Chart 10 shows the increasingbubble boom and prosperity thathas occurred since the twin inno-vations of the Industrial Revolutionand democracy, which increasingly centered in the US.
We have not merely been in anincreasing bubble boom sincethe early 1980s — we have seenan accelerating bubble boomsince the late 1700s!
The next stock expansion, into late2008 or 2009, should representthe longer-term peak of that longbubble boom in the West. Hence,this is likely to be the last greatbubble for Western nations, from
Europe to North America. Therewill continue to be strong demo-graphic-driven growth with indus-trialization and information tech-nologies throughout most of Asiaand to some degree in LatinAmerica, the Middle East andAfrica until world populationgrowth peaks according to presentdemographic projections, around2065.
That is when we are likely to see
the Next Great Depression on anear 60-year cycle from this one– the early 2070s!
The Rise of MassAffluence and
Influence
The Industrial and Democracy rev-olutions started a trend of rising
productivity beginning in the late1700s, as we showed in Charts A.9and A.10. Everyday people startedearning more money by movingfrom farms to factories (and theninto clerical and professional jobs),and the new political structuresand laws allowed them to keepmore of their productivity contri-butions, in contrast to the aristoc-racy and feudal lord, land-basedstructures of power and affluenceof the past. This revolution started
first in Great Britain and thenspread increasingly to Europe andNorth America from the early 1800s onward. As more everyday people shifted from subsistencefarm work to factory work and to
an increasing array of more spe-cialized jobs, incomes and econom-ic influence started to rise for morepeople.
As more immigrants were attractedto the more entrepreneurial andfreer society in North America,innovation boomed from these newpenniless and motivated entrepre-neurs and “Puritans.” Americaalways has been a contrasting
society both of dissident, frughard-working people and simultneously of hucksters, salesmeentrepreneurs, and Wild West gominers and gun slingers. It’s nflattering, and that’s why olde
more refined European culturshun us. But that melting pot more “cowboy” and independethinkers is what made this countthe leading nation in the wortoday. Farmers peaked as a pecentage of the U.S. workforce 1820 at almost 75%, as Chart shows, and have been decliniever since to less than 2% todawho produce all of the food we caeat and provide a major expoindustry as well.
13
© Copyright 2008, HS Dent Publishing
Chart 10
4
V
5
5
(V)
230-Year Bull Market Since Late 1780sA 300-Year Boom/Bust Cycle
Source: Robert Prechter, Conquer the Crash, pg. 33, with projections forward by Harry Dent.
Chart 11
0.00%
10.00%
20.00%
30.00%
40.00%
50.00%
60.00%
70.00%
80.00%
1820 1840 1860 1880 1900 1920 1940 1960 1980 2000
Farmers as % of US Workforce
Source: US. Department of Commerce, Bureau of the Census, U.S.Department of Labor for 1990-2004, Trends in Proportion of the Nation's Labor Force in Agriculture: 1820-1940.

8/7/2019 The Shifting Long Wave - Why Generation Wave Has Supplanted the K-Wave For Now
http://slidepdf.com/reader/full/the-shifting-long-wave-why-generation-wave-has-supplanted-the-k-wave-for 14/20
The Industrial Revolution has cre-ated the greatest gains in produc-tivity and standard of living sincethe Agricultural Revolution thatbegan 8,000 to 10,000 years ago inOld Testament times—but in a
shorter time frame, just 200 years(see our free special report at“Concepts/The Long View” atwww.hsdent.com for greater in-depth analysis). The second stageof the revolution started in the late1800s, with the advent of electrici-ty, electrical appliances, cameras,movies, phones, automobiles,small motors, oil, airplanes, syn-thetic chemicals and fibers, and soon. That stage was followed quick-ly by the mass production revolu-
tion, which began in America withstandardized parts for guns likethe Colt 45 in the mid-1800s, thescientific management of work by Frederick Taylor in the early 1900s, the assembly line by Henry Ford in 1914, and the modern cor-poration by Alfred Sloan at GM inthe early 1920s.Beginning in the late 1800s andearly 1900s, the mass produc-tion revolution finally catapult-ed the influence of everyday
consumers and workers to driveour economic, innovation, andinflation phases into genera-tional cycles of approximately
40 and 80 years, which increas-ingly has overridden the roughly29- to 30-year and 58- to 60-yearKondratieff innovation and infla-tion cycles of the past. Beforethat point, most of the gains and
profits went to a small percent-age of the population.
The Generation WaveExplained in Simple
Terms
We will look in more depth than inChapter 2 at the new logic in eco-nomic cycles that is driven as new,affluent generations go through
predictable cycles from innovationwhen they are young to spendingand productivity and then to cor-porate, political, and investmentpower as they age. Currently, newgenerations have a greater impacton our economy compared withpast eras. Chart 12 shows thesimplest and broadest waves of impact that new generations, likethe past Bob Hope and the current,massive Baby Boom generations,have on our society and economy as they age.
The first wave is the Birth Wave(including adjustments for immi-
gration), which creates the genertion and that peaked in 1961 fthe baby boom in the U.S. in tlast cycle and in 1921 for the BHope Generation before. The seond wave is the Innovation Wav
which peaks as the most innovtive of the new generation get oof college, first enter the workforcand start new technology anlifestyle trends, especially amothe more affluent “yuppies.” ThInnovation Wave creates inflatiowith the high cost of incorporatithe new generation and their initinnovations into the economy.
The third or Spending Wave crates an economic boom, as the ne
generation moves into its peincome and spending years—wifalling inflation rates as thsimultaneously move into thepeak productivity years—into themid- to late 40s today (spendinrates peaked earlier back in histry with lower life expectancieThe final or Power Wave occurs the aging generation moves intheir late 50s and early 60s anbegins to dominate political anbusiness power structures an
have the highest savings and nworth for investment and philathropy. In that stage, the wanigeneration presides over politicsocial, and organizational changwhile the new generation enters iinnovation stage, creating the neinnovations and future workforproductivity and spending to drithe next the next G-wave Cyc(financed by the older generationinvestment).
Neil Howe and William Straudocument a two-generation, foustage cycle that occurs roughevery 80 to 84 years in their bookstarting with Generations in 19(Chart 13). Their research extenbeyond the last century of modetailed economic and statisticresearch, with deep, qualitatiacademic research back to t1500s in European and Nor
14
© Copyright 2008, HS Dent Publishing
Chart 12
2,000,000
2,500,000
3,000,000
3,500,000
4,000,000
4,500,000
5,000,000
5,500,000
1933 1943 1953 1963 1973 1983 1993 2003 2013 2023 2033
Birth Innovation Spending Power
0 23 48 62
Generation Wave
Source: HS Dent Foundation

8/7/2019 The Shifting Long Wave - Why Generation Wave Has Supplanted the K-Wave For Now
http://slidepdf.com/reader/full/the-shifting-long-wave-why-generation-wave-has-supplanted-the-k-wave-for 15/20
American history. Two booms inbirths (and immigration) create twogenerations that are radically dif-ferent and react to each other. Thefirst is more radical and individual-istic. The second is more collabora-
tive and conformist. The firstbrings the more radical social andtechnological innovations that cre-ate a new economy with newindustries, business models, andlifestyles. The second generationimproves and extends them, withmore conformist and collaborativeefforts and more pragmatic ideals.Hence, it takes two generations tobuild a new economy to full matu-ration – and like supply anddemand economics, both are
required at different times to opti-mize long term growth andprogress.
For example, the more individual-istic Henry Ford Generation (priorto the Bob Hope Generation)brought us women’s rights, auto-mobiles, electricity, phones, air-planes, the assembly line, and soon. The more conformist Bob HopeGeneration brought incrementalinnovations to the new industries,including more automated homeappliances, power brakes andsteering and automatic transmis-sions in automobiles, jet enginesfor planes, and a more refinedmodel of decentralized corporatemanagement at maturing largecorporations like GE.
Each alternating generation has arising and falling tide of births.Each wave up and down of these
two generations has differing per-sonalities and innovation/lifestyletemperaments. The rising tide of the individualistic generation inChart A.13 is called the “Idealists”(these terms come from Howe andStrauss in Generations ). They arethe childlike visionaries and inno-vators who start radical new trendsin reaction to the conservativenature of the waning generation.
The falling tide of the individualis-tic generations is called the“Reactives.” They still are individu-alistic in nature but react to theidealistic nature and failures of theIdealists. They are good entrepre-neurial managers who take morecalculated risks but are still intogrowth and change.
The rising tide of the next, moreconformist generation is called the“Civics.” They want to bring society back from extreme individualisminto a greater whole that works forthe better of everyone and bringsgreater equality after the rich havegotten richer. They tend to fight thenext great wars or political battlesand are great large corporategrowth managers. They grow by systems and collaborative effortsaimed at the greater good and con-tinued growth into the maturity of those industries. The declining tide
of the conformist generation iscalled the “Adaptives.” They are thesilent generation that simply fol-lows the rules set by the Civics andadapts larger organizations intodeclining growth and consolida-tion—never complaining, but wish-ing they could do something morecreative. They were called the“Organizational Man” in the 1970s.That leads to the next truly cre-
ative and individualistic genertion, which reacts to their extremconformity and suppression individualistic needs and desires
The Rise of the 80-Year Generation-
Driven New EconomyCycle
The rise in affluence, spendipower, and innovation of masseseveryday consumers and workehas caused this 80- to 84-yegenerational cycle increasingly dominate the emergence of neeconomies and technologiedespite the fact that many bastechnological innovations follothe K-wave Cycle to a greatdegree. New economies with netechnological infrastructures, nebusiness and work models, neconsumer lifestyles, and negrowth industries emerge eveother generation. This generatiodriven New Economy Cycle hfour seasons or stages, just like tK-wave and all product and indutry life cycles, with two very diffeent booms and two very differebusts. Chart 14 shows this cycwhich we have elaborated on
15
© Copyright 2008, HS Dent Publishing
Chart 13
“Idealists” “Reactives”
“Civics” “Adaptives”
Individualistic
Conformist
80-Year Alternating Generation Cycles
Source: HS Dent Foundation

8/7/2019 The Shifting Long Wave - Why Generation Wave Has Supplanted the K-Wave For Now
http://slidepdf.com/reader/full/the-shifting-long-wave-why-generation-wave-has-supplanted-the-k-wave-for 16/20
much greater detail in all of ourbooks, most recently The Next
Great Bubble Boom. Note that ourcycle revolves around the life cycleof the most radical new technolo-gies, like autos and electricity or
PCs, cell phones, the Internet andbroadband today. Hence, our G-wave Cycle starts in the summerseason of the K-wave Cycle eventhough it follows the same fourstage process.
The Innovation Season
The first season in our 80-YearNew Economy Cycle is the
Innovation Stage, when radicalnew technologies (PCs and cellphones vs. mainframes) first enterinto niche markets, while oldertechnologies are at a plateau andconsolidating (like the summer
season of the K-wave Cycle). Therising tide of the new, individualis-tic generation (Idealists) is justentering the workforce in theirinnovation stage of theirGeneration Wave, which createsrising and peak inflation rates butalso creates radical new technolo-gies and industries and newlifestyles that rebel against the old.Inflation is also at a more extremepeak, because these generations
tend to be larger and allow moimmigration and, hence, highworkforce entry. The economy gointo a general downturn due to tslowing spending from the peak the last generation (Civics). Sma
cap stocks perform the best in thseason, as it favors companigrowing rapidly in new emergiindustries – while large cap stoctend to decline.
The Innovation Stage is charaterized by radical innovation anthe emergence of new technolgies and industries into busineand niche consumer marketfalling productivity, rising infltion, and a falling economy an
stock market. “Stagflation” the theme.
The Growth BoomSeason
The second stage is the GrowBoom Season. Here, the IdealGeneration moves into Spending Wave with rising produtivity into their late 40s, driving aextended boom with falling infltion (disinflation) trends. The radcal new technologies move maistream increasingly as they aadopted by the new generatiowhich has more income anspending clout. This growth stais where we see strong technologled bubbles in the stock marklike 1915 to 1919 and 1925 1929 in the last New EconomCycle and like 1995 to 1999 an
2005 to 2009 in the present cycAs the new industries move maistream on an S-curve pattern the second half of the GrowBoom, there are two bubbles wia shakeout and crash in betweeas Chart 15 illustrates. Large-cstocks do the best in this season new industries move mainstreaand the innovative companies the last season become large companies and leaders of the ne
16
© Copyright 2008, HS Dent Publishing
Chart 14
Innovation GrowthBoom
MaturityBoom
Shake-Out
Spending
Wave
(Economy)
Innovation/Inflation
1968 1978 1988 1998 2008 2018 2028 2038
We AreHere
Innovation
Inflation Disinflation Deflation
StablePrices Inflation
StablePrices
80-Year New Economy Cycle
Source: HS Dent Foundation
Chart 15
I n n o v a t i o n
Growth Boom
S h a k e - o u t
M a t u r i t yB o o m
1 0 %
5 0 %
9 0 %
The Industry Life Cycle
Source: HS Dent Foundation

8/7/2019 The Shifting Long Wave - Why Generation Wave Has Supplanted the K-Wave For Now
http://slidepdf.com/reader/full/the-shifting-long-wave-why-generation-wave-has-supplanted-the-k-wave-for 17/20
industries. This is like the autumnseason of the K-wave.
The Growth Boom Stage sees adynamic boom, with growingstock market bubbles and brutal
crashes within, rising productiv-ity, disinflation, and the move-ment of radical new technologiesand consumer industries main-stream. The rich get richer inthis stage, which favors risk tak-ers and new skills in the work-force.
The Shakeout Season
The next season is the worst sea-son of the cycle, the ShakeoutSeason. The economy sees thegreatest overexpansion of newindustries and the greatest over-valuation of the stock markets atthe top of the dynamic GrowthBoom that leads into it. The gener-ational Spending Wave peaks out,and the new technologies and con-sumer industries reach 90% pene-tration on the S-curve and slowdown dramatically. This leads to a
deflationary downturn wherein allassets from stocks to real estate tocommodity prices fall, similar tothe winter season of the K-waveCycle. This stage narrows the lead-ers in the emerging mainstreamindustries down to a few compa-nies that gain market share whileothers go under. This stage seesthe highest unemployment and theworst stock crashes.
The Idealist Generation is moving
into its Power Wave and makesmajor changes in political andsocial policies that start to favorthe everyday person vs. the wealth-ier innovators, in line with theiroriginal visions to change the worldand address inequalities whenthey were younger. At the sametime, the new, more conformistCivic Generation moves into its
Innovation Wave, with more incre-mental innovations that largely improve and extend the emergingindustries rather than creatingradical new ones, although very early radical inventions do emerge
here to eventually stimulate thenext cycle.
The Shakeout Stage sees thestrongest downturns and stockcrashes, deflation in prices andreal estate, the highest unem-ployment, major politicalchanges to favor everyday work-ers, and incremental innova-tions that extend the new indus-tries further mainstream in thenext boom—as well as the seed
of the next radical innovations.
The Maturity Boom
The final season is The Maturity Boom. This is a less dynamicboom, which has steadier growthand less volatile stock prices, withmoderately rising inflation comingout of the deflationary slowdownbefore it. The surviving few new
industry leaders enjoy steady growth, because the incrementalinnovations allow new growth andapplications of their maturingindustries—while the next radicalinnovations are just being innovat-ed. This is the optimistic seasonwith high hopes for the future andless radical changes and disrup-tions in which people are the mostcontent, like “The Happy Days” of the 1950s. The Civic Generationdriving this boom brings order and
conformity to the more innovativeboom and bust of the last moreindividualistic generation. As thenew industries mature and thisCivic Generation’s Spending Wavepeaks, we enter the next NewEconomy Cycle and a newInnovation Season, where the CivicGeneration moves into its PowerWave and the next Idealist
Generation moves into its risiInnovation Wave. This is the spriseason of the K-wave Cycle.
The Maturity Boom Season sesteady and moderate grow
with mild inflation. The growindustries of the last boommove fully mainstream anbegin to mature with few compnies leading. Productivity cotinues to rise, but not as dramaically as in the Growth BooSeason. The benefits of the neeconomy spread more widely everyday consumers and worers and we have the leainequality in incomes.
The Last GenerationWave Cycle
Let’s briefly trace this new 80-yegeneration-driven New EconomCycle since it has become modominant in the last century. TG-wave was just beginning emerge in the early 1900s but onset in more fully with the first mamiddle class generation, whiemerged from the 1940s to t1960s. The last Idealist, or radicgeneration was the Henry FoGeneration in the U.S., whibrought radical innovations wiautos, oil, telephones, electricitbasic appliances, and airplanes the late 1800s. The Growth Booof that generation was from aroun1902 to 1929. The Shakeout wfrom 1930 to 1942, and tMaturity Boom from 1942 to 196
The Baby Boom Generation wthe next Idealist group, and thbrought radical innovations fromicrochips to PCs to cell phones operating systems to Wal-Mart Starbucks to Dell in theInnovation Stage from the la1960s through the early 1980Their Growth Boom started
17
© Copyright 2008, HS Dent Publishing

8/7/2019 The Shifting Long Wave - Why Generation Wave Has Supplanted the K-Wave For Now
http://slidepdf.com/reader/full/the-shifting-long-wave-why-generation-wave-has-supplanted-the-k-wave-for 18/20
1983 and will peak with theirSpending Wave around 2009. Thenext Shakeout Season is aheadfrom 2010 to 2022-2023. AMaturity Boom will follow with theEcho Baby Boom’s (Civics)
Spending Wave, from 2023 to thelate 2050s or so. Although globaltrends will likely create a shorterMaturity Boom that peaks in themid 2030s. In addition, an inter-esting deviation in the earlieststages of the last 80-year cycleactually showed that the K-wavemodel was still more dominant atthat time.
Inflation was rising well into theGrowth Boom of the last Henry
Ford Generation Spending Wave,rather than falling. That infla-tion takes some explaining. Thestill-dominant K-wave andunusually strong immigrationcycles back then explain suchrising inflation!
The first reason for rising inflationin the Henry Ford Growth Boomwas that the K-wave was still dom-inant, with a peak inflation orsummer season building into
1920, on a 56-year lag from thelast peak in 1864. The second rea-son for rising inflation in thatGrowth Boom season was that thelast Idealist Generation largely wasan immigrant generation, with dra-matically rising immigration ratesinto the U.S. between the late1800s and 1914. Since these peo-ple weren’t born here, they cameinto our economy already in theirearly to mid 20s, typically, or 30years old on average. Our inflationmodels (Chart A.6 previous) corre-late with workforce entry (theexpense of incorporating new gen-erations into the workforce). Theirsudden workforce entry later in thecycle than people born here (age 12to 18 for workforce entry backthen) caused inflation to rise wellinto the Growth Boom, whichoccurred from 1897 to 1929. They also soon added to income and
spending growth and, hence, eco-nomic expansion and inflation.
Rising immigration, which peakedbetween 1907 and 1914, keptinflation levels rising modestly,
just as Baby Boomers entering theworkforce did into 1980. Thenthere was World War I. Major warsare the other major cause of infla-tion, as production efforts areswitched from consumer goods towar efforts, making consumergoods more scarce and expensive.That war extended inflation moresharply into early 1920 beforeprices collapsed. Rising inflationrates into 1919 suppressed stockvalues outside of the bubble that
formed in tech stocks from 1915 to1919. Rising inflation trends total-ly were consistent with the stillmore dominant K-wave Cycle, aswas World War I, into the peakinflation or summer stage, similarto the Civil War that peaked in1864 in the previous K-wave infla-tion cycle.
Hence, we only saw disinflation inthe latest and strongest phase of the Growth Boom of the new immi-
grant or Henry Ford Generation inthe Roaring 20s, whereas newtechnologies were moving fully mainstream with the highest pro-ductivity rates after their first tech-nology bubble peaked in late 1919and crashed in late 1921 to early 1922. The years 1922 to 1929 rep-resented the typical bubble-likeautumn boom of the last, still-dominant K-wave Cycle. Those twotrends, the peak of new technolo-gies into the mainstream and thepeak of that generation’s spending(earlier back then in age), allowedan extreme boom and stock bubblein the late 1920s—and the K-waveand G-wave cycles were nearly per-fectly in sync in their boom/bustand inflation/deflation cycles dur-ing the 1920s and 1930s.
Rising inflation creates lower stovaluations or Price/Earnings rati(P/Es), and so does the uncertaity of wars or major internationconflicts. Hence, stock pricunderperformed into 1919, outsi
of the strong bubble in tech stocat the time. But falling inflatioand rising political stability creathigher stock valuations. Wshowed in Chapter 2 how we satwo technology stock bubbles, tfirst peaking in late 1919 and tsecond peaking in late 1929, automobiles and other leaditechnologies moved from 10% 90% of urban households fro1914 to 1928 in the Growth BoomShakeout and Maturity Boo
Cycle around that S-curve acceleation. The second bubble led botech stocks and broader indiclike the Dow into the greatest stobubble in U.S. history.
The G-wave Cycle was beginning emerge in the early 1900s with tHenry Ford Generation (Idealistbut first fully emerged by time tBob Hope (Civic) Generation wascending into broad middle claincomes and affluence for the fir
time in history. Hence, the K-wawas fading in influence and the Gwave and new 80-year NeEconomy Cycle was rising, poered by the demographic supecharger of the massive Baby BooGeneration here and around tworld. The first extended genertional boom in the economy anstocks emerged from 1942 to 196a boom much longer than in paK-waves. The next inflation trenwas much larger than in the paand extended into 1980, more line with the next K-wave pearound 1979 - 1980. The neextended generational spendiboom manifested from 1983 inaround 2009.
This is what we mean by the neG-wave stretching economcycles more around its 80- to 8
18
© Copyright 2008, HS Dent Publishing

8/7/2019 The Shifting Long Wave - Why Generation Wave Has Supplanted the K-Wave For Now
http://slidepdf.com/reader/full/the-shifting-long-wave-why-generation-wave-has-supplanted-the-k-wave-for 19/20
year cycle. Despite this broadertrend, inflationary cycles havecontinued along the Commodityand Kondratieff Cycles, andglobal demographic cyclesstrongly suggest that the next
inflation and Innovation Waveon the G-wave Cycle will peakbetween the late 2030s and thevery early 2040s back in linewith the 58- to 60-yearKondratieff Cycle.
Chart 16 shows our GlobalInnovation Wave, which peakswith 20 to 24 year olds. The impactof the larger emerging countrieslike India will forecast a peak ininnovation and inflation pressures
from demographic forces (beyondcommodity cycles) around 2040,very close to the next 29- to 30-year Commodity Cycle peakbetween 2038 and 2039. Thatcommodity peak, as in 1980 and1920, would represent the peak of the inflation or summer season inthe Kondratieff Cycle. Hence, theG-wave and K-wave would mergeinto alignment again, and we arelikely to see the New Economy Cycle return more to the 58- to 60-
year cycles that we saw since thelate 1700s. The next Growth BoomSeason would then follow into theprojected world peak in spendingaround 2065 with the nextShakeout Season or depression tofollow into the 2070s.
The U.S. will start to diverge a bitfrom these increasingly globalcycles, due to its unique demo-graphics. The Echo Boom had twodistinct surges that peaked in1990 and likely again around2007, as we discussed in Chapter6. The first Echo Boom SpendingWave will generate a boom fromthe early 2020s into the early 2040s, more in line with theMaturity Boom in the present NewEconomy Cycle that is likely topeak in the mid 2030s due tostronger demographic declines in
China, Europe, East Europe andRussia. The second wave will cre-ate a second boom from the late2040s into the late 2050s more inline with the next Growth BoomSeason globally that is due to peakmore around 2065. If there is adramatic aging revolution in thedeveloped nations that causes apeak in spending more in the late50s or early 60s than in the early 50s then cycles for major regions
like North America would fall moreprecisely in line with the nextGlobal New Economy GrowthBoom Season. This could welloccur by then with advances inbiotechnology that are likely to cre-ate more tangible impacts on lifespans starting in the 2010sonward.
Commodity prices will be seeinga secondary peak (on the K-Wave) between late 2009 and
mid 2010 with a likely lesssevere crash than in the 1980sinto the early to mid 2010s dueto continued expansion inemerging countries that aremore commodity-intensive fordecades to come. Oil pricescould go as high as $150 to $170and then correct and settle moreback in a range of $10 to $60.
That would still leave plenty incentive for alternative enegies to emerge and such a cycof breakthrough innovations due near term and necessary deal with global warming anpollution issues. Commodiprices are likely to be more sidways up and down between thmid 2010s and the early 2020and then to accelerate again ina primary or more dramatic pea
into 2039 - 2040.
Hence, deflation and a majdownturn are in store for NorAmerica and most of Eurobetween 2010 and 2022-2023, duto the dominance of the GeneratiWave. But such deflation trencould actually bottom betwe2011 and 2013 or early 2015 the latest. However, most of Asiadestined to continue to grow demographic spending trends an
increasingly to lead in new tecnology cycles. These economiwill react at first to the slowdowin the West between 2010 an2012, but then boom again anlikely lessen the deflation trenworldwide, as will the K-waCycle, which will be in a mild infltionary mode in commodity pricinto the latter 2010s, with risiinflation trends from the ear2020s into 2038 to 2040 or so.
19
© Copyright 2008, HS Dent Publishing
Chart 16
0
200,000
400,000
600,000
800,000
1955
1960
1965
1970
1975
1980
1985
1990
1995
2000
2005
2010
2015
2020
2025
2030
2035
2040
2045
2050
2055
2060
2065
2070
Japan 1
Russia 1
US 1Europe
Japan 2 S.
Korea
China 2Russia 2
US 2Indonesia
Brazil
Mid East SaudiArabia
India PakistanN. Africa
Sub-SaharanAfrica
Mexico SEAsia
China 1
Global Innovation/Inflation Wave
Source: United Nations

8/7/2019 The Shifting Long Wave - Why Generation Wave Has Supplanted the K-Wave For Now
http://slidepdf.com/reader/full/the-shifting-long-wave-why-generation-wave-has-supplanted-the-k-wave-for 20/20
The Next NewEconomy Cycle
The present 80-Year new Economy Cycle will very likely see a shorterMaturity Boom Season fromaround 2020/2023 into2035/2036 that will bring it backmore in line with the K-WaveCycle. The next cycle on our sea-sons that starts with theInnovation Season will see thatoccur between 2036 and the mid2040s with a stock crash and deeprecession much like 1973 – 1975.Within that the next Commodity Cycle peak should come around2039 – 2040 and an innovation
peak in India around 2040 or a bitlater. That season could extendwith off and on recessions in partsof the world into the early 2050s.Then we would see a Growth BoomSeason dominated by India andthe Middle East into around 2065or as late as 2068 – 2069 (the nextCommodity Cycle peak) that wouldlead to the next Shakeout Seasonor depression with its worst crisisinto the early to mid 2070s. Thatseason should last off and on into
the late 2070s or early 2080s.Then a final Maturity Boom Seasonwould occur into the 2090s or solead more by the Middle East andAfrica.
Recall that our broader 500-YearMega Innovation Cycle wouldsuggest rising inflation and stan-dards of living into around 2150,following past cycle peaksaround 1650 and 1150. Thatwould not be consistent with a
peak in global population around2065 unless we had a veryextreme advance in lifeexpectancy and peakspending/productivity. It wouldmore likely suggest that in thecoming decades we could firstsee a major leap in life expectan-cy due to advances in biotech-
nology between the 2010s and2040s as Ray Kurzweil predicts.Much later in this century, thespread of rising life expectancyand broader prosperity to emerg-ing countries, could lead to
another major baby boom, mostlikely coming out of the nextdepression from the late 2070sinto the 2090s. That would thenextend long term inflation, pop-ulation and economic growthout to around the 2150s or2160s.
Since progress in life expectancy inthe early to mid part of this centu-ry is likely to take many decades toreach the emerging countries, the
present projections for a peak inpopulation and global spendingaround 2065 is likely to hold moreor less. Such a cycle is likely tomerely extend the spending cyclesof major countries like the US fromthe 2050s into the 2060s more inline with such global cycles cen-tered more in India. Europe, EastEurope and Russia have no EchoBoom Generation to fully leveragesuch extended life spans, hencethose countries will continue to
age and slow, just not as fast. Thenext more dynamic New Economy Cycle is not likely to occur until thefirst half of the 2100s. We havealready seen the most dynamicsuch cycle and the greatest boomwe will see in our lifetimes from1983 to 2009.
20