the social pillar of sustainability: a quantitative
TRANSCRIPT

RESEARCH Open Access
The social pillar of sustainability: aquantitative approach at the farm levelAnna Gaviglio*, Mattia Bertocchi, Maria Elena Marescotti, Eugenio Demartini and Alberto Pirani
* Correspondence:[email protected] of Health, AnimalScience and Food Safety, Universityof Milan, Via Celoria 2, 20133Milano, Italy
Abstract
The present research proposes a model for the assessment of the social pillar ofsustainability at the farm scale. Contrary to what is available for the environmentaland economic pillars, there is a considerable lack of exhaustive approaches able toevaluate the social dimension of sustainability in rural areas. Thus, the idea was tocreate a mean by which a quantitative evaluation of the social characteristics offarms could be made. The study involved farms of the South Milan Agricultural Park,located in northern Italy. Thirty sampled farms were selected in order to representthe different livestock systems, land areas, economic dimensions and levels ofmultifunctionality of the area. The framework is based on a set of 15 indicatorsable to evaluate five main social “components”: (i) quality of the products andthe region, (ii) short supply chain and related activities, (iii) work, (iv) ethical andhuman development and (v) society, culture and ecology. The work wasstructured using the following steps: identification of the relevant variables forthe social sustainability of farms, determination of the framework of indicators,assignment of their range scores, data collection, calculation of the score foreach farm, data analysis and visualization. The method allows different types ofanalysis in relation to the objective of the research. Three main approaches wereindividuated: (1) the comparison among farms is the “farms’ ranking” and the“aggregate ranking”; (2) the evaluation of single themes of sustainability is the“single indicator evaluation” approach and (3) the temporal comparison of thefarm’s result is the “score evolution” approach. The method showed a highsensitivity to the multifunctionality and the type of farm production, especiallyorganic vs conventional, while other characteristics, such as the type of livestockand the land area, seem to differentiate the sample less or to characterize it inonly a few social components. The work has underlined the importance and theadvancement in the study of the social dimension that, however, needs furtherin-depth analysis through comparison with the other two pillars and amongvarious social states in different rural areas.
Keywords: Social sustainability, Agricultural sustainability, Indicators, Farmperformance, Multi-attribute analysis
BackgroundOver the past 30 years, interest in the evaluation of agricultural activities’ sustainability
has grown considerably, many studies have been proposed and several assessment
methods developed. The literature offers approaches at different spatial scales, ranging
Agricultural and FoodEconomics
© 2016 The Author(s). Open Access This article is distributed under the terms of the Creative Commons Attribution 4.0 InternationalLicense (http://creativecommons.org/licenses/by/4.0/), which permits unrestricted use, distribution, and reproduction in any medium,provided you give appropriate credit to the original author(s) and the source, provide a link to the Creative Commons license, andindicate if changes were made.
Gaviglio et al. Agricultural and Food Economics (2016) 4:15 DOI 10.1186/s40100-016-0059-4

from field and farm to regional, national, and even international scale (Jacobs
1995, Hansen 1996, Smith and McDonald 1998). Researchers that opted for a
farm/local scale in their studies (Van der Werf and Petit 2002, Häni et al. 2003,
Pacini et al. 2004, Rasul and Thapa 2004, Van Cauwenbergh et al. 2007, Meul
et al. 2008, Vilain 2008, Gómez-Limón and Riesgo 2009, Reig-Martinez et al. 2011,
Paracchini et al. 2015, Thiollet-Scholtus and Bockstaller 2015) took advantage of
the possibility of an in-depth investigation of farm dynamics, while research studies
that used a regional/territorial scale (Paracchini et al. 2011, Mazzocchi et al. 2013,
Demartini et al. 2015) could limit the cost of analysis, ensuring transparency of
data and repeatability of measurements (Demartini et al. 2015).
Although the environmental, social and economic pillars of sustainability are
linked to each other, a single integrated approach seems to be difficult (Wells
2001, Zimmerer and Basset 2003). This reflects problems of data requirement and
incommensurability between different facets or dimensions of sustainability that be-
come stronger as the analysis moves to the system beyond the farm boundaries
(Rigby et al. 2001). As a result, research studies tend to include these three pillars
in their studies, treating them separately or with a different relevance (Singh et al.
2009). Furthermore, the different pillars have attracted varying levels of attention.
The environmental assessment is more studied, because of the growing social
sensitivity of the community to ecological issues, and therefore, many approaches
have been discussed and developed and researchers have multiple analytical oppor-
tunities. On the other hand, the evaluation of economic and, especially, social
sustainability suffers from a lack of accepted and well-grounded frameworks
(Chatzinikolaou and Manos 2012).
Although contemporary society recognizes agriculture as having an important re-
sponsibility in safeguarding the region, its culture and traditions (Gaviglio et al. 2014a),
the measurement of social sustainability seems to be less studied. Moreover, most of
the approaches that seek to involve a complete evaluation of the sustainability use
qualitative assessments of the social pillar, based on observations and opinions or indi-
cators that require difficult to find data (see Häni et al. 2003, Van Cauwenbergh et al.
2007, Meul et al. 2008, Vilain 2008).
As a matter of fact, finding a match between the social sustainability objectives
and their corresponding indicators is a challenging task. According to Omann
and Spangenberg (2002), this assessment concerns some relevant problems.
Firstly, the perception of social issues is heterogeneous in different territorial
contexts and this causes a lack of conceptual clarity. Secondly, when scientists
suggest a great number of social indicators they still hesitate to formulate norma-
tive targets. Thus, the complexity of the concept might not be manageable in the
current institutional settings. All this considered, the assessment of social sustain-
ability seems to be particularly dependent on the local context and the socio-
political goals proposed by policy-makers (Littig and Griessier 2005). Thus, the
choice of indicators used in the analysis probably represents the most critical step
of the research. Particularly, the scientific literature underlines the importance of
the balance between a validated approach, reliability and significance of the indi-
cators and the objectives to be achieved (Girardin et al. 1999), under the con-
straints of data availability.
Gaviglio et al. Agricultural and Food Economics (2016) 4:15 Page 2 of 19
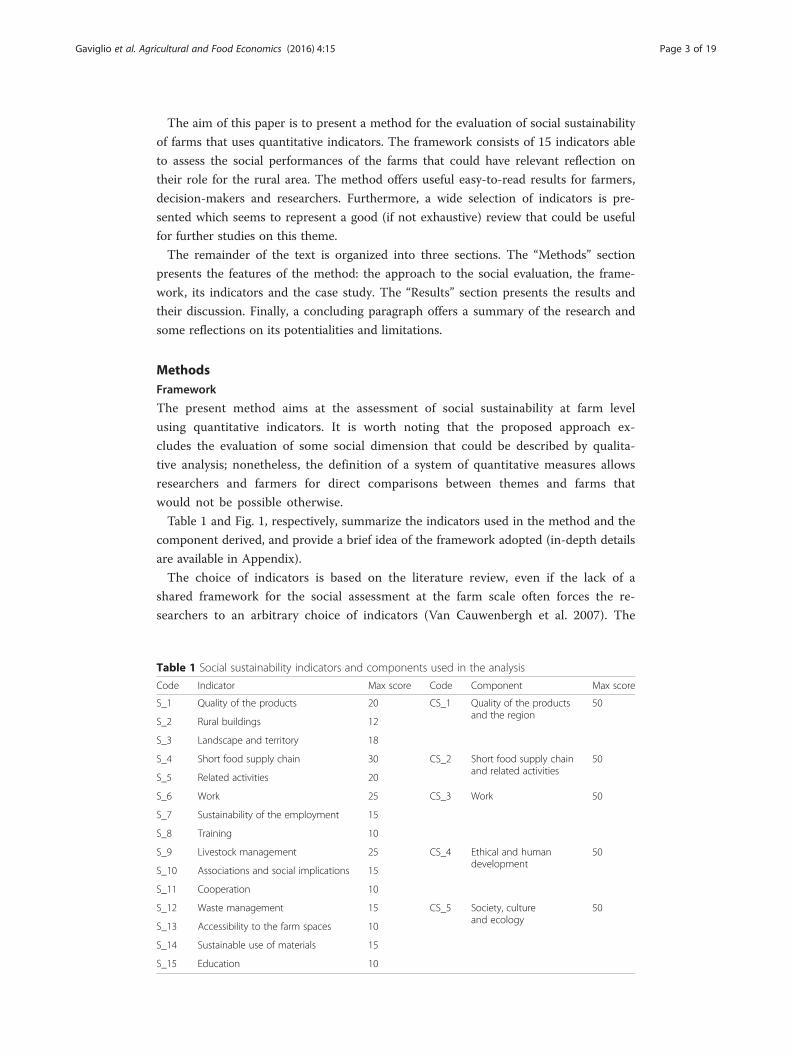
The aim of this paper is to present a method for the evaluation of social sustainability
of farms that uses quantitative indicators. The framework consists of 15 indicators able
to assess the social performances of the farms that could have relevant reflection on
their role for the rural area. The method offers useful easy-to-read results for farmers,
decision-makers and researchers. Furthermore, a wide selection of indicators is pre-
sented which seems to represent a good (if not exhaustive) review that could be useful
for further studies on this theme.
The remainder of the text is organized into three sections. The “Methods” section
presents the features of the method: the approach to the social evaluation, the frame-
work, its indicators and the case study. The “Results” section presents the results and
their discussion. Finally, a concluding paragraph offers a summary of the research and
some reflections on its potentialities and limitations.
MethodsFramework
The present method aims at the assessment of social sustainability at farm level
using quantitative indicators. It is worth noting that the proposed approach ex-
cludes the evaluation of some social dimension that could be described by qualita-
tive analysis; nonetheless, the definition of a system of quantitative measures allows
researchers and farmers for direct comparisons between themes and farms that
would not be possible otherwise.
Table 1 and Fig. 1, respectively, summarize the indicators used in the method and the
component derived, and provide a brief idea of the framework adopted (in-depth details
are available in Appendix).
The choice of indicators is based on the literature review, even if the lack of a
shared framework for the social assessment at the farm scale often forces the re-
searchers to an arbitrary choice of indicators (Van Cauwenbergh et al. 2007). The
Table 1 Social sustainability indicators and components used in the analysis
Code Indicator Max score Code Component Max score
S_1 Quality of the products 20 CS_1 Quality of the productsand the region
50
S_2 Rural buildings 12
S_3 Landscape and territory 18
S_4 Short food supply chain 30 CS_2 Short food supply chainand related activities
50
S_5 Related activities 20
S_6 Work 25 CS_3 Work 50
S_7 Sustainability of the employment 15
S_8 Training 10
S_9 Livestock management 25 CS_4 Ethical and humandevelopment
50
S_10 Associations and social implications 15
S_11 Cooperation 10
S_12 Waste management 15 CS_5 Society, cultureand ecology
50
S_13 Accessibility to the farm spaces 10
S_14 Sustainable use of materials 15
S_15 Education 10
Gaviglio et al. Agricultural and Food Economics (2016) 4:15 Page 3 of 19

selection process was carried out through the collection of the indicators detected
from currently available methods. Among these, the choice was based on a com-
bination of the best characteristics of simplicity, data requirements and significance
for the case study.
The following components of agricultural activities were observed, considering their
social dimension (Table 1): (CS_1) the products and regional management; (CS_2) the
short food supply chain and related activities; (CS_3) employment and working condi-
tions; (CS_4) the ethical and human development about animal welfare and the cooper-
ation and association; and (CS_5) cultural and ecological themes. Note that the
evaluation of these components involves the main social themes of the agricultural ac-
tivities; nevertheless, some topics reported in the literature are not treated in order to
avoid the use of qualitative indicators of data. In particular, we refer to food hygiene
and safety and quality of life.1
In the proposed method, the measurements of farm characteristics are converted into
dimensionless values that represent an easy-to-read score of the raw data according to
the desirability of the measured performance. For example, when measuring the indica-
tor “S_1 Quality of the products” higher scores rationally correspond to higher mea-
sures. Furthermore, each indicator can range from a minimum or a maximum score
(single scores are reported in Appendix); while the minimum score is always zero, the
maximum scores vary depending on the social relevance attributed to the indicator,
and therefore, more relevant indicators have higher maximum scores. This weighting
procedure derived from a subjective evaluation typical of these types of studies that
assigned the scores in accordance to the relevance attributed by the literature
(when available) and the characteristics of the case study and its objectives (von
Wirén_Lehr 2001). This process, which is convenient for adaptation to the local
Fig. 1 The framework proposed for social sustainability assessment
Gaviglio et al. Agricultural and Food Economics (2016) 4:15 Page 4 of 19
context, involves the typical risks connected to subjective norms. In order to re-
duce this possible source of errors, some studies used the principle of equality
among the indicators (Meul et al. 2008); nonetheless, other studies argue that indi-
cators cannot be considered equally relevant with reference to sustainability assess-
ment (Vilain 2008, Zahm et al. 2008). In this sense, researchers should be aware of
the trade-off between the two options and carefully adopt the one that they con-
sider the best in the research context.
The method is characterized by an aggregative structure (Fig. 1) aimed at reducing
data from farm characteristics to a unique value of the social pillar. As shown in Fig. 1,
the process is divided into four basic phases:
– Phase 1: collection and analysis (F(x) and G(x)) of the farms’ characteristics, classified
from S.1.a to S.15.a, in order to obtain a raw data set;
– Phase 2: elaboration of 75 sub-indicators, classified from S_1_a to S_15_a, leads to
integer and dimensionless values that range from negative to positive values,
according to their maximum scores;
– Phase 3: calculation of the 15 indicators, classified from S_1 to S_15, reported
in Table 1, obtained through the sum of two or more sub-indicators. A
minimum [0] and a maximum [variable] score is applied depending on the
case (see Appendix);
– Phase 4: the sum of two or more indicators provides the value of five
components of the social sustainability pillar, classified from CS_1 to CS_5. A
minimum [0] and a maximum [50] score is applied. In turn, the sum of the
components leads to the overall value of the social dimension of sustainability, which
can range from 0 to 250.
The components
In the following sections, we describe the indicators listed in Table 1, classified by
component.
Component 1 (CS_1): quality of the products and the region
The social inclusion of rural areas highly depends on the connection between them
and the citizenship. One of the most important means is the consumers’ perception of
the farm’s products. Often people assign good environmental standards to high-quality
products that contribute to a higher social acceptance of the agriculture and its produc-
tion systems.
There are wide ranges of categories of consumers, defined as ethical consumers
or citizen-consumers, who associate a very high value to the attribute of the
quality of the product and the region where they are produced. Among these
products, the CS_1 component identified two main categories: quality-certified
commodities and food products (S_1_a and S_1_b) and organic products (S_1_c
and S_1_d).
In the first case, the literature review on consumers’ perceptions shows some so-
cial relation between protected denomination of origin (PDO) products and the at-
tributes of support in order to sustain regional manufacturers (Van Ittersum et al.
2007, Verbeke et al. 2012) and to contribute to the survival of the social identity
Gaviglio et al. Agricultural and Food Economics (2016) 4:15 Page 5 of 19

of the region (Vilain 2008). Thus, nowadays, these recent purchasing motivations
are assigned a comparable importance with the typical attributes such as high stan-
dards (Van Ittersum et al. 2007), the tradition (Verlegh and Steenkamp 1999,
Dimara and Skuras 2003), the taste (Platania and Privitera 2006, Vanhonacker et al.
2010) and food safety (Dimara and Skuras 2003).
Regarding organic food consumption, many researches stated the importance of
the socio-economic traits of consumers (Hamm and Gronefeld 2004, Falguera et al.
2012), in particular tradition (Chinnici et al. 2002) and animal welfare (Magnusson
et al. 2003, Makatouni 2002). In this case too, these attributes seem to have a pri-
mary relevance, besides those historically associated with organic consumption: first
of all, environmentally friendly behaviour and also, as stated by some recent stud-
ies, the importance of the intrinsic attributes of the products (Gaviglio and Pirani
2015a), such as the healthiness (Pieniak et al. 2010), the high quality (Chinnici
et al. 2002) and the taste (Fotopoulos and Krystallis 2002, Zanoli and Naspetti
2002, Kihlberg and Risvik 2007).
While the establishment of organic and labelled products is easy because of certifica-
tion, there is a wide range of attempts to define local products (Hand and Martinez
2010). Because of the difficulties in defining the standard of quality of products without
certification, this component only considers labelled products. The evaluation of local
and typical products is treated by the CS_2 component, without taking into account
the attribute of their quality.
Finally, conscious social behaviour also involves issues not closely linked to the
products, such as the functional and aesthetic roles of rural buildings (S_2) and
the farm landscape (S_3). These are important features that characterize the archi-
tecture (Meul et al. 2008) and they represent positive or negative externalities in
the social acceptance of rural areas (Van Cauwenbergh et al. 2007).
Component 2 (CS_2): short food supply chain and related activities
Among the most important motivations in buying local products, the literature
found some social attributes such as tradition (Bessiére 1998), supporting local
economies and trust in producers (Seyfang 2006, Lockie 2009). These are indi-
cated by consumers as relevant means able to connect the citizenship with the
countryside.
Selling products through short chain systems involves different types of oppor-
tunities, such as direct sales (S_4_a, S_4_c and S_4_d), online sales (S_4_b), ethical
purchasing groups (S_4_e), farmers’ markets (S_4_f ), restaurants and shops (S_4_g)
and canteens (S_4_h). The direct sales formula is mainly dedicated to local prod-
ucts and creates a close relationship between producers and consumers that cannot
be explained just within an economic rationality (Gaviglio et al. 2015b).
The implications on other activities besides the agricultural production, such as
the maintenance and management of public spaces and resources (S_5_a), related
activities like agritourism, restaurants, bed and breakfast (S_5_b) and educational
farms (S_5_c and S_5_d) are other important means of linking the town and the
countryside (Vilain 2008). Citizens often use these systems to get to know the rural
world and to learn about production processes and agro-food systems (Santini and
Paloma 2013).
Gaviglio et al. Agricultural and Food Economics (2016) 4:15 Page 6 of 19

Component 3 (CS_3): work
Employment in the agriculture sector has fallen considerably in the last decades; there-
fore, the maintenance of a sustainable level of employment (S_7) is relevant for the so-
cial and economic development (S_6) of the agricultural area (Häni et al. 2003,
Meul et al. 2008, Vilain 2008, Gómez-Limón and Fernandez 2010, Reig-Martinez
et al. 2011, Bonneau et al. 2014). In this context, training (S_8) is a key aspect for
the growth of the agricultural sector (Vilain 2008) by which farms play a leading
role in development and innovation because of the requirement for high-profile
skilled jobs involved in related activities, research and breeding.
Component 4 (CS_4): ethics and human development
The human and ethical development of agriculture involves multiple issues. Among
these, animal welfare is today a primary requirement of society (Fortun-Lamothe et al.
2009, Broom 2010). Livestock management involves animal health and the farm’s ability
to implement innovations in the agricultural sector. This is a very complex issue, and
the use of a single approach able to evaluate different types of livestock is difficult.
Therefore, the indicator (S_9) is based on the diversification of the most common spe-
cies of animals (cattle, pigs, poultry, sheep/goats) bred in the area. In this way, we only
evaluated the management of the most important livestock of the farm (through the
calculation of the LSU, “livestock units”).
Cooperation and association are relevant instruments of innovation of agricul-
tural systems (Vilain 2008) and they are important indicators of human develop-
ment in rural areas. Among these factors, the social dynamism and vitality of an
area heavily depend on membership in associations (S_10_a and S_10_b), consortia
(S_10_c) and cooperation with other farms in the surrounding area in direct sales
(S_11_a and S_11_b), agritourism activities (S_11_c), the production structures
(S_11_d) and the workforce (S_11_e).
Component 5 (CS_5): society, culture and ecology
The inclusion of rural areas involves the recognition of the ecological, cultural and so-
cial effort of farms in their production process. In this sense, the component takes into
account four main aspects. A proper waste management through recycling processes
(S_12_a) and the use of recycled materials (S_12_b, S_12_c and S_12_d) has a great
environmental importance but it also involves the social acceptance of the agriculture
systems. The farm’s open spaces (S_13_a and S_13_b) have important recreational
functions useful for the population of a rural area.
Moreover, a proper landscape management can be a relevant source of income for
the multifunctional farm’s activities (Vilain 2008). The agricultural production systems
involve the use of materials, such as feed (S_14_a), fertilizers (S_14_b), water (S_14_c)
and seeds (S_14_e) that characterizes the sustainability of the farm management (Vilain
2008). A high dependence from the outset, even the buying of animals (S_14_c), often
causes a reduction of autonomy in making production, marketing and management de-
cisions. It also alters the resilience of the system and the ability to adapt to economic,
environmental and social changes.
The educational level (S_15_a) of the farm personnel is important for the cultural
and social growth of agricultural areas (Van Cauwenbergh et al. 2007). As found
Gaviglio et al. Agricultural and Food Economics (2016) 4:15 Page 7 of 19

by Elfkih et al. 2012, there is a probable positive effect of educational level on the
achievement of overall sustainability. The education of the workforce and the
entrepreneur is also able to encourage openness to new knowledge and innovation
in agriculture.
Case study
The survey was carried out on the region of the South Milan Agricultural Park.
The park is an area located on the Po plain (northern Italy), in one of the most in-
tensively agricultural regions in Europe (INEA 2014). This is an agricultural park
that involves the peri-urban area around the city of Milan. It covers more than
40,000 ha of lowland where farms are characterized by intensive production sys-
tems, a wide range of land areas, livestock and economic dimensions. The main
crops are maize, rice and grassland (Migliorini and Scaltriti 2012), while the main
livestock are cattle, poultry and pigs. The high population density confers the typ-
ical attributes of peri-urban areas, such as fragmentation and high economic value
of the land (Gaviglio et al. 2014b).
We carried out the sample stratification considering farm size, the main production
and geographical location. The selection was also linked to the willingness of farmers
to respond to interviews and to provide some administrative data (Briquel et al. 2001;
Viglizzo et al. 2006).
Thirty farms with different breeding systems were selected: cattle (for milk or meat
production), poultry, pigs, sheep and goats. Table 2 reports some of the main features
of the sampled farms.
Data were collected using (i) interviews through questionnaire to farm personnel that
provided an easy method to detect information, (ii) the Sistema Informativo Agricoltura
Regione Lombardia (SIARL) database and (iii) estimations when not available from the
other sources.
ResultsThe output of the method provides the values of each sub-indicator, indicator
and component that contribute to the overall score of the social pillar. In relation
to the objective of the research, the method still allows the use of different types
of analysis.
Farm comparison by ranking of indicators
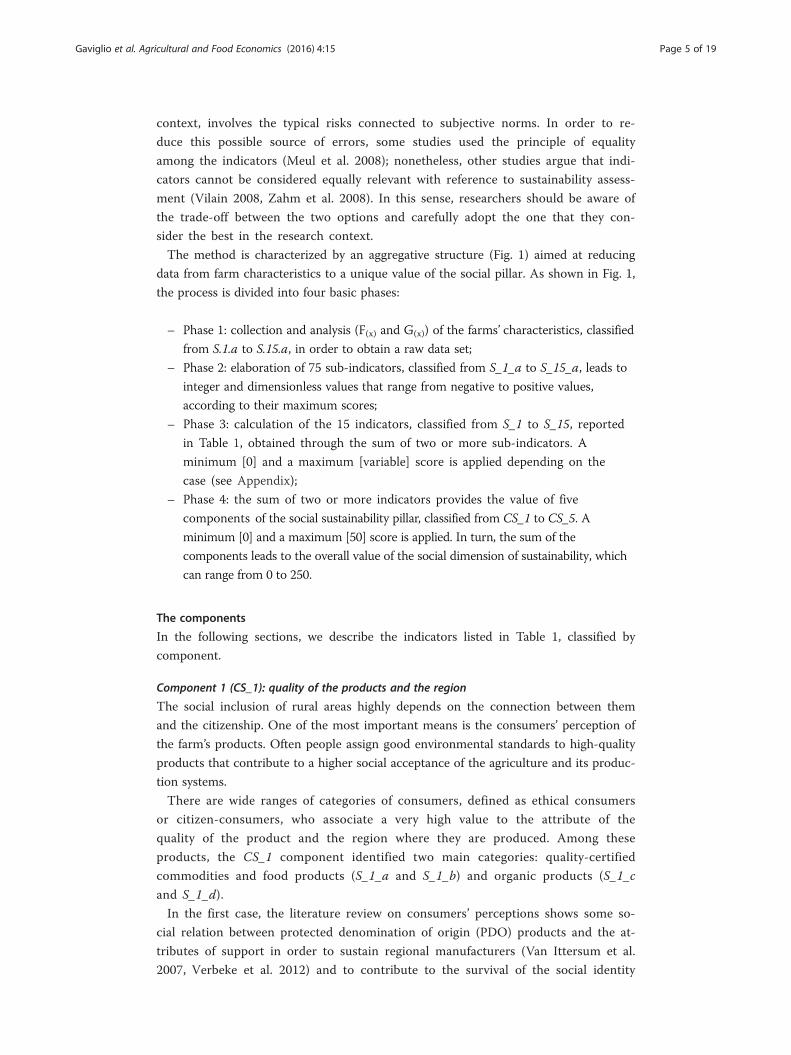
When the case study is focused on social sustainability aspects of individual farms, the
method allows an in-depth analysis of farms through the evaluation of the basic indica-
tors. Figure 2 shows a possible application of the results of two farms. Farm 1 has a
conventional production system, the livestock are cattle for milk production and
the land area is large. Farm 2 has the same characteristics but it also practises
multifunctional activities, while farm 1 can be defined as non-multifunctional.
These two farms are discussed as an example of how the method performs and
how data can be interpreted to identify key actions to be adopted to improve farm
performance. In general, farmers who have direct contact with consumers achieve
higher social results that can also lead to higher environmental performance (Gafsi
Gaviglio et al. Agricultural and Food Economics (2016) 4:15 Page 8 of 19

and Favreau 2010). In our sample, farm 2 obtained higher scores in the CS_2,
CS_3 and CS_5 components while farm 1 showed better scores in the CS_4 com-
ponent. The short food supply chain related activities component result is a direct
consequence of the different characteristics on multifunctionality. The third com-
ponent underlined the higher contribution of multifunctionality to employment in
the rural context. On the contrary, the other components seem to be less
dependent on the multifunctionality level. Their scores are probably more influ-
enced by other farm characteristics such as land area, type of production or the
management choices of each farm. However, both farms could improve their sus-
tainability level in the quality of the products and the region (CS_1) and work
(CS_3). Farm 1 seems to show no interest in diversification of income and activ-
ities. Both farms showed high performance in ethical and human development
(CS_4) and social, cultural and ecological sustainability (CS_5).
Farm comparison by aggregate component ranking
Radar diagrams are able to represent the overall performance of farms in the five
components. This method is able to provide different approaches of farm ranking
in relation to the sample features. The following figures show the farms’ results,
classified by livestock type (Fig. 3), land area (Fig. 4) and type of production (con-
ventional vs organic) (Fig. 5).
Table 2 Characteristics of the farms in the sample
Farm characteristic Quantity N Percentage %
Type of breeding
Bovine (meat prod.) 7 23.33
Bovine (milk prod.) 15 50.00
Poultry 4 13.33
Pigs 3 10.00
Sheep/goat 1 3.33
Land size—utilized agricultural area
<50 ha 14 46.66
50–100 ha 9 30.00
>100 ha 7 23.33
Multifunctionality
Non-multifunctional 9 30.00
Multifunctional 21 70.00
Type of production
Conventional 25 83.33
Organic 5 16.66
Economic size—standard output (SO)
SO < 100 13 43.33
100 < SO < 300 9 30.00
SO > 300 8 26.66
Total 30 100.00
Gaviglio et al. Agricultural and Food Economics (2016) 4:15 Page 9 of 19
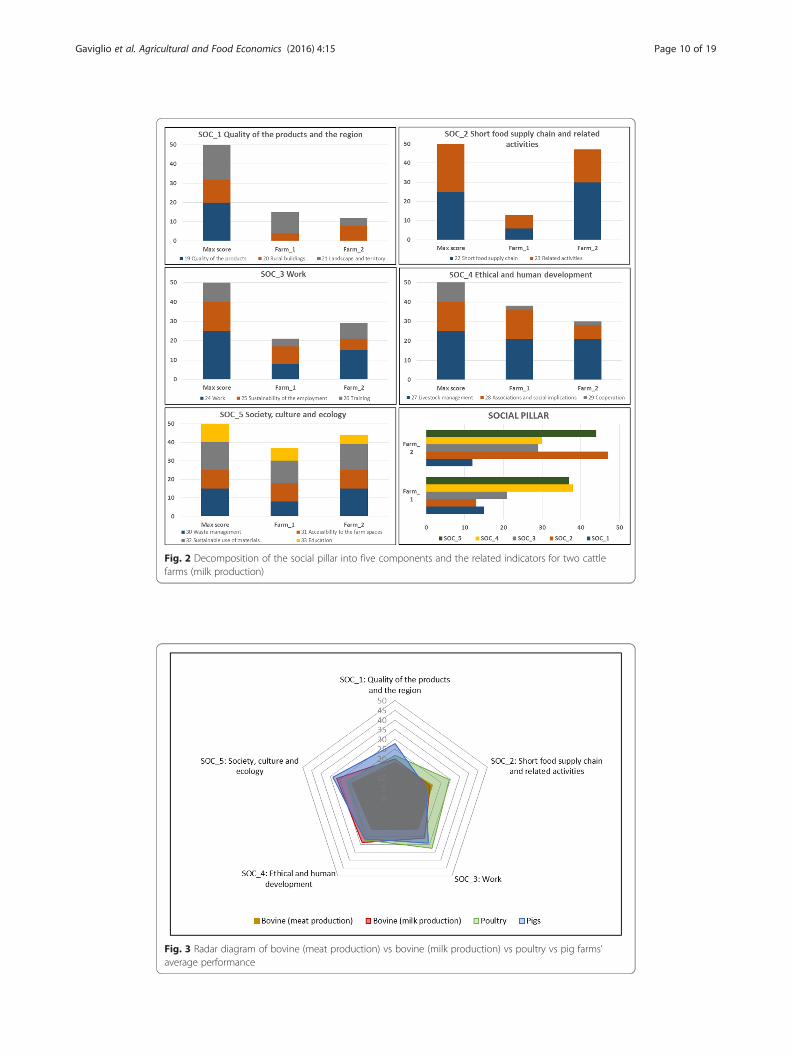
Fig. 3 Radar diagram of bovine (meat production) vs bovine (milk production) vs poultry vs pig farms’average performance
Fig. 2 Decomposition of the social pillar into five components and the related indicators for two cattlefarms (milk production)
Gaviglio et al. Agricultural and Food Economics (2016) 4:15 Page 10 of 19
In Fig. 3, the sample is divided into four categories of livestock type. Cattle farms
(Fig. 3) showed generally lower values, in particular for meat production. These are
often large farms that are not interested and do not have the necessary conditions to
diversify production and to develop systems of short chain and related activities. In the
CS_2 component (short food supply chain and related activities), they reached an over-
all score of 19 and 20, respectively, for milk and meat production, while poultry
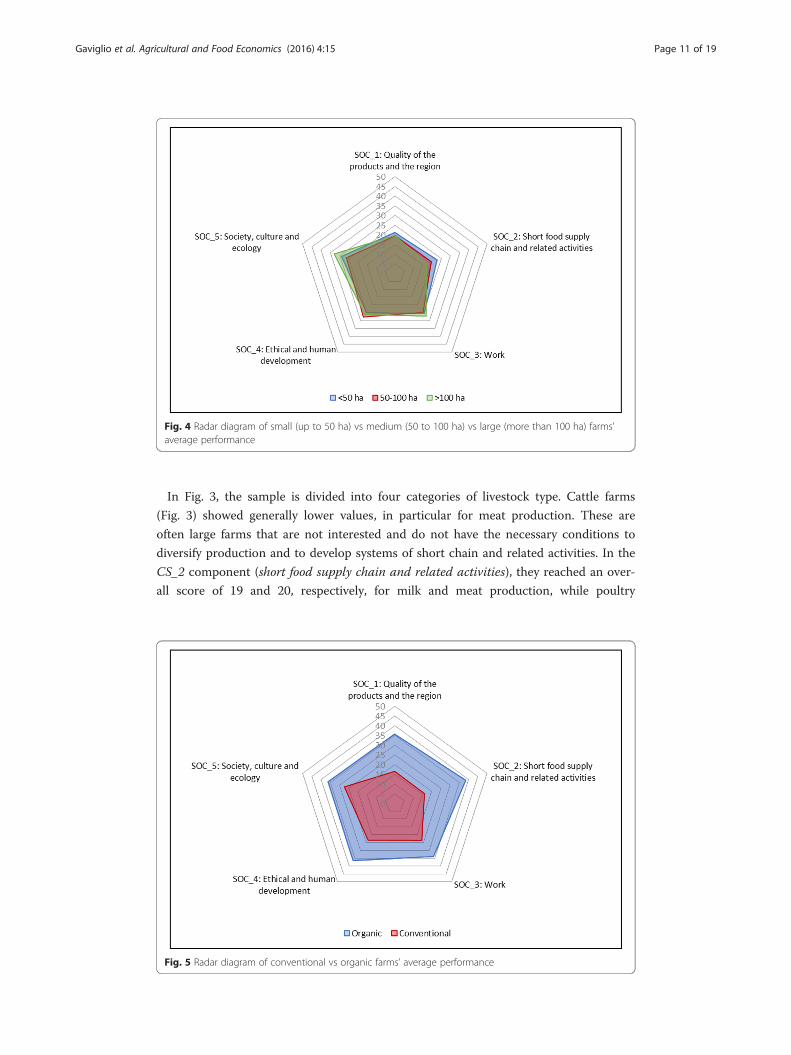
Fig. 4 Radar diagram of small (up to 50 ha) vs medium (50 to 100 ha) vs large (more than 100 ha) farms’average performance
Fig. 5 Radar diagram of conventional vs organic farms’ average performance
Gaviglio et al. Agricultural and Food Economics (2016) 4:15 Page 11 of 19

achieved 29.5 out of 50. This is probably because their product types are often sold to
only a few large clients. On the contrary, pigs and especially poultry farms achieved the
highest average values in almost all components, because of the diversification of
production and income and the greater ability to offer sales services and other social
functions. Similar results were noticed in the CS_3 component (work). This is probably
due to the higher level of multifunctionality of these farms, rather than a greater de-
mand for workers with livestock, that leads to a higher contribution to employment.
On the other hand, the CS_4 (ethical and human development) and the CS_5 (society,
culture and ecology) components are characterized by higher scores in the cattle, par-
ticularly for milk production, and the pig samples. This result is rather interesting and
suggests the need for further evaluation. The fact that the high level of knowledge re-
quested for these types of systems could also influence education and culture or that,
traditionally, these farmers are more involved in innovation processes are only two of
many potential interpretations.
Figure 4 shows the results of the farms, aggregated by land area classes. Only a
few differences were noted. In particular, the CS_2 component seems to allow
some relevant considerations; smaller farms tend to achieve higher results (22.9
out of 50) because of their predisposition to finding different types of income. The
results of the CS_3 component (work) seems to not be influenced by the land area
of the farms. In the literature, these results have contradictory feedbacks. Our data
is in accord with that of Häni et al. 2003, which did not find any substantial differ-
ence in the corresponding social component (work condition) of the RISE method.
On the other hand, it is in disaccord with Gavrilescu et al. 2012 who, applying the
IDEA method, attributed lower scores to family farms compared to legal entities
mostly because of their rigidity in creating new jobs, low professional training and
a lower minimum wage. Reig-Martinez et al. 2011 found an overall high level of
sustainability, even social, of larger farms that could be explained through the
opportunity to develop a more diversified range of crops and the generation of
sufficient income that has permitted the continuity of agricultural activity. It can
be supposed that these great differences are probably due to the high dissimilarity
of the samples involved in the studies.
Finally, in Fig. 5, the performances of conventional and organic farms are com-
pared. The differences between the two types of production were considerable: or-
ganic farms achieved higher scores in every component. The result of the CS_1
component was expected, in consideration of the relevance of organic certification.
The excellent results in the short chain and the related activities (CS_2) and work
(CS_3) components are a direct consequence of their higher regard for multifunc-
tionality. These aspects also involve the CS_4 and CS_5 components, as confirm-
ation of the higher level of culture, education and training required for the
practice of organic production.
Discussion and conclusionsA new method for the evaluation of the social sustainability of farms has been pro-
posed. It provides easy-to-read results and information at different scales of interpret-
ation. The method seems adequate to perform an evaluation of the social sustainability
of agricultural activities allowing for different approaches, such as:
Gaviglio et al. Agricultural and Food Economics (2016) 4:15 Page 12 of 19
1) Farm comparison by ranking of indicators and farm comparison by aggregate
component ranking: the comparison among farms, or groups of farms, that seems
to be useful for policy-makers to identify agriculturally sustainable practices and
the farm features that influence social sustainability, such as the type of animal
production, land area and multifunctional activities, individual and detailed aspects
of sustainability, as well as a high variability of aspects aggregated together to a
more comprehensive vision of the evaluation;
2) Single indicator evaluation: the evaluation of a single or few aspects of social
sustainability is able to provide synthetic information to farmers who want to
evaluate the level reached by their farm and to know the ways to improve by
comparison with other farms;
3) Score evolution: the temporal comparison looks at the evolution of the results
achieved by farms over time and those that are predictable in the future. This
approach was not calculated in this research, because of the lack of farm data
for different years, but it is still worth being cited because of its potential
multiple utilizations. For example, farmers could use it to evaluate the trend
of their own work, while policy-makers, comparing the performance of
different farms systems over time, could obtain useful information for
decision-making.
The assessment of social sustainability involves some relevant issues, considering
that the current objectives of policy-makers are dedicated to the improvement of
the environment and the landscape (e.g. Greening’s conditions in the new Common
Agricultural Policy) and the social value of agriculture (e.g. the Measures of the
Rural Development Plan).
From a practical point of view, the social pillar often involves themes highly
dependent on the farms’ characteristics that still seem hard to measure because of
the lack of a shared knowledge. Because of this, we believe we have shown an ap-
proach able to avoid the problems of qualitative assessments. Nevertheless, we
point out the need for periodical revision of the method, in order to keep in step
with the evolution of the social issues of the rural sector and improve the quantity
and quality of information provided. For example, as the indicators used in the
analysis relates specifically to social condition inside the farms, an interesting im-
provement may involve the direct assessment of social impact of farms’ activities in
their territories.
In addition, the study underlined that the integration of the method with assessments
of environmental and economic performances could be a valid way to the validation of
the social dimension. Because of its particular sensitivity to the local situation, a further
approach might involve the comparison of the results of farms located in different geo-
graphical contexts.
Endnotes1See Häni et al. (2003), Rasul and Thapa (2004), Van Cauwenbergh et al. (2007), Meul
et al. (2008), Vilain et al. (2008), Zahm et al. (2008), Gómez-Limón and Fernandez
(2010), Parachini et al. (2011), Bonneau et al. (2014).
Gaviglio et al. Agricultural and Food Economics (2016) 4:15 Page 13 of 19

Appendix
Table 3 Framework: sub-indicators, indicators and dimensions
Farm characteristic Source Code Sub-indicator Scorerange
Code Indicator Maxscore
Number of productsinvolved in quality certifiedproducts
Questionnaire S_1_a Quality certifiedcommodities
0–∞ S_1 Quality ofthe products
20
Number of quality certifiedproducts
Questionnaire S_1_b Quality certifiedfood products
0–∞
Number of vegetal organicproducts
Questionnaire S_1_c Vegetal organicproduction
0–∞
Number of animal organicproducts
Questionnaire S_1_d Animal organicproduction
0–∞
Aesthetics care of ruralbuildings
Questionnaire S_2_a Aesthetics of ruralbuildings
0–4 S_2 Ruralbuildings
12
Maintenance of the originaluse of the rural buildings
Questionnaire S_2_b Maintenance ofthe original useof the ruralbuildings
0–4
Number of buildings built orrenovate using “greentechniques”
Questionnaire S_2_c Green buildingtechniques
0–∞
Maintenance of the farmgreen spaces
Questionnaire S_3_a Greenmaintenance
0–4 S_3 Landscapeand territory
18
Presence of hedges, rowsand wooded bands
Questionnaire S_3_b Hedges, rows andwooded bands
0–4
Maintenance of the roadsand paths
Questionnaire S_3_c Maintenance ofthe roads andpaths
0–4
Number of crop species/UAA(N/ha)
SIARLDatabase
S_3_d Cropdiversification
0–6
Selling through direct sale(farm shop)
Questionnaire S_4_a Direct sales 0–3 S_4 Short foodsupply chain
30
Selling through onlinewebsite, portals, etc.
Questionnaire S_4_b Online sales 0–1
Income from short chainchannels/income fromconventional channels (%)
Questionnaire S_4_c Direct salesrelevance
0–20
Number of product soldthrough direct sale channels
Questionnaire S_4_d Product soldthrough directsales
0–∞
Sales through ethicalpurchasing groups
Questionnaire S_4_e Sales throughethicalpurchasinggroups
0–3
Sales through farmers’markets
Questionnaire S_4_f Sales throughfarmers’ markets
0–2
Sales to restaurant and shops Questionnaire S_4_g Sales torestaurant andshops
0–2
Sales to dining halls Questionnaire S_4_h Sales to dininghalls
0–3
Social services (e.g. snowremoval, composting,maintenance of private andpublic green areas)
Questionnaire S_5_a Social services 0–2 S_5 Relatedactivities
20
Gaviglio et al. Agricultural and Food Economics (2016) 4:15 Page 14 of 19

Table 3 Framework: sub-indicators, indicators and dimensions (Continued)
Type of related activities (e.g.agritourism, B&B, restaurant)
Questionnaire S_5_b Type of relatedactivities
0–10
Educational farm, teaching Questionnaire S_5_c Educational farm 0–5
Presence of other socialactivities (e.g. disadvantagespeople, children, socialinclusion)
Questionnaire S_5_d Social activities 0–5
UAA/annual amount of work(ha/h)
SIARLDatabase,Questionnaire
S_6_a Annual Work Unit(AWU)
0–8 S_6 Work 25
Number of newemployments (in the last5 years)
Questionnaire S_6_b Newemployments
0–∞
Number of farm productsprocessing
Questionnaire S_6_c Farm productsprocessing
0–∞
Number of workers whoresided in the farm buildings
Questionnaire S_7_a Workers whoresides in thefarm buildings
0–2 S_7 Sustainabilityof theemployment
15
Number of local workers/total number of employee(%)
Questionnaire S_7_b Local workers 0–1
Number of female workers/total number of workers (%)
Questionnaire S_7_c Female workers 0–4
Age of the entrepreneur Questionnaire S_7_d Youthentrepreneurship
0–4
Youth workers/total numberof workers (%)
Questionnaire S_7_e Youthemployment
0–4
Training courses for workersformation
Questionnaire S_8_a Training courses 0–∞ S_8 Training 10
Presence of trainees fromschools and universities
Questionnaire S_8_b Trainees 0–2
Training activities unfold infarm
Questionnaire S_8_c Training activitiesunfold in thefarm
0–2
Employment ofdisadvantaged peopleamong the workers
Questionnaire S_8_d Disadvantagedpeople hired
0–5
Number of animal speciesbred
SIARLDatabase
S_9_a Animal species 0–∞ S_9 Livestockmanagement
25
S_9_b1 Type of stableS_9_b2 Management byphysiological phasesS_9_b3 Systems ofventilation or heat reductionS_9_b4 Quality/quantitycontrol of the feedS_9_b5 Attendance at birthS_9_b6 Systems of cleaning
Questionnaire S_9_b Cattle 0–20
S_9_c1 Type of flooringS_9_c2 Systems ofventilation or heat reductionS_9_c3 Handling systems ofanimalsS_9_c4 Presence of materialsof environmental enrichment
Questionnaire S_9_c Swine 0–20
S_9_d1 Type of stableS_9_d2 Systems ofventilation or heat reduction
Questionnaire S_9_d Poultry 0–20
Gaviglio et al. Agricultural and Food Economics (2016) 4:15 Page 15 of 19

Table 3 Framework: sub-indicators, indicators and dimensions (Continued)
S_9_d3 Presence ofopenings and/or windowsS_9_d4 Quality/quantitycontrol of the feed
S_9_e1 Outdoor spaces andpasturageS_9_e2 Quality/quantity ofthe feedS_9_e3 Attendance at birthS_9_e4 Systems of cleaning
Questionnaire S_9_e Sheep and goats 0–20
Participation in associations Questionnaire S_10_a Association 0–5 S_10 Associationsand socialimplications
15
Position of responsibility inassociations
Questionnaire S_10_b Responsibility inthe associations
0–5
Participation in consortium Questionnaire S_10_c Consortium 0–5
The entrepreneur resides infarm
Questionnaire S_10_d Residence of theentrepreneur infarm
0–2
Direct sales managed incooperation with other farmsand associations
Questionnaire S_11_a Direct salesmanaged incooperation
0–2 S_11 Cooperation 10
Selling of other farm’sproducts in the direct sale
Questionnaire S_11_b Selling of otherfarm’s products
0–2
Agritourism managed incooperation
Questionnaire S_11_c Agritourismmanaged incooperation
0–2
Farm structures and/ormachineries managed incooperation
Questionnaire S_11_d Farm structuresand machineriesmanaged incooperation
0–2
Workforce managed incooperation
Questionnaire S_11_e Workersmanaged incooperation
0–2
Separate waste management Questionnaire S_12_a Wastemanagement
0–4 S_12 Wastemanagement
15
Use of recyclable materialsfor the farm activities
Questionnaire S_12_b Recyclablematerials for thefarm activities
0–4
Use of compost Questionnaire S_12_c Use of compost 0–3
Mulching Questionnaire S_12_d Mulching 0–4
Presence of public farmspaces
Questionnaire S_13_a Public farmspaces
0–5 S_13 Accessibilityto the farmspaces
10
Presence of recreational farmspaces
Questionnaire S_13_b Recreational farmspaces
0–5
Self produced feed/Feedrequirement (%)
Questionnaire S_14_a Self-producedfeed
0–5 S_14 Sustainableuse ofmaterials
15
Self-produced fertilizer/fertilizer requirement(% of nitrogen)
Questionnaire S_14_b Self-producedfertilizers
–1–5
Amount of livestockcomeback
Questionnaire S_14_c Livestockcomeback
0–4
Use of methods for thewater saving
Questionnaire S_14_d Saving water 0–2
Self-produced seeds andplants
Questionnaire S_14_e Self-producedseeds and plants
0–2
Schooling level of the farmworkers
Questionnaire S_15_a Schooling level ofthe farm workers
0–10 S_15 Education 10
Gaviglio et al. Agricultural and Food Economics (2016) 4:15 Page 16 of 19

AbbreviationsPASM, Parco Agricolo Sud Milano, in English “South Milan Agricultural Park”; PDO, Protected Denomination of Origin;SIARL, Sistema informativo Agricoltura Regione Lombardia
AcknowledgementsThe authors would thank the Città Metropolitana di Milano, the Parco Agricolo Sud Milano and the FondazioneCariplo for their support.
Authors’ contributionsThis paper is the result of the contribution between all Authors. The “Background” section is attributable to AP, the“Method: Framework” to AG, the “Method: The components” to ED, “Method: Case study” to MEM, the “Results anddiscussion” to MB and the “Conclusion” to all authors. All authors read and approved the final manuscript.
Authors’ informationAG is Associate Professor at the University of Milan (Department of Health, Animal Science and Food Safety, VESPA).MB is PhD student at the University of Milan (Department of Health, Animal Science and Food Safety, VESPA).MME is PhD student at the University of Milan (Department of Health, Animal Science and Food Safety, VESPA).ED is Researcher at the University of Milan (Department of Health, Animal Science and Food Safety (VESPA).AP is Full Professor at the University of Milan (Department of Health, Animal Science and Food Safety, VESPA).
Competing interestsThis research was financed by the Fondazione Cariplo and it was supported by the Città Metropolitana di Milano andthe Parco Agricolo Sud Milano.
Received: 30 October 2015 Accepted: 11 July 2016
ReferencesBessière J (1998) Local development and heritage: traditional food and cuisine as tourist attractions in rural areas.
Sociol Rural 38(1):21–34Bonneau M, Klauke TN, Gonzàlez J, Rydhmer L, Ilari-Antoine E, Dourmad JY, de Greef K, Houwers HWJ, Cinar MU,
Fàbrega E, Zimmer C, Hviid M, van der Oever B, Edwards SA (2014) Evaluation of the sustainability of contrastedpig farming systems: integrated evaluation. Animal 8(12):2058–2068
Briquel V, Vilain L, Bourdais J-L, Girardin P, Mouchet C, Viaux P (2001) La méthode IDEA (indicateurs de durabilité desexploitations agricoles): une démarche pédagogique. Ingénieries EAT 25:29–39
Broom DM (2010) Animal welfare: an aspect of care, sustainability, and food quality required by the public. J Vet MedEduc 37(1):83–88
Chatzinikolaou P, Manos B (2012) Review of existing methodologies and tools for measuring sustainability in ruralareas. http://www.feem-project.net/belpasso_2012/files/studpapers/Paper_Chatzinikolaou.pdf
Chinnici G, D’Amico M, Pecorino B (2002) A multivariate statistical analysis on the consumers of organic products. BrFood J 104(3/4/5):187–199
Demartini E, Gaviglio A, Bertoni D (2015) Integrating agricultural sustainability into policy planning: a geo-referencedframework based on rough set theory. Environ Sci Pol 54:226–239
Dimara E, Skuras D (2003) Consumer evaluations of product certification, geographic association and traceability inGreece. Eur J Mark 37(5/6):690–705
Elfkih S, Guldara I, Mtimet N (2012) Are Tunisian olive growing farms sustainable? An adopted IDEA approach analysis.Span J Agric Res 10(4):877–889
Falguera V, Aliguer N, Falguera M (2012) An integrated approach to current trends in food consumption: movingtoward functional and organic products? Food Control 26(2):274–281
Fortun-Lamothe L, Combes S, Gidenne T (2009) Contribution of intensive rabbit breeding to sustainable development,a semi-quantitative analysis of the production in France. World Rabbit Sci 17:79–85
Fotopoulos C, Krystallis A (2002) Organic product avoidance: reasons for rejection and potential buyers’ identification ina countrywide survey. Br Food J 104(3/4/5):233–260
Gafsi M, Favreau JL (2010) Appropriate method to assess the sustainability of organic farming systems. In: Proceedingsof the 9th European IFSA Symposium, Vienna, 4-7 July 2010: 912-921.
Gaviglio A, Pirani A (2015) Consumer perception of cured pork meats: the added value of the organic attribute foodanalysis. Czech J Food Sci 33(1):32–36
Gaviglio A, Pirani A, Bertocchi M (2014a) Development of the environmental, social and economic sustainability in the peri-urban agricultural areas: governance opportunities in the South Milan Agricultural Park. Adv Eng Forum 11:417–423
Gaviglio A, Bertocchi M, Silvestri S, Pirani A (2014b) The use of environmental, economic and social indicators asdecision support for the advancement of farms towards Sustainability. In: Sustainability of the agri-food system:strategies and performances. Proceedings of the 50th SIDEA conference, Lecce, 26-28 September 2013: 215-225.
Gaviglio A, Demartini E, Pirani A, Marescotti ME, Bertocchi M (2015b) National brands versus private labels versus nicheproducts: a graphical representation of consumers’ perception. Paper prepared for presentation at the EAAE-AAEAJoint Seminar ‘Consumer Behavior in a Changing World: Food, Culture, Society. March 25 to 27, 2015 Naples, Italy.
Gavrilescu C, Toma C, Turtoi C (2012) Assessment of the sustainability of agricultural holdings in macroregion 1 usingthe IDEA method. Bulletin UASVM Horticulture 69(2):122–130
Girardin P, Bockstaller C, van der Werf HMG (1999) Indicators: tools to evaluate the environmental impacts of farmingsystems. J Sustain Agric 13:5–21
Gómez-Limón JA, Riesgo L (2009) Alternative approaches to the construction of a composite indicator of agriculturalsustainability: an application to irrigated agriculture in the Duero basin in Spain. J Environ Manag 90(11):3345–3362
Gaviglio et al. Agricultural and Food Economics (2016) 4:15 Page 17 of 19

Gómez-Limón JA, Sanchez-Fernandez G (2010) Empirical evaluation of agricultural sustainability using compositeindicators. Ecol Econ 69(5):1062–1075
Hamm U, Gronefeld F (2004) The European market for organic food: revised and updated analysis, The Europeanmarket for organic food: revised and updated analysis
Hand MS, Martinez S (2010) Just what does local mean. Choices 25(1):13–18Häni F, Braga F, Stämpfli A, Keller T, Fisher M, Porche H (2003) RISE, a tool for holistic sustainability assessment at the
farm level. Int Food Agribus Man Rev 6(4):78–90Hansen JW (1996) Is agricultural sustainability a useful concept? Agric Syst 50(2):117–143INEA (2014) L’agricoltura Lombardia Conta 2014. http://dspace.inea.it/handle/inea/1037Jacobs M (1995) Sustainable development—from broad rhetoric to local reality. Conference Proceedings from Agenda
21 in Cheshire. Cheshire County Council, Document No. 493.Kihlberg I, Risvik E (2007) Consumers of organic foods—value segments and liking of bread. Food Qual Prefer 18(3):471–481Littig B, Griessler E (2005) Social sustainability: a catchword between political pragmatism and social theory. Int J
Sustain Dev 8(1/2):65–79Lockie S (2009) Responsibility and agency within alternative food networks: assembling the “citizen consumer”. Agric
Hum Values 26(3):193–201Magnusson MK, Arvola A, Hursti UKK, Åberg L, Sjödén PO (2003) Choice of organic foods is related to perceived
consequences for human health and to environmentally friendly behaviour. Appetite 40(2):109–117Makatouni A (2002) What motivates consumers to buy organic food in the UK? Results from a qualitative study. Br
Food J 104(3/4/5):345–352Mazzocchi C, Sali G, Corsi S (2013) Land use conversion in metropolitan areas and the performance of agriculture:
Sensitivity Index of Agricultural Land (SIAL), a tool for territorial analysis. Land Use Policy 35:155–162Meul M, Van Passel S, Nevens F, Dessein J, Rogge E, Mulier A, Van Hauwermeiren A (2008) MOTIFS: a monitoring tool
for the integrated farm sustainability. Agron Sustain Dev 28:321–332Migliorini P, Scaltriti B (2012) Evaluation of sustainability of the farms in the Agricultural Park of South Milan and their
production chain. Special issue New Medit 4:53–56Omann I, Spangenberg JH (2002) Assessing social sustainability. The social dimension of sustainability in a socio-
economic Scenario. Presented at the 7th Biennial Conference of the International Society for Ecological Economics“in Sousse (Tunisia), 6-9 March 2002.
Pacini C, Giesen G, Wossink A, Omodei-Zorini L, Huirne R (2004) The EU’s Agenda 2000 reform and the sustainability oforganic farming in Tuscany: ecological-economic modelling at field and farm level. Agr Syst 80(2):171–197
Paracchini ML, Pacini C, Jones MLM, Pérez-Soba M (2011) An aggregation framework to link indicators associated withmultifunctional land use to the stakeholder evaluation of policy options. Ecol Indic 11(1):71–80
Paracchini ML, Bulgheroni C, Borreani G, Tabacco E, Banterle A, Bertoni D, Rossi G, Parolo G, Origgi R, De Paola C (2015)A diagnostic system to assess sustainability at a farm level: The SOSTARE model. Agric Syst 133:35–53
Pieniak Z, Aertsens J, Verbeke W (2010) Subjective and objective knowledge as determinants of organic vegetablesconsumption. Food Qual Prefer 21(6):581–588
Platania M, Privitera D (2006) Typical products and consumer preferences: the ‘soppressata’ case. Br Food J 108(5):385–395Rasul G, Thapa GB (2004) Sustainability of ecological and conventional agricultural systems in Bangladesh: an
assessment based on environmental, economic and social perspectives. Agric Syst 79:327–351Reig-Martınez E, Gómez-Limón JA, Picazo-Tadeo AJ (2011) Ranking farms with a composite indicator of sustainability.
Agric Econ 42:561–575Rigby D, Woodhouse P, Young T, Burton M (2001) Constructing a farm level indicator of sustainable agricultural
practice. Ecol Econ 39:463–478Santini F, Paloma SG (2013) Short food supply chains and local food systems in the EU: a state of play of their socio-economic
characteristics, Publications OfficeSeyfang G (2006) Ecological citizenship and sustainable consumption: examining local organic food networks. J Rural
Stud 22(4):383–395Singh RK, Murty HR, Gupta SK, Dikshit AK (2009) An overview of sustainability assessment methodologies. Ecol Indic
9(2):189–212Smith CS, McDonald GT (1998) Assessing the sustainability of agriculture at the planning stage. J Environ Manag 52:15–37Thiollet-Scholtus M, Bockstaller C (2015) Using indicators to assess the environmental impacts of wine growing activity:
The INDIGO® method. Eur J Agron 62:13–25Van Cauwenbergh N, Biala K, Bielders C, Brouckaert V, Franchois L, Garcia Cidad V, Hermy M, Mathijs E, Muys B,
Reijnders J, Sauvenier X, Valckx J, Vanclooster M, Van der Veken B, Wauters E, Peeters A (2007) SAFE—a hierarchicalframework for assessing the sustainability of agricultural systems. Agric Ecosyst Environ 120(2-4):229–242
Van Der Werf HMG, Petit J (2002) Evaluation of the environmental impact of agriculture at the farm level: a comparisonand analysis of 12 indicator based methods. Agric Ecosyst Environ 93(1):131–145
Van Ittersum K, Meulenberg MT, Van Trijp H, Candel MJ (2007) Consumers’ appreciation of regional certification labels:a Pan‐European study. J Agric Econ 58(1):1–23
Vanhonacker F, Lengard V, Hersleth M, Verbeke W (2010) Profiling European traditional food consumers. Br Food J112(8):871–886
Verbeke W, Pieniak Z, Guerrero L, Hersleth M (2012) Consumers’ awareness and attitudinal determinants of EuropeanUnion quality label use on traditional foods. Bio-based Appl Econ 1(2):213–229
Verlegh PW, Steenkamp JBE (1999) A review and meta-analysis of country-of-origin research. J Econ Psychol 20(5):521–546Viglizzo EF, Frank F, Bernardos J, Buschiazzo DE, Cabo S (2006) A rapid method for assessing the environmental
performance of commercial farms in the Pampas of Argentina. Environ Monit Assess 117:109–134Vilain L (2008) La méthode IDEA. Edicagri éditions, FranceVon Wiren-Lehr S (2001) Sustainability in agriculture—an evaluation of principal goals-oriented concepts to close the
gap between theory and practice. Agric Ecosyst Environ 93:131–145Wells S (2001) Pandora’s seed: the unforeseen cost of civilization. Random House, New York, New York, USA
Gaviglio et al. Agricultural and Food Economics (2016) 4:15 Page 18 of 19

Zahm F, Viaux P, Girardin P, Vilain L, Mouchet C (2008) Assessing farm sustainability with the IDEA method—from theconcept of farm sustainability to case studies on French farms. Sustain Dev 16:271–281
Zanoli R, Naspetti S (2002) Consumer motivations in the purchase of organic food: a means end approach. Br Food J104(8):643–653
Zimmerer KS, Bassett TJ (2003) Political ecology: an integrative approach to geography and environment-developmentstudies. Guilford Press.
Submit your manuscript to a journal and benefi t from:
7 Convenient online submission
7 Rigorous peer review
7 Immediate publication on acceptance
7 Open access: articles freely available online
7 High visibility within the fi eld
7 Retaining the copyright to your article
Submit your next manuscript at 7 springeropen.com
Gaviglio et al. Agricultural and Food Economics (2016) 4:15 Page 19 of 19