the soret coefficients of the ternary system water/ethanol
TRANSCRIPT
Eur. Phys. J. E (2021) 44:128 https://doi.org/10.1140/epje/s10189-021-00134-6
THE EUROPEANPHYSICAL JOURNAL E
Regular Article – Flowing Matter
The Soret coefficients of the ternary systemwater/ethanol/triethylene glycol and its correspondingbinary mixturesM. Schraml1, H. Bataller2, C. Bauer1, M. M. Bou-Ali3, F. Croccolo2, E. Lapeira3, A. Mialdun4, P. Mockel1,A. T. Ndjaka2,5, V. Shevtsova3,6, and W. Kohler1,a
1 Physikalisches Institut, Universitat Bayreuth, 95440 Bayreuth, Germany2 Universite de Pau et des Pays de l’Adour, E2S UPPA, CNRS, TotalEnergies, LFCR UMR5150, Anglet, France3 Mondragon Unibertsitatea, 20500 Arrasate-Mondragon, Spain4 MRC, CP 165/62, Universite libre de Bruxelles (ULB), 50, Ave. F.D. Roosevelt, B-1050 Brussels, Belgium5 BRGM, Orleans, France6 Ikerbasque, Basque Foundation for Science, Bilbao, Spain
Received 22 July 2021 / Accepted 2 October 2021© The Author(s) 2021
Abstract Thermodiffusion in ternary mixtures is considered prototypic for the Soret effect of truly mul-ticomponent systems. We discuss ground-based measurements of the Soret coefficient along the binaryborders of the Gibbs triangle of the highly polar and hydrogen bonding ternary DCMIX3-systemwater/ethanol/triethylene glycol. All three Soret coefficients decay with increasing concentration, irrespec-tive of the choice of the independent component, and show a characteristic sign change as a function oftemperature and/or composition. With the exception of triethylene glycol/ethanol at high temperatures,the minority component always migrates toward the cold side. All three binaries exhibit temperature-independent fixed points of the Soret coefficient. The decay of the Soret coefficient with concentration canbe related to negative excess volumes of mixing. The sign changes of the Soret coefficients of the binariesallow to draw far-reaching conclusions about the signs of the Soret coefficients of the corresponding ternarymixtures. In particular, we show that at least one ternary composition must exist, where all three Soretcoefficients vanish simultaneously and no steady-state separation is observable.
1 Introduction
The Soret effect describes a thermodiffusive flow andthe subsequent establishment of a composition gradi-ent in a multicomponent fluid mixture subjected to atemperature gradient. Although most liquid mixturesof practical relevance, be it biological systems or crudeoil reservoirs [1], can contain a large number of con-stituents, research has mainly dealt with binary mix-tures. It is only recently that the focus has begun toshift to ternaries as prototypes of truly multicomponentmixtures. In the following, we will discuss ground-basedmeasurements on the binaries of the ternary systemthat has been investigated during the third mission ofthe DCMIX microgravity project. The DCMIX projectof the European Space Agency (ESA) and the Rus-sian Space Agency (Roscosmos) has established a basisof microgravity experiments on ternary liquid mixturessubjected to a temperature gradient that can serve asconvection-free references for ground experiments [2].
a e-mail: [email protected] (correspondingauthor)
DCMIX consists of four individual campaigns, namedDCMIX1 to DCMIX4, onboard the International SpaceStation (ISS). The five ternary samples of DCMIX1were mixtures of dodecane, isobutyl benzene, and tetra-lin of different compositions. No undue complicationswere expected for this system, whose correspondingbinaries were already very well characterized [3]. Thefocus of DCMIX2 was on mixtures of toluene, methanol,and cyclohexane, which exhibit a miscibility gap and acritical point [4]. DCMIX4 had exploratory characterand contained, among additional DCMIX2-mixtures,polymer solutions, and a nanofluid [5].
The here presented work deals with the DCMIX3-system water (H2O), ethanol (ETH), and triethyleneglycol (TEG) [6]. These molecules are highly polar, andthe prevailing hydrogen bonding leads to much morecomplex interactions than the dominating dispersioninteractions of the DCMIX1- and DCMIX2-mixtures.A consequence of these strong interactions is large neg-ative excess volumes of mixing.
The aim of the following work is the investigationof diffusion and thermodiffusion along the three binaryborders of the ternary Gibbs triangle of the DCMIX3system. One of these binaries, ETH/H2O, has already
0123456789().: V,-vol 123

128 Page 2 of 12 Eur. Phys. J. E (2021) 44:128
been characterized in the literature [7,8]. It shows aremarkable sign change of the Soret coefficient and isknown for instabilities and oscillatory convection indouble-diffusive convection experiments [9,10]. A thor-ough characterization of the binaries is of great impor-tance, as they define the values to which the transportcoefficients of the ternary mixtures extrapolate in thelimit of vanishing concentration of either one of thecomponents. Since their measurement does not requirecomplicated two-color experiments with the inversionof a potentially ill-conditioned contrast factor matrix,they can be obtained with a very good accuracy bymeans of, e.g., single color optical techniques. Otherthan for ternaries, convection can usually be avoidedfor binary mixtures in a Soret cell. The proper strategyis to select the direction of the temperature gradientsuch that the solutal separation leads to a stable strat-ification with the higher density at the bottom of thecell. If this requires heating from below, the stabilityrequirement is that the thermal Rayleigh number mustnot exceed its critical value.
In the last part of our work, we show how the infor-mation gathered for the binaries around the perimeterof the ternary Gibbs triangle can be used to infer prop-erties of the ternary Soret coefficients. In particular, weshow that the sign changes of the Soret coefficients ofthe binaries lead to the existence of a singular pointinside the Gibbs triangle where all three ternary Soretcoefficients vanish simultaneously.
2 Experimental
2.1 Optical beam deflection
The majority of the measurements were performed bymeans of the well-established optical beam deflection(OBD) technique [7,8,11,12]. The design of the instru-ment is similar to the one described in Ref. [13] withonly slight modifications. The sample is inside a Soretcell with a vertical temperature gradient defined by twohorizontal copper plates that are kept at a tempera-ture difference of typically 1K with a stability of betterthan 10mK. The lateral confinement consists of an opti-cal glass frame and thin Teflon gaskets that togetherdefine the height of the fluid slab of h = 1.43mm. Thepath length inside the liquid is 10.00mm. The refractiveindex gradient in the cell contains contributions fromboth the temperature and the concentration gradient,which can be separated on the basis of their very differ-ent characteristic time constants. The total refractiveindex gradient is read by deflection of a laser beam ofλ = 637 nm at a distance of 1.325m behind the Soretcell, whose position is detected by a line camera.
High quality ethanol (VWR LOT 19B064011, 99.96%),triethylene glycol (Acros 99%, LOT A0389346) andde-ionized and filtrated water (resistivity 18.5MΩcm,PAK-filter 0.22μm) retrieved from a Millipore Milli-Qfiltration station were used to prepare typically 3–4g ofevery sample to the required composition in mass frac-
tions using an analytical balance (Sartorius BP 211 D,±0.5mg).
Refractive indices were measured over the entire com-position range for typically ten intermediate concentra-tions by means of an Abbe refractometer (Anton Paar,Abbemat WR-MW). The temperature dependence ofthe refractive index was determined interferometricallyas described in Ref. [14] with the proper correction forthe temperature dependence of the refractive index ofthe glass windows of the cell given in Ref. [8]. Based onthese measurements, the refractive indices are param-eterized by polynomials in the concentration c of thefirst component and the temperature ϑ = T − 273.15Kin Centigrade:
n(c, T ) = (1 ϑ)(
a00 a01 a02 a03
a10 a11 a12 a13
)⎛⎜⎝
1cc2
c3
⎞⎟⎠ . (1)
The matrix coefficients aij are tabulated in Table 1.Excess volumes were computed from density measure-ments with an Anton Paar DSA 5000 density meter.
2.2 Optical digital interferometry and counter-flowcell
Diffusion and Soret coefficients of selected tempera-tures and compositions were also measured by meansof optical digital interferometry (ODI) and the diffu-sion coefficients at the two dilute limits of TEG/ETHwith a counter-flow cell (CFC). Similar to OBD, theODI instrument uses the Soret cell and optical diag-nostics. It differs by the cell size and by the approachto the interpretation of the optical signal. The Soretcell used in the ODI setup has a square glass framewith an inner size of 18.00 × 18.00mm2. The frameis clamped between two metal plates with intermedi-ate seals made of a special thermally conductive rub-ber. The total diffusion path (plate-to-plate distance) isequal to h = 6.26 mm. This relatively large cell heightlimits the measurements to mixtures with a positiveSoret coefficient and a corresponding stable separation.The temperature difference applied to the cell dependedon the mixture under investigation. The separation inTEG/H2O-mixture was studied at ΔT = 4.00 K, whilethe applied temperature difference was 6.00 K for theTEG/ETH-mixture with its smaller optical signal. Thestability of the temperature regulation, estimated as thestandard deviation of ΔT records, is around 1 mK. Therefractive index gradients appearing in the liquid insidethe cell due to thermal or solutal inhomogeneities aresensed by an expanded and collimated laser beam ofλ = 532 nm, directed into a Mach–Zehnder interferom-eter, with the cell being placed in one arm of the inter-ferometer. The optical phase variation is then extractedfrom the raw interference fringe patterns using a 2-DFourier transform technique. The temporal and spatialvariation of the refractive index along the diffusion path
123

Eur. Phys. J. E (2021) 44:128 Page 3 of 12 128
Table 1 Parameterization of the refractive indices of TEG/ETH and TEG/H2O for λ = 633 nm and for λ = 532 nmaccording to Eq. (1)
aij Units 633 nm 532 nm
TEG/ETH TEG/H2O TEG/ETH TEG/H2O
a00 1.36974 1.3337 1.37223 1.33714a10 10−4 K−1 −4.4696 −0.7593 −4.1728 −0.9207a01 0.06618 0.11976 0.07283 0.11942a11 10−4 K−1 3.2519 −3.1494 1.3316 −2.1410a02 0.02639 0.04861 0.02124 0.05002a12 10−4 K−1 −2.1476 −1.5595 −0.5566 −2.8940a03 – −0.04041 – −0.04054a13 10−4 K−1 – 2.2465 – 2.6673
is fitted to different analytical solutions describing theSoret separation in this geometry, allowing to simul-taneously extract both diffusion and Soret coefficients.More information on the instrument and the image pro-cessing can be found in Refs. [15,16].
The isothermal diffusion at dilute limits was mea-sured by a similar interferometer using the same dataextraction approach. The counter-flow cell for the diffu-sion study is a metal frame with rectangular opening of20.0 × 5.0mm2 clamped between two optical windowsusing PTFE gaskets. The liquid filled space between theinner surfaces of the windows is 5.00mm. Two inletslocated at the top and the bottom of the cell allowinjection of two solutions of slightly different concen-trations; the heavier one is injected from the bottom toavoid instability. Two outlets located symmetrically onlateral walls at the mid-height of the cell, at 10.0mmensure the formation of a sharp interface between bothsolutions during injection. After the injection stop andsealing of the ports, the interface elution due to dif-fusion is monitored in time along the diffusion path.More details of the instrument and the data extractionare available in Refs. [17,18].
Some chemicals (TEG and ETH) used for the experi-ments conducted with ODI and CFC setups were equiv-alent by grade and manufacturer to ones used in theOBD experiments, while extra pure deionized water waspurchased from Acros Organics (LOT A0396624).
2.3 Nonequilibrium fluctuations and shadowgraphy
Additional measurements for TEG/H2O-mixtures atselected compositions and temperatures were performedby means of the dynamic shadowgraphy technique(SG), which is based on optical detection of nonequi-librium fluctuations (NEFs). These measurements aredescribed in full detail in Ref. [19] and will only brieflybe summarized. The results are included here, sincethey are based on somewhat different principles andvery nicely align with the OBD and ODI experiments.
A fluid submitted to a gradient of temperature orconcentration shows thermal and/or solutal nonequilib-rium fluctuations that happen at all wavelengths, whoseamplitude can be orders of magnitude larger than that
of the equilibrium ones and whose size can grow upto macroscopic scales [20,21], so that they are usuallyreferred to as ‘giant’ fluctuations [21–23]. The asso-ciated refractive index fluctuations generate scatteredbeams that interfere with the transmitted one. Thelight intensity modulations can be collected by a pixe-lated sensor and analyzed in order to extract thermo-physical properties of the fluid [24].
The employed shadowgraph setup is similar to theone described in Ref. [25]. A Soret cell of 25mm diam-eter contains the liquid sample that is vertically con-fined by two horizontal square sapphire windows at adistance of h = 2mm. Their temperatures are regulatedby two Peltier elements with a central circular apertureof 13mm in diameter. Contrary to OBD and ODI, theobservation is not perpendicular to but rather along thedirection of the temperature gradient.
Thermodiffusion experiments were performed at meantemperatures of 20, 25, and 30 ◦C with a temperaturedifference of 20K between the two sapphire windows.The temperature gradient was anti-parallel to gravityfor c = 0.3 (heating from above) and parallel for c = 0.5and 0.7 (heating from below). Once the steady state isachieved, a typical experiment consists of recording aseries of images for a given acquisition frame rate. Theanalysis of each image series is performed by means ofthe Differential Dynamic Algorithm through a customprogram taking advantage of GPU parallel execution[26,27] in order to extract the structure function of theimages [25]. The fit of a model temporal correlationfunction to the structure function allows to extract thedecay times of the nonequilibrium fluctuations of theconcentration and eventually obtain an indirect mea-surement of the mass diffusion and the Soret coefficientsof the mixture [19,25].
We also carried out free isothermal diffusion experi-ments for c = 0.5 and 0.7 using a stainless steel annu-lus with thickness of h = 10.0mm. Two inlets and twooutlets allow the superimposition of two fluid layers ofequal thickness and different concentration. Once thetwo layers are in place, the diffusion process is followedby recording series of images in time. Details of this celland of the filling procedure are also given in Ref. [19].The reported diffusion coefficients measured by SG are
123

128 Page 4 of 12 Eur. Phys. J. E (2021) 44:128
mean values from the isothermal measurements and theexperiments with a temperature gradient.
3 Results and discussion
3.1 The binary borders
We report and discuss results for all three binary bor-ders of the ternary DCMIX3 system consisting of H2O,ETH, and TEG. The results for the binaries TEG/H2Oand TEG/ETH are new, the system ETH/H2O haspreviously been studied by Kolodner et al. [7] and inour laboratory [8]. The numerical values of the trans-port coefficients of ETH/H2O can be found in thesetwo original publications and will not be repeated here.The discussion and the numerical fits will focus on theOBD-measurements, which represent a complete andinternally consistent data set. The results obtained bythe other experimental techniques, which are generallyin good agreement but over a more limited parameterrange, will be compared and discussed where appropri-ate.
All OBD-measurements have been evaluated follow-ing the protocol described in, e.g., Refs. [8,28]. Theexperiment starts with an isothermal, homogeneoussample to which a constant temperature gradient isapplied at t = 0 by ramping the temperature of oneplate up and the temperature of the opposite platedown by the same amount of typically δT/2 = 0.5K,thereby keeping the mean sample temperature con-stant. Assuming sufficient time scale separation, the risetime of the temperature gradient can be neglected. Theformation of the concentration gradient is described onthe basis of the extended diffusion equation for the massfraction c(x, t) of the first component:
∂c
∂t= D∇2c + DT c(1 − c)∇2T. (2)
Both the diffusion coefficient D and the thermodiffu-sion coefficient DT are assumed constant within the1-Kelvin-temperature variation in the cell. The Soretcoefficient ST = DT /D determines the concentrationgradient in the nonequilibrium steady state. For suffi-ciently small Soret coefficients ST � 1/δT , as prevalentin our experiments, the product c(1−c) can be assumedconstant. The transient beam deflection signal is fittedby an analytic solution of Eq. (2) to obtain D from thecharacteristic time constant τ = h2/D. For DT and ST ,the beam deflections need additionally be transformedfrom the refractive index to the concentration space bymeans of the optical contrast factors (∂n/∂T )p,c and(∂n/∂c)p,T .
The focus of our discussion is on the Soret coeffi-cients, but we also document the diffusion coefficientsfor reference. Our measured diffusion coefficients forTEG/H2O and TEG/ETH are tabulated as functionsof concentration and temperature in Tables 2 and 3,
0 0.2 0.4 0.6 0.8 1
c(TEG)
-10
-5
0
5
10
ST /
10-3
K-1
10 °C OBD15 °C20 °C25 °C30 °C35 °C40 °C20 °C SG25 °C 30 °C 10 °C ODI20 °C30 °C40 °CMaeda et al.
Fig. 1 OBD-measurement (filled circles) of the Soret coef-ficient of TEG/H2O for different temperatures as a functionof TEG-concentration c. The filled diamonds at c = 0.3were obtained by SG and the open squares by ODI. Thedata at the lowest concentration of c = 0.01 are calculatedaccording to Maeda et al. [31] as ST = 9.4 × 10⁻³ K−1 −3.0×10⁻⁵ K−2T (open diamonds). The solid lines representa simultaneous fit of Eq. (4) to all OBD-data
0 0.2 0.4 0.6 0.8 1
c(TEG)
-1
-0.5
0
0.5
1
ST /
10-3
K-1
10 °C OBD15 °C20 °C25 °C30 °C10 °C ODI15 °C
Fig. 2 Soret coefficient of TEG/ETH for different temper-atures as a function of TEG-concentration c
respectively. The corresponding Soret coefficients canbe found in Tables 4 and 5.
The Soret coefficients of the three binaries are plottedin Figs. 1, 2, and 3. For ETH/H2O (Fig. 3), we haveused only data that were measured in our own labo-ratory. As shown in Ref. [8], they perfectly agree witholder results of Kolodner et al. [7] and also with dataover a smaller parameter range by Wiegand et al. [29]and Zhang et al. [30]. Our OBD-, SG- and ODI-data forthe Soret coefficient of TEG/H2O are compared withresults from Ref. [31] at the lowest concentration. Inthe following, the prominent features that are commonto all three mixtures shall be discussed.
The first obvious observation is the sign change ofthe Soret coefficients of all three systems as a func-tion of concentration and/or temperature. Such signchanges, where the components invert their thermodif-
123
Eur. Phys. J. E (2021) 44:128 Page 5 of 12 128
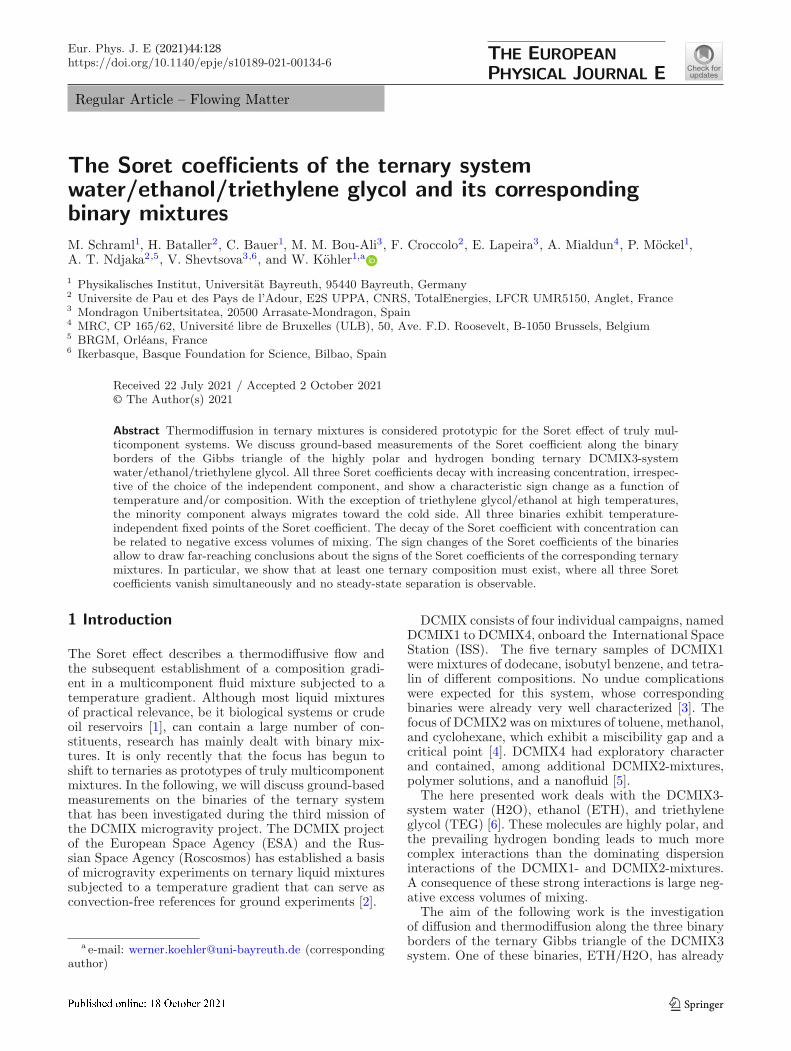
Table 2 Diffusion coefficients of TEG/H2O as a function of TEG-concentration c and temperature as obtained by OBD,SG, and ODI. SG-data from Ref. [19]
c D [10−10 m2/s]
10 ◦C 15 ◦C 20 ◦C 25 ◦C 30 ◦C 35 ◦C 40 ◦C
OBD 0.05 4.6(.2) 5.9(.2) 5.9(.2) 7.2(.2) 7.6(.3) 8.9(.3)0.3 3.4(.2) 4.1(.2) 4.7(.2) 5.2(.3) 6.2(.3) 7.0(.3) 7.8(.4)0.5 2.3(.1) 2.7(.1) 3.3(.2) 3.8(.2) 4.5(.2) 5.2(.3) 6.0(.3)0.7 1.4(.1) 1.9(.1) 2.4(.1) 2.9(.1) 3.4(.2) 4.1(.2)0.9 0.9(.1) 1.2(.1) 1.6(.1) 1.9(.1) 2.4(.1)
SG 0.3 4.79(.12) 5.46(.15) 6.4(.3)0.5 3.3(.1) 3.86(.14) 5.4(.3)0.7 2.09(.12) 2.33(.06) 2.86(.13)
ODI 0.05 6.2(.3) 8.0(.2)0.1 6.0(.3) 7.6(.2)0.15 4.1(.2) 5.6(.3) 7.2(.2)0.18 4.0(.2) 5.4(.3) 6.9(.2)0.2 5.3(.3) 6.0(.2)0.25 3.6(.2) 4.9(.2) 6.4(.2) 8.2(.2)0.3 4.5(.2) 5.9(.1)0.4 3.6(.2) 4.9(.1)
Table 3 Diffusion coefficients of TEG/ETH as a function of TEG-concentration c and temperature as obtained by OBD,ODI, and CFC
c D [10−10 m2/s]
10 ◦C 15 ◦C 20 ◦C 25 ◦C 30 ◦C
OBD 0.2 4.7(.2) 4.9(.2) 5.4(.3)0.3 2.6(.1) 3.2(.2) 3.7(.2) 4.1(.2) 4.6(.2)0.5 1.6(.1) 2.0(.1) 2.5(.1) 3.1(.2) 3.4(.2)0.7 1.3(.1) 1.5(.1) 1.8(.1) 2.0(.1) 2.5(.1)0.9 0.81(.05) 0.99(.05) 1.2(.1) 1.3(.1)
ODI 0.1 3.39(.09) 4.3(.3)0.15 3.1(.2) 3.9(.4)0.2 3.05(.06)0.3 3.0(.2)0.4 2.5(.1)
CFC 0.0015 4.9(.1) 5.54(.09) 5.88(.09) 6.5(.2) 7.0(.2)0.998 0.62(.03) 0.74(.04) 1.03(.09)
fusive migration direction, have been reported in theliterature also for colloids [32] but they are rare formolecular systems.
The second observation is the direction of the signchange. All Soret coefficients decrease with concentra-tion. They are positive for small and become negativefor large c. Only for TEG/ETH at the two highest tem-peratures, ST (c) is always negative, but the decreas-ing nature of ST (c) is still preserved (Fig. 2). Keep-ing in mind that the given Soret coefficient is the oneof the first component and that ST changes its signwhen the numbering of the components is reversed, thismeans that the minority component always migrates tothe cold side in the two dilute limits. Accordingly, themajority component goes to the hot side. It is impor-tant to understand that swapping of the componentschanges the sign of ST and, thus, does not change the
decaying nature of the curves with positive Soret coef-ficients for small and negative ones for large concentra-tions.
The third observation relates to the temperaturedependence of the Soret coefficient. For every mixture,there exists a temperature-independent fixed point ofST at a certain concentration cf . In TEG/H2O, it is atcf ≈ 0.31 with a positive value of ST , in TEG/ETH it isat cf ≈ 0.89 with a negative ST and in ETH/H2O it isat cf ≈ 0.29 with a vanishing Soret coefficient ST (cf ) ≈0. The fixed points are marked in the figures by arrows.In any case, the curves ST (c) for different temperaturespivot around the fixed point in a way such that ST
decreases with increasing temperature for c < cf andincreases for c > cf . Together with the general decreasein ST with increasing c, this implies that ST approachesST (cf ) with increasing temperature. There are also sign
123

128 Page 6 of 12 Eur. Phys. J. E (2021) 44:128
Table 4 Soret coefficient of TEG/H2O as a function of TEG-concentration c and temperature as obtained by OBD, SG,and ODI. SG-data from Ref. [19]
c ST [10−3 1/K]
10 ◦C 15 ◦C 20 ◦C 25 ◦C 30 ◦C 35 ◦C 40 ◦C
OBD 0.05 9.0(.5) 8.1(.4) 7.6(.4) 7.3(.3) 7.6(.3) 7.0(.3)0.3 2.0(.1) 2.2(.1) 2.4(.1) 2.5(.1) 2.6(.2) 2.6(.2) 2.7(.2)0.5 −1.34(.05) −1.16(.07) −1.00(.06) −0.85(.05) −0.74(.04) −0.65(.04) −0.56(.03)0.7 −5.0(.3) −4.5(.3) −4.3(.2) −4.1(.2) −3.9(.2)0.9 −7.8(.5) −7.4(.4) −7.0(.4) −6.7(.4) −6.4(.4)
SG 0.3 2.3(.3) 2.3(.3) 2.0(.4)ODI 0.05 6.9(0.3) 6.7(.3)
0.1 6.0(.4) 6.0(.2)0.15 5.0(.3) 5.0(.3) 5.1(.3)0.18 4.2(.2) 4.5(.2) 4.6(.2)0.2 4.1(.2) 4.3(.3)
0.25 2.9(.1) 3.2(.1) 3.4(.2) 3.4(.2)0.3 2.2(.1) 2.5(.1)0.4 0.63(.06) 0.89(.04)
Table 5 Soret coefficient of TEG/ETH as a function of TEG-concentration c and temperature as obtained by OBD andODI
c ST [10−3 1/K]
10 ◦C 15 ◦C 20 ◦C 25 ◦C 30 ◦C
OBD 0.1 0.47(.02)0.2 0.36(.01) 0 −0.27(.01) −0.56(.02)0.3 0.47(.02) 0.16(.01) −0.14(.01) −0.39(.02) −0.59(.03)0.5 0.09(.01) −0.20(.01) −0.39(.02) −0.57(.03) −0.74(.04)0.7 −0.52(.03) −0.60(.07) −0.7(.1) −0.8(.2) −0.8(.2)0.9 −0.88(.04) −0.87(.04) −0.79(.03) −0.87(.04)
ODI 0.1 0.92(.03) 0.55(.06)0.15 0.78(.07) 0.31(.05)0.2 0.61(.04) 0.26(.03)0.3 0.44(.02) 0.14(.01)0.4 0.191(.005)
0 0.2 0.4 0.6 0.8 1
c(ETH)
-5
0
5
10
ST /
10-3
K-1
10 °C15 °C20 °C25 °C30 °C35 °C40 °C50 °C60 °C
-20 @ 50 °C
Fig. 3 Soret coefficient of ETH/H2O for different temper-atures as a function of ETH-concentration c. Data from Ref.[8]
changes of ST as a function of temperature at certainconcentrations, e.g., for TEG/ETH around c = 0.3(Fig. 2). No such temperature-induced sign changesare observed for ETH/H2O, where the temperature-independent fixed point coincides with ST (cf ) = 0.
A temperature-independent fixed point of the Soretcoefficient has also been observed for other systems. InRef. [33] it has been suggested to write the Soret coeffi-cient as a composition-dependent function α(c) multi-plied by a temperature-dependent amplitude β(T ) plusa constant offset Sf
T that is identified with the Soretcoefficient at the fixed point:
ST (c, T ) = α(c)β(T ) + SfT . (3)
This equation with polynomials for α(c) and β(T ) hasalready been used for the ETH/H2O-system, both withthe concentration measured in mole [33] and in massfractions [8]. Following the same idea, the Soret coeffi-cients are fitted by
123
Eur. Phys. J. E (2021) 44:128 Page 7 of 12 128
ST (c, T ) =4∑
i=0
aici (1 + b1ϑ) + Sf
T . (4)
As in Eq. (1), ϑ = T − 273.15K is the temperature inCentigrade. The fits have been performed to the OBD-measurements, which represent a complete and experi-mentally consistent data set. The SG- and ODI-resultsare additionally plotted in Figs. 1 and 2 and are in verygood agreement with the OBD-data. The fit parame-ters for all three systems are summarized in Table 6.As already mentioned, b1 is always negative and β(T )decreases with increasing temperature. For mixtures ofbenzene and cyclohexane, the Soret coefficient at thefixed point could be identified with the isotopic con-tribution, which is related to differences of molar massand moment of inertia, and the term α(c)β(T ) with theso-called chemical contribution [33]. Despite the similarstructure of ST (c, T ), such an assignment is not possiblefor the here considered hydrogen bonding mixtures.
Although we cannot provide a fully quantitativedescription of our results, it is worth pointing outanother relationship for the composition dependence ofST . In Ref. [34], it is shown that the Soret coefficientcan be split into contributions from the pure compo-nents, Spur
T , and a mixing term SmixT . Only the latter is
responsible for the concentration dependence. Accord-ing to Morozov’s theory [35], it is related to the excessvolume of mixing V E by
SmixT ≈ C
∂V E
∂x1, (5)
with x1 being the mole fraction of the first componentand C < 0 a constant that depends on the solvent com-pressibility.
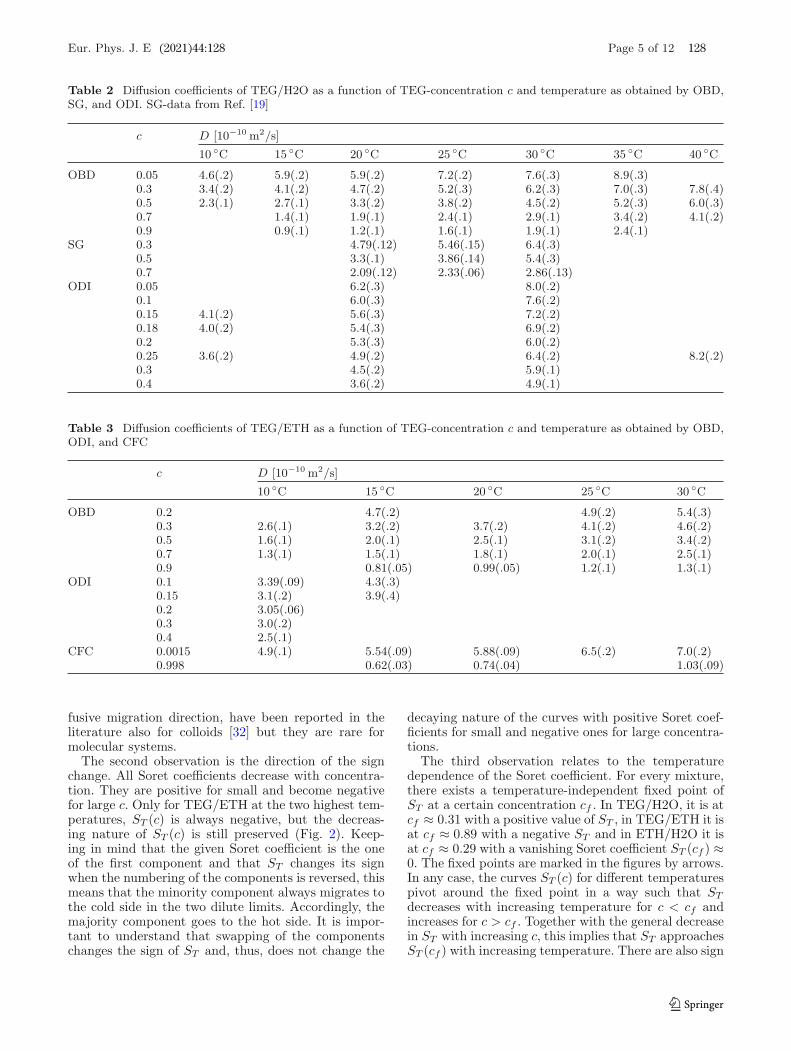
Since V E vanishes at the two ends of the concen-tration axis and typically goes through an extremum inbetween, a positive excess volume corresponds to a situ-ation with a negative second derivative, ∂2V E/∂x2
1 < 0.Because of the negative constant C < 0, this relates tothe situation of a Soret coefficient that increases withc, and vice versa for a negative excess volumes [34].All three mixtures show a decreasing Soret coefficient,albeit the situation is not fully clear for ETH/H2Oat high ETH concentrations. A few data points abovec ∼ 0.9 might hint at an increase in ST at higherconcentrations, but they show a large scatter and arevery unreliable because of the vanishing solutal con-trast factor (∂n/∂c)p,T , which changes sign aroundc = 0.8. They were already excluded from the fitin Ref. [8]. With their inclusion, the Soret coefficientwould no longer decrease monotonously, but the over-all picture remained unchanged: there would still be thetemperature-invariant fixed point with the sign changeand an overall decrease in ST from the left to the right.
Figure 4 shows the excess volumes for all three mix-tures at 25 ◦C as obtained from density measurementsof the pure substances and the mixtures performed withan Anton Paar DSA 5000 M densitometer. All threeare negative, which is, indeed, in agreement with the
0 0.2 0.4 0.6 0.8 1
c(H2O), c(TEG)
-1
-0.5
0
VE in
cm
3 mol
-1
H2O/ETHTEG/ETHTEG/H2O
Fig. 4 Excess volumes of mixing V E for the three mixturesTEG/H2O, TEG/ETH, and ETH/H2O at 25 ◦C
observation of decreasing Soret coefficients. We want torepeat here, that a decreasing ST (c) remains decreasingunder reversal of the components.
3.2 The ternary Gibbs triangle
The knowledge of the signs of the Soret coefficientsalong all three binary borders allows, within certainassumptions, predictions about the signs of the Soretcoefficients inside the ternary Gibbs triangle. In the fol-lowing, we will use the primed Soret coefficients S′
T,i,which are the established notation for ternaries. Theyare defined by the concentration gradients in the Soretequilibrium, ∇ci = −S′
T,i∇T , and are related to theirunprimed counterparts in the case of binary mixturesby S′
T,i = ci(1 − ci)ST,i [36]. An in-depth discussionof frame-invariant Soret coefficients has been given byOrtiz de Zarate [37].
Figure 5 shows the Gibbs triangle with colors assignedto the three compounds: magenta for H2O, orange forETH, and green for TEG. The color code along thebinary borders marks the concentration range, wherethe respective component is thermophilic, i.e., has anegative Soret coefficient and enriches at the hot sidefor a mean temperature of 25 ◦C. These regions aredirectly taken from Figs. 1, 2, and 3. The coinci-dence of the color code of the axes with the colorof the respective component near the corners reflectsour finding that, as a rule, the majority componentmigrates to the hot and the minority component to thecold side. The concentration of the sign change alongthe H2O/ETH-axis, i.e., where the color changes frommagenta to orange, is temperature independent (Fig. 3)and the sign change along the TEG/H2O-axis dependsonly weakly on temperature (Fig. 1). The sign changeconcentration for TEG/ETH, on the other hand, showsa pronounced temperature dependence and shifts fromcTEG ≈ 0.5 at 10 ◦C to cTEG ≈ 0 at 25 ◦C, for whichFig. 5 is drawn. Very close to the selected temperatureof 25 ◦C, the Soret coefficient of TEG in TEG/ETH-
123

128 Page 8 of 12 Eur. Phys. J. E (2021) 44:128
Table 6 Fit parameters for the Soret coefficients according to Eq. (4). The values for ETH/H2O are from Ref. [8]
TEG/H2O TEG/ETH ETH/H2O
a0 0.00777 0.00292 0.0115a1 −0.0268 −0.00370 −0.0154a2 0.00604 0.000471 −0.1453a3 – – 0.2378a4 – – −0.0652b1 [K−1] −0.00719 −0.02921 −0.00931
SfT [K−1] 0.00231 −0.00087 0.0
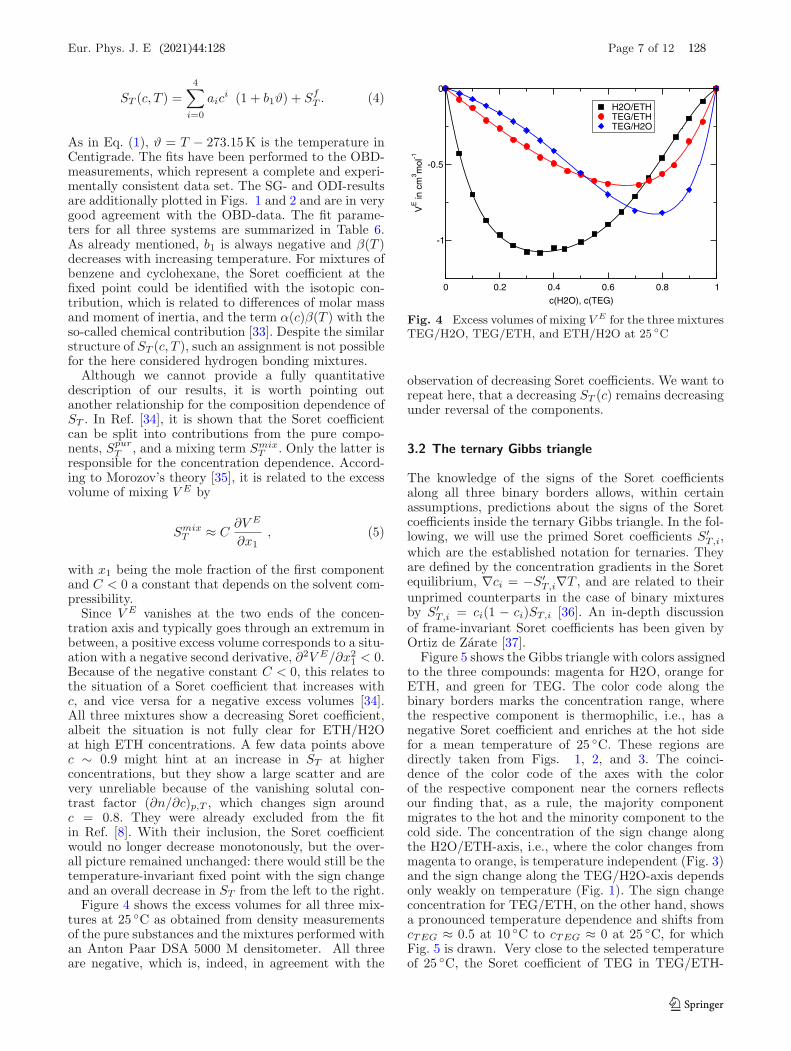
Fig. 5 Signs of the Soret coefficients within the ternaryGibbs triangle at 25 ◦C. The colored regions denote ther-mophilic behavior with negative Soret coefficients of therespective components. The dots 1–6 indicate the composi-tions of the DCMIX3 samples. Point Z marks the intersec-tion of the boundaries of the three colored regions, where allthree Soret coefficients vanish simultaneously. The steady-state optical signal vanishes along the dashed line (see Fig.6). The regions I to VI are explained in the text. The tri-angle near the H2O corner indicates the zoom-region shownin Fig. 6
mixtures remains negative over the entire compositionrange and just vanishes in the limit cTEG ≈ 0, corre-sponding to cETH ≈ 1. Thus, the green color along thisaxis extends just up to the ETH-corner. Already at aslightly lower temperature, the green color would stopshort of the ETH-corner. The following discussion does,however, not depend on these peculiar details.
Since Soret coefficients are smooth and continuousfunctions of the composition, and since the ternariesextrapolate to the corresponding binaries near the axes,we can draw some conclusions about the signs of theSoret coefficients of the ternaries inside the Gibbs tri-angle.
Let us begin with TEG. Its Soret coefficient van-ishes at the ETH-corner and at the concentration of
the sign change along the TEG/H2O-axis. These twopoints must be connected by a continuous line throughthe Gibbs triangle, defined as the locus where the Soretcoefficient of TEG, the third component, changes sign,hence S′
T,3 = 0. Together with the green sections of theaxes, this line encompasses the green composition rangewhere TEG is thermophilic. Outside, it is thermopho-bic. Of course, the shape of the green region inside theGibbs triangle is only a sketch and could be more to theleft or more to the right. The orange and the magentaregions can be constructed along the same rules.
From Ref. [38], it is known that both ETH (compo-nent 2) and TEG (component 3) have negative Soretcoefficients at point 2, whereas the one of H2O (com-ponent 1) is positive. Hence, composition 2 must beinside both the green and the orange but outside themagenta region.
Only one negative Soret coefficient exists withinregions I, II, and III. Compositions with two negativeSoret coefficients define the intersection regions IV, V,and VI. Additional rules follow from mass conservation,which requires
S′T,1 + S′
T,2 + S′T,3 = 0 . (6)
An immediate consequence is that the intersection of allthree colors must be of size zero, since all three Soretcoefficients cannot be negative at the same time. Forthe same reason also three positive Soret coefficientsare not possible and every composition must belong toeither one or two colors.
Because composition 2 is both green and orange, theboundaries of these two regions must intersect in pointZ in a similar way as drawn in Fig. 5. Since this intersec-tion is defined by S′
T,2 = S′T,3 = 0, Eq. (6) immediately
requires S′T,1 = 0, and the boundary of the magenta
region must also pass through the intersection point Z.Thus, the sign changes of the Soret coefficients of
the binaries and the knowledge of their signs at onecomposition (point 2) inside the ternary diagram allowsus to draw far-reaching conclusions about the signs ofthe Soret coefficients of the ternaries and to prove thatat least one composition Z must exist, where all threeSoret coefficients vanish simultaneously and no steady-state separation will be observed in a temperature gra-dient.
Zones V and VI in Fig. 5 are very narrow, mean-ing that the Soret coefficients that correspond to the
123
Eur. Phys. J. E (2021) 44:128 Page 9 of 12 128
Fig. 6 Construction of the dotted line in Fig. 5 with van-ishing steady-state amplitude of the solutal OBD-signal at25 ◦C. The numbers reflect the chronological order of themeasurements
0 500 1000 1500 2000 2500t / s
0.9
0.95
1
1.05
1.1
norm
aliz
ed O
BD
sig
nal
10
21
13
22
30
Fig. 7 Solutal OBD-signals for measurements 30, 22, 13,21, and 10 from Fig. 6 as indicated by red arrow. The steady-state amplitude vanishes between points 22 and 13, close tothe latter
two respective overlapping colors (TEG/H2O in zoneV and ETH/H2O in zone VI) are very close to theirsign change compositions. Since two small Soret coef-ficients automatically imply, according to Eq. (6), alsoa small Soret coefficient of the third component, theOBD-signals in zones V and VI should be very small.Since H2O has the smallest refractive index, the OBD-signal is even expected to change its sign along pathsthrough zones I–V–III or II–VI–III.
Indeed, such a sign change within zones V and VI isobserved experimentally at the dashed line in Fig. 5.This line has been constructed by measuring the OBD-signal with a single color at a large number of compo-
sitions around the expected sign change compositions.Then, pairs of compositions with different signs of theirsolutal OBD-amplitudes are identified. The sign changecompositions are determined by linear interpolation ofthe two amplitudes along the connecting line in theGibbs triangle.
Figure 6 illustrates this procedure. The compositionpairs with different signs of the OBD-amplitudes areconnected with thin red lines along which the compo-sitions of asymptotically vanishing solutal OBD-signalsare determined. Together with the sign changes of theSoret coefficients of the adjacent binaries, they definethe dashed lines in Figs. 5 and 6.
The normalized solutal signals along the line throughcompositions 30-22-13-21-10 are shown in Fig. 7. Thesign change occurs between compositions 22 and 13,very close to the latter. We attribute the positive ampli-tudes below the dashed line mainly to the negativeSoret coefficient of H2O in zones III, V, and VI. Thecomposition with vanishing signal close to composition13 is, however, not identical to point Z, where all threeSoret coefficients vanish. A close inspection of the solu-tal signal of composition 13 in Fig. 7 reveals a superpo-sition of a fast contribution with a small positive and aslow one with a small negative amplitude.
Thus, although the solutal steady-state optical sig-nal asymptotically vanishes along the dashed line, itis still a superposition of two, albeit small, contribu-tions with different signs that correspond to the twoeigenmodes with different eigenvalues of the diffusionmatrix. As a consequence, the vanishing asymptotic sig-nals can still show transient amplitudes for finite times.The strict requirement for an asymptotically vanishingsolutal amplitude of the optical signal reads
(∂n
∂c1
)p,T
S′T,1 +
(∂n
∂c2
)p,T
S′T,2 = 0 . (7)
Because of the dispersion of the optical contrast factors,the precise position of the dashed line through regions VVI, with the exception of point Z, is expected to dependslightly on the employed detection wavelength. In prin-ciple, Eq. (7) could also be satisfied by a very peculiarcombination of large Soret coefficients and matchingoptical contrast factors. Since this can be excluded atthe two binary limits, and since the component separa-tion necessarily needs to be small with changing signswithin the narrow overlap regions V and VI, we con-sider it safe to exclude such unlikely coincidences.
Because of the vanishing solutal steady-state signalon the dashed line, it is very difficult to pin down theprecise locus of point Z. Its position can be shifted alongthe dashed line and even the extreme positions at thetwo binary axes cannot be ruled out completely. Theywould still be compatible with our arguments. On theother hand, there are neither experimental observationsnor theoretical arguments that would support such avery special assumption.
The sample from DCMIX3 cell number 3 with a com-position of 0.25/0.6/0.15 (H2O/ETH/TEG) provides
123

128 Page 10 of 12 Eur. Phys. J. E (2021) 44:128
Table 7 Ternary thermodiffusion and Soret coefficients of DCMIX3 sample 3 at 25 ◦C. Thermodiffusion coefficients D′T,i
measured by TGC. Soret coefficients S′T,i calculated from D′
T,i and diffusion matrix from Ref. [39]
D′T,i [10−13 m2/(sK)] S′
T,i [10−3 1/K]
H2O i = 1 4.36(.13) 1.33(.08)ETH i = 2 −3.30(.15) −1.03(.09)TEG i = 3 −1.06(.13) −0.30(.07)
the opportunity for an additional test of the picturedeveloped so far. It is, besides sample 2, the only otherDCMIX3 sample that has a positive separation ratioand can be measured by the thermogravitational col-umn (TGC) technique with its superior contrast factormatrix. As shown in Fig. 5, sample 3 should be in thesame zone IV as sample 2 with a positive Soret coef-ficient for H2O and negative Soret coefficients of ETHand TEG. In order to test this prediction, TGC mea-surements were performed following the identical pro-tocol as employed for sample 2 in Ref. [38]. The resultsare listed in Table 7. The experiments yield directly thethermodiffusion coefficients D′
T,i. The Soret coefficientsS′T,i are calculated as described in Ref. [38] using the
diffusion matrix from Ref. [39]. As can be seen fromTable 7, the signs of the three ternary Soret coefficientsare in agreement with our model.
4 Summary and conclusion
We have presented Soret- and diffusion coefficients ofthe three binary subsystems of the ternary DCMIX3system consisting of H2O, ETH, and TEG. All threebinaries are strongly interacting hydrogen bonding mix-tures with pronounced excess volumes of mixing [40].We are not able to provide a fully quantitative model.There are, however, several remarkable properties thatare common to all three mixtures but not necessarilyfound to the same extent in nonpolar organic liquids.
The most remarkable observation is a sign changeof ST as a function of concentration—in the case ofTEG/ETH only below room temperature. In all bina-ries, the Soret coefficient is a decreasing function, whichleads, together with the sign change, to a migration ofthe minority components to the cold side in the dilutelimits. Correspondingly, the majority component hasa negative Soret coefficient and goes to the hot side.As already observed for organic liquids, all three mix-tures show a temperature invariant fixed point of ST
at a certain concentration, and ST can be factorizedinto a concentration-dependent function α(c) with atemperature-dependent amplitude β(T ) plus the con-stant offset of the fixed point (Eq. (3)).
Although these observations can qualitatively beinterpreted in terms of concepts discussed in the litera-ture for organic mixtures, a fully quantitative descrip-tion is still lacking for these hydrogen bonding sys-tems. An example is the decrease in ST with concentra-
tion, which is in agreement with predictions by Moro-zov [34,35] for systems with negative excess volumes.Despite the nice qualitative agreement, we are not ableto provide a quantitative model. Another example isthe mentioned fixed point of the Soret coefficient andthe parameterization of ST according to Eq. (3). Whilethese terms could be identified with the isotopic andthe chemical contribution to the Soret coefficient in thecase of organic mixtures, such an interpretation fails forthe here considered strongly interacting polar mixtures.
Based on the knowledge of the signs of the Soret coef-ficients for the binaries and for the symmetric ternarymixture (DCMIX3-composition 2), it is possible toreconstruct the signs and sign changes also for theternaries within the Gibbs triangle. Since the threeSoret coefficients are not independent, two small Soretcoefficients automatically imply that also the third oneneeds to be small. This, in combination with the lowrefractive index of water, leads to vanishing optical sig-nals along the dashed line through the narrow overlapregions V and VI in Fig. 5, which are close to the lociwhere the Soret coefficients of TEG and H2O or ETHand H2O change their signs. Though its precise loca-tion has not been nailed down, these considerationsnecessarily imply the existence of a certain composi-tion, point Z, where all three Soret coefficients vanishsimultaneously and where no separation will occur in atemperature gradient.
On purpose, we have used as little experimentalinput as possible for the ternary mixtures inside theGibbs triangle. The determination of the Soret coeffi-cients for the ternaries requires two-color experiments,as employed for the DCMIX project, and the inversionof the optical contrast factor matrix. Due to the largecondition numbers of the latter, the errors introducedby this procedure are unavoidably large. An exceptionis composition 2, which has been investigated in Ref.[38] both under microgravity and ground conditions.In particular, the employed thermogravitational columntechnique provides, for this particular system, superiorcontrast factor matrices. But since this method onlyworks for positive separation ratios, it is limited to theDCMIX3-mixtures 2 and 3. These problems do not existfor the binaries and the reported data are generally ofa high quality. Thus, it was our goal to investigate, howmuch information about the ternaries can be extractedfor this particular system from the knowledge of thebinaries alone. Even without DCMIX3 sample 2, theconclusions would be very similar and only the orangeregion with the negative Soret coefficient of ETH might
123

Eur. Phys. J. E (2021) 44:128 Page 11 of 12 128
be drawn somewhat less toward the TEG corner. Itshould be remembered that the measurements shownin Fig. 6 to determine the dashed line were only madewith a single color and did not involve the inversion ofa contrast factor matrix.
Acknowledgements This work was developed in theframework of the cooperative project DCMIX (AO-2009-0858/1056) of the European Space Agency (ESA) and theRussian Space Agency (Roscosmos). The shadowgraphymeasurements are supported by the ESA project GIANTFLUCTUATIONS and the ESA-MAP project TechNES(Grant 4000128933/19/NL/PG). M.S. and W.K. acknowl-edge the support by Deutsches Zentrum fur Luft- undRaumfahrt (DLR) (Grants 50WM1544 and 50WM1850).A.M. acknowledges the support of the PRODEX programof the Belgian Federal Science Policy Office, ESA. H.B.,F.C., and A.T.N. acknowledge support from the CNES andfrom the E2S UPPA Hub Newpores and the Industrial ChairCO2ES supported by the Investissements d’Avenir Frenchprogramme managed by ANR (ANR-16-IDEX-0002) E.L,M.M.B., and V.S. acknowledge the support of the projectmicro4IloT (KK-2019/00101) from the Basque governmentand support from the Ministerio de Ciencia e Innovacion,Spain (Grant PID2020-115086GB-C33).
Funding Open Access funding enabled and organized byProjekt DEAL.
Author contribution statement
MS, PM, CB, and WK performed and analyzed theOBD measurements. HB, FC, and ATN performed andanalyzed the SG experiments. EL and MMB performedand analyzed the TGC experiments. AM and VS per-formed and analyzed the ODI and the. CFC experi-ments. WK wrote the manuscript. All authors analyzedand discussed the content of the paper.
Data availability Data are available upon reasonablerequest from the authors.
Open Access This article is licensed under a Creative Com-mons Attribution 4.0 International License, which permitsuse, sharing, adaptation, distribution and reproduction inany medium or format, as long as you give appropriate creditto the original author(s) and the source, provide a link tothe Creative Commons licence, and indicate if changes weremade. The images or other third party material in this arti-cle are included in the article’s Creative Commons licence,unless indicated otherwise in a credit line to the material. Ifmaterial is not included in the article’s Creative Commonslicence and your intended use is not permitted by statu-tory regulation or exceeds the permitted use, you will needto obtain permission directly from the copyright holder.To view a copy of this licence, visit http://creativecommons.org/licenses/by/4.0/.
References
1. W. Kohler, K.I. Morozov, J. Non-Equilib, Thermodyn.41, 151 (2016). https://doi.org/10.1515/jnet-2016-0024
2. M. Braibanti, P.A. Artola, P. Baaske, H. Bataller,J.P. Bazile, M. Bou-Ali, D. Cannell, M. Carpineti, R.Cerbino, F. Croccolo, J. Diaz, A. Donev, A. Errarte,J. Ezquerro, A. Frutos-Pastor, Q. Galand, G. Gal-liero, Y. Gaponenko, L. Garcıa Fernandez, J. Gavalda,F. Giavazzi, M. Giglio, C. Giraudet, H. Hoang, E.Kufner, W. Kohler, E. Lapeira, A. Laveron-Simavilla,J.C. Legros, I. Lizarraga, T. Lyubimova, S. Mazzoni, N.Melville, A. Mialdun, O. Minster, F. Montel, F. Molster,J. M. Ortiz de Zarate, J. Rodriguez, B. Rousseau, X.Ruiz, I. Ryzhkov, M. Schraml, V. Shevtsova, C. Takacs,T. Triller, S. VanVaerenbergh, A. Vailati, A. Verga, R.Vermorel, V. Vesovic, V. Yasnou, S. Xu, D. Zapf, K.Zhang, Eur. Phys. J. E 42, 86 (2019). https://doi.org/10.1140/epje/i2019-11849-0
3. J.K. Platten, M.M. Bou-Ali, P. Costeseque, J.F.Dutrieux, W. Kohler, C. Leppla, S. Wiegand, G. Wit-tko, Philos. Mag. 83, 1965 (2003). https://doi.org/10.1080/0141861031000108204
4. V. Shevtsova, C. Santos, V. Sechenyh, J.C. Legros, A.Mialdun, Microgravity Sci. Tec. 25, 275 (2014). https://doi.org/10.1007/s12217-013-9349-6
5. A. Mialdun, M.M. Bou-Ali, M. Braibanti, F. Croccolo,A. Errarte, J.M. Ezquerro, J.J. Fernandez, L. GarcıaFernandez, Q. Galand, Y. Gaponenko, J. Gavalda,W. Kohler, T. Lyubimova, J.M. Ortiz de Zarate, J.Rodriguez, X. Ruiz, I.I. Ryzhkov, V. Shevtsova, S. vanVaerenbergh, V. Yasnou, H. Bataller, Acta Astronaut.176, 204 (2020). https://doi.org/10.1016/j.actaastro.2020.06.020
6. T. Triller, H. Bataller, M.M. Bou-Ali, M. Braibanti,F. Croccolo, J.M. Ezquerro, Q. Galand, J. Gavalda, E.Lapeira, A. Laveron-Simavilla, T. Lyubimova, A. Mial-dun, J.M. Ortiz de Zarate, J. Rodrıguez, X. Ruiz, I.I.Ryzhkov, V. Shevtsova, S.V. Vaerenbergh, W. Kohler,Microgravity Sci. Tec. 30, 295 (2018). https://doi.org/10.1007/s12217-018-9598-5
7. P. Kolodner, H. Williams, C. Moe, J. Chem. Phys. 88,6512 (1988). https://doi.org/10.1063/1.454436
8. A. Koniger, B. Meier, W. Kohler, Philos. Mag. 89, 907(2009). https://doi.org/10.1080/14786430902814029
9. O. Batiste, E. Knobloch, A. Alonso, I. Mercader, J.Fluid Mech. 560, 149 (2006). https://doi.org/10.1017/S0022112006000759
10. P. Kolodner, A. Passner, C.M. Surko, R.W. Walden,Phys. Rev. Lett. 56, 2621 (1986). https://doi.org/10.1103/PhysRevLett.56.2621
11. M. Giglio, A. Vendramini, Phys. Rev. Lett. 34, 561(1975). https://doi.org/10.1103/PhysRevLett.34.561
12. R. Piazza, A. Guarino, Phys. Rev. Lett. 88,208302 (2002). https://doi.org/10.1103/PhysRevLett.88.208302
13. A. Koniger, H. Wunderlich, W. Kohler, J. Chem. Phys.132, 174506 (2010). https://doi.org/10.1063/1.3421547
14. G. Wittko, W. Kohler, Philos. Mag. 83, 1973 (2003).https://doi.org/10.1080/0141861031000108213
15. A. Mialdun, V. Shevtsova, J. Chem. Phys. 134, 044524(2011). https://doi.org/10.1063/1.3546036
123

128 Page 12 of 12 Eur. Phys. J. E (2021) 44:128
16. A. Mialdun, J.C. Legros, V. Yasnou, V. Sechenyh, V.Shevtsova, Eur. Phys. J. E 38, 27 (2015). https://doi.org/10.1140/epje/i2015-15027-2
17. A. Mialdun, V. Yasnou, V. Shevtsova, C.R. Mec. 341,462 (2013). https://doi.org/10.1016/j.crme.2013.02.001
18. T. Janzen, S. Zhang, A. Mialdun, G. Guevara-Carrion,J. Vrabec, M. He, V. Shevtsova, Phys. Chem. Chem.Phys. 19(47), 31856 (2017). https://doi.org/10.1039/C7CP06515A
19. A.T. Ndjaka, D.E. Bouyou Bouyou, A. Lassin,M. Azaroual, F. Croccolo, H. Bataller, Eur. Phys. J.E submitted (2021)
20. A. Vailati, M. Giglio, Nature 390, 262 (1997). https://doi.org/10.1038/36803
21. A. Vailati, R. Cerbino, S. Mazzoni, C.J. Takacs, D.S.Cannell, M. Giglio, Nature Commun. 2, 290 (2011).https://doi.org/10.1038/ncomms1290
22. F. Croccolo, J.M. Ortiz de Zarate, J.V. Sengers, Eur.Phys. J. B 39, 125 (2016). https://doi.org/10.1140/epje/i2016-16125-3
23. P. Baaske, H. Bataller, M. Braibanti, M. Carpineti, R.Cerbino, F. Croccolo, A. Donev, W. Kohler, J.M. Ortizde Zarate, A. Vailati, Eur. Phys. J. E 39, 119 (2016).https://doi.org/10.1140/epje/i2016-16119-1
24. F. Scheffold, R. Cerbino, Curr. Opin. Colloid InterfaceSci. 12, 50 (2007). https://doi.org/10.1016/j.cocis.2007.03.005
25. F. Croccolo, H. Bataller, F. Scheffold, J. Chem. Phys.137, 234202 (2012). https://doi.org/10.1063/1.4771872
26. G. Cerchiari, F. Croccolo, F. Cardinaux, F. Scheffold,Rev. Sci. Instrum. 83, 106101 (2012). https://doi.org/10.1063/1.4755747
27. M. Norouzisadeh, M. Chraga, G. Cerchiari, F. Croccolo,Eur. Phys. J. E submitted (2021)
28. M. Gebhardt, W. Kohler, J. Chem. Phys. 142, 084506(2015). https://doi.org/10.1063/1.4908538
29. S. Wiegand, H. Ning, H. Kriegs, J. Phys. Chem. B 111,14169 (2007). https://doi.org/10.1021/jp076913y
30. K.J. Zhang, M.E. Briggs, R.W. Gammon, J.V. Sengers,J. Chem. Phys. 104, 6881 (1996)
31. K. Maeda, N. Shinyashiki, S. Yagihara, S. Wiegand, R.Kita, J. Chem. Phys. 143, 124504 (2015). https://doi.org/10.1063/1.4931115
32. S. Iacopini, R. Rusconi, R. Piazza, Eur. Phys. J. E 19,59 (2006). https://doi.org/10.1140/epje/e2006-00012-9
33. G. Wittko, W. Kohler, Europhys. Lett. 78, 46007(2007). https://doi.org/10.1209/0295-5075/78/46007
34. S. Hartmann, G. Wittko, F. Schock, W. Groß, F. Lind-ner, W. Kohler, K.I. Morozov, J. Chem. Phys. 141,134503 (2014). https://doi.org/10.1063/1.4896776
35. K.I. Morozov, Phys. Rev. E 79, 031204 (2009). https://doi.org/10.1103/PhysRevE.79.031204
36. M. Gebhardt, W. Kohler, J. Chem. Phys. 143, 164511(2015). https://doi.org/10.1063/1.4934718
37. J.M. Ortiz de Zarate, Eur. Phys. J. E 42, 43 (2019).https://doi.org/10.1140/epje/i2019-11803-2
38. T. Triller, D. Sommermann, M. Schraml, F. Som-mer, E. Lapeira, M.M. Bou-Ali, W. Kohler, Eur.Phys. J. E 42, 27 (2019). https://doi.org/10.1140/epje/i2019-11789-7. https://rdcu.be/bpGYk
39. J.C. Legros, Y. Gaponenko, A. Mialdun, T. Triller, A.Hammon, C. Bauer, W. Kohler, V. Shevtsova, Phys.Chem. Chem. Phys. 17, 27713 (2015). https://doi.org/10.1039/C5CP04745E
40. J. Zhang, P. Zhang, K. Ma, F. Han, G. Chen, X. Wei,Sci. China Ser. B Chem. 51, 420 (2008). https://doi.org/10.1007/s11426-008-0045-0
123