the spe foundation through member donations and a ... · wellbore stability analysis lurk images of...
TRANSCRIPT

1
Primary funding is provided by
The SPE Foundation through member donations
and a contribution from Offshore Europe
The Society is grateful to those companies that allow their
professionals to serve as lecturers
Additional support provided by AIME
Society of Petroleum Engineers
Distinguished Lecturer Programwww.spe.org/dl

“Diamonds in the Noise”Treasures Lurking in Acoustic Data
Jennifer MarketSenergy
Society of Petroleum Engineers
Distinguished Lecturer Programwww.spe.org/dl
2

Diamonds in the Noise
• Waveform data recorded by modern sonic
tools is full of hidden treasures, such as
fracture characterisation, permeability,
wellbore stability, hole size, production
optimisation and much more.
• This presentation considers the gems that can
be mined from taking a second look at sonic
data.
3
Treasures Lurking in Acoustics Data
• Did you know that the LWD sonic data
acquired for seismic correlation also contains a
cement bond log and a “calliper”?
• Would you be surprised to learn that within the
wireline crossed-dipole data obtained for
wellbore stability analysis lurk images of
fractures 20 ft from the wellbore?
4

Overview
• Applications
• Sonic Tool Flavours
• Are the Data Suitable?
• The Importance of the Right Deliverables
5

Classic Sonic Applications
• Pore Pressure Prediction
• Seismic Correlation
• Porosity
• Hydrocarbon Indicator
• Hole Size Indicator
• Cement Bond Indicator
6

Pore Pressure Prediction
7
Bachrach, 2007
Compressional Velocities (Vp) can be used to predict pore pressure.
These pressures can then be used to determine a safe hole size and
mud weight.

Seismic Correlation
Chiburis, 1993
Hashem, 1999
8
Vp (& density) are used to compute synthetic seismograms for
tying wellbore data to seismic.
Adding shear velocities (Vs) allows for AVO analysis.

McCalmont, 2008
Porosity
9
Sonic Porosity (pu)
Neutron Porosity (pu)
Vp can be used to estimate
porosity.
Differences between neutron
porosity and sonic porosity
are often indicative of pore
structure.

Hydrocarbon/Lithology Indicator
Williams, 1990
10
The Vp/Vs ratio can be used as a lithology and hydrocarbon
indicator.
This method is particularly well suited for identifying gas.
Williams, 1990
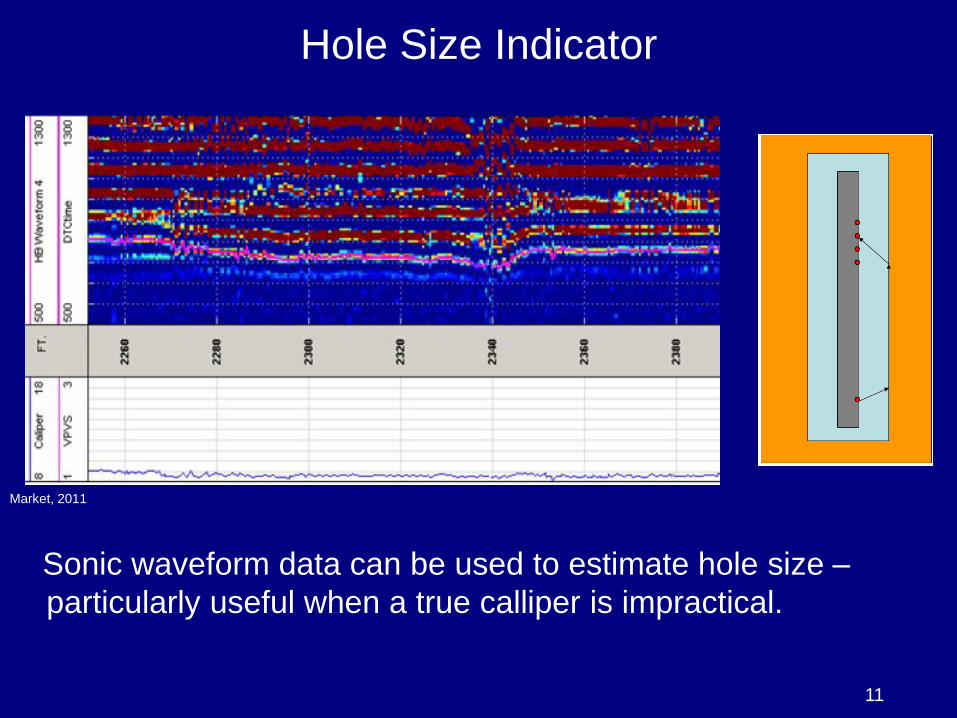
Hole Size Indicator
Market, 2011
11
Sonic waveform data can be used to estimate hole size –
particularly useful when a true calliper is impractical.

Market, 2004
Cement Bond Logging (CBL)
12
Top of Cement
The amplitude of the
signal reflected from
casing can be used as
an indicator of cement
bond.
Note – it isn’t the
equivalent of a hi-res
ultrasonic scanning
tool!
Digging a Little Deeper
• Permeability
• Fracture Detection
• Wellbore Stability
• Mud Selection
• Geosteering
13

Canady, 2005
Permeability
14

Fracture Detection
Fogel, 2002
15
Measure
d D
epth
Time (us)
N E S W N

Geosteering
Market, 2012 16
Top
Bottom
Top
Top
Bottom
Top
Azimuthal Vp & Vs data can be used for geosteering as a
complement to more traditional methods.

Wellbore Stability and Mud Selection
www.Halliburton.comwww.Halliburton.com 17
Vp and Vs can be used to
determine at which wellbore
inclination and mud weight the
wellbore will be stable, collapse, or
break out.
30 60 90

Hidden Gems
• Radial Profiling
• Deep Fracture Imaging
• Unconventional Reservoir Production
Optimisation
18

Radial Profiling
19
Depth of Investigation, ft.
Measure
d D
epth
Wireline DTC
Shallow DTC
Deep DTC240 us/ft 40

Deep Imaging
www.Schlumberger.com Tang, 201020

Unconventional Reservoirs –
Production Enhancement
Pitcher, 201121
Top
Bottom
Top
Top
Bottom
Top
Top
Bottom
Top

Wireline Tool Flavours
• Monopole
– Compressional, Shear (Fast Formations)
– Stoneley, CBL
– Short Spaced, High Frequency
• Crossed-Dipole
– Compressional, Shear (Fast and Slow
Formations)
– Stoneley, CBL, Anisotropy
– Long Spaced, Broad Frequency
X Y M
23

LWD Tool Flavours
• Unipole/Monopole
– Compressional, Shear (Fast Formations)
– Stoneley, CBL
• Dipole & Quadrupole
– Compressional, Shear (Fast and Slow
Formations)
• Azimuthal
– Wellbore Images
– Anisotropy
Mickael,SPE 2012 24

Classic
Monopole
(WL/LWD)
WL
Crossed-
Dipole
LWD
Multipole
Azimuthal
LWD
Pore Pressure Prediction
Seismic Correlation/AVO
Hydrocarbon detection
Lithology Indicator
Porosity
Top of Cement
Permeability
Fracture Characterisation
Wellbore Stability
Production Optimisation
Hole Size Indicator
Geosteering
Invasion Profiling
What Can We Mine From Each Tool?
25

Optimising Data Acquisition
• Is the Tool Healthy?
• Tool Set-up
• Source & Receiver
Configuration
• Tool Position
• Centralisation
• Accurate Depth Tracking
26

Quality Control
27

Deliverables
• Archive everything!
– Raw waveforms
– Processed data
– Processing parameters
– Tool QC plots
– LWD: Include all data (Drilling & Non-drilling)
• Standardize QC plots and digital
deliverables
28

Summary
• With the wealth of acoustic data acquired today, there are many opportunities to “mine” the data for additional applications.
• Optimising the data collection will maximise the amount of information that can be extracted from the waveforms.
• Archive the full dataset. Who knows what new applications will be developed tomorrow?
29

Thank You!
30

References• Bachrach, R., Noeth, S., Banik, N., et al., 2007, “From Pore Pressure Prediction to
Reservoir Characterization: A Combined Geomechanics –seismic Inversion Workflow
Using Trend-kriging Techniques in a Deepwater Basin”, The Leading Edge, May 2007,
pp. 590-595.
• Buller, D., Hughes, S., Market, J., Petre, E., Spain, D., and Odumosu, T. 2010.
Petrophysical Evaluation for Enhancing Hydraulic Stimulation in Horizontal Shale
Gas Wells. Paper SPE 132990 presented at the SPE Annual Technical Conference
and Exhibition held in Florence, Italy, 19–22 September.
• Canady, W., Spooner, P., Vasquez, R., 2005. “Permeability Estimation From Stoneley
Amplitude, Corrected for Borehole Geometry and Rugosity”, SPE96598.
• Chiburis, E., Leaney, S., Skidmore, C., Franck, C., McHugo, S., 1993, “Hydrocarbon
Detection with AVO”, Oilfield Review, Jan 1993.
• Fogel, J., Kessler, C., Varsamis, G., 2002. “Application of Shear Anisotropy from a New
Generation Crossed Dipole Acoustic Tool”, SPE77792.
• Hashem, M., Ince, D., Hodenfield, K., and Hsu, K., 1999, “Seismic tie using sonic-
while-drilling measurements,” SPWLA 40th Annual Logging Symposium.
• McCalmont, S., Chittick, S. Nurgaliev, R., Russo, J., Deady, R., Market, J., 2008, “
Optimal FE Acquisition in a Complex Carbonate Reservoir: a Case Study on the
Karachaganak Field, Kazakhstan”, SPWLA 49th Annual Logging Symposium.
• Market, J., 2013, “Choosing the Right Sonic Service”, SPWLA 54th Annual Symposium.31

References
• Market, J., Bilby, C., 2011. “Introducing the First LWD Crossed-Dipole Imaging
Service”, SPWLA 52nd Annual Symposium.
• Market, J., Canady, W., 2009. “Multipole Sonic Logging in High Angle Wells”, SPWLA
50th Annual Symposium.
• Market, J. And Parker, T., 2011. “Reliable LWD Callipers”, SPE 146245.
• Market, J. Schmitt, D.P., Deady, R., 2004. “LWD Sonic Logging in Cased Holes”,
SPWLA 45th Annual Symposium.
• Mickael, M., Barnett, C., Diab, M., 2012. “Azimuthally Focused LWD Sonic Logging
for Shear Wave Anisotropy Measurement and Borehole Imaging”, SPE160133.
• Pitcher, J., Market, J., Hinz, D., 2011. “Geosteering with Sonic in Conventional and
Unconventional Reservoirs”, SPE 146732.
• Tang, X., Bolshakov, A., Patterson, D., 2010. “Integrated Acoustic Evaluation of
Reservoir Fractures: From Borehole Out into Formation”, SPWLA 51st Annual Logging
Symposium.
• Williams, D.M., 1990, “The Acoustic Log Hydrocarbon Indicator,” SPWLA 31st Annual
Symposium.
• www.Schlumberger.com (BARS brochure)
• www.Halliburton.com (CBL, BAT and Drillworks brochures)32
Society of Petroleum Engineers
Distinguished Lecturer Programwww.spe.org/dl 33
Your Feedback is Important
Enter your section in the DL Evaluation Contest by
completing the evaluation form for this presentation :
Click on: Section Evaluation