the state of k-12 education in the commonwealth of … web.pdfthe state of k-12 public education in...
TRANSCRIPT

The State of K-12 Education
in the Commonwealth of
Kentucky
Stephen L. Pruitt, Ph.D.Commissioner of Education
January 2016

The State of
K-12 Education in the
Commonwealth of Kentucky
Stephen, L. Pruitt
Commissioner of Education
January 21, 2016 UPDATED TO REFLECT QUALITY COUNTS CHANGES
The State of K-12 Public Education in the Commonwealth of Kentucky 1
Thank you for your interest in K-12 public education in the
Commonwealth of Kentucky. Kentucky kids can do ANYTHING!
I believe that, but it’s up to all of us, working together, to help them
reach their true potential.
Three months ago I came to Kentucky to become the commissioner
of education. I was drawn to the job, in part, because the state has
an excellent reputation – one that is recognized nationwide – for
improving K-12 public education. I felt called to help build on this
legacy.
During my short time in the Commonwealth, I have seen firsthand
the efforts underway on behalf of our children and the hard work
that is going on every day in classrooms, schools and district
offices, and local school board meetings across the state to provide ALL of our children with the best
education possible. I have been impressed with the professionalism of our educators, their passion
and their ongoing commitment to kids.
Also, I have had a chance to take stock on where we are with K-12 public education in Kentucky – to
see where our strengths are, and there are many, as well as assess where we have room for
improvement. I believe as a shareholder in our public education system, you have a right to know the
facts on the state of K-12 public education in Kentucky. That is why I am issuing this report and plan
to make this an annual event. While much of this information is available on the Kentucky
Department of Education’s website and through the online Kentucky School Report Card, at least
once a year it is important to reflect on the data as a whole so that you can be proud of our progress
and help support the changes that may be necessary to move our students ahead.
My goal is to build on our accomplishments of the past 25 years to provide each and every child with
an excellent, world-class education that will lead them to success in their postsecondary endeavors,
in the job market and in life.
With the reauthorization of the federal Elementary and Secondary Education Act, known as the
Every Student Succeeds Act, we have a greater opportunity to chart our own course for the future of
education than at any time in recent history. I recognize we also have some challenges to overcome.
As we move forward we must work collaboratively and focus on equity, achievement and the
integrity of our public education system. Without a doubt, we also must continue to have high
expectations for all of our students.
We have some great opportunities ahead of us, to continue building on the foundation of public
education in Kentucky. As we embrace these opportunities, we must stand up for what is right for
Kentucky’s kids and not take the easy way out. This will take courage, compromise and
understanding.
For the sake of all the children of the Commonwealth, I hope you will join me in the task at hand.
Remember, Kentucky kids can do ANYTHING!
Stephen L. Pruitt, Ph.D.
Commissioner of Education

2 The State of K-12 Public Education in the Commonwealth of Kentucky
Kentucky as a National Model in Education
In recent years, Kentucky has increasingly served as a national model to other states in a variety
of education policy and program areas. Through the catalyst of Senate Bill 1 (2009) and the
strong state leadership of commissioners, Kentucky continues to garner national attention for its
work in areas like high academic standards, communications, career readiness, teacher
leadership, accountability and innovation.
Chris Minnich, Executive Director
Council of Chief State School Officers
The State of K-12 Public Education in the Commonwealth of Kentucky 3
K-12 Public Education Governance
The Kentucky Education Reform Act (KERA) of 1990 created an independent governance
structure for public education. The governor appoints members of the Kentucky Board of
Education, which is responsible for hiring a commissioner, who oversees the daily operations of
the Kentucky Department of Education (KDE) that is dedicated to serving the districts that
educate our children.
In April 2015, Kentucky Commissioner Terry Holliday announced his retirement. The board
immediately embarked on the task of finding his successor. After educator and public input on
the qualities the next commissioner should possess, the board undertook an extensive nationwide
search and in early September, the board hired Stephen Pruitt to be the sixth commissioner of
education in Kentucky. Pruitt is a former science teacher, Georgia Department of Education
chief of staff and executive with a national not-for-profit, non-partisan education advocacy
organization. He started work as commissioner in mid-October.
The Kentucky Board of Education (KBE) develops and adopts the regulations that govern
Kentucky’s public school districts and the actions of the KDE. This includes management of the
Kentucky School for the Blind, the Kentucky School for the Deaf, interscholastic athletics, and
community education programs and services. The board reviews the department’s budget
requests and makes recommendations to the governor and legislature.
The commissioner of education oversees the daily operations of the KDE and recommends and
implements KBE policies.
The KDE provides support to locally operated public school districts focused on educating
children in elementary, middle and high schools throughout the Commonwealth. Together, the
KBE, the commissioner and KDE are responsible for setting local school district standards for
student, program, and operational performance while respecting the local autonomy of each
school district. Budget and policy priorities are tied to the strategic goals developed by the
KBE and the KDE.
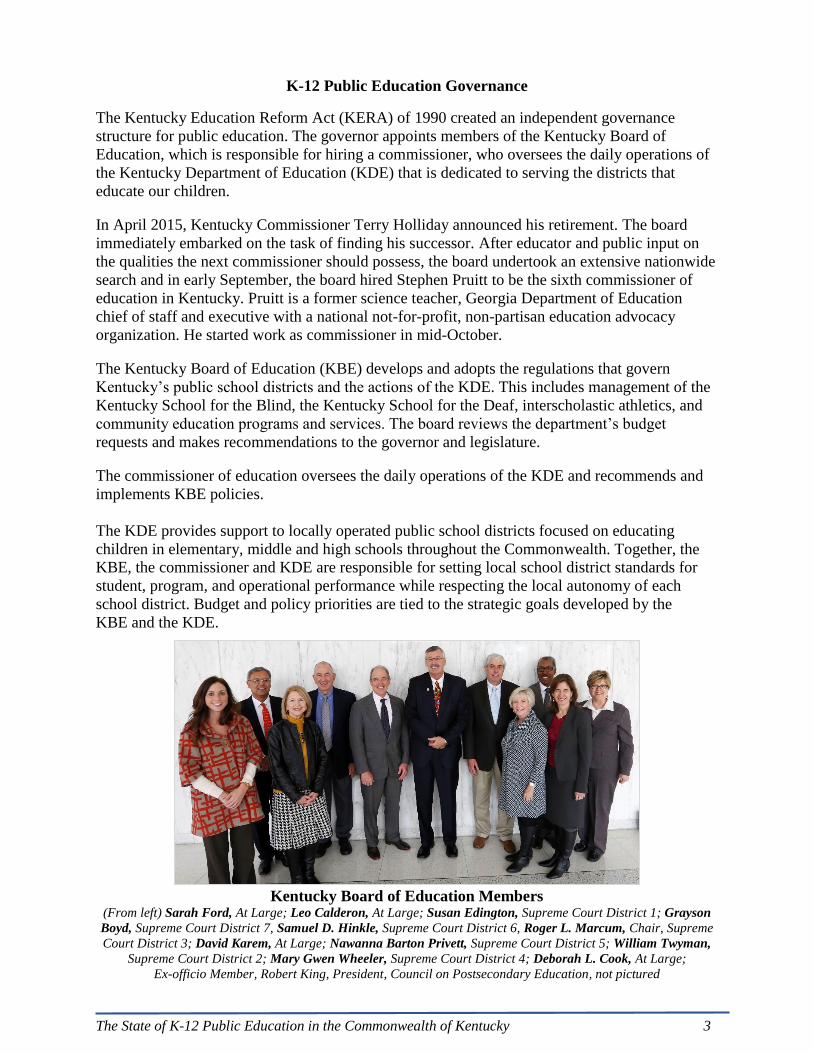
Kentucky Board of Education Members
(From left) Sarah Ford, At Large; Leo Calderon, At Large; Susan Edington, Supreme Court District 1; Grayson
Boyd, Supreme Court District 7, Samuel D. Hinkle, Supreme Court District 6, Roger L. Marcum, Chair, Supreme
Court District 3; David Karem, At Large; Nawanna Barton Privett, Supreme Court District 5; William Twyman,
Supreme Court District 2; Mary Gwen Wheeler, Supreme Court District 4; Deborah L. Cook, At Large;
Ex-officio Member, Robert King, President, Council on Postsecondary Education, not pictured

4 The State of K-12 Public Education in the Commonwealth of Kentucky
Teaching and Learning
Teaching and learning is at the center of Kentucky public education. The instructional programs
for Kentucky’s public schools emphasize the development of students’ abilities to acquire, apply
and integrate knowledge, skills and understandings in real-life contexts and to problem solve,
make decisions, and think critically and creatively. They assist students in connecting learning to
the world beyond the classroom by exploring and investigating real issues and problems of
communities, states, the nation, and the world.
Kentucky Academic Standards Standards define what students are expected to learn –the minimum academic content every
student should know at each grade level and before graduating from high school.
The standards should not be
confused with curriculum.
Curriculum defines how
standards are taught – the
methods and material used.
While the state is required to
produce a Model
Curriculum Framework for
districts to follow, it is up to
teachers and leaders in local
districts to determine what
textbooks and other
instructional materials are
used.
Senate Bill 1 (2009) mandated new academic standards in all content areas that were
focused on the critical knowledge, skills, and capacities needed for success in the global
economy;
fewer but more in-depth to facilitate mastery learning;
based on evidence-based research;
internationally comparable; and
aligned from elementary to high school to postsecondary education so that students can
be successful at each education level.
The Kentucky Academic Standards help ensure that all students throughout Kentucky, regardless
of family income or where they go to school, are provided with the same opportunity to learn at
high levels.

The State of K-12 Public Education in the Commonwealth of Kentucky 5
English/Language Arts and Mathematics Standards
In an historic joint
meeting, the Kentucky
Board of Education,
Council on
Postsecondary
Education and
Education
Professional
Standards Board
adopted new standards
in English/ language
arts and mathematics
in 2010 and
implemented them in
classrooms across the
state. Students were
first tested on the
standards in the 2011-
12 school year.
The English/language arts and
mathematics standards are designed to
promote creative problem solving and
critical thinking over rote memorization,
and prepare students with the
collaboration, creativity and
communication skills that the 21st
century workplace demands.
Kentucky has essentially the same
English/language arts and mathematics
standards as the majority of the top 10
performing states in the country.
In the years following implementation of Kentucky Academic
Standards (KAS), I have witnessed a profound change in my
students' capabilities.
Both comprehensive and rigorous, the standards advance
analytical thinking at each grade level, enabling my students to
tackle increasingly complex learning tasks. Moreover, they enjoy
mastering challenging concepts, and take pride in the deeper
learning of which they are capable.
In my small, rural district, KAS integration means my students will
not only be college and/or career ready, but also possess the skills
to be competitive beyond Kentucky in a global job market.
Sabrina Tackett, Language Arts Teacher Jenkins Independent Schools
The business community is still solidly
behind these standards because we
understand how critical it is that our
schools and students meet these
challenging demands. They will help
Kentucky achieve its goals for
economic growth and workforce
quality.
Trey Grayson, President and CEO Northern Kentucky Chamber of Commerce
Because Kentucky’s math standards may not
correspond to the way they were taught,
many parents have understandable
frustration in trying to decipher the thinking
behind them.
These standards are about developing ways
of thinking alongside ways of doing. The two
work hand-in-hand.
Sahar Zadeh, Student Paul Laurence Dunbar High School, Fayette Co.
6 The State of K-12 Public Education in the Commonwealth of Kentucky
During the 2014-15 school year, as part of its regular five to seven year review of the standards
taught in Kentucky classrooms, the Kentucky Department of Education sought public input on
the state's English/language arts and mathematics standards through the online Kentucky
Academic Standards (KAS) Challenge.
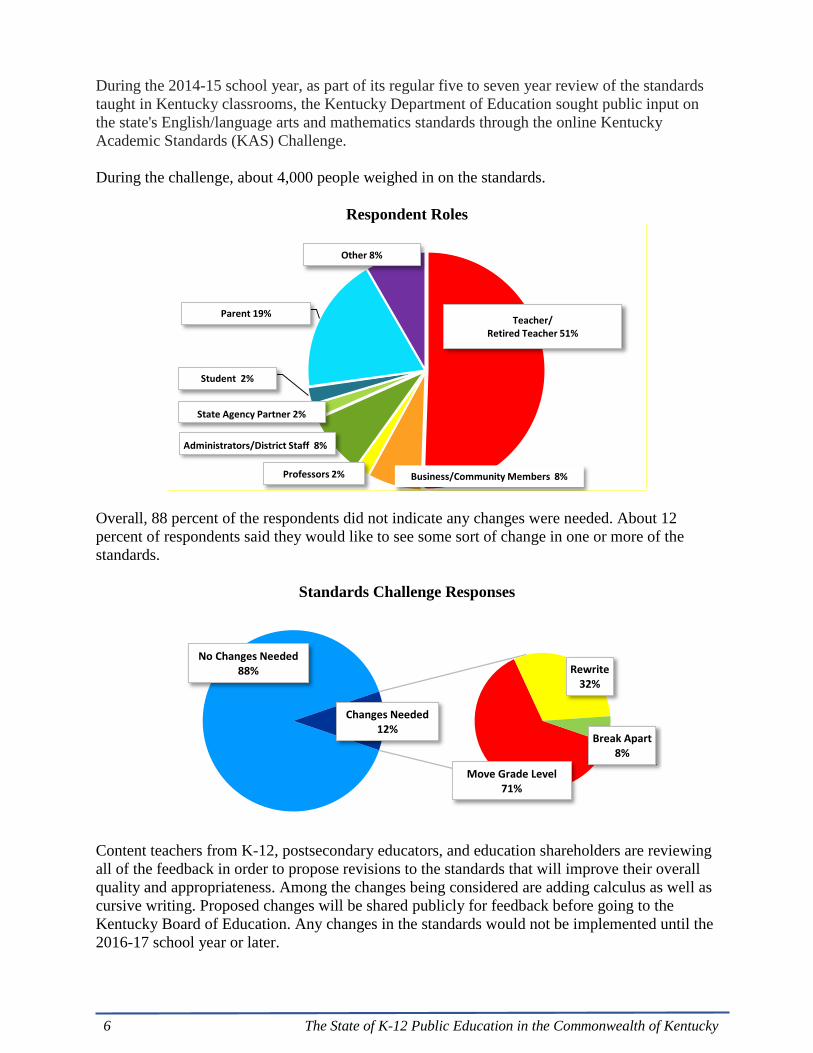
During the challenge, about 4,000 people weighed in on the standards.
Respondent Roles
Overall, 88 percent of the respondents did not indicate any changes were needed. About 12
percent of respondents said they would like to see some sort of change in one or more of the
standards.
Standards Challenge Responses
Content teachers from K-12, postsecondary educators, and education shareholders are reviewing
all of the feedback in order to propose revisions to the standards that will improve their overall
quality and appropriateness. Among the changes being considered are adding calculus as well as
cursive writing. Proposed changes will be shared publicly for feedback before going to the
Kentucky Board of Education. Any changes in the standards would not be implemented until the
2016-17 school year or later.
Teacher/Retired Teacher 51%
Business/Community Members 8%Professors 2%
Administrators/District Staff 8%
State Agency Partner 2%
Student 2%
Parent 19%
Other 8%
No Changes Needed 88%
Move Grade Level71%
Rewrite32%
Break Apart8%
Changes Needed12%
The State of K-12 Public Education in the Commonwealth of Kentucky 7
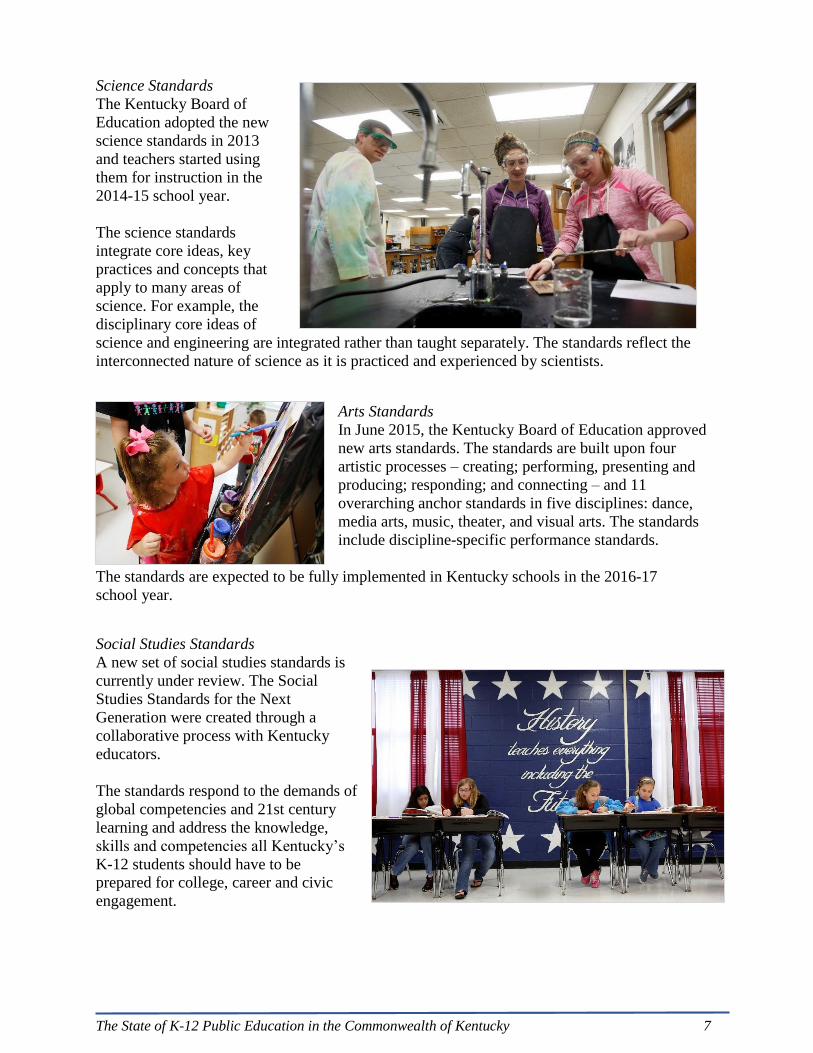
Science Standards
The Kentucky Board of
Education adopted the new
science standards in 2013
and teachers started using
them for instruction in the
2014-15 school year.
The science standards
integrate core ideas, key
practices and concepts that
apply to many areas of
science. For example, the
disciplinary core ideas of
science and engineering are integrated rather than taught separately. The standards reflect the
interconnected nature of science as it is practiced and experienced by scientists.
Arts Standards
In June 2015, the Kentucky Board of Education approved
new arts standards. The standards are built upon four
artistic processes – creating; performing, presenting and
producing; responding; and connecting – and 11
overarching anchor standards in five disciplines: dance,
media arts, music, theater, and visual arts. The standards
include discipline-specific performance standards.
The standards are expected to be fully implemented in Kentucky schools in the 2016-17
school year.
Social Studies Standards
A new set of social studies standards is
currently under review. The Social
Studies Standards for the Next
Generation were created through a
collaborative process with Kentucky
educators.
The standards respond to the demands of
global competencies and 21st century
learning and address the knowledge,
skills and competencies all Kentucky’s
K-12 students should have to be
prepared for college, career and civic
engagement.
8 The State of K-12 Public Education in the Commonwealth of Kentucky
Advanced Coursework Advanced Placement (AP)
In recent years, Kentucky educators have worked diligently to expand access to, and
participation in rigorous coursework such as Advanced Placement (AP) classes. The Advanced
Placement program gives students the opportunity to pursue college-level coursework while still
in high school.
There are more than 30 Advanced Placement courses, ranging from high-level math and science
to fine arts, each of which connects directly to a wide variety of college majors and careers. The
Advanced Placement program gives high school students the opportunity to earn college credit if
they score well on a standardized end-of-course exam. Although it varies from school to school,
most colleges require a minimum qualifying score of 3 on an AP exam to earn college credit for
the course.
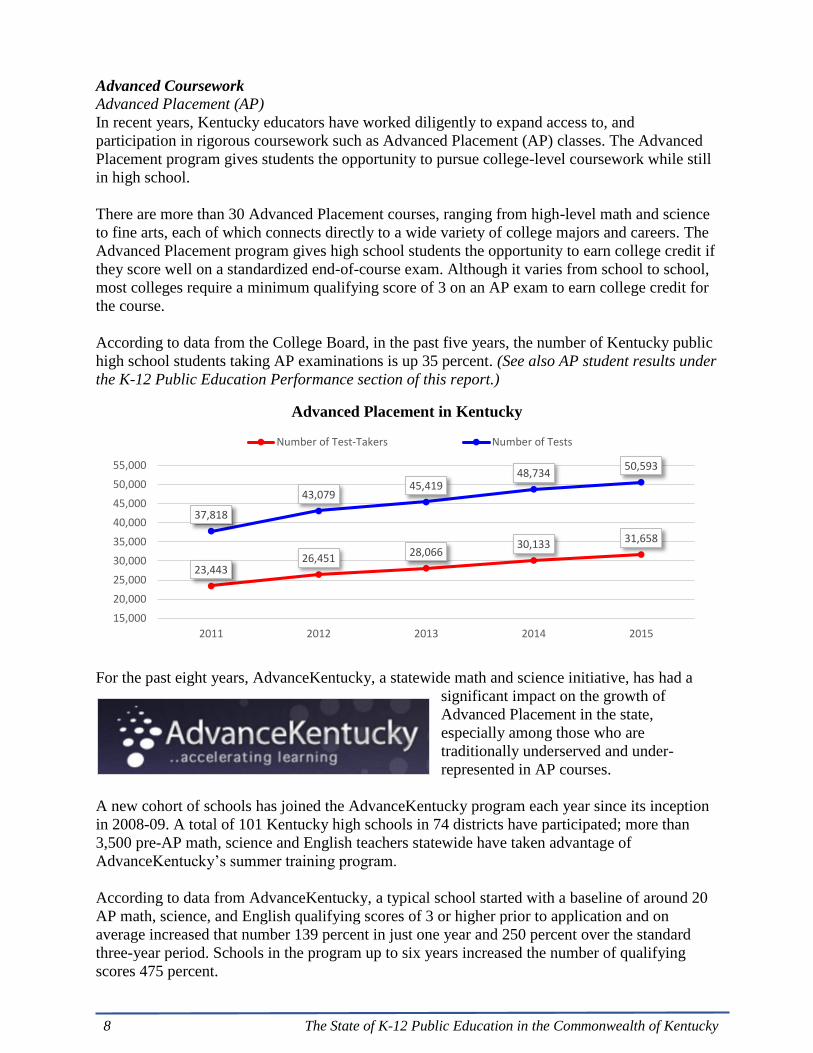
According to data from the College Board, in the past five years, the number of Kentucky public
high school students taking AP examinations is up 35 percent. (See also AP student results under
the K-12 Public Education Performance section of this report.)
Advanced Placement in Kentucky
For the past eight years, AdvanceKentucky, a statewide math and science initiative, has had a
significant impact on the growth of
Advanced Placement in the state,
especially among those who are
traditionally underserved and under-
represented in AP courses.
A new cohort of schools has joined the AdvanceKentucky program each year since its inception
in 2008-09. A total of 101 Kentucky high schools in 74 districts have participated; more than
3,500 pre-AP math, science and English teachers statewide have taken advantage of
AdvanceKentucky’s summer training program.
According to data from AdvanceKentucky, a typical school started with a baseline of around 20
AP math, science, and English qualifying scores of 3 or higher prior to application and on
average increased that number 139 percent in just one year and 250 percent over the standard
three-year period. Schools in the program up to six years increased the number of qualifying
scores 475 percent.
23,44326,451
28,06630,133 31,658
37,818
43,07945,419
48,73450,593
15,000
20,000
25,000
30,000
35,000
40,000
45,000
50,000
55,000
2011 2012 2013 2014 2015
Number of Test-Takers Number of Tests

The State of K-12 Public Education in the Commonwealth of Kentucky 9
Career and Technical Education Career and technical education (CTE) is an essential component of high school in Kentucky. For
many students, it represents as much as a third of their high school experience. CTE incorporates
academics, career exploration, career
preparation, and leadership development to
meet student needs.
There are 53 state-operated career and
technical centers under the guidance of the
Office of Career and Technical Education
within the Kentucky Department of
Education (KDE). Another 42 centers are
locally operated.
In the 2014-15 school year, more than
22,000 seniors in the state were enrolled in a
career and technical pathway. Each career
pathway includes a coherent, articulated sequence of rigorous academic and career/technical
courses including dual credit opportunities, leading to postsecondary degrees and industry
recognized certifications and/or licensures. Career pathways are developed, implemented and
maintained in partnership with secondary and postsecondary institutions, business and employers
and are designed to lead to rewarding careers.
In recent years, the KDE has been working with the Council of Chief State School Officers on a
career-readiness initiative to increase both the rigor and relevance of career and technical
programs in order to support the growing demands of employers in the state. The effort focuses
on ways to increase employer engagement, expand work-based learning opportunities and
enhance the college and career accountability model
that prepares students for the next level and life-long
learning.
KDE has convened a statewide CTE Task Force
comprised of business and industry leaders for each
program area to determine the industry certificates
and credentials needed after high school. Later this
year, the groups will convene to determine the skills
and competencies needed within each program area
for career success.
Efforts to increase worked-based learning
opportunities for secondary students include a
partnership with the Kentucky Labor Department on
the initiative known as the Tech Ready Apprentices
for Careers in Kentucky (TRACK). TRACK is the
only statewide apprenticeship program in the nation
that recognizes student pathways at the K-12 level that
lead into postsecondary apprenticeship programs.
Employers identify the competencies needed for
pathway completion and postsecondary credit.
10 The State of K-12 Public Education in the Commonwealth of Kentucky
Innovation
The Division of Innovation and Partner Engagement serves
as the research and development arm of the Kentucky
Department of Education and is charged with “incubating”
innovative programs and ideas with the hope that these new
approaches to learning can be scaled up in the future.
Innovation is not about finding the next popular program
that comes out of a box or using new catchphrases.
Innovation in learning also is not about modifying the existing teaching system, it is about
creating a new system that includes:
moving from a “one-size-fits-all” instructional program to personalized learning;
focusing on the 21st-century skills of collaboration, teamwork, problem-formulation,
creativity and the ability to “learn how to learn”;
creating systems where students are partners in designing and owning their learning; and
ensuring that a student can learn anywhere he/she can access the instructional material
and at any time 24 hours a day/7 days a week and 365 days a year.
Non-Traditional Instruction Program
In in the 2015-16 school year, when bad weather hits Kentucky, students in some school districts
will continue learning. The Kentucky Department of Education approved waivers that allow 44
districts across the state to use virtual or other nontraditional means of instruction when school is
cancelled because of weather or another emergency. In
most cases, students will participate in lessons online.
In the spring, districts approved for waivers will submit
documentation of student and faculty participation and
measurements of student learning for the missed days.
The KDE then will determine the number of regular
attendance days granted to the district under the
provisions of the waiver.
The program is being replicated internationally.
Districts of Innovation
KRS 156.108 and 160.107 (House Bill
37, enacted 2012) provide Kentucky
public school districts the opportunity to
apply to the Kentucky Board of
Education (KBE) to be exempt from
certain administrative regulations and
statutory provisions, as well as waiving
local board policy, in an effort to improve
the learning of students. By "re-thinking"
what a school might look like, districts
are able to redesign student learning in an
effort to engage and motivate more
students and increase the numbers of
those who are college- and career-ready.
Currently seven districts have been
named Districts of Innovation.
The District of Innovation designation has
helped the Owensboro Public Schools chart
a course for making our already very good
district even better by focusing on
innovation around the instructional core. It
has helped us add significant connections to
postsecondary education, and the business
community has created a sharper vision of
what college- and career-readiness really
means for our students and our community.
Nicholas Brake, Superintendent Owensboro Independent Schools
The State of K-12 Public Education in the Commonwealth of Kentucky 11
Innovation Lab Network (ILN)
Kentucky is a member of a 12-state consortium known as the Innovation Lab Network facilitated
by the Council of Chief State School Officers (CCSSO). The states take action to identify, test,
and implement student-centered approaches to learning that
will transform the public education system. The goal of the
ILN is to spur system-level change by scaling locally led
innovation to widespread implementation, both within and
across states, with a constant focus on student outcomes.
Within Kentucky, 31 districts participate in the state network. Participation in Districts of
Innovation or Non-Traditional Instruction is not required to participate in the Kentucky ILN.
There are many schools in Kentucky that are taking the lead in innovating learning and the
learning environment for the Commonwealth’s children.
The Owensboro Innovation Academy, which opened in the fall of 2015, is a collaboration
between Owensboro Independent and Daviess County schools. It is a new high school with a
project-based curriculum focused on science, technology, engineering and math. Students follow
one of three career pathways – engineering, computer science or biomedical – which were
selected based on the needs of area employers.
Kentucky also opened up its first regional career collaborative in the fall of 2015. Operated by
the Ohio Valley Educational Cooperative, the iLEAD Academy is located in Carrollton but is
open to students from Carroll, Gallatin, Henry, Owen and Trimble counties.
Using interest surveys, freshmen work with iLEAD teachers and community mentors to develop
individualized career pathways. Students narrow that focus throughout high school and select a
senior project to hone skills and produce an electronic portfolio demonstrating their capabilities.
iLEAD juniors and seniors have Fridays open to work as interns or apprentices, job shadow, visit
colleges and work on intensive projects designed with regional employers. They also will be
college students at Jefferson Community and Technical College’s Carrollton Campus. iLEAD
focuses on preparing students for careers in the Golden Triangle’s highest growth sectors –
advanced manufacturing, engineering and technology.
12 The State of K-12 Public Education in the Commonwealth of Kentucky
Education Technology
Technology supports teaching and learning in Kentucky’s public school districts, the mission of
the Kentucky Department of Education (KDE), the vision of the Kentucky Board of Education
and the Digital Readiness initiative. The department’s goal is to ensure that basic and equitable
anytime, anywhere, always-on access to instructional and administrative education technology
services is provided to students, teachers, administrators, parents and the general public.
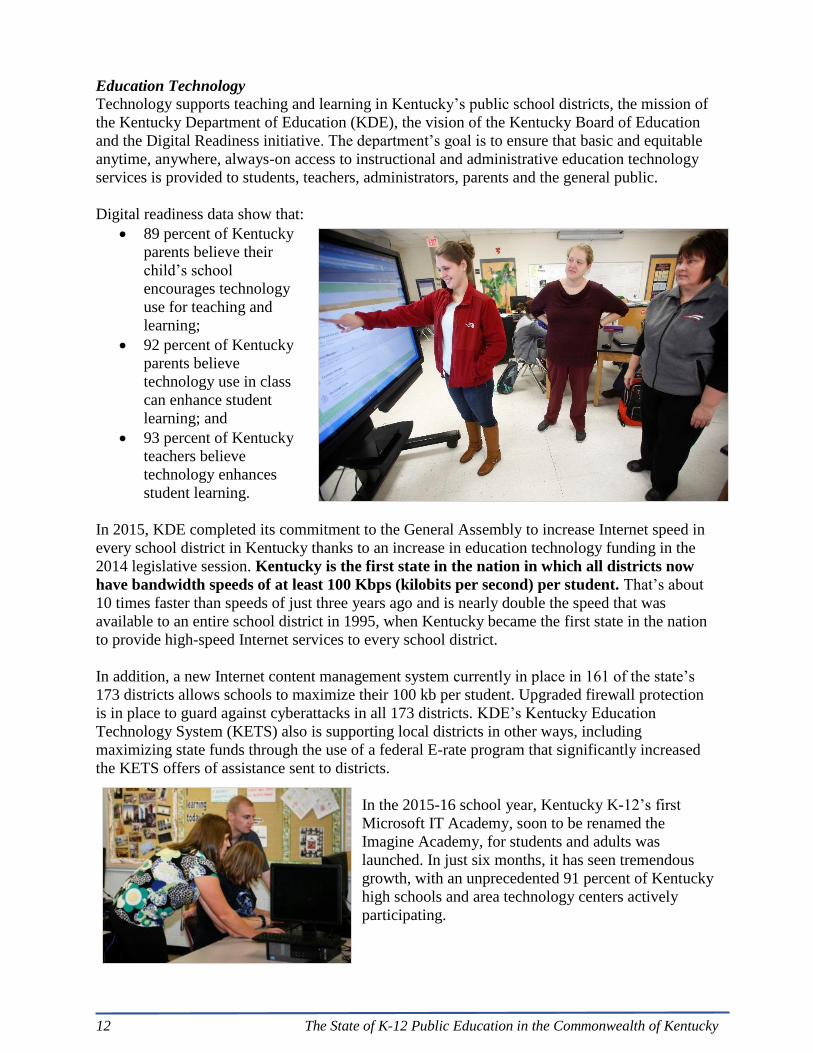
Digital readiness data show that:
89 percent of Kentucky
parents believe their
child’s school
encourages technology
use for teaching and
learning;
92 percent of Kentucky
parents believe
technology use in class
can enhance student
learning; and
93 percent of Kentucky
teachers believe
technology enhances
student learning.
In 2015, KDE completed its commitment to the General Assembly to increase Internet speed in
every school district in Kentucky thanks to an increase in education technology funding in the
2014 legislative session. Kentucky is the first state in the nation in which all districts now
have bandwidth speeds of at least 100 Kbps (kilobits per second) per student. That’s about
10 times faster than speeds of just three years ago and is nearly double the speed that was
available to an entire school district in 1995, when Kentucky became the first state in the nation
to provide high-speed Internet services to every school district.
In addition, a new Internet content management system currently in place in 161 of the state’s
173 districts allows schools to maximize their 100 kb per student. Upgraded firewall protection
is in place to guard against cyberattacks in all 173 districts. KDE’s Kentucky Education
Technology System (KETS) also is supporting local districts in other ways, including
maximizing state funds through the use of a federal E-rate program that significantly increased
the KETS offers of assistance sent to districts.
In the 2015-16 school year, Kentucky K-12’s first
Microsoft IT Academy, soon to be renamed the
Imagine Academy, for students and adults was
launched. In just six months, it has seen tremendous
growth, with an unprecedented 91 percent of Kentucky
high schools and area technology centers actively
participating.

The State of K-12 Public Education in the Commonwealth of Kentucky 13
The Continuous Instructional Improvement Technology System (CIITS) has been an invaluable
resource in the implementation of Senate Bill 1
(2009). Created in 2011, CIITS is a 24-hour
resource for teachers that supports highly
effective teaching and learning in the classroom.
Through CIITS, teachers can access the Kentucky Academic Standards, as well as hundreds of
high-quality instructional resources.
Teachers can create assessments for
learning using a vast standards-aligned
bank of questions or create their own
questions built as passages, multiple
choice or open response. Students take
the learning checks online, on paper or
using a clicker system, and teachers
receive instant feedback. Also, CIITS
is the technology platform for the
Professional Growth and Effectiveness
System (PGES).
CIITS has an average of 1.6 million
logins per month, and data from a
recent 60-day period showed that
39,132 unique Kentucky teachers used CIITS. Using CIITS, teachers have created 304,000
formative tests and about 646,000 lesson plans. An average of 23,000 Kentucky students also log
into CIITS each week.
Teachers are convinced that their schools and their students are making gains in the area of
education technology. Results were higher on all 10 questions related to the topic on the 2015
Teaching, Empowering, Leading and Learning (TELL) Kentucky Survey than when the survey
was last given in 2013. The two biggest jumps were seen in the speed and reliability of Internet
service and in teachers having sufficient training to fully utilize technology. Additionally, 96
percent of school leadership reported using data to improve student learning; and 95 percent of
teachers believe parents are provided with useful information about student learning.
Kentucky was recognized nationally last
year by the Data Quality Campaign as a
top-three state in use of data. Data
transparency and availability for parents
and students through KDE’s Open House,
the online School Report Card, eTranscripts
and the Infinite Campus (student
information system) Parent Portal also
regularly get high marks.
Data security continues to be a high priority
for KDE technology personnel. The requirements of a new regulation and the identification of
disciplinary action for those who put data at risk may make this topic more important to district
employees and students and help create a heightened culture for data security.
My favorite thing about CIITS is the immediate feedback to students and the teacher that it can provide. Instantly, I can figure out where my students are in their learning and what next steps need to be taken. CIITS is an integral part of my planning and the best tool I’ve ever used to help give me immediate and usable data on my students.
Jason Loreaux, 4th grade teacher Sixth District Elementary (Covington Independent)

14 The State of K-12 Public Education in the Commonwealth of Kentucky
Education Workforce
Effective Teachers and Leaders
The most important factor in the achievement of our students is the effectiveness of the teachers
and school leaders who serve them. In the 2014-15 school year, Kentucky public schools
employed 41,588 teachers who earned an average annual salary of $51,143.
The success of public education is directly related to the quality of the teachers and leaders in our
schools and districts. Though hiring is done at the local level, the Kentucky Department of
Education (KDE) has taken a number of steps to recruit, train and retain effective teachers and
leaders, many of them through partnerships and collaborations with other groups and institutions.
A recent study produced for the Institute of Education Sciences by the Regional Educational
Laboratory – Appalachia, showed that Kentucky’s teaching population has remained relatively
stable in recent years. Over a four-year period from 2008-12, almost 86 percent of Kentucky
teachers stayed in the same school from one year to the next.
Scholarships and/or student loan assistance may be available for teachers who fill areas of
critical shortage, which currently include career and technical education, English, English as a
second language, exceptional children, mathematics, science, social studies and world languages.
Students also can be assured of equitable access to effective educators as a result of Kentucky’s
teacher equity plan that targets gaps in teacher experience, teacher turnover and the proportion of
National Board Certified Teachers in each school.
National Board for Professional Teaching Standards Certification
National Board Certification
provides numerous benefits to
teachers, students and schools. It
was designed to develop, retain
and recognize accomplished
teachers and to generate ongoing
improvement in schools
nationwide. Board certification is
available in 25 certificate areas,
from pre-K through 12th grade
and consists of four components:
written assessment of content
knowledge, reflection on student work samples, video and analysis of teaching practice, and
documented impact and accomplishments as a teaching professional.
In Kentucky, the Network to Transform Teaching (KyNT3) is committed to transform teaching
by working to:
increase the number of National Board Certified Teachers (NBCT) in Kentucky, and
innovate and improve teacher leadership opportunities for existing National Board
certified teachers.
KRS 161.131 has set the goal of having one National Board Certified Teacher in every Kentucky
school by 2020. The state’s number of National Board Certified Teachers continues to rise.. With
3,273 NBCTs, Kentucky ranks 7th in the nation in the percentage of its teachers who hold
National Board for Professional Teaching Standards certification.
The State of K-12 Public Education in the Commonwealth of Kentucky 15
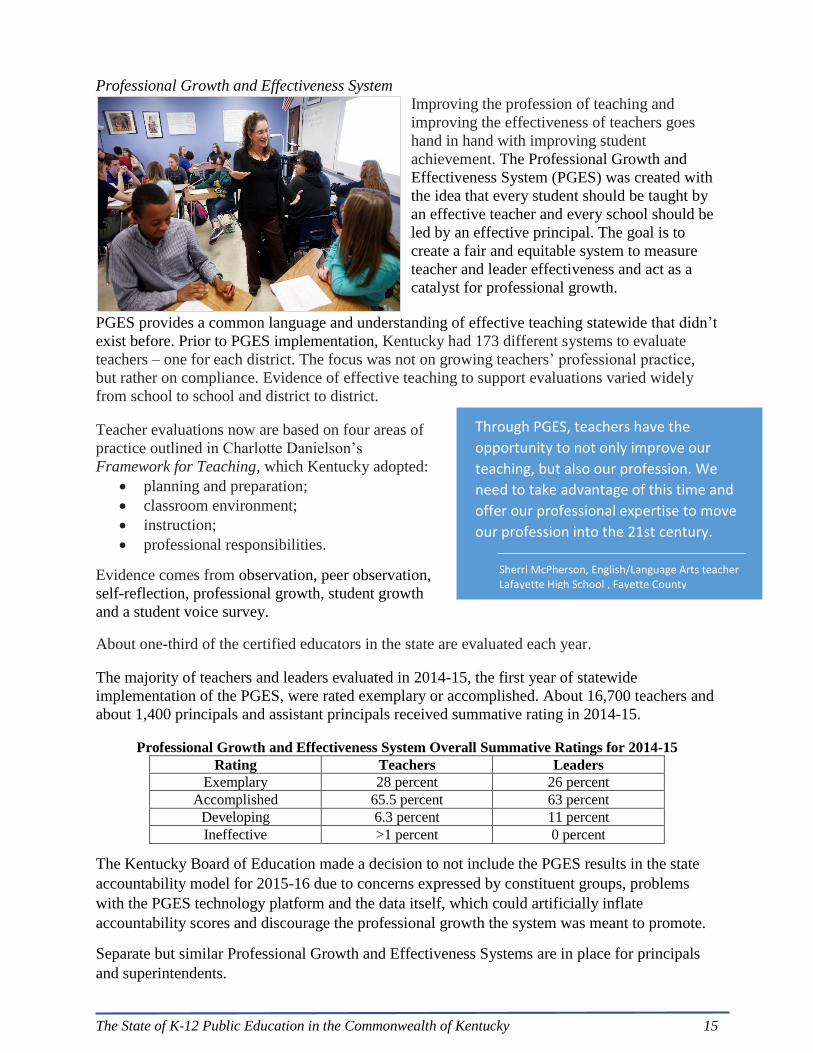
Professional Growth and Effectiveness System
Improving the profession of teaching and
improving the effectiveness of teachers goes
hand in hand with improving student
achievement. The Professional Growth and
Effectiveness System (PGES) was created with
the idea that every student should be taught by
an effective teacher and every school should be
led by an effective principal. The goal is to
create a fair and equitable system to measure
teacher and leader effectiveness and act as a
catalyst for professional growth.
PGES provides a common language and understanding of effective teaching statewide that didn’t
exist before. Prior to PGES implementation, Kentucky had 173 different systems to evaluate
teachers – one for each district. The focus was not on growing teachers’ professional practice,
but rather on compliance. Evidence of effective teaching to support evaluations varied widely
from school to school and district to district.
Teacher evaluations now are based on four areas of
practice outlined in Charlotte Danielson’s
Framework for Teaching, which Kentucky adopted:
planning and preparation;
classroom environment;
instruction;
professional responsibilities.
Evidence comes from observation, peer observation,
self-reflection, professional growth, student growth
and a student voice survey.
About one-third of the certified educators in the state are evaluated each year.
The majority of teachers and leaders evaluated in 2014-15, the first year of statewide
implementation of the PGES, were rated exemplary or accomplished. About 16,700 teachers and
about 1,400 principals and assistant principals received summative rating in 2014-15.
Professional Growth and Effectiveness System Overall Summative Ratings for 2014-15
Rating Teachers Leaders
Exemplary 28 percent 26 percent
Accomplished 65.5 percent 63 percent
Developing 6.3 percent 11 percent
Ineffective >1 percent 0 percent
The Kentucky Board of Education made a decision to not include the PGES results in the state
accountability model for 2015-16 due to concerns expressed by constituent groups, problems
with the PGES technology platform and the data itself, which could artificially inflate
accountability scores and discourage the professional growth the system was meant to promote.
Separate but similar Professional Growth and Effectiveness Systems are in place for principals
and superintendents.
Through PGES, teachers have the
opportunity to not only improve our
teaching, but also our profession. We
need to take advantage of this time and
offer our professional expertise to move
our profession into the 21st century.
Sherri McPherson, English/Language Arts teacher Lafayette High School , Fayette County
16 The State of K-12 Public Education in the Commonwealth of Kentucky
Teacher Voice
Teacher engagement and empowerment is crucial to achieving student success in the state.
So, the state and its education partners have actively worked to ensure teachers have
opportunities for involvement in reform efforts and to provide feedback.
In 2011, Kentucky implemented the Teaching,
Empowering, Leading and Learning (TELL)
Kentucky Survey to allow teachers to express their
opinions on key working conditions such as
facilities, resources, leadership, professional
development and time. The survey provides
educators with data, tools and direct support to
facilitate school improvement.
In 2015, a record 89.3 percent – almost 45,000 –
of eligible school-based certified educators responded to the anonymous, biennial survey.
The results showed that Kentucky educators were more positive about teaching and learning
conditions in their schools than they were in 2013, when the survey was last given.
Teachers also have been given a voice through the Hope Street Group (HSG), a national
nonprofit organization that provides fellowship opportunities for Kentucky teachers to create
communication pathways between policy makers and classroom practitioners. Teacher voice is
elevated by connecting teachers with local, state and national policymakers. Also, the Hope
Street Group utilizes teacher leaders to communicate directly with other teachers. Through HSG,
teachers statewide have provided feedback that has impacted critical education policies,
including PGES and the Kentucky Academic Standards.
Each year, the Kentucky Education Association (KEA) hosts the Let's TALK conference, where
every learning session is led by teachers and is for teachers. KEA also organizes legislative
learning days for Kentucky teachers.
The Fund for Transforming Education in Kentucky coordinates initiatives such as Next
Generation Instructional Design (NGID) to provide opportunities for teachers to be active
creators of instruction, rather than passive consumers of canned curriculum.
These partners have all worked together to develop a Kentucky Teacher Leadership Framework
to provide definitions for what teacher leadership can look like in all its forms. In addition,
Kentucky is working to develop career pathways for teachers to provide leadership opportunities
that do not require a teacher to completely leave the classroom.
Also, individual teachers have taken opportunities to exemplify teaching as not
just a job or even a career, but a profession by working on teacher-driven
initiatives to engage teachers around the state in opportunities to share their
voice and expertise. Recently, at the invitation of the commissioner, 2016
Kentucky Teacher of the Year Ashley Lamb-Sinclair took a sabbatical from
the classroom and joined the Kentucky Department of Education to provide
insight on projects, advocate for teachers and craft projects that she believes
will encourage her colleagues to become masters of their own fates.
Teachers also serve on numerous statewide advisory committees and provide a voice for the
profession when changes are considered that would impact classrooms.
Lamb-Sinclair
The State of K-12 Public Education in the Commonwealth of Kentucky 17
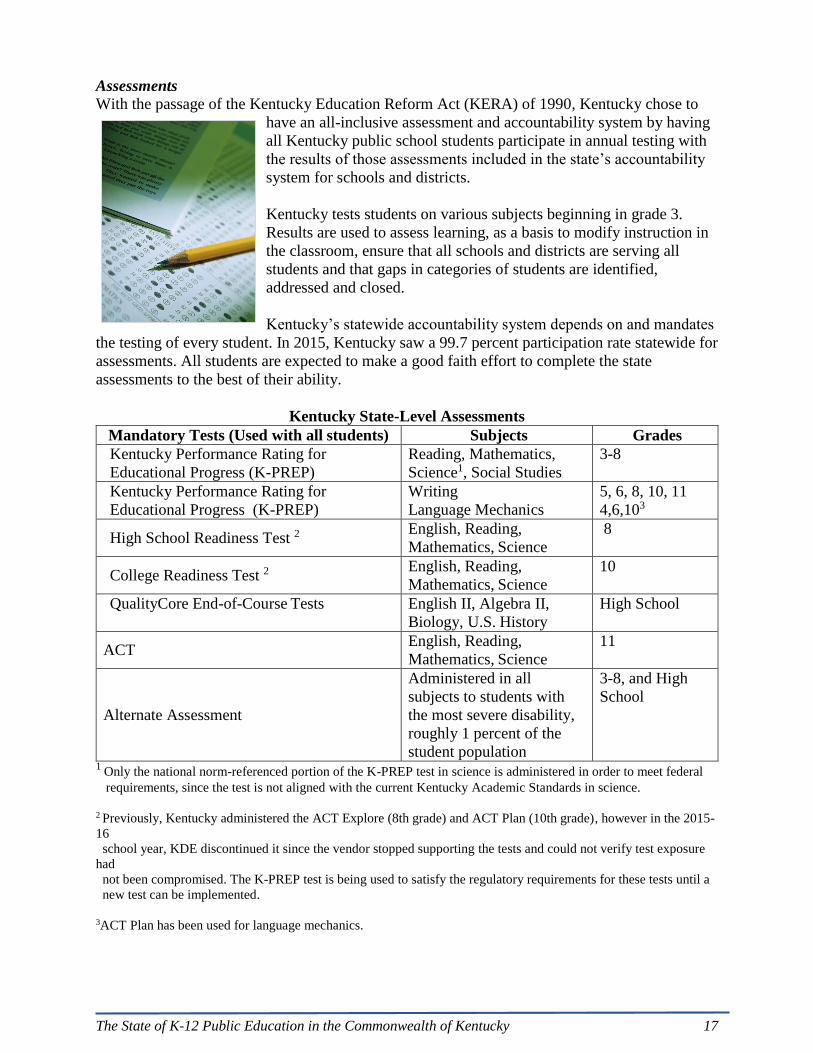
Assessments
With the passage of the Kentucky Education Reform Act (KERA) of 1990, Kentucky chose to
have an all-inclusive assessment and accountability system by having
all Kentucky public school students participate in annual testing with
the results of those assessments included in the state’s accountability
system for schools and districts.
Kentucky tests students on various subjects beginning in grade 3.
Results are used to assess learning, as a basis to modify instruction in
the classroom, ensure that all schools and districts are serving all
students and that gaps in categories of students are identified,
addressed and closed.
Kentucky’s statewide accountability system depends on and mandates
the testing of every student. In 2015, Kentucky saw a 99.7 percent participation rate statewide for
assessments. All students are expected to make a good faith effort to complete the state
assessments to the best of their ability.
Kentucky State-Level Assessments
Mandatory Tests (Used with all students) Subjects Grades
Kentucky Performance Rating for
Educational Progress (K-PREP)
Reading, Mathematics,
Science1, Social Studies
3-8
Kentucky Performance Rating for
Educational Progress (K-PREP)
Writing
Language Mechanics
5, 6, 8, 10, 11
4,6,103
High School Readiness Test 2 English, Reading,
Mathematics, Science
8
College Readiness Test 2 English, Reading,
Mathematics, Science
10
QualityCore End-of-Course Tests English II, Algebra II,
Biology, U.S. History
High School
ACT English, Reading,
Mathematics, Science
11
Alternate Assessment
Administered in all
subjects to students with
the most severe disability,
roughly 1 percent of the
student population
3-8, and High
School
1 Only the national norm-referenced portion of the K-PREP test in science is administered in order to meet federal
requirements, since the test is not aligned with the current Kentucky Academic Standards in science.
2 Previously, Kentucky administered the ACT Explore (8th grade) and ACT Plan (10th grade), however in the 2015-
16
school year, KDE discontinued it since the vendor stopped supporting the tests and could not verify test exposure
had
not been compromised. The K-PREP test is being used to satisfy the regulatory requirements for these tests until a
new test can be implemented.
3ACT Plan has been used for language mechanics.

18 The State of K-12 Public Education in the Commonwealth of Kentucky
Kentucky State-Level Supplemental Assessments
Supplemental Tests
(Used only with designated students)
Subjects Who Takes
Assessing Comprehension and
Communication in English State-to- State
(ACCESS) for English Language
Learners
Reading, Writing,
Speaking, Listening
English Language
Learners only
ACT Compass1 Reading, Mathematics Grade 12 students
who do not meet ACT
benchmarks in the
designated subject
Kentucky Online Testing (KYOTE)
(University of Kentucky)
Reading, Mathematics,
Writing
Grade 12 students
who do not meet ACT
benchmarks in the
designated subject
Advanced Placement (AP) 30 subject areas High School
students who
complete AP courses
ACT WorkKeys Reading, Mathematics Career-enrolled
students only who
have completed
three CTE courses
Armed Services Vocational Aptitude
Battery (ASVAB)
Reading, Mathematics,
Mechanics, Electrical
Career-enrolled
students only who
have completed
three CTE courses
National Assessment of Education
Progress (NAEP)
Reading, Mathematics,
Civics, U.S. History,
Writing
Only students in
sampled schools
Kentucky Occupational Skills Standards
Assessment (KOSSA)
Broad spectrum ranging
from Agriculture,
Manufacturing to
Engineering
Career-enrolled
students only who
have completed
three CTE courses 1 The vendor has announced it is discontinuing this test.
Time Required for Mandatory State Testing
Overall, mandatory statewide testing requires less than 1 percent of the instructional time
available in a school year.
However, districts often administer their own
tests, which increases the assessment burden
on teachers and students. The department has
partnered with school districts to review their
benchmark and formative assessments and
encourages districts to evaluate both the quality
and quantity of local testing. The goal on a
state and local level is to ensure there's a clear
purpose for every assessment that is being
administered to Kentucky’s students.

The State of K-12 Public Education in the Commonwealth of Kentucky 19
Rigor and Reliability of State Assessments
Nationally, the rigor of state tests is often called into question. In 2015, Achieve and the
Collaborative for Student Success released a new analysis of student proficiency scores that
compares student performance on state tests and on NAEP. In many states there are wide
discrepancies, with students almost always performing better on state tests.
According to the report, for the 2013-14 school year, Kentucky showed an 18-point discrepancy
between state-reported proficiency scores and NAEP scores in 4th grade reading, and a 15-point
discrepancy in 8th grade math – about half what it was before moving to K-PREP tests. In
comparison, more than half the country had discrepancies in excess of 30 percentage points, with
the differential in some states greater than 50 percentage points.
Online Testing
In 2015-16, online testing is available for end-of-course tests in high school and ACCESS for
ELLs. The state does not currently have the capacity to provide all tests online, although this
remains an ongoing area of study.
Future Tests
Work is underway on the design of a new science test. In spring 2015, the Kentucky Department
of Education (KDE) began working with WestEd, an assessment company, on conceptualizing
the design of a new science assessment system. WestEd may not bid on the development of the
operational science assessment in the future. Work and products from this contract will be used
in creating a Request for Proposals to secure a vendor for the new science assessment and to
inform Kentuckians about the new assessment.
WestEd has facilitated work with science specialists and assessment staff at KDE and individuals
representing classroom teachers, school and district leaders, and university faculty.
A prototype for a summative assessment and an example of
a through course task for formative assessment purposes are
nearing completion. The summative prototype consists of a
group of clustered or connected items to measure two
performance expectations (referred to as science standards
in Kentucky’s Academic Standards). The through course
assessment is intended for implementation in the classroom
setting to allow for performance and skill based application
of the intended science practices, concepts and ideas.
The next step is to try the prototypes out with a small number of Kentucky students in an
experience similar to a “cognitive laboratory,” where students explicitly describe their thinking
and process for completing the assessment. Additional edits to the prototype items may happen
after the tryout.
Assessment guidance documents on aligning tasks and clusters of items to the standards and an
overall assessment system design are nearing completion as well.
20 The State of K-12 Public Education in the Commonwealth of Kentucky
Test Security and Data Quality
Test security activities are designed to ensure the security of
assessments used in accountability determinations. The Office of
Assessment and Accountability (OAA) at the Kentucky Department
of Education provides training on the regulations that govern testing
and communicates security expectations to certify proper test
procedures were followed. Analysis of erasures and other post-testing
data are monitored and may highlight needs for further investigation.
Since state-required assessments are the basis of accountability, consistent administration is a
critical element for score validity. OAA works collaboratively with the District Assessment
Coordinator advisory group and the School Curriculum Assessment and Accountability Council
to identify needs and to develop supports and processes for successful test administrations.
Data quality is an on-going collaborative process between local districts and KDE to ensure
accurate data and public reporting. OAA uses data in the state student information system and
individual student test results to populate a secure Web-based application used for rosters, data
cleanup, and quality control. Each year, public reporting has been increasingly accurate, with
only a small number of requested data reviews following public reporting.
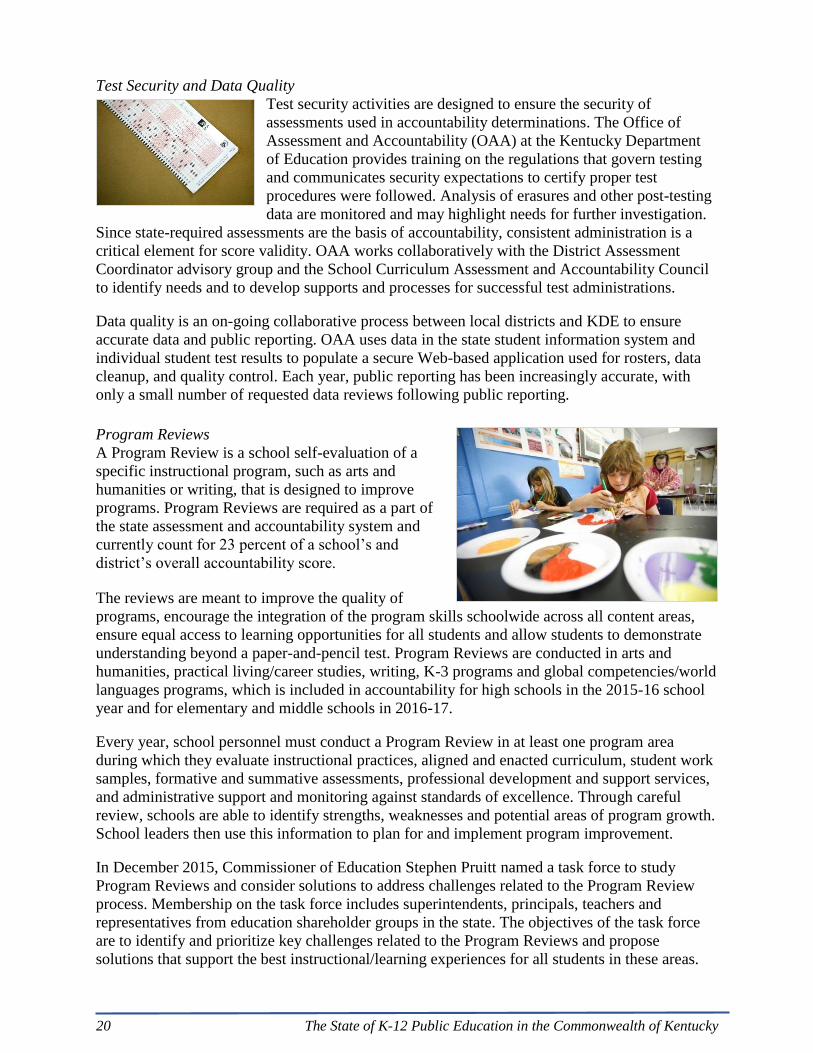
Program Reviews
A Program Review is a school self-evaluation of a
specific instructional program, such as arts and
humanities or writing, that is designed to improve
programs. Program Reviews are required as a part of
the state assessment and accountability system and
currently count for 23 percent of a school’s and
district’s overall accountability score.
The reviews are meant to improve the quality of
programs, encourage the integration of the program skills schoolwide across all content areas,
ensure equal access to learning opportunities for all students and allow students to demonstrate
understanding beyond a paper-and-pencil test. Program Reviews are conducted in arts and
humanities, practical living/career studies, writing, K-3 programs and global competencies/world
languages programs, which is included in accountability for high schools in the 2015-16 school
year and for elementary and middle schools in 2016-17.
Every year, school personnel must conduct a Program Review in at least one program area
during which they evaluate instructional practices, aligned and enacted curriculum, student work
samples, formative and summative assessments, professional development and support services,
and administrative support and monitoring against standards of excellence. Through careful
review, schools are able to identify strengths, weaknesses and potential areas of program growth.
School leaders then use this information to plan for and implement program improvement.
In December 2015, Commissioner of Education Stephen Pruitt named a task force to study
Program Reviews and consider solutions to address challenges related to the Program Review
process. Membership on the task force includes superintendents, principals, teachers and
representatives from education shareholder groups in the state. The objectives of the task force
are to identify and prioritize key challenges related to the Program Reviews and propose
solutions that support the best instructional/learning experiences for all students in these areas.
The State of K-12 Public Education in the Commonwealth of Kentucky 21
K-12 Public Education Performance
For years, Kentucky ranked near the bottom of states in nearly every indicator of K-12 public
education performance. But, that is the case no more. Instead, Kentucky is often cited nationally
as an example for other states of improvement and ranks in the top ten in several key indicators.
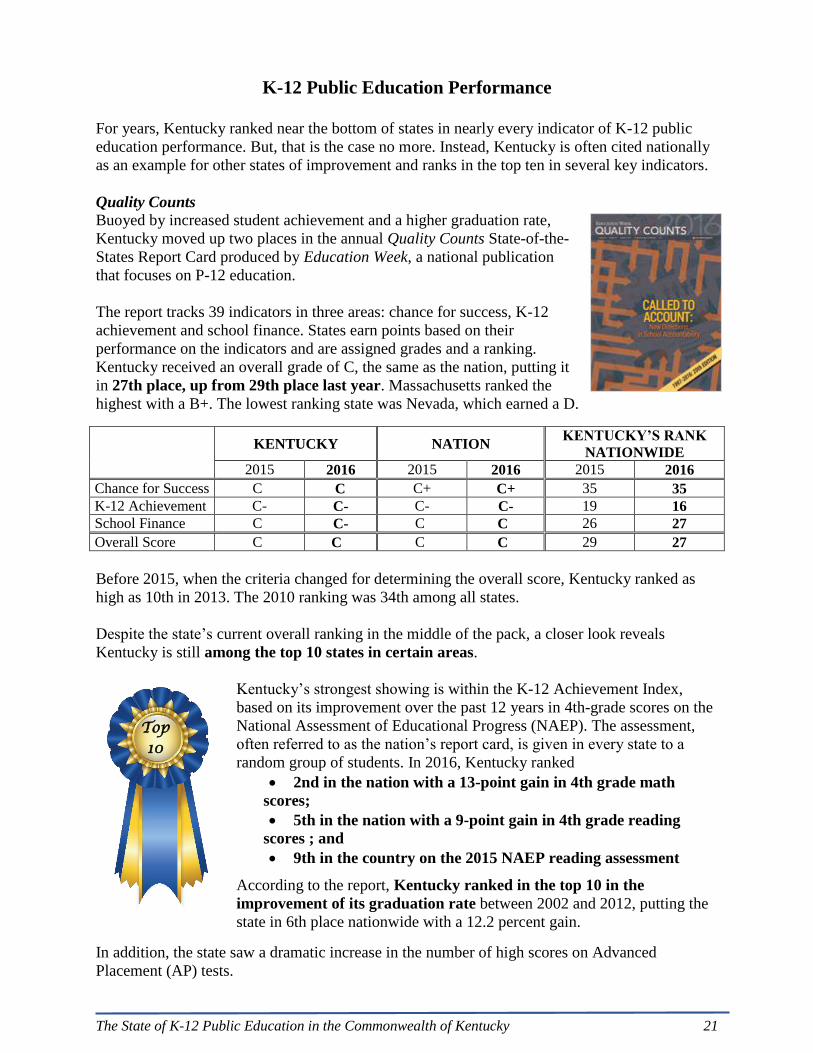
Quality Counts
Buoyed by increased student achievement and a higher graduation rate,
Kentucky moved up two places in the annual Quality Counts State-of-the-
States Report Card produced by Education Week, a national publication
that focuses on P-12 education.
The report tracks 39 indicators in three areas: chance for success, K-12
achievement and school finance. States earn points based on their
performance on the indicators and are assigned grades and a ranking.
Kentucky received an overall grade of C, the same as the nation, putting it
in 27th place, up from 29th place last year. Massachusetts ranked the
highest with a B+. The lowest ranking state was Nevada, which earned a D.
Before 2015, when the criteria changed for determining the overall score, Kentucky ranked as
high as 10th in 2013. The 2010 ranking was 34th among all states.
Despite the state’s current overall ranking in the middle of the pack, a closer look reveals
Kentucky is still among the top 10 states in certain areas.
Kentucky’s strongest showing is within the K-12 Achievement Index,
based on its improvement over the past 12 years in 4th-grade scores on the
National Assessment of Educational Progress (NAEP). The assessment,
often referred to as the nation’s report card, is given in every state to a
random group of students. In 2016, Kentucky ranked
2nd in the nation with a 13-point gain in 4th grade math
scores;
5th in the nation with a 9-point gain in 4th grade reading
scores ; and
9th in the country on the 2015 NAEP reading assessment
According to the report, Kentucky ranked in the top 10 in the
improvement of its graduation rate between 2002 and 2012, putting the
state in 6th place nationwide with a 12.2 percent gain.
In addition, the state saw a dramatic increase in the number of high scores on Advanced
Placement (AP) tests.
KENTUCKY NATION
KENTUCKY’S RANK
NATIONWIDE
2015 2016 2015 2016 2015 2016
Chance for Success C C C+ C+ 35 35
K-12 Achievement C- C- C- C- 19 16
School Finance C C- C C 26 27
Overall Score C C C C 29 27
Top 10
22 The State of K-12 Public Education in the Commonwealth of Kentucky
One of the state’s biggest challenges in K-12 achievement is closing the achievement gap. Specifically, the 2016 Quality Counts report looked at the gap in performance between students
who are eligible for free/reduced-price (F/R) meals – which is 60 percent of the student
population in Kentucky – and those who are not. While a wide achievement gap between low-
income students and their wealthier counterparts exists in every state in the nation, the poverty
gap is lower in Kentucky than in the majority of states.
2015 COMBINED PROFICIENCY RATES REGIONAL COMPARISON
F/R meal non-eligible F/R meal eligible Poverty Gap Ranking
West Virginia 40.2 22.2 18 1
Kentucky 51.6 25.3 26.3 18
Indiana 54.8 27.9 26.9 21
Missouri 49.1 22.1 27 23
Tennessee 49.6 21.6 28.1 29
U.S. 51 20.9 30.1 n/a
Illinois 51.6 20.6 31 39
Ohio 54 21.8 32.2 41
Virginia 54.8 20.7 34.1 46
District of Columbia 56.6 13.3 43.4 51
This year, the state put in place a strategy to reduce the number of novice learners and raise
achievement for all students, especially in math. (See Improving Outcomes for All Students
section of this report).
Ironically, in Massachusetts, which ranked highest in overall performance in the rest of the
report, ranked 48th in the nation when looking at the performance gap between students in
poverty and their more affluent counterparts. It registers a gap of 35.1 points.
The School Finance category has two subcategories – equity and
spending – and presents mixed news for the state. With the exception
of one indicator, Kentucky scores in the top 15 of states in equity of
school finance with the highest ranking in the relationship between
district funding and local property wealth. The state ranks 45th in the
country on the actual spending as a percent of the amount needed to
bring all students to the median per pupil expenditure level in the
state.
In spending, the state ranks below the middle on most indicators. Kentucky’s adjusted per-
pupil expenditure (PPE) is $1,279 less than the national average. However, of greater
concern is the fact that only 13.7 percent of Kentucky students go to school
in a district with a PPE which is at or above the national average.
Nationally, the number is 39.8 percent.
The Chance for Success index captures the importance of education in a person’s
lifetime from cradle to career. Its 13 indicators span a variety of factors
including preparation in early childhood, the performance of public schools, and
educational and economic outcomes in adulthood. Kentucky ranked lowest, at
35th in this area, primarily due to poverty, employment and the relatively low
numbers of adults in the state with more than a high school education.

The State of K-12 Public Education in the Commonwealth of Kentucky 23
219
229 231235
239 241 241 242
224
234 237239
239 240 241 240
270 274 274 279 279 282 281 278272 276 278 280 282 283 284 281
2000 2003 2005 2007 2009 2011 2013 2015
Scal
e Sc
ore
s
218 219 219 220 222 226 225 224 228
213 217 216 217220 220 220 221 221
262 265 266 264 262 267 269 270 268
261 263 261 260 261 262 264 266 264
1998 2002 2003 2005 2007 2009 2011 2013 2015
Scal
e Sc
ore
sOther Measures of Success
Achievement –Elementary and Middle School
NAEP
Kentucky students outperform their peers at most levels in reading, mathematics, and
science on the National Assessment of Educational Progress (NAEP).
NAEP READING NAEP MATHEMATICS
NAEP SCIENCE
Note: Scores are the latest available.
Science was not tested in 2011 at the 4th
grade level.
Achievement – High School
Advanced Placement (AP) Tests
In 2015, more Kentucky public high school students took rigorous Advanced Placement
(AP) tests (see Advanced Placement section of this report) and scored higher than ever before.
In the past five years the number of tests with a qualifying score of 3, 4 or 5, has increased by 40
percent.
Advanced Placement in Kentucky
Students must earn at least a 3 to earn college credit for the course. Five is the highest score
possible.
17,336
20,264
21,854
23,51924,311
15,000
20,000
25,000
2011 2012 2013 2014 2015
Number of Scores 3-5
161
149
156 157
149151
2009 2011
Scal
e Sc
ore
s
4th Grade
8th Grade 8th Grade
4th Grade
24 The State of K-12 Public Education in the Commonwealth of Kentucky
ACT
In the last five years, Kentucky has made greater gains on the ACT than the rest of the
United States.
Kentucky Public High School Graduates’ Average ACT Scores
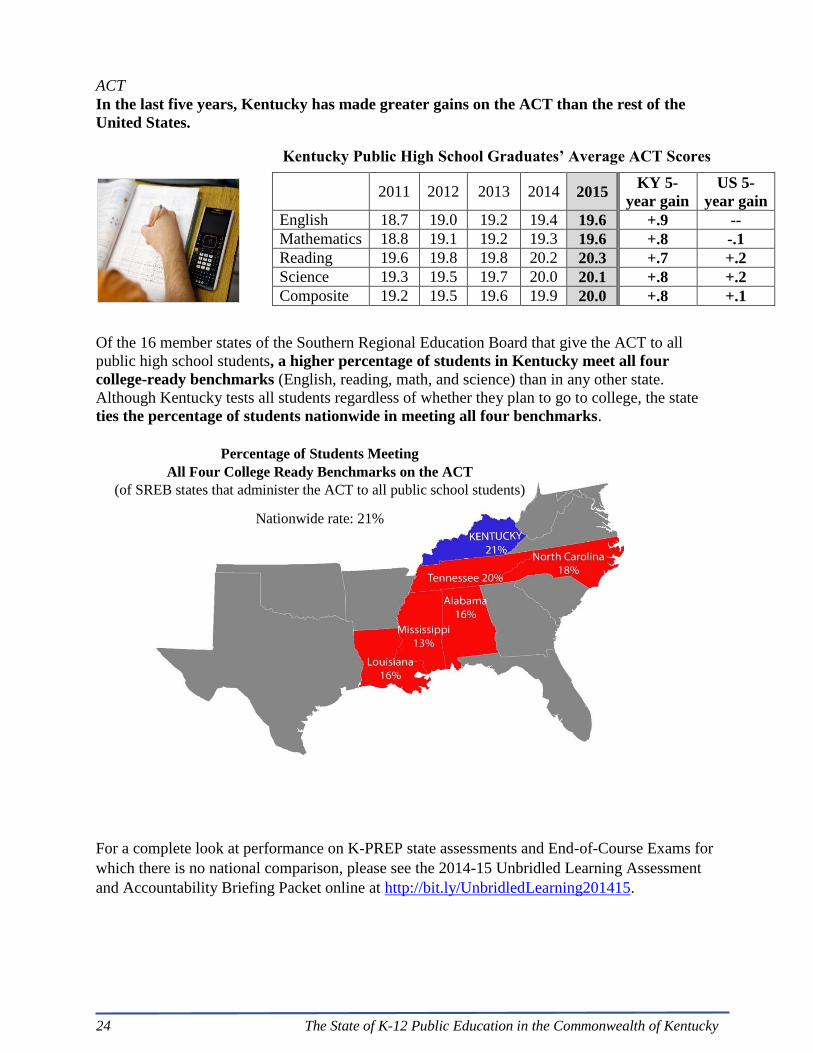
Of the 16 member states of the Southern Regional Education Board that give the ACT to all
public high school students, a higher percentage of students in Kentucky meet all four
college-ready benchmarks (English, reading, math, and science) than in any other state.
Although Kentucky tests all students regardless of whether they plan to go to college, the state
ties the percentage of students nationwide in meeting all four benchmarks.
For a complete look at performance on K-PREP state assessments and End-of-Course Exams for
which there is no national comparison, please see the 2014-15 Unbridled Learning Assessment
and Accountability Briefing Packet online at http://bit.ly/UnbridledLearning201415.
2011 2012 2013 2014 2015
KY 5-
year gain
US 5-
year gain
English 18.7 19.0 19.2 19.4 19.6 +.9 --
Mathematics 18.8 19.1 19.2 19.3 19.6 +.8 -.1
Reading 19.6 19.8 19.8 20.2 20.3 +.7 +.2
Science 19.3 19.5 19.7 20.0 20.1 +.8 +.2
Composite 19.2 19.5 19.6 19.9 20.0 +.8 +.1
Percentage of Students Meeting
All Four College Ready Benchmarks on the ACT
(of SREB states that administer the ACT to all public school students)
Nationwide rate: 21%

The State of K-12 Public Education in the Commonwealth of Kentucky 25
Graduation
In 2015, 88 percent of Kentucky public students graduated from high school on time, among
the highest rates in the nation (all states now use the same 4-year cohort graduation rate
calculation). Kentucky ranks the highest of states that require Algebra II and four years of
English to graduate.
The 2015 Building a Grad Nation report released annually by the
Alliance for Excellent Education, America’s Promise Alliance,
Civic Enterprises and the Everyone Graduates Center at Johns
Hopkins University called Kentucky “a beacon to all other
states.”
Even though more than half of Kentucky’s students are considered
low-income, its graduation rate for low-income students is nearly
identical to its graduation rate for middle/high-income students and
well above the national average for all students. According to the
report, nationwide, low-income students are graduating at a
rate 15 percentage points behind their more affluent peers.
College- and Career-Readiness
In 2015, 66.9 percent of Kentucky public high school students graduated college- and/or
career-ready.
College-ready means students were prepared to take entry-level, credit-bearing, college classes
without remediation or additional coursework.
Career-ready students earned an industry-recognized career certificate or a passing score on a
Kentucky Occupational Skills Standards Assessment, aligned to a Career and Technical
Education Career Pathway.
In 2011, every school board chair and superintendent in the state signed a pledge, the
Commonwealth Commitment, to increase the college/career-readiness rate in their high
schools by 50 percent by 2015. The state provided a comprehensive set of strategies with
specific annual targets to help districts reach their goal. Some 68 percent (114 districts) met
their college/career-readiness goal; 32 percent fell short of meeting their goal. However, of
those 54 districts, 20 came within 5 percent of meeting their goal, another 14 districts came
within 10 percent, significantly increasing the state’s overall college/career-readiness rate.
Postsecondary Enrollment and Success
According to the Kentucky Center for Education and Workforce Statistics (KCEWS), 60
percent of the Class of 2013 enrolled in an institution of higher education the fall following
graduation from high school.
Additionally, KCEWS reports that students who graduate from
high school having reached the Kentucky college/career-
readiness benchmarks realize more success their first year in
college than those who do not meet benchmarks for readiness.
Specifically, they:
have a higher GPA – 2.6 versus 1.7;
complete more college hours – 22 versus 11; and
return for a second year of postsecondary at
higher rates –85 percent versus 65 percent.

26 The State of K-12 Public Education in the Commonwealth of Kentucky
Maximizing Educational Outcomes for All Students
The Kentucky Board of Education has high expectations for all students – from the day they
enter kindergarten until the day they walk across the stage to collect a high school diploma –
And the board is dedicated to maximizing students’ educational outcomes by increasing
readiness and closing opportunity and achievement gaps. This effort does not pertain to only
certain children or groups of children, but applies to ALL children, regardless of family income,
the part of the state where they live, the school they attend, their race or ethnicity, the language
they speak, whether they have a disability or where they fall on the spectrum of learning.
Kindergarten readiness
Each year, Kentucky public schools
administer the Brigance Kindergarten
Screener to each student starting
kindergarten to determine his or her
readiness to learn. School readiness skills
and behaviors are not used to determine
school eligibility; all children who meet
the legal age requirement are entitled to a
public school education.
In 2015-16, only half of the children
entering kindergarten were deemed ready to engage in and benefit from early learning
experiences that promote success. Screener results allow teachers to meet each student where he
or she is on the first day of school and determine how to best meet the child’s learning needs
moving forward. When children start out behind their peers in kindergarten, the push to bring
them up to grade level is urgent. The longer a child lags behind academically, the more difficulty
they have succeeding in school.
Closing the achievement gap
Each year, students receive reports that place their performance on state tests in each content area
tested into the categories (from lowest to highest) of Novice, Apprentice, Proficient and
Distinguished (NAPD). The achievement gap refers
to a substantive performance differences between
the various groups of students, including:
male and female students;
students with and without disabilities;
students with and without English
proficiency;
minority and nonminority students;
students who are eligible for free or
reduced-price meals and those who are not.
Kentucky’s goal is 100 percent proficiency for all students. The distance from that goal or gap is
measured by creating a student Gap Group – an overall count of student groups that have
historically had achievement gaps.
The State of K-12 Public Education in the Commonwealth of Kentucky 27
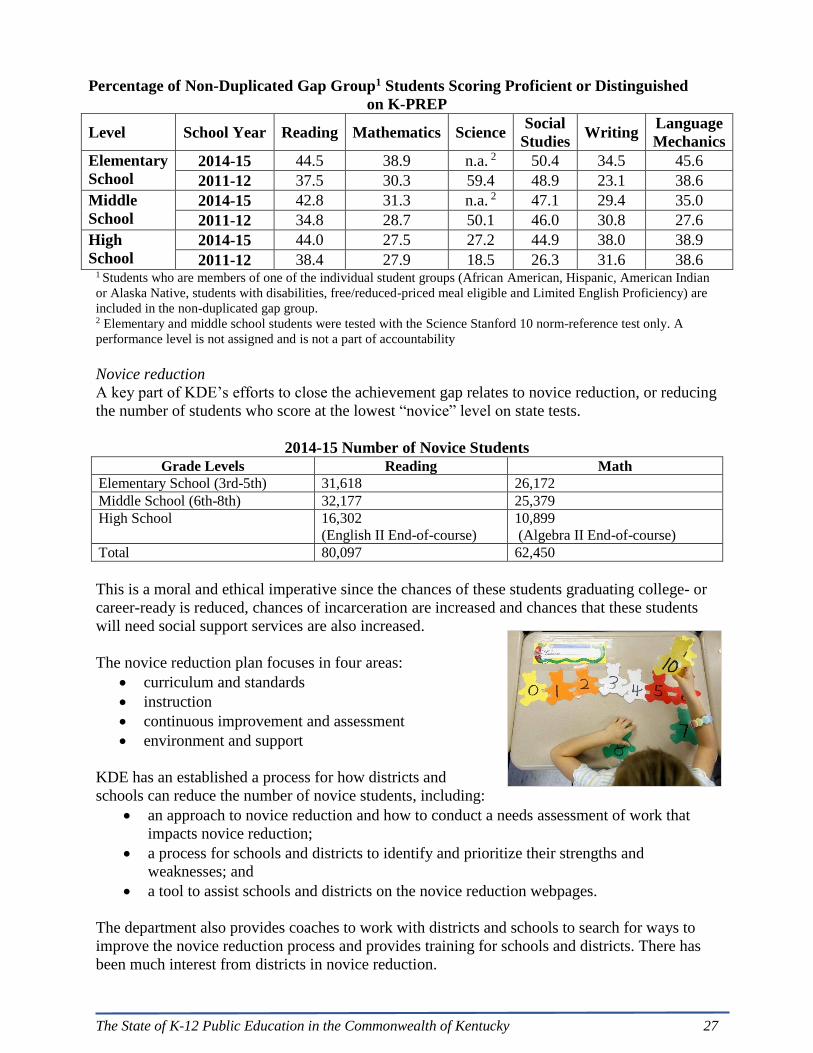
Percentage of Non-Duplicated Gap Group1 Students Scoring Proficient or Distinguished
on K-PREP
Level School Year Reading Mathematics Science Social
Studies Writing
Language
Mechanics
Elementary
School
2014-15 44.5 38.9 n.a. 2 50.4 34.5 45.6
2011-12 37.5 30.3 59.4 48.9 23.1 38.6
Middle
School
2014-15 42.8 31.3 n.a. 2 47.1 29.4 35.0
2011-12 34.8 28.7 50.1 46.0 30.8 27.6
High
School
2014-15 44.0 27.5 27.2 44.9 38.0 38.9
2011-12 38.4 27.9 18.5 26.3 31.6 38.6 1 Students who are members of one of the individual student groups (African American, Hispanic, American Indian
or Alaska Native, students with disabilities, free/reduced-priced meal eligible and Limited English Proficiency) are
included in the non-duplicated gap group. 2 Elementary and middle school students were tested with the Science Stanford 10 norm-reference test only. A
performance level is not assigned and is not a part of accountability
Novice reduction
A key part of KDE’s efforts to close the achievement gap relates to novice reduction, or reducing
the number of students who score at the lowest “novice” level on state tests.
2014-15 Number of Novice Students
Grade Levels Reading Math
Elementary School (3rd-5th) 31,618 26,172
Middle School (6th-8th) 32,177 25,379
High School 16,302
(English II End-of-course)
10,899
(Algebra II End-of-course)
Total 80,097 62,450
This is a moral and ethical imperative since the chances of these students graduating college- or
career-ready is reduced, chances of incarceration are increased and chances that these students
will need social support services are also increased.
The novice reduction plan focuses in four areas:
curriculum and standards
instruction
continuous improvement and assessment
environment and support
KDE has an established a process for how districts and
schools can reduce the number of novice students, including:
an approach to novice reduction and how to conduct a needs assessment of work that
impacts novice reduction;
a process for schools and districts to identify and prioritize their strengths and
weaknesses; and
a tool to assist schools and districts on the novice reduction webpages.
The department also provides coaches to work with districts and schools to search for ways to
improve the novice reduction process and provides training for schools and districts. There has
been much interest from districts in novice reduction.

28 The State of K-12 Public Education in the Commonwealth of Kentucky
So far, KDE has worked with more than 100 leadership teams, and 880 workshop participants
and conducted 3,031 face-to-face meetings about novice reduction and gap closure.
In addition, the Kentucky Board of Education approved several changes to the accountability
model that would provide incentives for schools and districts to move all students to higher
performance levels. The board approved:
Establishing a novice reduction goal where schools and districts would earn points based
on the percentage of the annual goal met in reading and mathematics in the following
categories: African American, Hispanic, American Indian or Native American; limited
English proficiency; students in poverty; students with disabilities that have an Individual
Education Program; and the non-duplicated gap group; and
Giving credit to schools for moving students up one or more performance category
(novice, apprentice proficient, distinguished) or keeping students at the proficient or
distinguished level.

The State of K-12 Public Education in the Commonwealth of Kentucky 29
Student Supports
The Kentucky Department of Education’s primary function is to provide service and assistance
to the state’s 173 school districts. Among the supports provided are programs that meet students’
learning needs as well as basic student needs.
Basic Supports
Nutrition
Good nutrition makes a vital contribution to physical development and a student’s cognitive
performance. KDE administers several programs that deliver quality nutrition and nutrition
education to Kentucky students including the
school breakfast and lunch programs and
Summer Food Service Program. In addition to
the important mission of providing fuel for
growth and learning, these programs bring into
Kentucky more than $150 million annually in
federal reimbursement funds, employ several
thousands of people and utilize thousands of
dollars’ worth of commodities produced by
American farmers.
The Community Eligibility Provision (CEP) is part of the Healthy, Hunger-Free Kids Act of
2010 that allows schools and local educational agencies with high poverty rates to provide free
breakfast and lunch to all students. CEP eliminates the burden of collecting household
applications to determine eligibility for school meals, relying instead on information from other
means-tested programs, such as the Supplemental Nutrition Assistance Program and Temporary
Assistance for Needy Families.
Community eligibility is designed to be extremely easy for a school or district to adopt and
became available nationwide in the 2014-15 school year. As of the 2015-16 school year, 137
school districts had attained either full or partial community eligibility status.
Student Health
There is a critical link between health and learning and the role of schools to help improve the
well-being of students, families, and the entire school
community. Research shows that when school
districts and schools have effective policies and
practices that support the health of their students and
staff:
student concentration improves;
student behavior problems are reduced;
student and staff attendance increases; and
children and adolescents develop life-long health-
promoting behaviors.
The Kentucky School Health and Physical Education (SHAPE) Network provides a
comprehensive approach for engaging schools across the state to promote healthy schools:
nutrition policies, physical education/activity policies and staff wellness through a Coordinated
School Health Plan.
30 The State of K-12 Public Education in the Commonwealth of Kentucky
The SHAPE team has members both at the Kentucky Department of Education and the Kentucky
Department for Public Health.
The Kentucky Youth Risk Behavior Survey is conducted as part of a
national effort by the U.S. Centers for Disease Control and prevention
to monitor students’ health-risk behaviors in six priority areas. These
six areas include injury and violence, alcohol and drug use, tobacco
use, nutrition, physical activity, and sexual risk behaviors. These risk
behaviors contribute to the leading causes of death, disability and
social problems among youth and adults in the U.S. Kentucky has
been administering the survey since 1997. The survey is voluntary and
is administered to a randomly selected sample of middle and high
school students across the state.
The 2015-16 survey showed students still are engaging in some risk
behaviors, such as texting or emailing while driving, engaging in a
physical fight one or more times during the 12 months before the survey, and riding with a driver
who had been drinking alcohol one or more times in the 30 days before the survey.
Safe Schools
Kentucky's General Assembly, through KRS
158.442, provides funding to local school districts
through the Kentucky Center for School Safety in
an effort to support substance abuse prevention and
violence reduction programming. Since the federal
Title IV program was discontinued, the Safe
Schools Grant program is the state’s primary funding source for prevention activities and
provides funds to all school districts within the state, with allocations based on enrollment. This
grant money is managed and monitored by the Kentucky Center for School Safety, according to
spending guidelines within that agency.
KDE collaborates with the Kentucky Center for School Safety to provide training and
professional development to school districts. Throughout the year, the Kentucky Center for
School Safety is available to schools across Kentucky, as a “one stop shop” for school safety
resources, training and assistance.
One new program being offered by KDE is training in
the Olweus Bullying Prevention Program, with the goal
of reducing and preventing bullying problems and
improving peer relations among students. The program is
being used extensively in other states, including
Pennsylvania and South Carolina. East Carter Middle
School became the first school in Kentucky to adopt the
program and received special training and support from
KDE staff to implement it.
The State of K-12 Public Education in the Commonwealth of Kentucky 31
Positive Behavioral Interventions and Supports (PBIS)
The Kentucky Department of Education collaborates with special education cooperatives as
other shareholders to increase the number of schools and districts that implement the Positive
Behavioral Interventions and Supports. Annual web-based training is provided to all districts in
an effort to increase appropriate behavior, decrease inappropriate behavior and respond to
dangerous behavior. The focus is on effective teaching strategies – not only for behavior, but
also academic achievement.
Learning Supports
Kentucky has numerous programs to help all of the Commonwealth’s students stay on track to
graduation and a successful future.
Individual Learning Plans
Students across Kentucky are required to complete an Individual Learning Plan (ILP) beginning
in the 6th grade. This learning plan is designed to help students bring together their academic
achievements, extracurricular experiences, and career and
education exploration activities. This enables the student,
parents or guardians, teachers and counselors to work together
to develop a course of study that meets the student’s needs and
goals.
An online Student ILP Tool lets students record their goals for
their career, education and life; bookmark careers and schools
that are of interest to them, explore career clusters, record
extracurricular activities, community activities and work experience; and create professional
looking resumes. An online Parent/Guardian ILP Tool gives parents the chance to see what their
child has entered into his or her ILP account, learn about careers that are of interest to their child
and email comments to their child’s advisor.
Both of these tools and the curriculum used in the classroom help students to begin seeing early
in their educational life the connection between what they are learning in the classroom and how
it can affect their future careers.
Kentucky’s System of Interventions (KSI) and Response to Interventions (RtI)
An additional support for schools and districts to help keep students on track is Kentucky’s
System of Interventions (KSI) and Response to Interventions (RtI).
This comprehensive system addresses Response to
Interventions, accelerated learning requirements,
closing achievement gaps, highly effective instruction,
readiness to learn and student transitions. KDE has
expanded the framework for RtI to assist schools and
districts in incorporating state and federal programs to
provide a seamless system of interventions for
improving student achievement.
KSI is based on a three-tiered system depending upon the needs of the student. Tier 1, which
includes 80 percent of the students in Kentucky’s classrooms, is the universal instruction
provided to all students in the general education classroom. Tier 2 is targeted instruction, which
covers 15 percent of the public school system population, for students who need additional
32 The State of K-12 Public Education in the Commonwealth of Kentucky
academic or behavioral interventions due to either not meeting or exceeding the standards. Tier
3, which covers 5 percent of the student population, provides more intensive instruction for
students not making adequate progress in the core curriculum and Tier 2 interventions.
KDE provides schools and districts with guidance and best practice resources. It also provides
technical assistance to schools/district on the implementation of the tiered intervention system,
and helps problem solve district or school-specific intricacies around implementation and
management.
Extended School Services (ESS)
The Extended School Services (ESS) program is another tool for school districts to use and is
designed to assist individual students who are having difficulty in one or more content areas.
ESS funds are allocated to every school
district for the purpose of operating a program
for students having short- or long- term
academic difficulties. ESS programs offer
extra instructional time outside regular school
hours and may take a variety of formats,
including after-school or before-school
programs, evening sessions, Saturday learning
opportunities, summer programs and/or
intercessions.
Districts have the opportunity to request a waiver to offer ESS services during the school day.
There is close collaboration between the regular day program and the ESS program to best meet
the student's needs. ESS programs being implemented across the state offer a wide array of
curricular programs and instructional formats. Many of these programs are designed to gain the
interest of and inspire motivation in students.
Persistence to Graduation Tool
Another tool offered to schools is the online Persistence to Graduation Tool. It is an early
warning system to help schools identify students who may be off-track for graduation or
promotion to the next grade level. The tool uses
student-level data and research-based indicators
– such as attendance, suspensions or removals,
and failing grades -- to highlight students who
may be in need of additional intervention or
support. Drawing information from the current
and prior academic year, the tool calculates a risk
value for each student. Each school may then
determine the necessary and appropriate supports
and interventions for students who may be off
track for graduation.

The State of K-12 Public Education in the Commonwealth of Kentucky 33
Alternative Education Programs
Alternative education programs exist to meet the needs of students that cannot be addressed in a
traditional classroom setting through the assignment of students to alternative classrooms,
centers, or campuses that are designed to remediate academic performance, improve behavior or
provide an enhanced learning experience. Alternative education programs do not include career
or technical centers or departments. There has been a greater focus on alternative education
programs since the compulsory school attendance age has increased to age 18. The goal is to
provide a meaningful education program, not just warehouse the student until he or she turns 18.
The Kentucky Department of Education is currently working to improve the alternative
monitoring and support process and providing professional learning activities using the 11
Alternative Programs of Distinction as examples of alternative education done right.
Exceptional Children
A significant portion of the students enrolled in a public school in Kentucky qualify as
exceptional children – either because they are English language learners, possess a disability or
are identified as gifted and talented.
English Language Learners (ELLs)
For the 2014-15 school year, almost 24,000 students, or 3.6 percent of the population, were
classified as English language learners. These are students whose primary language is something
other than English. The vast majority of these
students were of a Hispanic background
(14,688), with the number of Asian students
(3,796) being the next most populous group.
Each new student in a district is given a home-
language survey. If the answer to any of the
four required questions is any language other
than English, then a special screener is given,
the results of which must be shared with
parents within the first 30 days of enrollment
or two weeks of enrollment during the
school year.
For each identified ELL student, a program services committee will design a Program Services
Plan (PSP). The teacher will provide services throughout the year with appropriate instructional
and assessment accommodations for each individual ELL student.
All identified ELL students are required federally to be assessed annually with an English
Language Proficiency test. Students must meet certain standards on the ACCESS English
Language Learner assessment to exit from the ELL program.
34 The State of K-12 Public Education in the Commonwealth of Kentucky
Students with Disabilities
There were 86,966 students in the 2014-15 school year, or 13.3 percent, identified as having a
disability and placed in special education. The majority of those students, by an almost 2 to 1
margin, were male and the majority of
them (69,532) were classified as
white. There were 22,768 students
with a speech language disability,
15,079 with a specific learning
disability and 13,438 with another
health impairment. In 2014, more than
73 percent of students with disabilities
spent 80 percent or more of their day
in general education classrooms.
Greater strides need to be made to
reduce the number of students with
disabilities who score as below
proficient on state tests. Almost 70 percent of students with disabilities were not proficient in
either reaching or math at the elementary school level; and although 70 percent of students with
disabilities graduated from high school in 2014, only 22 percent were deemed ready for college
and careers.
It is notable that the focus of many states, including Kentucky,
on regulatory compliance over the past 30 years has resulted in
improved compliance. However, over that same period of time,
educational results and outcomes for students with disabilities
have not improved. While it is important to celebrate the
achievement of improved compliance and to ensure that
commitment moving forward, it is clear that a sole focus on
compliance does not improve the educational results for the
students.
One possible tool to help in this matter is a requirement from
the federal Office of Special Education Programs for states to
create a State Systemic Improvement Plan. The purpose of the
plan is to increase the capacity of school districts to
implement, scale and sustain evidence-based practices to improve educational results and
outcomes for students with disabilities. KDE is requiring regional co-ops to develop regional
systemic improvement plans, with an emphasis on improvement in math.
The State of K-12 Public Education in the Commonwealth of Kentucky 35
Gifted and Talented Students
In the 2014-15 school year, there were 107,509 students classified as gifted and talented, 16.4
percent of the total school population. This group was split fairly evenly between male and
female students, with the top abilities classified as general intellectual ability (32,984),
specific academic aptitude – language arts (25,292) and specific academic aptitude –
mathematics (24,415).
Kentucky law requires the state to oversee a
comprehensive educational program for its
exceptional school-aged children. All school
districts are required to operate programs for
exceptional children, including gifted and talented
students. Among the strategies used to meet the
unique learning needs of the gifted and talented
community are:
Differentiation – Differentiation recognizes students with varying background knowledge,
readiness, language, preferences in learning and. interests. Teachers can differentiate content,
process and product using a variety of tiered activities including small group instruction,
graphic organizers, compacting assignments, jigsaw and learning centers.
Accelerated Learning – This includes Advanced Placement, dual credit opportunities, the
International Baccalaureate program and performance-based credit, which allows students to
earn credit outside the traditional structure of a 120-hour instructional course.
Early Graduation – Early Graduation is a deliberate pathway for students who intend to
progress through high school on an accelerated timeline and graduate college ready in three
years or less of high school or at age 18. Early Graduation students move on when ready,
receive a diploma from the district and are eligible for acceptance into Kentucky public
universities and non-profit independent colleges and universities. The related regulation
provides a financial scholarship, known as the Early Graduation Certificate, to support this
action. In its first year of implementation, more than 345 students enrolled in the program,
representing 63 different districts and 89 diverse high schools across the state.
Kentucky was one of several states awarded a Javits Grant to meet the special education needs of
gifted and talented students. In addition to verifying and reporting achievement data
disaggregated for gifted students, a professional learning opportunity is planned for March 2016
which will focus on identifying and serving gap and under-represented groups of students in the
state.
36 The State of K-12 Public Education in the Commonwealth of Kentucky
Accountability and School Improvement
Accountability
The Unbridled Learning Assessment and
Accountability System provides in-depth
information about the performance of students,
schools, districts and the state as a whole. The
Unbridled Learning accountability model includes
annual public reporting of student performance
disaggregated by various student groups. The data
also gives Kentucky education shareholders the
information they need to make decisions on
education polices, programs and curricula, and
overall school improvement.
Kentucky’s current accountability system, the Unbridled Learning College/Career-Readiness
Accountability model, was designed under the federal No Child Left Behind Act (2001) and
provides one system for state and federal accountability. The model supports the Kentucky
Board of Education’s strategic priorities: Next-Generation Learners, Next-Generation
Instructional Programs and Support and Next-Generation Professionals, though this component
has not yet been included in the actual accountability calculation.
Various component scores in each area are calculated and weighted to produce an overall score.
Based on overall scores, schools and districts fall into one of three performance classifications.
Number of Schools and Districts by Classification1
Schools Year Needs Improvement Proficient Distinguished
Elementary
2012 508 148 77
2013 483 172 75
2014 371 187 162
2015 328 196 188
Middle
2012 231 66 36
2013 210 82 39
2014 174 86 69
2015 181 70 76
High
2012 160 46 24
2013 86 80 65
2014 88 81 59
2015 51 84 93
Total Schools
2012 899 260 137
2013 779 334 179
2014 633 354 290
2015 560 350 357
Districts
2012 121 35 18
2013 88 61 25
2014 78 55 40
2015 53 73 47

The State of K-12 Public Education in the Commonwealth of Kentucky 37
Progressing is an additional designation that is added to a school/district performance
classification of distinguished, proficient or needs improvement to indicate that the school has
met its annual measurable objective, student participation rate for the all students group and each
subgroup, and has met its graduation rate goal.
Number of Schools and Districts Progressing
Schools Year
Needs Improvement/
Progressing
Proficient/
Progressing
Distinguished/
Progressing
Elementary
2013 212 101 49
2014 227 147 139
2015 141 109 122
Middle
2013 106 42 23
2014 116 61 60
2015 56 33 39
High
2013 32 42 35
2014 32 43 41
2015 12 30 39
Total Schools
2013 350 185 107
2014 375 251 240
2015 209 172 201
Districts
2013 33 26 4
2014 32 27 25
2015 11 17 11
Schools and districts are placed in rewards or assistance categories based on overall scores and
other data.
Focus schools were originally identified in 2011-12 as outlined in 703 KAR 5:225 and generally
represent those schools/districts with the lowest performance, largest achievement gaps and/or
the lowest graduation rates in the state.
Number of Schools and Districts by Assistance Category
Schools Year Priority School1 Focus School2
Elementary
2012 0 103
2013 0 102
2014 0 98
2015 2 101
Middle
2012 9 106
2013 9 105
2014 9 103
2015 10 106
High
2012 32 76
2013 32 75
2014 27 73
2015 17 75
Total Schools
2012 41 285
2013 41 282
2014 36 274
2015 28 284
38 The State of K-12 Public Education in the Commonwealth of Kentucky
Districts
Priority District Focus District
2012 n/a 17
2013 n/a 17
2014 n/a 17
2015 0 17 1 Two Priority Schools also are identified as Distinguished and are reported as Priority Schools for
monitoring purposes only. 2 Schools previously identified remain in their status for a minimum of two consecutive years
(2012 and 2013) over this time they must demonstrate sustained improvement to exit. Some
Focus Schools exited in 2014, but additional Focus Schools were identified based on federal
requirements. Focus Districts represent the lowest 10 percent of districts identified annually.
School Improvement
While Kentucky public education has made great strides in recent years, schools and districts
continue to work to improve student achievement.
Through a system of continuous improvement schools and districts are constantly learning,
reflecting, monitoring and evaluating for success. Schools use 30-60-90 Day Plans to pursue
goals that are aligned to their Comprehensive School Improvement Plan or Comprehensive
District Improvement Plan. Outcomes are measured by data for each initiative.
In order to disseminate practices that motivate, engage and provide measurable results in the
classroom across the state, the Kentucky Department of Education hosts a Best Practices website
that allows teachers and administrators access to strategies that have been proven successful. The
searchable database allows educators to zero in on their specific need or browse the practices that
have been proven to improve student performance.
For schools that need extra help, the department offers a vast array of supports.
Focus Schools
As required under the Elementary and Secondary Education Act, the department has identified
schools as Focus Schools. These schools meet the following criteria:
Schools that have a non-duplicated student gap group score in the bottom 10 percent
of non-duplicated student gap group scores for all elementary, middle and high
schools
Schools with an individual student subgroup within assessment grades by level with a
score in the third standard deviation below the state average for all students; or
High schools that have a graduation rate that has been less than 60 percent for two
consecutive years.
In the 2014-15 school year, 284 schools were identified as Focus Schools. These schools work
with the department to create a new Comprehensive School Improvement Plan designed to help
the school improve student achievement. Schools that rate as Focus Schools for four years
receive additional supports including improvement strategies, the assignment of a high-achieving
partner school and other resources from KDE staff. Schools that have been identified as Focus
Schools remain in that category for a minimum of two consecutive years during which time they
must demonstrate sustained improvement in order to exit Focus status.
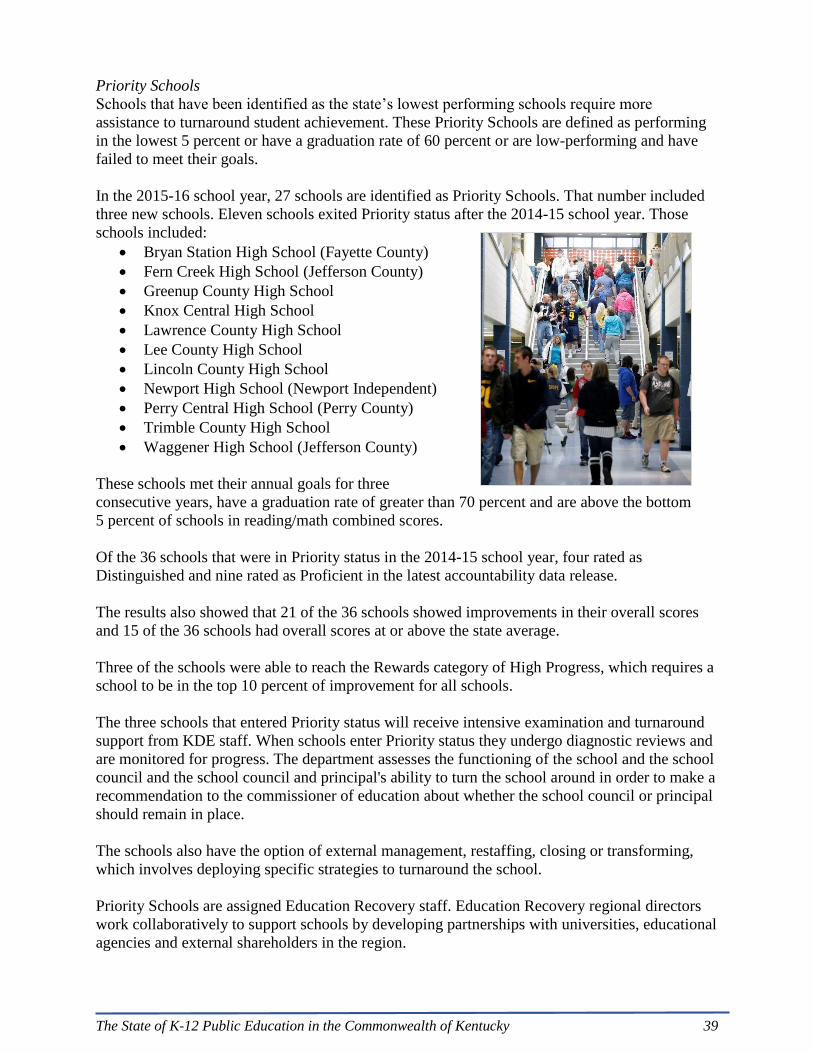
The State of K-12 Public Education in the Commonwealth of Kentucky 39
Priority Schools
Schools that have been identified as the state’s lowest performing schools require more
assistance to turnaround student achievement. These Priority Schools are defined as performing
in the lowest 5 percent or have a graduation rate of 60 percent or are low-performing and have
failed to meet their goals.
In the 2015-16 school year, 27 schools are identified as Priority Schools. That number included
three new schools. Eleven schools exited Priority status after the 2014-15 school year. Those
schools included:
Bryan Station High School (Fayette County)
Fern Creek High School (Jefferson County)
Greenup County High School
Knox Central High School
Lawrence County High School
Lee County High School
Lincoln County High School
Newport High School (Newport Independent)
Perry Central High School (Perry County)
Trimble County High School
Waggener High School (Jefferson County)
These schools met their annual goals for three
consecutive years, have a graduation rate of greater than 70 percent and are above the bottom
5 percent of schools in reading/math combined scores.
Of the 36 schools that were in Priority status in the 2014-15 school year, four rated as
Distinguished and nine rated as Proficient in the latest accountability data release.
The results also showed that 21 of the 36 schools showed improvements in their overall scores
and 15 of the 36 schools had overall scores at or above the state average.
Three of the schools were able to reach the Rewards category of High Progress, which requires a
school to be in the top 10 percent of improvement for all schools.
The three schools that entered Priority status will receive intensive examination and turnaround
support from KDE staff. When schools enter Priority status they undergo diagnostic reviews and
are monitored for progress. The department assesses the functioning of the school and the school
council and the school council and principal's ability to turn the school around in order to make a
recommendation to the commissioner of education about whether the school council or principal
should remain in place.
The schools also have the option of external management, restaffing, closing or transforming,
which involves deploying specific strategies to turnaround the school.
Priority Schools are assigned Education Recovery staff. Education Recovery regional directors
work collaboratively to support schools by developing partnerships with universities, educational
agencies and external shareholders in the region.
40 The State of K-12 Public Education in the Commonwealth of Kentucky
Education Recovery staff are assigned to the school to support the staff with an emphasis on
leadership, literacy and math. The Educational Recovery leaders and specialists focus their work
around a systems approach that aligns with the mission and vision of the school leader.
The leaders and specialists work with staff to help turn around the school in many ways
including ensuring rigorous and authentic assessments to inform and improve instruction,
helping staff work with families and the community to remove barriers to learning, and working
with teachers to identify areas of growth that will enhance their teaching skills.
The Education Recovery staff is proving effective at many of the Priority Schools. Of the 27
schools currently under Priority status, a great number are making substantial gains.
Three schools that were former Priority Schools have now be identified as Hub Schools which
serve as a model for school turnaround and best practices in teaching and learning. Those schools
are: Franklin-Simpson High School, Pulaski County High School and East Carter High School.
During the 2014-15 school year, more than 2,220 educators from 274 schools and several
districts visited the Hub schools.
This year KDE staff continue to work with the Priority Schools to implement Novice Reduction
strategies, strengthen the capacity of the schools’ leadership, review data and develop
sustainability plans for exiting schools.
Every Student Succeeds Act
In December 2015, Congress reauthorized the Elementary and Secondary Education Act, called
the Every Student Succeeds Act (ESSA), which will allow states greater flexibility than under
No Child Left Behind.
ESSA still requires annual tests in grades 3-8 and
once in high school. But it also requires states to
rate schools on other measures of student progress
other than testing, including graduation rates,
advance courses and English language proficiency.
States also will have to include one other measure,
such as engagement, educator engagement, access to
and completion of advanced coursework,
postsecondary readiness, school climate/safety or
another measure.
The ESSA also encourages the development of richer, performance-based assessments and may
include portfolios and projects.
Instead of adequate yearly progress states will be able to define long-term goals that are
“ambitious” and include measures of interim progress.
The Every Student Succeeds Act will provide Kentucky the opportunity to modify and simplify
its accountability model to promote continuous improvement in our schools that is fair, equitable
and promotes success for all students. Any changes will need to be in place by the 2017-18
school year. Kentucky’s current accountability model will remain in place for the 2015-16 school
year. The state awaits direction from the U.S. Department of Education on how accountability
will be handled in the 2016-17 school year.

The State of K-12 Public Education in the Commonwealth of Kentucky 41
State assisted and managed districts
When local school districts demonstrate an inability to execute their responsibilities or properly
govern themselves, it can become necessary for KDE to provide assistance or even take full
control of operations in the district. When a district that demonstrates such a critical lack of
efficiency or effectiveness in governance or administration that state-mandated corrective action
or state control of the district is required, the district is designated for state assistance or
management.
When a district is placed under state assistance, KDE provides management assistance to the
district to develop and implement a plan to correct deficiencies. Under state management, KDE
has full control of all administrative, operational, financial, personnel and instructional
management duties typically carried out by the local school board and superintendent. The state
maintains control until the Kentucky Board of Education (KDE) determines that the patterns of
ineffective and inefficient governance and the deficiencies have been corrected.
The commissioner’s recommendation to the KBE that a district be designated for state assistance
or management is based on a management audit that includes an investigation of the district's
compliance with state and federal statutes, administrative regulations and local board policies.
There are five districts currently under state assistance or management, and progress has been
made in each of them since those designations were put in place by the KBE.
These districts are currently under state assistance:
Caverna Independent: Progress has been made toward a more intentional approach to
teaching and learning, including strengthening lesson plans and improving parent and
community involvement so the district can avoid state management.
Fleming County: The district has worked to make financial improvements through
spending cuts and is collaborating with KDE on a major renovation at its high school.
The district also has placed an intentional focus on instruction which will help it work
toward its ultimate goal of becoming a District of Distinction.
Robertson County: The district has worked to lower expenses and add revenue to its
general fund and to reverse declining enrollment, all teachers have been trained in using
classroom systems for continuous improvement and new leadership at the district level
has strengthened community involvement.
These districts are currently under state management:
Breathitt County: The district has hired a superintendent who is collaborating with a state
manager on daily operations, local board members continue to develop the capacity for
leadership and self-governance through partnerships and a district-wide focus has been
placed on improving results through monitoring and analyzing data.
Menifee County: There has been improvement in transparency in communication, culture
and climate, and systems are in place to educate and hold all shareholders responsible for
following policies and procedures. The district is working with the state manager to
improve student achievement and day-to-day operations.
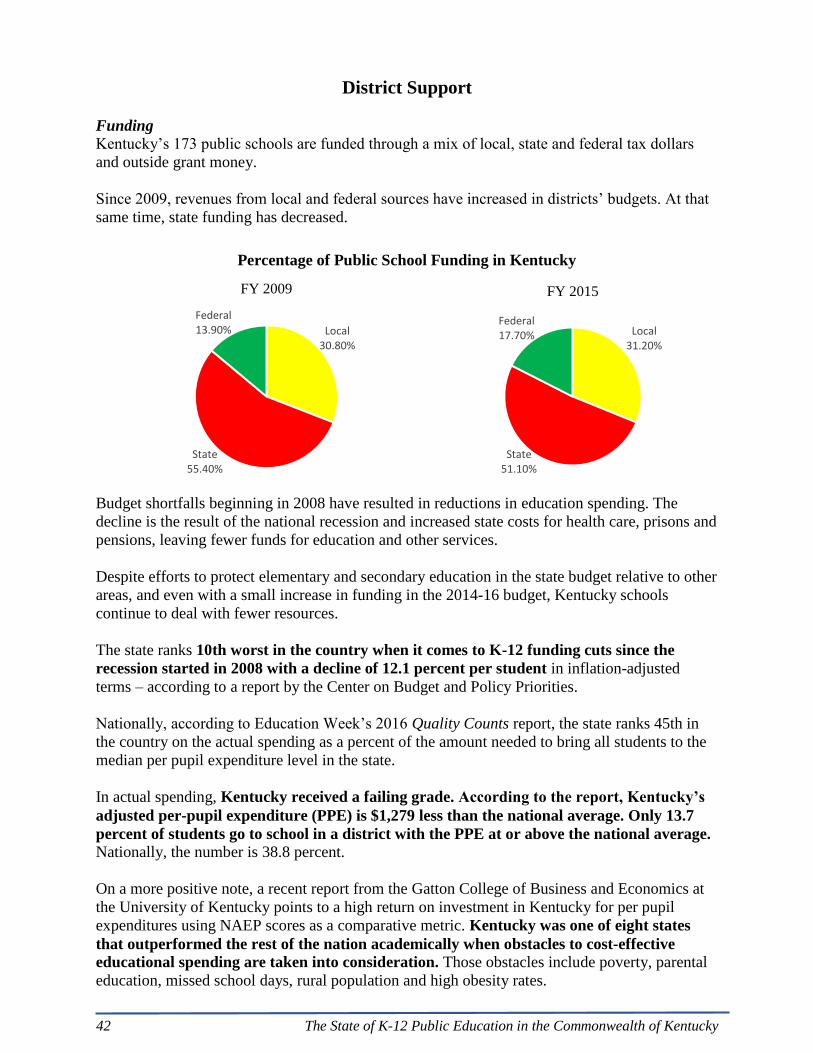
42 The State of K-12 Public Education in the Commonwealth of Kentucky
District Support
Funding
Kentucky’s 173 public schools are funded through a mix of local, state and federal tax dollars
and outside grant money.
Since 2009, revenues from local and federal sources have increased in districts’ budgets. At that
same time, state funding has decreased.
Percentage of Public School Funding in Kentucky
Budget shortfalls beginning in 2008 have resulted in reductions in education spending. The
decline is the result of the national recession and increased state costs for health care, prisons and
pensions, leaving fewer funds for education and other services.
Despite efforts to protect elementary and secondary education in the state budget relative to other
areas, and even with a small increase in funding in the 2014-16 budget, Kentucky schools
continue to deal with fewer resources.
The state ranks 10th worst in the country when it comes to K-12 funding cuts since the
recession started in 2008 with a decline of 12.1 percent per student in inflation-adjusted
terms – according to a report by the Center on Budget and Policy Priorities.
Nationally, according to Education Week’s 2016 Quality Counts report, the state ranks 45th in
the country on the actual spending as a percent of the amount needed to bring all students to the
median per pupil expenditure level in the state.
In actual spending, Kentucky received a failing grade. According to the report, Kentucky’s
adjusted per-pupil expenditure (PPE) is $1,279 less than the national average. Only 13.7
percent of students go to school in a district with the PPE at or above the national average. Nationally, the number is 38.8 percent.
On a more positive note, a recent report from the Gatton College of Business and Economics at
the University of Kentucky points to a high return on investment in Kentucky for per pupil
expenditures using NAEP scores as a comparative metric. Kentucky was one of eight states
that outperformed the rest of the nation academically when obstacles to cost-effective
educational spending are taken into consideration. Those obstacles include poverty, parental
education, missed school days, rural population and high obesity rates.
Local31.20%
State51.10%
Federal17.70%
FY 2015
Local30.80%
State55.40%
Federal13.90%
FY 2009
The State of K-12 Public Education in the Commonwealth of Kentucky 43
Support Education Excellence in Kentucky (SEEK)
Support Education Excellence in Kentucky (SEEK) is the basic state funding formula used to
allocate state dollars to school districts.
The SEEK formula requires a minimum local tax effort for
school districts of 30 cents per $100 of assessed property
valuation. School districts may raise the revenues through
any combination of the property tax, motor vehicle tax and
three optional taxes. Districts may exceed the required
minimum under a two tier system that limits local support.
SEEK sets a guaranteed district allotment for each student,
taking into consideration additional needs for exceptional students, economically-disadvantaged
students, transportation, students who do not speak English, and students served in home and
hospital settings. The base SEEK per pupil allotment varies depending on these unique district
needs. The amount provided by the state also varies depending on districts’ ability to generate
revenue to meet the guaranteed amount. Higher wealth districts receive less per pupil than lower
wealth districts.
The base guarantee per pupil amount is established by the state budget every two years. Districts
are guaranteed this amount, plus adjustments for transportation, at-risk students, students with
disabilities and limited English proficiency, and students who need home and hospital services. It
appears that a SEEK shortfall will occur in the 2015-16 SEEK final calculation, which will
impact districts. The shortfall for all districts combined is expected to be no more than $10
million for FY 16. The primary factor contributing to this shortfall is a higher than projected
Exceptional Child Count.
Districts have been warned to anticipate an approximate reduction of no more than 1 percent in
their district SEEK allocations for this year.
Facilities
As a result of Senate Bill 132 (2010), the Kentucky Department of Education (KDE) conducted
an assessment of 485 public school facilities in Kentucky which included a detailed facility
condition, educational suitability and
technology readiness evaluation.
The report identified deficiencies that included
condition needs, deferred maintenance needs,
educational suitability needs and technology
readiness needs. A total of $3.7 billion of needs
were identified. Current replacement value was
estimated at $7.4 billion.
Districts must levy a 5-cent equivalent tax to
participate in the School Facilities Construction Commission program which provides debt
service for new facilities or major renovations.
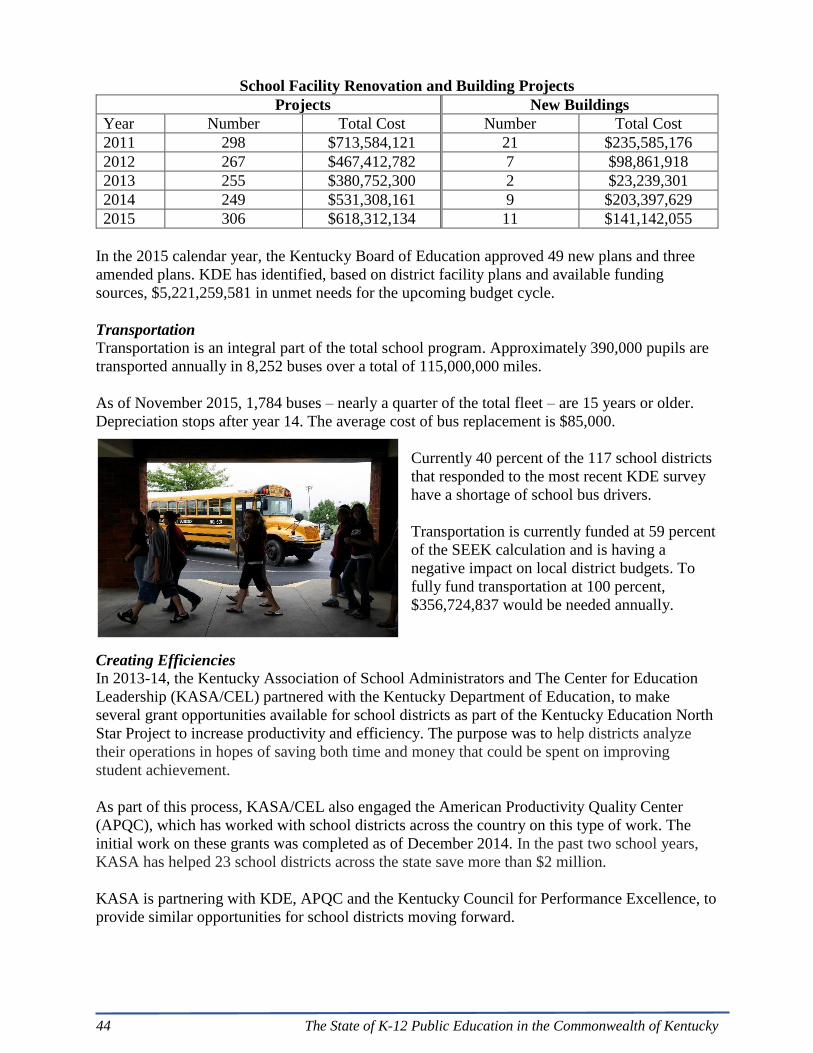
44 The State of K-12 Public Education in the Commonwealth of Kentucky
School Facility Renovation and Building Projects
Projects New Buildings
Year Number Total Cost Number Total Cost
2011 298 $713,584,121 21 $235,585,176
2012 267 $467,412,782 7 $98,861,918
2013 255 $380,752,300 2 $23,239,301
2014 249 $531,308,161 9 $203,397,629
2015 306 $618,312,134 11 $141,142,055
In the 2015 calendar year, the Kentucky Board of Education approved 49 new plans and three
amended plans. KDE has identified, based on district facility plans and available funding
sources, $5,221,259,581 in unmet needs for the upcoming budget cycle.
Transportation
Transportation is an integral part of the total school program. Approximately 390,000 pupils are
transported annually in 8,252 buses over a total of 115,000,000 miles.
As of November 2015, 1,784 buses – nearly a quarter of the total fleet – are 15 years or older.
Depreciation stops after year 14. The average cost of bus replacement is $85,000.
Currently 40 percent of the 117 school districts
that responded to the most recent KDE survey
have a shortage of school bus drivers.
Transportation is currently funded at 59 percent
of the SEEK calculation and is having a
negative impact on local district budgets. To
fully fund transportation at 100 percent,
$356,724,837 would be needed annually.
Creating Efficiencies
In 2013-14, the Kentucky Association of School Administrators and The Center for Education
Leadership (KASA/CEL) partnered with the Kentucky Department of Education, to make
several grant opportunities available for school districts as part of the Kentucky Education North
Star Project to increase productivity and efficiency. The purpose was to help districts analyze
their operations in hopes of saving both time and money that could be spent on improving
student achievement.
As part of this process, KASA/CEL also engaged the American Productivity Quality Center
(APQC), which has worked with school districts across the country on this type of work. The
initial work on these grants was completed as of December 2014. In the past two school years,
KASA has helped 23 school districts across the state save more than $2 million.
KASA is partnering with KDE, APQC and the Kentucky Council for Performance Excellence, to
provide similar opportunities for school districts moving forward.

The State of K-12 Public Education in the Commonwealth of Kentucky 45
State Schools and the Kentucky Department of Education
State Schools
The state runs 53 Area Technology Centers as well as two schools to address the special needs of
visually impaired and deaf learners. The Kentucky Board of Education also serves as the board
for the Kentucky School for the Blind and Kentucky School for the Deaf, and KDE staff serve as
resources for all of the state schools.
Area Technology Centers
The state operates 53 Career and Technical Centers (ATCs) across Kentucky that provide
planned course sequences of high quality academic content and technical skills, and focus on a
specific career and prepare students to successfully transition toward their career goal. The
funding mechanisms are distinctly different for the 53
state-operated ATCs than for the 42 locally operated
Career and Technical Centers and local schools, making
comparisons difficult. The Area Technology Centers are
funded utilizing a combination of federal Perkins money
and state SEEK and General Fund dollars. State
operated ATCs receive no foundational SEEK dollars
but do receive special funding for personnel and a
portion of operating expenses through a separate SEEK
allocation. ATCs apply to the state for these funds and
allocations are made based on the number of fulltime equivalent (FTE) students enrolled in
3-hour (half-day) courses at the center divided into the total state amount available in that year.
(See program information under Career and Technical Education section of this report).
Kentucky School for the Blind
The Kentucky School for the Blind (KSB) provides comprehensive educational services to all
Kentucky students who are blind and visually impaired, birth to 21. In addition to the residential
program located in Louisville, KSB supports local school districts in reducing barriers for
students with visual impairment needs through its outreach program. The outreach program
provides a Low Vision Clinic throughout the state, family support services (including
collaboration with other agencies)
and other programs, including a
summer postsecondary preparation
program on a college campus. In
addition, KSB has consultants in
eight regions which provide
mentoring for new visual
impairment teachers;
workshops and trainings;
assessments;
consultation and technical
assistance; and
visual impairment cadre
meetings.
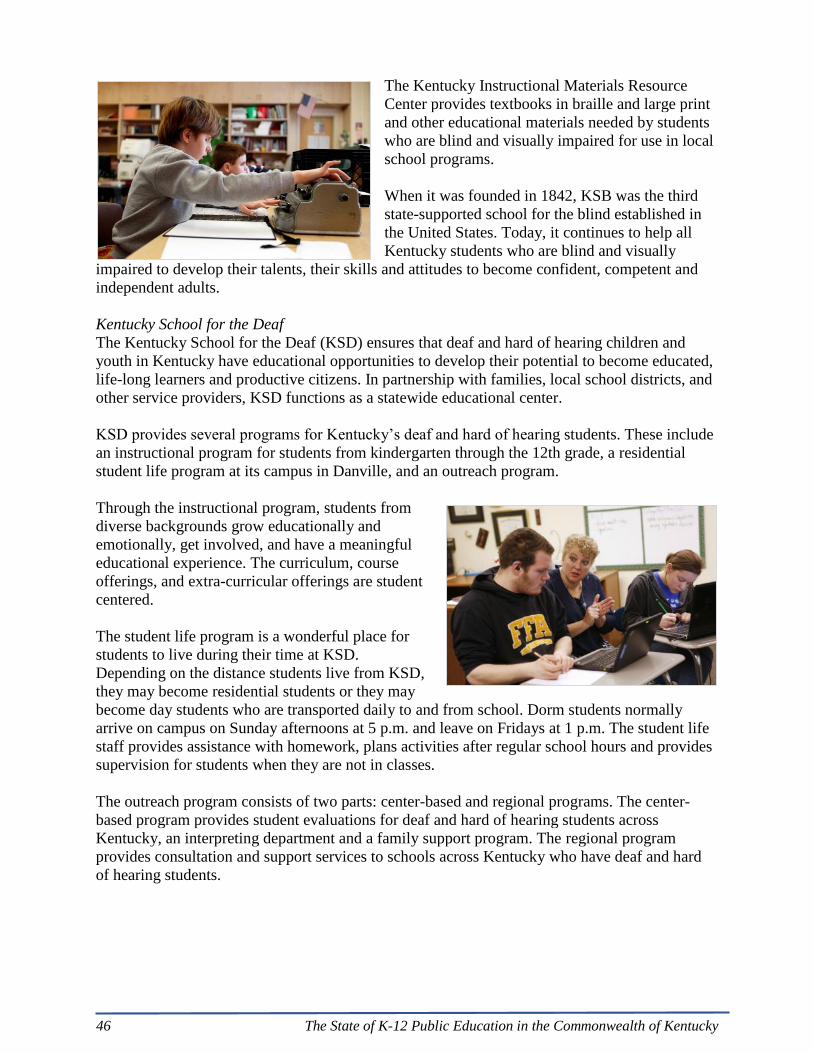
46 The State of K-12 Public Education in the Commonwealth of Kentucky
The Kentucky Instructional Materials Resource
Center provides textbooks in braille and large print
and other educational materials needed by students
who are blind and visually impaired for use in local
school programs.
When it was founded in 1842, KSB was the third
state-supported school for the blind established in
the United States. Today, it continues to help all
Kentucky students who are blind and visually
impaired to develop their talents, their skills and attitudes to become confident, competent and
independent adults.
Kentucky School for the Deaf
The Kentucky School for the Deaf (KSD) ensures that deaf and hard of hearing children and
youth in Kentucky have educational opportunities to develop their potential to become educated,
life-long learners and productive citizens. In partnership with families, local school districts, and
other service providers, KSD functions as a statewide educational center.
KSD provides several programs for Kentucky’s deaf and hard of hearing students. These include
an instructional program for students from kindergarten through the 12th grade, a residential
student life program at its campus in Danville, and an outreach program.
Through the instructional program, students from
diverse backgrounds grow educationally and
emotionally, get involved, and have a meaningful
educational experience. The curriculum, course
offerings, and extra-curricular offerings are student
centered.
The student life program is a wonderful place for
students to live during their time at KSD.
Depending on the distance students live from KSD,
they may become residential students or they may
become day students who are transported daily to and from school. Dorm students normally
arrive on campus on Sunday afternoons at 5 p.m. and leave on Fridays at 1 p.m. The student life
staff provides assistance with homework, plans activities after regular school hours and provides
supervision for students when they are not in classes.
The outreach program consists of two parts: center-based and regional programs. The center-
based program provides student evaluations for deaf and hard of hearing students across
Kentucky, an interpreting department and a family support program. The regional program
provides consultation and support services to schools across Kentucky who have deaf and hard
of hearing students.
The State of K-12 Public Education in the Commonwealth of Kentucky 47
Kentucky Department of Education
The Kentucky Department of Education is a service agency of the
Commonwealth of Kentucky. The department provides resources
and guidance to Kentucky's public schools and districts as they
implement the state's P-12 education requirements. The
department also serves as the state liaison for federal education
requirements and funding opportunities.
The department's major activities include:
• administering the statewide assessment and accountability
system;
• providing technical assistance to schools and districts in the areas
of finance, management and curriculum;
• providing support and information to the Kentucky Board of
Education as it promulgates state education regulations;
• overseeing the state's education technology system; and
• monitoring school and district compliance with state and
federal laws.
The department is organized into seven offices and the Office of the Commissioner. Work is led
by the commissioner and planning committee, which is comprised of an associate commissioner
from each office, the executive director for the Kentucky Board of Education, communications
director, legislative policy advisor and the chief performance officer, who also oversees strategic
planning for the department. The work of the department is integrated and is seldom confined to
just one office.
Excluding the Office of Career and Technical Education, currently the department employs 513
full-time employees (about 13 percent minorities), of which 319 make up the Frankfort-based
full time workforce. This is among the lowest number of employees in nearly two decades and
compares with 837 total and 538 Frankfort-based employees at the end of the year in 1999, when
department employment was at the highest levels in the last 17 years.
The Office of Career and Technical Education employs 608 full time employees (about 2 percent
minorities), which includes Frankfort-based staff as well as those employed in the 53 Area
Technology Centers. Due to factors such as geographic location, demographics and position
requirements, recruitment of minority staffing is difficult, though minority recruitment efforts are
ongoing.
According to the 2016 customer service survey, 92 percent of customer contacts with the
department are handled in a professional manner with the majority of requests coming from
district and school personnel via e-mail.