the state of philippine’s national innovation...
TRANSCRIPT

DRAFT FOR DISCUSSION – DO NOT CITE
The State of Philippine’s National Innovation System
Edita A. TanEmail: [email protected]
April, 2010
Abbreviations and Acronyms
1. CHED – Commission on Higher Education
2. DOST – Department of Science and Technology
3. HE – Higher Education
4. HEI – Higher Education Institutions
5. SME – Small and Medium Size Firms
6. SUC – State Universities and Colleges
7. UPCE – University of the Philippines College of Engineering
8. UPCS – University of the Philippines College of Science

List of Tables
Table 1. Share of firm rating constraints to operation
Table 2. American Chamber of Commerce view on Business environment
Table 3: Trend in Philippine Rankings in Global Competitiveness Factors 2003-2007
Table 4. WEF's Global Competitiveness Rankings (by Factor) of Selected Countries, 2007
Table 5. Average Growth Rates and Share in the Output of Major Industrial Sector 1986-2007
Table 6. Number and Distribution of Establishments, Total Employment in Micro, SME and large Enterprises, 2003
Table 7. Employment, Value added per worker of Share in output in Manufacturing of SME and Large Establishments, 1994, 2003
Table 8. National Budget Appropriation to Education and Department of Science and Technology, 2008
Table 9: Distribution of High School Graduates, Aged 17-25 Enrolled in Tertiary Education by School Type by Income Decile, 1998
Table 10. Higher Education Graduates by Discipline Group, Program level and Degree: 2003/04
Table 11. Numbers of Graduates by Discipline Group
Table 12 Number of Centers of Excellence and Centers of Development
Table 13. Enrollment and Graduates in Centers of Excellence, By Category
Table 14: Centers of Excellence in Top 5 Universities
Table 15: University of the Philippines College of Science Enrollment and Graduates by Field by Degree, 2005-2006 to 2008-2009
Table 16. Faculty Profile and Research Output of UP College of Science, 2008
Table 17. University of the Philippines College of Engineering Enrollment and Graduates by Field by Degree, 2005-2006 to 2008-2009
Table 18. Faculty Profile and Students/Teachers Ratio, College of Engineering and College of Science, 2009
Table 19: R&D Personnel, 2002, 2003, 2005
Table 20. Number and Amount of R&D Projects Implemented by DOST Agencies by Funding Source 2008

Table 21: Intellectual Property Rights Granted by Type, 2000-2007
Table 22: DOST Scholars Enrolled and Graduated, 2006-2008
Table 23. Manufacturing Companies with R&D
Table 24. Manufacturing Sectors with R&D, NSO

1. The paper assesses the innovation system that the Philippine has developed and discusses the recent discourses and plans for reforming and strengthening it. A country’s innovation
system consists of its high quality universities and research institutes and their staff of highly skilled scientists and engineers who undertake basic and applied research (R&D) and provide graduate studies in Science and Technology/Engineering (S&T). The system also includes the research capabilities and activities in private companies. There is a growing awareness on the
part of the executive and legislative heads of the government and business and academic leaders that the country’s innovation system is very weak and seriously lags behind what all its
high performing neighbors have created. They realize that this weakness partly explains the relatively poor performance of the economy, especially its agriculture and manufacturing
sectors. The government badly neglected to support the development of the NIS. At the same time, the poor performance of the economy did not stimulate its growth. There was both weak
supply push and demand pull to NIS development. The country rates very poorly in global competitiveness which has inhibited its ability to benefit from globalization and the rapidly
expanding world trade and capital flows, and to access the large and growing stock of knowledge and technology. The paper reviews the policies and market conditions that haveimpacted the supply and demand sides of the NIS. If the country’s innovation system fails to
catch up with the advanced and industrializing economies, it will continue to fall on the negative side of the world’s technological divide. There are now serious moves to improve the organization of the innovation system and increase government support for S&T manpower,
research and infrastructure development. The Department of Science and Technology (DOST)has organized working groups to identify priority fields in science and engineering. The Congress created in late 2007 the Commission on Science, Technology and Engineering
(COMSTE) to study the state of the innovation system and recommend strategies for S&T capabilities to assist priority economic sectors, e.g. energy. The commission is composed of
officials from the DOST and the Commission on Higher Education (CHED), S&T faculty from top universities and industry leaders. Working together with DOST, COMSTE organized teams of experts to assess the capability of academic and research institutions for producing highly skilled scientists and engineers and undertaking R&D, identify their weaknesses, assess the
performance of key industries that they believe to have good market prospects and large social impact which the innovation system is to serve, and make recommendations for its reform and
development. COMSTE decided to address the following sectors - energy, IT and IT enabled services or IT-ITES, semi-conductor and electronics, food and agriculture, health. It takes
science, mathematics and engineering education as a separate priority area to be studied and supported. Complementing COMSTE’s work, The DOST has organized a team of leaders from
the academe and business to develop plans for engineering research and development for technology referred to by the acronym ERDT. They partly overlap the priority sectors that
COMSTE addresses.

2. In its inquiry into the state of the NIS, this study finds both encouraging and discouraging conditions. At this point, the evidence shows a rather dismal state of the NIS. Minimal government resources have been allocated for research, less than .15% of GDP so that few highly skilled S&T personnel have been employed in R&D. There exists no single strong S&T research institute. The numerous universities and colleges numbering more than 1,400 produce mainly first degree graduates in business, teacher training and social science fields. Those that offer S&T fields of specialization produce mostly first degree graduates. They graduate very small numbers with masters and Ph.d. degree in S&T. In 2004, less than 1000graduated with masters degree and 30 with Ph.d. degree. The quality of instruction at all levels including higher education is on average poor. On the other hand, there is a small group of good universities that could be readily strengthened and expanded to be the foundation of a strong NIS. The government has recently provided financial support for scholarship, researchand investment in buildings and laboratories for this group of institutions. However, the grant is for a limited period of five to ten years. Sustained support of a much larger scale would be required to create a strong NIS. DOST, CHED and COMSTE have to draw a long termoperational plan for NIS development which would be the basis for adequate and sustained budgetary allocation.
3. Rosenberg, Laudau and Mowery in their pioneering volume on technology has this to say in their introductory statement: “Productivity growth is indispensable to growth in national income and wealth”. (p.1 1992). Significant Productivity increases are achievedthrough technological change when the production function shifts upward. But there could be significant increases in productivity from economies of scale given existing technologies. The most efficient technology for a small scale operation is likely to be very labor intensive, using low low-skilled labor and low technology capital. For very large scale operation, the technique involves the use of state of art capital equipment and machinery, high quality materials and highly skilled labor. The kind of technology used by firms depends on the scale of production. Small scale enterprises will tend to be less productive because they use low level technologies, e.g. single seamstree. This notion is used to explain the low productivity of many sectors of the economy that are still dominated by small firms.
4. New technologies are developed in various places in the world, in universities and research institutes and in business firms. They are not evenly applied by all the world’s producers since not all the peoples have equal access to extant knowledge and technologies. These are mainly stocked in the advanced economies where most of the knowledge and technologies were created and used. Countries outside them must develop their NIS to allow their citizens and firms to access this stock of knowledge and make their own contribution for its growth. In practical terms, a country’s citizens must have the capability to acquire available knowledge and apply them to production, i.e, innovate to increase productivity or to produce

new products. But not all knowledge and technologies are open to all. Nelson (1992) classifies knowledge into generic and tacit – generic knowledge is public in nature and is available in scientific and professional journals, books and other media, now the internet. In theory, it is available to all. There is tacit knowledge in the technologies that firms have developed on their own and which for a time they enjoy monopoly application. They may enjoy abnormal profits from the monopoly for some time but usually not forever. Nelson argues that the innovator has the advantage of being first but the monopoly tends loosen since the technology could be learned and reproduced by other firms through research and other means. The scientific content of a technology is generic or public and its application can be learned and copied in various ways through R&D including through the more obvious reverse engineering tactic.Firms must therefore have the scientific knowledge content of particular technologies to be able to replicate and improve on it. All the Asian tigers developed their S&T capabilities for innovation as an important part of their over-all industrialization policies. (Rosenberg, Landau and Mowery 1992, Lall and Urata 2003)
5. Technological change does not take place in a vacuum. A firm decides to develop a new technology or buy one for a defined objective – to increase profits, to increase or preserve market share, to assume market dominance, etc. The desired innovation generally entailsinvestment. Boskin and Lau (1992) argued that that technology is embodied in capital and from their econometric study showed significant positive relation between technological change and investment. The stimulus for undertaking technical change depends on the expected rate of return to the technology and in the investment in which it is embodied. The economic environment must be conducive to undertaking technical change and investment. What stimulates or constraints investment works in the same way on innovation. More recent analysis of growth does not simply take investment and other factors or production as determining growth but examines why they are at the observed levels. Hausman, Rodrik and Velasco (2005) introduced the diagnostic approach to the analysis of economic development, explaining why countries succeed or fail to achieve high sustained growth. The Asian Development Bank undertook diagnostic studies of several Asian countries including the Philippines (ADB, 2009). The new approach inquires into constraints on private investment and entrepreneurship. Constraints may come in the form of corruption, defects in the rule of law on property rights and their implementation, undeveloped financial system, poor infrastructureand shortage of skilled labor. The absence of an innovation system is one of the constraints on productivity and competitiveness. The NIS provides firms channels for accessing extant knowledge and technologies and assists them in their application. It also helps them undertake R&D for improving their technology or creating new ones. Following Magpantay (1998), the NIS may act as a supply stimulus for business innovation or demand pull by entrepreneur. Constraints on investment would mean constraints on innovation.
6. The paper reviews the diagnostic study on the Philippines in the volume edited by Canlas, Khan and Zhuang( ADB 2009) which looked at various aspects of the economic environment that have impeded private investment and growth. The various authors of the volume addressed critical constraints on growth such as macro instability, political instability, quality of governance, infrastructure, energy cost and education. Unfortunately it has no separate chapter on the innovation system and neglected to address the population problem. One may conclude from the diagnostic analysis that bad governance has been the most serious obstacle to private investment, hence innovation. Corruption and defective fiscal management decreased government resources for investment in infrastructure and human capital and raised the cost and risk of doing business. These discouraged both private domestic and foreign direct investment and innovation. Moreover, the government neglected to develop the NIS that could have encouraged the more dynamic firms to innovate and enhance their productivity. We find evidence of weakness in both supply-led and demand pull innovation forces. There are dynamic sectors such as the semic-conductor and electronics industry that could have directlybenefited from a stronger NIS.

7. The following paradigm traces the interaction of NIS to innovation, investment and growth.
Block A are the constraints or stimuli to investment and innovation. It contains macro stability, political stability, quality of labor and labor policy, quality of governance (institutions, laws and enforcement), financial system, trade and industrial policy, infrastructure (transport, water system, energy supply and telecommunications). Block B is the NIS comprising of research and academic institutions that undertake R&D and provide advanced instruction in the professions and in S&T plus firms that undertake their own R&D and contribute to the stock of knowledge and technology. Block C shows NIS output. Block D has the country’s enterprises as they are impacted by conditions in Block A and Block B. Business decisions on investment and innovations are made in response to conditions determined in Block A and Block B. The conditions may be favorable or unfavorable. Favorable conditions stimulate business investment and innovation which in turn create demand for NIS services, employment opportunities for S&T workers, and demand for advanced S&T education. We see a virtuous circle of favorable economic environment, effective NIS, investment and innovation by economic units and enrichment of NIS.
A Economic Environment1. Political Stability2. Rule of Law & its
Implementation3. Macro-stability
Fiscal, Monetary, Industrial, Trade & Labor Policies
4. Government Investment in Infrastructure, Energy, NIS
5. Educational Institution and Supply Skills
6. Financial System
C. Business Enterprises1. Investment2. Innovation3. Economic Performances4. Tax Payment5. Social Contribution
E. Foreign Direct Investment
B. NISResearch Universities and
Research InstitutesAnd their Faculty & Scientists
Business Enterprisesand their R&D Laboratories and
S&T staff
D. NIS OutputHighly skilled S&T LaborBasic ResearchApplied Research and New Technologies
Supply led
Demand Pull

8. The diagnostics on the Philippines did not consider the supply of skilled manpower as a major constraint on development for there was an abundance of a highly literate population and labor with professional and sub-professional skills that could fill the kinds of labor demanded. In fact there has been high unemployment of double-digit rate among college and high school educated since the mid 1980s. An extensive market-oriented educational system has enrolled relatively large proportions of the youth at all levels, primary, secondary and tertiary and produced an excess supply of middle skilled labor. Moreover, Filipino workers have been well regarded by their trainability and non-cognitive skills. Cunha and Heckman recognize non-cognitive skills to be of critical value in the market place and in the acquisition of human capital.(2007) But the stock and university output of high level skills, i.e. those with graduate degrees in high quality higher education institutions (HEI) is small. This slack has impeded innovation in the manufacturing sector and in the IT and ITES sector, one of the few dynamic sectors in the country.
9. The paper draws attention to the rising importance of the semi-conductor and electronics and the business process outsourcing (BPO) industries which can directly benefit from an upgrading of the NIS. These two industries are the leading export sectors contributing about 70% of export earnings in recent years. They have survived the ongoing recession in their major national clients, the US and Japan, and project accelerated growth in the coming years. They are mainly engaged in low skill processes such as assembly and testing in the electronics industry and contact centers in the BPO industry. They face increasing competitive pressurefrom neighboring economies such as China and Vietnam who could as readily supply low-cost, low skilled labor as the Philippines. The IT and IT-enabled industries must move on to higher skilled processes and outputs if they are to maintain their competitive edge against other host countries. They face a shortage of highly skilled workers and obtain little technical support from academic institutions. Only about 15% of BPO income comes from high-tech services such as engineering design, software and financial analysis. Some entrepreneurs in the two industries say that they are supply constrained for there is a dearth of ICT workers. The higher education (HE) system has meager capacity for producing graduates with advanced degree in S&T fields.
10. A purposive survey of manufacturing firms was undertaken to gain some insights into the innovation capability and activities of Philippine enterprises. Seventeen large firms that belonged to the country’s top 5000 corporations were surveyed. Unfortunately, we obtained a very low response rate, 8/17. Only one firm stated it is constrained by supply of highly skilled manpower, none was constrained by financial sources. Except for one relatively small firms, all the sampled firms undertook innovations, mostly in new products and improvement in product lines. Interviews with S&T and education authorities and the COMSTE team were undertaken to get their views on the ongoing programs for the NIS development..
11. The paper is organized as follows: Section 2 reviews recent studies on economic growth particularly the newly released Asian Development Bank volume edited by Canlas, Khan and Zhuang (ADB 2009) which looked closely at major constraints on the country’s investment and growth. The chapters by Lim show that poor quality of governance was the main impediment to the country’s economic growth. Section 3 gives a brief history of economicpolicies that explains the evolution and persistence of the constraints. Section 4 presents results from various surveys regarding business view on the quality of economic environment particularly corruption. Section 5 analyzes the industrial structure that has evolved. Small scale enterprises have continued to dominate in the manufacturing and service sectors. Apparently they undertake little innovations and have low productivity. Section 6 inquires into the emergence of the IT and IT-enabled industries which have become important employers and the largest export earners. The later sections from 7 to 11 are assessments of aspects of the innovation system – the educational system, research budget and activities, quality of higher education. Section 12 discusses the results of the survey of firms’ innovation. Section 13 views of industries and professional associations on quality of HEI. Section 14 looks into the COMSTE and technology plans. Section 15 discusses the conclusion. The last sections deal with new programs for strengthening the NIS, particularly those of DOST and COMSTE. We find theirplans lack coherence and strategies. They have no long-term targets and budget. The paper suggests that CHED, DOST and COMSTE jointly draw a long term integrated operational plan for a ten year NIS development. The country cannot afford to postpone reforms. COMSTEproposed several bills addressed to specific reform measures. The bills need to be integrated into one that provides for massive and long term financial support for scholarship, research and institutional development. These three bodies must collaborate closely in writing a single billfor NIS development, not the separate bills that COMSTE has drafted.
2. Economic Environment
12. Several surveys of firms found the country’s economic environment to be poor and not conducive to investment. They complain of macro instability, political instability, poor governance, poor infrastructure and high energy cost and see these as major constraints on their investment and competitiveness. These problems are traceable to a range of bad policies that were adopted in the 1950s to the mid 1980s. The policies did not just distort prices and intervened in resource allocation but they also led to the evolution of weak institutions, poor governance and poor physical infrastructure and neglect of the NIS. The policies have had a lasting impact on the macro economic environment despite the structural reforms that were undertaken in the 1986-1998 period. The highly repressive credit and financial policies in the 1950s to the 1980s obstructed efficient investment by the government and the private sectorand held up financial development. The highly protective trade regime promoted inward looking industries and weak entrepreneurship. The selective credit and foreign currency

allocation, among other forms of incentives created a culture of dependence on government favor and opportunities for corruption. These weakened the quality of leadership in business as well as in the bureaucracy. Fairly comprehensive structural reforms were undertaken but in staggered manner during the administration of Aquino and Ramos from 1986 to 1998. The economy could not benefit from a fully liberalized environment until the new century. Political instability arose from dissatisfaction with the quality of governance so that until now, there is still uncertainty about a peaceful transition from the coming election (May 10,2010). Business complains that the executive department has continued to intervene intermittently in specific sectors through executive ad hoc executive orders. Such interventions lead to macro instability.
13. Through the whole post WWII period, the Philippine economy’s performance has been poor especially in comparison with all its East Asian neighbors which have experienced what the World Bank would call miracle (1994). The trend in key indicators such as GDP and GDP per capita growth rate, investment rate, poverty incidence and Gini ratio is shown in Table 1. Low saving and investment rates and high population rates are major macro level explanations. But why the low saving and investment rates? Following the diagnostic approach suggested by Huasman, Rodric and Velasco (2003), Lim (ADB2009) traces the reasons for the low saving and investment rates. Weak governance and low tax effort negatively impacted government investment in infrastructure and human capital. Political instability raises business risk, making entrepreneurs more cautious in undertaking new ventures and investments, and innovations. Poor governance raises the cost of doing business in many ways. Machinated procedures aimed at extracting bribes lead to delays in processing licenses and other business papers, supply deliveries, imports and exports procedures and deliveries. A critical problem is poor infrastructure particularly in the transport system and power supply. Transport and electricity costs in the Philippines are higher than in most of its neighbors.
14. Government investment in infrastructure has been seriously constrained by budgetconstraints and corruption. The tax effort ( tax revenue to GNP ratio) has not reached 20%, the level of most of its high performing neighbors. Tax effort averaged 12% in the Aquino administration, it rose to 17% during Ramos time but has since declined back to 12%. The Aquino administration began when the economy was in deep recession and could not therefore collect much tax revenue. Moreover, it inherited a very large foreign debt accumulated during the Marcos regime and more than 300 unprofitable government corporations. Debt service and support of the losing corporations absorbed more than 50% of the already tight budget. The Brady plan helped the government lessen the debt burden and ODA refinanced the debt. Debt service gradually declined. The gains made during the Ramos administration was whittled down by the succeeding presidents, Estrada from 1999 to 2001, Arroyo from 2002 to the present. Lim (ADB 2009) argues that corruption has weakened tax collection even with the legislation of the value added tax. At the same time, the share of infrastructure and education
in the declining budget declined. ODA and private investors via BOT (build-operate and turnover) basis became the main source of financing large infrastructure projects. They partly offset the decline in government investments. MetroManila’s new highways and rail are private enterprises. The relatively low investment in infrastructure was further diminished by alleged corruption in its construction. Low budget and inefficient allocation likewise assailedinvestment in human capital. Education absorbed 30% of the national budget in the early 1960 it is down to 20%.
15. Poor infrastructure directly raises production and distribution costs and segmentsthe market for inputs and outputs. Additionally, corruption and uncertain enforcement of laws increase the cost of doing business and raise business risk. These mean lower rate of return to investment. At the same time they create dissatisfaction with the government and cause political instability. Both domestic and foreign investments are discouraged. Canlas, Vhan and Zhuang (ADB, 2009) showed that each episode of political upheaval was accompanied by recession. The results of recent surveys of firms regarding their views on the economic environment are discussed in Section 4 below. Majority of the sampled companies found poor governance and poor infrastructure to be serious problems in doing business in the country.The diagnostics did not address the effect of high population rate and slow growth on the saving rate. Possibly too, Filipinos are not as frugal as its neighbors.
3. History of Repression
16. The Philippine economy was subjected to highly repressive trade/industry and monetary policies during the first three decades of its development history starting in 1950. Until 1960 the exchange rate was pegged at the unreasonably overvalued P2/$1 level which was originally set by the US colonial government in 1900. It was untenable considering thehyper inflation that had occurred through the years, especially during WWII. The government had to control the outflow of foreign currency by selective import control. Import substitute industries were promoted largely through favorable dollar allocation for capital and material imports. The central bank that was established in 1947 was a development monetary authorityresponsible for promoting economic growth and employment. It was also tasked to maintain price and currency stability. To stimulate investment, it imposed below market interest rate ceilings on deposits and loans and provided subsidized credit to selected sectors and borrowers. During the authoritarian government of President Marcos, the central bank became an important source of credit for his and his crony businesses. Central Bank funds from money creation and foreign debts were channeled through government financial institutions or GFIs to favored borrowers. There were other interventions including forced acquisition of business and property by the Marcos family such as the Manila Electric Company and the

monopolization of sugar coconut milling and trading. The Marcos reign lasted two decades until it was toppled by the people power revolution in February, 1986.
17. Many studies analyzed the great damage the repressive policies had wrought the economy. Moreover, they developed non-competitive values, lowered the moral bar for corruption and encouraged dependence on government dole-out among entrepreneurs and state educational institutions. The import substitution policy inculcated domestic market orientation and weak entrepreneurship. Political instability has assailed the nation over the last four decades from the time President Marcos established an authoritarian regime in 1972 to the present. Resistance to his massive financial abuses and human rights violation that culminated in the assassination of Benigno Aquino in 1983 led to his ouster in February 1986. The massive foreign borrowing had to be serviced but the economy’s inability to meet the obligation resulted in a foreign exchange crisis. This and political instability led to a deep recession in 1984 to 1985 when GDP fell by a total of 15%. The Aquino government inherited a much damaged economy with unemployment doubling to 11% from an average rate of about 5-6% in previous decades, large foreign and domestic debt and several large bankrupt financialinstitutions, particularly the GFI’s: the Philippine National Bank, the Development Bank of the Philippines and the Government Service Insurance System. These were then the largestfinancial institutions in the country. All succeeding presidents experienced political challenges. Aquino (1986-1992) suffered coup attempts, the most serious in 1989 which was followed by the Pinatubo volcanic eruption and strong earthquake in the North. President Ramos revived the economy and implemented major reforms in fiscal, exchange and monetary policy. (1992-1998) The Asian financial crisis spread to the Philippines. President Estrada was ousted by People Power 2 in December 2001 following his impeachment for massive corruption. The current President Macapagal Arroyo was nearly driven out of office for alleged election fraudand corruption in 2008. Currently, there are concerns about possible failure of election when the electronic voting system is implemented for the first time. Not enough lead time has beenallotted for verifying the accuracy of the program and machines. An election failure would likely provoke mass revolt. Excepting for the 1997-1998 Asian financial crisis, all the recessions in the past 3 decades occurred as a result of major political disturbances: the toppling of the Marcos regime in 1986, the coup attempts against President Aquino in 1989 that was followed by the Pinatubo volcanic eruption and strong earthquake, the ouster of President Estrada in 2001, and the near ouster of President Arroyo in 2008.
18.The Aquino and Ramos governments during the 1986 to 1998 period undertook structural reforms that removed most of the repressive rules including those on interest rates, exchange rates, credit allocation, trade and the capital market. One of the first acts of the Aquino administration was to abolish all preferential credits that the Central Bank provided to government financial institutions, rural banks and private development banks. This policy
stopped indiscriminate expansion of credit, reduced bad lending and stimulated financial intermediation. Many government corporations were privatized. President Ramos continued the reforms. The Central Bank law was amended in 1993 to remove its development orientation and limit its responsibility to maintaining price and economic stability. Tariff rates were unified at much lower levels and virtually all non-tariff barriers were abolished. The capital market was liberalized with most foreign exchange restrictions abolished. The latter measure, however, had caused exuberant short term capital flows and greater volatility in credit, interest rate and exchange rate following the Asian Financial crisis. President Ramos fostered positive outlook for business and improved tax collection which raised the tax effortrate from 12% to 17%. The Estrada administration lasted about three years. It was wracked by scandals and corruption that led to his impeachment and toppling in December 2001. He was forced to resign when majority of his cabinet and the military abandoned him. His Vice President, Gloria Macapagal Arroyo took over. She was reelected in 2004 and has remained in power until now. There will be an election on May 11,2010. Corruption is alleged to have intensified during her administration. While she did not reverse any of the liberalization measures that the Aquino and Ramos presidency adopted, she has not instituted any major policy reforms. The decline in the tax effort has resulted in rising deficit levels. She had the Congress enact a value added tax of 10% applicable to selected products and services. In 2008, the VA tax was raised to 12% with fewer exceptions. However, the tax effort has remained low at about 12%. Lim (ADB 2009) showed that the growing deficits have led to rising debt service that further crowded out government investment in physical and human capital. In the meantime, population growth remains high at over 2.0% and raises demand for social services and basic infrastructure.
19. The rapid development of the telecommunications industry in this millennium is a major positive break in the economy. This development has stimulated innovations in the financial sector and provided the key infrastructure for the business processes outsourcing (BPO) and semi-conductor and electronics sectors. The relative importance of the communications sector in GDP rose from 1.2% in 1995 to 3.7% in2007, and finance from 4.2% to 5.4% for the same years. The liberalization of the capital market and the abandonment of financial repression in the banking system fostered competition for funds and financial investments. The banks and other financial intermediaries had to innovate to be able to compete well in the liberalized and globalized capital market. They have computerized their accounting, credit processing, financial analysis and transmission of transactions across cities and municipalities and globally. Migrant workers’ remittances are now coursed through modern ICT system. The semi-conductor and electronics and BPO are direct users of the telecommunications infrastructures. They have been granted tax incentives and favorable treatment by the government. The advances in telecommunications have favored tourism also.

20. Despite the structural reforms undertaken during the Aquino and Ramos administration, business continues to complain of macroeconomic instability as an important constraint on their performance. Apparently, the national government continues to impose new rules or give new incentives in ad hoc manner in response to untoward events. A company cites the example of an ad hoc oil price cap during the Ondoy flood in 2009 and the removal of tariff on wheat feed imports because of reported inflation in flour. The oil industry experienced a surprised price cap while corn producers faced a sudden price drop in wheat feeds. Sometimes ad hoc policies are traced to vested interest or corruption.
4. Business View of the Economic Environment
21 . We present the views of business regarding the quality of economic environment from three recent surveys of firms and the country’s ranking in the World Economic Forum competitive index. The Makati Business Club1 undertook a survey of 72 of its 700 membercompanies in 2007 to see their experience and view on each of 17 macro environmentproblems such as macroeconomic instability, political instability, corruption, poor or uncertain enforcement of laws, quality of infrastructure, electricity cost, tax rates and supply of skilledlabor. (Table 1) Macroeconomic instability affected the highest number of firms, 40%. Corruption, high electricity price and high tax rates were complained by about 1/3 of the sample while economic policy uncertainty, crime rate, tax administration and labor legislation were suffered by about 25% and poor transport by 20%. Only about 12% of the firms found problems with the skill and education of workers. Fewer firms experienced problems with finance and communications. Note that the financial sector adopted IT technology quite fast and achieved fairly rapid growth in the last decade. The telecommunications industry also underwent rapid development since the mid 1990s.
22. Table 2 shows the results of surveys of members of the American Chamber of Commerce Philippines which were asked to identify sources of strength and of weaknesses of the country’s economic environment. Of the sources of strength, 71% of the sample identified supply of skilled labor, 65%, availability of trained personnel, 63%, low housing cost, and 57%,low office lease. On the negative features, corruption was cited by 77%, laws and regulations by 52%, and poor infrastructure by 50%. Problems with tax structure, local protectionism and supply of raw materials were cited by 45%, 39% and 35%, respectively. The table shows changes in perceptions from 2004 to 2006. Excepting for problems relating to quality of
1
Makati city is the most modern city of Metro Manila and hosts the financial center and high-end entertainment and hospitality industries. Many executives of
the country’s leading businesses live in the gated mansions of the city and are leading members of the club. They hold forums not only on business matters but social and political issues. Some of its leaders head NGOs like the National Forum for Clean Election or NAMFREL which mobilized students and other groups to prevent or minimize election frauds. It has acquired a respected social advocacy identity.
governance and supply of raw materials, the percentage complaining of each of the problems declined. For instance, 91% of the 2004 sample complained of corruption as compared to 77% in 2006. There was also a substantial decline in the percentage complaining of poor infrastructure from 69% to 50%. Nevertheless, this is still a rather high percentage.
23. Mahar Mangahas, head of the Social Weather Station, a leading poll body, reported in the Philippine Daily Inquirer (2/20/2010) on its 2009 survey of business regarding corruption. (sample size of 500) There was some improvement in the economic environment. The percentage of managers whose companies were solicited for bribes by government officials dropped from 70% in 2008 to 61% in 2009, albeit still high. The sample found improved transparency in the bidding of government projects and in access to information. Half of the sample found getting business permits to be easier than before. Doing business in the province is less bothersome.
24.The Global Competitiveness Report (GCR) gauges countries’ global competitiveness in two sets of criteria – a) basic requirements for efficient production such as quality of institutions, quality of human resources, infrastructure and macro stability, and b) efficiency enhancement conditions of the market such as quality and relevance of higher education and technological readiness. Table 3 gives the Philippine rank in each criterion for several years, 2003 to 2007. In 2007, its overall rank among 134 countries was 71. The poorest ranking are in basic requirements at 93 based on poor ranking in institutions at 95, infrastructure at 94 and health and primary education at 85. The average rank for efficiency enhancement is better than for basic requirements, 60. It is pulled up (worsened) by labor market efficiency with rank of 100 and technological readiness and other innovation criteria. The overall rank slightly improved from 74 in 2003 to 71 in 2007 but there was a worsening in basic requirements particularly relating to institutions from 75 in 2004 to 95 in 2007, likewise in infrastructure from 87 to 94. The next table (4) gives the comparative ranking of Asian countries. Singapore has the lowest rank (best) at 7th and the Philippines the lowest at 71st,, worse than Indonesia at 54. The country has far worse ranking in every criterion excepting macro instability and health and education where India rates the lowest. Note that the country has far worse ranking than India, its main competitor in IT and IT-enabled service, in technological readiness, business sophistication and innovation.
5. Structure of the Economy
25. A problematic economic environment would tend to impact different sectors differently. Low saving rate would inhibit capital intensive sectors more than labor intensive ones. Heavy industries such as machinery, metal and chemical manufacture and mining are more capital intensive than light industries such as food and beverage manufacture. Services are more labor intensive than industries as a whole. In any industry, economies of scale

generally results in adopting higher technology and larger capital inputs. Small firms in an industry would therefore tend to be more labor intensive and less productive. Poor infrastructure would segment markets geographically and favor small scale producers that cater to their market segments located in small cities and municipalities. They tend to have less access to modern financial institutions and telecommunications system and technological knowledge. But they may bear smaller cost of doing business arising from corruption and bureaucratic impositions. Mangahas (PDI,2/20/10) found that there is less corruption in provincial areas than in Metro Manila so that the small businesses in these areas bear lower cost of doing business. A closer relation between business and government is more easily fostered in small urban centers and rural areas than in mega cities like Metro Manila. (It has 11 Million population.) Here businessmen have to deal with strangers in government. In smaller cities and municipalities, local leaders have direct interest in the development of local businesses and the output and employment they create. They can more readily help settle labor disputes and establish communications network between different stakeholders such as business, educational institutions and labor leaders. In fact several MNCs including those in the BPO industry are expanding their operation in provincial cities such as Cebu, Davao, Baguio and Iloilo. Tourism is developing faster in some of these provincial cities than in Metro Manila.
26. The economic environment has sustained an underdeveloped industrial structure which is dualistic and dominated by small, labor intensive firms in light industries and services. The economy did not follow the common sectoral transformation experienced by most developed economies where industrialization matured before the rise of the service sector to a dominant position. In the Philippines, the service sector assumed dominance when industry stagnated. At the same time, small enterprises have remained. Over the post-Marcos period,1986 to 2007, the industrial sector grew at the average annual rate of only 4.22%, agriculture,3.0% and services,5.6%. (Table 5) To be noted is the rather slow growth of the manufacturing sector at 4.1%, usually the most dynamic sector during the industrialization process. Over the same period, agriculture’s share in GDP slowly declined from 23.6% to 19.4%, industry from 35.2% t 33.2% but services rose 41.4% to 47.2%. The share of manufacturing even fell from 25.2% to 24.1%. Moreover, manufacturing output has been concentrated in light industries such as food processing, beverages and tobacco and textile/apparel. They contributed 57.7% to GDP 2007. The share of heavy industrial products consisting of metal and chemical products and electrical and non-electrical machinery was 37.7%. Noted is the 9.3% share of electrical machinery which includes electronics and semi-conductor industries. The share of non-electrical machinery was only 1.2%. The medium heavy industries that include wood products, furniture and fixtures, publishing and printing and leather goods had a small share of only 4.7%. It rose to 2.6%.
27. The manufacturing and service sectors have dualistic structure. They have both modern, large scale and more capital investment component and informal or small unregulated component of independent family firms. Minimal innovations likely take place in the informal segment. The low income earned from small enterprises does not allow for big capital investment and it is not efficient for them to do so. Transport has a clearly dualistic structure. Air transport service firms and the Metro Manila light rail transport system are large scale, capital intensive and use advanced technology. Land transport on the other hand, contains alarge group of the ubiquitous jeepneys and passenger-converted motorcycles and bicycles.They use very low technology and are labor intensive. The hospitality sector includes first class hotels and restaurants and food peddlers and traditional restaurants and food stalls. Retail trade boasts of the ultra modern Ayala Center and the Mall of Asia and innumerable small shops and hawkers. Small firms tend to be labor intensive, they serve particular market segments, are internally or informally financed and not as accessible to government services. Banks are discouraged from lending to them because small loans tend to have higher transactions cost and the borrowers usually have no acceptable collateral. Small firms employ low skilled labor including unpaid family members. The firms can survive as small firms in a poor economic environment. Not much innovation is to be expected of these firms.
28. Table 6 gives the distribution of enterprises by size defined by employment and asset levels. We take the classification by employment level: micro for less than 20, small for 20-99, medium for 100 to 200, and large for over 200. There were 839,014 enterprises in 2003 of which 90.9% were micro enterprises, 8.9% small and medium sized or SME and .4% large. The micro enterprises were concentrated in wholesale and retail trade and manufacturing whose respective shares were 53% and 15%. The larger firms contributed disproportionatelymore to the total manufacturing employment,34.3% and so with the SME, 31.5. Labor productivity, measured by value added per employed worker. Expectedly, labor productivity rises as firm size increases. Large firms have double the productivity of the small and medium sized (SME) firms . Labor productivity and the differential between large and SM vary widely across the 3-digit manufacturing sectors. (Table 7). Labor productivity ranged from P24,000 to to P302,000 in 2003. For large firms, machinery, metals, petroleum, cement chemical industries had higher productivity than food processing and food manufacture, wearing apparel and leather goods.
29. The large scale labor migration is another outcome of the failure of the economy to create sufficient and satisfying employment. The outgoing workers are of varied skill categories ranging from professionals to housemaids. There has been a fairly large number of engineers migrating permanently for North America. The Semiconductor and Electronics Industry of the Philippines (SEIPI) stated in an interview that their members experience rapid turnover with pirating of good workers across firms in the country and abroad. Migration has exacerbated

the shortage of highly skilled workers. Migrants like the BPO workers face similar future challenges. The country needs to develop its NIS in order to increase the supply of highly skilled labor for both domestic and foreign labor markets and help domestic industries innovate and increase their productivity. The availability of highly skilled labor would allow the BPO companies to offer more varied and more technically sophisticated services such as design engineering and software development. The electronics and semi-conductor industry may employ workers in higher value processes that pay higher wage rates. Of all the sectors, the IT and IT-enabled sector is the most seriously constrained by the lack of highly skilled labor and the NIS. Improved S&T career opportunities and high economic performance make foreign labor markets less attractive especially for the highly skilled.
6. The Semi-conductor and Electronics Industry and the BPO Industry.
30. Electronics and semi-conductor industry has become the country’s largest export, now contributing about 50% to export earnings. The Semi-conductor and Electronics Industry of the Philippines, Inc.(SEIPI) reported total employment of 450,000 in 2007. The industry is dominated by foreign companies. Majority of the electronics companies listed in the top 5,000 corporations are branches of MNCs, largely American and Japanese including Texas Instruments, HP, Acer, Hitatchi,Fujitso, IBM. Intel was here until 2008 when it transferred its operation to Vietnam.2
31. The Commission on Science and Technology (COMSTE) states that the “the country’s electronics industry hardly progressed beyond the lowest level of the productive chain –assembly and testing.” Earlier studies (Austria 2000, Abrenica and Tecson 2005 and Cororaton 2001) likewise found the same. Abrenica and Tecson further found that the industry failed to effect forward and backward linkages. The output is exported and the inputs are either directly imported or produced by other MNCs. Japanese subcontractors of parts followed their mother companies when they came to the Philippines. No Filipino hardware parts producer has so far entered the market and no final computer products are produced by Filipino firms. There are Filipino electronics companies but they are small with their potential growth strongly inhibited by lack of venture capital. The President of one of the two largest domestic electronics company said that banks tend not to lend to companies with no track record. Banks have been very liquid since the end of the Asian financial crisis but are over cautious in lending to smalland new businesses. No Filipino Brin and Page would find investors for their ideas. According 2
The University of the Philippines Vice Chancellor for Technology Development said that the Filipino managers of Intel did not fight for keeping the company here.
He cited the case of Texas Instrument which decided to undertake massive expansion in Cebu. Its Filipino managers organized themselves to show the MNC that the country has the competitive the capability to meet its manpower and other requirements. It is expanding its operation not in Metro Manila but in Cebu where the cost of doing business is deemed to be lower.

to Sereno, Diokno and Capuno (2008), banks generally lend on the basis of good collateral and/or good business record. They do not provide venture capital. Canlas,Khan and Zhuang (ADB 2009) show that small and medium sized firms rely minimally on external finance.
32. COMSTE points to lack of highly skilled workers and research and testing laboratories as a major cause of the inability of the industry to be a material supplier. It states that the local supplier industry is “narrow and still immature…..local materials are more expensive and do not meet the required quality standards.” It states that the government has provided little support for developing R&D capabilities especially in industries like electronics in which the country has developed a niche. On the other hand many MNCs in the country praised the quality of its workers as a factor for their choice to come and stay in the Philippines. How long they will stay and how much they will expand their operations here would depend on the future competitiveness of the workforce and the whole economic environment. The need to increase the supply of highly skilled engineers and IT-ITES experts is obvious.
33. COMSTE recommends that the government target high value products in the ICT industry such as chip design, materials development, package design and test equipment. This development would require massive and well organized support for quality advanced education and R&D in electronics and related fields.
34. The business process outsourcing (BPO) industry is another fast growing export sector. Its income grew from $1.4Billion in 2004 to $4.9Billion in 2007 and to $7.0Billion in 2009. The industry was able to overcome the impact of the recession in the economies of its major clients, the US and Japan. Apparently, the cost advantage of outsourcing in the Philippines has offset the downtrend in demand by the clients. However, the country faces an increasingly stiffer competition from neighboring and farther countries. Its earnings were second to India in 2004 but now fall behind China and Malaysia. Vietnam and Indonesia are fast catching up. According to AT Kearney’s Global Services Location Index, the country’s ranking fell from 4th place in 2004 to 8th place in 2007. The industry could have grown much faster if it was able to maintain it competitiveness. Nevertheless Kearney forecasts continuous growth for the domestic industry in 2010.
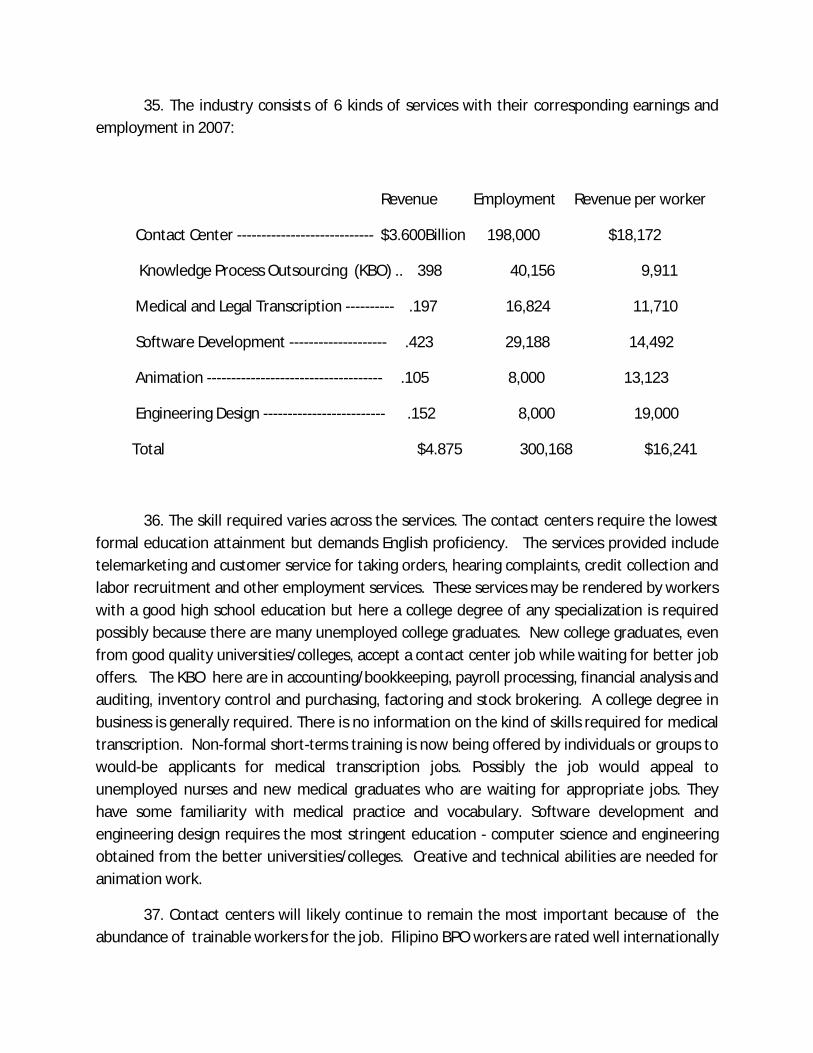
35. The industry consists of 6 kinds of services with their corresponding earnings and employment in 2007:
Revenue Employment Revenue per worker
Contact Center ---------------------------- $3.600Billion 198,000 $18,172
Knowledge Process Outsourcing (KBO) .. 398 40,156 9,911
Medical and Legal Transcription ---------- .197 16,824 11,710
Software Development -------------------- .423 29,188 14,492
Animation ------------------------------------ .105 8,000 13,123
Engineering Design ------------------------- .152 8,000 19,000
Total $4.875 300,168 $16,241
36. The skill required varies across the services. The contact centers require the lowest formal education attainment but demands English proficiency. The services provided include telemarketing and customer service for taking orders, hearing complaints, credit collection and labor recruitment and other employment services. These services may be rendered by workers with a good high school education but here a college degree of any specialization is required possibly because there are many unemployed college graduates. New college graduates, even from good quality universities/colleges, accept a contact center job while waiting for better job offers. The KBO here are in accounting/bookkeeping, payroll processing, financial analysis and auditing, inventory control and purchasing, factoring and stock brokering. A college degree in business is generally required. There is no information on the kind of skills required for medical transcription. Non-formal short-terms training is now being offered by individuals or groups to would-be applicants for medical transcription jobs. Possibly the job would appeal to unemployed nurses and new medical graduates who are waiting for appropriate jobs. They have some familiarity with medical practice and vocabulary. Software development and engineering design requires the most stringent education - computer science and engineering obtained from the better universities/colleges. Creative and technical abilities are needed for animation work.
37. Contact centers will likely continue to remain the most important because of the abundance of trainable workers for the job. Filipino BPO workers are rated well internationally

for their non-cognitive skills such as trainability, multicultural attitude and loyalty. (AT Kearney,2009) However, the contact center industry finds that only a small proportion of applicants are proficient in English. The BPO Association reports that only about 6% of applicants qualify for immediate employment. The McKinsey Global survey of English proficiency of Filipino applicants for contact center jobs found that less than 10% qualified for immediate employment, 20% are trainable, the rest are not qualified. The government has emphasized English instruction in the lower level. At the same time, private tutoring in English is proliferating in Metro Manila. There are tutoring services for learning and speaking particular English accents to suit prospective clients in different areas of the United States. Private tutoring services have been an established business in the country. Review centers for variousprofessional licensure examinations exist; review centers for the University of the Philippines entrance examination have also operated.
38. It may seem strange that contact centers have higher revenue per employee than the other BPO services. Contact centers are run by foreign firms to serve their own needs or to service other firms and by Filipino sub-contracting firms. Contact services require little capital and inexpensive working space. They operate night shifts to serve the day needs of their Western clients. Night shifts are considered overtime work and demand at least 25% premium wage. This partly explains the higher wage paid to contact center workers. According to the director of the UP Electrical and Electronics Department, most high-tech BPO companies are Filipino owned and run. The directory of members of the Business Outsourcing Association of the Philipipines (BPAP) P) shows many members are engaged in solutions and softwareservices. The companies are probably run by highly skilled engineers and IT specialists. The investment levels given by many firms in the directory are relatively small at between P.5 to P1.0Million. The UP EE Director further said that the Filipino companies find difficulty expanding their business due to lack venture capital. They provide services to domestic and foreign clients but have not yet acquired palpable presence. Apparently they obtain little assistance from the government, unlike the semi-conductor and electronics sector which receive tax privileges in the Philippine Export Zones where they are usually located.
39. The BPO sector requires improvement in the quality of education in skills that are demanded abroad such as English, accounting and finance, computer science and electrical and electronics engineering. All these fields are being offered in numerous universities/colleges. But there has not been a concerted effort on the part of the government to prod and assist schools to improve the quality of instruction in these fields. Relatively modest financial support would be needed to improve the quality of instruction in English, accounting, finance and computer science since they do not require expensive laboratory equipment. COMSTE electronics and ICT team found the ICT and engineering education in the country to be not just generally poor in quality but that their curricula do not match the knowledge and skills required

by the industry. They say that the curricula and teaching method used are geared to passing.The licensure examinations rather than to preparing for ITC jobs. Apparently no rigorous consultations with industry leaders and employers are being undertaken in the preparation of the test questions. The same complaint was aired by the ICT CEO who was interviewed for this paper. His company employs about 100 highly skilled engineers who have post graduate studies or training abroad. He said that fresh graduates from Philippine HEIs are not qualified to take on the company’s technical work and need post graduate education/training abroad. An official from another ICT company interviewed expressed the same view about the inadequate education given by the country’s engineering and ICT schools. There are too few good quality computer science and engineering schools. Note that until the mid 2009, there was not a single COE in ITC. Emigration has worsened the shortage of technical manpower. Companies have to exert special effort to keep their highly skilled workers. An officer of a large ICT foreigncompany said it requires its new hires to post a bond to discourage them from quitting during their first two years of employment. Lower level skilled workers also have to make some pledges for staying with the company. Even production workers who have to be trained have to post bond. The shortage of technical workers has dampened the growth of the industry and weakened the country’s competitiveness in a high-tech BPO services.
7. The Educational System
40. The Philippines has developed an extensive educational system that enrolls a high proportion of its school age population at the primary to the tertiary levels. The literacy rate ofabout 96% and the average years of schooling of more than 8 years exceed those achieved by most low middle income countries. More than 37,000 primary schools, 5,934 high schools and 1,428 universities and colleges now exist. In 2007-2008, the enrollment rates were 85% at the primary grades, 62% at the secondary level and 27% at the tertiary level. The high population growth rate of more than 2.0% has created large demand for new places in the public primary and secondary schools. In turn, the increasing number of high school graduates pushed higher demand for tertiary education. The government tried to meet this growing demand by expanding the school system. About 20 million youth are now enrolled in school.
41. Until the late 1950s, the government left the provision of HE to the private sector. There was liberal policy for establishing private schools and the minimum standards set by the education authority were not strictly enforced. Many private schools and colleges were opened mainly as a business or for profit, others, for religious and other social objectives. The great majority of private HEIs are fully dependent on school fees since there are few philanthropic sources. Government support for private education is virtually nil. Until the late 1950s, the national government supported only one SUC, the University of the Philippines which was established by the American colonial government in 1908. Upon the initiative of President
Marcos, the Congress established Mindanao State University in the mid 1960 as a means of tempering the simmering turmoil in Muslim Mindanao. The establishment of this new SUC awakened the interest of Congressmen to open new SUCs for their respective constituency.Copying the national government’s practice, the richer local governments (cities and municipalities) established their own HEIs. There now exist 111 SUCs and 47 locally supported HEIs. The SUCs’ share in total HE enrollment increased from less than 10% to 25% from 1950s to 2008. They are chartered institutions that obtain their budget directly from Congress and are quite independent of CHED’s authority. They are virtually totally dependent on the national budget for their capital and operating expenses. All their students are subsidized irrespective of academic performance, degree program and socio-economic background.3 The bulk of the national government subsidy to HE has been concentrated in the operation of the SUCs. In 1981, the financial and administrative responsibility of the national government for education was further increased by the enactment of the Free High School Law which provides for tuition grant to all youth who desire to pursue secondary schooling but cannot be accommodated in existing public high schools. The tuition grant may be used for entry in any private high school.The law further provided for the nationalization of the locally funded provincial and barangay (village) high schools. This act laid their financial burden on the national government. Theexpansion of the SUC system and the subsidy for high school students have vastly increased financial demands for education on the national government. The limited budget that the national government allotted to education had to be shared by more schools and more students. This has had serious negative consequence on the quality of education at all levelsand on the NIS.
42. The country’s education policy has always been driven by political expediency – the American colonial government established the public school system in the first four years of its occupation and expanded it rapidly as a means of countering the military resistance to itsoccupancy. In later years, new SUCs were chartered to enhance the popularity of incumbent congressmen; the Free High School Law was a popular legislation of Senator Angara. From these various political interests, a populist education policy evolved, i.e. maximize access or enrollment given available resources. Little attention was directed at internal efficiency or atmaximizing education’s contribution to economic and social development. The Department of Education which is In charge of primary and secondary education has been mainly concerned
3
The University of the Philippines adopted a socialized tuition scheme in 1992. The scheme involves raising tuition to a higher fraction of cost, initially
at 50%. There have been discussions about subsidizing tuition but the SUCs have continued to charge nominal tuition rates, some as low as US$25 per year. Tuition discounts were granted depending on students’ family income and wealth scaled to 8 income ranges with zero tuition plus stipend for the lowest two brackets and full tuition for the top bracket. No adjustments were made between 1992 and 2006 so the scheme was whittled down by inflation. The real value of the 1992 tuition dropped to trivial level and reversed the scale’s progressiveness. In 2008, the scheme was adjusted to the new cost level. Tuition discounts are scaled to family income with a significant increase in the nominal value of stipend for the lowest income bracket .

with building new classrooms and hiring additional teachers to accommodate each year’sinflow of new of students. While the demand for basic education has been rising at increasing rate, its share in the national budget has been declining from about one-third in the 1950s to 20.4% in 2008. On the other hand, the budget for HE has gone largely for the operational cost of the SUCs. (Table 8) In 2008, they got P96.8Billion or 38.7% of the total budget for education and research. Note the DOST was given only P2.0Billion or .76% to support its scholarship and research programs and the running of the country’s weather forecasting system. CHED, the HE authority, was given only P1.6Billion or .64% of the total. The populist policy has resulted in a very expansive poor quality education and the neglect of the innovation system. Financial constraints and vested interest of politicians, SUC officials, students, alumni and their relatives have obstructed the implementation of all the major reforms that a number of studies have recommended. (WB-ADB Philippine Education Sector Study 1995, Congressional Commission to Study Education 2002 and the Higher Education for the Twenty-First Century 2004, Tan,et al 2005) SUCs’ supporters would argue that these HEIs provide access to the poor but Tan’s survey of their students showed that they catered largely to middle and higher income students. Table 9 gives the distribution of high schools graduates, aged 17-25 who were enrolled in tertiary education across income deciles. Of the total enrolled in tertiary education, only 1.3% came from the lowest income decile. The proportion enrolled rose as we move up the income ladder. Almost 20% of enrolled youth came from the richest 10% of families. The inequality of distribution is worse for those enrolled in private HEIs, particularly the sectarian ones. The distribution is very unequal even for the SUCs where only 2.7% of their students came from the lowest decile. The SUCs admitted students from the middle and upper income groups. Tan’s study further showed that the poor have meager access to the better quality SUCs since they have stricter admission criteria. The poor college-bound youth have too poor formal and informal pre-college education to pass admission tests in the higher quality SUCs.For instance, the great majority of students in the main campus of the University of the Philippines are from affluent families who have provided them with good quality primary and high school schooling and more learning stimuli in their social environment. The last column of the table shows that as much as 30% of the poorest youth were unable to complete secondary schooling.
8.The Structure of Higher Education System
43. HE students are concentrated in first degree programs in popular fields such as business courses, teacher training, engineering, medical fields (mainly nursing) and mass communication. Enrollment in mathematics and computer science increased rapidly in response to perceived demand for workers with computer science skills. But there was little information about the curriculum that would match the qualification demanded. Many colleges/ universities opened so-called computer science degree programs. Apparently CHED

failed to develop and impose international standard for computer science program. It is alleged that most schools merely trained students to operate popular computer programs like word.There were simply too few qualified teachers to handle IT courses since very few HEIs offeredadvanced programs in the field. The natural science programs have attracted relatively few students. Of the 315,928 Bachelors graduates in 2003-2004, only 4,042 or 1.3% majored in Biology, Chemistry and Physics. (Table 11) A fair number, 39,632 or 12.5% majored in various engineering fields. Very small numbers of students pursued graduate studies for Masters and PhD. Degree, 13,843 and 1,522, respectively, with the large majority specializing in Business, social sciences and teacher training. Only 315 completed Masters degree in engineering, 153 in natural science, 203 in mathematics and computer science. Alarmingly very small numbers completed doctoral degree in these fields – 6 in engineering, 13 in natural science and 6 inmathematics and computer science, these out of the 315,928 graduates. Most schools do not have qualified faculty and adequate laboratory and library facilities to open graduate programs in these fields. And they are not attractive to many students because their rate of return is low. The foregone income for graduate work is high and the degree offers no observable prospects for attractive employment. There is no sizable NIS to employ S&T Ph.d. graduates. It is a vicious circle wherein there are too few research universities and institutes to attract advanced S&T graduates and provide them with satisfactory S&T teaching and research careers. This lack of demand depresses enrollment and the growth of advanced S&T HE programs. Most HEIs have small demand for highly skilled scientists and engineers since they can make do with low quality faculty. On average only about 9% of HEI faculty have doctoral degree. Many low quality schools produce their own faculty resulting in in-breeding low quality faculty from low quality students. Available scholarships, particularly those from the Department of Science and Technology are relatively few. Until about 2005, DOST did not give high priority for graduate S&T studies and its scholarship program was relatively small and did not provide adequate support for decent living and high tuition in private universities.
44. The quality of education in SUCs is generally poor with the majority offering mainly undergraduate programs in such popular fields as teacher training and business courses. The quality of most SUC programs is comparable to that of private HEIs. One reason is that they obtain relatively small budgets from the government. They have the power to raise tuition to augment their revenue but by tradition and political pressure, they do not tap this source. Budget allocation to SUCs varies widely.(Appendix Table 1) The better quality SUCs tend to obtain larger budgets. The University of the Philippines has always been appropriated the largest budget. In 2008, the budget per student ranged from P6,200 (Negros Oriental State College) to P113,060 (University of the Philippines). The current expenditures per students ranged from P6,030 toP84,180 (same universities). The SUCs with COE programs got much lower budgets than UP but higher than most other SUCs. Mindanao State University-Iligan Institute of Technology which has 4 COE programs got only P291.8 Million or P28,570 per

student. The other SUCs with COE programs got from P20,000 to P30,000 per student budget -Mariano Marcos State University, the Philippine Normal University and Central Luzon State University. Some SUCs with small enrollment tend to have relatively high per student budget. Most SUCs undertake minimal research possibly because they do not have qualified faculty and research infrastructure for research. The budget for research ranged from P50,000 for Basilan State College to P2.685Billion for UP. The structure of the state system does not differ from the private sector. The majority offer only undergraduate programs of poor quality. They have nodeveloped research capability. Nevertheless, both the public and private HE sectors contain a small number of centers of excellence and centers of development.
45. Apparently, the HE system does not operate efficiently. Many SUCs appear to have lower operating cost per student than private institutions of the same quality. UP has much lower cost than Ateneo, DLSU and Mapua. The other SUCs with one or two COEs in their programs also have relatively low cost as compared to their private HEI counterparts. Within the private sector, cost varies even more widely and most of the poor enrolled in whatever low-cost school was present in their locality. Santo Tomas has much lower tuition fees than Ateneo, DLSU and Mapua. CHED hesitates to publicize the performance of individual schools in the various professional licensure examinations which is of direct interest to students when they are deciding on degree program and school. The lack of information has resulted in a low or insignificant positive relationship between school fees and school performance in the licensure examination. For instance the highly respected engineering Mapua Institute of Technology has a lower passing rate but has a higher tuition rate in several engineering fields than the University of Santo Tomas. engineering fields than the latter. (Tan 2008). The Philippine Science High School has more than double the cost of the Manila Science High School even if their students obtain virtually equal average scores in the National Secondary Achievement Test.
46. The preponderance of poor quality HEIs may be explained by the stringent financial constraints facing families and the government. Relatively few youth in the lowest quintile of families could finance HE and those from the lower middle and middle income quintiles couldafford only low-cost low-quality HEIS. Private HEIs cater to the effective demand of these income groups. On the other hand, budgetary constraints on the part of the national government lead it to allocate relatively small budgets to the SUCs. The Congressman who sponsored the establishment of his province’s SUC was probably aware of budgetary limits on HE support and implicitly acquiesced to his SUC getting relatively small budget and becoming a poor quality HEI.

9. Quality Indicators of HE
47. There is no rating system of HEIs in the country but three popularly used quality indicators - performance of graduates in professional licensure examinations, accreditation andCHED’s recognition of academic programs as Centers of Excellence (COE) or Centers of Development (COD). The Professional Regulations Commission or PRC administers licensure examination to 42 professions. The 1995 Task Force on Higher Education was the first to use performance in the PRC examination as a gauge of HEI quality. Universities and colleges advertize in the media and on bill boards when their students top an examination. However, the employers interviewed for this paper question the validity of the PRC tests as a gauge of quality. They think the test questions do not correspond to the knowledge and skills industry requires of their technical workers. The relevance of the tests to industry needs would depend on the examination panels appointed. The panel members may or may not be versed in the current state of basic and applied knowledge. There has not been an inquiry into the quality and relevance of PRC examinations. The PRC examination possibly gauges achievement based on standard curriculum. It is still a gauge of quality. We show the distribution of HEIs by their graduates’ performance as indicated by percentage of takers who pass in selected professionsor their passing rate. The average performance of graduates varies widely across schools. In some professions, the passing rate ranges from 100% for the top schools to zero for some schools . Generally, the most respected HEIs such as the University of the Philippines, De La Salle University, Ateneo de Manila University and Santo Tomas University top in passing rate.Some HEIs are known for particular professions such as the Iligan Institute of Technology for engineering, St. Louis University, the Pamantasan ng Lungsod ng Manila (University of the City of Manila) and the Philippine Normal University for teacher training . A number of HEIs have zero to 10% passing rate. CHED has tried to close them but not successfully because of political pressure. (Table 12)
48. To encourage HEIs to improve the quality of their academic programs, CHED awards those of high quality with the status of center of excellence, COE. Those with potential for meeting the criteria for COE are awarded the status of center of development, COD. Panelsof experts are appointed to assess the quality of degree programs in a number of fields such as biology, physics, chemical engineering, medicine and nursing. CHED and the panels of expertshave adopted common criteria for the grant of COE and COD status. An important criterion for COE award is that an academic program must have at least 7 regular faculty members with Ph.d. degree. Another criterion is research output with a minimum number of publications in local and international refereed journals. Publication in ISI journal is given a heavier weight. Performance in the PRC examination is also considered for the award. The criteria for COD award are not as clear as those for COE. CHED awards the COD status to programs that indicatepotential for raising their quality to COE level. However, CHED does not specify how the

potential is gauged. Possibly the CODs have complied with CHED minimum standards. The award includes a modest financial grant for scholarship, faculty development and other purposes. This year the award for COEs was doubled from the P3Million given earlier. CODs get half the COEs monetary award. The COD award acts as an encouragement for an HEI to qualify for a COE status. The COD status differentiates an HEI program from the rest and has an advertising value. The financial grant is fairly small in terms of the monetary cost of improving the library, laboratory and faculty of the CODs. In her 2002 survey Tan (2005) found most HEIs had very poor library and laboratory facilities. They would require much larger financial support than what CHED provides to make a significant improvement in their instructional facilities.
49. So far, 117 HEIs have been awarded the COE status for 26 degree programs.(Table 13) The COEs are very few in terms of the total number of HEIs or of their program offerings. Only 47 COEs have been awarded to the S&T fields. Five HEIs got COE award for mathematics and 25 for natural sciences which include biology, physics, chemistry, geology, marine science and IT. Seventeen HEIs qualified for COE status in agriculture, fishery and forestry. Very few engineering schools qualified for COE status. There is no COE in four critical fields in engineering: civil, metallurgy, ceramics, mining. Civil engineering is the largest field in engineering in terms of enrollment and number of schools yet not one qualified for COE status. Six engineering fields have one COE each, computer engineering has 2 and agriculture engineering has 3. On the other hand, nursing and teacher training programs which are offered by many HEIs and have large enrollment have the largest number of COEs, respectively 8 and 18. There is no COE in commerce or business fields which are offered by as numerous universities/colleges as education. Medicine , an important health field, has only 3 COEs. Possibly the sparsity of COEs in engineering, medicine and the sciences is due to the high cost of laboratory facilities and the fewness of HEIs that offer advanced instruction. In 2008, there was no COE in IT but there was an upshot to 7 in 2009. It appears that the panel appointed to assess IT programs lowered the COE standard for the field so that many were able to qualify for the award including the university from which the Chairman of the CHED originated. The panel did not require the institutions to have a minimum of 7 faculty with Ph.d. in the field. There were simply not that many doctoral holders in IT in the country.
50. The CODs are mainly teaching HEIs. Many more programs got awarded the COD than COE status, 186 vs. 117. The science fields have 57 CODs and engineering 85. It is noted, however, that only 3 CODs, aside from those in IT, have moved up to COE status from 2005 to 2009. The CODs in the S&T fields may function as feeder schools for the planned expansion of advanced degree programs in the S&T COEs. Their BS graduates form the potential supply of students for graduate studies in the S&T COEs. Note the S&T COEs have not fully utilized theiradvanced instructional capacity and scholarship fund. More graduate students can be

accommodated in the consortium of engineering schools and in the UP College of Science. CODs should be encouraged to send their bright graduates to the S&T COEs.
51. In 2008, CHED had commissioned a study to assess the performance of the S&T COEs in terms of their graduate programs, faculty and research output. (Table 14) The results show how small is the share of COEs in HE output. The COEs in biology enrolled only 185 at the Masters level and 42 at the Ph.d. level. They graduated 48 Masters and less than 3 Ph.d’s. In chemistry, enrollment was 589 in BS program, 46 for the Masters degree and 23 in the Ph.d. program. The number graduated was respectively 111, 15 and less than 2. In chemical engineering, enrollment was even smaller than in biology and chemistry – 163 at the BS level, 20 at the Masters and 8 at the doctoral level. The number of graduates was, respectively, 31, less than 4 and less than 1. Not all the COEs and CODs responded to all the questions. They did not provide data on faculty qualification and research output. Perhaps they have not fully complied with the COE standards for these.
52. Table 15 shows the five most respected HEIs in the country – University of the Philippines or UP, the Universities of Ateneo de Manila, De la Salle and Santo Tomas and Mindanao State University-Iligan Institute of Technology. UP is the largest high quality HEI in the country and has a predominant position in S&T fields. It has the largest number of COEs, the largest corps of faculty with Ph.d. degree and the most active and published research program. The table shows that in S&T fields, UP and its three major campuses – Diliman, Los Banos, and Manila have a total 30 COEs. All its key S&T programs are COEs. The other four HEIs have 32 COEs - Ateneo has 10, De la Salle,9, Santo Tomas,9, and MSU-Iligan Institute of Technology 4.
10. The University of the Philippines College of Science and College of Engineering
53. The development of a strong NIS would have to start with the five top universities cited above, particularly UP which has COEs in several S&T fields. The government has decided to center its S&T development plan on the UP College of Science (UPCS) and UP College of Engineering (UPCE). In 2005, President Arroyo provided UPCS a lump sum grant of P5Billion. This is of historic level in the University. The budget will fund scholarship for graduate studies, research and infrastructure development including buildings and laboratories. The UPCS has a relatively high concentration of faculty with doctoral degree who account for a large share of published research and the best library and laboratory in the country. Of its 241 regular faculty144 or 60% have doctoral degree. Compare this to the national average proportion of 8-9%. Its part-time lecturers and adjunct professors add to the faculty capacity totaling 290. Many in the faculty have published research in local and international journals including ISI journals. (Appendix Table 3). To encourage publication in refereed journals and books, the university now grants monetary award depending on the reputation of the publication. For ISI

publication, the award is P55,000 equivalent to about 1.5 monthly salary of associate professor. Promotion is heavily weighted by such publication.
54. Natural science has not been a popular field of study. As mentioned earlier, career prospects in the field, especially for graduate degree holders, have not been very bright. There is no NIS to provide satisfying employment to S&T Masters and Ph.d. graduates. There are too few universities and research institutes to employ scientists. Consequently, the instructional capacity of the various departments of UPCS has not been fully utilized. Enrollment at the graduate level is a small fraction of undergraduate enrollment; in 2008, 1,609 were enrolled in BS programs but only 549 in the Masters and 160 in the Ph.d. programs. (Table 16) The total student faculty ratio was 9.1; the graduate students/faculty with Ph.d. ratio was 4.7. The dean of the College expressed strong concern about the low graduate degree output of his faculty. In 2008, the 147 faculty with Ph.d. degree produced only 14 Ph.d.’s, less than one per 15 faculty. The Ph.d. output in 2000 to 2008 averaged 13.2 a year in all departments, higher than in the 1984-85 to 1998-1999 period but still very meager. The dean is giving incentives for dissertation advising and getting students complete a graduate degee. Moral suation is also being applied. He noted the fairly large increase in the enrollment for the masters program which would feed into the doctoral program. The brightest masters students are encouraged to continue on to the Ph.d. program. The new grant for scholarship and research will help attract more students. It provides for much larger stipend for graduate students that approximate entry wage rates of UP graduates, about Php20,000 per month.
55. Engineering is a more popular undergraduate field than science and mathematics. In 2008-2009, 4,089 were enrolled at the undergraduate level , 608 for the Masters and 80 for the Ph.d. programs in various engineering fields.(Table 17) The number completing graduate degree is very small and showed little growth from 2004-2005 to 2008-2009. Over this period, 257 graduated with Masters degree but only 16 with the Ph.d, averaging 68 and 4 per year, respectively. The UPCE seems to have an even greater difficulty attracting students and graduating them in the Ph.d. program than the College of Science. Engineering graduates have better job opportunities than science graduates which means a higher foregone income. Engineers can work in production, distribution, research and teaching and management while scientists are suited mainly for teaching and research. The college has larger enrollment butfewer faculty than the College of Science, 204 vs. 244. (Table 18) It has fewer faculty with Ph.d., 49 vs. 149. Of the 204 faculty members, 87 have only BS degree, 68, Masters degree and 49 Ph.d. The percentage of faculty with Ph.d. degree varies across programs ranging from only 10.5% in industrial engineering to 43.2% in civil engineering. There is no report on faculty research. The student/faculty ratio for all programs is 23.4 and for graduate students to faculty with Ph.d., 14. The 49 faculty with Ph.d. produced only 4 Ph.d.’s a year, only 2 in 2008-2009. Apparently, faculty time is heavily concentrated in undergraduate instruction, leaving little for

research. Those with only a BS degree cannot teach in the graduate program. There is no report on research and publication perhaps because there is not much to report. The college will have to increase its faculty corps in order to increase its research activities and graduate instruction. It will face the problem of finding qualified professors. The engineering COEs produce only a handful of Ph.d.’s a year. This is a dilemma for the Engineering Research and Development for Technology program (ERDT) which plans on supporting R&D in several industrial sectors.
56. The government gave a lump sum grant of P3.1 Billion 10 year development program to a consortium of the top 8 engineering institutions under the Engineering Research and Development for Technology program or ERDT. The consortium consists of UP Diliman, UP Los Banos, De La Salle,, Ateneo , Santo Tomas, Mapua and Mindanao State University-Iligan Institute of Technology. Aboout P1.8Billion of the grant is for infrastructure development -laboratory, library and renovation of old buildings and construction of new ones in UPCE, the rest for scholarship and research. The grant for research and scholarship is to be administered by DOST to benefit of the consortium members. Priority is given for graduate scholarship. To attract graduate scholars, the stipend has been raised to match the entry salary of S&T graduates from good schools, now close to P20,000 per month. This is a tremendous increasefrom about P5,000 given earlier. DOST is tasked for drawing and screening applicants for graduate studies in engineering and the sciences. Research grants are given for thesis writing and publication. The other members are not provided support for laboratory, library and other infrastructure development. The ERDT is a ten-year project. Its R&D agenda covers four fields: energy, environment and infrastructure, ICT, electronics and semi-conductor. Each field has several related R&D programs. The ICT tract, for instance, covers five sub-tracts such as ICT for environment, ICT for education, ICT for health, ICT for business and logistics and ICT for multimedia. The ERDT has set targets for scholarships for advanced degree in selected fields and research grants for the consortium members in the coming three years.
57. The DOST has its own funds for scholarship which it has recently prioritized for graduate programs. CHED also has received a large increase in its budget for research and scholarship for faculty development. According to CHED’s director for planning and research, the funds have not been fully utilized. It has not received enough applications for faculty scholarship and research grants. Most potential scholars have families to care for and find relocation for study purposes discouraging. CHED should not be stymied by the problem; it can give the scholarship to students who could potentially replace less qualified faculty.
11. Research Policy and Research Institutions
58. In theory, the government has expressed great concern for building scientific and technological capability as a tool for social and economic development. In 1982, the National

Science and Technology Board was created to plan and support advanced instruction and research in S&T. The 1987 Constitution expressly provided “The State shall give priority to research and development, invention, innovation, and their utilization; and to science and technology education, training and services. It shall support indigenous, appropriate, and self-reliant scientific and technological capabilities, and their application to the country’s productive systems and national life….The Congress is to provide incentives including tax exemption deduction to encourage participation in programs of basic and applied research, scholarships, grants-in-aid or other forms of incentives to science students, researchers, scientists, inventors, technologist and specially gifted citizens.” There is a Constitutional provision for the protection of intellectual property rights. The Congress enacted some implementing laws for these Constitutional mandates. It converted the National Science and Technology Board into an executive department, now the Department of Science and Technology, DOST. The Magna Carta for Scientists and Engineers, Researchers and other S&T personnel provides for a system of incentives and special salary scale for S&T personnel. In 1998, another law was passed tocreate the national science high school system. Through time, laws have been enacted to address different problems of the educational and innovation system. But they were neverbacked by commensurate financial support and only half measures could be implemented. There has been a great divide between the noble aims of the Constitution and implementing laws and the provisions for their financing. The Magna Carta for Scientists is an example; it did not substantially raised the compensation of scientists.
59. The DOST created 20 councils, institutes and administrative units and some are research policy and planning offices, some are operating units like the Science Education Institute which runs the Philippine Science High Schools and the Philippine Atmospheric and Geophysical and Atmospheric Administration (PAGASA) which is the country’s climate forecasting agency. DOST administers the National Academy of Science. The SEI is responsible for the department’s scholarship program, and now the new scholarship programs of the UP College of Science and UP College of Engineering. In 2008 DOST obtained from Congress P1.99Billion which comprised .76% of the total budget for education and research. The budget was allocated to its numerous research councils and other offices. The Philippine Science High School System, PAGASA and the Science Education Institute have absorbed more than half of the total budget leaving little for R&D and scholarships. Earlier, DOST scholarship was not prioritized toward graduate studies and the grant level was too little to support decent studentliving and the tuition rates in high quality HEIs. These have changed so that priority is for graduate studies and the grant was increased to a level that could pay for comfortable student living costs and fees in any good school.
60. Table 19 shows the budget of the DOST’s research councils and number of R&D projects in 2008. About P640 Million was allocated to 550 projects giving an average grant of
about P1.2 per project. PAGASA and the Industry Technology Development Institute (ITDI)were given the largest share, P146.7Million and P167.3Million. The Metals Industry Researchand Development Center (MIRDC) was awarded the smallest amount though it has largest number of projects, 164. This means rather small average grant amounting to about P63,000. There is no report on two important councils, the Philippine Council for Industry and Energy Research and Development (PCIERD) and the Philippine Council for Aquatic and Marine Research and Development (PCAMRD),another two critical areas for industry development. The Institute for Advanced Science and Technology (ASTI) was awarded only P44.7Million for 24 projects. The number of awards and amount of grants increased fairly significantly from P247.2Million in 2006 to P370.5Million in 2007 to P639.6Million in 2008. DOST obtained financial support from other sources such as other government units, the private sector and foreign donors. In 2008, their respective shares in the total R&D budget were respectively 36.7%, 46.0%, 2.3% and 14.6%. Note how little came private sources.
61. Scholarship for S&T studies is a major responsibility of DOST. Over the 2006-2008period, 86 scholars completed the Masters degree but only 30 were in S&T fields under theumbrella of the Council for Advanced Science and Technology (PCASTRD). The National Research Council (NRCP) and the Science Education Institute would grant scholarship for different fields of study. The scholars enrolled in Ph.d. programs in 2008 numbered 172. Forty-seven completed the degree but only 10 in S&T and 9 in aquatic and marine fields. DOST runs and supports 9 science high schools which are spread all over the major islands. They are high quality high schools that strictly screen applicants for admission. In 2008, their enrollment amounted to 3,019; only 690 graduated. Note that their graduates are not obligated to pursue S&T studies. There is no evidence on the proportion of graduates who pursued further studies in S&T fields. On the whole, the DOST programs have not been geared to the development of the NIS. It has not drawn a practical or operational plan for developing specific S&T fields with target output in priority S&T fields, time table and required budget. Like other departments, it implements small scale programs in different directions. DOST planning is more in the nature of wish lists. However, its new compendium of S&T statistics reflects a keen awareness of the very poor state of the country’s NIS. The compendium contains the country’s comparative position to neighbors with regard to scientific manpower supply, research budget, competitive index and quality of HEIs. Perhaps this awareness will lead to the drawing of an operational plan that contains targets, strategies, schedule and financing.
62. The overall picture of the innovation system is dismal. The R&D Expenditures to GDP ratio is low and even had a declining trend. DOST reports very low and declining ratio from .15% in 2002 to .14% in 2003 and .12% in 2005. Its meager budget could not finance essential researches or employ large numbers of scientists. In 2005, 14,087 were employed in research work. Of these, 10,690 were classified as scientists and engineers, the others consisted of

1,162 technicians and 2,234 support personnel. (Table 20) Of the 10,690 scientists, 7,500 were accounted for by sector of employment and educational background. Those with Ph.d. numbered 1,852 of which 211 were in government, 1,146 in SUCs, 495 in private HEIs. There are more than 1,200 private HEIs which means many of them have no faculty with the advanced degree. There were 2,818 scientists with Masters degree of which 846 were in government, 1,273 in SUCs and 699 in private HEIs. There was no report for private industry for 2005 but in 2002, it employed 66 with Ph.d. and 127 with Masters degree. The SUCs are the main employers of scientists and engineers with advanced degree. As seen above, UP College of Science and UP College of Engineering have close to 200 Ph.d’s in their faculty. (The UPCS and UPCE reported 144 and 149 facualty with Ph.d in 2009) The research scientists are not equally distributed across research fields. Agricultural sciences employed about 30% of the scientists and engineers while natural science, 21.6%, and engineering and technology 15%. The social sciences employed 22.1% but the humanities only 3.5% of the total.
63. Dean Saloma of the UP College of Science estimated the number of Ph.d.’s that have to be produced for the Philippines to reach the Ph.d./population ratios of Germany, Japanand the US. The number required are, respectively, 25,508, 7,564 and 13,454 given theirrespective Ph.d./population ratios or l/3,316, 1/11,621 and 1/6,533. The figures are meant to shock for the whole HE system has graduated only about 50 Ph.d.’s a year. The serious shortage of highly skilled scientists and engineers would be a difficult binding constraint in the development of the country’s innovation system. The instructional output of the available faculty with advanced degree in the COEs must be maximized and supported with massive scholarship to draw larger numbers of students into the graduate studies. The field must be made attractive by providing more support for research and faculty compensation that would make S&T career relatively attractive. Magpantay (1998) suggested that high school science teachers be required to have majored in science. This would further increase the demand for science education. Currently only 15% of science teachers have majored in science. It is noted that families and students have exhibited fairly strong sensitivity to labor market opportunities so that if labor market opportunities in the S&T fields are made more attractive, they would definitely attract more students. The increased stipends for scholars and increased budget for research are expected to succeed in drawing more students. However, the grants to UPCS and UPCE are lump-sum grants for a limited time of 5 to 10 years. There is no guarantee ofsustainability and new budgetary appropriation and new laws would have to be enacted to continue the programs. A more aggressive development plan than what the DOST and COMSTE have drawn will be needed for developing the NIS. The current grants do not address the need for building up the library and laboratory facilities of S&T COEs and CODs outside UPCS and UPCE.
12. Survey Results on Innovations in Private Business
64. This study partly aimed to inquire into innovation activities and facilities in private business. A survey of leading manufacturing firms was conducted through a written questionnaire sent by email and courier to be followed by interview of respondent company representative. A sample of 17 firms from the country’s top 5,000 corporations and 5 firms that reported R&D expenditures from the WB survey (2009) were selected. The 22 firms represent major manufacturing sectors such as food, cement, metal, garment and shoes and ICT. The survey asked about the nature of innovations undertaken in recent years, numberemployed in R&D, expenditures for R&D, investment made for the innovations and open ended questions on prospects and problems encountered in innovations. (See Appendix 2 for the questionnaire.). The survey got a rather small response rate, 8 out of 22. Choosing leading companies might have been a mistake for their officers are too busy and too proud to appreciate the study to spend time on it. But since only the large and dynamic companies undertook R&D (based on the survey of establishment), they were the logical sample frame for the survey. Another reason for the poor response is the length of the questionnaire. In a large firm with several departments, the questionnaire has to be circulated to each of them and that takes time and monitoring. Nevertheless, other information on innovations was obtained through interviews with officials from UPCS, UPCE, UP Vice Chancellor for Research who is also a faculty member of the Electrical and Electronics Engineering Department, the Executive Director of the newly created Commission on Science, Technology and Engineering (COMSTE), and the Executive Director of the Ayala Corporation Business Incubation Center. Interviews were conducted with five of the seven respondents to the survey.
65. The responding firms represent the following industries: shoes, cement, pharmaceutical, match, chemical, steel, semi-conductor and electronics and JGSummit, one of the country’s largest conglomerate. Firm size in terms of employment and sales vary widely across the sampled firms. The firms’ responses regarding the innovative activities, R&D resources and educational background of top and middle level executives differ depending on firm size and sector. The smallest firm barely undertook innovation and employed only one engineer. The largest firm in ICT sector cited many innovations, employed highly skilled executives from top HEIs including some with graduate degree from foreign universities. It is the only respondent that has regular consultations with university experts. The pharmaceutical firm undertakes innovations in new product lines based on its own staff R&D work. The cement representative innovates in new product lines and energy source. It has harnessed sugarcane biomass to fuel its energy intensive technology. The match company is a subsidiary of an MNCand relies on the mother company’s technology platform. Its innovations are in the nature of increasing product lines that involve higher technologies and based on building the capability of its domestic staff to adapt the new technologies. Its innovation is very dependent on good
management and upgrading of skill. Only the ICT and chemical firms experienced some shortage of workers of specific skills. The pharmaceutical firm said that his chemists who are graduates of domestic HEIs are very capable of doing research for developing new products. It is interesting to see that while the firms express high regard for the top five universities, some of their top and middle level executives come from other institutions. Presumably bright students are found in all schools; the brightest from an unrated HEI may be as good or better than the average UP or Ateneo graduates. The former may possess higher non-cognitive skillssuch as willingness to work with machines and have “passion” for work as cited by two interviewees. Two executives surveyed said that engineering graduates of top schools tend to have little love or enjoyment of production work as they aim for managerial position. All the respondents said they were fairly satisfactory with their workforce. None experienced any problem financing their investment and operation. Except for the shoe company, all experienced high revenue growth. The interviewees exuded great enthusiasm and optimism for their respective companies.
66. We highlight some unique characteristics of the respondents, starting with the smallest and least innovative firm.
1.Shoe factory – The owner-manager preferred to have an interview to answering the questionnaire. The researcher visited the factory which appeared to have rather simple operation with little innovations taking place. It is a small firm with less than 100 employees. It subcontracts with American and European companies the manufacture of women’s shoes according to their precise specifications and design. The technique is labor intensive. Average revenue is P80Million, the estimated value of assets is also P80 million. It employs mainly high school educated workers. There is only one engineer employed to man and maintain the machines. Few shoe designs were being produced during the visit. The owner/manager appeared quite content with the existing scale of operation and has no plans of expanding to new products or own products. There are similar subcontracting companies that manufacture known brand clothing. They are supplied with the materials and machinery. Value added comes mainly from labor inputs.
2. Pharmaceutical firm – The owner/manager preferred to be interviewed to answering the questionnaire. The company experienced high sales growth in 2004 to 2009 and expectseven higher growth in 2010. Sales were P80Million 2004, P170 in 2008 and expected to reach P275 in 2010. It employs 70 workers of which 15 are technical/professional with BS degree in chemistry and engineering. Only one has MS. The company does a lot of R&D for new products. Its capital is only P50Million ,- While the interview provides insights, it cannot obtain complete data since the interviewee does not have them on hand. Nevertheless the findings are interesting. He is very satisfied with his technical staff. He

manufactures drugs and cosmetics on orders of clients. His staff does research for product development. They depend on scientific publications and the internet for needed knowledge. Of special interest here is that he and his staff depend on readily available information in the internet and libraries for acquiring knowledge and expertise. His capital stock is relatively small. They need inexpensive equipment for experimentation and production, test tubes come to mind.
3. Cement company – also preferred an interview to the written questionnaire. It was conducted by the human resource manager. The company is part of an MNC. It is a fairly large company with 600 employees. No sales figures could be given. The top and middle executives have MS degree, the top has majored in engineering. They were educated in the top schools such as UP, Ateneo, DLSU, Santo Tomas, all COEs, and San Carlos University, a COD. Noted is that most of its production workers have BS engineering degree though not all are licensed engineers. I asked why it employs college graduates for production work and he said that they were available at the wage rate it offers which is above average. They have diversified their product lines and improved their quality. Cement production is inherently energy intensive. One important innovation undertaken was the development of machinery for using biomass from sugarcane which is abundant in the firm’s location. It has changed its marketing strategy from using middlemen to direct delivery to retailers. This provides faster transmission of information and closer monitoring of market demand and deliveries. The company depends on the mother company technology platform for developing new product lines or improving them. The company finds its top and middle executive staff excellent and the production staff fairly good. The company values employees who have “passion to get things done well and quickly”
4. Match company – Both interview and written questionnaire were used. The company is medium sized with 137 employees. It generated revenue of $18.4Million in 2004 and $35.79Million in 2008, respectively P920Million and P1,682 Million, 83% undeflated growth in 4 years. The top executive has a masters degree in engineering. Note that only 14 out of 137 employees have high school education, the rest, BS degree. Technological innovations come from technology transfer from the mother company in Europe and from development by local personnel. The innovations entailed new investments which jumped from less than $1Million to $5.9Million in 2006 to 2007. Investment was lower in 2008 at $3.4Million. The new capital had both foreign and local sources. The president interviewed said that the local company’s technical change comes in the form of undertaking new products including the manufacture of machinery. He finds all his staff to be fairly good. Their executives come not just from UP, UST, DLSU and Ateneo but also from Don Bosco College and Mapua . He wrote in the questionnaire that “Its technical team is mainly composed of technical and vocational school graduates who have been trained internally over their years of service in

the company. Most started as production workers” The company did not consult with the academe as it thinks that the faculty are not capable to do the work it needed or were interested only in getting grants for scholarship which the company was willing to give.
5. Chemical company - It is a small company with only 29 employees. The top executive has a masters degree in management and engineering, the other executives have BS degree. The production workers are high school educated. The top officers come from varied HEIs. The top officers in manufacturing have chemical engineering degree, one from UP, one from Mapua, one from Manual Quezon University, an unrated HEI and a chemistry major from from Mindanao State University – Iligan. Another executive is a graduate of Adamson University. The company introduced a new product line, upgraded an existing one, made investments in new machines and undertook some organization changes. It invested P12Million in 2004 and P18Million in 2007. It has high rating for its executives and “good” rating for its production workers. It values “passionate” hardworking, good sense of humor and open-mindedness among all its workers, including production workers.
6. Metal company – It is a large firm with 323 employees and sales ofP1,467Million in 2004 P2.723Billion in 2008 or growth rate of 86%. Three of its top executives has a master degree, the rest of middle level and professional staff have BS degree. A few production and service workers have BS degree, the other, high school education. It is interesting to find that its executives are graduated from schools other than the top five. The schools are St. Louis University in Baguio City, Cebu Institute of Technology, Adamson University, Feati, Far Eastern University, Divine Word College and University of San Carlos. The company rates its top executives excellent but the middle executives and professionals to be “fairly good to not good enough” The production workers are rated not good enough. The company introduced new products, upgraded existing ones, made investment in machinery, undertook organization change and computerizationthe accounting, sales,etc. The investment in new equipment and machinery averaged P21.3Million in 2005-2007 period and P38.8Million in 2008. The new capital had local and foreign sources. The company has a capable staff to do research and engineering work, make plans and undertake comparative analysis. It organizes focused group discussions and produce progress reports, time frame and use of SMART and SWOT. It is very satisfied with all its staff. It sends engineers for training abroad in specialized fields. It rates the quality of graduates in various S&T fields to be fairly good. Some shortage in engineering and computer science has been experienced.
7. Semiconductor and electronics – This is the largest respondent firm employing 6,735 regular workers with revenue of $109Million in 2004 and $441Million in 2008, a growth rate of 305%. The equivalent peso revenue was , respectively P5.45Billion and P20.73Billion. The

top executive has BS engineering and MBA degree. Its middle level and professional personnel have one with Ph.d. degree and 13 with masters degree. Of the 5,553 production workers, 576 have BS degree and 981 vocational training and the rest, high school education. The company rates its top executives to be excellent and the middle level executives and professionals, fairly good. Ten per cent of production workers are excellent, 85% fairly good and 5% not good enough. It did not state the preferred HEI for its top executives but identified five HEIs for the middle level executives and professionals to be UP, Mapua, UST, Adamson, Letran and DLSU, in that order. The heads of various departments graduated from HEIs other than the top five. Three department heads are BS Engineering, Mapua, one BS Engineering, DLSU, one BS Engineering, San Carlos University, one MS Engineering, Linloping University Institute of Technology, one AB Behavioral Science ,St. Scholastica College and one BS Accounting, St. Theresa’s College. The investments made were a fraction of revenue, $4.5Million/$109Million in 2004 and $8.8/$441Million in 2008. The company upgraded existing product line, undertook organizational changes and formed partnership with local individuals/companies. New technologies were brought in by new foreign partners. The company did not do core research but application R&D. It has competent staff to do this. It has consulted with UP Electrical and Electronics Department, DLSU Electronics and Communications Engineering Department and UP Institute of Physics. The company finds the specialists in domestic universities to be “academically very good, able to give good insight to problems. However, they are still lacking in practical or industry experience.” The consultancy involves weekly physical presence for helping in resolution issues and conduct competency development activities (training). They participate in project reviews, brainstorming sessions, conduct seminars, improve performance of wireless products and the implementation of software solutions and new techniques. The company has a separate R&D with 62 personnel in 2004, reduced to 44 in 2008. The budgetfor R&D in 2004 was P64Million, in 2008, P46Million. The head of the R&D division has an MS degree from Rensselaer Polytechnic Institute, the three associates have BS Electronics and Communications Engineering from DLSU, Mapua and UST. The company cites” lack of highly qualified personnel capable of doing cutting edge development work and unavailability of simulation and modeling tools for signal integrity and EMC/EMI “ as serious constraints to innovation. He finds technology licensing costs prohibitive and experiences some shortage in good graduates of engineering, computer science and management and accounting. Its recommendations to the government reads like other studies and COMSTE, to cite a few – establish research programs that target domestic problems, establish collaboration between academe and industry to tackle these problems, make scholarships more attractive to motivate students to pursue advanced degrees and lobby for legislations that would stimulate the R&D sector.

8. Conglomerate – forthcoming
13. Views of Industry and Professional Associations on Quality of HEIs
67. CHED had commissioned a small survey of ICT firms and professional associations to get their views about the quality of HEIs and the performance of their graduates. Five firms and three associations responded to the survey. The first question asks the sample to name the HEI from which their employees graduated. Table21 puts the order in which each respondent orders the name of the schools. We interpret the order of listing as reflecting relative importance of a school as a source of workers. We find that UP Diliman is ranked 1 by only one firm while Mapua, a COD is ranked 1 by three firms. De la Salle is ranked 2 by two firms and 1 by another. Several other schools which are not COEs are listed by the companies. There is no listing for Ateneo de Manila. Could it be that Mapua and Don Bosco which are not COEs provide more relevant ICT curriculum than the top three schools? In our survey, Mapua graduates are found in several respondent firms. It might also because the other HEIs which have humbler reputation than the top three inculcate better non-cognitive skills such as willingness to dirty their hands or “be under the hood” of machinery and vehicles. The CEO of the match company interviewed said that graduates from the top schools tend to be impatient for promotion to managerial position and exhibit less love of machine.
68. The next table (22) shows the samples’ rating of their employees’ competence, analytical ability, problem solving ability, creativity and other desirable traits by their HEI background. The graduates from UP Diliman have a generally higher rating in most of the non-cognitive skills than the graduates of De la Salle University. This is seen to be the school of the rich. The graduates from other HEIs such as University of Santo Tomas, Adamson University and Technological University of the Philippines have lower rating. For instance, NXP rates the graduates of Adamson University as below average in competence and analytic ability while GMA, the largest news and entertainment network rates them average in these abilities. On the whole, the companies have a generally positive assessment of the quality of the top universities and their graduates. This finding seems inconsistent with the finding from the writer’s interview and from the COMSTE report. The CHED sample is too small to make any generalization. The COMSTE reports were written by teams that represent industry, academe and government. They base their report on consultations with industry leaders and is more representative than the CHED sample of 5 firms.
14. COMSTE Science and Technology Plan

69.COMSTE 2009 Annual Report addressed the following sectors to be developed through research and technology application – energy, ICT, food and agriculture, health and education.
70. Energy -The report reviews available energy resources and the current state of technology applied and suggests measures for tapping new sources and applying new technologies. The country has large reserves of coal and biomass materials. It is supposed to sit on geothermal power. This has been tapped but there are more areas waiting for development. More serious R&D in biomass technology is needed. The COEs in agriculture are to be directed to acquire expertise in biomass science and technology . Solar power is being piloted in the North but on a project basis supported by foreign grants. Wind power is being similarly piloted. COMSTE recommends a more focused and adequately financed R&D program for developing alternative energy sources. Current research on energy is spotty and poorly funded.
71. Food and Agriculture – This is a critical sector to develop since a large proportion of the population is still dependent on its output and its productivity can be raised through infrastructure and technological change. Rural families which are largely dependent on agriculture comprise 52% of the total. Rural poverty is much higher in rural areas than in urban areas. The poverty incidence is 44% among farmers and 50% among fishermen. The country’s progress in poverty alleviation would depend much on agriculture’s performance given the high poverty incidence among farmers and fishermen and the whole rural areas and the fact that it supplies a large proportion of the poor’s consumption expenditure, close to 60%. The average share of food in total consumption is more than 40%. Increasing food supply would dampen food inflation and raise the real income of the poor. It will also stimulate manufacturing development as rural demand for industrial goods will increase.
72. This sector is in a strong position to benefit from technological change considering the presence of a large number of COEs in agriculture. It had been given high priority in the establishment of SUCs as the government has tried to pursue self-sufficiency in food. There are agriculture COEs in several regions from the North to Mindanao. Most agricultural HEIs are public since the field is not very popular with college students. Among government agencies, the Department of Agriculture has the largest number of researchers. However, the COMSTE team for the sector finds that R&D is poorly organized and not very productive. The Department employs more than a thousand extension workers. But they have not been effective in introducing new technologies and the sector’s productivity has remained lower than in neighboring economies. Politicians’ rhetoric favoring farmers has not been supported by technological improvements, infrastructure investment and R&D. Consequently the country’s productivity in major crops such as rice, coconut, corn and sugar is substantially below Japan,

Korea, Malaysia and China. There are opportunities for increasing productivity through innovations and investment in infrastructure. After a discussion on the state of agriculture, the COMSTE team for the sector changed its focus toward export crops such as crops such as pomelo, bananas and pineapples, not at staple foods. It argues that their growth would pull up the other crops. This is a debatable recommendation considering that the traditional crops comprise a large proportion of the sector’s value added and are cultivated by the great majority of farmers in different areas of the archipelago. Moreover, the cultivation of export crops is in hands of large farmers including MNC plantations. Focusing on the staples would directly benefit larger population and alleviate poverty more significantly than concentrating on export fruits.
73. The presence of several agricultural COEs and researchers in the government and in the COEs bode well for innovations in agriculture. COMSTE finds very inefficient organization of R&D offices and researchers in agriculture. Research is not well focused and organized and most of funds go to unorganized researches in the Department of Agriculture’s numerous extension offices. They have not shown much research output. The COE’s research output is, however, not effectively disseminated to farmers and fishermen. So we have poor quality researches in scattered agriculture offices with the good research output stocked in HEI libraries and laboratories. Needed reforms would involve raising financial support for R&Ds and improving its organization and dissemination.
74. Health Sector -The COMSTE report on the health sector is rather thin and focused on the application of IT for improving access to diagnostic and testing services. Much more effort and resources are needed for improving the quality and quantity of health services and facilities than in providing IT connection between patients and doctors. The quality of health education requires much improvement. Note there are only 3 COEs in medicine and many medical schools are run for profit. There are critical shortages of hospital facilities especially for the poor. Production of low-cost generic drugs is a challenge. Health care has always obtainedvery small budget share, now less than 5%. The devolution of responsibility from the national to local government not worked as effectively as expected. Local governments vary in degree of efficiency and integrity in delivering health care, some more efficient than before the devolution, others not. The capacity of the few good public general hospitals in Metro Manilaand in other capital cities has been increasing strained due to rising population.
15. Concluding Remarks
75. There is greater awareness on the part of the executive and legislative bodies about the poor state of the country’s innovation system and the role the NIS plays in national development. The concern led to the creation of COMSTE and the drawing of the Engineering Research and Development for Technology (ERDT) plan for a consortium of 8 top HEIs in 2007.

The ERDT is drawn by a panel with representation from line departments such as the Department of Industry and Trade, academe and business leaders. The ERDT scholarship and research program is to benefit a consortium of the 8 best engineering HEIs. COMSTE was given ample funds for assessing the state of the country’s S&T capabilities and makingrecommendations for their development. UP College of Science received a lump-sum allocation of P5.6 Billion for infrastructure development, research and scholarships. The infrastructure development comprises some buildings and laboratory facilities.
76. COMSTE, DOST and UP College of Science and UP College of Engineering have been working somewhat independently of each other although the COMSTE and ERDT teams have overlapping representatives. COMSTE have come up with recommendations for priority production sectors. It focused on the sectors to be developed. But it neglected to link sectoral development to NIS development. Who are to do R&D, in which HEIs and how much financial support would they need? These need to be integrated into a single set of inter-related recommendations for long term financing, strategies for capacity building through scholarship, research and infrastructure of each area of concern, organization of key players andinstitutions, time frame. The key players are the S&T COEs, the ERDT panel and consortium of 8 HEIs. Their specific roles have to be defined. A schedule of activities has to be drawn since not all the recommended measures can be simultaneously implemented.
77. No substantive reform of HE and its role in the NIS can be implemented without reforming the financing of SUCs. More than 95% of HE subsidy has gone to SUCs which provides virtually free education to all their students irrespective of academic ability, performance, socio-economic background and academic program. Rich and poor students are equally subsidized except in the University of the Philippines which applies a socialized tuition scheme.The SUCs have crowded out most HE programs for they have absorbed more than 95% of the budget for HE. CHED and DOST have been allocated less than 3% of education budget and are constrained from implementing an effective program for NIS development. Both make do with half measures as seen in the relatively small scholarship and research programs they could harness. Development the NIS entails strengthening the quality of academic and research capabilities of a critical number of HEIs. Large sustained financial support for ERDT and the UP College of Scienc is needed. The S&T CODs have to be developed into COEs to further increase the output of research and advanced instruction in the whole system. Funds are needed toimprove library and laboratory facilities in all the COEs and CODs. Access to internet-based journals has to be provided all cooperating HEIs. Currently, even UP does not have internet access to all major journals. The support that was recently given to UPCS and UPCE and COMSTE are good starting points for developing the NIS. A well thought out operational plan for NIS development needs to be drawn by DOST, CHED, UPCS, UPCE and the consortium of ERDT schools. The plan should fan out to a single bill for legislation. Given the dismal state of

the NIS, drastic reform and massive financing are required to achieve the development of a decent NIS.

References
Abrenica, J and G. Tecson (2003). Can the Philippines ever catch up?, Competitiveness, FDI and Technological Activity in East Asia, Sanjaya Lall and Shurijo Urata, eds., Edward Elgar,Cheltenham, UK, Northampton, MA,USA: Edward Elgar
Asian Development Bank (2006) Philippines: Critical Development Constraints, Manila
Austria, M. ( 2000). Competitiveness of the Philippine IT Industry, What lies ahead, Journal of Philippine Development, Vol.XXVII,No. 2,Second Semester,2000
Boskin,M.J. and L. J.Lau (1992). Capital, Technology and Economic Growth, Technology and the Wealth of Nations, N.Rosenberg, R. Landau and D. C.Mowery, eds. Stanford University Press, Stanford, California
Canlas,D, M.E.Khan and J.Zhuang (2009) Overview and Synthesis, Diagnosing the Philippine Economy Toward Inclusive Growth, Canlas,D, M.E.Khan and J.Zhuang, eds., Asian Development Bank
Cororaton,C (2002) Total Factor Productivity in the Philippines: Is What We Know about the Poor Robust:, C.M. Edmonds, ed. Reducing Poverty in Asia: Emerging Issues in Growth, Targeting, and Measurement. Cheltenham: Edward Elgar.
Cororaton,C.B (2000) Technological Innovations in Japan and S&T Experiences in the Philippines: Drawring Policy Lessons for the Philippines, Discussion Paper Series No. 2001-08, Philippine Institute for Development Studies
Lim,J.A. (2009). Macroeconmic Management, Chapter 4 and Trade, Investment and Domestic Production, Chapter 5, Diagnosing the Philippine Economy Toward Inclusive Growth, Canlas, D., M.E. Khan and J.Zhuang, eds., Asian Development Bank
J.A. Magpantay (1998). Beyond 2000: Assessment of the Economy and Policy Recommendations –Social Sector Dealing with Technology Policy, Philippine Institute for Development Studies Discussion Paper Series No. 98-08
Magtibay-Ramos,N.,G. Estrada and J. Felipe 2008. An Input-Output Analysis of Philippine BPO Industry,Asia Pacific Economic Literature,
R.Nelson (1992). What Is “Commercial” and What Is “Public” Technology, and What Should Be? Capital, Technology and Economic Growth, Technology and the Wealth of Nations, N. Rosenber, R.Landau and D.C. Mowery,eds. Stanford University Press, Stanford,California
Tan,E.A. (2009) Supply Response of Filipino Workers to World Demand, International Organization for Migration, Makati City
Tan, E.A. (2003). College Fee Structure and Philippine Inflation, Philippine Institute for Development Studies, Makati City

Tan, E.A. (2003) Access of the Poor to Higher Education, paper prepared for the Asian Development Bank.
Official Documents:
Department of Science and Technology National Science and Technology Plan, 2002-2020,
Compendium of Science and Technology Statistics, June,2007
The Commission on Science and Technology Panel Reports on
1. Science & Mathematics Education
2. Agriculture and Food
3. Energy
4. IT and IT-Enabled Industries
5. Health
UP College of Science
UP College of Engineering
Commission on Higher Education
National Statistics Office: Annual Survey of Establishment
National Statistical Coordinating Baord Yearbook of Statistics

Table 1. Share of firm rating constraints to operation
IndicatorPhilippines
AllEcozone Exporter Domestic
SmallYes No Yes No Yes No
Telecommunications 9.8 23.2 9.0 17.5 7.3 8.6 19.8Electricity 33.3 44.1 32.6 39.7 31.2 33.0 35.2 32.4Transport 18.2 34.2 17.3 24.7 16.1 16.9 28.6 15.2Access to land 15.5 24.7 15.0 15.4 15.6 15.3 17.2 13.5Tax rates 32.1 28.4 32.3 32.8 31.9 32.8 26.4 31.6Tax administration 26.0 33.8 25.5 31.5 24.2 26.1 25.1 24.8Customs and trade regulations 19.5 46.1 17.9 36.7 13.9 17.0 39.7 14.Labor regulations 24.1 44.7 22.9 33.0 21.3 23.1 33.0 21.8Skills and education of available workers 10.8 20.9 10.2 20.7 7.6 9.5 20.0 10.2Business licensing and operating permits 12.6 17.5 12.3 15.0 11.8 12.4 14.0 11.5Access to financing 14.5 15.7 14.4 12.2 15.2 14.9 11.4 15.0Cost of financing 24.3 29.3 24.0 24.8 24.1 24.8 20.2 25.0Regulatory policy uncertainty 29.0 35.7 28.6 33.9 27.5 28.6 32.4 25.8Macroeconomic instability 40.0 43.7 39.8 40.9 39.8 40.6 35.8 38.2Corruption 34.4 39.6 34.1 44.9 31.0 33.3 43.3 32.1Crime, theft and Disorder 26.3 46.8 25.1 35.4 23.4 25.5 33.2 25.4Anticompetitive or informal practices 24.1 29.7 23.8 28.7 22.6 24.4 21.3 24.4
Source: ADB Improving the Investment Climate in the Philippines

Table 2. Local Business Environment FactorsStrengths Major Concerns
(a score of 60% or more is significant) (a score of 30% or more is significant)Factors 2004 2005 2006 Factors 2004 2005 2006
Availability of Low-Cost Labor - - 71% Laws and Regulations 48% 63% 52%Availability of Trained Personnel 73% 63% 67% Corruption 91% 88% 77%Office Lease Cost - - 59% Local Protectionism 49% 46% 39%Housing Cost - - 63% Tax Structure 49% 56% 45%
Infrastructure 69% 68% 50%
Availability of Raw Materials 20% 42% 35%
Source: American Chamber of Commerce

Table 3: Trend in Philippine Rankings in Global Competitiveness Factors 2003-2007
Factor 2003 2004 2005 2006 2007
Global Competitiveness Index Rank
66 74 73 71 71
1. Basic Requirements 82 81 84 93
(a) Institutions 85 75 89 88 95
(b) Infrastructure 87 90 88 94
(c) Macro-economy 60 61 58 62 77
(d) Health & primary 77 82 86
Education
2. Efficiency Enhancement
64 63 63 60
(a) Higher Education & 61 63 62
Training
(b) Market Efficiency 64 57
(b.1) Goods Market efficiency
64
(b.2) Labor Market efficiency
100
(c) Technological readiness
56 63 67 61 69
3. Innovation Factors 67 56 66 65
(a) Business sophistication
66 43 59 55
(b) Innovation 76 86 79 79
Source: Global Competitiveness Report, World Economic Forum, 2003-2004; 2004-2005; 2005-2006; 2006-2007; 2007-2008

Table 4. WEF's Global Competitiveness Rankings (by Factor) of Selected Countries, 2007
Factor
Sing
apor
e
Taiw
an
Kore
a
Mal
aysi
a
Thai
land
Indi
a
Indo
nesi
a
Chin
a
Phili
ppin
es
Global Competitiveness Index Rank 7 14 11 21 28 48 54 14 71
1. Basic Requirements 3 19 14 21 40 74 82 44 93 (a) Institutions 3 37 26 20 47 48 63 77 95 (b) Infrastructure 3 20 16 23 27 67 91 52 94 (c) Macro-economic Stability
24 26 8 45 30 108 89 7 77 (d) Health & primary Education
19 6 27 26 63 101 78 61 862. Efficiency Enhancers 6 17 12 24 29 31 37 45 60 (a) Higher Education & Training
16 4 6 27 44 55 65 78 62 (b) Goods Market Efficiency
2 17 16 20 34 36 23 58 64 (c) Labor Market efficiency
2 22 24 16 11 96 31 55 100 (d) Technological readiness
12 15 7 30 45 62 75 73 693. Innovation Factors 13 10 7 19 39 26 34 50 65 (a) Business sophistication
16 14 9 18 40 26 33 57 55 (b) Innovation 11 9 8 21 36 28 41 38 79Source: Global Competitiveness Report, World Economic Forum, 2007-2008
Table 5. Average Growth Rates and Share in the Output of Major Industrial Sector 1986-2007
Panel A.
YearsAverage Growth Rates Share in Total Outpu
Agriculture Industry Manufacturing Services All Agriculture Industry Manufacturing1960-1990 2.49 5.67 5.89 6.07 5.08 23.60 35.20 25.301991-1995 1.47 2.19 2.07 2.58 2.19 22.60 34.60 25.101996-2000 2.27 4.06 3.17 4.74 3.97 20.40 35.20 24.802001-2007 3.89 3.75 4.24 6.40 5.01 19.40 33.20 24.101986-2007 3.00 4.22 4.10 5.55 4.57
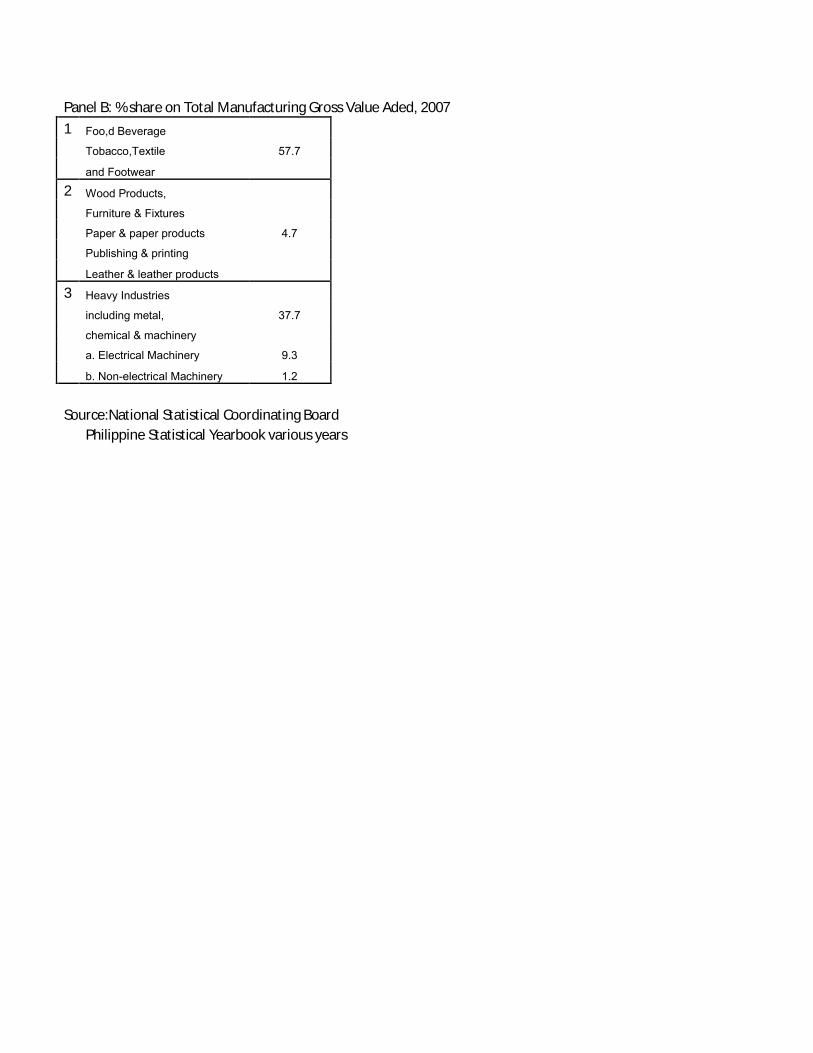
Panel B: % share on Total Manufacturing Gross Value Aded, 20071 Foo,d Beverage
Tobacco,Textile 57.7
and Footwear
2 Wood Products,
Furniture & Fixtures
Paper & paper products 4.7
Publishing & printing
Leather & leather products
3 Heavy Industries
including metal, 37.7
chemical & machinery
a. Electrical Machinery 9.3
b. Non-electrical Machinery 1.2
Source:National Statistical Coordinating BoardPhilippine Statistical Yearbook various years

Table 6. Number and Distribution of Establishments, Total Employment in Micro, SME and large Enterprises, 2003
Industry Sector
Number of Establishments Employment
Total
% of
total Micro
% of sector total SMEs
% of sector total Large
% of sector total Total
% of
total Micro
% of sector total SMEs
sector
Agriculture, hunting and Forestry 5,221 1 3,141 0 1,931 3 149 4 160,000 2 11,859 1 64,705Fishery 1,834 0 984 0 818 1 32 1 37,917 1 3,454 0 20,327Mining and quarrying 533 0 320 0 197 0 16 0 23,605 0 1,509 0 8,774Manufacturing 129,849 15 112,458 15 15,704 22 1,687 45 1,959,134 30 366,210 17 538,968Electricity, gas and water 1,507 0 629 0 757 1 121 3 99,774 2 2,674 0 38,702Construction 4,432 1 2,575 0 1,716 2 141 4 189,868 3 10,942 0 61,038Wholesale and retail trade 442,312 53 421,488 55 20,465 28 359 10 1,768,269 27 1,125,461 51 456,237Hotels and restaurants 90,637 11 82,873 11 7,690 11 74 2 502,155 8 271,376 12 187,678Transport, storage and communications 16,099 2 11,892 2 4,012 6 195 5 317,239 5 43,810 2 120,325Financial intermediation 25,258 3 19,136 3 6,003 8 119 3 277,039 4 79,702 4 118,243Real estate, renting and business activities 41,482 5 35,952 5 5,082 7 448 12 491,483 8 107,876 5 163,573Education 9,731 1 5,137 1 4,360 6 234 6 285,274 4 21,531 1 153,255Health and social work 28,606 3 26,994 4 1,507 2 105 3 163,084 3 60,812 3 52,683
Other community, social and personal service activities 41,513 5 38,994 5 2,454 3 65 2 199,953 3 107,062 5 57,589
Total 839,014 100 762,573 100 72,696 100 3,745 100 6,474,794 2,214,278 2,042,097
Source: National Statistics Office, Survey of Establishment
Table 7. Employment, Value added per worker of Share in output in Manufacturing of SME and Large Establishments, 1994, 2003
Value added contribution
Value added contribution % Value added per worker
1994 2003 1994 2003
SMEs Large SMEs Large SMEs Large SMEs Large
Total 23 77 21 79 0.110 0.196 0.097 0.211
Food processing 35 65 26 74 0.205 0.173 0.124 0.263
Food manufacturing 28 72 34 66 0.114 0.174 0.089 0.185
Beverages 17 83 18 82 0.711 0.494 0.302 0.535
Tobacco 0 100 0 100 0.044 0.727 0.052 0.475
Textiles 26 74 44 56 0.063 0.075 0.070 0.074
Wearing apparel except footwear 37 63 31 69 0.076 0.058 0.040 0.046
Leather and leather products 35 65 12 88 0.030 0.040 0.088 0.137
Leather footwear 32 68 62 38 0.021 0.044 0.024 0.025

Wood and cork products 43 57 58 42 0.057 0.062 0.041 0.044
Furniture (wood & metal) 49 51 65 35 0.042 0.048 0.067 0.062
Paper and paper products 25 75 46 54 0.100 0.218 0.139 0.160
Printing and publishing 49 51 54 46 0.066 0.203 0.042 0.184
Industrial chemicals 62 38 65 35 0.320 0.358 0.327 0.420
Other chemicals 16 84 22 78 0.209 0.669 0.177 0.580
Petroleum refineries 0 100 0 100 0.000 4.438 0.000 28.643
Petroleum and coal products 100 0 100 0 0.100 0.000 0.280 0.000
Rubber products 21 79 30 70 0.062 0.095 0.055 0.091
Plastic products 66 34 50 50 0.125 0.096 0.076 0.085
Pottery, china, and earthenware 13 87 22 78 0.034 0.079 0.102 0.068
Glass and glass products 22 78 26 74 0.180 0.371 0.131 0.204
Cement 0 100 0 100 0.000 0.447 0.562 0.934
Other nonmetallic mineral prods 47 53 56 44 0.078 0.149 0.059 0.195
Iron and steel 25 75 57 43 0.150 0.485 0.142 0.133
Nonferrous metal products 5 95 19 81 0.074 0.578 0.164 0.481
Fabricated metal products 50 50 52 48 0.082 0.110 0.108 0.083
Machinery except electrical 35 65 10 90 0.053 0.105 0.061 0.198
Electrical machinery 9 91 8 92 0.123 0.137 0.121 0.141
Transport Equipment 28 72 19 81 0.182 0.239 0.153 0.375
Professional and scientific eqpt 26 74 7 93 0.159 0.056 0.091 0.110
Furniture of metal (1994 only) 44 56 - - 0.038 0.049 - -
Miscellaneous manufacture 39 61 62 38 0.044 0.066 0.104 0.080
Source: National Statistics Office, Survey of Establishment, 1993, 2003
Table 8. National Budget Appropriation to Education and Department of Science and Technology, 2008
P (Billion) % Total
Basic Education 147 58.68
State Universities/Colleges 96.8 38.64
Technical-Vocational 3.2 1.37
Commission on Higher Education 1.6 0.64
Department of Science and Technology 1.9 0.76
Total 250.5 100
Education and Science Budget / Total Budget Expenditure=20.4Source: Congress National Appropriations Act, 2008

Table 9: Distribution of High School Graduates, Aged 17-25
Enrolled in Tertiary Education by School Type by Income Decile, 1998
Income Decile
Total Voc Tech
SUC Private
Non-Sectarian
Private Sectarian
HS
Graduates
1 1.3 3.5 2.7 0.5 0.1 2.9
2 2.3 3.5 4.2 1.4 0.7 4.3
3 4.1 6.5 7.8 2.4 0.9 6.4
4 6.5 5.1 10.8 4.7 3.7 8.7
5 7.5 9.4 10.8 6 4.6 10.2
6 10.9 14.4 12.9 9.2 106 119
7 12.3 13.2 12.4 13.3 18.9 13.1
8 15.7 17.6 14.2 16 17.5 14.2
9 19.4 16 13.1 23.5 21.2 14.9
10 19.8 11 11.1 23 31.7 13.4
(richest)
100 4.5 32.5 47.4 15.5
100 100 100 100 100 100
Source: National Statistical Office
Annual Poverty Indicator Survey
Tabulated in Edita A. Tan, et. al
Access of the poor to Higher Education

Table 10. Higher Education Graduates by Discipline Group, Program level and Degree: 2003/04
Discipline Group Pre-Baccalaureate Baccalaureate Post-Baccalaureate Master's DoctoralAgricultural, Forestry, Fisheries, Vet Med. 2,390 10,269 174 258 63Architechtural and Town Planning 279 3,091 62 30Business Admin. And Related 9,050 86,094 340 5,315 320Education and Teacher Training 830 64,415 382 5,335 889Engineering and Technology 10,633 39,632 103 305 6Fine and Applied Arts 568 1,076 18General 672 2,884 51Home Economics 52 990 2 46 10Humanities 13 4,458 119 77Law and Jurisprudence 2,670 2Mass Communication and Documentation 6 4,541 41 119 5Mathematics and Computer Science 9,933 25,172 53 203 6Medical and Allied 14,562 26,403 7 712 4Natural Science 4,042 1 153 13Religion and Theology 115 790 504 18Service Trades 226 2,187Social and Behavioral Science 172 12,792 24 269 27Trade, Craft and Industrial 2,282 1,296 1Other Disciplines 2,646 23,126 9 403 84
54,429 315,928 1,198 13,843 1,522
Source:Commission on Higher Education
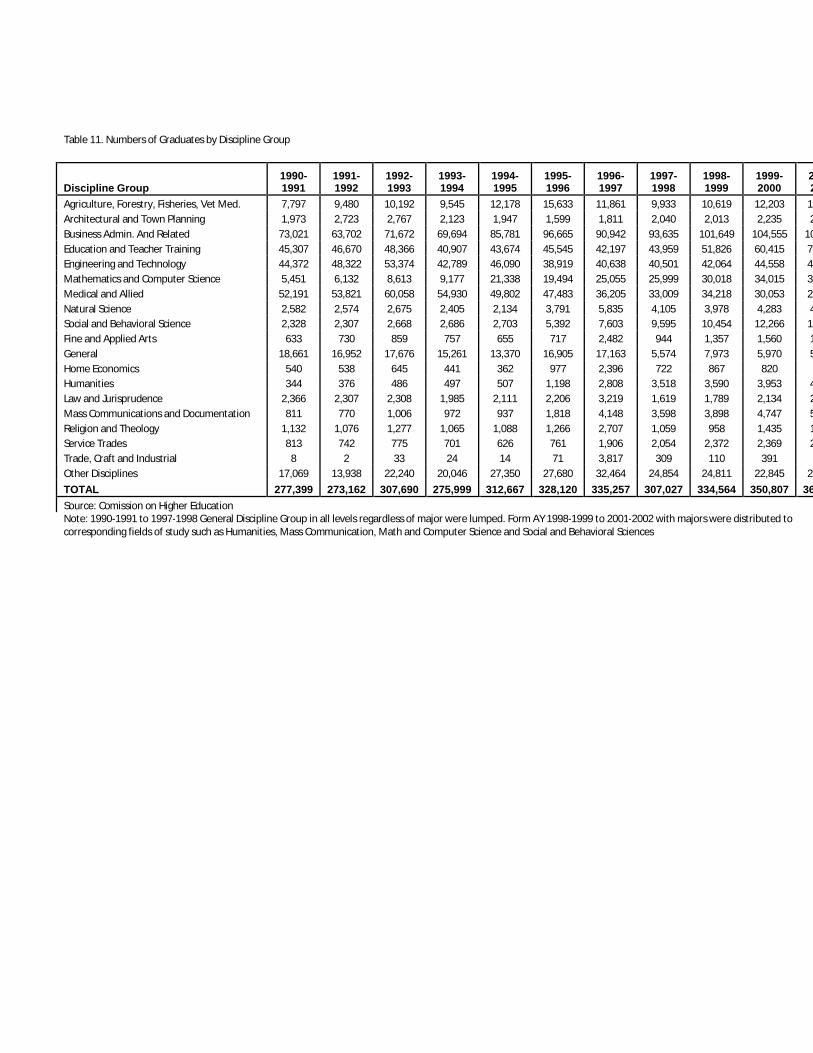
Table 11. Numbers of Graduates by Discipline Group
Discipline Group1990-1991
1991-1992
1992-1993
1993-1994
1994-1995
1995-1996
1996-1997
1997-1998
1998-1999
1999-2000
20002001
Agriculture, Forestry, Fisheries, Vet Med. 7,797 9,480 10,192 9,545 12,178 15,633 11,861 9,933 10,619 12,203 13,172Architectural and Town Planning 1,973 2,723 2,767 2,123 1,947 1,599 1,811 2,040 2,013 2,235 2,541Business Admin. And Related 73,021 63,702 71,672 69,694 85,781 96,665 90,942 93,635 101,649 104,555 106,559Education and Teacher Training 45,307 46,670 48,366 40,907 43,674 45,545 42,197 43,959 51,826 60,415 71,349Engineering and Technology 44,372 48,322 53,374 42,789 46,090 38,919 40,638 40,501 42,064 44,558 45,041Mathematics and Computer Science 5,451 6,132 8,613 9,177 21,338 19,494 25,055 25,999 30,018 34,015 33,059Medical and Allied 52,191 53,821 60,058 54,930 49,802 47,483 36,205 33,009 34,218 30,053 27,296Natural Science 2,582 2,574 2,675 2,405 2,134 3,791 5,835 4,105 3,978 4,283 4,770Social and Behavioral Science 2,328 2,307 2,668 2,686 2,703 5,392 7,603 9,595 10,454 12,266 13,395Fine and Applied Arts 633 730 859 757 655 717 2,482 944 1,357 1,560 1,323General 18,661 16,952 17,676 15,261 13,370 16,905 17,163 5,574 7,973 5,970 5,238Home Economics 540 538 645 441 362 977 2,396 722 867 820Humanities 344 376 486 497 507 1,198 2,808 3,518 3,590 3,953 4,236Law and Jurisprudence 2,366 2,307 2,308 1,985 2,111 2,206 3,219 1,619 1,789 2,134 2,214Mass Communications and Documentation 811 770 1,006 972 937 1,818 4,148 3,598 3,898 4,747 5,140Religion and Theology 1,132 1,076 1,277 1,065 1,088 1,266 2,707 1,059 958 1,435 1,052Service Trades 813 742 775 701 626 761 1,906 2,054 2,372 2,369 2,342Trade, Craft and Industrial 8 2 33 24 14 71 3,817 309 110 391Other Disciplines 17,069 13,938 22,240 20,046 27,350 27,680 32,464 24,854 24,811 22,845 23,244TOTAL 277,399 273,162 307,690 275,999 312,667 328,120 335,257 307,027 334,564 350,807 363,640
Source: Comission on Higher EducationNote: 1990-1991 to 1997-1998 General Discipline Group in all levels regardless of major were lumped. Form AY 1998-1999 to 2001-2002 with majors were distributed to corresponding fields of study such as Humanities, Mass Communication, Math and Computer Science and Social and Behavioral Sciences

Table 12 Number of Centers of Excellence and Centers of Development
COE CODScience and Mathematics
Biology 4 9Chemistry 6 5Physics 4 4Mathematics 5 4Marine Science 1 6Agriculture,Fisheries & Forestry 17 3Geology 1 2Information Technology 9 24
Total 47 57
EngineeringChemical 1 9Industrial/Mechanical 1 18Electrical 1 15Civil 0 19Geodetic 1 3Electronics and Communication 1 7Metallurgical 1 2Ceramics 0 2Mining 0 2Sanitary 0 2Agriculture 3 1Computer 2 5
Total 11 85
Architecture 2 2Social Sciences 9 0Teacher Training 18 3Health Fields
Medicine 3 1Nursing 8 0
Linguistics and Philosophy 13 0Business 0 14Communications Arts 3 0Distance Education 1 0InformationTechnology Education 0 24Music 2 0
TOTAL 117 186Source: Commission on Higher Education
Table 13. Enrollment and Graduates in Centers of Excellence, By Category
Institution Category Enrollment Graduates
Undergraduate
UP National Inst of Physics Level 1 MS
Ph.D.
Level 2 Undergraduate
DLSU Physics Department MS 14
Ph.D. 1
Undergraduate
Ateneo Physics Department Level 2 MS
Ph.D. 0
Level 2 Undergraduate 55 4

MSU-IIT MS
Ph.D. 6 0
Undergraduate
University of San Carlos -Physics
Level 3 MS
Ph.D.
Undergraduate
UP Baguio - Physics Level 3 MS
Ph.D.
Level 3 Undergraduate 71 7
UP Los Banos – Physics MS
Ph.D.
Undergraduate 24
Siliman University – Physics Level 5 MS
Ph.D.
Undergraduate 280 34
UP Diliman - Mathematics Level 1 MS
Ph.D.
Level 2 Undergraduate 50+ 10+
Ateneo – Mathematics MS 15-Oct
Ph.D. 1
Level 2 Undergraduate
DLSU – Mathematics MS 200/yr 50/yr
Ph.D. 5
Undergraduate
MSU-IIT Mathematics Level 2 MS
Ph.D. 19
Undergraduate 48
MPSC - Mathematics Level 2 MS 65
Ph.D. 16
Undergraduate
University of San Carlos -Mathematics
Level 4 MS
Ph.D.
Undergraduate
UP Los Banos - Mathematics Level 2 MS 15 1
Ph.D. 7
Level 3/ Level 2
Undergraduate 100
UP Baguio – Mathematics Division
MS 12
Ph.D.
Undergraduate
UP Diliman – Civil Engineering
Level 2 MS
Ph.D.
Undergraduate
DLSU – Civil Engineering Level 2 MS <10 1-2/yr
Ph.D.
Undergraduate
Adamson – Civil Engineering Level 5 MS
Ph.D.
Undergraduate 530
TUP – Civil Engineering Level 3 MS 48
Ph.D.

Undergraduate 670
UST – Civil Engineering Level 4 MS
Ph.D.
Undergraduate 500
UP Diliman – Industrial Engineering
Level 4 MS 46
Ph.D.
Undergraduate 393 90
DLSU – Industrial Engineering
Level 3 MS 17
Ph.D.
Undergraduate 782
Adamson – Industrial Engineering
Level 5 MS
Ph.D.
Undergraduate 532
UST – Industrial Engineering Level 5 MS
Ph.D.
Undergraduate
DLSU – Mechanical Engineering
Level 2 MS 13 8
Ph.D. 300 ave. 330
Undergraduate
UP Diliman – Mechanical Engineering
Level 4 MS 20
Ph.D.
Undergraduate
UST – Mechanical Engineering
Level 5 MS
Ph.D.
Undergraduate
Adamson – Mechanical Engineering
Level 5 MS
Ph.D.
Undergraduate 600
TUP – Mechanical Engineering
Level 4 MS
Ph.D.
Undergraduate
UP Diliman – EE, ECE and Computer Engineering
Level 2 MS
Ph.D.
Undergraduate 900-1100 100
Adamson – Electrical Engineering
Level 4 MS
Ph.D.
Undergraduate 1100 150
Adamson – Electronics and Communication Engineering
Level 5 MS
Ph.D.
Undergraduate
Adamson – Computer Engineering
Level 5 MS
Ph.D.
Undergraduate 300 46
UST – Electrical Engineering Level 5 MS
Ph.D.
Undergraduate
UST – Electronics and Level 4 MS

Communication Engineering
Ph.D.
Undergraduate 600
TUP – Electrical Engineering Level 4 MS
Ph.D.
Undergraduate
DLSU – Electronics and Communication Engineering
Level 2 MS
Ph.D.
Undergraduate
University of the Cordilleras – Sanitary Engineering
Level 5 MS
Ph.D.
Undergraduate
University of Baguio –Sanitary Engineering
Level 5 MS
Ph.D.
Undergraduate
UP Diliman – Mining Engineering
Level 3 MS
Ph.D.
Undergraduate
Mapua – Mining Engineering Level 5 MS
Ph.D.
Undergraduate 107
UP Diliman – Metallurgical Engineering
Level 2 MS
Ph.D.
Undergraduate
Mapua – Metallurgical Engineering
Level 4 MS
Ph.D.
Table 14: Centers of Excellence in Top 5 Universities
Field Schools
University of the Philippines - Diliman
Ateneo de Manila University De La Salle University
University of Santo Tomas
Mindanao State University -Iligan
Mathematics ● ● ● ●
Physics ● ● ● ●
Biology ● ● ● ●
Chemistry ● ● ● ● ●
Marine Science ●
Medicine ●
Nursing ●
Engineering ●
Industrial/
● Mechanical
Electrical ●
Geodetic ●

Chemical ●
Electronic & Communication ● ●
Metallurgical ● ●
Architecture ●
Political Science ●
Economics ●
Psychology ● ●
Sociology ● ●
Anthropology ●
Philosphy ● ●
English ● ● ●
Literature ● ● ● ●
Journalism ●
Filipino ● ●
Music ● ●
Total 24 10 9 9 4
Universtity of the Philippines - Los BanosBiologyChemistryMathematics
University of the Philippines - ManilaMedicineNursing
Table 15: University of the Philippines College of Science Enrollment and Graduates by Field by Degree, 2005-2006 to 2008-2009
2008-2009 2009-2010
A. BS Enrollment
Applied Physics 157 168
Biology 332 354
Chemistry 299 309
Geology 116 161
Mathematics 369 351
MBB 129 125
Physics 118 96
Non-majors 47 45
Total 1567 1609
B. Masters Degree Graduates Enrollment Graduates
1984-1995 1995-2008 1984-2008 2009-2010 2008-2009
IB 105 98 201 41 11
IC 31 71 102 104 7
I Math 135 204 339 122 29
NIGS 29 48 77 46 3
MSI 41 48 89 53 2
IESM - - - 65 -
NIMBB 2 19 21 29 0
MSEP 0 23 23 26 22
NIP 34 132 166 2
ESO 0 79 79 0
DMO 44 22 66 63 2
Total 419 744 1163 549
Per Year Graduates 38.1 49.6 44.7
C. Ph.D Degree Graduates Enrollment Graduates
1984-1995 1996-2008 Total 2009-2010 2008-2009
IB 50 31 81 11 1
IC 9 16 25 6

I Math 17 43 60 37 5
NIGS 1 2 3 1
MSI 0 12 12 31
IESM 25
NIMBB 2 13 15 12 1
MSEP 0 1 1 4
NIP 33 2
ISP 14 16 30
DMO 25 16 41
Total 118 150 268 160 8
Per Year Graduates 10.7 10 10.3
Source: UP College of Science
Table 16. Faculty Profile and Research Output of UP College of Science, 2008
Panel A. Faculty ProfileCS Unit Regular Faculty Items Total Faculty Members PhD Faculty
Biology 38 32 17
Chemistry 49 65 26
IESM 6 9 9
Mathematics 75 80 26
Marine Science Institute 18 16
16
NIMBB 10 11 8
NIGS 21 24 17
Physics 36 52 25
Dean’s office 1 1
Total 244 290 144
Panel B. ISI Publication Output of the College of ScienceINSTITUTES – COLLEGE OF SCIENCE
YEAR IB Philippines IESM IM NIMBB MSI NIGS NIP NSRI CS TOTAL Philippines
(38 items) (9)
(78)
(10)
(17)
(21)
(36)
(14 REPS)
2000 3 9 0 5 5 14 11 21 1 65 387
2001 2 8 1 1 1 24 8 20 0 58 366
2002 4 9 1 3 4 21 6 31 2 79 451
2003 8 6 3 5 4 23 10 21 3 81 467
2004 9 8 2 4 2 13 12 23 0 72 475
2005 8 9 1 3 3 14 16 16 1 71 520
2006 5 3 1 2 4 15 9 14 53 780
2007 9 0 0 4 1 8 7 10 39 66
2008 12 3 3 10 2 56 26 33 2 145 771
TOTAL 60 55 12 37 26 188 105 189
Source: UP College of ScienceSource: http://ovidsp.tx.ovid.com/spa/ovidweb.cgi (2000-2007 data); SCOPUS (ADMU Rizal Library subscription)
Note: IESM = Environmental ScienceNIMBB = Molecular Biology and BiotechnologyNIGS = Geology
Table 17. University of the Philippines College of Engineering Enrollment and Graduates by Field by Degree, 2005-2006 to 2008-2009

2005-2006 2006-2007 2007-2008 2008-2009
Enrollment Graduate Enrollment Graduate Enrollment Graduate Enrollment Graduate
A. Diploma, BS
ChE 648 85 631 72 644 97 638 136
CE 438 46 460.5 30 502.5 70 541 62
CS 360.5 66 399 44 439.5 45 488.5 52
EE 84 7 80.5 10 85 7 88 5
ECE 396.5 47 404 43 458.5 57 481.5 57
CoE 316 32 322.5 20 334.5 29 336 34
GE 229.5 55 198.5 62 142.5 53 125 20
IE 486 66 511 51 553 75 539.5 61
ME 183.5 37 255.5 15 314.5 15 360 35
MatE 260.5 51 281 47 269 38 270.5 59
MetE 100 21 110.5 16 99.5 20 113 13
EM 79.5 8 105.5 6 102.5 18 108 8
TOTAL 3590.5 521 3762.5 416 3946 524 4089 542B. Masters Degree
CHE 28.5 2 31.5 5 26.5 2 28 4
CE 90.5 5 93 9 85 14 90.5 9
CS 75.5 10 74 8 69.5 9 104 3
EE 105.5 12 89 14 104 6 100 18
EEE 29.5 0 30.5 0 28 1 12 1
EGY 24 2 26 2 28 1 36.5 1
ENE 88.5 7 79.5 16 80 17 69 13
IE 43.5 4 53 5 54.5 1 53.5 8
MSE 81 7 63.5 6 49.5 5 46 4
ME 20.5 3 16.5 5 15.5 2 15.5 2
MET 8.5 2 6 0 9.5 0 13.5 0
RS 52 0 38.5 1 36.5 4 36.5 4
WR 10 1 10 1 6 1 2.5 0
TOTAL 657.5 55 611 72 592.5 63 607.5 67C. Ph.D Degree
CE 11 0 14.5 0 13.5 0 18.5 1
CHE 11.5 3 9 2 6.5 2 6.5 0
DEEE 0.5 0 2.5 0 2.5 0 2 0
EE 6 0 7.5 1 8 1 8.5 0
EgyE 0 0 0 0 4.5 0 8 0
EnE 0 0 9 1 18 0 29.5 1
MSE 6.5 0 7.5 2 10 2 7 0
TOTAL 35.5 3 50 6 63 5 80 2Source: UP College of Engineering
Table 18. Faculty Profile and Students/Teachers Ratio, College of Engineering and College of Science, 2009
Panel A. Faculty Profile by Field and Degree Earned, College of Engineering 2009
BS % of Total
MS % of Total
PhD % of Total
Total
CHE 14 53.8 6 23.1 6 23.1 26
CE 12 32.4 9 24.3 16 43.2 37
CS 10 37 10 37 7 25.9 27
EEE 12 29.3 22 53.7 7 17.1 41
GE 11 64.7 3 17.6 3 17.6 17

IE 10 52.6 7 36.8 2 10.5 19
ME 5 31.3 8 50 3 18.8 16
MMM 13 61.9 3 14.3 5 23.8 21
Total 87 42.6 68 33.3 49 24 204
Panel B. Student Teacher Ratio
College of Science College of Engineering
Undergraduate/Total Faculty 1530/287 = 5.33 4089/204 = 20.0
Graduate/Total Faculty with Ph.D.
287/149 = 4.9 682/49 = 14.0
Total Enrollment/Total Faculty
2253/287 = 15.7 4777/204 = 23.4
Source: UP College of Engineering; UP College of Science
Table 19: R&D Personnel, 2002, 2003, 2005
Panel A. 2002 2003 2005
Total R&D Personnel (Headcount) 9,325 13,488 14,087
No. of Scientists and Engineers engaged in R&D (Headcount)
7,203 8,866 10,690
Population Size (in Million People) 80.2 81.88 85.26
No. of R&D Personnel per million population 116 165 165
No. of Scientists and Engineers engaged in R&D per million population
90 108 125
R&D Expenditures as % of GDP 0.15 0.14 0.12
Ratio: R&D Expenditure to Population 72 72 74.2
Source: Department of Science& Technology
Compendium of Science and Technology Statistics
Apr-08

Panel B. Scientists by Sector of Employment and Degree Earned, 2003,2005
Classification Total Government Higher Education
State Private
2003 2005 2003 2005 2003 2005 2005
Total Scientists & Engineers in R&D
8,866 7,500 2,557 2,797 3,712 3,185 1,406
With PhD 1,374 1,852 167 211 1,102 1,146 484
MS/MA 2,439 2,818 722 846 1,520 1,273 665
Post BS/BA 991 811 389 407 416 261 127
BS/BA 3,799 1,906 1,228 1,263 664 478 120
Post HS 110 43 31 30 6 11
HS and Below 152 27 20 23 3 4
Not Classified 1 44 16 1 13 10
Source: Department of Science & Technology

Table 20. Number and Amount of R&D Projects Implemented by DOST Agencies by Funding Source 2008
Agency No. of R&D Projects
Funding Source (P Million)
Total Project
Own Budget
Other Gov’t
Source
Private Funding
Foreign Funding
Others
ASTI 24 44.65 0.00 41.72 0.00 2.93 0.00
FNRI 41 81.33 43.08 17.79 11.23 9.24 0.00
FPRDI 117 96.86 3.60 37.95 0.20 55.11 0.00
ITDI 95 167.35 136.70 30.48 0.16 0.00 0.00
MIRDC 164 10.28 7.22 1.60 0.09 0.00 1.37
PNRI 40 34.93 14.45 17.40 0.47 2.61 0.00
PTRI 18 33.76 17.88 12.84 3.04 0.00 0.00
PAGASA 38 146.77 0.00 134.12 0.00 12.66 0.00
PHIVOLCS 13 23.65 12.36 0.00 0.00 11.29 0.00
TOTAL 550 639.59 235.30 293.90 15.19 93.83 1.37
Source: Department of Science and Technology

Table 21: Intellectual Property Rights Granted by Type, 2000-2007
Total Patents Utility Model Industrial Design
Year Number Granted
per Application
Received
Number Granted per Application
Received
Number Granted
per Application
Received
Number Granted per Application Received
Number Number Number Number
A. To Local Inventors
2000 801 0.68 8 0.05 287 0.53 506 1.05
2001 656 0.69 10 0.07 356 0.83 290 0.75
2002 1,110 0.99 12 0.08 428 0.81 670 1.49
2003 1,676 1.3 7 0.04 806 1.68 863 1.29
2004 819 0.64 16 0.1 335 0.58 468 0.87
2005 22 0.01 15 0.01 7 0.01 0 0
2006 599 0.49 24 0.1 282 0.54 293 0.61
2007 212 0.2 29 0.12 715 1.81 468 1.08
B. To Foreign Inventors
2000 858 0.22 566 0.16 1 0.02 291 0.85
2001 1,498 0.53 1,082 0.43 9 0.42 407 1.28
2002 2,158 2 1,113 1.57 47 1.2 998 2.97
2003 2,214 2.77 1,160 2.67 43 2.04 1,011 2.94
2004 2,104 2.31 1,433 3.46 325 17.1 343 0.72
2005 1,644 1.55 1,638 3.99 4 0.14 2 0
2006 1,515 0.42 1,191 0.39 18 0.81 306 0.62
2007 2,708 0.72 1,785 0.54 58 1.81 865 1.99
Source: IPO
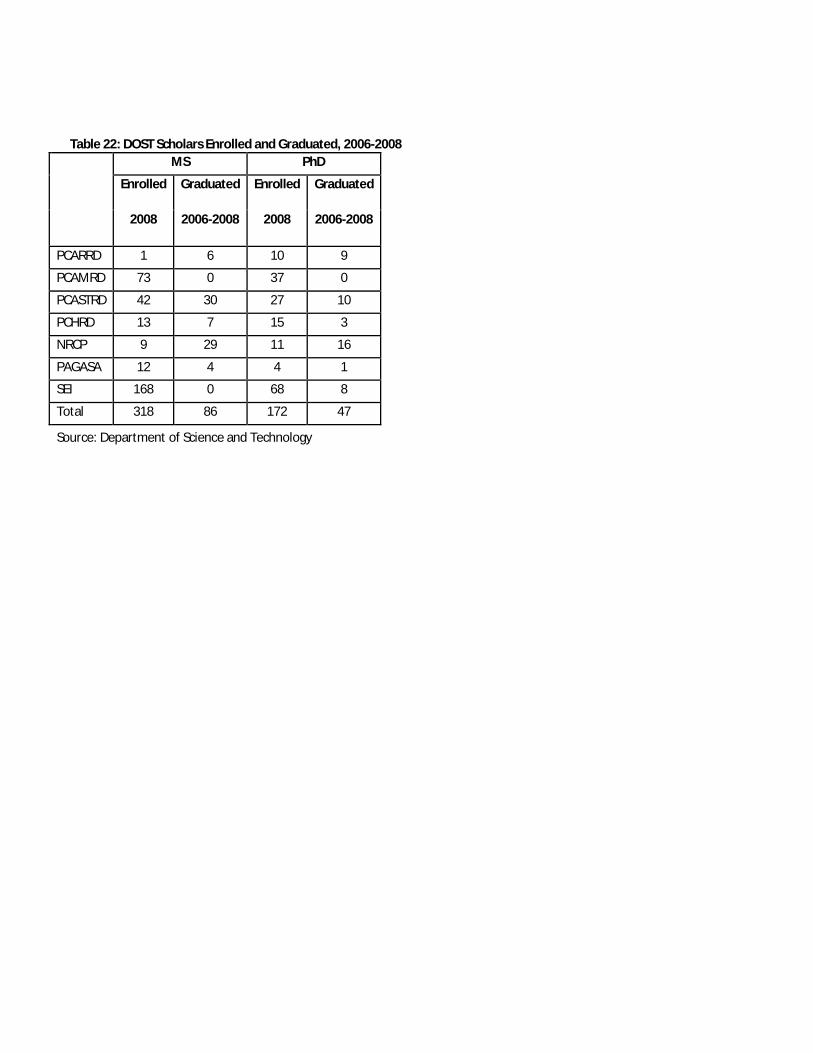
Table 22: DOST Scholars Enrolled and Graduated, 2006-2008 MS PhD
Enrolled Graduated Enrolled Graduated
2008 2006-2008 2008 2006-2008
PCARRD 1 6 10 9
PCAMRD 73 0 37 0
PCASTRD 42 30 27 10
PCHRD 13 7 15 3
NRCP 9 29 11 16
PAGASA 12 4 4 1
SEI 168 0 68 8
Total 318 86 172 47
Source: Department of Science and Technology
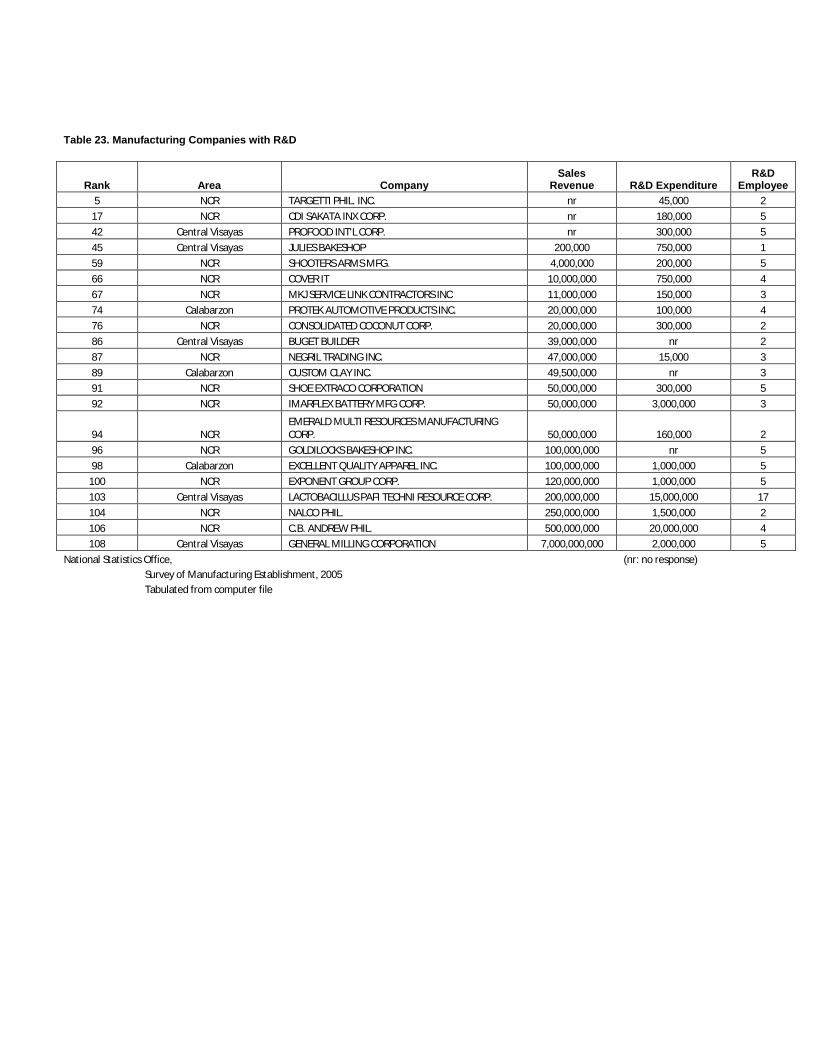
Table 23. Manufacturing Companies with R&D
Rank Area CompanySales
Revenue R&D ExpenditureR&D
Employee
5 NCR TARGETTI PHIL. INC. nr 45,000 217 NCR CDI SAKATA INX CORP. nr 180,000 542 Central Visayas PROFOOD INT'L CORP. nr 300,000 545 Central Visayas JULIES BAKESHOP 200,000 750,000 159 NCR SHOOTERS ARMS MFG. 4,000,000 200,000 566 NCR COVER IT 10,000,000 750,000 467 NCR MKJ SERVICE LINK CONTRACTORS INC 11,000,000 150,000 374 Calabarzon PROTEK AUTOMOTIVE PRODUCTS INC. 20,000,000 100,000 476 NCR CONSOLIDATED COCONUT CORP. 20,000,000 300,000 286 Central Visayas BUGET BUILDER 39,000,000 nr 287 NCR NEGRIL TRADING INC. 47,000,000 15,000 389 Calabarzon CUSTOM CLAY INC. 49,500,000 nr 391 NCR SHOE EXTRACO CORPORATION 50,000,000 300,000 592 NCR IMARFLEX BATTERY MFG CORP. 50,000,000 3,000,000 3
94 NCREMERALD MULTI RESOURCES MANUFACTURING CORP. 50,000,000 160,000 2
96 NCR GOLDILOCKS BAKESHOP INC. 100,000,000 nr 598 Calabarzon EXCELLENT QUALITY APPAREL INC. 100,000,000 1,000,000 5
100 NCR EXPONENT GROUP CORP. 120,000,000 1,000,000 5103 Central Visayas LACTOBACILLUS PAFI TECHNI RESOURCE CORP. 200,000,000 15,000,000 17104 NCR NALCO PHIL. 250,000,000 1,500,000 2106 NCR C.B. ANDREW PHIL. 500,000,000 20,000,000 4108 Central Visayas GENERAL MILLING CORPORATION 7,000,000,000 2,000,000 5
National Statistics Office, (nr: no response)Survey of Manufacturing Establishment, 2005Tabulated from computer file
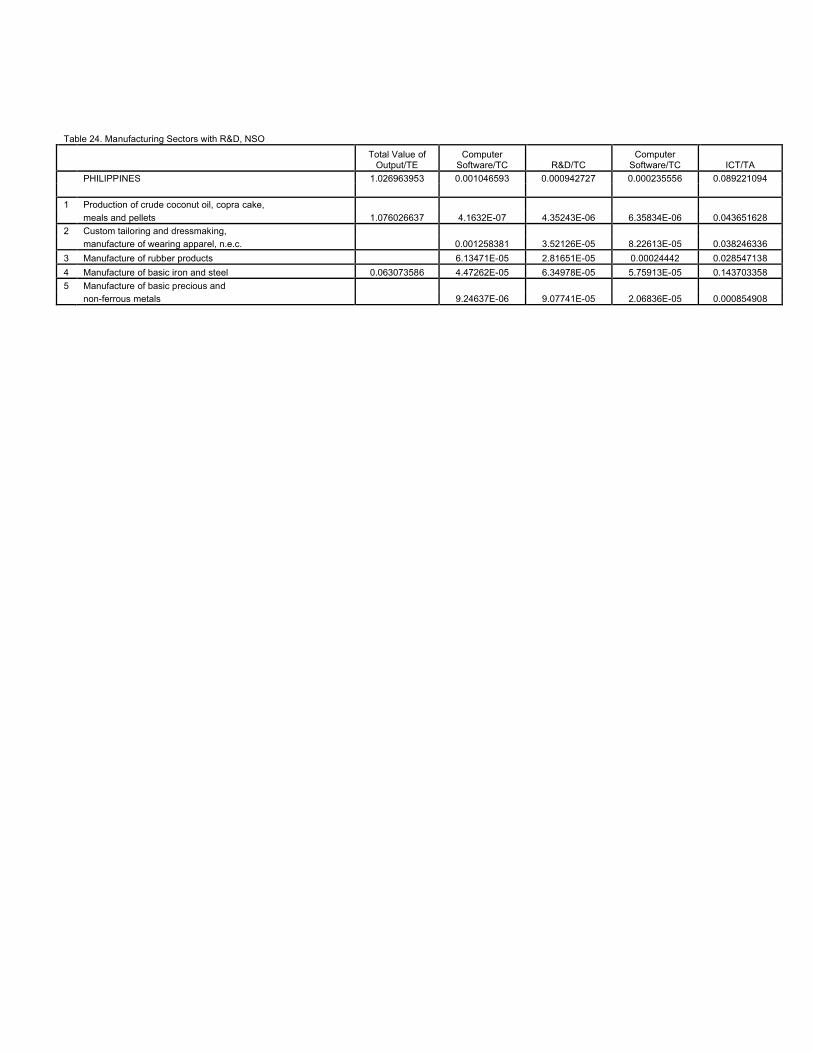
Table 24. Manufacturing Sectors with R&D, NSO
Total Value of Output/TE
Computer Software/TC R&D/TC
Computer Software/TC ICT/TA
PHILIPPINES 1.026963953 0.001046593 0.000942727 0.000235556 0.089221094
1 Production of crude coconut oil, copra cake,
meals and pellets 1.076026637 4.1632E-07 4.35243E-06 6.35834E-06 0.043651628
2 Custom tailoring and dressmaking,
manufacture of wearing apparel, n.e.c. 0.001258381 3.52126E-05 8.22613E-05 0.038246336
3 Manufacture of rubber products 6.13471E-05 2.81651E-05 0.00024442 0.028547138
4 Manufacture of basic iron and steel 0.063073586 4.47262E-05 6.34978E-05 5.75913E-05 0.143703358
5 Manufacture of basic precious and
non-ferrous metals 9.24637E-06 9.07741E-05 2.06836E-05 0.000854908
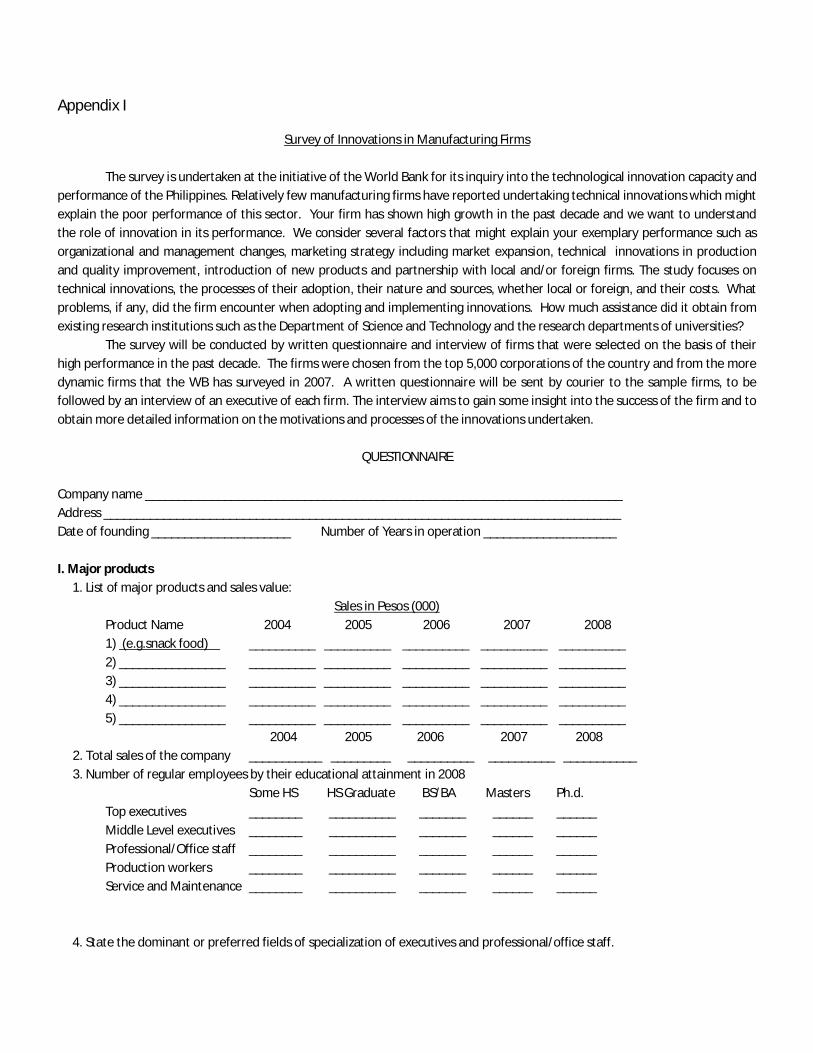
Appendix I
Survey of Innovations in Manufacturing Firms
The survey is undertaken at the initiative of the World Bank for its inquiry into the technological innovation capacity and performance of the Philippines. Relatively few manufacturing firms have reported undertaking technical innovations which might explain the poor performance of this sector. Your firm has shown high growth in the past decade and we want to understand the role of innovation in its performance. We consider several factors that might explain your exemplary performance such asorganizational and management changes, marketing strategy including market expansion, technical innovations in production and quality improvement, introduction of new products and partnership with local and/or foreign firms. The study focuses on technical innovations, the processes of their adoption, their nature and sources, whether local or foreign, and their costs. What problems, if any, did the firm encounter when adopting and implementing innovations. How much assistance did it obtain from existing research institutions such as the Department of Science and Technology and the research departments of universities?
The survey will be conducted by written questionnaire and interview of firms that were selected on the basis of their high performance in the past decade. The firms were chosen from the top 5,000 corporations of the country and from the more dynamic firms that the WB has surveyed in 2007. A written questionnaire will be sent by courier to the sample firms, to be followed by an interview of an executive of each firm. The interview aims to gain some insight into the success of the firm and to obtain more detailed information on the motivations and processes of the innovations undertaken.
QUESTIONNAIRE
Company name ________________________________________________________________________ Address ______________________________________________________________________________Date of founding _____________________ Number of Years in operation ____________________
I. Major products 1. List of major products and sales value: Sales in Pesos (000)
Product Name 2004 2005 2006 2007 20081) (e.g.snack food) __________ __________ __________ __________ __________
2) ________________ __________ __________ __________ __________ __________ 3) ________________ __________ __________ __________ __________ __________
4) ________________ __________ __________ __________ __________ __________ 5) ________________ __________ __________ __________ __________ __________ 2004 2005 2006 2007 2008 2. Total sales of the company ___________ _________ __________ __________ ___________ 3. Number of regular employees by their educational attainment in 2008 Some HS HS Graduate BS/BA Masters Ph.d.
Top executives ________ __________ _______ ______ ______ Middle Level executives ________ __________ _______ ______ ______ Professional/Office staff ________ __________ _______ ______ ______ Production workers ________ __________ _______ ______ ______ Service and Maintenance ________ __________ _______ ______ ______
4. State the dominant or preferred fields of specialization of executives and professional/office staff.
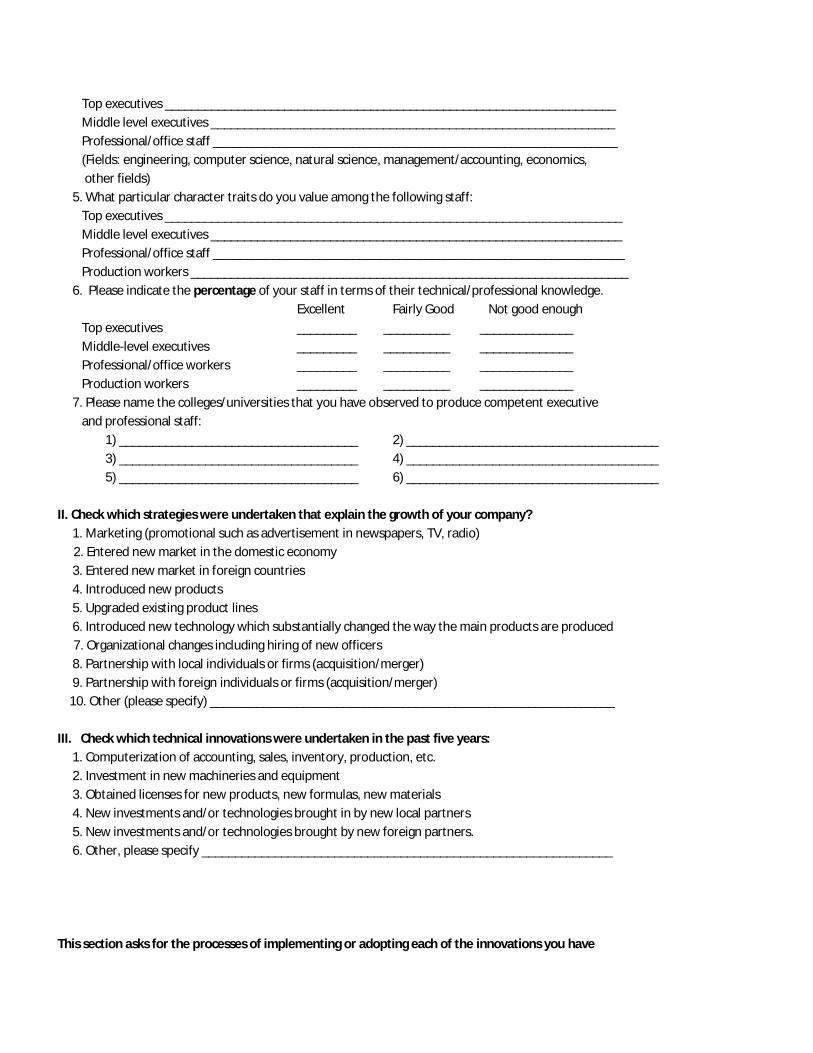
Top executives ____________________________________________________________________ Middle level executives _____________________________________________________________ Professional/office staff _____________________________________________________________ (Fields: engineering, computer science, natural science, management/accounting, economics, other fields) 5. What particular character traits do you value among the following staff: Top executives _____________________________________________________________________ Middle level executives ______________________________________________________________ Professional/office staff ______________________________________________________________ Production workers __________________________________________________________________ 6. Please indicate the percentage of your staff in terms of their technical/professional knowledge. Excellent Fairly Good Not good enough Top executives _________ __________ ______________ Middle-level executives _________ __________ ______________ Professional/office workers _________ __________ ______________ Production workers _________ __________ ______________ 7. Please name the colleges/universities that you have observed to produce competent executive and professional staff: 1) ____________________________________ 2) ______________________________________
3) ____________________________________ 4) ______________________________________5) ____________________________________ 6) ______________________________________
II. Check which strategies were undertaken that explain the growth of your company? 1. Marketing (promotional such as advertisement in newspapers, TV, radio)
2. Entered new market in the domestic economy 3. Entered new market in foreign countries 4. Introduced new products 5. Upgraded existing product lines 6. Introduced new technology which substantially changed the way the main products are produced
7. Organizational changes including hiring of new officers 8. Partnership with local individuals or firms (acquisition/merger) 9. Partnership with foreign individuals or firms (acquisition/merger) 10. Other (please specify) _____________________________________________________________
III. Check which technical innovations were undertaken in the past five years: 1. Computerization of accounting, sales, inventory, production, etc. 2. Investment in new machineries and equipment 3. Obtained licenses for new products, new formulas, new materials 4. New investments and/or technologies brought in by new local partners 5. New investments and/or technologies brought by new foreign partners. 6. Other, please specify ______________________________________________________________
This section asks for the processes of implementing or adopting each of the innovations you have

undertaken.IV. Computerization of accounting, sales, etc. 1. Year when first implemented _______ 2. Annual cost of operating and upgrading the computer system and number of employees assigned to the job: Cost in Pesos(000) Number of employees
2004 _______________ __________________2005 _______________ __________________2006 _______________ __________________2007 _______________ __________________ 2008 _______________ __________________
3. Education background and age of the employees in the computerization program:Top personnel Degree Field of Specialization College/university Age
Head ______________ ____________________ __________________ _____ Associate l ______________ ____________________ __________________ _____
Associate 2 ______________ ____________________ __________________ _____ Associate 3 ______________ ____________________ __________________ _____ Other ______________ ____________________ __________________ _____ (Degree: BS/BA, Masters and Phd., same categories of fields as listed above.) 4. Number of years of experience of head of the computer system:
In the firm ______, in other firms ______
V. Organizational and management changes 1. Give the departments where there was upgrading of officers:
1 _____________________________ 2 _____________________________3 _____________________________ 4 _____________________________5 _____________________________ 6 _____________________________
2. Educational background of top officers: Degree Field College/UniversityDepartment 1 ___________ ____________ _____________________ Department 2 ___________ ____________ _____________________Department 3 ___________ ____________ _____________________ Department 4 ___________ ____________ _____________________Department 5 ___________ ____________ _____________________Department 6 ___________ ____________ _____________________
VI. Marketing Strategy1. Cost of advertisement in Pesos(000)
2004 __________ 2005 __________ 2006 __________ 2007 __________ 2008 __________2. Check the nationality of advertising agents hired: local _______________ foreign _____________3. Target clientele of your marketing strategy:
a. domestic market _________ b. foreign market _________ c. both _________
VII. 1. How much have you invested in new equipment and machinery and where was it purchased?

Year Pesos (000) Local Foreign2004 _______________________ _________ _________
2005 _______________________ _________ _________ 2006 _______________________ _________ _________ 2007 _______________________ _________ _________ 2008 _______________________ _________ _________ 2. Did you encounter any problem financing the investment? ________________________________ _________________________________________________________________________________ 3. Did you encounter any problem finding suppliers? _______________________________________ _________________________________________________________________________________
VIII. Technical Innovations 1. Name the products that underwent technical innovation:
1) ___________________________________________ 2) ___________________________________________ 3) ___________________________________________ 4) ___________________________________________ 5) ___________________________________________ Other (specify) _________________________________________ 2. Check the innovations undertaken for each of the products listed above:
Product as numbered above 1 2 3 4 5 Other
1) Investment in new machinery/equipment [___] [___] [___] [___] [___] [___] 2) New formula developed by own personnel [___] [___] [___] [___] [___] [___] 3) Formula licensed from local firms/agents [___] [___] [___] [___] [___] [___] 4) Formula licensed from foreign firms/agents [___] [___] [___] [___] [___] [___] 5) Formula from local partner firm [___] [___] [___] [___] [___] [___] 6) Formula from foreign partner firm [___] [___] [___] [___] [___] [___] Other (specify) ___________________________________________ 3. Check source of information on innovations:
1) Internet 2) Technical/professional journals and catalogues and magazines 3) Consultation with local research institutes and experts 4) Consultation with foreign research institutes and experts 5) Consultation with local university faculty and researchers 6) Consultation with government research institutes and agencies 4. Was your executive and professional staff technically competent to initiate and implement
innovations? Please discuss the degree of their technical competence, interest and work discipline in adopting/adapting and carrying out the innovations ___________________________________
_________________________________________________________________________________ _________________________________________________________________________________ _________________________________________________________________________________

5. What was the educational background of the staff that initiated and carried out the innovations High school _____________________
BS/BA degree _____________________ in field(s) _______________________________________ Masters degree ____________________ in field(s) _______________________________________ Ph.d. degree ______________________ in field(s) _______________________________________ 6. If you have consulted or worked with specialists in domestic research institutes or universities please name them and the corresponding department(s). Research Institutes/Universities Department(s) 1) _____________________________________ _____________________________________ 2) _____________________________________ _____________________________________
3) _____________________________________ _____________________________________ 7. If you have you consulted or worked with specialists in foreign research institutes or universities please name them and the corresponding department(s). 1) _____________________________________ _____________________________________
2) _____________________________________ _____________________________________ 3)______________________________________ _____________________________________ 8. Please describe your relationship with the institutes/universities. Have you made mainly occasional consultations on an ad hoc basis or have you arranged for regular consultations under some contractual compensatory terms? How many specialists were involved in your consultations? __________________________________________________________________________________ __________________________________________________________________________________ __________________________________________________________________________________
9. Describe a usual consultancy contract and its cost. ________________________________________ ___________________________________________________________________________________ ___________________________________________________________________________________ ___________________________________________________________________________________ 10. Describe the objective and method of consultations. Are the experts involved in in-plant experimentation, application of new processes, testing of new equipment or machinery, and the like. _____________________________________________________________________________ __________________________________________________________________________________ __________________________________________________________________________________ __________________________________________________________________________________ 11. How well do you rate their expertise? Discuss briefly your degree of satisfaction, whether excellent, good, inadequate. How valuable have they been in adopting/adapting new technologies. Discuss their good points and weak points.
(a) Specialists in Domestic Universities ____________________________________________________________________________________________________________________________________________________________________________
_______________________________________________________________________________________(b) Specialists in Domestic Research Institutes
_______________________________________________________________________________________ _______________________________________________________________________________________ _______________________________________________________________________________________

12. Please identify and describe particular forms of innovative assistance your company obtained from your consultations with the research institutes/universities, e.g., development of new formula; improvement of existing production technology; identification of sources of critical inputs, equipment or machinery; foreign sources of technical information; and application of computer program. ________________________________________________________________________ ________________________________________________________________________________ ________________________________________________________________________________ ________________________________________________________________________________ 13. Have you encountered any difficulty finding the best source/seller of your machinery/equipment? If so, discuss the problem __________________________________________________________ ________________________________________________________________________________ ________________________________________________________________________________ ________________________________________________________________________________
IX. Does your firm operate a research and development (R&D) branch or department? _______ 1. If you do, when was it established? _______________ 2. Give the annual budget and number of full-time personnel in R&D: Budget in Pesos (000) Number of full-time personnel
2004 _________________ _________________________ 2005 _________________ _________________________ 2006 _________________ _________________________ 2007 _________________ _________________________ 2008 _________________ _________________________ 3. Give the education, field and college/university of the R&D personnel
Degree Field College/universityHead ___________________ _______________ ___________________________
Associate 1 ___________________ _______________ ___________________________ Associate 2 ___________________ _______________ ___________________________ Associate 3 ___________________ _______________ ___________________________ Other ___________________ _______________ ___________________________
4. List and describe the specific innovations they have produced _____________________________ _______________________________________________________________________________ _______________________________________________________________________________
_______________________________________________________________________________ 5. Discuss briefly the current priority subjects of your R&D? ________________________________________________________________________________ _______________________________________________________________________________
_______________________________________________________________________________
X. Have you experienced any problem that inhibited or constrained you from undertaking technical innovations, e.g., lack of qualified persons to hire, absence of expertise to consult in domestic research institutes and universities, poor access to international sources of information and expertise, high cost of innovation and other reasons. Explain briefly. _________________________________________ ______________________________________________________________________________________ ______________________________________________________________________________________ ______________________________________________________________________________________
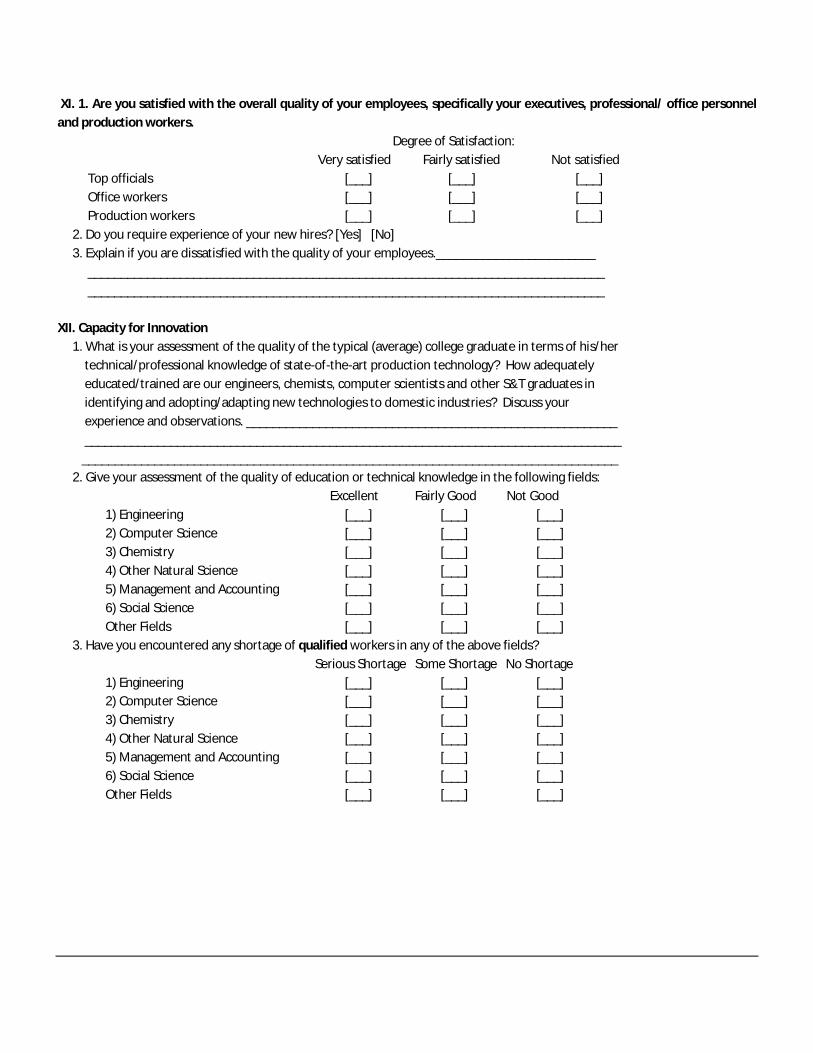
XI. 1. Are you satisfied with the overall quality of your employees, specifically your executives, professional/ office personnel and production workers. Degree of Satisfaction:
Very satisfied Fairly satisfied Not satisfied Top officials [___] [___] [___] Office workers [___] [___] [___] Production workers [___] [___] [___] 2. Do you require experience of your new hires? [Yes] [No] 3. Explain if you are dissatisfied with the quality of your employees.________________________ ______________________________________________________________________________ ______________________________________________________________________________ XII. Capacity for Innovation 1. What is your assessment of the quality of the typical (average) college graduate in terms of his/her technical/professional knowledge of state-of-the-art production technology? How adequately educated/trained are our engineers, chemists, computer scientists and other S&T graduates in identifying and adopting/adapting new technologies to domestic industries? Discuss your experience and observations. ________________________________________________________ _________________________________________________________________________________ _________________________________________________________________________________ 2. Give your assessment of the quality of education or technical knowledge in the following fields: Excellent Fairly Good Not Good
1) Engineering [___] [___] [___] 2) Computer Science [___] [___] [___] 3) Chemistry [___] [___] [___] 4) Other Natural Science [___] [___] [___] 5) Management and Accounting [___] [___] [___] 6) Social Science [___] [___] [___] Other Fields [___] [___] [___] 3. Have you encountered any shortage of qualified workers in any of the above fields? Serious Shortage Some Shortage No Shortage 1) Engineering [___] [___] [___] 2) Computer Science [___] [___] [___] 3) Chemistry [___] [___] [___] 4) Other Natural Science [___] [___] [___] 5) Management and Accounting [___] [___] [___] 6) Social Science [___] [___] [___] Other Fields [___] [___] [___]

4. Some studies have suggested for the government to redirect education resources toward improving the quality of education instead of just expanding enrollment. Do you agree with the following recommendations? Agree Disagree
1) Reallocate the budget now given to state universities/colleges toward scholarship and laboratory improvement of S&T programs in high quality institutions [___] [___] 2) Provide massive subsidy for S&T research and graduate instruction in the better quality schools [___] [___] 3) Increase the budget for library and IT access in public high schools and elementary schools [___] [___] 4) Establish a massive scholarship program for teacher training in the better quality schools [___] [___] 5. Give your own recommendation(s) for improving the country’s S&T innovative capacity. ________________________________________________________________________________ ________________________________________________________________________________ ________________________________________________________________________________

Appendix II
Paper Company Steel Company Electronics CompanyDate Founded 1991 1963 1980
AddressY-1 J.Y. & Sons,
Veterans Center, Taguig12th Flr., 39 Plaza Drive, Phinma Plaza, Rockwell Center, Makati
North Science Avenue, Laguna Technopark, Special Export Processing
Zone, Binan, Laguna
Products1 Polyamine Pre-painted Coils Sheets Computing2 Polydadmac Communication3 Defoarmers Consumer4 Paper Sizing Additive Industrial5 Paper Strength Additive Automotive6 Medical7 Plastic/Metal8 Others
Sales2004 Php 1.467B $109M2008 Php 2.723B $441M
Number and Education of Regular EmployeesTop Executives 1 MS, 3 BS 1 MS, 4 BS 3 MS, 8 BS
Middle Executives & Professional 11 BS 2 MS, 231 BS, 5 HS1 PHd, 11 MS, 705 BS, 157 HS, 295
VocationalProduction Workers 3 BS, 11 HS 4 BS, 60 HS 576 BS, 3998 HS, 981 VocationalService & Maintenance none 3 BS, 13 HS noneTotal 29 323 6,735
Field of Secialization
Top ExecutivesMangement / Engineering
Management / Economics Engineering - MBA
Middle Executives & ProfessionalEngineering / Chemistry /
Accounting / Finance / Computer Science
Engineering / Accounting Engineering / General BS Courses
Particular Traits Valued
Top ExecutivesPassionate, hardworking,
good sense of humor, open-mindedness
Integrity, passion, innovativeness, servant, leadership, visionary
Integrity, customer focus, concern for others, excellence
Middle Executives & ProfessionalPassionate, hardworking,
good sense of humor, open-mindedness
Innovative, integrity, passion, team spirit
Integrity, customer focus, concern for others, excellence, trustworthiness
Production WorkersPassionate, hardworking,
good sense of humor, open-mindedness
Hard working, team spirit, trustworthiness, discipline
Trustworthiness, customer focus, excellence, concern for others
Satisfactory RatingTop Executives Excellent Excellent Excellent
Middle Executives & Professional Excellent to Good Fairly good to Not good enough Fairly good
Production Workers Good Not good enough85% Fairly good, 10% Excellent, 5% Not
good enoughPreferred HEI for top executives
Top ExecutivesUP, Ateneo, UST, CIT/MIT, Adamson
UST, UP, St. Louis University, Cebu Institure of Technology, Ateneo, Feati,
Mapua, FEU, UE, Divine World College, University of San Carlos
UP, Mapua, UST, Adamson, Letran, DLSUMiddle Executives & Professional
What explains the growth of companyMarketing XEntered New Market in the domestic economyEntered New Market in foreign Country XIntroduced new product X X XUpgraded existing product line X X XIntroduced new technology XOrganizational changes X X XPartnership w/ local individuals XPartnership w/ foreign individual X
Others X
Technical Innovations UndertakenComputerization of accounting, sales, inventory, production, etc.
X X X

Investment in new machines and equipment X X
Obtained licenses for new products, formulas, materials
X
New investment and/or technologies brought in by new local partner
New investment and/or technologies brought in by new foreign partner
X X
OthersComputerization of accounting, sales, etc. 2006 1966 2004
Cost 2004 - Php 532 M, 3 employeesPhp 77 M, 14 IMI Employees, 11
consultantsCost 2005 - Php 550 M, 3 employees Php 28 M, 10 Employees, 1 consultantCost 2006 Php 2.5 M Php 665 M, 3 employees Php 48 M, 10 Employees, 1 consultantCost 2007 Php 0.5 M Php 715 M, 4 employees Php 24 M, 9 EmployeesCost 2008 Php 0.5 M Php 979 M, 5 employees Php 31 M, 11 Employees
Education of Head Outsourced BS Accounting, SLU, MSBS Electronics & Communications
Engineering, USCAssociate 1 BS Chemistry, St. Mary's College BS Computer Engineering, Mapua
Associate 2BS Computer Science, University of
Immaculate ConceptionBS Computer Science, DLSU
Associate 3BS Computer Science, Laguna College of Business and Arts
BS Computer Engineering, UST
Others
Departments wher officers were upgraded Manufacturing Production, Finance, MarketingInformation Communication and
TechnologyEducation of Top Officers
Department 1BS Chemical
Engineering, UPBS Accounting, SLU, MS BS Engineering, Mapua
Department 2BS Chemical
Engineering, MapuaBS Accounting, Divine World
UniversityBS Engineering, DLSU
Department 3BS Chemical
Engineering, MLQUBS Mechanical Engineering, FEATI BS Engineering, Mapua
Department 4BS Electrical
Engineering, UNORBS Accounting, SLU, MS BS Engineering, Mapua
Department 5BS Accountancy, Rizal
College of TaalBS Accounting, UE
MS Engineering, Linkoping University Inst. Of Technology
Department 6 BS Chemistry, MSU BS Engineering, USCDepartment 7 AB Behavioral Science, SSCDepartment 8 BS Accountancy, St. Theresa's College
Marketing Strategy
Cost 2004 Php 2.7 M Php 2.2 MCost 2005 Php 6.3 M Php 0.8 M Cost 2006 Php 6.5 M Php 4.9 MCost 2007 Php 6.5 M Php 1.5 MCost 2008 Php 9.3 M Php 5.99 M
Nationality of Advertising Agents hiredLocal XForeign X
Target clientele of marketing strategyDomestic Market XForeign MarketBoth X X
Investment in new eqpt & machinery
Cost 2004Php 12 M - 4M Local, 8M
ForeignPhp 8.4 M; local $ 4.5 M
Cost 2005 Php 24.0 M; both local & foreign $ 7.4 MCost 2006 Php 19.0 M; both local & foreign $ 16.0 M
Cost 2007Php 18M - 6M Local,
12M ForeignPhp 20.8 M; both local & foreign $ 12.4 M
Cost 2008 Php 38.8 M; both local & foreign $ 8.8 MAny Financing Problem No No NoAny Supplier Problem No No NoTechnical Innovations
Investment in new machinery/equipment Product 1, 2, 3, 4 Product 1, 2, 3, 5 Product 1, 2, 3, 4, 5, othersNew formula developed by own staff Product 3, 4 Product 1, 2, 3, 5 Product 4, othersFormula licensed from local firms Product 2, .3Formula licensed from foreign firms Product 1, 2 Product 4 Product 1, 5Formula from local partner firmFormula from foreign partner firm Product 1

Source of Information on innovationsInternet X X XTechnical/professional journals, catalogues and magazines
X X
Consultation w/ local research institutes and experts
X X
Consultation w/ foreign research institutes and experts
X X
Consultation w/ local university faculty & researchers
X X
Consultation w/ govt research institutes and agencies
X
Education of the Innovator in the Company BS Chemical Engineering
BS Mechanical, Chemical, Electrical Engineering
95% BS/BA; 5% MA
Staff capable to innovate
Product innovation driven by our Chairman and R&D Director who is a Chemical Engineer but
has a passion for chemistry and many friends abroad in the
same field
Staff are able to do research work, engineering, computations,
benchmarking, comparative analysis, enhancing team work,
conceptualization, planning, scheduling and implementations;
Focused group discussions, formation of task force, progress reports - time
frame, use of "SMART", "SWOT", etc.
We did not do core R&D. The type of R&D performed at IMI is application level
R&D. For this, the competence is sufficient. However, the competence takes time to develop. The people we
hired worked for us specifically because they wanted to work in an R&D
environment. They quickly adopted the work discipline required.
Consultation with domestic research institutes or universities
UP - Electrical & Electronics Engg Dept; DLSU - Electronics & Communications Engg Dept; UP - National Institute of
Physics
Expertise Rating
Specialist in Domestic universities: academically very good, able to give
good insight to problems. However, still lacking in practical or industry experience
Usual consultancy contract & cost
Physical presence once a week to assist in the resolution of issues & conduct
competency development activities at a cost of approx. Php 50K per month
Objective and method of consultation
They participate in project reviews, brainstorming sessions, they assist in the
resolution of issue, they conduct seminars and workshops
Forms of innovative assistance from consultations
Improvement of performance of wireless products, improvement in the
implementation of software solutions, use of new techniques
R&D
Separate division Yes Yes
Cost and Personnel 2004 Php 2.0 M; 2 personnel
Per project basis included in the capital expenditures; 4 personnel
Cost and Personnel 2005 Php 2.0 M; 2 personnel Php 64 M; 62 PersonnelCost and Personnel 2006 Php 2.5 M; 2 personnel Php 65 M; 66 PersonnelCost and Personnel 2007 Php 2.8 M; 3 personnel Php 65 M; 65 PersonnelCost and Personnel 2008 Php 2.8 M; 3 personnel Php 46M; 44 Personnel
Education of Head BS Chemical Engineering, MLQU
BSME Engineer, Cebu Institute of Tech
MS eng Computer/Systems; Rensselaer Polytechnic Institute
Associate 1MS Chemistry,
PLM/UPLBBSME, FEATI MS Electrical Engg; UP
Associate 2BS Chemical
Engineering, USTBS Chemistry, UST
BS Electronics & Communications Engineering, DLSU

Associate 3 BSChe/BSME, USC/Iligan Institute of Technology
BS Electronics & Communications Engineering, Mapua
Others BS Electronics & Communications Engineering, UST
Constraints experienced in innovationLack of state of the art equipment for
steel / galvanized steel testing equipment
Lack of highly qualified personnel capable of doing cutting edge dev't, unavailability of expensive simulation & modeling tools
for signal integrity and EMC/EMI, prohibitive technology licensing costs
Satisfactory RatingTop Executives Very Satisfied Very Satisfied Fairly SatisfiedMiddle Executives & Professional Very Satisfied Very Satisfied Fairly SatisfiedProduction Workers Fairly Satisfied Very Satisfied Fairly Satisfied
Experience required for new hires Yes No but preferred in some positions Yes
Capacity for Innovation
Lack of practical experience is the main
concern. Our engineering/science
program must include a "Real" OJT portion
similar to the medical sciences
Chemical Engineering - Very good; Mechanical/Electrical - Fair to Good;
Engineers are sent abroad for training in addition to local trainings in
specialized fields
The average college graduate lacks an appreciation of state of the art
technologies. The R&D orientation is generally lacking. They are well trained in solving standard operational problems but lack training in synthesizing solutions to problems. They are not provided with
enough design exposure in colleg. They are however highly trainable. It usualy
takes 6months to 1 year to provide them an R&D orientation and get them up to
speed on new and emerging technologies
Quality of GraduatesEngineering Fairly Good Fairly Good Fairly goodComputer Science Fairly Good Fairly Good ExcellentChemistry Fairly Good Fairly Good Fairly goodOther Natural Science Fairly goodManagement and Accounting Fairly Good Fairly Good ExcellentSocial Science Fairly Good ExcellentOther Fields Fairly good
Shortage of qualified workersEngineering Some shortage Some shortageComputer Science Some shortage Serious shortageChemistry No shortage No shortageOther Natural Science No shortage No shortageManagement and Accounting No shortage Some shortageSocial Science No shortage No shortageOther Fields Some shortage
Policy Recommendation Agree w/ 1, 3, 4 Agree w/ 4, Disagree w/ 1, 2, 3 Agree w/ 3, 4; disagree w/ 1, 2
Company Recommedation Develop basic S & T program for elementary schools
Establish research programs that target domestic problems. From consortia that allow collaboration between academe &
industry in tackling these problems. Raise the salaries of educators to levels competitive w/ industry so good
instructors and professors are not lulled by industry. Make scholarships more attractive so college graduates are
motivated to take advanced degrees instead of working for industry. Lobby for legislation that would stimulate the R&D
sector in the Philippines, example: mandate government to purchase locally made products when quality and cost is
comparable to foreign products. Government should support SME
activities w/ incentives & facilities that provide tools and equipment

Appendix III
Cement Company Cigar CompanyDate Founded 1973
Address104 Technology Ave., Technopark Inc.,
Sta. Rosa, Laguna, Philippines
Products1 Cement Disposable Lighters2 Cigars345678
Sales2004 Php 920M2008 Php 1,682M
Number and Education of Regular EmployeesTop Executives MS 1 MS
Middle Executives & Professional MS, BS 3 MS, 44 BS
Production Workers BS 40 BS, 14 HSService & Maintenance at least HS 35 BSTotal 600 137
Field of Secialization
Top Executives MS EngineeringGen. Management, Manufacturing,
Logistics
Middle Executives & Professional BS
Human Resource Management, Accounting/Finance, Engineering, Marketing & Sales, Electronics,
Computer Science
Particular Traits Valued
Top ExecutivesPassion to get things done well and quick
Proactive, Strategic thinking, mental discipline
Middle Executives & ProfessionalPeople/Team oriented, proactive, self-
starter/motivated
Production Workers self-starter/motivated, team-oriented
Satisfactory RatingTop Executives Excellent Fairly good
Middle Executives & ProfessionalExcellent to Fairly
goodFairly good
Production Workers Fairly good Fairly good
Preferred HEI for top executivesTop Executives UP, UST, Ateneo,
DLSU, SCUDon Bosco College, Mapua Institute of Technology, UP, UST, Ateneo, DLSUMiddle Executives & Professional
What explains the growth of companyMarketing
Entered New Market in the domestic economy
Entered New Market in foreign CountryIntroduced new product XUpgraded existing product line XIntroduced new technology XOrganizational changesPartnership w/ local individualsPartnership w/ foreign individual
OthersTechnology transfer from mother factory
in Europe & development for local personnel
Technical Innovations UndertakenComputerization of accounting, sales, inventory, production, etc.
X X

Investment in new machines and equipment X X
Obtained licenses for new products, formulas, materials
New investment and/or technologies brought in by new local partner
New investment and/or technologies brought in by new foreign partnerOthers
Computerization of accounting, sales, etc. Cost 2004 $ 0.077 M, 1 employeeCost 2005 $ 0.094 M, 1 employeeCost 2006 $ 0.109 M, 1 employeeCost 2007 $ 0.142 M, 1 employeeCost 2008
Education of Head BS Industrial Engineering, UP
Associate 1 BS Computer Science, AMA
Associate 2
Associate 3
Others
Departments wher officers were upgraded Yes Manufacturing, Logistics/Sourcing
Education of Top Officers
Department 1 BSME/MBM Engineering / Bus. Mgmt, DLSU, AIM
Department 2 BSIE Engineering, UP
Department 3 BSECE Engineering, Mapua
Department 4 AB Psychology, PUP
Department 5 BS Accounting, Marian College
Department 6Department 7Department 8
Marketing Strategy New ___ system direct to retailer
Cost 2004 $ 0.16 MCost 2005 $ 0.18 MCost 2006 $ 0.22 MCost 2007 $ 0.27 MCost 2008 $ 0.33 M
Nationality of Advertising Agents hiredLocal XForeign
Target clientele of marketing strategyDomestic Market XForeign MarketBoth
Investment in new eqpt & machinery
Cost 2004 $ 0.55 M, both local and foreign
Cost 2005 $ 0.49 M, both local and foreignCost 2006 $ 0.68 M, both local and foreign
Cost 2007 $ 5.91 M, both local and foreign
Cost 2008 $ 3.49 M, both local and foreignAny Financing Problem NoAny Supplier Problem NoTechnical Innovations
Investment in new machinery/equipment Product 1 Product 1New formula developed by own staff Product 1Formula licensed from local firmsFormula licensed from foreign firmsFormula from local partner firmFormula from foreign partner firm
Other Product design changes from R&D office in Europe
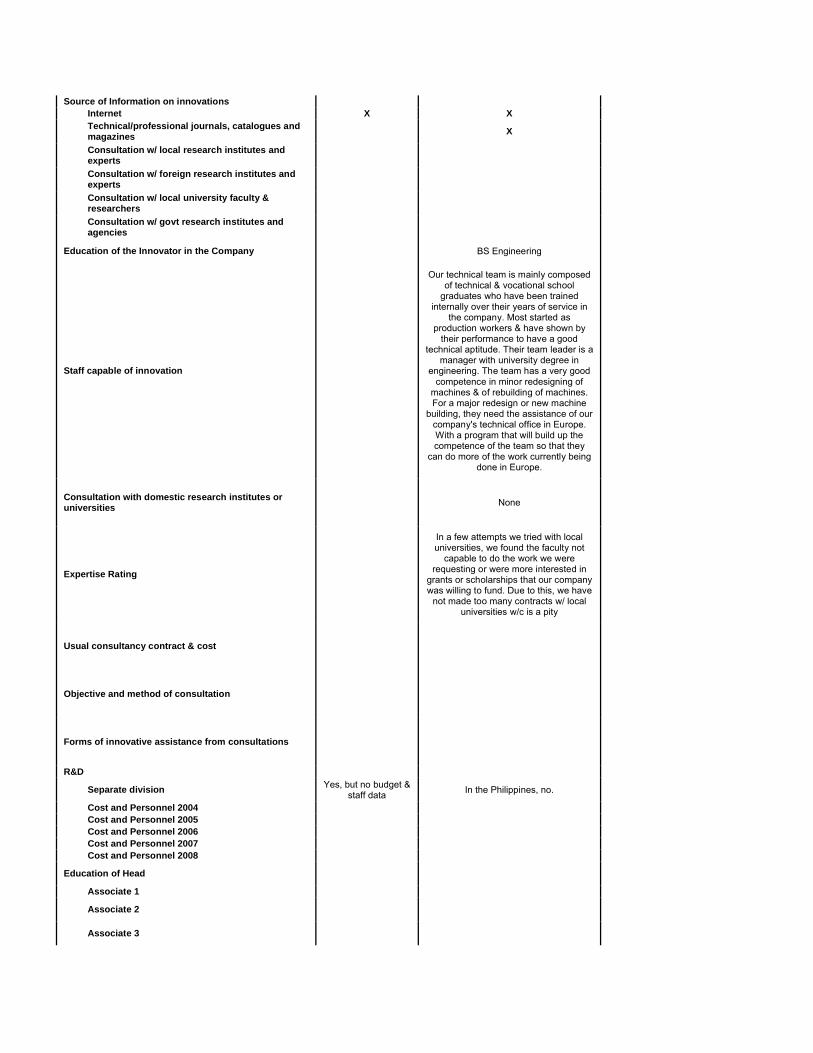
Source of Information on innovationsInternet X XTechnical/professional journals, catalogues and magazines
X
Consultation w/ local research institutes and experts
Consultation w/ foreign research institutes and experts
Consultation w/ local university faculty & researchers
Consultation w/ govt research institutes and agencies
Education of the Innovator in the Company BS Engineering
Staff capable of innovation
Our technical team is mainly composed of technical & vocational school
graduates who have been trained internally over their years of service in
the company. Most started as production workers & have shown by
their performance to have a good technical aptitude. Their team leader is a
manager with university degree in engineering. The team has a very good
competence in minor redesigning of machines & of rebuilding of machines. For a major redesign or new machine
building, they need the assistance of our company's technical office in Europe. With a program that will build up the competence of the team so that they
can do more of the work currently being done in Europe.
Consultation with domestic research institutes or universities
None
Expertise Rating
In a few attempts we tried with local universities, we found the faculty not
capable to do the work we were requesting or were more interested in
grants or scholarships that our company was willing to fund. Due to this, we have
not made too many contracts w/ local universities w/c is a pity
Usual consultancy contract & cost
Objective and method of consultation
Forms of innovative assistance from consultations
R&D
Separate division Yes, but no budget & staff data
In the Philippines, no.
Cost and Personnel 2004Cost and Personnel 2005Cost and Personnel 2006Cost and Personnel 2007Cost and Personnel 2008
Education of Head
Associate 1
Associate 2
Associate 3

Others
Constraints experienced in innovation NoneThe main problem is the lack of
universities who are willing to partner on either some research or design
Satisfactory RatingTop Executives Very Satisfied Fairly SatifiedMiddle Executives & Professional Very Satisfied Fairly SatifiedProduction Workers Fairly Satisfied Fairly Satified
Experience required for new hires No, except for supervisory and manegerial positions
Capacity for Innovation
The top universities seem to prepare their engineering and science students for "white-collar" or management jobs
instead of going into research or engineering. Given that it is not
financially rewarding to go into research in the Philippines, this is
understandable. Our engineering students do have the capability to adapt
new technologies to local needs & conditions. Admittedly, most have been adaptations of already existing products
and configured for local conditions. It does show that the potential is there
given the motivation.
Quality of GraduatesEngineering Fairly Good Fairly GoodComputer Science Fairly Good Fairly GoodChemistry Fairly GoodOther Natural ScienceManagement and Accounting Fairly GoodSocial ScienceOther Fields
Shortage of qualified workers None EncounteredEngineering Some shortageComputer Science No shortageChemistryOther Natural ScienceManagement and Accounting No shortageSocial ScienceOther Fields
Policy Recommendation Agree w/ 1, 2, 3; Disagree w/ 4
Company Recommedation Improve basic education
Most of the support mentioned above should be on a project basis. The
institution must show that it has a project with the private sector or company. This encourages universities to build up their research / innovation capabilities & for private companies to partner with them on a project on consulting basis. The
private sector will also be encouraged to later pay for the full cost of research so that the government can allocate funds
to other needs.