the state of support services - az766929.vo.msecnd.net · the state of support services 2017...
TRANSCRIPT
Judith Platz, Vice President Research, Support Services
The State of Support Services 2017
SUPPORT SERVICES | Research Publication

www.tsia.com ©2017 Technology Services Industry Association | 17065 Camino San Bernardo, Ste. 200 | San Diego, CA 92127 | Tel. 1.858.674.5491
2
The State of Support Services: 2017 by Judith Platz
Executive Overview
The traditional support organization focused on break/fix is quickly becoming a thing of the past. The successful support organization of 2017 and beyond is one focused on the overall customer experience. Given the realization by executives across the industry that support services is a key player in creating the ideal customer experience, which ultimately will lead to long-term customer loyalty, support organizations are now finding themselves in the midst of an identity crisis.
For organizations so focused on fixing problems and measuring things that happened in the past, support is now being asked to look forward, predict what customers may want and need, and measure customer-centered metrics. Some support organizations are being asked to take on lead generation activities, create new incentive plans, create and deliver profitable and differentiated service offerings, deliver effortless customer experience, and predict and personalize the support journey. Many organizations are being asked to do this alongside the newer organization, customer success. Others continue to work with the traditional service lines such as field, education, managed, or professional services, but each of these service lines is going through significant disruption of its own.
In 2016, TSIA support services research suggested support organizations begin to focus or expand their support service transformation in four key areas. As Thomas Lah, executive director of TSIA, writes in his “2017 Service Capability Heatmap” report: “The technology industry is in the first phase of a massive industry transformation. TSIA feels this transformation will be playing out over the next
Executive Insight
TSIA-03080
February 14, 2017
SUPPORT SERVICES | Research Publication

www.tsia.com
©2017 Technology Services Industry Association | 17065 Camino San Bernardo, Ste. 200 | San Diego, CA 92127 | Tel. 1.858.674.5491
3
three to five years. At the end of this transformation, technology business models and organizational structures will look markedly different.”
Knowing that, the support service organization transformation is going to be ongoing. TSIA continues to recommend that support organizations focus on support services transformation in the four distinct areas shown in Figure 1. TSIA Research suggests members continue to create and/or review the following:
• Customer Experience Strategy • Customer Engagement Strategy • Support Modernization Strategy • Technology Adoption Strategy
Figure 1: Support Services Areas of Transformation
Customer Experience Strategy
In 2017, support organizations must continue to participate in or lead the creation of the company’s customer experience strategy. TSIA has previously stated that this needs to be a cross-functional effort between key stakeholders and is often led by marketing. Support is positioned to be one of, if not the key, linchpin in this strategy. If the effort is not being led by other stakeholders, support will only benefit by stepping forward and taking lead in this effort.
www.tsia.com ©2017 Technology Services Industry Association | 17065 Camino San Bernardo, Ste. 200 | San Diego, CA 92127 | Tel. 1.858.674.5491
4
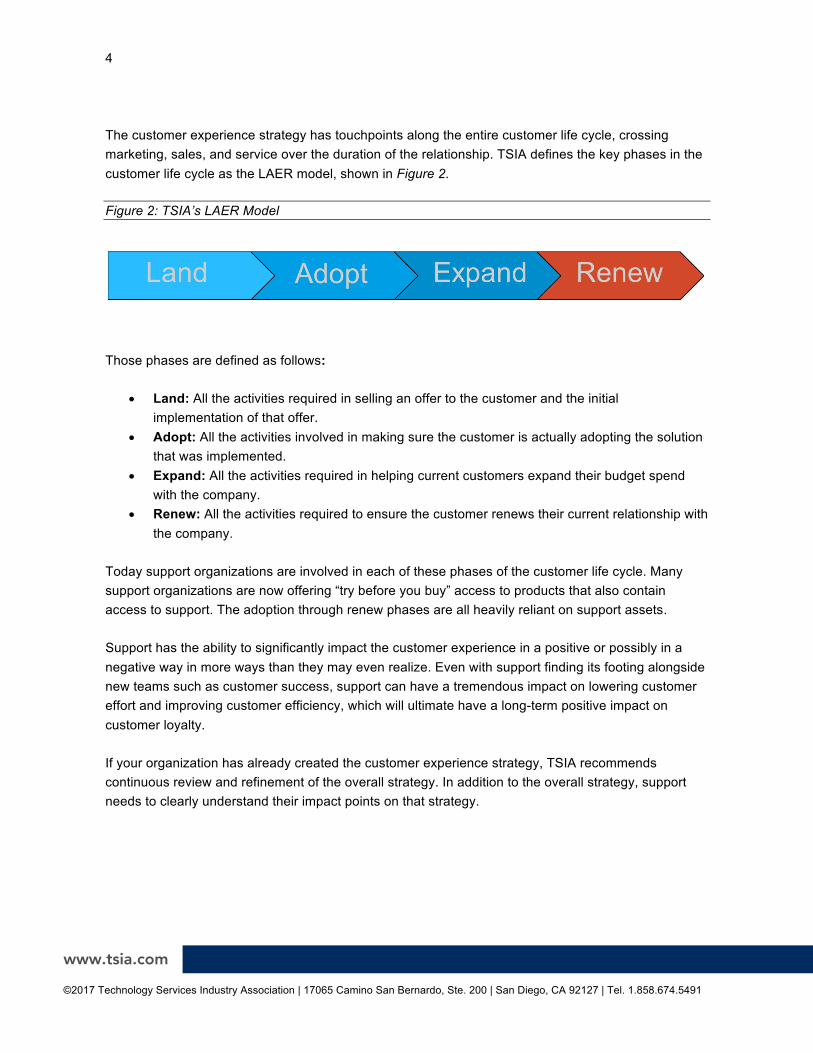
The customer experience strategy has touchpoints along the entire customer life cycle, crossing marketing, sales, and service over the duration of the relationship. TSIA defines the key phases in the customer life cycle as the LAER model, shown in Figure 2.
Figure 2: TSIA’s LAER Model
Those phases are defined as follows:
• Land: All the activities required in selling an offer to the customer and the initial implementation of that offer.
• Adopt: All the activities involved in making sure the customer is actually adopting the solution that was implemented.
• Expand: All the activities required in helping current customers expand their budget spend with the company.
• Renew: All the activities required to ensure the customer renews their current relationship with the company.
Today support organizations are involved in each of these phases of the customer life cycle. Many support organizations are now offering “try before you buy” access to products that also contain access to support. The adoption through renew phases are all heavily reliant on support assets.
Support has the ability to significantly impact the customer experience in a positive or possibly in a negative way in more ways than they may even realize. Even with support finding its footing alongside new teams such as customer success, support can have a tremendous impact on lowering customer effort and improving customer efficiency, which will ultimate have a long-term positive impact on customer loyalty.
If your organization has already created the customer experience strategy, TSIA recommends continuous review and refinement of the overall strategy. In addition to the overall strategy, support needs to clearly understand their impact points on that strategy.
www.tsia.com
©2017 Technology Services Industry Association | 17065 Camino San Bernardo, Ste. 200 | San Diego, CA 92127 | Tel. 1.858.674.5491
5
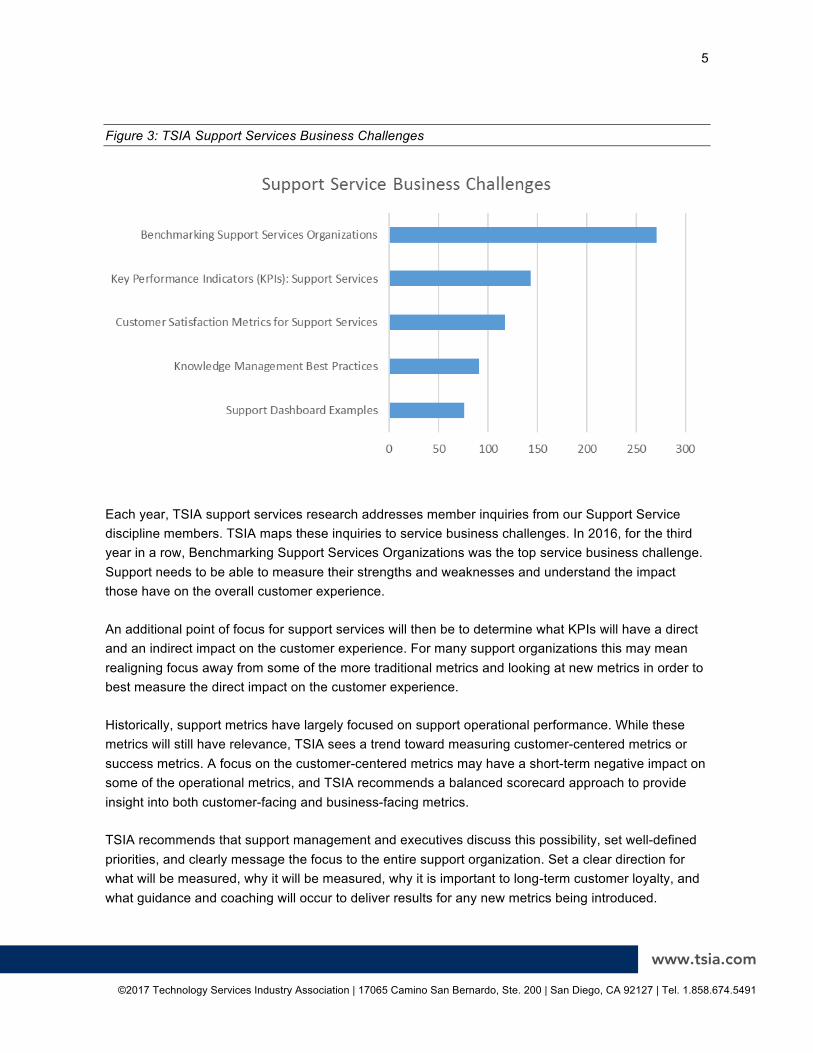
Figure 3: TSIA Support Services Business Challenges
Each year, TSIA support services research addresses member inquiries from our Support Service discipline members. TSIA maps these inquiries to service business challenges. In 2016, for the third year in a row, Benchmarking Support Services Organizations was the top service business challenge. Support needs to be able to measure their strengths and weaknesses and understand the impact those have on the overall customer experience.
An additional point of focus for support services will then be to determine what KPIs will have a direct and an indirect impact on the customer experience. For many support organizations this may mean realigning focus away from some of the more traditional metrics and looking at new metrics in order to best measure the direct impact on the customer experience.
Historically, support metrics have largely focused on support operational performance. While these metrics will still have relevance, TSIA sees a trend toward measuring customer-centered metrics or success metrics. A focus on the customer-centered metrics may have a short-term negative impact on some of the operational metrics, and TSIA recommends a balanced scorecard approach to provide insight into both customer-facing and business-facing metrics.
TSIA recommends that support management and executives discuss this possibility, set well-defined priorities, and clearly message the focus to the entire support organization. Set a clear direction for what will be measured, why it will be measured, why it is important to long-term customer loyalty, and what guidance and coaching will occur to deliver results for any new metrics being introduced.
www.tsia.com ©2017 Technology Services Industry Association | 17065 Camino San Bernardo, Ste. 200 | San Diego, CA 92127 | Tel. 1.858.674.5491
6
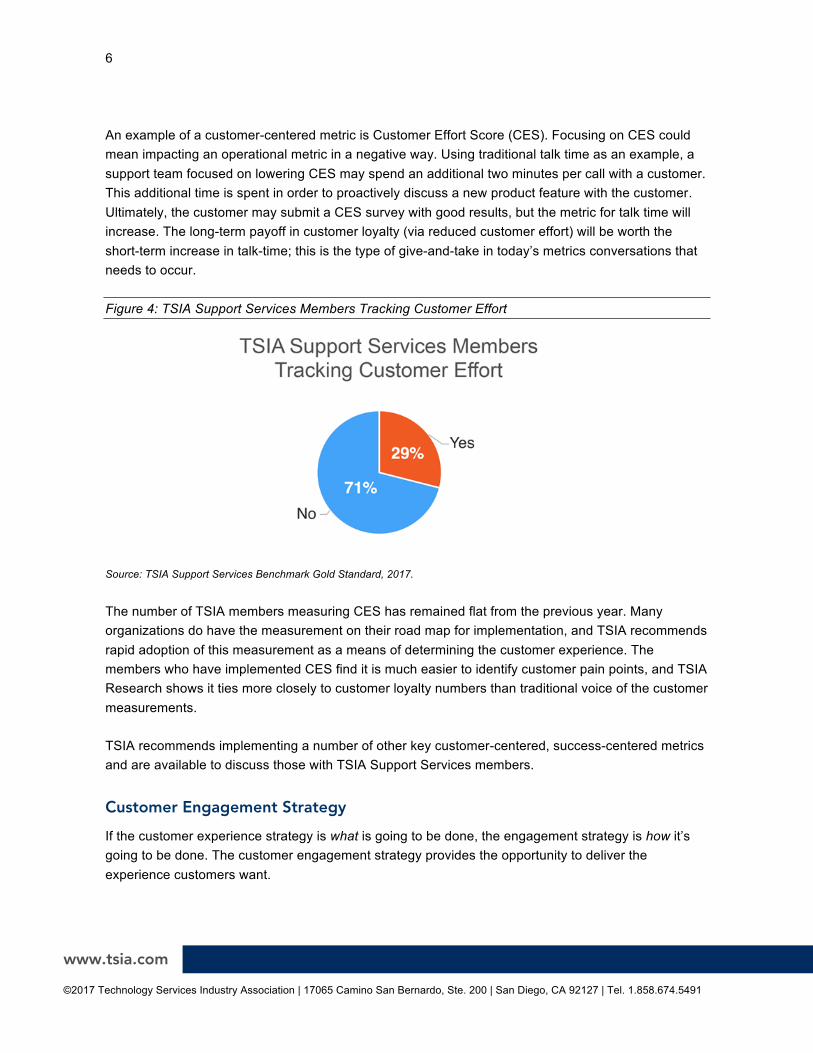
An example of a customer-centered metric is Customer Effort Score (CES). Focusing on CES could mean impacting an operational metric in a negative way. Using traditional talk time as an example, a support team focused on lowering CES may spend an additional two minutes per call with a customer. This additional time is spent in order to proactively discuss a new product feature with the customer. Ultimately, the customer may submit a CES survey with good results, but the metric for talk time will increase. The long-term payoff in customer loyalty (via reduced customer effort) will be worth the short-term increase in talk-time; this is the type of give-and-take in today’s metrics conversations that needs to occur.
Figure 4: TSIA Support Services Members Tracking Customer Effort
Source: TSIA Support Services Benchmark Gold Standard, 2017.
The number of TSIA members measuring CES has remained flat from the previous year. Many organizations do have the measurement on their road map for implementation, and TSIA recommends rapid adoption of this measurement as a means of determining the customer experience. The members who have implemented CES find it is much easier to identify customer pain points, and TSIA Research shows it ties more closely to customer loyalty numbers than traditional voice of the customer measurements.
TSIA recommends implementing a number of other key customer-centered, success-centered metrics and are available to discuss those with TSIA Support Services members.
Customer Engagement Strategy
If the customer experience strategy is what is going to be done, the engagement strategy is how it’s going to be done. The customer engagement strategy provides the opportunity to deliver the experience customers want.

www.tsia.com
©2017 Technology Services Industry Association | 17065 Camino San Bernardo, Ste. 200 | San Diego, CA 92127 | Tel. 1.858.674.5491
7
As TSIA benchmarks our members, we see a majority of members are making their way to the right-most box in Figure 5, but few have made the full evolution. This is proving to be a difficult journey for many reasons: changing engagement preferences on the customer side and changing engagement options with insufficient staffing and technology on the side of the support provider are two of the main reasons.
Figure 5: TSIA Support Services Engagement Evolution
Traditional channels, such as phone and email, remain common engagement channels throughout the industry, but for the first time in the history of TSIA benchmarking, incoming volume by self-service portal has surpassed the other channels.
Figure 6: Incoming Case Volume by Channel
Source: TSIA Support Services Benchmark Gold Standard, 2017

www.tsia.com ©2017 Technology Services Industry Association | 17065 Camino San Bernardo, Ste. 200 | San Diego, CA 92127 | Tel. 1.858.674.5491
8
Customers across all segments of the industry are now using self-service at greater rates and are looking for companies to continue to build out the self-service features. This is another key area where support can excel and create a differentiated customer experience. Self-service is no longer simply a place to search for knowledge articles or log service requests. The growth of communities and the power of having community champions will be a loyalty multiplier for technology companies. This is an actionable area that support can build/own and produce amazing return on investment.
TSIA encourages members to continue to survey their customers for their engagement preferences. Many companies do not believe their customers want social support, communities, mobile, or chat support (as examples). This belief can only be confirmed with a customer engagement survey. Survey customers for their preferences, and ask the full range of customers who interact with the support organization—not just the VP or CIO who is the primary contact. Each demographic and user type may have a unique set of preferences. These preferences will not necessarily indicate an immediate need to stand up each preferred channel, but these surveys will identify trends within the customer base and indicate areas for additional financial and technical investment in coming months and years.
As companies make the evolution to a fully unified engagement strategy, they will be enabling customers to have levels of connection they haven’t had in the past. This will drive higher expectations from customers as they do engage with both self-service and live agent support. An example of increased expectation in live-agent support will be the expectation for personalized support without regard for how the issue entered the system.
Analyzing Figure 7, 28% of the industry continues to route issues to the first available agent. Routing to the most appropriate skillset is second, at 27%, but this represents just above one-fourth of the industry providing this preferred routing option. While valuing the customer’s time and providing quick response times across channels is important, today it is even more important to provide customers with routing that shows alignment with an understanding of them and their issues, in other words, personalizing the experience. Customers will always value features of live-agent support, especially when the live agent is aware of what the customer owns, where the customer has been on their journey to seek support, and who can best support them, and then takes the necessary proactive steps to build loyalty by reducing customer effort.

www.tsia.com
©2017 Technology Services Industry Association | 17065 Camino San Bernardo, Ste. 200 | San Diego, CA 92127 | Tel. 1.858.674.5491
9
Figure 7: Primary Routing of Service Incidents
Source: TSIA Support Services Benchmark Gold Standard, 2017.
As the engagement evolution continues, with channels being rapidly added and subtracted, a key to unifying the customer experience is to ensure that the service is consistent. Consistency across channels, geographies, teams, product lines, and business units is necessary. This may sound obvious, but for most companies this is not happening today.
The common means to measuring service experience remains the post-transaction surveys. Post-transaction surveys should be conducted on each service channel, whether staffed by a live agent or not. Support organizations and their peer service groups, such as education, field, and professional services, continue to work to reduce cost of delivery by implementing robust self-service options. These organizations are working to implement these self-service options with low labor and low effort, but there will be considerable technical investment.
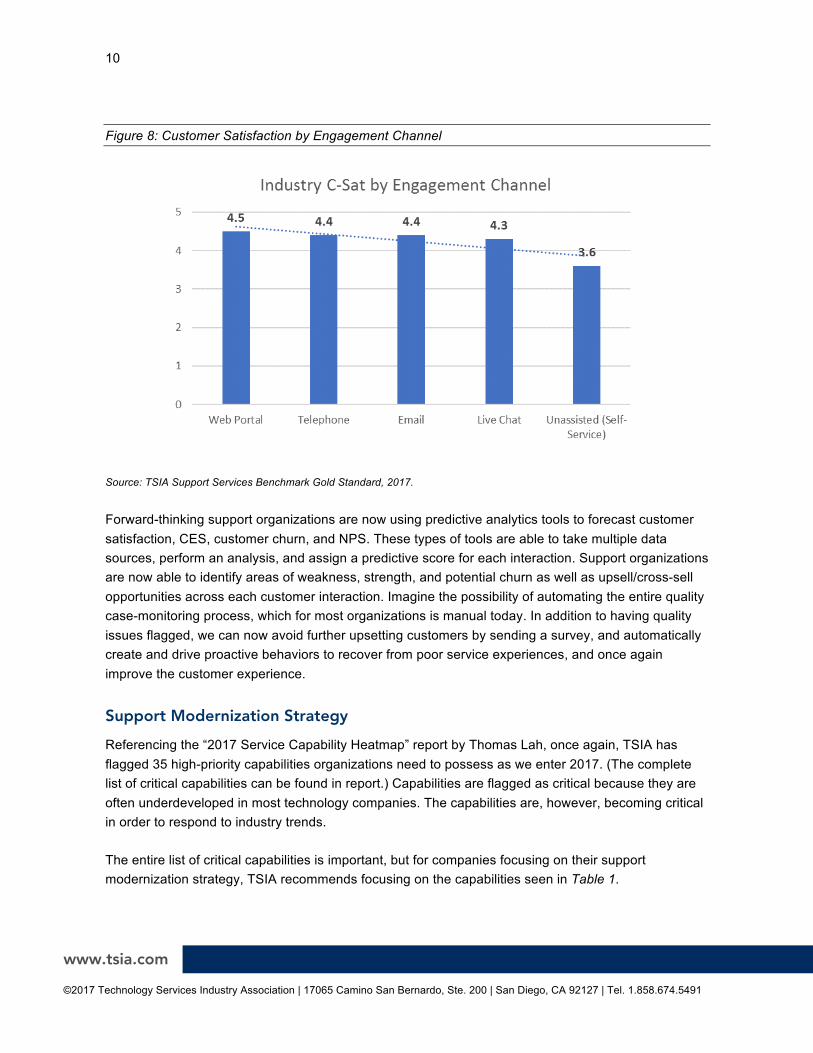
As Figure 8 highlights, there is a significant gap between live-agent and self-service satisfaction today. Industry companies will need to apply resources (both technical and people) to improve this performance in 2017. Companies need to assess if the areas of dissatisfaction are due to lack of features on the self-service portal (forums, automated chat, virtual agents), lack of knowledge content, lack of personalization, ease of use, etc. The variance in the satisfaction numbers speaks to inconsistent support experiences for customers. This lack of consistency will become a long-term loyalty issue if not addressed with corrective actions.
www.tsia.com ©2017 Technology Services Industry Association | 17065 Camino San Bernardo, Ste. 200 | San Diego, CA 92127 | Tel. 1.858.674.5491
10
Figure 8: Customer Satisfaction by Engagement Channel
Source: TSIA Support Services Benchmark Gold Standard, 2017.
Forward-thinking support organizations are now using predictive analytics tools to forecast customer satisfaction, CES, customer churn, and NPS. These types of tools are able to take multiple data sources, perform an analysis, and assign a predictive score for each interaction. Support organizations are now able to identify areas of weakness, strength, and potential churn as well as upsell/cross-sell opportunities across each customer interaction. Imagine the possibility of automating the entire quality case-monitoring process, which for most organizations is manual today. In addition to having quality issues flagged, we can now avoid further upsetting customers by sending a survey, and automatically create and drive proactive behaviors to recover from poor service experiences, and once again improve the customer experience.
Support Modernization Strategy
Referencing the “2017 Service Capability Heatmap” report by Thomas Lah, once again, TSIA has flagged 35 high-priority capabilities organizations need to possess as we enter 2017. (The complete list of critical capabilities can be found in report.) Capabilities are flagged as critical because they are often underdeveloped in most technology companies. The capabilities are, however, becoming critical in order to respond to industry trends.
The entire list of critical capabilities is important, but for companies focusing on their support modernization strategy, TSIA recommends focusing on the capabilities seen in Table 1.

www.tsia.com
©2017 Technology Services Industry Association | 17065 Camino San Bernardo, Ste. 200 | San Diego, CA 92127 | Tel. 1.858.674.5491
11
Table 1: Critical Capabilities for Support Modernization Strategy
Capability Description Driving Industry Trend
Service Compensation Models to Accelerate Revenue Growth through Account Expansion
We have developed compensation models that effectively incent services and customer support resources to drive expansion revenues with existing customers while maintaining strong customer relationships.
Blurring of Sales and Services
Customer Engagement Models to Drive Revenue Growth
We have optimized how we have defined and engaged our roles across the customer engagement model of land, adopt, expand, and renew to accelerate revenue growth cost efficiently.
Declining Product Revenues
Converging Service Resources
We successfully share billable and non-billable resources across existing service organizations.
Extreme Cost Optimization
Service Influence on Product Development
Data and experiences from service engagements effectively influence product development priorities.
Extreme Cost Optimization
Service Enablement Analytics
We mine data from customer service interactions and product usage feeds to increase service quality and reduce the cost to service customers.
Extreme Cost Optimization
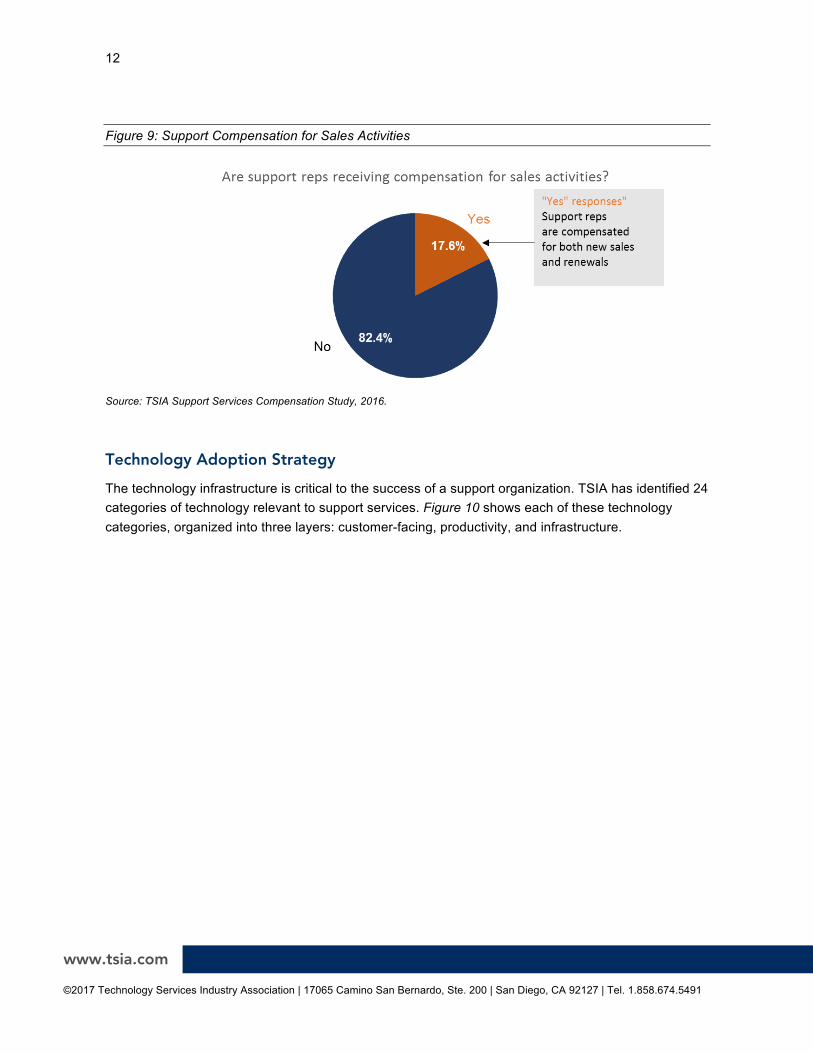
Historically, support compensation structures have not undergone significant change. Companies have experimented with things like tying bonus pay to company performance, whether to structure individual or team-based bonuses and whether to pay off-hours compensation. Today support executives and their business partners, such as human resources, finance, and sales, are faced with the opportunity to determine (1) if support can be a source of lead-generation activities, and (2) what type of compensation support should receive for such activities.
Figure 9 highlights the movement in the industry toward support representatives receiving compensa-tion for both new sales and renewal activities. Companies are looking to lower cost of sales and use resources who have already established customer relationships. Changing the conversation to selling being a service for your customers changes the long-standing wall built around this part of the busi-ness.
www.tsia.com ©2017 Technology Services Industry Association | 17065 Camino San Bernardo, Ste. 200 | San Diego, CA 92127 | Tel. 1.858.674.5491
12
Figure 9: Support Compensation for Sales Activities
Source: TSIA Support Services Compensation Study, 2016.
Technology Adoption Strategy
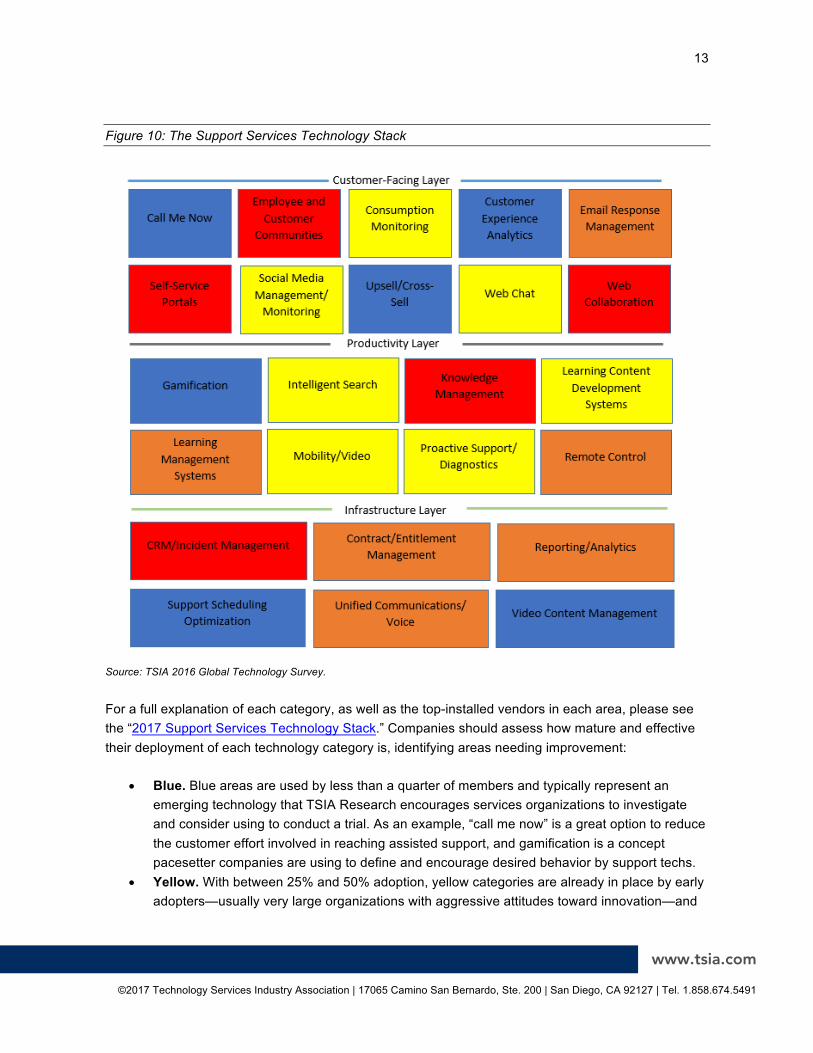
The technology infrastructure is critical to the success of a support organization. TSIA has identified 24 categories of technology relevant to support services. Figure 10 shows each of these technology categories, organized into three layers: customer-facing, productivity, and infrastructure.
www.tsia.com
©2017 Technology Services Industry Association | 17065 Camino San Bernardo, Ste. 200 | San Diego, CA 92127 | Tel. 1.858.674.5491
13
Figure 10: The Support Services Technology Stack
Source: TSIA 2016 Global Technology Survey.
For a full explanation of each category, as well as the top-installed vendors in each area, please see the “2017 Support Services Technology Stack.” Companies should assess how mature and effective their deployment of each technology category is, identifying areas needing improvement:
• Blue. Blue areas are used by less than a quarter of members and typically represent an emerging technology that TSIA Research encourages services organizations to investigate and consider using to conduct a trial. As an example, “call me now” is a great option to reduce the customer effort involved in reaching assisted support, and gamification is a concept pacesetter companies are using to define and encourage desired behavior by support techs.
• Yellow. With between 25% and 50% adoption, yellow categories are already in place by early adopters—usually very large organizations with aggressive attitudes toward innovation—and
www.tsia.com ©2017 Technology Services Industry Association | 17065 Camino San Bernardo, Ste. 200 | San Diego, CA 92127 | Tel. 1.858.674.5491
14
are now beginning to find their way into small and medium-sized firms. A good example of a cool technology is proactive support, which monitors equipment at remote customer sites to detect outages or errors needing attention. Yellow categories offer a few early success stories, but less of a solid blueprint for success, which is a good time for smaller and more conservative firms to evaluate current options, look for new market entrants, and consider investing in within one to two years.
• Orange. Once a technology is used by 50% to 75% of members, the ROI story should be established and well understood. If you have yet to invest in an orange category, you are already behind the curve and should create some MBOs for employees to begin investigating business impacts from these tools or services, average project costs, top-deployed vendors, and when an investment should be made.
• Red. When technologies are highly adopted, it is no longer a question of should you invest, but rather, is the anticipated return on the investment being received? In areas like knowledge management and self-service portals, you should have a mature implementation that employees and/or customers enjoy using, which deliver usable, helpful reports with all the required integrations mapped and complete. You should have a clear understanding of which metrics the project impacted, and by how much. If your results are not stellar, or your program peaked and is becoming less effective, identifying problems and creating a “get well” plan is important for any red category.
2017 Support Services Research Agenda
TSIA Research has a number of planned research studies and published research reports for 2017, capturing metrics and best practices related to areas of support operations with the highest interest. At the core of TSIA’s support services research is the Support Services Benchmark, an ongoing survey designed to help companies understand how they compare to industry peers with financial and operational metrics. The 2017 research studies applicable to support services members can be found in Table 2.

www.tsia.com
©2017 Technology Services Industry Association | 17065 Camino San Bernardo, Ste. 200 | San Diego, CA 92127 | Tel. 1.858.674.5491
15
Table 2: 2017 Publications
Document Title Subtype Abstract Publication Date
Author
Support Services Benchmark Survey
Executive Insight
Compares companies’ support organization business practices, results, and metrics against the industry and corresponding peer group. Provides insights into current industry and service trends that will affect the member’s organization. Addresses all areas that will enable companies to resolve their support services business challenges and drive business transformation.
Perpetual Judith Platz
The State of Social Support 2017
Technology Insight
TSIA’s Social Support Survey tracks best practices related to both online customer communities and supporting customers via social media channels.
2/1/2017 John Ragsdale
Support Services Best Practices 2017
Service Insight
This paper presents best practices support services organizations should implement across people, process, and technology for their support services organizations. Case studies from pacesetter organizations and emerging trends are shared.
3/25/2017 Judith Platz
2017 Technology Adoption and Spending: Support Services
Technology Insight
This report is based on the findings of the 2017 TSIA Global Technology Survey, which asks members what technology and services they are using, how satisfied they are with them, and in what areas they have plans for additional investments in 2017-2018. This report documents details for technology used for support services.
5/1/2017 John Ragsdale
www.tsia.com ©2017 Technology Services Industry Association | 17065 Camino San Bernardo, Ste. 200 | San Diego, CA 92127 | Tel. 1.858.674.5491
16
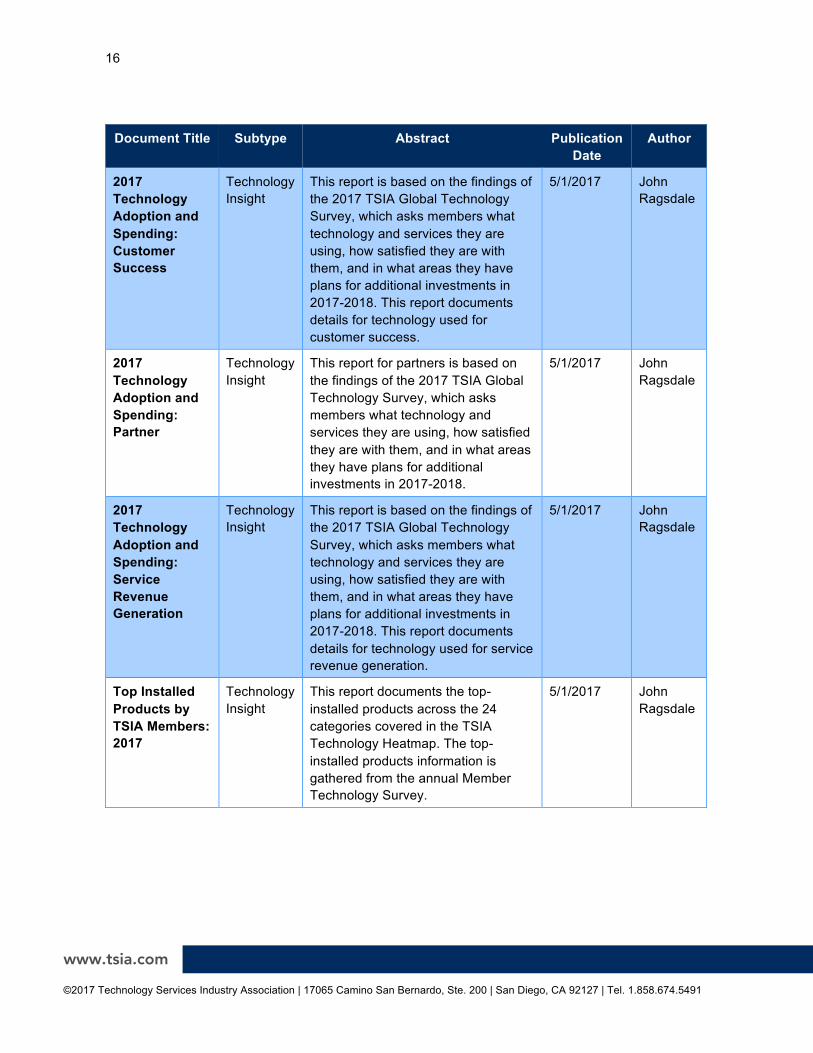
Document Title Subtype Abstract Publication Date
Author
2017 Technology Adoption and Spending: Customer Success
Technology Insight
This report is based on the findings of the 2017 TSIA Global Technology Survey, which asks members what technology and services they are using, how satisfied they are with them, and in what areas they have plans for additional investments in 2017-2018. This report documents details for technology used for customer success.
5/1/2017 John Ragsdale
2017 Technology Adoption and Spending: Partner
Technology Insight
This report for partners is based on the findings of the 2017 TSIA Global Technology Survey, which asks members what technology and services they are using, how satisfied they are with them, and in what areas they have plans for additional investments in 2017-2018.
5/1/2017 John Ragsdale
2017 Technology Adoption and Spending: Service Revenue Generation
Technology Insight
This report is based on the findings of the 2017 TSIA Global Technology Survey, which asks members what technology and services they are using, how satisfied they are with them, and in what areas they have plans for additional investments in 2017-2018. This report documents details for technology used for service revenue generation.
5/1/2017 John Ragsdale
Top Installed Products by TSIA Members: 2017
Technology Insight
This report documents the top-installed products across the 24 categories covered in the TSIA Technology Heatmap. The top-installed products information is gathered from the annual Member Technology Survey.
5/1/2017 John Ragsdale

www.tsia.com
©2017 Technology Services Industry Association | 17065 Camino San Bernardo, Ste. 200 | San Diego, CA 92127 | Tel. 1.858.674.5491
17
Document Title Subtype Abstract Publication Date
Author
2017 Technology Services Heatmap
Technology Insight
This report is based on the findings of the 2017 TSIA Global Technology Survey, which asks members what technology and services they are using, how satisfied they are with them, and in what areas they have plans for additional investments in 2017-2018. The report shows overall adoption levels of 24 categories of tools and services to allow member companies to compare their rate of technology adoption to their peers.
5/1/2017 John Ragsdale
2017 Technology Adoption and Spending: EMEA
Technology Insight
This report is based on the findings of the 2017 TSIA Global Technology Survey, which asks members what technology and services they are using, how satisfied they are with them, and in what areas they have plans for additional investments in 2017-2018.
5/1/2017 John Ragsdale
State of the Support Channel Mix: 2017
Executive Insight
This report will outline what TSIA member companies’ channel mix looks like in 2017, and how that has changed over the past 18 months. TSIA will also share data on what shifts are underway with chat, video, social media, and self-service, as well as how pacesetter companies are shifting from high-cost to low-cost channels; the methods being used to track activity, performance, satisfaction, and effectiveness; and how companies are blending these various channels into one seamless experience for the customer.
7/15/2017 Judith Platz
The State of Knowledge Management: 2017
Technology Insight
TSIA’s annual Knowledge Management Survey includes findings regarding KM staffing, corporate culture, collaboration, and more.
10/16/2017 John Ragsdale

www.tsia.com ©2017 Technology Services Industry Association | 17065 Camino San Bernardo, Ste. 200 | San Diego, CA 92127 | Tel. 1.858.674.5491
18
Document Title Subtype Abstract Publication Date
Author
2017 Support Services Channel Mix
Service Insight
This report will outline what TSIA member companies’ mix looks like in 2017, what has changed, and highlight emerging trends. Data will cover not just phone, email, and web portal, but also chat, video, social media, and self-service.
12/25/2017 Judith Platz
How TSIA Can Help
At TSIA, our mission is to leverage industry data to document best practices for optimizing technology business models. Specifically, we encourage member companies to leverage the following TSIA capabilities:
• TSIA Conferences. TSIA brings industry professionals together twice a year to share and learn. Our next conference will be focused on organizational structure in a world of recurring revenue. For more information on conferences, visit http://www.technologyservicesworld.com/.
• Industry Performance Data. Benchmark your company performance against best-in-class performance. TSIA currently tracks 870 industry performance metrics and financial results related to optimizing technology business models. For more information on TSIA data sets, visit https://www.tsia.com/research/benchmarking.html.
• TSIA Solution Widgets. Based on the specific business challenge you are working on, use the TSIA Solution Widget tool to find relevant research and content that can help your company with this challenge. For more information, visit https://www.tsia.com/tsia-solution-widget.html.
• TSIA Outcome Chains. TSIA is leveraging new software to build “outcome chains.” Each outcome chain is centered on a specific target outcome, such as “Grow Customer Adoption.” For more information, visit https://app.outcomechains.com/?ref=tsia.com.
• TSIA Workshops. Having trouble getting folks aligned? Or looking for ways to jumpstart a team working on a new initiative? Invite a TSIA research expert to help accelerate the discussion. Workshops can last from two hours to two days. They can be delivered on site or virtually. For more information, visit https://www.tsia.com/strategic-services/about-strategic-services.html#workshops.
• TSIA Outcome Sprints. Finally, TSIA can work with your company in a series of touchpoints designed to achieve specific outcomes you are targeting. For more information on TSIA Outcome Sprints, visit https://www.tsia.com/strategic-services/about-strategic-services.html#sprints.