the state of sustainable markets 2018...wozniak, and duc dang (2018), the state of sustainable...
TRANSCRIPT
The State of Sustainable Markets 2018STATISTICS AND EMERGING TRENDS
In collaboration with:

CoffeeCocoa
TeaOil palm
Cotton
BananasSugarcaneSoybeans
Forestry
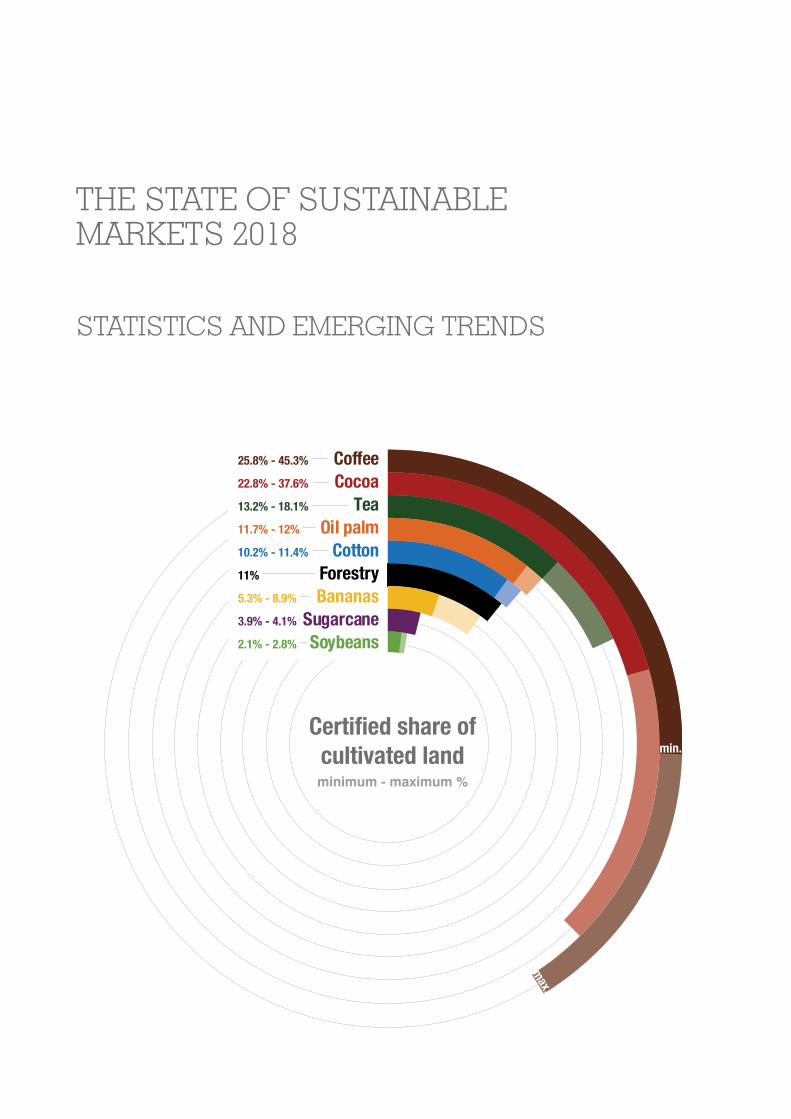
25.8% - 45.3%
22.8% - 37.6%
13.2% - 18.1%
11.7% - 12%
10.2% - 11.4%
5.3% - 8.9%
3.9% - 4.1%
2.1% - 2.8%
11%
min.
max.
Certified share of cultivated land minimum - maximum %
How much of the world’s agricultural and forestry production is certified as sustainable?
This is the world's most comprehensive report on sustainable markets, with data from 14 major sustainability standards for eight agricultural products, plus forestry.The chart gives a snapshot of sustainable production today. It shows how much cultivated land is certified by at least one sustainability standard.At least a quarter of the world's land dedicated to coffee, for example, is now certified. But the real share may be closer to half of the world's coffee areas. This minimum and maximum range for each product is given because many producers have multiple certifications. (For more about how the data is captured and assessed, see Chapter 4.)
CoffeeCocoa
TeaOil palm
Cotton
BananasSugarcaneSoybeans
Forestry
25.8% - 45.3%
22.8% - 37.6%
13.2% - 18.1%
11.7% - 12%
10.2% - 11.4%
5.3% - 8.9%
3.9% - 4.1%
2.1% - 2.8%
11%
min.
max.
Certified share of cultivated land minimum - maximum %
How much of the world’s agricultural and forestry production is certified as sustainable?
This is the world's most comprehensive report on sustainable markets, with data from 14 major sustainability standards for eight agricultural products, plus forestry.The chart gives a snapshot of sustainable production today. It shows how much cultivated land is certified by at least one sustainability standard.At least a quarter of the world's land dedicated to coffee, for example, is now certified. But the real share may be closer to half of the world's coffee areas. This minimum and maximum range for each product is given because many producers have multiple certifications. (For more about how the data is captured and assessed, see Chapter 4.)
THE STATE OF SUSTAINABLE MARKETS 2018
STATISTICS AND EMERGING TRENDS

ii
Voluntary sustainability standards continue their growth across the world.
This third global report provides new insights into the evolution of certified agriculture and forestry. ITC has teamed up once more with the Research Institute of Organic Agriculture (FiBL) and the International Institute for Sustainable (IISD) to provide data about 14 major sustainability standards for bananas, cocoa, coffee, cotton, palm oil, soybeans, cane sugar, tea and forestry products. This report helps shape decisions of policymakers, producers and businesses, working to address systemic labour and environmental challenges through certified sustainable production.
Title: The State of Sustainable Markets 2018: Statistics and Emerging Trends
Publisher: International Trade Centre (ITC), International Institute for Sustainable (IISD), Research Institute of Organic
Agriculture (FiBL)
Publication date and place: October 2018, Geneva
Page count: 198
Language: English
ISBN: 978-92-9137-408-3
eISBN: 978-92-1-047447-4
Print ISSN: 2617-5452
eISSN: 2617-5460
United Nations Sales Number: E.18.III.T.2
ITC Document Number: P39.E/DEI/SIVC/18-X
Citation: Julia Lernoud, Jason Potts, Gregory Sampson, Bernhard Schlatter, Gabriel Huppe, Vivek Voora, Helga Willer, Joseph Wozniak, and Duc Dang (2018), The State of Sustainable Markets – Statistics and Emerging Trends 2018. ITC, Geneva. Contact: Gregory Sampson ([email protected]) at ITC or Julia Lernoud ([email protected]) and Helga Willer ([email protected]) at FiBL.
For more information, see Sustainability Map (www.sustainabilitymap.org) and visit the Trends module which presents data taken from this publication using interactive charts and graphs.
The authors confirm the information in this report to be correct to the best of their knowledge. Views by the authors and publishers are not subject to any obligation or imply the expression of any opinion whatsoever on their part; neither do they accept responsibility or liability for any possible mistakes, or for any consequences of actions taken by readers based on statements or advice contained therein. The views expressed herein do not reflect the official opinions of State Secretariat for Economic Affairs (SECO) and the standards/initiatives covered in this report.
The designations employed and the presentation of material in this publication do not imply the expression of any opinion whatsoever on the part of the International Trade Centre concerning the legal status of any country, territory, city or area or of its authorities, or concerning the delimitation of its frontiers or boundaries.
All rights reserved. No part of this publication may be reproduced, stored in a retrieval system or transmitted in any form or by any means electronic, electrostatic, magnetic tape, mechanical, photocopying or otherwise, without prior permission in writing from the International Trade Centre.
Digital image on the cover: © Shutterstock
© International Trade Centre (ITC). www.intracen.org
ITC is the joint agency of the World Trade Organization and the United Nations.
iii
FOREWORD
The environment is at a global tipping point. Production and consumption as usual is no longer an option. With a little over a decade left to achieve the United Nations Sustainable Development Goals (SDGs) of the 2030 Agenda, we must speed up our actions and pilot solutions to existing problems. This takes global partnerships. It also takes reassessing the entire production and consumption value chain.
Producers, processors, brands, retailers and consumers have a responsibility to move towards a consensus on sustainability.
Why change our approach to how we produce and consume? A quick glance at commodity-based value chains is enlightening.
Bananas are the world’s most popular fruit. The industry is the world’s second largest user of agrochemicals, after cotton. What’s more, virtually all bananas sold internationally are of one type, making bananas especially susceptible to changes in the market, in quality, and in consumer preferences.
Cocoa is another industry that deserves a deep dive. What are the realities of the smallholder farming and income opportunities along the cocoa value chain? How can we better close the price gap between the final product price and what the farmer actually gets in his or her pocket?
The cotton industry is another value chain susceptible to environmental change. In a time of water scarcity and continued population growth, the cotton industry is notorious for high water use and volatile prices.
Tea is the world’s most popular drink (after water). To grow and process tea, deforestation and soil erosion are still common, along with worker safety related to agrochemical use.
In the sugarcane industry, a rapid rise in production addresses fast-growing consumer demand – at the cost of biodiversity in fragile ecosystems.
In many of these value chains, there also remains the spectre of child labour, forced labour and unjust conditions. Cleaning these value chains requires more than just greening them – we must ensure zero tolerance to any aspect of human rights abuses.
What can we do about it? How can we transform ‘business as usual’ into a more conscious approach to global sustainability?
While there is no silver bullet, we can make a difference by producing and consuming more sustainably. When consumers insist on accountability that protects their own health, the well-being of workers and that of our planet, big buyers listen. As a result, many buyers are increasingly working with producers using voluntary sustainability standards. For example, more than one-quarter of the world’s coffee is produced using such standards.
Sustainability standards provide assurances that purchases support sustainability, and better connect consumers and producers. In doing so, these standards have become a mechanism to support SDG 12, which focuses on sustainable consumption and production.
While these standards have improved environmental and social conditions for production, data behind these standards are not always clear or comparable. This matters, because consumers, businesses and governments need accurate intelligence to make decisions that bring positive change.
The State of Sustainable Markets is the most comprehensive global data source available for certified agricultural commodity markets. Fulfilling its mandate to provide transparency and market intelligence on trade, ITC has teamed up with major research institutions and 14 of the world’s largest sustainability

iv
standards organizations for the eight agricultural products and forestry covered in this report. The data is updated constantly, using common methodology and reporting procedures.
ITC is pleased to partner with the Research Institute of Organic Agriculture (FiBL) and the International Institute for Sustainable Development to produce the third edition of this report, offering new insights into the evolution of certified markets.
The report shows that agricultural land on which certified commodities are grown continues to increase, in some cases, surpassing the 20% mark. Cotton-certified areas are witnessing the highest growth rate, tripling between 2011 and 2016. Cocoa also almost tripled in area; and oil palm and tea-certified areas more than doubled during the same five-year span.
However, between 2015 and 2016, oil palm registered substantial declines (11.5% less than in 2015) as well as sugarcane (7.9% less).
While this report focuses on production, it is useful for a wide audience of policymakers, retailers, producer associations, investors, trade and investment support institutions – and even for the conscious consumer. The report provides insights for those who attach importance to the social and environmental conditions behind the products produced in their countries or sold in their nation’s supermarkets.
Policymakers are getting the message and seeking to improve national production, lest they lose out to more sustainable locations for doing business. But challenges remain: high costs of certification; lack of harmonization among sustainability standards; and certification fatigue among brands and retailers looking to improve the situation on the ground without duplicative audits and elusive results.
In short, this year’s report provides evidence that there is continued demand for sustainable production, and great scope for addressing challenges that can scale up sustainable trade – and help the world move away from ‘business as usual’.
Arancha GonzálezExecutive DirectorInternational Trade Centre

v
ACKNOWLEDGEMENTS
The Research Institute of Organic Agriculture (FiBL), the International Institute for Sustainable Development (IISD) and the International Trade Centre (ITC) are very grateful to the Swiss State Secretariat for Economic Affairs (SECO) for its financial support of the global data collection on voluntary sustainability standards and the production of this publication.
Further acknowledgements are due to all the standard-setting organizations that collaborated on the report: 4C, Better Cotton Initiative (BCI), Bonsucro, Cotton Made in Africa (CmiA), GLOBALG.A.P., Fairtrade International, Forest Stewardship Council (FSC), IFOAM – Organics International, the Programme for the Endorsement of Forest Certification (PEFC), ProTerra Foundation, Rainforest Alliance (RA), the Roundtable on Sustainable Palm Oil (RSPO), the Round Table on Responsible Soy (RTRS) and UTZ.
The publishers would like to acknowledge Jason Potts, (1967 to 2018) whose work on advancing sustainable development through the design and use of effective voluntary standards and initiatives provided inspiration for developing the State of Sustainable Markets reports. At IISD, Jason led the State of Sustainability Initiatives, which tracks and issues regular reports on the characteristics, performance and market trends of sustainability initiatives internationally. His innovative leadership resulted in the creation of globally respected entities as the Committee on Sustainability Assessment, the Finance Alliance for Sustainable Trade and the Sustainable Commodity Assistance Network, all of which champion sustainable trade.
The publishers also wish to thank the following individuals, without whose contribution this report would not have been possible:
Oshin Abrami, GLOBALG.A.P., Cologne; Jesús Aguirre Chávez, Fairtrade International, Bonn; Thorsten Arndt, PEFC International, Geneva; Shannon Avison, BCI, Geneva; Ana Patricia Batalhone, ITC, Geneva; Christina Ben Bella, CmIA, Hamburg; Thomas Bernet, FiBL, Frick; Joseph Cameron Booth, RA, London; Christina Bredehorst, CmiA, Hamburg; Daniel Castro, Fairtrade International, Bonn; Alice Correa, ProTerra Foundation, Bilthoven; William Crosse, RA, London; Maira Devisscher, International Social and Environmental Accreditation and Labelling (ISEAL) Alliance, London; Anne Dullemeijer, UTZ, Amsterdam; Lisa Emberson, Textile Exchange, London; Christina Endemann, FSC International, Bonn; Augusto Freire, ProTerra Foundation, Bilthoven; Salvador Garibay, FiBL, Frick; Yannic Grewe, GLOBALG.A.P., Cologne; Juan Isaza, Global Coffee Platform, Bonn; Marion Karmann, FSC International, Bonn; Daniel Kazimierski, RTRS, Buenos Aires; Laura Kemper, FiBL, Frick; Kristin Komives, ISEAL Alliance, London; Karin Kreider, ISEAL Alliance, London; Marta Maireles, ISEAL Alliance, London; Marta Martínez Pardo, PEFC International, Geneva; Claudia Meifert, GLOBALG.A.P., Cologne; Arisbe Mendoza, Fairtrade International, Bonn; Monika Messmer, FiBL, Frick; Kristian Moeller, GLOBALG.A.P., Cologne; Bernadette Oehen, FiBL, Frick; Soo Chin Oi, RSPO, Kuala Lumpur; Kendra Pasztor, BCI, Geneva; Alexandra Perschau, CmIA, Hamburg; Eleanor Radford, ISEAL Alliance, London; Aimee Russillo, Liseed, Kentucky; Bernhard Schlatter, FiBL, Frick; Monika Schneider, FiBL, Frick; Rafael Seixas, Bonsucro, London; Sonia Slavinski, Bonsucro, London; Maria-Verena Spohler-Kouoh, CmIA, Hamburg; Alexia Stumpf, ProTerra Foundation, Bilthoven; Evonne Tan, Textile Exchange, Petaling Jaya; Liesl Truscott, Textile Exchange, Bath; Nahuel Tuñon, Bonsucro, London; Rob Ukkerman, FSC International, Bonn; Andrea Valenzuela, RA, San José; Paul van den Berge, FiBL, Frick; Inke van der Sluijs, RSPO, Kuala Lumpur; Jan Van Driel, RSPO, Kuala Lumpur; Nicolas Viart, Bonsucro, London; Laura Villegas, RTRS, Buenos Aires; Marcelo Visconti, RTRS, Buenos Aires; Walter Gerrit, Fairtrade International, Bonn; George Watene, Global Coffee Platform, Bonn; Tessa Witte-Laan, UTZ, Amsterdam.
Erica Meltzer, the editor of the report; Natalie Domeisen and Evelyn Seltier, ITC, for editorial management and quality control; Kristina Golubic, ITC, for design; Serge Adeagbo and Franco Iacovino, ITC, for printing.
vi
PROJECT PARTNERS
The International Trade Centre (ITC), founded in 1964, is the joint agency of the World Trade Organization and the United Nations. Its aim is for businesses in developing countries to become more competitive in global markets, to speed up economic development and to contribute to the achievement of the United Nations Sustainable Development Goals.
Trade for Sustainable Development (T4SD) is ITC’s partnership-based programme that helps businesses chart their path to more sustainable trade. The programme offers access to wide-ranging information for trade-related sustainability initiatives and standards. Building on well-established online tools, such as Standards Map and SustainabilityXchange, ITC launched a new platform, the Sustainability Map, in September 2017. It provides new features, such as the Sustainability Network. The online platform enables users, regardless of their position in the value chain, to better understand the sustainability initiatives landscape and to connect with business partners.
The Research Institute of Organic Agriculture (FiBL), founded in 1973, links interdisciplinary research to the rapid transfer of knowledge from research to extension to agricultural practice, drawing on advisory work, training and conferences. FiBL has offices in Austria, France, Germany and Switzerland, as well as a representative office in Brussels. It also undertakes numerous projects and initiatives in Africa, Asia, Europe and Latin America.
FiBL has more than 15 years of experience in collecting and publishing data on organic agriculture. Since 2000, it has developed a network of some 200 experts from 180 countries, all of whom contribute to data collection. Every year, FiBL and IFOAM – Organics International jointly publish The World of Organic Agriculture, which documents recent developments in the field worldwide. Since 2008, this global data collection has been financially supported by the Swiss State Secretariat for Economic Affairs (SECO) in collaboration with ITC. NürnbergMesse, organizer of the BIOFACH organic food fair, and IFOAM – Organics International also provide support. See www.organic-world.net.
FiBL works to encourage sustainable production in the food and agriculture sector, in part by contributing to the development of the guidelines for Sustainability Assessment of Food and Agriculture Systems (SAFA), published in 2013 by the Food and Agriculture Organization of the United Nations (FAO). Based on those guidelines, FiBL developed the Sustainability Monitoring and Assessment RouTine (SMART), which is now widely used for transparent and comparable assessments of the sustainability performance of farms and the impacts of voluntary standards.
The International Institute for Sustainable Development (IISD) is a public policy research institute renowned for its cutting-edge research on sustainable development. Established in 1990, its mission is to promote human development and environmental sustainability through innovative research, communication and partnerships. The Institute has offices in Canada, China, Switzerland and the United States, and operates in over 70 countries. Its projects are funded by numerous Governments, United Nations agencies, foundations, the private sector and individuals.
IISD has been assessing the characteristics, performance and market trends of voluntary sustainability standards (VSS) via the State of Sustainability Initiatives (SSI) project since 2008. The SSI Reviews of 2010 and 2014 are the most comprehensive reports published to date offering supply-chain decision makers – including procurement agents, investment advisers, CEOs, policymakers, sustainability initiatives and non-governmental organizations – the high-level data and analysis needed to navigate the increasingly complex world of sustainability standards. The Institute was also instrumental in establishing the Committee on Sustainability Assessment and the Sustainable Commodity Assistance Network, which are now independent organizations focused respectively on measuring sustainability impact and building capacity for the adoption of VSS. In addition to conducting strategic policy research and analysis on standards, IISD continues to make important contributions to sustainable consumption and production through its sustainable markets and responsible trade programme.
vii
CONTENTS
Foreword iii
Acknowledgements v
Project partners vi
Acronyms, units and measures xiv
Executive summary xv
Chapter 1
SUSTAINABILITY STANDARDS: IN THE MAINSTREAM 1
TRENDS IN VOLUNTARY SUSTAINABILITY STANDARDS 3
HIGHLIGHTS BY AGRICULTURAL AND FORESTRY PRODUCTS 7
Chapter 2
GETTING TO KNOW STANDARD-SETTERS 11
4C 12
BETTER COTTON INITIATIVE 16
BONSUCRO 20
COTTON MADE IN AFRICA 22
FAIRTRADE INTERNATIONAL 26
FOREST STEWARDSHIP COUNCIL 32
GLOBAL G.A.P. 36
IFOAM – ORGANICS INTERNATIONAL 42
PROGRAMME FOR THE ENDORSEMENT OF FOREST CERTIFICATION 49
PROTERRA FOUNDATION 52
RAINFOREST ALLIANCE 55
ROUNDTABLE ON SUSTAINABLE PALM OIL 59
ROUND TABLE ON RESPONSIBLE SOY 62
UTZ 65
Chapter 3
FAST GROWTH IN AGRICULTURE AND FORESTRY 71
BANANAS 72
COCOA 80
COFFEE 88
COTTON 97
PALM OIL 104

viii
SOY 110
SUGARCANE 116
TEA 122
FORESTRY 130
Chapter 4
METHODOLOGY AND DATA SOURCES 135
METHODOLOGY 136
KEY ISSUES AND SUGGESTIONS IN DATA COLLECTION 139
DATA SOURCES 140
Appendix I
GEOGRAPHIC OVERVIEW BY PRODUCT AND STANDARD 143
BANANAS 144
COCOA 147
COFFEE 149
COTTON 153
PALM OIL 155
SOY 157
SUGARCANE 159
TEA 161
FORESTRY 163
Appendix II
REFERENCES AND FURTHER READING 169

ix
TABLES
Table 1: Selected commodities: Minimum area 2016, 1-year growth, 2015–2016, and 6 years’ growth, 2011–2016 4
Table 2: 4C: Key indicators 12
Table 3: Better Cotton Initiative: Key indicators 16
Table 4: Bonsucro: Key indicators 20
Table 5: Cotton made in Africa: Key indicators 22
Table 6: Fairtrade International: Key indicators 27
Table 7: Forest Stewardship Council: Key indicators 33
Table 8: GLOBALG.A.P.: Key indicators 36
Table 9: Organic: Key indicators 43
Table 10: Programme for the Endorsement of Forest Certification Schemes: Key indicators 49
Table 11: ProTerra Foundation: Key indicators 52
Table 12: Rainforest Alliance: Key indicators 55
Table 13: Roundtable on Sustainable Palm Oil: Key indicators 59
Table 14: Round Table on Responsible Soy: Key indicators 62
Table 15: UTZ: Key indicators 66
Table 16: Bananas: Fairtrade International 2016 144
Table 17: Bananas: GLOBALG.A.P. 2016 144
Table 18: Bananas: Organic 2016 145
Table 19: Bananas: Rainforest Alliance 2016 146
Table 20: Cocoa: Fairtrade International 2016 147
Table 21: Cocoa: Organic 2016 147
Table 22: Cocoa: Rainforest Alliance 2016 148
Table 23: Cocoa: UTZ 2016 148
Table 24: Coffee: 4C 2016 149
Table 25: Coffee: Fairtrade International 2015 149
Table 26: Coffee: Organic 2016 150
Table 27: Coffee: Rainforest Alliance 2016 151
Table 28: Coffee: UTZ 2016 152
Table 29: Cotton: Better Cotton Initiative 2016 153
Table 30: Cotton: Fairtrade International 2016 153
Table 31: Cotton: Organic 2016 154
Table 32: Oil palm: Organic 2016 155
Table 33: Oil palm: Rainforest Alliance 2016 155
Table 34: Oil palm: Roundtable on Sustainable Palm Oil 2016 156
Table 35: Soybeans: Organic 2016 157
Table 36: Soybeans: ProTerra Foundation 2016 158
Table 37: Soybeans: Round Table on Responsible Soy 2016 158
Table 38: Sugarcane: Bonsucro 2016 159
Table 39: Sugarcane: Fairtrade International 2016 159
Table 40: Sugarcane: Organic 2016 160
Table 41: Tea: Fairtrade International 2016 161
Table 42: Tea: Organic 2016 161
Table 43: Tea: Rainforest Alliance 2016 162
Table 44: Tea: UTZ 2016 162
Table 45: Forestry: Forest Stewardship Council 2016 163
Table 46: Forestry: Programme for the Endorsement of Forest Certification 2016 165

x
FIGURES
Figure 1: Growing fast – Selected products certified by sustainability standards (minimum possible), 2008 – 2016 4
Figure 2: Certified area by standard, 2016 5
Figure 3: Certified area by standard and selected agricultural products, 2016 6
Figure 4: 4C: Certified area, 2008–2016 13
Figure 5: 4C: Production volume and production volume sold under the 4C label, 2008–2016 14
Figure 6: 4C: 2016 close-up – Top 10 countries by area 14
Figure 7: 4C: Top 10 countries (percentage of total coffee area), 2016 15
Figure 8: 4C: 2016 close-up – Production volume by country 15
Figure 9: Better Cotton Initiative: Certified area, 2010–2016 17
Figure 10: Better Cotton Initiative: Cotton lint production volume, 2010–2016 17
Figure 11: Better Cotton Initiative: 2016 close-up – Top countries by area 18
Figure 12: Better Cotton Initiative: Top countries (percentage of total cotton area), 2016 18
Figure 13: Better Cotton Initiative: 2016 close-up – Cotton lint production volume by country 19
Figure 14: Bonsucro: Certified area, 2011–2016 21
Figure 15: Bonsucro: Cane sugar production volume, 2011–2016 21
Figure 16: Cotton Made in Africa: Certified area, 2009–2016 23
Figure 17: Cotton made in Africa: Production volume, 2009–2016 23
Figure 18: Cotton Made in Africa: 2015 close-up – Top countries by area 24
Figure 19: Cotton Made in Africa: Top 10 countries (percentage of total seed cotton area), 2015 24
Figure 20: Cotton made in Africa: Producers by country, 2015 25
Figure 21: Cotton made in Africa: Production volume by country, 2015 25
Figure 22: Fairtrade International: Certified area, 2011–2015 27
Figure 23: Fairtrade International: 2015 close-up – Top 10 countries by area 28
Figure 24: Fairtrade International: Top 10 countries (percentage of total agricultural area), 2015 28
Figure 25: Fairtrade International: Area by region, 2015 29
Figure 26: Fairtrade International: Top 10 products by area, 2015 29
Figure 27: Fairtrade International: Production volume and production volume sold under the Fairtrade label, 2011–2015 30
Figure 28: Fairtrade International: Retail sales, 2004–2015 30
Figure 29: Fairtrade International: Top 10 countries by retail sales, 2015 31
Figure 30: Fairtrade International: Retail sales by region, 2015 31
Figure 31: Forest Stewardship Council: Certified area, 2004–2016 33
Figure 32: Forest Stewardship Council: 2016 close-up – Top 10 countries by area 34
Figure 33: Forest Stewardship Council: Area by region, 2016 34
Figure 34: Forest Stewardship Council: Forest Management by region, 2016 35
Figure 35: GLOBALG.A.P.: Certified area, 2010–2016 37
Figure 36: GLOBALG.A.P.: Area by region, 2016 38
Figure 37: GLOBALG.A.P.: 2016 close-up – Top 10 countries by area 38
Figure 38: GLOBALG.A.P.: Producers, 2010–2016 39
Figure 39: GLOBALG.A.P.: Top 10 countries by certified producers, 2016 39
Figure 40: GLOBALG.A.P: Producers by region, 2016 40
Figure 41: GLOBALG.A.P.: Top 10 non-covered crops by area, 2016 40
Figure 42: GLOBALG.A.P.: Top 10 covered crops by area, 2016 41
Figure 43: Organic: Certified area, 1999–2016 43
Figure 44: Organic: 2016 close-up – Top 10 countries by area 44
Figure 45: Organic: Area by region, 2016 44
xi
Figure 46: Organic: Top countries and territories (percentage of total agricultural area), 2016 45
Figure 47: Organic: Producers, 1999–2016 45
Figure 48: Organic: Top 10 countries by certified producers, 2016 46
Figure 49: Organic: Producers by region, 2016 46
Figure 50: Organic: Top 10 countries by retail sales, 2016 47
Figure 51: Organic: Top 10 crops/crop groups, 2016 47
Figure 52: Organic: Land by main use type, 2016 48
Figure 53: Programme for the Endorsement of Forest Certification: Certified area, 2004–2016 50
Figure 54: Programme for the Endorsement of Forest Certification: Area by region, 2016 50
Figure 55: Programme for the Endorsement of Forest Certification: 2016 close-up – Top 10 countries by area 51
Figure 56: Programme for the Endorsement of Forest Certification: Chain-of-custody certificate holders, 2001–2016 51
Figure 57: ProTerra: Certified area, 2008–2016 53
Figure 58: ProTerra Foundation: Production volume, 2013–2016 53
Figure 59: ProTerra: 2016 close-up – Top countries by area 54
Figure 60: ProTerra: Top countries (percentage of total soybean area), 2018 54
Figure 61: Rainforest Alliance: Certified area, 2008–2016 56
Figure 62: Rainforest Alliance: 2016 close-up – Top 10 countries by area 56
Figure 63: Rainforest Alliance: Area by region, 2016 57
Figure 64: Rainforest Alliance: Top 10 countries by certified producers, 2016 57
Figure 65: Rainforest Alliance: Producers by region, 2016 58
Figure 66: Rainforest Alliance: Top 10 products by area, 2016 58
Figure 67: Roundtable on Sustainable Palm Oil: Cultivated area, 2008–2016 60
Figure 68: Roundtable on Sustainable Palm Oil: Palm oil production volume, 2008–2016 60
Figure 69: Roundtable on Sustainable Palm Oil: 2016 close-up – Top 10 countries by area 61
Figure 70: Roundtable on Sustainable Palm Oil: Top 10 countries (percentage of total oil palm area), 2016 61
Figure 71: Round Table on Responsible Soy: Certified area, 2011–2016 63
Figure 72: Round Table on Responsible Soy: Production volume and production volume sold under RTRS label, 2011–2016 63
Figure 73: Round Table on Responsible Soy: 2016 close-up – Top countries by area 64
Figure 74: Round Table on Responsible Soy: Top countries (percentage of total soybean area), 2016 64
Figure 75: UTZ: Certified area, 2009–2016 66
Figure 76: UTZ: Estimated production volume, 2009–2016 67
Figure 77: UTZ: 2016 close-up – Top 10 countries by area 67
Figure 78: UTZ: Top 10 countries (percentage of total cocoa, coffee, and tea area), 2016 68
Figure 79: UTZ: Area by region, 2016 68
Figure 80: Banana: Production area by standard, 2008–2016 74
Figure 81: Banana: Average production area, 2008–2016 74
Figure 82: Banana: Production volume by standard, 2008–2016 75
Figure 83: Banana: Average production volume, 2008–2016 75
Figure 84: Banana: Fairtrade International – Top countries by area, 2016 76
Figure 85: Banana: GLOBALG.A.P. – Top 10 countries or territories by area, 2016 76
Figure 86: Banana: Organic – Top 10 countries by area, 2016 77
Figure 87: Banana: Rainforest Alliance – Top 10 countries by area, 2016 77
Figure 88: Banana: Fairtrade-certified area by region, 2016 78
Figure 89: Banana: GLOBALG.A.P.-certified area by region, 2016 78
Figure 90: Banana: Organic-certified area by region, 2016 78

xii
Figure 91: Banana: Rainforest Alliance-certified area by region, 2016 78
Figure 92: Banana: Share of Fairtrade area, 2015 79
Figure 93: Banana: Share of GLOBALG.A.P. area, 2016 79
Figure 94: Banana: Share of organic area, 2016 79
Figure 95: Banana: Share of Rainforest Alliance area, 2016 79
Figure 96: Cocoa: Production area by standard, 2008–2016 82
Figure 97: Cocoa: Average production area, 2008–2016 82
Figure 98: Cocoa: Production volume by standard, 2008–2016 83
Figure 99: Cocoa: Average production volume, 2008–2016 83
Figure 100: Cocoa: Fairtrade International – Top countries by area, 2016 84
Figure 101: Cocoa: Organic – Top 10 countries by area, 2016 84
Figure 102: Cocoa: Rainforest Alliance – Top 10 countries by area, 2016 85
Figure 103: Cocoa: UTZ – Top 10 countries by area, 2016 85
Figure 104: Cocoa: Fairtrade-certified area by region, 2016 86
Figure 105: Cocoa: Organic-certified area by region, 2016 86
Figure 106: Cocoa: Rainforest Alliance-certified area by region, 2016 86
Figure 107: Cocoa: UTZ-certified area by region, 2016 86
Figure 108: Cocoa: Share of Fairtrade area, 2015 87
Figure 109: Cocoa: Share of Organic area, 2016 87
Figure 110: Cocoa: Share of Rainforest Alliance area, 2016 87
Figure 111: Cocoa: Share of UTZ area, 2016 87
Figure 112: Coffee: Production area by standard, 2008–2016 90
Figure 113: Coffee: Average production area, 2008–2016 90
Figure 114: Coffee: Production volume by standard, 2008–2016 91
Figure 115: Coffee: Average production volume, 2008–2016 91
Figure 116: Coffee: 4C – Top 10 countries by area, 2016 92
Figure 117: Coffee: Fairtrade International – Top 10 countries by area, 2015 92
Figure 118: Coffee: Organic – Top 10 countries by area, 2016 93
Figure 119: Coffee: Rainforest Alliance – Top 10 countries by area, 2016 93
Figure 120: Coffee: UTZ – Top 10 countries by area, 2016 94
Figure 121: Coffee: 4C-certified area by region, 2016 94
Figure 122: Coffee: Fairtrade-certified area by region, 2015 94
Figure 123: Coffee: Organic-certified area by region, 2016 95
Figure 124: Coffee: Rainforest Alliance-certified area by region, 2016 95
Figure 125: Coffee: UTZ-certified area by region, 2016 95
Figure 126: Coffee: Share of Fairtrade area, 2015 96
Figure 127: Coffee: Share of Organic area, 2016 96
Figure 128: Coffee: Share of Rainforest Alliance area, 2016 96
Figure 129: Coffee: Share of UTZ area, 2016 96
Figure 130: Cotton: Production area by standard, 2008–2016 99
Figure 131: Cotton: Average production area, 2008–2016 99
Figure 132: Cotton lint: Production volume by standard, 2008–2016 100
Figure 133: Cotton: Better Cotton Initiative – Top 10 countries by area, 2016 100
Figure 134: Cotton: Cotton Made in Africa – Top countries by area, 2015 101
Figure 135: Cotton: Fairtrade International – All countries by area, 2015 101
Figure 136: Cotton: Organic – Top 10 countries by area, 2016 102
Figure 137: Cotton: Better Cotton Initiative-certified area by region, 2016 102
Figure 138: Cotton: Cotton Made in Africa-certified area by country, 2015 102

xiii
Figure 139: Cotton: Fairtrade-certified area by region, 2015 103
Figure 140: Cotton: Organic-certified area by region, 2016 103
Figure 141: Oil palm: Production area by standard, 2008–2016 106
Figure 142: Oil palm: Average production area, 2008–2016 106
Figure 143: Oil palm: Organic – Top countries by area, 2016 107
Figure 144: Oil palm: Rainforest Alliance – Top countries by area, 2016 107
Figure 145: Oil palm: Roundtable on Sustainable Palm Oil – Top 10 countries by area, 2016 108
Figure 146: Oil palm: Organic-certified area by region, 2016 108
Figure 147: Oil palm: Rainforest Alliance-certified area by region, 2016 108
Figure 148: Oil palm: Roundtable on Sustainable Palm Oil-certified area by region, 2016 109
Figure 149: Soybean: Production area by standard, 2008–2016 111
Figure 150: Soybean: Average production area, 2008–2016 112
Figure 151: Soybean: Production volume by standard, 2008–2016 112
Figure 152: Soybean: Average production volume, 2008–2016 113
Figure 153: Soybean: Organic – Top 10 countries by area, 2016 113
Figure 154: Soybean: ProTerra – Top countries by area, 2016 114
Figure 155: Soybean: Round Table on Responsible Soy – Top countries by area, 2016 114
Figure 156: Soybean: Organic-certified area by region, 2016 115
Figure 157: Soybean: ProTerra-certified area by region, 2016 115
Figure 158: Soybean: RTRS-certified area by region, 2016 115
Figure 159: Sugarcane: Production area by standard, 2008–2016 118
Figure 160: Sugarcane: Average production area, 2008–2016 118
Figure 161: Sugarcane: Production volume by standard, 2008–2016 119
Figure 162: Sugarcane: Bonsucro – Top countries by area, 2016 119
Figure 163: Sugarcane: Fairtrade International – Top countries by area, 2016 120
Figure 164: Sugarcane: Organic – Top 10 countries by area, 2016 120
Figure 165: Sugarcane: Bonsucro-certified area by region, 2016 121
Figure 166: Sugarcane: Fairtrade-certified area by region, 2016 121
Figure 167: Sugarcane: Organic-certified area by region, 2016 121
Figure 168: Tea: Production area by standard, 2008–2016 124
Figure 169: Tea: Average production area, 2008–2018 124
Figure 170: Tea: Production volume by standard, 2008–2016 125
Figure 171: Tea: Average production volume, 2008–2016 125
Figure 172: Tea: Fairtrade International – Top countries by area, 2016 126
Figure 173: Tea: Organic – Top 10 countries by area, 2016 126
Figure 174: Tea: Rainforest Alliance – Top 10 countries by area, 2016 127
Figure 175: Tea: UTZ – Top 10 countries by area, 2016 127
Figure 176: Tea: Fairtrade-certified area by region, 2016 128
Figure 177: Tea: Organic-certified area by region, 2016 128
Figure 178: Tea: Rainforest Alliance-certified area by region, 2016 128
Figure 179: Tea: UTZ-certified area by region, 2016 128
Figure 180: Tea: Share of Fairtrade area, 2015 129
Figure 181: Tea: Share of organic area, 2016 129
Figure 182: Tea: Share of Rainforest Alliance area, 2016 129
Figure 183: Tea: Share of UTZ area, 2016 129
Figure 184: Forestry: Certified area, 2004–2016 131
Figure 185: Forestry: Top 10 countries by area, 2016 132
Figure 186: Forestry: Certified area by region, 2016 132
xiv
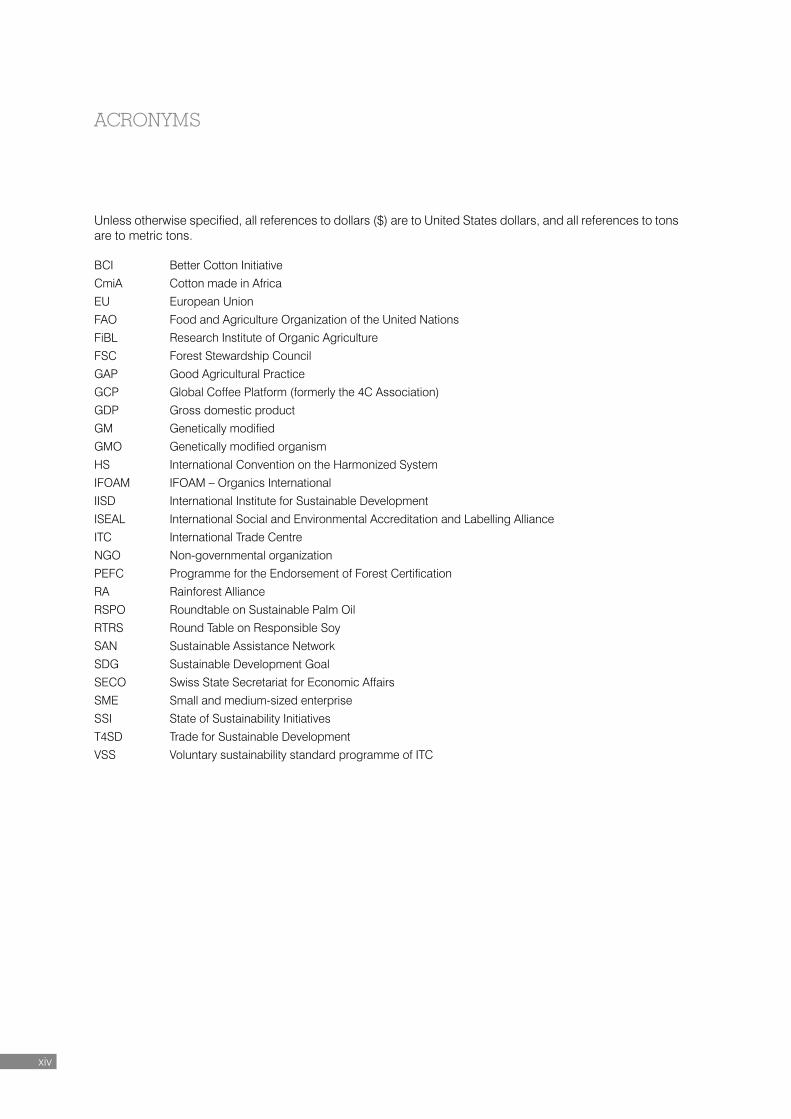
ACRONYMS
Unless otherwise specified, all references to dollars ($) are to United States dollars, and all references to tons are to metric tons.
BCI Better Cotton Initiative
CmiA Cotton made in Africa
EU European Union
FAO Food and Agriculture Organization of the United Nations
FiBL Research Institute of Organic Agriculture
FSC Forest Stewardship Council
GAP Good Agricultural Practice
GCP Global Coffee Platform (formerly the 4C Association)
GDP Gross domestic product
GM Genetically modified
GMO Genetically modified organism
HS International Convention on the Harmonized System
IFOAM IFOAM – Organics International
IISD International Institute for Sustainable Development
ISEAL International Social and Environmental Accreditation and Labelling Alliance
ITC International Trade Centre
NGO Non-governmental organization
PEFC Programme for the Endorsement of Forest Certification
RA Rainforest Alliance
RSPO Roundtable on Sustainable Palm Oil
RTRS Round Table on Responsible Soy
SAN Sustainable Assistance Network
SDG Sustainable Development Goal
SECO Swiss State Secretariat for Economic Affairs
SME Small and medium-sized enterprise
SSI State of Sustainability Initiatives
T4SD Trade for Sustainable Development
VSS Voluntary sustainability standard programme of ITC
xv
EXECUTIVE SUMMARY
This report, the third in what is now an annual update on the state of sustainable markets, presents the latest data on area, production volume and producers for 14 major standard-setting organizations.
This year’s report shows how certified agriculture and forestry continue to grow, in line with a growing global population and increasing consumption.
Access to natural resources will continue to be a major sustainable development challenge far into the future. Fortunately, many opportunities exist along international supply chains to meet resource shortfalls.
Voluntary sustainability standards (VSS) represent one of these opportunities. They are a way to adopt production and trade practices that have the potential to lead to social, environmental and economic sustainability.1
Voluntary sustainability standards are no longer a novelty serving niche markets. They have been finding their way into mainstream markets for more than a decade. The trend is clear: sustainable agricultural products, which demonstrate compliance (for example, third-party verified compliance) with internationally recognized standards, are growing at a pace that exceeds markets for conventional products.
Overall, the rising share of total area and production volume covered by VSS suggests there is significant potential for continued growth.
The current market context shows:
� Continued growth, albeit not at the same pace as in previous years; � An expanding share of agricultural land, which surpasses the 20% mark in some commodities; � Dominance of single-sector standards in some sectors.
This year’s report is based on a global survey on voluntary sustainability standards, funded by the Swiss State Secretariat for Economic Affairs (SECO). The Research Institute of Organic Agriculture (FiBL), the International Institute of Sustainable Development (IISD), and the International Trade Centre (ITC) jointly produced this report, building on their complementary and in-depth expertise on sustainability standards. The data presented here cover the year 2016, where available, as well as earlier years.
The report offers a comprehensive snapshot of significant growth in the adoption of global sustainability standards across nine sectors: bananas, cocoa, coffee, cotton, palm oil, soybeans, cane sugar, tea, and forestry. It provides market and statistical data on the nine sectors as well as at-a-glance tables on products and standards by country.
1. Voluntary Sustainability Standards (VSS) are standards developed at local, national or international level by organizations from the public and private sectors on environmental and social improvements. Private VSS are developed by businesses or not-for-profit non-governmental organizations. In the agricultural sector, VSS promote sustainability along the value chain. They define the criteria to be met by the certified organization or product, often resulting in an identifiable label for consumers. (FAO, available at http://www.fao.org/world-banana-forum/projects/good-practices/voluntary-sustainability-standards/en/.)

xvi
Among the highlights of this year’s report2:
Cotton, cocoa and tea achieved the highest growth rates
Cotton experienced the highest growth rate of its certified area – at least threefold – between 2011 and 2016, followed by cocoa and tea.
Between 2015 and 2016 alone, cocoa grew the fastest (28%). However, over the same period, most other commodities experienced single-digit growth or even saw the amount of certified area decline. For example, the oil palm area fell by 11.5%, and the sugarcane area by almost 8%.
Organic continues to be the leading standard by certified area
Organic is the biggest sustainability standard in terms of both area and product variety. In 2016, more than 57.8 million hectares of agricultural production were certified as organic (including areas in the process of becoming organic-certified), representing 1.2% of agricultural land worldwide.
2. Data is based on minimum values.
14 Major Voluntary Sustainability Standards
4CBetter Cotton InitiativeBONSUCROCotton made in AfricaFairtrade International Forest Stewardship CouncilGLOBALG.A.P.IFOAM – Organics InternationalProgramme for the Endorsement of Forest CertificationProTerra FoundationRainforest Alliance/Sustainable Agriculture Network Roundtable on Sustainable Palm OilRound Table on Responsible SoyUTZ
Sustainable production and trade allows us to produce, buy and sell in a way that ensures consumer protection, social responsibility and environmental sustainability.
This report features data on area, production volume and producers for 14 major voluntary sustainability standards covering forestry and eight agricultural products.
Collectively, these figures show that sustainable production and trade are no longer a novelty; they reflect consumer demand in mainstream markets.
Bananas
Selected products
Tea
Sugarcane
Cocoa
Soybeans
Coffee
Oil palm
Cotton
Share of certified area by standard for agriculture
Share of certified area by sustainability standard for
selected products
Share of certified area for agriculture and forestry
PEFC
FSC
Agriculture
Forestry
Bons
ucro
RTRS
CmiA
RA
4C
ProTerra
BCIO
rgan
ic
Fairtrade
RSPO
UTZ
Oil
palm
Com
mod
ityC
ocoa
Cof
fee
Cot
ton
Soy
bean
s
Bons
ucro
RTRS
CmiA
4C
ProT
erra
BCI
Fairtra
de (2015
)
UTZ
Rainforest
RSPO
GLOBALG.A.P.
Organic

xvii
GLOBALG.A.P. has the second-largest area of all the standards, accounting for 0.09% of the global agricultural area.
The Roundtable on Sustainable Palm Oil (RSPO) certified more than 3.2 million hectares in 2016, making it the third biggest standard in terms of area certified.
All of the standards covered by this report have experienced growth in their compliant areas since 2011. The Round Table on Responsible Soy (RTRS) saw the greatest jump, with the certified area expanding more than sevenfold between 2011 and 2016. The Better Cotton Initiative (BCI) area increased nearly five times over the same period, while that of Cotton made in Africa (CmiA) nearly quadrupled. Similarly, 4C and RSPO reported significant growth in their certified area.
Standards compliance continues to gain ground
Approximately 23% of the world’s cocoa area, which experienced the biggest growth of all sectors from 2015 to 2016, is now certified by four standards. The coffee sector boasts the highest compliance rate, with at least 25.8% of the coffee area being certified. The CmiA-certified area currently represents 26% of the entire cotton area in Africa.
Three standards now certify production of sugarcane, the world’s largest source of sugar, and at least 13% of the world’s tea area is VSS-certified. The certified forestry sector, which accounts for almost 11% of the global forestry area, is paving the way for voluntary standards worldwide, with a 27% increase in the certified area between 2011 and 2016.
14 Major Voluntary Sustainability Standards
4CBetter Cotton InitiativeBONSUCROCotton made in AfricaFairtrade International Forest Stewardship CouncilGLOBALG.A.P.IFOAM – Organics InternationalProgramme for the Endorsement of Forest CertificationProTerra FoundationRainforest Alliance/Sustainable Agriculture Network Roundtable on Sustainable Palm OilRound Table on Responsible SoyUTZ
Sustainable production and trade allows us to produce, buy and sell in a way that ensures consumer protection, social responsibility and environmental sustainability.
This report features data on area, production volume and producers for 14 major voluntary sustainability standards covering forestry and eight agricultural products.
Collectively, these figures show that sustainable production and trade are no longer a novelty; they reflect consumer demand in mainstream markets.
Bananas
Selected products
Tea
Sugarcane
Cocoa
Soybeans
Coffee
Oil palm
Cotton
Share of certified area by standard for agriculture
Share of certified area by sustainability standard for
selected products
Share of certified area for agriculture and forestry
PEFC
FSC
Agriculture
ForestryBo
nsuc
ro
RTRS
CmiA
RA
4C
ProTerra
BCIO
rgan
ic
Fairtrade
RSPO
UTZ
Oil
palm
Com
mod
ityC
ocoa
Cof
fee
Cot
ton
Soy
bean
s
Bons
ucro
RTRS
CmiA
4C
ProT
erra
BCI
Fairtra
de (2015
)
UTZ
Rainforest
RSPO
GLOBALG.A.P.
Organic
xviii
Addressing persistent sustainability concerns
The continuous increase in certification over the past decade reflects a demand among consumers, buyers and producers to address common environmental and social concerns. For example, the banana industry, the world’s second largest consumer of agrochemicals after cotton, faces such challenges as low wages, worker health and safety, child labour, and lack of biodiversity.
The cocoa market is confronted by an unorganized production base, systemic poverty and child labour, while the cotton market’s reputation is affected by high water use, volatile prices and worker exploitation.
The increasing consumption of sugarcane is having a major impact on biodiversity amidst concerns over abusive labour practices. For the tea market, concerns include forest removal, soil erosion, chemical inputs, and worker protection.
Reporting challenges: Multiple certification, lack of reliable data
In a context where access to sustainable markets tends to be concentrated in more developed economies, policymakers, producers and businesses need better-quality information to facilitate strategic planning.
It remains difficult to report a global total for individual sectors, as many producers are certified by more than one standard. There are not enough reliable data on the share of these multiple certifications. For the purposes of this report FiBL, IISD and ITC accordingly decided that the best approach was to provide the minimum, maximum and average of the area or production volume.
Better quality and more transparent data are needed for prices and markets, trade, consumption, expansion of reporting and transparency requirements for certified producers, expansion of the Harmonized System (HS) coding system, expanded corporate reporting, and sustainable consumption at the national level.
Standards featured in this report
This report covers the following standards: 4C Association, Better Cotton Initiative, Bonsucro, Cotton made in Africa, Fairtrade International, Forest Stewardship Council, GLOBALG.A.P., IFOAM – Organics International, the Programme for the Endorsement of Forest Certification Schemes, ProTerra Foundation, Rainforest Alliance, the Roundtable on Sustainable Palm Oil, the Round Table on Responsible Soy, and UTZ.
Strategies for sustainable trade
Voluntary sustainability standards offer explicit strategies to link trade with better practices. Better data will improve understanding of the state of sustainable markets, and better reporting will help round out the picture of sustainable supply chains.
This report’s presentation of market conditions and trends therefore intends to inform readers, encourage additional data collection and promote accountability within sustainability markets. It also serves as a resource for further analysis and informed decision-making by researchers, policymakers, industry actors and other stakeholders.

xix


TABLE OF CONTENTS FOR CHAPTER ����������������������������������������������������������������������������������������������������������������������p
TABLE OF CONTENTS FOR CHAPTER ������������������������������������������������������������������������������������������������������������������������������������������������� P
TABLE OF CONTENTS FOR CHAPTER ����������������������������������������������������������������������������������������������������������������������p
TABLE OF CONTENTS FOR CHAPTER ����������������������������������������������������������������������������������������������������������������������p
TABLE OF CONTENTS FOR CHAPTER ����������������������������������������������������������������������������������������������������������������������p
CHAPTER 1
SUSTAINABILITY STANDARDS: IN THE MAINSTREAM
TRENDS IN SUSTAINABILITY STANDARDS ������������������������������������������������������������������������������������������������������������� 3
HIGHLIGHTS BY AGRICULTURAL AND FORESTRY PRODUCTS �������������������������������������������������������������������������� 7

CHAPTER 1 – SUSTAINABILITy STANDARDS: IN THE MAINSTREAM2
Partnerships lie at the heart of advancing sustainable development and overcoming major global challenges, such as gender equity, poverty alleviation and climate change. The 17th and last Sustainable Development Goal (SDG) illustrates this point, specifically focusing on strengthening partnerships for sustainable development. SDG 17 – Strengthen the means of implementation and revitalize the global partnership for sustainable development – supports the fulfilment of the 16 other goals adopted by the global community in 2015 (United Nations Department of Economic and Social Affairs, 2017).
Voluntary sustainability standards (VSS) have long embodied the understanding of the need to establish partnerships for implementing sustainable development, as shown by the following:
� Organic and Fairtrade have moved the agricultural sector closer to environmental and social sustainability, with many producers electing to become certified by both standards.
� The Roundtable on Sustainable Palm Oil (RSPO) and the Round Table on Responsible Soy (RTRS) aim to represent the multiple interests of their supply chain stakeholders.
� The evolution of Bonsucro from a certification programme to a global sugarcane platform in 2016 strengthened its efforts to move the sector towards sustainability (Bonsucro, 2016).
� The 2017 merger of UTZ and Rainforest Alliance (RA) leverages their respective organizational strengths for greater sustainability (Kraft, 2017).
� The existence of the International Social and Environmental Accreditation and Labelling (ISEAL) Alliance, a member-based organization for sustainability standards, reflects its members’ commitment to greater coherence in pursuing sustainable consumption and production.
As demand for standard-compliant products grows in the marketplace, VSS are enabling sustainable consumption and production as well as partnerships for sustainable development – effectively contributing to the fulfilment of several SDGs. The expansion of sustainable consumption choices enabled by VSS makes consumers more aware of sustainability, whether they are individuals shopping for their day-to-day needs or corporate procurement decision makers purchasing tons of materials for their businesses, creating a virtuous cycle of demand for more sustainable products. By providing assurances for purchases that support sustainability, VSS are connecting consumers and producers via transactions that involve more sustainable products. As VSS continue tackling more complex sustainability challenges, the partnerships they have nurtured between entities and consumers committed to sustainable consumption and production will become increasingly important.
This report supports that assertion, reflecting the many partnerships established by the Research Institute of Organic Agriculture (FiBL), the International Trade Centre (ITC) and the International Institute for Sustainable Development (IISD) with standards organizations that have generously shared information in order to provide marketplace transparency to standard-compliant production in key agricultural and forestry sectors. This commitment to information-sharing and transparency constitutes a solid foundation for VSS to continue advancing and enabling global sustainable consumption and production efforts.
Following on the previous two editions of this report, The State of Sustainable Markets 2018 offers the latest available data, covering the year 2016. The report is divided into two sections:
� An overview of each of the standards surveyed, with a short description and key data; � A product section showing the data by agricultural and forestry product.

CHAPTER 1 – SUSTAINABILITy STANDARDS: IN THE MAINSTREAM 3
TRENDS IN VOLUNTARY SUSTAINABILITY STANDARDS
VSS are no longer a novelty serving niche markets. Over the past decade and more they have increasingly found their way into mainstream markets. There are many reasons for the growing adoption of these standards. For some producers and suppliers, adherence to a set of recognized principles for sustainable practice represents a stepping stone to implementing best practices within supply chains.3 For others, compliance with a given standard may offer a strategy for managing reputational risks or even supply risks. However, regardless of the reasons, the trend is clear: sustainable commodities, as defined by products that are demonstrably (e.g. third-party verified) compliant with internationally recognized standards, are growing rapidly, and at a pace that outstrips markets for conventional commodities. Highlights of the current market context are continued growth, expanding coverage of agricultural land, and dominance in some sectors of single-sector standards, as outlined below.
Growth continues, albeit not at the same pace
� Between 2011 and 2016, most standards covered by this report experienced growth in their compliant areas.4 RTRS underwent the greatest jump, with the certified area expanding more than seven fold. The Better Cotton Initiative (BCI) area increased nearly five times, while that of Cotton made in Africa (CmiA) nearly quadrupled. Similarly significant growth in certified area was also reported by 4C and RSPO.
� Looking at individual agricultural sectors, the certified area for cotton experienced the highest growth rate, increasing more than threefold between 2011 and 2016.5 This was followed by cocoa and tea, which more than doubled in area. All other commodities grew in area as well, with the exception of bananas, which showed stagnation.
� However, the growth rates experienced in previous years have slowed, with some sectors undergoing either stagnation or significant drops. While cocoa experienced the greatest increase in certified area (28%) between 2015 and 2016, most other commodities experienced single-digit growth or even saw their certified area decline over the same period. For example, the oil palm area fell by 11.5%, and the sugarcane area by almost 8%.
� The certified forest area expanded by 57% between 2008 and 2016, with the Forest Stewardship Council (FSC) area growing by 91% to 196 million hectares and that of the Programme for the Endorsement of Forest Certification (PEFC) increasing by 39% to over 301 million hectares in the same period.
3. Some of the VSS covered here are members of the non-governmental organization ISEAL, the International Social and Environmental Accreditation and Labelling Alliance. For more information see http://www.isealalliance.org/.
4. 2011 is the first year for which data are available on all the standards covered by this report, with the exception of GLOBALG.A.P. for which data is only available since 2012.
5. These growth rates are calculated by taking the minimum area possible as the reference.
Multiple certification and data on total VSS area and production
Reporting a global total for certain commodities remains difficult, as many producers are certified by more than one VSS, and there are not enough reliable data on the share of multiple certifications. Taking this into account, FiBL, IISD and ITC decided that the best approach was to provide a range that encompasses the minimum and the maximum amounts possible, along with the average of the two at the country level. To calculate the maximum amount, the total production of all standards in the country was determined. For the minimum, the standard with the largest area or largest production volume in the country was used as the reference. An average of the maximum and minimum was then calculated. These figures must, however, be treated with caution, as they are simply estimates that indicate a trend.

CHAPTER 1 – SUSTAINABILITy STANDARDS: IN THE MAINSTREAM4
Figure 1: Growing fast – Selected products certified by sustainability standards (minimum possible), 2008 – 2016
0
2,000,000
4,000,000
6,000,000
8,000,000
10,000,000
12,000,000
14,000,000
16,000,000
2008 2009 2010 2011 2012 2013 2014 2015 2016
Hec
tare
s
Bananas Tea Sugarcane Cocoa Oil palm Soybeans Coffee Cotton
Note: The products are sorted by largest area. The data in this figure were not adjusted for multiple certifications. For purposes of the figure it is assumed that there is a maximum amount of multiple certifications occurring within each commodity, corresponding to the minimum VSS-compliant area per commodity in a country. Therefore, the total VSS-compliant area corresponds to the VSS with the largest compliant area operating within a given sector. For Fairtrade International, as the 2016 data for coffee and cotton were not available, the 2015 data were used to draw a global picture.
Sources: FiBL-ITC-SSI survey 2018: Coffee Assurance Services 2014, 2015, 2016, and 2018; Better Cotton Initiative 2014, 2015, 2017, and 2018; Bonsucro 2014, 2015, 2016, and 2018; Cotton made in Africa 2014, 2015, 2016, and 2018; Fairtrade International 2017 and 2018; GLOBALG.A.P. 2015, 2016, and 2018; FiBL survey 2018; ProTerra Foundation 2014, 2015, 2016, and 2018; Rainforest Alliance 2014, 2015, 2016, and 2018; Roundtable on Sustainable Palm Oil 2014, 2015, 2016, and 2018; Round Table on Responsible Soy 2014, 2015, 2016, and 2018; UTZ 2014, 2015, 2016, and 2018.
Table 1: Selected commodities: Minimum area 2016, 1-year growth, 2015–2016, and 6 years’ growth, 2011–2016
Commodity Minimum area [ha]Share of total area
[%]Growth 2015–2016
[%]Growth 2011–2016
[%]
Bananas 289,142 5.3% -0.6% -3.1%*
Cocoa 2,321,384 22.8% 28.3% 187.5%
Coffee 2,828,096 25.8% 8.3% 77.9%
Cotton 3,090,497 10.2% -2.8% 243.0%
Oil palm 2,464,864 11.7% -11.5% 116.2%
Soybeans 2,579,243 2.1% 1.1% 48.6%
Sugarcane 1,050,380 3.9% -7.9% 26.8%
Tea 542,466 13.2% -3.1% 117.4%
Note: The data in this table were not adjusted for multiple certifications, thus the minimum possible is reported. The total VSS-compliant area corresponds to the VSS with the largest compliant area operating within a given sector by country.
Source: FiBL-ITC-SSI survey 2018.
*Please note that for bananas data are only available from 2012, so the growth rate is from 2012 to 2016.
CHAPTER 1 – SUSTAINABILITy STANDARDS: IN THE MAINSTREAM 5
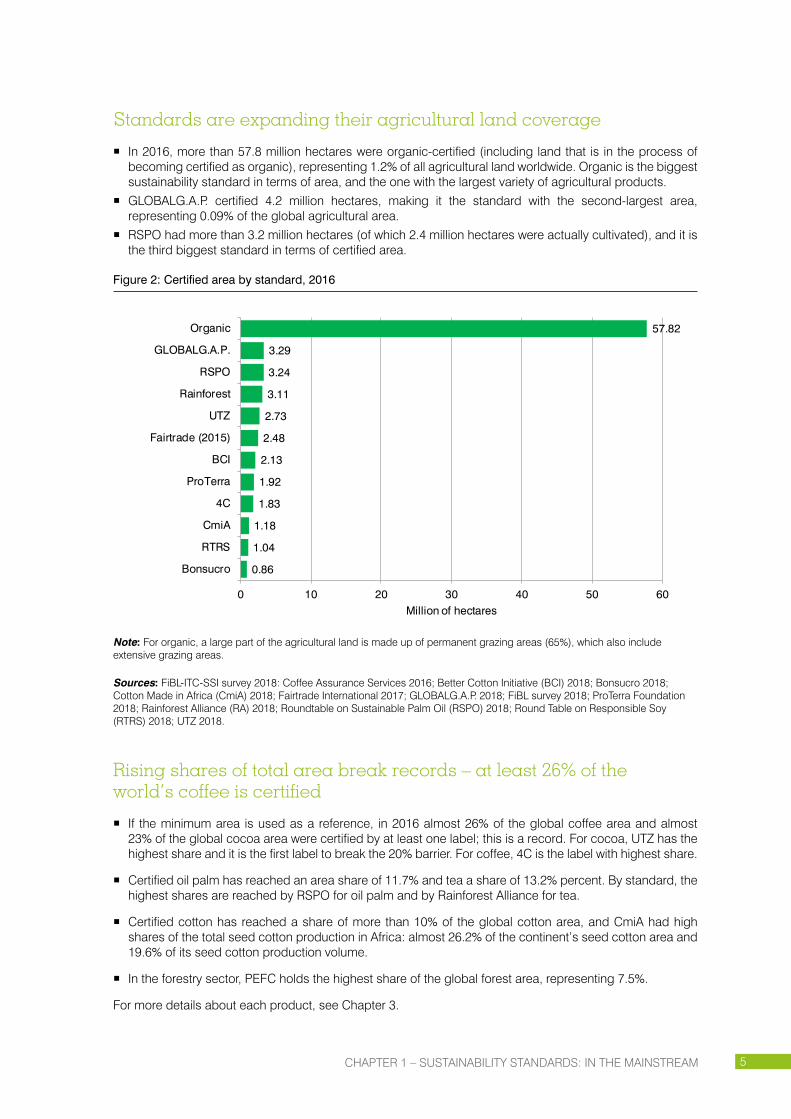
Standards are expanding their agricultural land coverage
� In 2016, more than 57.8 million hectares were organic-certified (including land that is in the process of becoming certified as organic), representing 1.2% of all agricultural land worldwide. Organic is the biggest sustainability standard in terms of area, and the one with the largest variety of agricultural products.
� GLOBALG.A.P. certified 4.2 million hectares, making it the standard with the second-largest area, representing 0.09% of the global agricultural area.
� RSPO had more than 3.2 million hectares (of which 2.4 million hectares were actually cultivated), and it is the third biggest standard in terms of certified area.
Figure 2: Certified area by standard, 2016
0.86
1.04
1.18
1.83
1.92
2.13
2.48
2.73
3.11
3.24
3.29
57.82
0 10 20 30 40 50 60
Bonsucro
RTRS
CmiA
4C
ProTerra
BCI
Fairtrade (2015)
UTZ
Rainforest
RSPO
GLOBALG.A.P.
Organic
Million of hectares
Note: For organic, a large part of the agricultural land is made up of permanent grazing areas (65%), which also include extensive grazing areas.
Sources: FiBL-ITC-SSI survey 2018: Coffee Assurance Services 2016; Better Cotton Initiative (BCI) 2018; Bonsucro 2018; Cotton Made in Africa (CmiA) 2018; Fairtrade International 2017; GLOBALG.A.P. 2018; FiBL survey 2018; ProTerra Foundation 2018; Rainforest Alliance (RA) 2018; Roundtable on Sustainable Palm Oil (RSPO) 2018; Round Table on Responsible Soy (RTRS) 2018; UTZ 2018.
Rising shares of total area break records – at least 26% of the world’s coffee is certified
� If the minimum area is used as a reference, in 2016 almost 26% of the global coffee area and almost 23% of the global cocoa area were certified by at least one label; this is a record. For cocoa, UTZ has the highest share and it is the first label to break the 20% barrier. For coffee, 4C is the label with highest share.
� Certified oil palm has reached an area share of 11.7% and tea a share of 13.2% percent. By standard, the highest shares are reached by RSPO for oil palm and by Rainforest Alliance for tea.
� Certified cotton has reached a share of more than 10% of the global cotton area, and CmiA had high shares of the total seed cotton production in Africa: almost 26.2% of the continent’s seed cotton area and 19.6% of its seed cotton production volume.
� In the forestry sector, PEFC holds the highest share of the global forest area, representing 7.5%.
For more details about each product, see Chapter 3.
CHAPTER 1 – SUSTAINABILITy STANDARDS: IN THE MAINSTREAM6
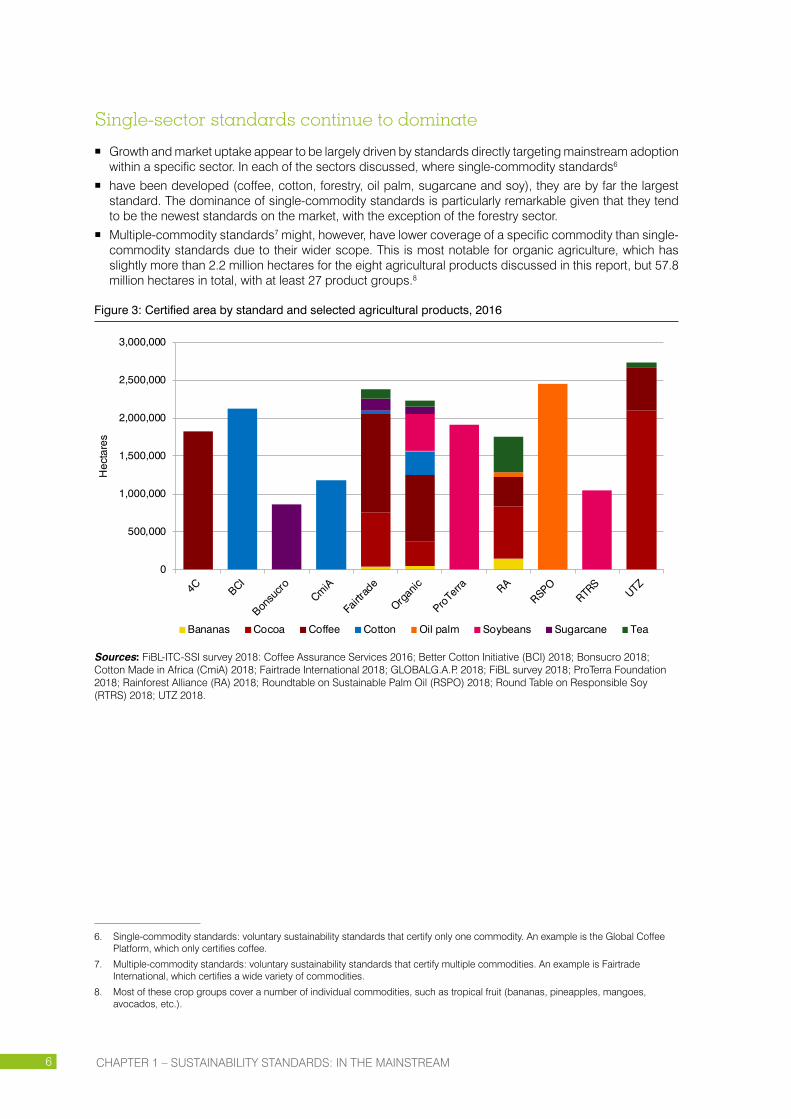
Single-sector standards continue to dominate
� Growth and market uptake appear to be largely driven by standards directly targeting mainstream adoption within a specific sector. In each of the sectors discussed, where single-commodity standards6
� have been developed (coffee, cotton, forestry, oil palm, sugarcane and soy), they are by far the largest standard. The dominance of single-commodity standards is particularly remarkable given that they tend to be the newest standards on the market, with the exception of the forestry sector.
� Multiple-commodity standards7 might, however, have lower coverage of a specific commodity than single-commodity standards due to their wider scope. This is most notable for organic agriculture, which has slightly more than 2.2 million hectares for the eight agricultural products discussed in this report, but 57.8 million hectares in total, with at least 27 product groups.8
Figure 3: Certified area by standard and selected agricultural products, 2016
0
500,000
1,000,000
1,500,000
2,000,000
2,500,000
3,000,000
Hec
tare
s
Bananas Cocoa Coffee Cotton Oil palm Soybeans Sugarcane Tea
Sources: FiBL-ITC-SSI survey 2018: Coffee Assurance Services 2016; Better Cotton Initiative (BCI) 2018; Bonsucro 2018; Cotton Made in Africa (CmiA) 2018; Fairtrade International 2018; GLOBALG.A.P. 2018; FiBL survey 2018; ProTerra Foundation 2018; Rainforest Alliance (RA) 2018; Roundtable on Sustainable Palm Oil (RSPO) 2018; Round Table on Responsible Soy (RTRS) 2018; UTZ 2018.
6. Single-commodity standards: voluntary sustainability standards that certify only one commodity. An example is the Global Coffee Platform, which only certifies coffee.
7. Multiple-commodity standards: voluntary sustainability standards that certify multiple commodities. An example is Fairtrade International, which certifies a wide variety of commodities.
8. Most of these crop groups cover a number of individual commodities, such as tropical fruit (bananas, pineapples, mangoes, avocados, etc.).

CHAPTER 1 – SUSTAINABILITy STANDARDS: IN THE MAINSTREAM 7
HIGHLIGHTS: AGRICULTURAL AND FORESTRY PRODUCTS
What follows is an overview of the key statistics for each of the selected sectors (bananas, cocoa, coffee, cotton, palm oil, soy, sugarcane, tea and forestry products). As noted previously, there is little information available about the share of multiple certification, and it was therefore decided to provide the minimum area (100% multiple-certified) and the maximum area (no multiple certification taking place) along with the average.
Bananas
Four of the VSS covered in this report – Fairtrade International, GLOBALG.A.P., organic and RA – certified banana production in 2016. Combined, they certified a minimum of 289,000 hectares and a maximum of 488,000 (for an average of 389,000 hectares). In terms of the proportion of the VSS-certified area of the global banana area, the minimum represents 5.3%, the maximum, 8.9%, and the average, 7.1%. With more than 252,000 hectares, GLOBALG.A.P. had by far the largest VSS-certified banana area in 2016; the area with the highest growth (87%) in 2012–2016 was that of RA.
Cocoa
Four of the standards – Fairtrade International, organic, RA and UTZ – certified cocoa production. Combined, they certified a minimum of 2.3 million hectares and a maximum of 3.8 million hectares in 2016 (an average of 3.1 million hectares). In terms of the proportion of the VSS-certified area of the global cocoa area, the minimum represents 22.8%, the maximum, 37.6%, and the average, 30.2%. UTZ reported the largest VSS-certified cocoa area (2.1 million hectares), and as well reported the largest growth (fourfold between 2011 and 2016).
Coffee
Five of the standards – 4C, Fairtrade International, organic, RA and UTZ – certified coffee production, with a combined minimum of 2.8 million hectares and a maximum of almost 5 million hectares in 2016 (average: 3.9 million hectares). In terms of the proportion of the VSS-certified area of the global coffee area, the minimum represents 25.8%, the maximum, 45.3%, and the average, 35.5%. 4C had the largest VSS-certified coffee area, over 1.8 million hectares, and it also registered the largest growth in area (it trebled between 2011 and 2016). As the 2016 data for Fairtrade International were not available at the time this report was published, the latest available figures, covering 2015, were used instead.
Cotton
Four of the standards –BCI, CmiA, Fairtrade International and organic – certified cotton production. Combined, they certified a minimum of 3.1 million hectares and a maximum of 3.4 million hectares in 2016 (average: 3.3 million hectares). In terms of the proportion of the VSS-certified area of the global cotton area, the minimum represents 10.2%, the maximum, 11.4%, and the average, 10.8%. With 2.1 million hectares, BCI had the largest VSS-certified cotton area, and it showed the largest growth: a fivefold increase was reported for the 2011–2016 period.

CHAPTER 1 – SUSTAINABILITy STANDARDS: IN THE MAINSTREAM8
Oil palm
Three of the standards – organic, RA and RSPO – certified oil palm production. Combined, they certified a minimum of 2.46 hectares and a maximum of almost 2.52 million hectares in 2016 (average: 2.5 million hectares). In terms of the proportion of the VSS-certified area of the global oil palm area, the minimum represents 11.7%, the maximum, 12%, and the average, 11.8%. With 3.2 million hectares, RSPO had the largest VSS-certified oil palm area, while organic showed the largest growth: its area trebled between 2013 and 2016.
Soy
Three of the standards – organic, ProTerra Foundation and RTRS – certified soybean production. Combined, they certified a minimum of 2.6 million hectares and a maximum of almost 3.45 million hectares in 2016 (average: 3 million hectares). In terms of the proportion of the VSS-certified area of the global soybean area, the minimum represents 2.1%, the maximum, 2.8%, and the average, 2.5%. ProTerra Foundation had the largest VSS-certified soybean area (1.9 million hectares), while the largest growth (a sevenfold increase between 2011 and 2016) was noted for RTRS.
Sugarcane
Three of the standards – Bonsucro, Fairtrade International and organic – certified sugarcane production. Combined, they certified a minimum of 1.05 million hectares and a maximum of 1.1 million hectares in 2016 (average: 1.08 million hectares). In terms of the proportion of the VSS-certified area of the global sugarcane area, the minimum represents 3.9%, the maximum, 4.1%, and the average, 4.0%. Bonsucro had the largest VSS-certified sugarcane area, 0.9 million hectares; the largest growth was noted for Fairtrade International, whose area almost doubled between 2011 and 2016.
Tea
Four of the standards – Fairtrade International, organic, RA and UTZ – certified tea production. Combined, they certified a minimum of more than 542,000 hectares and a maximum of 745,000 hectares in 2016 (average: 643,000 hectares). In terms of the proportion of the VSS-certified area of the global tea area, the minimum represents 13.2%, the maximum, 18.1%, and the average, 15.7%. RA had the largest VSS-certified tea area, almost 0.5 million hectares, and also showed the largest growth in area (a fourfold increase between 2011 and 2016).
Forestry
In 2016, an estimated 428 million hectares of certified forest were reported, representing almost 11% of the global forest area. There is an estimated certification overlap in the sector of 15% between FSC and PEFC.


CHAPTER 2
GETTING TO KNOW STANDARD-SETTERS
4C �������������������������������������������������������������������������������������������������������������������������������������������������������������������������������� 12
BETTER COTTON INITIATIVE ���������������������������������������������������������������������������������������������������������������������������������� 16
BONSUCRO ��������������������������������������������������������������������������������������������������������������������������������������������������������������� 20
COTTON MADE IN AFRICA ������������������������������������������������������������������������������������������������������������������������������������ 23
FAIRTRADE INTERNATIONAL ��������������������������������������������������������������������������������������������������������������������������������� 27
FOREST STEWARDSHIP COUNCIL ����������������������������������������������������������������������������������������������������������������������� 33
GLOBALG�A�P� ����������������������������������������������������������������������������������������������������������������������������������������������������������� 36
IFOAM – ORGANICS INTERNATIONAL ����������������������������������������������������������������������������������������������������������������� 42
PROGRAMME FOR THE ENDORSEMENT OF FOREST CERTIFICATION SCHEMES �������������������������������������� 49
PROTERRA FOUNDATION ��������������������������������������������������������������������������������������������������������������������������������������� 52
RAINFOREST ALLIANCE/SUSTAINABLE AGRICULTURE NETWORK ���������������������������������������������������������������� 55
ROUNDTABLE ON SUSTAINABLE PALM OIL �������������������������������������������������������������������������������������������������������� 59
ROUND TABLE ON RESPONSIBLE SOY ���������������������������������������������������������������������������������������������������������������� 62
UTZ ����������������������������������������������������������������������������������������������������������������������������������������������������������������������������� 65
This section presents the latest available data for the selected voluntary sustainability standards� Data covers 2008–2016� (Data were not always available for all years from all standards�) Data on area, production volume and producers were available for all standards except for production volume data on GLOBALG�A�P�

CHAPTER 2 – GETTING TO KNOW STANDARD-SETTERS12
4C
Since April 2016, the 4C Code (Common Code for the Coffee Community) and its corresponding verification scheme have been operated by Coffee Assurance Services (CAS), formerly a wholly owned subsidiary of the Global Coffee Platform (GCP). An independent advisory board was appointed in late 2016 to oversee the transformation of CAS into a completely independent stand-alone entity, and supported a number of key developments during the transitional years of 2016 and 2017. Among other things, this involved the formation of a new team, a move to new offices in Bonn, and the sale of the 4C Code of Conduct and CAS to Meo Carbon Solutions, which was completed on 1 January 2018.
The 4C Code was created through an extensive participatory, transparent and balanced consultation with global coffee stakeholders. 4C Code verification aims to gradually improve the social, economic and environmental conditions of coffee production and processing worldwide. To that end, the Code has two main components:
� A list of 10 unacceptable practices that have to be eliminated before applying for 4C verification; � 27 principles that cover economic, social and environmental dimensions based on good agricultural and
management practices as well as international conventions and recognized guidelines in the coffee sector.
The code remains unchanged in 2018 and continues to offer a very comprehensive standard for on-the-ground sustainability verifications. This was recently reinforced by the award of “Silver” equivalence based on the SAI9 Platform’s Farm Sustainability Assessment tool. GCP also continues to recognize the code as equivalent to BCC, the GCP reference code.
In 2016, over 1.8 million hectares of coffee worldwide received a 4C licence, representing 0.04% of global agricultural land and 16.6% of the global coffee area. Almost 570,000 producers were 4C-licenced and produced more than 2.7 million metric tons of coffee. Brazil had the largest 4C area (over 737,000 hectares), followed by Colombia (more than 354,000 hectares) and Viet Nam (over 150,000 hectares). Between 2008 and 2016, the 4C licence area grew almost ninefold; between 2015 and 2016, it grew almost 15%, whereas there was a drop in 2014 and 2015.
More information is available at www.cas-veri.com. For more information on 4C coffee, see Chapter 3.
9. SAI refers to Sustainable Agriculture Initiative Platform. For more information, see www.saiplatform.org.

CHAPTER 2 – GETTING TO KNOW STANDARD-SETTERS 13
Table 2: 4C: Key indicators
4C 2016
Area [hectares] 1,826,825
Share of 4C area of global agricultural land [%] 0.04
Share of 4C coffee area of global coffee area [%] 16.65
Production volume [metric tons] 2,764,002
Production volume sold under the label [metric tons] 504,379
Producers [no.] 569,222
Source: Coffee Assurance Services, 2018.
Figure 4: 4C: Certified area, 2008–2016
0.2
1.8
0.0
0.2
0.4
0.6
0.8
1.0
1.2
1.4
1.6
1.8
2.0
2008 2009 2010 2011 2012 2013 2014 2015 2016
Mill
ion
of h
ecta
res
Source: Coffee Assurance Services, 2018.

CHAPTER 2 – GETTING TO KNOW STANDARD-SETTERS14
Figure 5: 4C: Production volume and production volume sold under the 4C label, 2008–2016
367
2,764
12
504
0
500
1,000
1,500
2,000
2,500
3,000
3,500
2008 2009 2010 2011 2012 2013 2014 2015 2016
Thou
sand
of m
etric
tons
Production volume Production volume sold under the label
Source: Coffee Assurance Services, 2018.
Figure 6: 4C: 2016 close-up – Top 10 countries by area
21,275
27,397
48,854
51,360
59,660
79,374
150,013
150,177
354,217
737,430
0 100,000 200,000 300,000 400,000 500,000 600,000 700,000 800,000
China
Uganda
Peru
Mexico
Côte d'Ivoire
Honduras
Indonesia
Viet Nam
Colombia
Brazil
Hectares
Source: Coffee Assurance Services, 2018.

CHAPTER 2 – GETTING TO KNOW STANDARD-SETTERS 15
Figure 7: 4C: Top 10 countries (percentage of total coffee area), 2016
12%
13%
13%
21%
25%
30%
35%
37%
41%
51%
0% 10% 20% 30% 40% 50% 60%
Indonesia
Peru
El Salvador
Honduras
Viet Nam
Burundi
Thailand
Brazil
Colombia
China
Source: Coffee Assurance Services, 2018.
Figure 8: 4C: 2016 close-up – Production volume by country
14,259
36,732
42,891
47,630
48,940
86,138
120,708
358,444
522,530
1,385,272
0 200,000 400,000 600,000 800,000 1,000,000 1,200,000 1,400,000 1,600,000
Thailand
Côte d'Ivoire
Mexico
China
Peru
Indonesia
Honduras
Colombia
Viet Nam
Brazil
Metric tons
Source: Coffee Assurance Services, 2018.

CHAPTER 2 – GETTING TO KNOW STANDARD-SETTERS16
BETTER COTTON INITIATIVE
Founded in 2005, the Better Cotton Initiative (BCI) is a member-based initiative operating in the cotton sector with farmers producing “Better Cotton” across 23 countries (as of 2015/2016) (Better Cotton Initiative, 2017). The BCI standard is based on six principles and criteria, which were first published in 2010. The standard is undergoing an extensive review, which started in 2015 and is scheduled to be completed in 2018. It uses third-party verification to ensure compliance (Potts 2014).
Since 2005, BCI has grown substantially, capturing 11% of global cotton lint production in 2016 (Better Cotton Initiative, 2017). It is in the middle of its mainstreaming phase as it works towards enabling 5 million cotton farmers to produce 8.2 million tons of “Better Cotton” by 2020, corresponding to 30% of the global cotton market (Better Cotton Initiative, 2018).
The BCI programme is focused on building the capacity of its participating farmers to adopt cotton production practices aligned with the BCI standard, such as more sustainable and profitable water conservation approaches and pest management techniques. The BCI Growth and Innovation Fund was established in 2016 with IDH for sustainable trade, BCI Retailer and Brand Members, and other public and private investments. The fund invested significant resources in 2016/2017, enabling the participation of over 600,000 farmers in BCI programmes in China, India, Pakistan, Mozambique, Senegal, Tajikistan and Turkey (Better Cotton Initiative, 2016).
BCI certified over 2.1 million hectares worldwide in 2016, representing 0.04% of the global agricultural area and 7% of the global cotton area. Over 800,000 producers participated in its programmes, and 2.9 million metric tons of cotton lint were produced in 2016. Brazil has the largest BCI area (607,000 hectares), with 61% of its cotton area BCI-certified. It is followed by India, with 501,000 hectares (4.8% of the country’s cotton area) and China, with 401,000 hectares (11.9% of the country’s cotton area). Between 2011 and 2016, the BCI-certified area grew almost fivefold. However, between 2015 and 2016, a drop of 8% was reported.
More information is available from www.bettercotton.org. For more information on BCI cotton, see Chapter 3.
Table 3: Better Cotton Initiative: Key indicators
Better Cotton Initative (BCI) 2016
Area [hectares] 2,127,000
Share of BCI area of global agricultural land [%] 0.04
Share of BCI cotton area of global cotton area [%] 7.04
Share of BCI cotton lint production volume of global cotton lint production [%] 11.25
Cotton lint: Production volume [metric tons] 2,924,000
Producers participating in Better Cotton projects [no.] 802,457
Source: Better Cotton Initiative (BCI), 2018.

CHAPTER 2 – GETTING TO KNOW STANDARD-SETTERS 17
Figure 9: Better Cotton Initiative: Certified area, 2010–2016
94,000
2,127,000
0
500,000
1,000,000
1,500,000
2,000,000
2,500,000
2010 2011 2012 2013 2014 2015 2016
Hec
tare
s
Source: Better Cotton Initiative (BCI), 2014, 2016, and 2018.
Figure 10: Better Cotton Initiative: Cotton lint production volume, 2010–2016
1,594,500
2,924,000
0
500,000
1,000,000
1,500,000
2,000,000
2,500,000
3,000,000
3,500,000
2014 2015 2016
Met
ricto
ns
Source: Better Cotton Initiative (BCI), 2014, 2016, and 2018.

CHAPTER 2 – GETTING TO KNOW STANDARD-SETTERS18
Figure 11: Better Cotton Initiative: 2016 close-up – Top countries by area
2,000
7,000
7,000
8,000
13,000
16,000
59,000
62,000
85,000
359,000
401,000
501,000
607,000
0 100,000 200,000 300,000 400,000 500,000 600,000 700,000
Kazakhstan
Madagascar
South Africa
Israel
Tajikistan
Turkey
Mozambique
Australia
United States
Pakistan
China
India
Brazil
Hectares
Source: Better Cotton Initiative (BCI), 2018.
Figure 12: Better Cotton Initiative: Top countries (percentage of total cotton area), 2016
1.8%
2.2%
3.8%
4.8%
8.0%
11.9%
14.4%
22.1%
47.3%
58.4%
60.9%
89.0%
95.9%
0% 20% 40% 60% 80% 100%
Kazakhstan
United States
Turkey
India
Tajikistan
China
Pakistan
Australia
Madagascar
Mozambique
Brazil
South Africa
Israel
Source: Better Cotton Initiative (BCI), 2018.
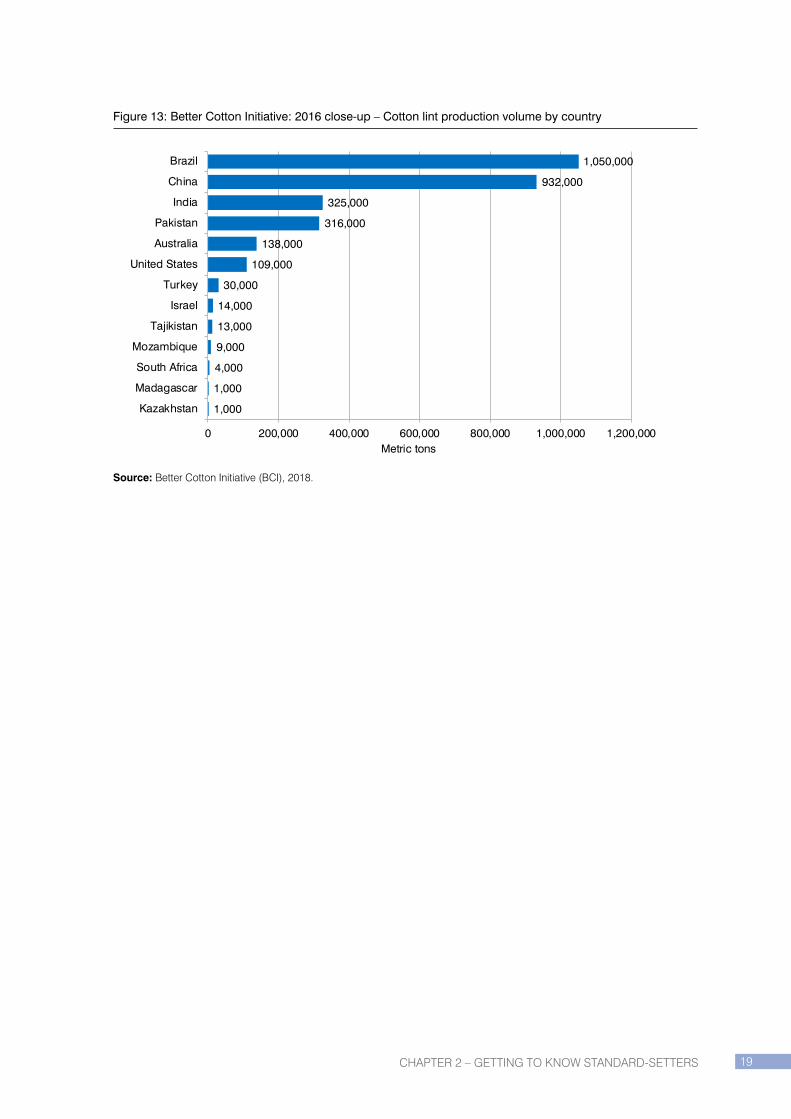
CHAPTER 2 – GETTING TO KNOW STANDARD-SETTERS 19
Figure 13: Better Cotton Initiative: 2016 close-up – Cotton lint production volume by country
1,000
1,000
4,000
9,000
13,000
14,000
30,000
109,000
138,000
316,000
325,000
932,000
1,050,000
0 200,000 400,000 600,000 800,000 1,000,000 1,200,000
Kazakhstan
Madagascar
South Africa
Mozambique
Tajikistan
Israel
Turkey
United States
Australia
Pakistan
India
China
Brazil
Metric tons
Source: Better Cotton Initiative (BCI), 2018.
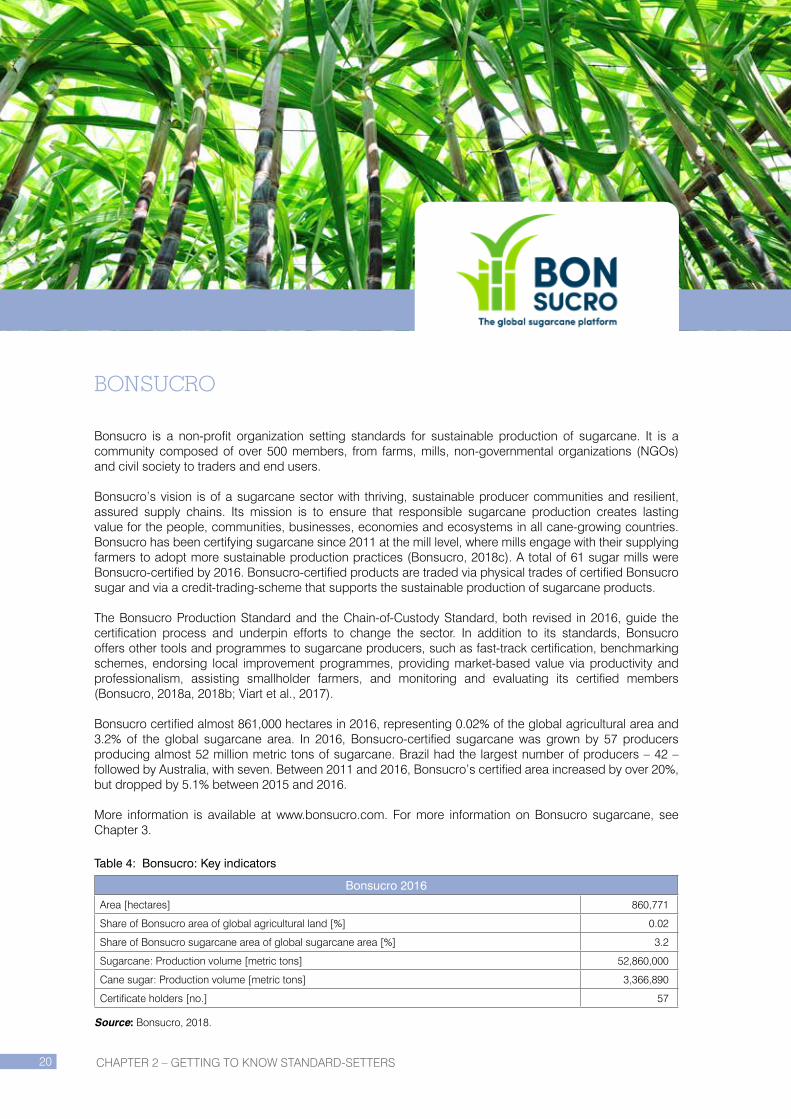
CHAPTER 2 – GETTING TO KNOW STANDARD-SETTERS20
BONSUCRO
Bonsucro is a non-profit organization setting standards for sustainable production of sugarcane. It is a community composed of over 500 members, from farms, mills, non-governmental organizations (NGOs) and civil society to traders and end users.
Bonsucro’s vision is of a sugarcane sector with thriving, sustainable producer communities and resilient, assured supply chains. Its mission is to ensure that responsible sugarcane production creates lasting value for the people, communities, businesses, economies and ecosystems in all cane-growing countries. Bonsucro has been certifying sugarcane since 2011 at the mill level, where mills engage with their supplying farmers to adopt more sustainable production practices (Bonsucro, 2018c). A total of 61 sugar mills were Bonsucro-certified by 2016. Bonsucro-certified products are traded via physical trades of certified Bonsucro sugar and via a credit-trading-scheme that supports the sustainable production of sugarcane products.
The Bonsucro Production Standard and the Chain-of-Custody Standard, both revised in 2016, guide the certification process and underpin efforts to change the sector. In addition to its standards, Bonsucro offers other tools and programmes to sugarcane producers, such as fast-track certification, benchmarking schemes, endorsing local improvement programmes, providing market-based value via productivity and professionalism, assisting smallholder farmers, and monitoring and evaluating its certified members (Bonsucro, 2018a, 2018b; Viart et al., 2017).
Bonsucro certified almost 861,000 hectares in 2016, representing 0.02% of the global agricultural area and 3.2% of the global sugarcane area. In 2016, Bonsucro-certified sugarcane was grown by 57 producers producing almost 52 million metric tons of sugarcane. Brazil had the largest number of producers – 42 – followed by Australia, with seven. Between 2011 and 2016, Bonsucro’s certified area increased by over 20%, but dropped by 5.1% between 2015 and 2016.
More information is available at www.bonsucro.com. For more information on Bonsucro sugarcane, see Chapter 3.
Table 4: Bonsucro: Key indicators
Bonsucro 2016
Area [hectares] 860,771
Share of Bonsucro area of global agricultural land [%] 0.02
Share of Bonsucro sugarcane area of global sugarcane area [%] 3.2
Sugarcane: Production volume [metric tons] 52,860,000
Cane sugar: Production volume [metric tons] 3,366,890
Certificate holders [no.] 57
Source: Bonsucro, 2018.

CHAPTER 2 – GETTING TO KNOW STANDARD-SETTERS 21
Figure 14: Bonsucro: Certified area, 2011–2016
711.7
860.8
0
200
400
600
800
1,000
1,200
2011 2012 2013 2014 2015 2016
Thou
sand
of h
ecta
res
Source: Bonsucro, 2014, 2015, 2016, and 2018.
Figure 15: Bonsucro: Cane sugar production volume, 2011–2016
3.03.4
0.0
1.0
2.0
3.0
4.0
2011 2012 2013 2014 2015 2016
Mill
ion
of m
etric
tons
Source: Bonsucro, 2014, 2015, 2016, and 2018.

CHAPTER 2 – GETTING TO KNOW STANDARD-SETTERS22
COTTON MADE IN AFRICA
Founded in 2005, Cotton made in Africa (CmiA) is an initiative of the Aid by Trade Foundation that aims to assist African cotton farmers to help themselves through trade (Cotton made in Africa, 2018b). Thus far, it has been working with cotton farmers in 10 countries, and specifically with smallholder farmers, who cultivate rainfed handpicked cotton in accordance with the CmiA standard criteria, which are regularly verified for compliance (Cotton made in Africa, 2018d, 2018a). From 2009 to 2016, CmiA obtained significant support from the Competitive African Cotton Initiative, which focused on building the capacity of African cotton farmers to adopt more sustainable farming practices.
Almost a third of all sub-Saharan African cotton was grown in accordance with the CmiA standard in 2016. CmiA estimates that their efforts touched the lives of 6.7 million people, including the family members of the smallholder cotton farmers who are part of the initiative (Cotton made in Africa, 2016). This production led to the fabrication of about 50 million CmiA-labelled textiles representing almost 1.5 million euros in licence revenues (Cotton made in Africa, 2016). In addition to enabling sustainable cotton production, CmiA invested close to 1 million euros in village-level development projects in 2016 (Cotton made in Africa, 2016).
Almost 1.2 million hectares were CmiA-verified in 2016, representing 0.02% of the global agricultural area and 0.09% of the African agricultural area. Looking solely at the cotton area, the shares are considerably higher: the CmiA area represents 3.9% of the global cotton area and 26.2% of the continent’s total cotton area. As the 2016 country data were not available at the time of publication, the latest available figures, for 2015, were used for the country level. In 2015, Côte d’Ivoire had the largest area (367,231 hectares), followed by Zambia (225,052 hectares) and Cameroon (209,930 hectares). Between 2008 and 2016, the CmiA-certified area increased more than tenfold. Between 2015 and 2016, a growth of over 21% was reported.
More information is available from www.cottonmadeinafrica.org/en/. For more information on CmiA cotton, see Chapter 3.
Table 5: Cotton made in Africa: Key indicators
Cotton made in Africa (CmiA) 2016
Area harvested [hectares] 1,182,000
Share of CmiA area of global agricultural land [%] 0.02
Share of CmiA cotton area of global cotton area [%] 3.9
Share of CmiA cotton area of African cotton area [%] 26.2
Cotton lint: Production volume [metric tons] 320,100
Producers [no.] 780,000
Source: Cotton made in Africa (CmiA), 2018.

CHAPTER 2 – GETTING TO KNOW STANDARD-SETTERS 23
Figure 16: Cotton made in Africa: Certified area, 2009–2016
117,750
1,182,000
0
200,000
400,000
600,000
800,000
1,000,000
1,200,000
1,400,000
2009 2010 2011 2012 2013 2014 2015 2016
Hec
tare
s
Source: Cotton made in Africa (CmiA), 2014, 2015, 2016, and 2018.
Figure 17: Cotton made in Africa: Production volume, 2009–2016
28,900
320,100
0
40,000
80,000
120,000
160,000
200,000
240,000
280,000
320,000
360,000
2009 2010 2011 2012 2013 2014 2015 2016
Met
ricto
ns
Production volume
Source: Cotton made in Africa (CmiA), 2014, 2015, 2016, and 2018.
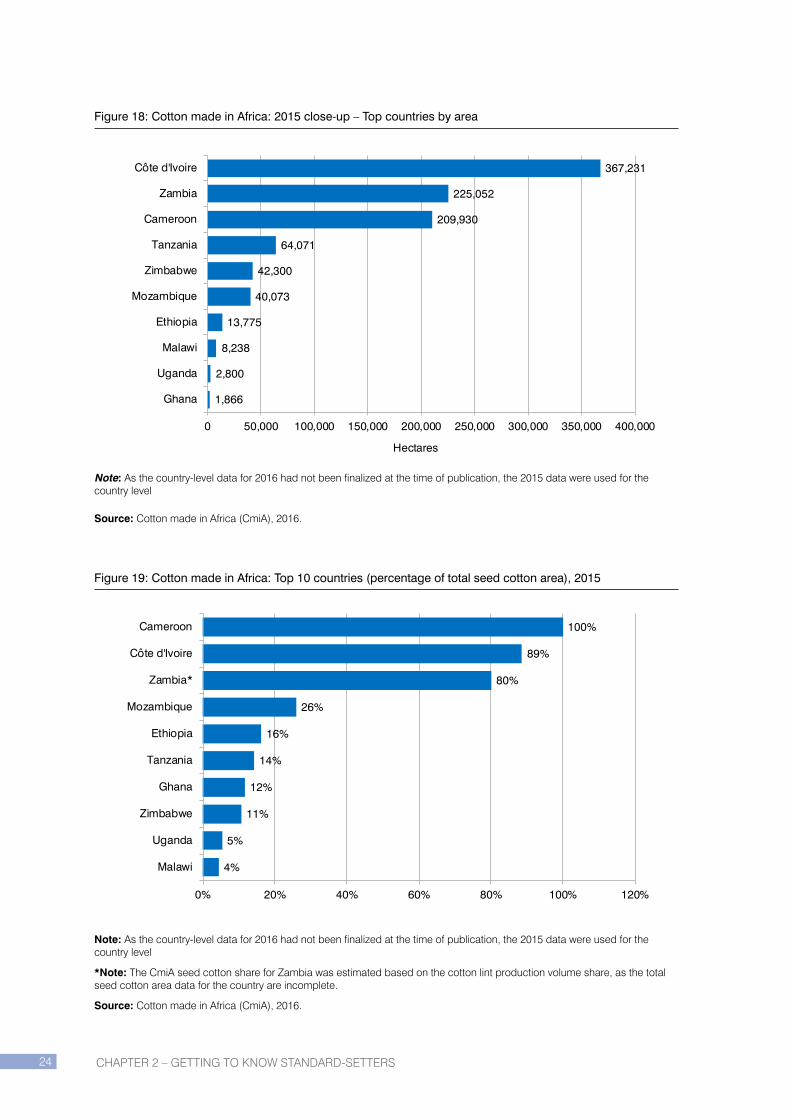
CHAPTER 2 – GETTING TO KNOW STANDARD-SETTERS24
Figure 18: Cotton made in Africa: 2015 close-up – Top countries by area
1,866
2,800
8,238
13,775
40,073
42,300
64,071
209,930
225,052
367,231
0 50,000 100,000 150,000 200,000 250,000 300,000 350,000 400,000
Ghana
Uganda
Malawi
Ethiopia
Mozambique
Zimbabwe
Tanzania
Cameroon
Zambia
Côte d'Ivoire
Hectares
Note: As the country-level data for 2016 had not been finalized at the time of publication, the 2015 data were used for the country level
Source: Cotton made in Africa (CmiA), 2016.
Figure 19: Cotton made in Africa: Top 10 countries (percentage of total seed cotton area), 2015
4%
5%
11%
12%
14%
16%
26%
80%
89%
100%
0% 20% 40% 60% 80% 100% 120%
Malawi
Uganda
Zimbabwe
Ghana
Tanzania
Ethiopia
Mozambique
Zambia*
Côte d'Ivoire
Cameroon
Note: As the country-level data for 2016 had not been finalized at the time of publication, the 2015 data were used for the country level
*Note: The CmiA seed cotton share for Zambia was estimated based on the cotton lint production volume share, as the total seed cotton area data for the country are incomplete.
Source: Cotton made in Africa (CmiA), 2016.

CHAPTER 2 – GETTING TO KNOW STANDARD-SETTERS 25
Figure 20: Cotton made in Africa: Producers by country, 2015
Zambia31%
Cameroon30%
Côte d'Ivoire16%
Tanzania8%
Mozambique7%
Zimbabwe3%
Ethiopia2% Other
3%
Note: As the country-level data for 2016 had not been finalized at the time of publication, the 2015 data were used for the country level
Source: Cotton made in Africa (CmiA), 2016.
Figure 21: Cotton made in Africa: Production volume by country, 2015
Côte d'Ivoire47%
Cameroon34%
Zambia10%
Zimbabwe3%
Tanzania2%
Ethiopia2% Other
2%
Note: As the country-level data for 2016 had not been finalized at the time of publication, the 2015 data were used for the country level
Source: Cotton made in Africa (CmiA), 2016.

CHAPTER 2 – GETTING TO KNOW STANDARD-SETTERS26
FAIRTRADE INTERNATIONAL
Founded in 1997, Fairtrade International is a member-based initiative operating in the food and agriculture sector across 74 countries, including 21 low-income countries (Fairtrade International, 2018a). The initiative coordinates Fairtrade labelling at the international level and sets minimum pricing and premium levels as part of its commitment to poverty reduction for developing-country producers.
As part of Fairtrade International’s mission to establish equitable and just trading relationships for its producers, the Fairtrade standards for smallholders and hired labour working primarily in plantations must be adhered to by participating entities for their products to be labelled Fairtrade. The Fairtrade Minimum Price is based on the average cost of sustainable production for a given commodity. It is applied only if market prices fall below minimum prices, thus effectively protecting producers from the vagaries of global markets. A price premium is also obtained for all Fairtrade products sold, which goes towards community sustainable development projects.
Fairtrade is embarking on ambitious sustainable consumption and production initiatives in Europe and Asia, including India and Bhutan (Fairtrade International, 2018c). These efforts will contribute to the objectives of the Fairtrade Strategy 2016–2020 by strengthening its global networks and movements and by expanding its reach in India and Bhutan by developing new Fairtrade supply chains and enhancing consumer awareness.
Unfortunately, the 2016 data were not available for all crops at the time of publication, and so a complete picture could not be drawn for Fairtrade International in 2016. However, the 2016 data have been reported when available; this is the case of bananas, cocoa, cotton (except for the area), sugarcane and tea.
Almost 2.5 million hectares were Fairtrade-certified in 2015, representing 0.05% of the global agricultural area. Fairtrade International certifies a wide range of commodities, from tropical fruit to cereals, gold and textiles. Coffee accounted for over half of the total Fairtrade International area, with almost 1.3 million hectares, or nearly 12% of the global coffee area. After coffee, cocoa was the second most important product, with more than 570,000 hectares, representing almost 6% of the global cocoa area. In 2016, Fairtrade International certified 1,411 producer organizations, mainly in Latin America (52%), followed by Africa (31%) and Asia (17%). Between 2011 and 2015, the Fairtrade-certified area grew by over 80%, and by 19% between 2014 and 2015 alone.
In 2015, Fairtrade International retail sales amounted to $8.1 billion, and the largest markets were in the United Kingdom ($2.4 billion), Germany (almost $1.2 billion) and the United States (more than $1 billion).
More information is available at www.fairtrade.net. For more information on Fairtrade commodities, see Chapter 3.

CHAPTER 2 – GETTING TO KNOW STANDARD-SETTERS 27
Table 6: Fairtrade International: Key indicators
Fairtrade International 2015
Area harvested [hectares] 2,479,339
Share of Fairtrade International area of global agricultural land [%] 0.05
Production value [million $]10 1,205
Production volume [metric tons] 3,085,692
Production volume sold under the label [metric tons] 1,030,786
Producer organizations [no.] 1,239
Global retail sales [million $] 8,099
Global retail sales: Growth rate 2014–2015 [%] 16
Source: Fairtrade International, 2017.
Note: The 2015 totals have been revised and might differ from those reported in the previous edition of this report.
Figure 22: Fairtrade International: Certified area, 2011–2015
1.4
2.5
0.0
0.5
1.0
1.5
2.0
2.5
3.0
2011 2012 2013 2014 2015
Mill
ion
of h
ecta
res
Source: Fairtrade International, 2017.
10. This refers to the total Fairtrade production volume and value with the exception of flowers, gold and sport balls. The figure might differ from the data reported in the Fairtrade monitoring reports.

CHAPTER 2 – GETTING TO KNOW STANDARD-SETTERS28
Figure 23: Fairtrade International: 2015 close-up – Top 10 countries by area
94,789
97,306
108,783
121,992
175,758
186,342
208,481
209,319
218,520
250,983
0 50,000 100,000 150,000 200,000 250,000 300,000
Dominican Republic
South Africa
Kenya
Mexico
Tanzania
Côte d'Ivoire
Ethiopia
Peru
Colombia
Ghana
Hectares
Source: Fairtrade International, 2017.
Figure 24: Fairtrade International: Top 10 countries (percentage of total agricultural area), 2015
0.6%
0.7%
0.9%
0.9%
1.2%
1.6%
2.1%
2.4%
2.8%
4.0%
0.0% 1.0% 2.0% 3.0% 4.0% 5.0%
Papua New Guinea
Guatemala
Peru
Côte d'Ivoire
Nicaragua
Ghana
Costa Rica
Jamaica
Mauritius
Dominican Republic
Source: Fairtrade International, 2017.

CHAPTER 2 – GETTING TO KNOW STANDARD-SETTERS 29
Figure 25: Fairtrade International: Area by region, 2015
Africa47%
Latin America41%
Asia5%
Oceania0.3%
No details7%
Source: Fairtrade International, 2017.
Figure 26: Fairtrade International: Top 10 products by area, 2015
20
31
41
45
49
93
122
187
570
1,297
0 200 400 600 800 1,000 1,200 1,400
Rice
Fruit, no details
Bananas
Cotton
Quinoa
Grapes, wine
Tea
Sugarcane
Cocoa
Coffee
Thousand of hectares
Source: Fairtrade International, 2017.

CHAPTER 2 – GETTING TO KNOW STANDARD-SETTERS30
Figure 27: Fairtrade International: Production volume and production volume sold under the Fairtrade label, 2011–2015
2,094
3,086
774
1,031
0
500
1,000
1,500
2,000
2,500
3,000
3,500
2011 2012 2013 2014 2015
Thou
sand
s of
met
ricto
ns
Production volume Production volume sold under the label
Note: This refers to the total Fairtrade production volume and value with the exception of flowers, gold, nuts, honey and sport balls. The figure might differ from the data reported in the Fairtrade monitoring reports.
Source: Fairtrade International, 2017.
Figure 28: Fairtrade International: Retail sales, 2004–2015
1,032
8,099
0
1,000
2,000
3,000
4,000
5,000
6,000
7,000
8,000
9,000
2004 2005 2006 2007 2008 2009 2011 2012 2013 2014 2015
$ m
illio
n
Source: Fairtrade International 2005–2016 (data missing for 2010). Original data in euros; the 2015 annual average exchange rate from the Statistical Data Warehouse of the European Central Bank was used.
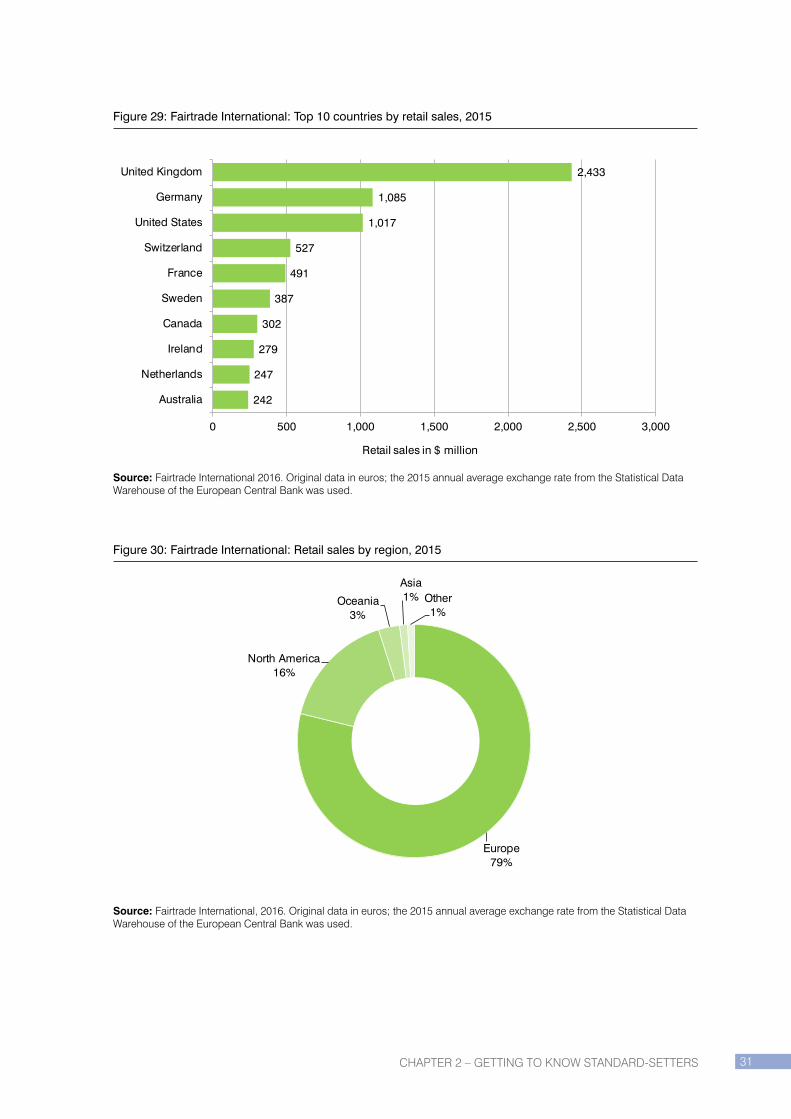
CHAPTER 2 – GETTING TO KNOW STANDARD-SETTERS 31
Figure 29: Fairtrade International: Top 10 countries by retail sales, 2015
242
247
279
302
387
491
527
1,017
1,085
2,433
0 500 1,000 1,500 2,000 2,500 3,000
Australia
Netherlands
Ireland
Canada
Sweden
France
Switzerland
United States
Germany
United Kingdom
Retail sales in $ million
Source: Fairtrade International 2016. Original data in euros; the 2015 annual average exchange rate from the Statistical Data Warehouse of the European Central Bank was used.
Figure 30: Fairtrade International: Retail sales by region, 2015
Europe79%
North America16%
Oceania3%
Asia1% Other
1%
Source: Fairtrade International, 2016. Original data in euros; the 2015 annual average exchange rate from the Statistical Data Warehouse of the European Central Bank was used.

CHAPTER 2 – GETTING TO KNOW STANDARD-SETTERS32
FOREST STEWARDSHIP COUNCIL
Founded in 1993, FSC is a member-based initiative operating in over 80 countries (Forest Stewardship Council, 2018c). The FSC Principles and Criteria (P&C) articulate the requirements for forest management certification. To ensure that the global P&C are well suited for national and regional contexts, standard development groups are formed to establish national and regional standards.
Based on annual field and office audits, independent, accredited certification bodies issue Forest Management and Chain of Custody certificates, which correspond to the different origins, stages of production and subsequent progress of forest products through the value chain (FSC, 2016a). Forest Management certification aims to protect the environmental and social values of forests being used for timber extraction, for instance, and to protect areas of high conservation value and Indigenous Peoples’ land rights.
The FSC chain-of-custody certification ensures that FSC-certified wood remains separate from non-certified wood throughout the supply chain (Forest Stewardship Council, 2018a). In order to display the FSC Mix label (the standard’s most common label), products must be made up, on balance, of at least 70% FSC-certified material. The remainder can be FSC-Controlled Wood. This material has been assessed as having a low risk of coming from unacceptable sources in uncertified forests, and a low risk of having mixed with unacceptable material in the supply chain. The “Controlled Wood” status ensures that wood is harvested legally in accordance with traditional and civil rights and is not sourced from areas of high conservation value, from forests with genetically modified trees or from areas being permanently deforested to give way to plantations or other non-forest uses (Forest Stewardship Council, 2018b).
Proactive stakeholder engagement is at the core of the organization. FSC members and other stakeholders make the most relevant decisions related to FSC certification and FSC governance processes. FSC’s governance structure balances both societal interests and North-South perspectives to develop transparent, consensus-based solutions at global and local level to promote responsible forest stewardship. FSC increasingly works to forge stronger business linkages between suppliers and buyers of forest products that come from responsible sources.
More than 196 million hectares of forest were FSC-certified in 2016 (data per January 2017), representing 4.9% of the global forest area. Canada had the largest area, with almost 54.7 million hectares, followed by the Russian Federation (nearly 44 million hectares) and the United States (almost 14 million hectares). Together, these three countries represented 57% of the global FSC-certified area. In 2016, there were 1,462 forest-management certificate holders and almost 31,600 chain-of-custody certificate holders.
More information is available at www.ic.fsc.org/en. For more information on forestry, see Chapter 3.

CHAPTER 2 – GETTING TO KNOW STANDARD-SETTERS 33
Table 7: Forest Stewardship Council: Key indicators
Forest Stewardship Council (FSC) 2016 11
Area certified as managed in compliance with the FSC standards [hectares] 196,285,055
Share of total forest area [%] 4.9
Forest management certificate holders [no.] 1,462
Chain-of-custody certificate holders [no.] 31,599
Source: Forest Stewardship Council (FSC), 2016.
Figure 31: Forest Stewardship Council: Certified area, 2004–2016
48
196
0
50
100
150
200
250
2004 2005 2006 2007 2008 2009 2010 2011 2012 2013 2014 2015 2016
Mill
ion
of h
ecta
res
Source: Forest Stewardship Council (FSC), 2005–2018.
11. Data reported in January 2017.

CHAPTER 2 – GETTING TO KNOW STANDARD-SETTERS34
Figure 32: Forest Stewardship Council: 2016 close-up – Top 10 countries by area
2.63
2.85
2.88
6.26
6.94
8.50
12.26
13.71
43.75
54.68
0 10 20 30 40 50 60
Congo, D.R.
Indonesia
Ukraine
Brazil
Poland
Belarus
Sweden
United States
Russian Federation
Canada
Million of hectares
Source: Forest Stewardship Council (FSC), 2018.
Figure 33: Forest Stewardship Council: Area by region, 2016
Europe50%
North America35%
Latin America7%
Africa4%
Asia3%
Oceania1%
Source: Forest Stewardship Council (FSC), 2018.

CHAPTER 2 – GETTING TO KNOW STANDARD-SETTERS 35
Figure 34: Forest Stewardship Council: Forest Management by region, 2016
Europe54%
Asia28%
North America11%
Latin America5%
Oceania1%
Africa1%
Source: Forest Stewardship Council (FSC), 2018.

CHAPTER 2 – GETTING TO KNOW STANDARD-SETTERS36
GLOBAL G.A.P.
Founded in 1997, the Global Partnership for Good Agricultural Practices (GLOBALG.A.P.) is a private initiative operating in the food and agriculture sector across 125 countries (GLOBALG.A.P., 2018c). It evolved from the efforts of the Euro-Retailer Produce Working Group, which decided to partner with their suppliers and establish their own standard to meet food safety, environmental impact, worker health and safety, and animal welfare concerns and requirements for their European-based stores. The standard eventually became global in scope, was chaired by a farmer and adopted the name GLOBALG.A.P.
GLOBALG.A.P. runs 40 standards for crops, livestock and aquaculture production (GLOBALG.A.P., 2018a). It also implements a Chain-of-Custody Standard to ensure product segregation of the certified products. The local G.A.P. programme provides retailers with a less stringent stepwise approach to accessing local markets and eventually becoming GLOBALG.A.P.-certified (GLOBALG.A.P., 2018a). This approach enables new growers to meet minimum requirements for food safety and hygiene at its “Foundation” level before advancing to other food safety criteria. For retailers looking to go beyond the GLOBALG.A.P. certification, the standard offers add-on modules that can enhance their certification by addressing additional worker health and safety and animal welfare considerations as well as specific retailer sustainability initiatives. Examples are the COOP Sustainable Program for Irrigation and Groundwater Use and the Tesco Nurture Program associated with the plant protection product list (GLOBALG.A.P., 2018b).
In 2016, almost 3.3 million hectares were certified against the GLOBALG.A.P. standard12, managed by over 170,000 horticulture producers.13 The product with the largest area was potatoes, with over 350,000 hectares, followed by bananas (nearly 253,000 hectares) and apples (almost 245,600 hectares). Most of GLOBALG.A.P.’s certified area is in Europe (44%), followed by Latin America (26%), Africa (12%) and North America (5%). Spain had the largest certified area (over 402,000 hectares), followed by Italy (almost 189,000 hectares) and France (over 181,000 hectares). Between 2011 and 2016, the GLOBALG.A.P.-certified area increased by 23%.
GLOBALG.A.P. certifies a wide variety of fruits and vegetables worldwide, more than 230 such products are also certified within the Integrated Farm Assurance (IFA) standard worldwide.
More information is available from www.globalgap.org/uk_en. For more information on GLOBALG.A.P. bananas, see Chapter 3.
12. This includes many hectares covered by greenhouses and plastic tunnels for intensive production.
13. The number of producers includes crop producers only, and excludes livestock and aquaculture operators.

CHAPTER 2 – GETTING TO KNOW STANDARD-SETTERS 37
Table 8: GLOBALG.A.P.: Key indicators
GLOBALG.A.P. IFA Standard 2016 14
Total area [hectares] 3,293,282
Area non-covered [hectares] 3,173,965
Area covered [hectares] (greenhouses and plastic tunnels) 119,317
Certificate holders [no.] 47,215
Producers [no.] 174,316
Source: GLOBALG.A.P., 2018.
Figure 35: GLOBALG.A.P.: Certified area, 2010–2016
2.22
3.29
0.0
0.5
1.0
1.5
2.0
2.5
3.0
3.5
2010 2011 2012 2013 2014 2015 2016
Mill
ion
of h
ecta
res
Source: GLOBALG.A.P., 2018.
14. The number of producers and the number of certificate holders include the total number of producers/certificate holders under certification within the Integrated Farm Assurance (IFA) Standard. For more information on the IFA Standard, see www.globalgap.org/uk_en/what-we-do/globalg.a.p.-certification/globalg.a.p./.
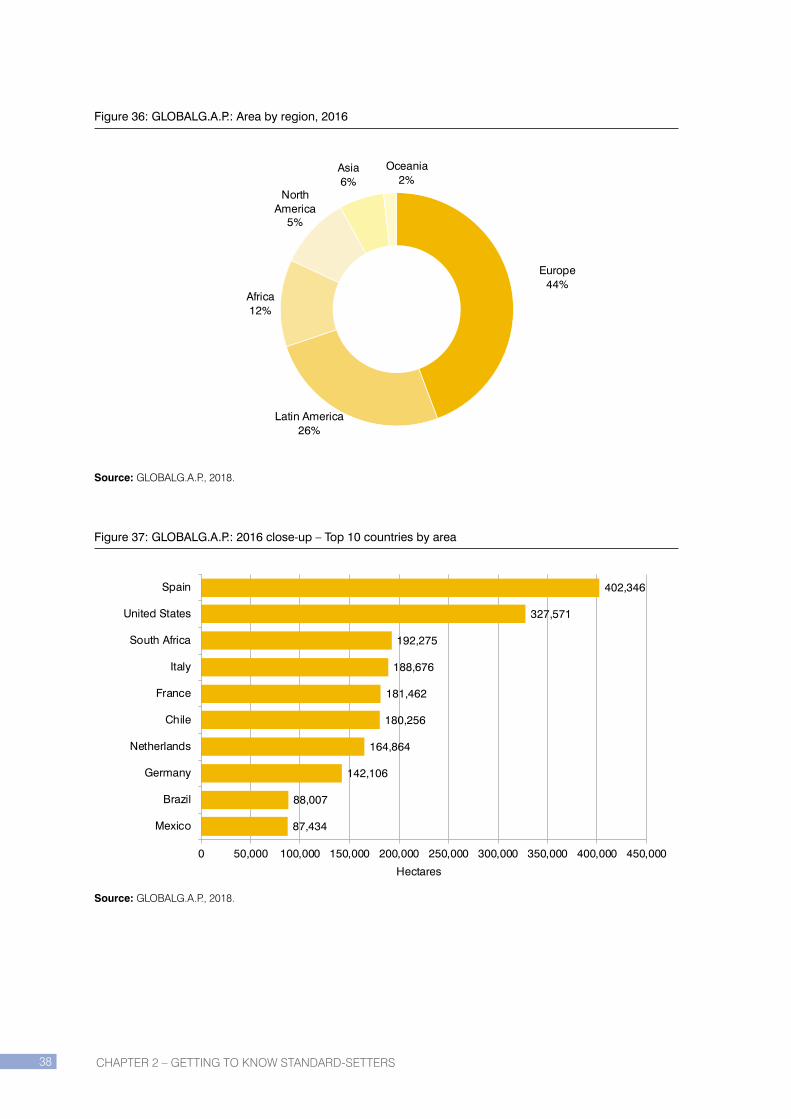
CHAPTER 2 – GETTING TO KNOW STANDARD-SETTERS38
Figure 36: GLOBALG.A.P.: Area by region, 2016
Europe44%
Latin America26%
Africa12%
North America
5%
Asia6%
Oceania2%
Source: GLOBALG.A.P., 2018.
Figure 37: GLOBALG.A.P.: 2016 close-up – Top 10 countries by area
87,434
88,007
142,106
164,864
180,256
181,462
188,676
192,275
327,571
402,346
0 50,000 100,000 150,000 200,000 250,000 300,000 350,000 400,000 450,000
Mexico
Brazil
Germany
Netherlands
Chile
France
Italy
South Africa
United States
Spain
Hectares
Source: GLOBALG.A.P., 2018.
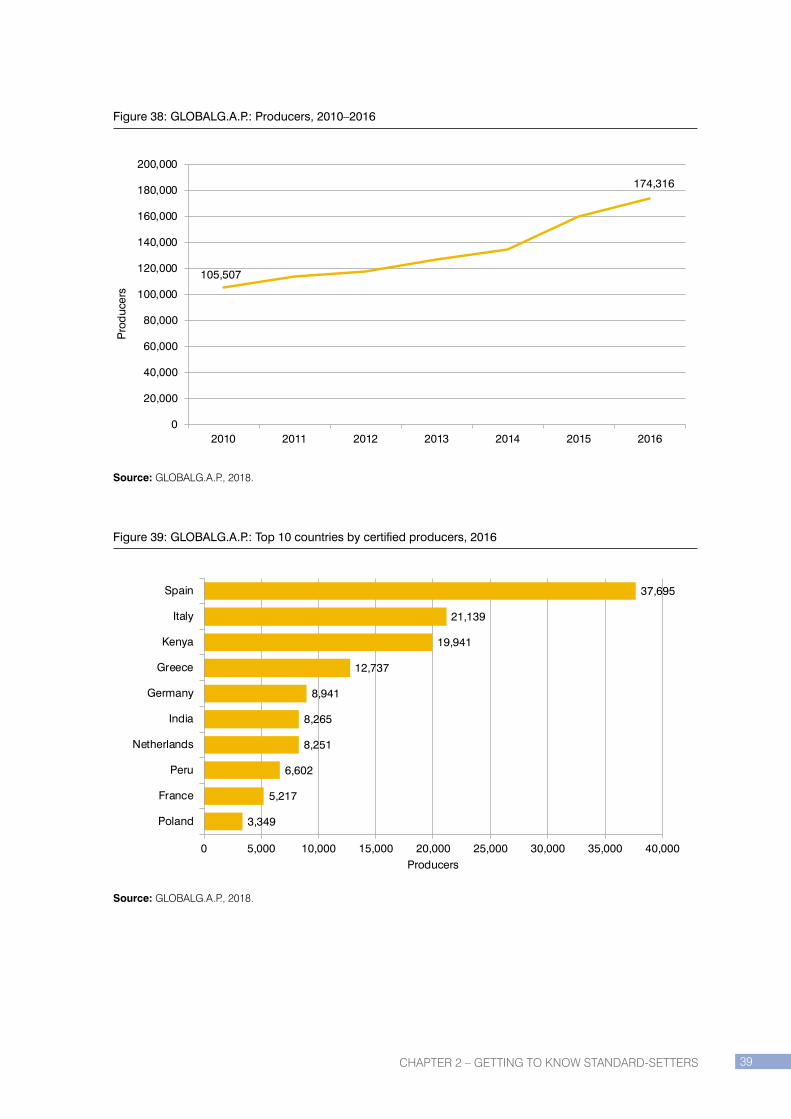
CHAPTER 2 – GETTING TO KNOW STANDARD-SETTERS 39
Figure 38: GLOBALG.A.P.: Producers, 2010–2016
105,507
174,316
0
20,000
40,000
60,000
80,000
100,000
120,000
140,000
160,000
180,000
200,000
2010 2011 2012 2013 2014 2015 2016
Pro
duc
ers
Source: GLOBALG.A.P., 2018.
Figure 39: GLOBALG.A.P.: Top 10 countries by certified producers, 2016
3,349
5,217
6,602
8,251
8,265
8,941
12,737
19,941
21,139
37,695
0 5,000 10,000 15,000 20,000 25,000 30,000 35,000 40,000
Poland
France
Peru
Netherlands
India
Germany
Greece
Kenya
Italy
Spain
Producers
Source: GLOBALG.A.P., 2018.
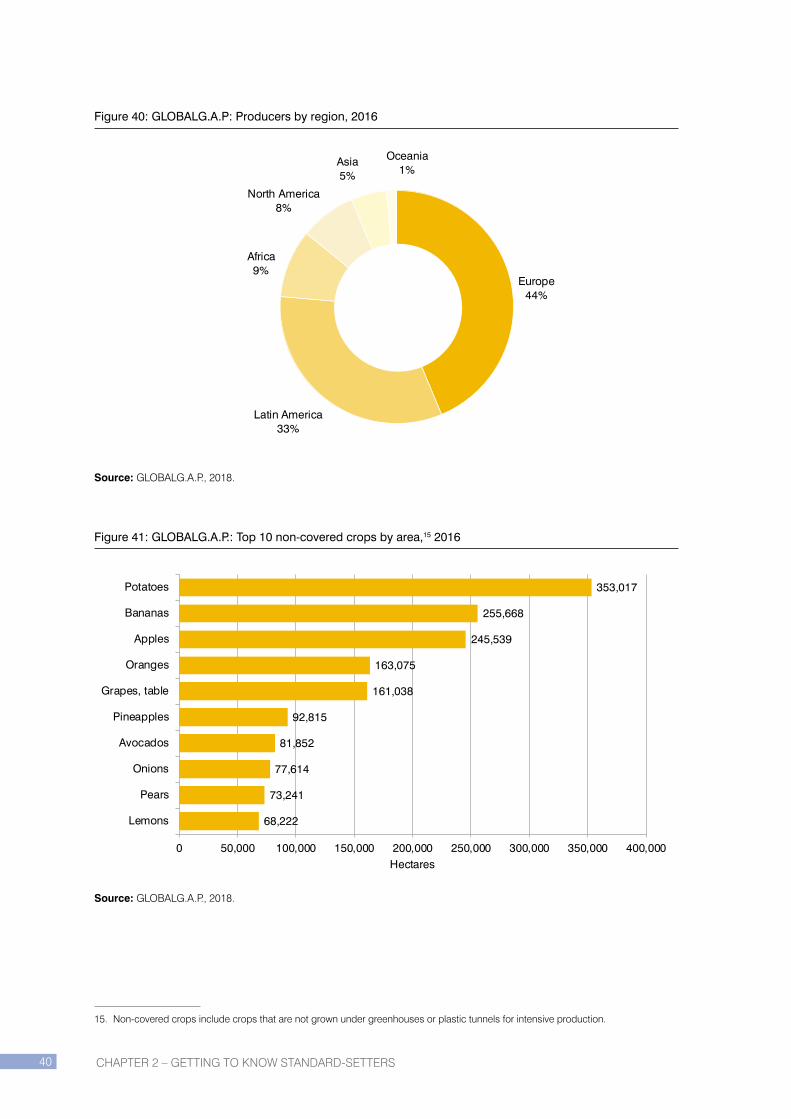
CHAPTER 2 – GETTING TO KNOW STANDARD-SETTERS40
Figure 40: GLOBALG.A.P: Producers by region, 2016
Europe44%
Latin America33%
Africa9%
North America8%
Asia5%
Oceania1%
Source: GLOBALG.A.P., 2018.
Figure 41: GLOBALG.A.P.: Top 10 non-covered crops by area,15 2016
68,222
73,241
77,614
81,852
92,815
161,038
163,075
245,539
255,668
353,017
0 50,000 100,000 150,000 200,000 250,000 300,000 350,000 400,000
Lemons
Pears
Onions
Avocados
Pineapples
Grapes, table
Oranges
Apples
Bananas
Potatoes
Hectares
Source: GLOBALG.A.P., 2018.
15. Non-covered crops include crops that are not grown under greenhouses or plastic tunnels for intensive production.
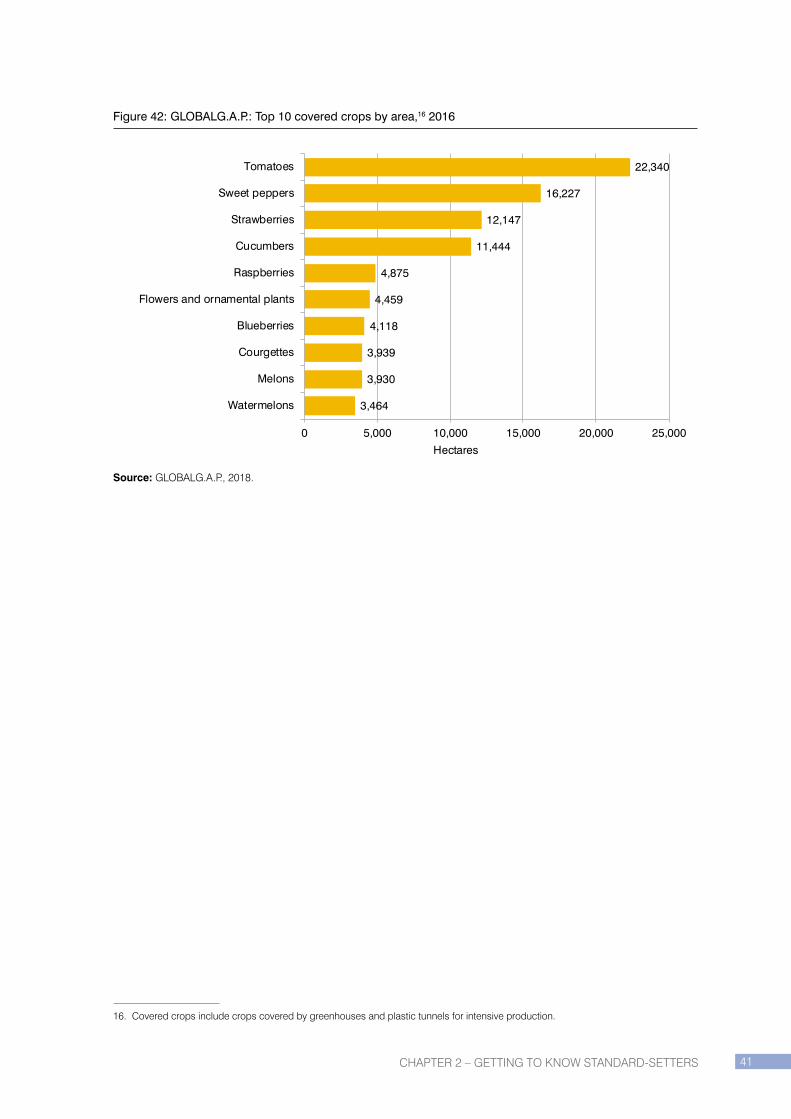
CHAPTER 2 – GETTING TO KNOW STANDARD-SETTERS 41
Figure 42: GLOBALG.A.P.: Top 10 covered crops by area,16 2016
3,464
3,930
3,939
4,118
4,459
4,875
11,444
12,147
16,227
22,340
0 5,000 10,000 15,000 20,000 25,000
Watermelons
Melons
Courgettes
Blueberries
Flowers and ornamental plants
Raspberries
Cucumbers
Strawberries
Sweet peppers
Tomatoes
Hectares
Source: GLOBALG.A.P., 2018.
16. Covered crops include crops covered by greenhouses and plastic tunnels for intensive production.

CHAPTER 2 – GETTING TO KNOW STANDARD-SETTERS42
IFOAM – ORGANICS INTERNATIONAL
Founded in 1972, IFOAM – Organics International is a membership-based umbrella organization representing the organic movement across the entire value chain, with affiliates in more than 127 countries (Willer/Lernoud, 2018). One of its areas of work is to set standards and quality assurance systems for organic standards and to promote the adoption of organic agriculture worldwide.
Organic certification is typically determined by standards set at the national or regional level. Many different organic standards may operate within a single country, and they may or may not follow the IFOAM standard or comply with the standards included in the IFOAM Family of Standards. Some 87 countries have local organic standards, and 18 countries are in the process of drafting legislation (Huber and Schmid, 2018).
IFOAM – Organics International plays a special role in the organic sector by uniting organic stakeholders, advocating long-term social and ecological change, facilitating production and trade, assisting organic development and building the capacity of future organic leaders. Unlike most other standard-setting organizations, it is not involved in the certification and control process; all its efforts focus on the development of the organic sector. IFOAM – Organics International is currently involved in enabling the organic movement to address global socio-environmental challenges (IFOAM, 2018).
In 2016, 57.8 million hectares were certified organic worldwide, representing 1.2% of the global agricultural land. There were at least 2.7 million producers in 178 countries practising organic farming. Australia has the largest organic area, with 27.1 million hectares, followed by Argentina (3 million hectares) and the United States (2.3 million hectares). Almost all agricultural products can be certified according to organic standards and regulations; indeed, organic has the largest range of commodities of all the standards presented in this report. Apart from agricultural products, wild collection, aquaculture and forestry products are certified. In 2016, these areas covered almost 40 million hectares.
The organic market surpassed the $90-billion mark in 2016, and the leading countries were the United States (46% of the global organic market), Germany (11%) and France (8%). Data collection on organic agriculture is carried out annually by FiBL, and the data are published in the joint FiBL-IFOAM – Organics International publication The World of Organic Agriculture (Willer and Lernoud, 2018). The data on organic cotton shown in this report were provided by Textile Exchange.
As production volume data are not available for most countries, FiBL has estimated the area harvested and the production volume for the products covered by this report: bananas, cocoa, coffee, cotton, oil palm, soybeans, sugarcane and tea. For the harvested area, it was assumed that 90% of the fully converted area was harvested. The production volume was arrived at using estimated yields based on country yields as provided by the Food and Agriculture Organization Corporate Statistical Database (FAOSTAT), assuming that organic has a lower yield in most cases.
More information is available at www.ifoam.bio. For information on organic commodities, see Chapter 3.

CHAPTER 2 – GETTING TO KNOW STANDARD-SETTERS 43
Table 9: Organic: Key indicators
Organic 2016
Agricultural area [hectares] (including in-conversion areas) 57,816,759
Other organic areas [hectares] (Wild collection, aquaculture, etc.) 39,712,910
Share of organic area of global agricultural land [%] 1.2
Producers [no.] 2,726,967
Global retail sales [million $] 93,753
Source: FiBL survey, 2018 (Willer and Lernoud 2018).
Figure 43: Organic: Certified area, 1999–2016
11.0
57.8
0
10
20
30
40
50
60
70
1999
2000
2001
2002
2003
2004
2005
2006
2007
2008
2009
2010
2011
2012
2013
2014
2015
2016
Mill
ion
of h
ecta
res
Source: GLOBALG.A.P., 2018.

CHAPTER 2 – GETTING TO KNOW STANDARD-SETTERS44
Figure 44: Organic: 2016 close-up – Top 10 countries by area
1,251,320
1,490,000
1,538,047
1,656,952
1,796,363
2,018,802
2,031,318
2,281,215
3,011,794
27,145,021
0 5,000,000 10,000,000 15,000,000 20,000,000 25,000,000 30,000,000
Germany
India
France
Uruguay
Italy
Spain
United States
China
Argentina
Australia
Hectares
Source: FiBL survey, 2018 (Willer and Lernoud 2018). Based on national data sources and data from certifiers.
Figure 45: Organic: Area by region, 2016
Oceania47%
Europe23%
Latin America12%
Asia9%
North America6%
Africa3%
Source: FiBL, 2018 (Willer and Lernoud 2018). Based on national data sources and data from certifiers.
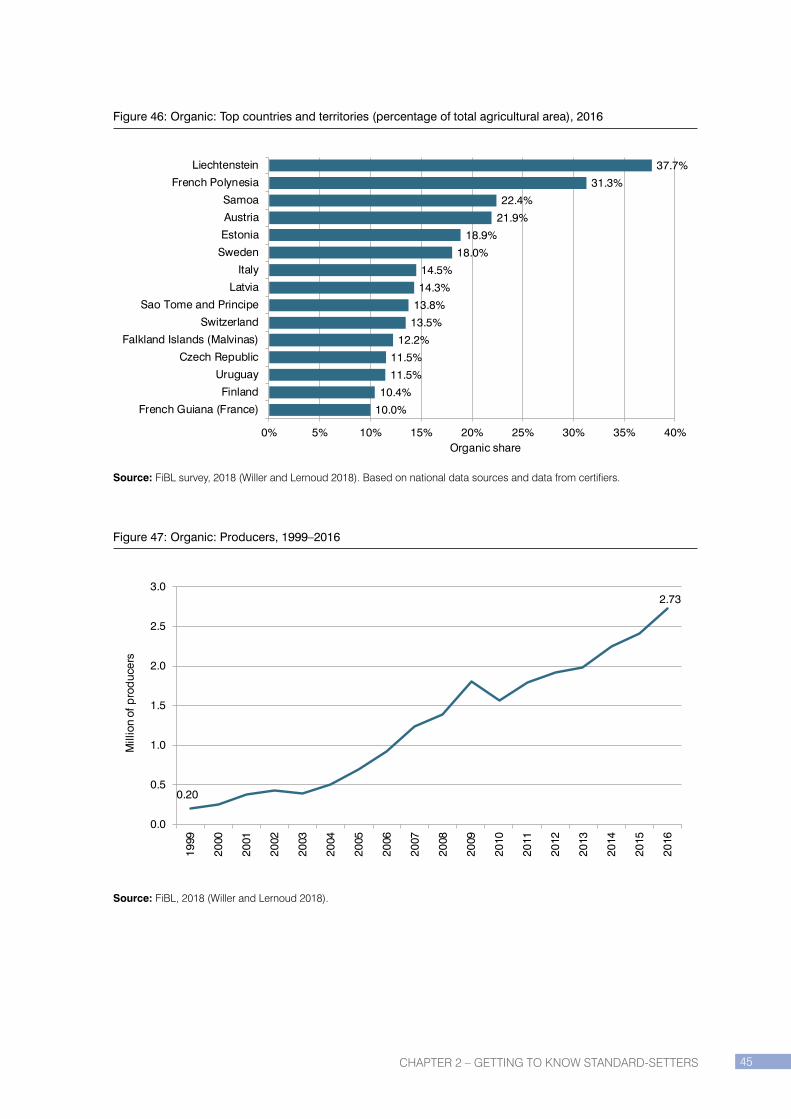
CHAPTER 2 – GETTING TO KNOW STANDARD-SETTERS 45
Figure 46: Organic: Top countries and territories (percentage of total agricultural area), 2016
10.0%
10.4%
11.5%
11.5%
12.2%
13.5%
13.8%
14.3%
14.5%
18.0%
18.9%
21.9%
22.4%
31.3%
37.7%
0% 5% 10% 15% 20% 25% 30% 35% 40%
French Guiana (France)
Finland
Uruguay
Czech Republic
Falkland Islands (Malvinas)
Switzerland
Sao Tome and Principe
Latvia
Italy
Sweden
Estonia
Austria
Samoa
French Polynesia
Liechtenstein
Organic share
Source: FiBL survey, 2018 (Willer and Lernoud 2018). Based on national data sources and data from certifiers.
Figure 47: Organic: Producers, 1999–2016
0.20
2.73
0.0
0.5
1.0
1.5
2.0
2.5
3.0
1999
2000
2001
2002
2003
2004
2005
2006
2007
2008
2009
2010
2011
2012
2013
2014
2015
2016
Mill
ion
of p
rod
ucer
s
Source: FiBL, 2018 (Willer and Lernoud 2018).

CHAPTER 2 – GETTING TO KNOW STANDARD-SETTERS46
Figure 48: Organic: Top 10 countries by certified producers, 2016
58,258
64,210
67,879
91,771
148,610
165,994
203,602
210,000
210,352
835,000
0 100,000 200,000 300,000 400,000 500,000 600,000 700,000 800,000 900,000
Paraguay
Italy
Turkey
Peru
Tanzania
Philippines
Ethiopia
Mexico
Uganda
India
Producers
Source: FiBL survey, 2018 (Willer and Lernoud 2018). Based on national data sources and data from certifiers.
Figure 49: Organic: Producers by region, 2016
Asia40%
Africa27%
Latin America17%
Europe14%
Oceania1%North America
1%
Source: FiBL survey, 2018 (Willer and Lernoud 2018). Based on national data sources and data from certifiers.

CHAPTER 2 – GETTING TO KNOW STANDARD-SETTERS 47
Figure 50: Organic: Top 10 countries by retail sales, 2016
1,686
1,944
2,298
2,460
2,644
3,002
5,900
6,736
9,478
38,938
0 5,000 10,000 15,000 20,000 25,000 30,000 35,000 40,000 45,000
Spain
Sweden
Switzerland
United Kingdom
Italy
Canada
China
France
Germany
United States
Retail sales million USD
Source: FiBL survey, 2018 (Willer and Lernoud 2018). Based on national data sources.
Figure 51: Organic: Top 10 crops/crop groups, 2016
356,119
379,555
437,443
495,773
529,138
574,069
747,640
933,950
1,286,588
4,091,183
0 1,000,000 2,000,000 3,000,000 4,000,000 5,000,000
Tropical/subtrop fruits.
Grapes
Vegetables
Textile crops
Dry pulses
Nuts
Olives
Coffee
Oilseeds
Cereals
Hectares
Source: FiBL survey, 2018 (Willer and Lernoud 2018). Based o n national data sources and data from certifiers.

CHAPTER 2 – GETTING TO KNOW STANDARD-SETTERS48
Figure 52: Organic: Land by main use type, 2016
Permanent grassland66%
Arable land crops18%
Permanent crops8%
No details/Other8%
Source: FiBL survey, 2018 (Willer and Lernoud 2018). Based on national data sources and data from certifiers.

CHAPTER 2 – GETTING TO KNOW STANDARD-SETTERS 49
PROGRAMME FOR THE ENDORSEMENT OF FOREST CERTIFICATION
Founded in 1999, the Programme for the Endorsement of Forest Certification (PEFC) is a global alliance of independent national standard-setting bodies and international stakeholder members. PEFC is currently represented in 49 countries via its national organizations (PEFC, 2018). The initiative manages the PEFC Sustainability Benchmarks, which set baseline requirements for national standards initiatives to be endorsed by PEFC.
PEFC is an international umbrella organization that develops forest management and Chain of Custody standards and provides independent assessment and endorsement of national forest certification systems. It operates on a business-to-consumer basis, developing standards and marketing the PEFC label to ensure sustainable forestry practices.
PEFC continues to push the boundaries of forest certification by challenging its members to address various sustainability challenges. For instance, members explored adopting a landscape approach to address deforestation at the PEFC Forest Week 2015 and 2016 (Collins & Voora, 2016; Turley, 2015), and a task force explored certifying trees outside of forests as they also provide valuable ecosystem services (PEFC, 2016).
PEFC certified more than 301 million hectares of forest worldwide in 2016, or 7.5% of the global forest area. Canada had the largest PEFC-certified forest area, with over 131 million hectares, followed by the United States and Australia. In 2016, there were 10,867 chain-of-custody certificate holders.
More information is available at www.pefc.org. For more information on forestry, see Chapter 3.
Table 10: Programme for the Endorsement of Forest Certification Schemes: Key indicators
Programme for the Endorsement of Forest Certification (PEFC) 2016
Forest area [hectares] 301,569,608
Share of total forest area [%] 7.5
Chain-of-custody certificate holders [no.] 10,867
Source: Programme for the Endorsement of Forest Certification (PEFC), 2018.

CHAPTER 2 – GETTING TO KNOW STANDARD-SETTERS50
Figure 53: Programme for the Endorsement of Forest Certification: Certified area, 2004–2016
55
302
0
50
100
150
200
250
300
350
2004 2005 2006 2007 2008 2009 2010 2011 2012 2013 2014 2015 2016
Mill
ion
of h
ecta
res
Source: Programme for the Endorsement of Forest Certification (PEFC), 2005–2018.
Figure 54: Programme for the Endorsement of Forest Certification: Area by region, 2016
North America54%
Europe31%
Oceania9%
Asia4%
Latin America2%
Source: Programme for the Endorsement of Forest Certification (PEFC), 2018.

CHAPTER 2 – GETTING TO KNOW STANDARD-SETTERS 51
Figure 55: Programme for the Endorsement of Forest Certification: 2016 close-up – Top 10 countries by area
7.4
7.4
8.2
8.7
11.5
12.0
16.6
26.6
33.3
131.1
0 50 100 150
Norway
Germany
France
Belarus
Sweden
Russian Federation
Finland
Australia
United States
Canada
Million of hectares
Source: Programme for the Endorsement of Forest Certification (PEFC), 2018.
Figure 56: Programme for the Endorsement of Forest Certification: Chain-of-custody certificate holders, 2001–2016
59
10,976
0
2,000
4,000
6,000
8,000
10,000
12,000
2001 2002 2003 2004 2005 2006 2007 2008 2009 2010 2011 2012 2013 2014 2015 2016
Num
ber
of P
EFC
cha
in o
f cus
tod
y ce
rtific
ates
Source: Programme for the Endorsement of Forest Certification (PEFC), 2002–2018.

CHAPTER 2 – GETTING TO KNOW STANDARD-SETTERS52
PROTERRA FOUNDATION
Founded in 2012, the ProTerra Foundation is a member-based, not-for-profit foundation operating in 39 countries (The ProTerra Foundation, 2018). The ProTerra standard is based on the Basel Criteria for Sustainable Soy Production but was designed to be applicable to all agricultural products (ProForest, 2004). Till now the ProTerra standard has been primarily applied to the sustainable production of soy and soy-derived consumer products but it is also being used in the sugarcane and tree nut sectors. All certified products arrive in the market as “Identity Preserved”, meaning there is full traceability and the raw material comes from certified farms.
The ProTerra Foundation standard version 3.0 was last revised in 2014. Its key components centre around the protection of high-conservation-value areas; good labour practices, such as worker health and safety and prevention of child labour; maintaining community rights; adopting good agricultural practices, such as sustaining soil fertility and water resources; lowering the use of fertilizers and pesticides; and rigorous non-genetically-modified-organism (GMO) requirements (ProTerra Foundation, 2018). The ProTerra standard will be revised in 2018 to version 4.0.
In 2016, 1.9 million hectares were ProTerra-certified, representing 0.04% of the global agricultural area and 1.6% of the global soybean area. There were almost 3.9 million metric tons of ProTerra-certified soybeans. Seven countries produced ProTerra-certified soy; the largest area was in Brazil, with some 1.8 million hectares, representing 93% of the global ProTerra Foundation area. Since 2008, the ProTerra-certified area has grown by 54%. Between 2015 and 2016, a growth of almost 6% was noted.
More information is available from www.proterrafoundation.org. For more information on ProTerra soybeans, see Chapter 3.
Table 11: ProTerra Foundation: Key indicators
ProTerra Foundation 2016
Area [hectares] 1,916,050
Share of ProTerra area of global agricultural land [%] 0.04
Share of ProTerra soybean area of global soybean area [%] 1.6
Soybeans: Production volume [metric tons] 3,873,000
Source: ProTerra Foundation, 2018.

CHAPTER 2 – GETTING TO KNOW STANDARD-SETTERS 53
Figure 57: ProTerra: Certified area, 2008–2016
1.24
1.92
0.0
0.5
1.0
1.5
2.0
2.5
2008 2009 2010 2011 2012 2013 2014 2015 2016
Mill
ion
of h
ecta
res
Source: ProTerra Foundation, 2018.
Figure 58: ProTerra Foundation: Production volume, 2013–2016
3.00
3.87
0.0
0.5
1.0
1.5
2.0
2.5
3.0
3.5
4.0
4.5
2013 2014 2015 2016
Mill
ion
of m
etric
tons
Source: ProTerra Foundation, 2018.Figure 59: ProTerra: 2016 close-up – Top countries by area

CHAPTER 2 – GETTING TO KNOW STANDARD-SETTERS54
Figure 59: ProTerra: 2016 close-up – Top countries by area
1,700
8,350
15,000
28,000
33,000
50,000
1,780,000
0 500,000 1,000,000 1,500,000 2,000,000
France
Canada
Argentina
Russian Federation
Germany
Italy
Brazil
Hectares
Source: ProTerra Foundation, 2018. The data from Germany include values from Austria, Czech Republic, Hungary, Serbia, Slovakia and Ukraine.
Figure 60: ProTerra: Top countries (percentage of total soybean area), 2018
0.08%
0.4%
1.2%
1.3%
5.4%
17.4%
0% 5% 10% 15% 20%
Argentina
Canada
France
Russian Federation
Brazil
Italy
Source: ProTerra Foundation, 2018.

CHAPTER 2 – GETTING TO KNOW STANDARD-SETTERS 55
RAINFOREST ALLIANCE
Founded in 1987, the Rainforest Alliance (RA) is a member-based initiative operating in the food and agriculture sector across 43 countries. RA and UTZ agreed to merge in 2017 to take advantage of their respective organizational strengths (Rainforest Alliance, 2017). Both VSS work in similar agricultural commodity sectors, which include primarily coffee, tea and cocoa. RA also certifies palm oil, cattle, bananas and cut flowers, while UTZ also certifies hazelnuts.
The Sustainable Assistance Network (SAN) was the sole standard-setting body for RA-certified agricultural products until November 2017 but has since moved on from this role. The Rainforest Alliance Sustainable Agriculture Standard has replaced the SAN standard, and authorized certification bodies will continue to audit participating farmers against the standard, which will be combined with the UTZ Codes into a new certification programme by 2019 (Rainforest Alliance, 2018).
The Rainforest Alliance continues to manage labelling and marketing support of RA-compliant products. It owns the trademark and manages the traceability, labelling and marketing of RA-certified products. Farms meeting the standard’s requirements can sell their products as RA-certified and use the RA trademarks. These functions will be maintained and will evolve as the Rainforest Alliance and UTZ merger advances over time. The UTZ and RA certification programmes will continue to operate in parallel until the publication of a new certification programme at the end of 2019 (with transition beginning in 2020).
In 2016, the Rainforest Alliance certified more than 3.1 million hectares of a wide variety of commodities, managed by almost 1.3 million producers. The product with the largest area was cocoa, with 692,000 hectares, followed by tea (almost 469,000 hectares) and coffee (over 387,000 hectares). Most of the RA-certified area was in Africa (52%), followed by Latin America (32%), Asia (15%) and Europe (1%). Côte d’Ivoire had the largest area (642,000 hectares), followed by Kenya (316,000 hectares) and Brazil (almost 301,000 hectares). Between 2010 and 2016, the RA-certified area increased fourfold.
More information is available at www.rainforest-alliance.org. For more information on Rainforest Alliance commodities, see Chapter 3.
Table 12: Rainforest Alliance: Key indicators
Rainforest Alliance 2016
Certified area [hectares] 3,105,608
Cultivated area [hectares] 1,933,235
Certificate holders [no.] 1,948
Producers [no.] 1,275,726
Note: The data presented in this table cover all RA commodities. “Certified area” refers to the entire farm, including infrastructure, set-aside, and any other non-crop-bearing land, while “Cultivated area” refers only to the land on which crops are grown. Source: Rainforest Alliance (RA), 2018.

CHAPTER 2 – GETTING TO KNOW STANDARD-SETTERS56
Figure 61: Rainforest Alliance: Certified area, 2008–2016
390
1,933
712
3,106
0
500
1,000
1,500
2,000
2,500
3,000
3,500
4,000
2010 2011 2012 2013 2014 2015 2016
Thou
sand
of h
ecta
res
Cultivated area Certified area
Note: “Certified area” refers to the entire farm, including infrastructure, set-aside, and any other non-crop-bearing land, while “Cultivated area” refers only to the land on which crops are grown.
Source: Rainforest Alliance, 2014, 2015, 2016, and 2018.
Figure 62: Rainforest Alliance: 2016 close-up – Top 10 countries by area
95,353
96,870
106,678
115,986
140,279
168,186
217,080
300,919
316,231
642,493
0 100,000 200,000 300,000 400,000 500,000 600,000 700,000
Tanzania
Ethiopia
Guatemala
Indonesia
Colombia
Ghana
India
Brazil
Kenya
Côte d'Ivoire
Hectares
Source: Rainforest Alliance, 2018.

CHAPTER 2 – GETTING TO KNOW STANDARD-SETTERS 57
Figure 63: Rainforest Alliance: Area by region, 2016
Africa52%
Latin America32%
Asia15%
Europe1%
Oceania0.2%
Source: Rainforest Alliance, 2018.
Figure 64: Rainforest Alliance: Top 10 countries by certified producers, 2016
18,272
29,179
29,320
30,550
47,548
50,478
58,948
77,105
97,529
726,275
0 100,000 200,000 300,000 400,000 500,000 600,000 700,000 800,000
Ethiopia
Uganda
Indonesia
Turkey
Ghana
Burundi
Rwanda
Tanzania
Côte d'Ivoire
Kenya
Producers
Source: Rainforest Alliance, 2018.
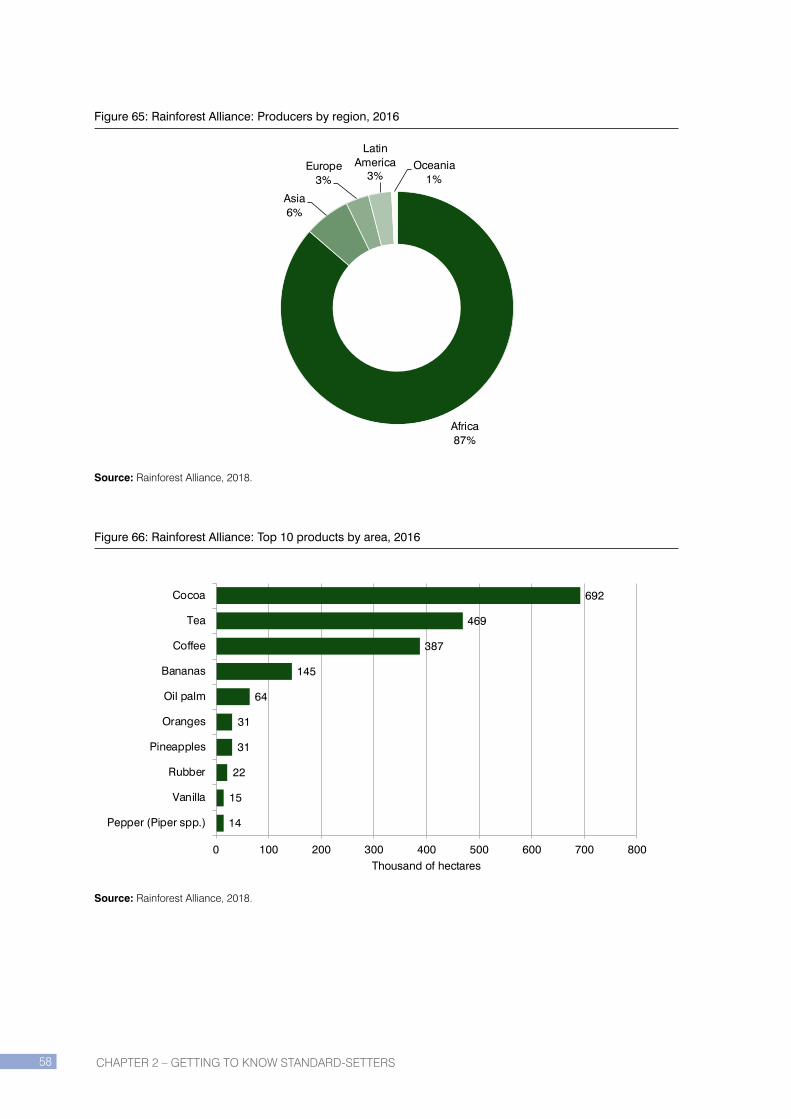
CHAPTER 2 – GETTING TO KNOW STANDARD-SETTERS58
Figure 65: Rainforest Alliance: Producers by region, 2016
Africa87%
Asia6%
Europe3%
Latin America
3%Oceania
1%
Source: Rainforest Alliance, 2018.
Figure 66: Rainforest Alliance: Top 10 products by area, 2016
14
15
22
31
31
64
145
387
469
692
0 100 200 300 400 500 600 700 800
Pepper (Piper spp.)
Vanilla
Rubber
Pineapples
Oranges
Oil palm
Bananas
Coffee
Tea
Cocoa
Thousand of hectares
Source: Rainforest Alliance, 2018.

CHAPTER 2 – GETTING TO KNOW STANDARD-SETTERS 59
ROUNDTABLE ON SUSTAINABLE PALM OIL
Founded in 2004, the Roundtable on Sustainable Palm Oil (RSPO) is a member-based initiative operating in the palm oil sector across 89 countries, with 16 countries producing RSPO-certified oil palm (RSPO, 2017a). The initiative aims to achieve mainstream market uptake of palm oil production and processing.
Palm oil producers are certified by accredited certifying bodies through verification of the production process in keeping with the RSPO principles and criteria. Certification can be withdrawn at any time in case of infringement of the rules and standards. Elements of the RSPO certification scheme include the standard itself, accreditation, and the process requirements. RSPO principles and criteria are developed and revised every five years (RSPO, 2016).
RSPO continues to expand and work towards capturing more market share. In December 2017, it announced the formation of the North American Sustainable Palm Oil Network, which aims to mainstream sustainable palm oil in North America (RSPO, 2017b). It is expanding steadily in South America and specifically in Colombia and Brazil. By establishing the RSPO smallholder task force and fund, it hopes to make its certification programme accessible to palm oil producers (Andrade, 2016; RSPO, 2018; Voora, 2014).
In 2016, more than 3.2 million hectares of oil palm were RSPO-certified (2.5 million cultivated), representing 0.07% of the global agricultural land and 15.3% of the global oil palm area. Almost 12 million metric tons of palm oil were produced under the RSPO standards. The largest areas were in Indonesia (over 1.7 million hectares), Malaysia (almost 942,000 hectares) and Papua New Guinea (nearly 124,500 hectares). Asia has 83% of the RSPO area, followed by Latin America (8.8%) and Oceania (6%). Between 2008 and 2016, the RSPO-certified area increased more than 35 times. Between 2015 and 2016, a drop of 6.6% was reported.
More information is available at www.rspo.org. For more information on RSPO oil palm, see Chapter 3.
Table 13: Roundtable on Sustainable Palm Oil: Key indicators
Roundtable on Sustainable Palm Oil (RSPO) 2016
Certified area [hectares] 3,236,429
Cultivated area [hectares] 2,451,573
Share of RSPO area of global agricultural land [%] 0.07
Share of RSPO oil palm area of global oil palm area [%] 15.3
Palm oil: Production volume [metric tons] 11,710,919
Palm kernel: Production volume [metric tons] 2,683,835
Certificate holders [no.] 2,387
Source: Roundtable on Sustainable Palm Oil (RSPO), 2018.

CHAPTER 2 – GETTING TO KNOW STANDARD-SETTERS60
Figure 67: Roundtable on Sustainable Palm Oil: Cultivated area, 2008–2016
0.1
2.5
0.0
0.5
1.0
1.5
2.0
2.5
3.0
2008 2009 2010 2011 2012 2013 2014 2015 2016
Mill
ion
of h
ecta
res
Source: Source: Roundtable on Sustainable Palm Oil (RSPO) 2014, 2015, 2016, and 2018.
Figure 68: Roundtable on Sustainable Palm Oil: Palm oil production volume, 2008–2016
0.6
11.7
0.0
2.0
4.0
6.0
8.0
10.0
12.0
14.0
2008 2009 2010 2011 2012 2013 2014 2015 2016
Mill
ion
of m
etric
tons
Source: Roundtable on Sustainable Palm Oil (RSPO) 2014, 2015, 2016, and 2018.

CHAPTER 2 – GETTING TO KNOW STANDARD-SETTERS 61
Figure 69: Roundtable on Sustainable Palm Oil: 2016 close-up – Top 10 countries by area
20,836
24,843
25,478
29,587
48,523
55,008
124,481
184,038
941,876
1,718,558
0 500,000 1,000,000 1,500,000 2,000,000
Honduras
Cambodia
Ghana
Guatemala
Costa Rica
Colombia
Brazil
Papua New Guinea
Malaysia
Indonesia
Hectares
Source: Roundtable on Sustainable Palm Oil (RSPO), 2018.
Figure 70: Roundtable on Sustainable Palm Oil: Top 10 countries (percentage of total oil palm area), 2016
13%
14%
15%
19%
32%
37%
60%
61%
80%
81%
0% 20% 40% 60% 80% 100%
Honduras
Indonesia
Malaysia
Guatemala
Brazil
Solomon Islands
Madagascar
Costa Rica
Cambodia
Papua New Guinea
Source: Roundtable on Sustainable Palm Oil (RSPO), 2018.
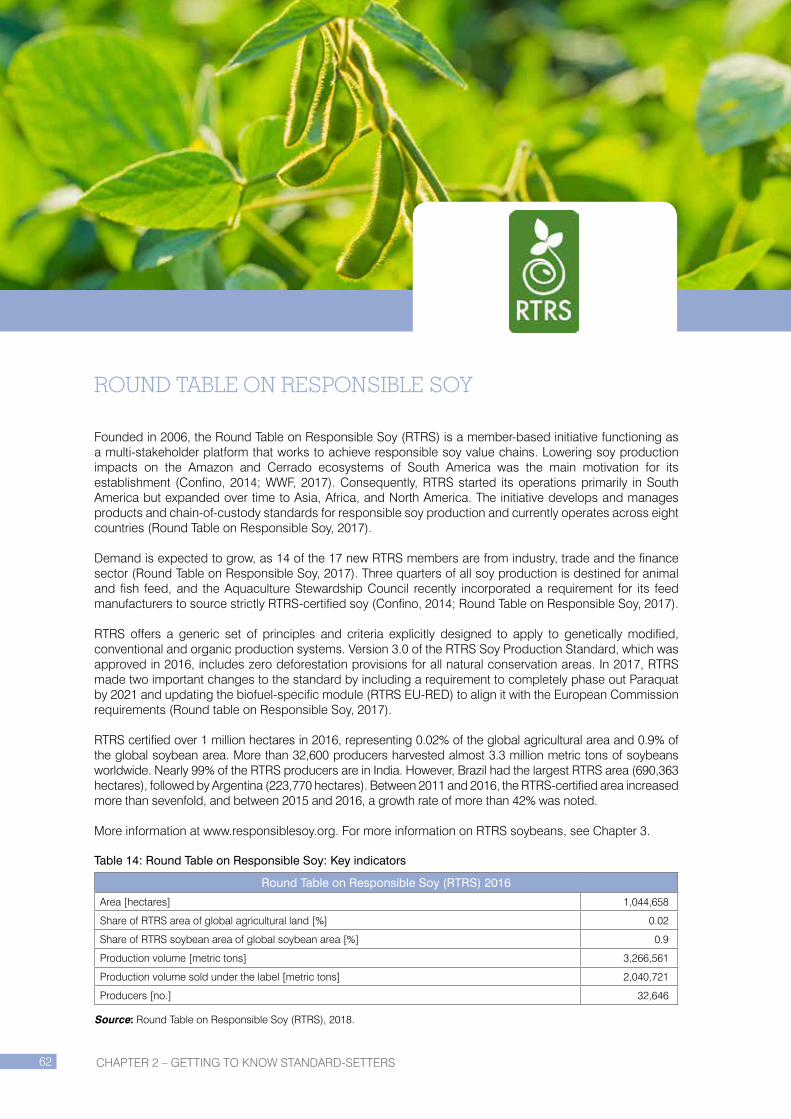
CHAPTER 2 – GETTING TO KNOW STANDARD-SETTERS62
ROUND TABLE ON RESPONSIBLE SOY
Founded in 2006, the Round Table on Responsible Soy (RTRS) is a member-based initiative functioning as a multi-stakeholder platform that works to achieve responsible soy value chains. Lowering soy production impacts on the Amazon and Cerrado ecosystems of South America was the main motivation for its establishment (Confino, 2014; WWF, 2017). Consequently, RTRS started its operations primarily in South America but expanded over time to Asia, Africa, and North America. The initiative develops and manages products and chain-of-custody standards for responsible soy production and currently operates across eight countries (Round Table on Responsible Soy, 2017).
Demand is expected to grow, as 14 of the 17 new RTRS members are from industry, trade and the finance sector (Round Table on Responsible Soy, 2017). Three quarters of all soy production is destined for animal and fish feed, and the Aquaculture Stewardship Council recently incorporated a requirement for its feed manufacturers to source strictly RTRS-certified soy (Confino, 2014; Round Table on Responsible Soy, 2017).
RTRS offers a generic set of principles and criteria explicitly designed to apply to genetically modified, conventional and organic production systems. Version 3.0 of the RTRS Soy Production Standard, which was approved in 2016, includes zero deforestation provisions for all natural conservation areas. In 2017, RTRS made two important changes to the standard by including a requirement to completely phase out Paraquat by 2021 and updating the biofuel-specific module (RTRS EU-RED) to align it with the European Commission requirements (Round table on Responsible Soy, 2017).
RTRS certified over 1 million hectares in 2016, representing 0.02% of the global agricultural area and 0.9% of the global soybean area. More than 32,600 producers harvested almost 3.3 million metric tons of soybeans worldwide. Nearly 99% of the RTRS producers are in India. However, Brazil had the largest RTRS area (690,363 hectares), followed by Argentina (223,770 hectares). Between 2011 and 2016, the RTRS-certified area increased more than sevenfold, and between 2015 and 2016, a growth rate of more than 42% was noted.
More information at www.responsiblesoy.org. For more information on RTRS soybeans, see Chapter 3.
Table 14: Round Table on Responsible Soy: Key indicators
Round Table on Responsible Soy (RTRS) 2016
Area [hectares] 1,044,658
Share of RTRS area of global agricultural land [%] 0.02
Share of RTRS soybean area of global soybean area [%] 0.9
Production volume [metric tons] 3,266,561
Production volume sold under the label [metric tons] 2,040,721
Producers [no.] 32,646
Source: Round Table on Responsible Soy (RTRS), 2018.
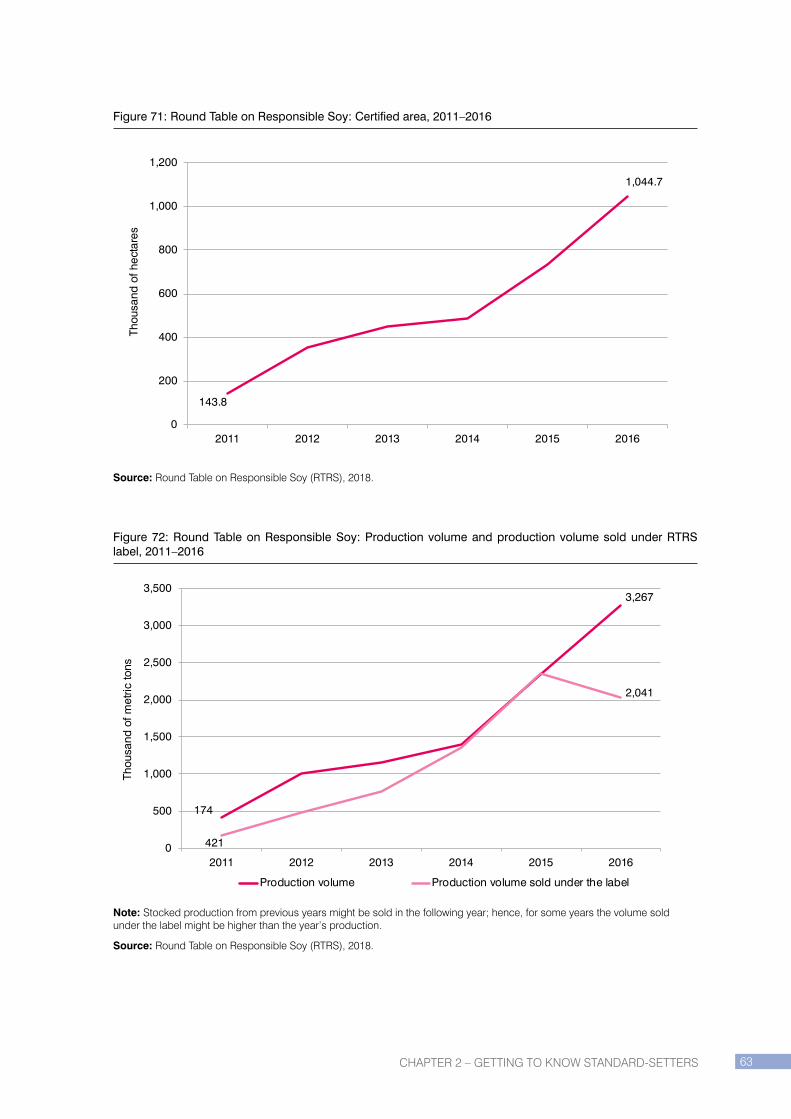
CHAPTER 2 – GETTING TO KNOW STANDARD-SETTERS 63
Figure 71: Round Table on Responsible Soy: Certified area, 2011–2016
143.8
1,044.7
0
200
400
600
800
1,000
1,200
2011 2012 2013 2014 2015 2016
Thou
sand
of h
ecta
res
Source: Round Table on Responsible Soy (RTRS), 2018.
Figure 72: Round Table on Responsible Soy: Production volume and production volume sold under RTRS label, 2011–2016
421
3,267
174
2,041
0
500
1,000
1,500
2,000
2,500
3,000
3,500
2011 2012 2013 2014 2015 2016
Thou
sand
of m
etric
tons
Production volume Production volume sold under the label
Note: Stocked production from previous years might be sold in the following year; hence, for some years the volume sold under the label might be higher than the year’s production.
Source: Round Table on Responsible Soy (RTRS), 2018.

CHAPTER 2 – GETTING TO KNOW STANDARD-SETTERS64
Figure 73: Round Table on Responsible Soy: 2016 close-up – Top countries by area
2,893
3,404
9,983
21,470
29,969
62,806
223,770
690,363
0 100,000 200,000 300,000 400,000 500,000 600,000 700,000 800,000
UnitedStates
Uruguay
Canada
Paraguay
China
India
Argentina
Brazil
Hectares
Source: Round Table on Responsible Soy (RTRS), 2018.
Figure 74: Round Table on Responsible Soy: Top countries (percentage of total soybean area), 2016
0.01%
0.3%
0.4%
0.4%
0.6%
0.6%
1.2%
2.3%
0.0% 0.5% 1.0% 1.5% 2.0% 2.5%
United States
Uruguay
China
Canada
India
Paraguay
Argentina
Brazil
Source: Round Table on Responsible Soy (RTRS), 2018.
CHAPTER 2 – GETTING TO KNOW STANDARD-SETTERS 65
UTZ
Founded in 2002, UTZ is a multi-stakeholder initiative operating in the food and agriculture sector across 41 producing countries. A product of the vision of a Guatemalan coffee grower and a Dutch coffee roaster, UTZ has grown into an independent, non-governmental, not-for-profit organization. It certifies cocoa, coffee, tea and hazelnut production in various parts of the world.
To become certified, all UTZ producers follow a code of conduct, which offers expert guidance on better farming methods, farm management and social issues, such as working conditions and care for nature. UTZ supports its farmers by providing training and working on several aspects of sustainability. For instance, in collaboration with the International Center for Tropical Agriculture (CIAT), it recently conducted a study on climate suitability scenarios for tea production in Malawi (CIAT & UTZ Certified, 2017). UTZ also invests in evaluating and measuring impact. It is one of the few VSS to track multiple certification, which is a major challenge to be overcome in VSS market performance reporting.
UTZ has developed rigorous measurement and traceability systems, which have been adopted by other standards. RSPO uses the e-trace system developed and managed by UTZ for enhanced traceability in its palm oil supply chains. The Sustainable Rice Platform benefited from UTZ’s guidance and expertise in the development of its standard.
UTZ has recently merged with the Rainforest Alliance, forming a new organization that carries forward the Rainforest Alliance name. The UTZ and RA certification programmes will continue to operate in parallel until the publication of a new certification programme at the end of 2019 (with transition beginning in 2020).
In 2016, cocoa, coffee and tea covered 2.7 million hectares worldwide, representing 0.06% of the global agricultural area. Cocoa was the largest UTZ-certified product, with almost 2.1 million hectares, representing almost 21% of the global cocoa area and nearly 77% of the total UTZ-certified area. UTZ coffee was grown on over 567,000 hectares, or 5.2% of the global coffee area (21% of UTZ’s certified area). UTZ tea was grown on almost 68,000 hectares, or 1.7% of the global tea area.
In 2016, there were over 853,000 producers operating under UTZ standards. Côte d’Ivoire has the largest UTZ area (1.1 million hectares), followed by Ghana (almost 401,500 hectares) and Brazil (over 145,700 hectares). Between 2011 and 2016, the UTZ-certified area more than trebled, and between 2015 and 2016, it registered a 28% growth.
More information is available at www.utzcertified.org. On UTZ commodities, see Chapter 3.

CHAPTER 2 – GETTING TO KNOW STANDARD-SETTERS66
Table 15: UTZ: Key indicators
UTZ (Cocoa, coffee and tea) 2016
Area [hectares] 2,731,954
Share of UTZ area of global agricultural land [%] 0.06
Share of UTZ cocoa, coffee, and tea area of total cocoa, coffee, and tea area [%] 10.8
Estimated production volume [metric tons]17 2,177,909
Production volume sold under the label [metric tons] 967,146
Certificate holders [no.] 1,286
Producers [no.] 853,232
Source: UTZ, 2018.
Figure 75: UTZ: Certified area, 2009–2016
0.2
2.7
0.0
0.5
1.0
1.5
2.0
2.5
3.0
2009 2010 2011 2012 2013 2014 2015 2016
Mill
ion
of h
ecta
res
Source: UTZ, 2014, 2015, 2016, and 2018. This graph refers to the cocoa, coffee and tea UTZ-certified area.
17. UTZ defines certified volume as the estimated production potential.

CHAPTER 2 – GETTING TO KNOW STANDARD-SETTERS 67
Figure 76: UTZ: Estimated production volume, 2009–2016
371
2,178
0
500
1,000
1,500
2,000
2,500
2009 2010 2011 2012 2013 2014 2015 2016
Thou
sand
of m
etric
tons
Source: UTZ, 2014, 2015, 2016, and 2018. This graph refers to the cocoa, coffee and tea UTZ-certified production volume.
Figure 77: UTZ: 2016 close-up – Top 10 countries by area
53,356
60,773
70,273
71,590
95,247
125,671
142,999
145,722
401,487
1,143,736
0 200,000 400,000 600,000 800,000 1,000,000 1,200,000 1,400,000
Ecuador
Sierra Leone
India
Cameroon
Indonesia
Peru
Nigeria
Brazil
Ghana
Côte d'Ivoire
Hectares
Source: UTZ, 2018. This graph refers to the cocoa, coffee and tea UTZ-certified area.

CHAPTER 2 – GETTING TO KNOW STANDARD-SETTERS68
Figure 78: UTZ: Top 10 countries (percentage of total cocoa, coffee, and tea area), 2016
15%
17%
20%
20%
21%
24%
24%
25%
27%
41%
0% 10% 20% 30% 40% 50%
Dominican Republic
Honduras
Zambia
Zimbabwe
Malawi
Ghana
Nicaragua
Burundi
Peru
Congo, D.R.
Source: UTZ, 2018.
Figure 79: UTZ: Area by region, 2016
Africa73%
Latin America19%
Asia8%
Source: UTZ, 2018. This graph refers to the cocoa, coffee and tea UTZ-certified area.


CHAPTER 3
FAST GROWTH IN AGRICULTURE AND FORESTRY
BANANAS ������������������������������������������������������������������������������������������������������������������������������������������������������������������ 72
COCOA ���������������������������������������������������������������������������������������������������������������������������������������������������������������������� 80
COFFEE ��������������������������������������������������������������������������������������������������������������������������������������������������������������������� 88
COTTON �������������������������������������������������������������������������������������������������������������������������������������������������������������������� 97
PALM OIL ����������������������������������������������������������������������������������������������������������������������������������������������������������������� 104
SOY �������������������������������������������������������������������������������������������������������������������������������������������������������������������������� 110
SUGARCANE ���������������������������������������������������������������������������������������������������������������������������������������������������������� 116
TEA ��������������������������������������������������������������������������������������������������������������������������������������������������������������������������� 122
FORESTRY ��������������������������������������������������������������������������������������������������������������������������������������������������������������� 130
This section presents the latest market and statistical data on the selected agricultural products by standard – bananas, cocoa, coffee, cotton, oil palm, soybeans, sugarcane and tea� The data cover the area, production volume, producers, and area and production volume shares of the overall total for each product�
The end of the section presents the latest data on FSC- and PEFC-certified forestry.
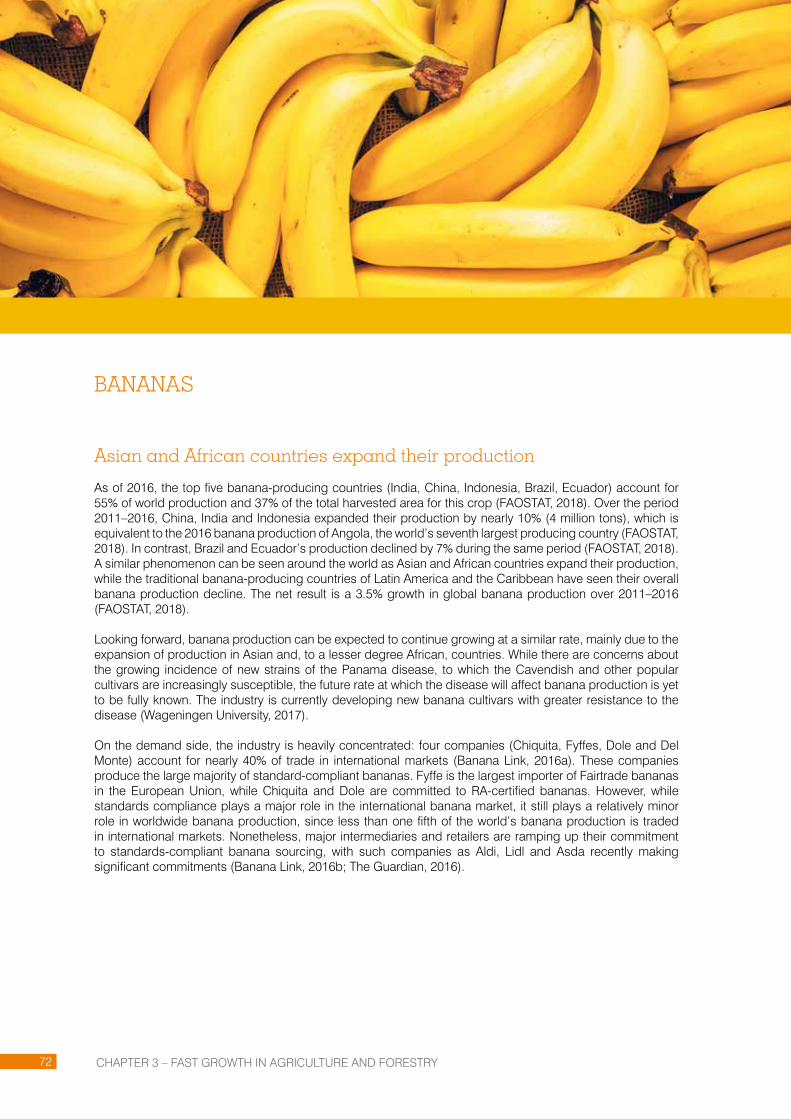
CHAPTER 3 – FAST GROWTH IN AGRICULTURE AND FORESTRy72
BANANAS
Asian and African countries expand their production
As of 2016, the top five banana-producing countries (India, China, Indonesia, Brazil, Ecuador) account for 55% of world production and 37% of the total harvested area for this crop (FAOSTAT, 2018). Over the period 2011–2016, China, India and Indonesia expanded their production by nearly 10% (4 million tons), which is equivalent to the 2016 banana production of Angola, the world’s seventh largest producing country (FAOSTAT, 2018). In contrast, Brazil and Ecuador’s production declined by 7% during the same period (FAOSTAT, 2018). A similar phenomenon can be seen around the world as Asian and African countries expand their production, while the traditional banana-producing countries of Latin America and the Caribbean have seen their overall banana production decline. The net result is a 3.5% growth in global banana production over 2011–2016 (FAOSTAT, 2018).
Looking forward, banana production can be expected to continue growing at a similar rate, mainly due to the expansion of production in Asian and, to a lesser degree African, countries. While there are concerns about the growing incidence of new strains of the Panama disease, to which the Cavendish and other popular cultivars are increasingly susceptible, the future rate at which the disease will affect banana production is yet to be fully known. The industry is currently developing new banana cultivars with greater resistance to the disease (Wageningen University, 2017).
On the demand side, the industry is heavily concentrated: four companies (Chiquita, Fyffes, Dole and Del Monte) account for nearly 40% of trade in international markets (Banana Link, 2016a). These companies produce the large majority of standard-compliant bananas. Fyffe is the largest importer of Fairtrade bananas in the European Union, while Chiquita and Dole are committed to RA-certified bananas. However, while standards compliance plays a major role in the international banana market, it still plays a relatively minor role in worldwide banana production, since less than one fifth of the world’s banana production is traded in international markets. Nonetheless, major intermediaries and retailers are ramping up their commitment to standards-compliant banana sourcing, with such companies as Aldi, Lidl and Asda recently making significant commitments (Banana Link, 2016b; The Guardian, 2016).

CHAPTER 3 – FAST GROWTH IN AGRICULTURE AND FORESTRy 73
GLOBALG.A.P. has the largest certified banana area
Four of the voluntary sustainability standards covered in this report – Fairtrade International, GLOBALG.A.P., organic and Rainforest Alliance – certified banana production in 2016. Combined, they certified a minimum of 289,000 hectares and a maximum of 488,000 hectares (average almost 389,000 hectares).18 In terms of the proportion of the VSS-certified area of the global banana area, the minimum represents 5.3%, the maximum, 8.9% and the average, 7.1% of the total banana area. Based on the minimum area, the certified banana area has remained stable since 2012. GLOBALG.A.P. had by far the largest VSS-certified banana area in 2016, with more than 252,000 hectares; the largest area growth (2012–2016) was noted for RA, 87%.19
Fairtrade International certified almost 36,500 hectares of bananas in 2016, constituting 0.7% of the global banana area. Almost 831,000 metric tons were produced, representing 0.7% of the global banana production volume. The countries with the largest areas were the Dominican Republic (almost 12,600 hectares), Peru (almost 6,800 hectares), Colombia (6,414 hectares) and Ecuador (5,210 hectares). Together, these five countries accounted for 82% of the total Fairtrade International banana area. Between 2012 and 2016, that area increased by almost 15%. However, between 2015 and 2016 a drop of 10% was reported.
More than 252,000 hectares of bananas were GLOBALG.A.P.-certified in 2016, equivalent to 4.6% of the global banana area. The largest areas were in Ecuador (over 69,000 hectares), Colombia (42,500 hectares), Costa Rica (26,200 hectares), Guatemala (almost 22,300 hectares) and the Dominican Republic (15,700 hectares), representing close to 42% of the total GLOBALG.A.P. banana area. Between 2015 and 2016 that area increased by 1.7%, after the drop reported in 2015. However, when compared with 2012, when data first became available, the GLOBALG.A.P. banana area declined by 5.7%.
Organic bananas represented almost 1% of the global banana area, or almost 51,500 hectares (estimated harvested area).20 An estimated 1.1 million metric tons were produced in 2016, 1% of the world’s banana production. The Dominican Republic (20,350 hectares), Ecuador (13,200 hectares), the Philippines (5,500 hectares), Peru (4,900 hectares) and Mexico (3,100 hectares) had the largest organic banana areas, together representing 91% of the total organic banana area. That area decreased by 2% compared with 2015; however, between 2012 and 2016, it increased by 9.4%.
Rainforest Alliance reported almost 145,000 hectares and almost 7.4 million metric tons of certified bananas in 2016, accounting for 6.5% of the global banana production volume. Five countries represented 85% of the total RA banana area: Colombia (over 38,000 hectares), Costa Rica (29,230 hectares), Guatemala (26,414 hectares), Ecuador (20,321 hectares) and Honduras (8,514 hectares). The RA banana area increased by 87% between 2012 and 2016 and by 32% between 2015 and 2016 alone.
For tables of VSS-compliant banana production, see the appendix with data tables by country.
18. Multiple certification: Many of the areas certified by VSS are multiple-certified. An average of the maximum and minimum areas provides an estimate of the possible VSS area for a given sector. The maximum would be the sum of the total area/production provided by the individual VSS in the country, and the minimum would be the area of the VSS with the largest area in the country.
19. 2012 is the year for which data on all the standards covered are available.
20. In total, almost 58,407 hectares of organic bananas were certified in 2016, including in-conversion areas and areas for bananas associated with other crops, and representing 0.6% of the global banana area (Willer/Lernoud, 2018).
BANANAS

CHAPTER 3 – FAST GROWTH IN AGRICULTURE AND FORESTRy74
Figure 80: Banana: Production area by standard, 2008–2016
40.9
70.4
43.4
96.3
40.0
36.7
28.3 43
.1 58.6
31.8
268.
0
47.1
77.2
38.2
223.
2
48.1
79.4
35.6
251.
6
52.2
90.3
40.6
248.
3
52.5
109.
7
36.5
252.
6
51.5
144.
7
0
50
100
150
200
250
300
Fairtrade GLOBALG.A.P. Organic Rainforest Alliance
Thou
sand
of h
ecta
res
2008 2009 2010 2011 2012 2013 2014 2015 2016
Note: The organic area is the area harvested as estimated by FiBL, assuming that 90% of the fully converted area is actually harvested. For the Rainforest Alliance, the area cultivated is shown.
Source: Fairtrade International, 2018; GLOBALG.A.P., 2018; FiBL, 2018; Rainforest Alliance, 2018.
Figure 81: Banana: Average production area, 2008–2016
0
100,000
200,000
300,000
400,000
500,000
600,000
2008 2009 2010 2011 2012 2013 2014 2015 2016
Hec
tare
s
Max Min Average
Note: Data from GLOBALG.A.P have been available since 2012.
Source: FiBL-IISD-ITC survey, 2018. VSS: Fairtrade International, GLOBALG.A.P., organic, and Rainforest Alliance.

CHAPTER 3 – FAST GROWTH IN AGRICULTURE AND FORESTRy 75
BANANAS
Figure 82: Banana: Production volume by standard, 2008–2016
464
574
603
1,24
3
493
618
2,09
8
672
745
3,64
8
793
856
3,74
5
803 1,03
2
5,92
3
808 1,08
2
5,65
8
831 1,09
0
7,35
4
0
1,000
2,000
3,000
4,000
5,000
6,000
7,000
8,000
Fairtrade Organic Rainforest Alliance
Thou
sand
of m
etric
tons
2008 2009 2010 2011 2012 2013 2014 2015 2016
Note: The organic production volume was estimated by FiBL based on estimated yields as data are not available for most of the countries. Production volume data from GLOBALG.A.P. are not available.
Source: Fairtrade International, 2018; FiBL, 2018; Rainforest Alliance, 2018.
Figure 83: Banana: Average production volume, 2008–2016
0
1,000,000
2,000,000
3,000,000
4,000,000
5,000,000
6,000,000
7,000,000
8,000,000
9,000,000
10,000,000
2008 2009 2010 2011 2012 2013 2014 2015 2016
Met
ric to
ns
Max Min Average
Note: Production volume data from GLOBALG.A.P. are not available.
Source: FiBL-IISD-ITC survey, 2018. VSS: Fairtrade International, organic, and Rainforest Alliance.Figure 76: UTZ: Estimated production volume, 2009–2016

CHAPTER 3 – FAST GROWTH IN AGRICULTURE AND FORESTRy76
Figure 84: Banana: Fairtrade International – Top countries by area, 2016
5,210
5,414
6,797
12,588
0 2,000 4,000 6,000 8,000 10,000 12,000 14,000
Ecuador
Colombia
Peru
Dominican Republic
Hectares
Source: Fairtrade International, 2018.
Figure 85: Banana: GLOBALG.A.P. – Top 10 countries or territories by area, 2016
3,327
4,404
6,111
6,216
10,483
15,668
22,260
26,240
42,548
69,145
0 10,000 20,000 30,000 40,000 50,000 60,000 70,000 80,000
Martinique (France)
Mexico
South Africa
Peru
Honduras
Dominican Republic
Guatemala
Costa Rica
Colombia
Ecuador
Hectares
Source: GLOBALG.A.P., 2018.
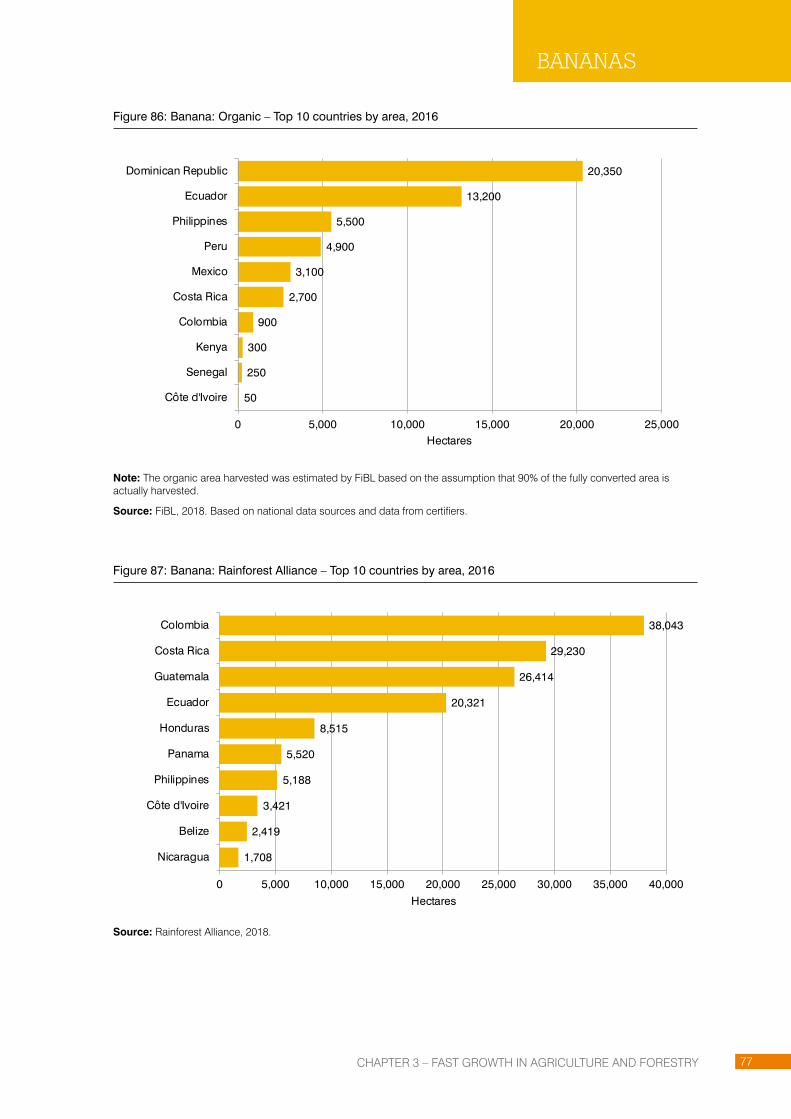
CHAPTER 3 – FAST GROWTH IN AGRICULTURE AND FORESTRy 77
BANANAS
Figure 86: Banana: Organic – Top 10 countries by area, 2016
50
250
300
900
2,700
3,100
4,900
5,500
13,200
20,350
0 5,000 10,000 15,000 20,000 25,000
Côte d'Ivoire
Senegal
Kenya
Colombia
Costa Rica
Mexico
Peru
Philippines
Ecuador
Dominican Republic
Hectares
Note: The organic area harvested was estimated by FiBL based on the assumption that 90% of the fully converted area is actually harvested.
Source: FiBL, 2018. Based on national data sources and data from certifiers.
Figure 87: Banana: Rainforest Alliance – Top 10 countries by area, 2016
1,708
2,419
3,421
5,188
5,520
8,515
20,321
26,414
29,230
38,043
0 5,000 10,000 15,000 20,000 25,000 30,000 35,000 40,000
Nicaragua
Belize
Côte d'Ivoire
Philippines
Panama
Honduras
Ecuador
Guatemala
Costa Rica
Colombia
Hectares
Source: Rainforest Alliance, 2018.

CHAPTER 3 – FAST GROWTH IN AGRICULTURE AND FORESTRy78
Figure 88: Banana: Fairtrade-certified area by region, 2016
Source: Fairtrade International, 2018.
Figure 89: Banana: GLOBALG.A.P.-certified area by region, 2016
Source: GLOBALG.A.P, 2018.
Figure 90: Banana: Organic-certified area by region, 2016
Note: The organic area harvested was estimated by FiBL based on the assumption that 90% of the fully converted area is actually harvested
Source: FiBL, 2018.
Figure 91: Banana: Rainforest Alliance-certified area by region, 2016
Source: Rainforest Alliance, 2018.
Latin America79%
Africa2%
Other19%
Latin America82%
Other18%
Latin America88%
Asia11%
Africa1%
ORGANIC
Latin America93%
Africa4%
Asia3.6%

CHAPTER 3 – FAST GROWTH IN AGRICULTURE AND FORESTRy 79
BANANAS
Figure 92: Banana: Share of Fairtrade area, 2015
Source: Fairtrade International, 2017.
Figure 93: Banana: Share of GLOBALG.A.P. area, 2016
Source: GLOBALG.A.P, 2018.
Figure 94: Banana: Share of organic area, 2016
Source: FiBL, 2018..
Figure 95: Banana: Share of Rainforest Alliance area, 2016
Source: Rainforest Alliance, 2018.
Bananas1%
Other99%
Bananas6%
Other94%
Bananas0.1%
Other99.9%
ORGANIC
Bananas5%
Other95%

CHAPTER 3 – FAST GROWTH IN AGRICULTURE AND FORESTRy80
COCOA
The Netherlands commits to 100% sustainable cocoa by 2025
The top five cocoa-producing countries (Côte d’Ivoire, Ghana, Indonesia, Cameroon, Nigeria) account for 79% of global production and 76% of the total harvested area for this crop (FAOSTAT, 2018). Between 2011 and 2016 Côte d’Ivoire, Indonesia and Nigeria decreased their production, while Ghana and Cameroon increased theirs, resulting in an aggregate decrease of 1% in the total production and harvested area of these five countries. Globally, a 3% decrease in yield was observed during the same period.
Conditions of oversupply in the cocoa market are expected for 2017/2018, with farmers likely to continue their slow shift to other crops (World Bank, 2017). Cocoa farmers number approximately 5 to 6 million globally, and the cocoa industry contributes to the livelihoods of 40 to 50 million people (WCF, 2012).
On the demand side, the industry is heavily concentrated, with eight traders and grinders controlling about three quarters of the global trade in cocoa and the six biggest chocolate-manufacturing companies accounting for 40% of global sales in chocolate products (Fountain & Hütz-Adams, 2015). Several companies, including Hershey’s, Mars and Ferrero, have committed to 100% standards-compliant sourcing of cocoa by 2020. Other multinationals, such as Mendelez and Nestlé, have also made significant commitments.
At the national level, some European countries have adopted sustainable cocoa sourcing commitments: the Netherlands, for example, has pledged to achieve 100% sustainable cocoa consumption by 2025, and Germany is committed to sourcing at least 50% of its cocoa from standards-compliant producers by 2020 (Fountain & Hütz-Adams, 2015).
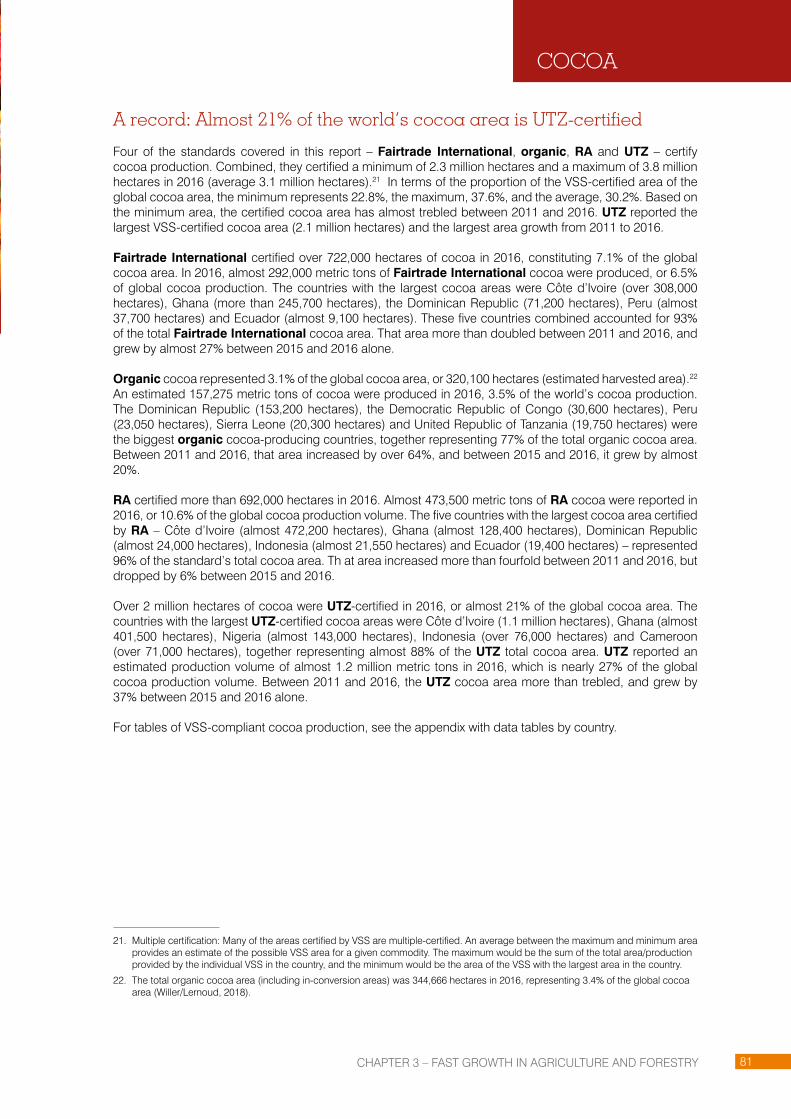
CHAPTER 3 – FAST GROWTH IN AGRICULTURE AND FORESTRy 81
COCOA
A record: Almost 21% of the world’s cocoa area is UTZ-certified
Four of the standards covered in this report – Fairtrade International, organic, RA and UTZ – certify cocoa production. Combined, they certified a minimum of 2.3 million hectares and a maximum of 3.8 million hectares in 2016 (average 3.1 million hectares).21 In terms of the proportion of the VSS-certified area of the global cocoa area, the minimum represents 22.8%, the maximum, 37.6%, and the average, 30.2%. Based on the minimum area, the certified cocoa area has almost trebled between 2011 and 2016. UTZ reported the largest VSS-certified cocoa area (2.1 million hectares) and the largest area growth from 2011 to 2016.
Fairtrade International certified over 722,000 hectares of cocoa in 2016, constituting 7.1% of the global cocoa area. In 2016, almost 292,000 metric tons of Fairtrade International cocoa were produced, or 6.5% of global cocoa production. The countries with the largest cocoa areas were Côte d’Ivoire (over 308,000 hectares), Ghana (more than 245,700 hectares), the Dominican Republic (71,200 hectares), Peru (almost 37,700 hectares) and Ecuador (almost 9,100 hectares). These five countries combined accounted for 93% of the total Fairtrade International cocoa area. That area more than doubled between 2011 and 2016, and grew by almost 27% between 2015 and 2016 alone.
Organic cocoa represented 3.1% of the global cocoa area, or 320,100 hectares (estimated harvested area).22 An estimated 157,275 metric tons of cocoa were produced in 2016, 3.5% of the world’s cocoa production. The Dominican Republic (153,200 hectares), the Democratic Republic of Congo (30,600 hectares), Peru (23,050 hectares), Sierra Leone (20,300 hectares) and United Republic of Tanzania (19,750 hectares) were the biggest organic cocoa-producing countries, together representing 77% of the total organic cocoa area. Between 2011 and 2016, that area increased by over 64%, and between 2015 and 2016, it grew by almost 20%.
RA certified more than 692,000 hectares in 2016. Almost 473,500 metric tons of RA cocoa were reported in 2016, or 10.6% of the global cocoa production volume. The five countries with the largest cocoa area certified by RA – Côte d’Ivoire (almost 472,200 hectares), Ghana (almost 128,400 hectares), Dominican Republic (almost 24,000 hectares), Indonesia (almost 21,550 hectares) and Ecuador (19,400 hectares) – represented 96% of the standard’s total cocoa area. Th at area increased more than fourfold between 2011 and 2016, but dropped by 6% between 2015 and 2016.
Over 2 million hectares of cocoa were UTZ-certified in 2016, or almost 21% of the global cocoa area. The countries with the largest UTZ-certified cocoa areas were Côte d’Ivoire (1.1 million hectares), Ghana (almost 401,500 hectares), Nigeria (almost 143,000 hectares), Indonesia (over 76,000 hectares) and Cameroon (over 71,000 hectares), together representing almost 88% of the UTZ total cocoa area. UTZ reported an estimated production volume of almost 1.2 million metric tons in 2016, which is nearly 27% of the global cocoa production volume. Between 2011 and 2016, the UTZ cocoa area more than trebled, and grew by 37% between 2015 and 2016 alone.
For tables of VSS-compliant cocoa production, see the appendix with data tables by country.
21. Multiple certification: Many of the areas certified by VSS are multiple-certified. An average between the maximum and minimum area provides an estimate of the possible VSS area for a given commodity. The maximum would be the sum of the total area/production provided by the individual VSS in the country, and the minimum would be the area of the VSS with the largest area in the country.
22. The total organic cocoa area (including in-conversion areas) was 344,666 hectares in 2016, representing 3.4% of the global cocoa area (Willer/Lernoud, 2018).
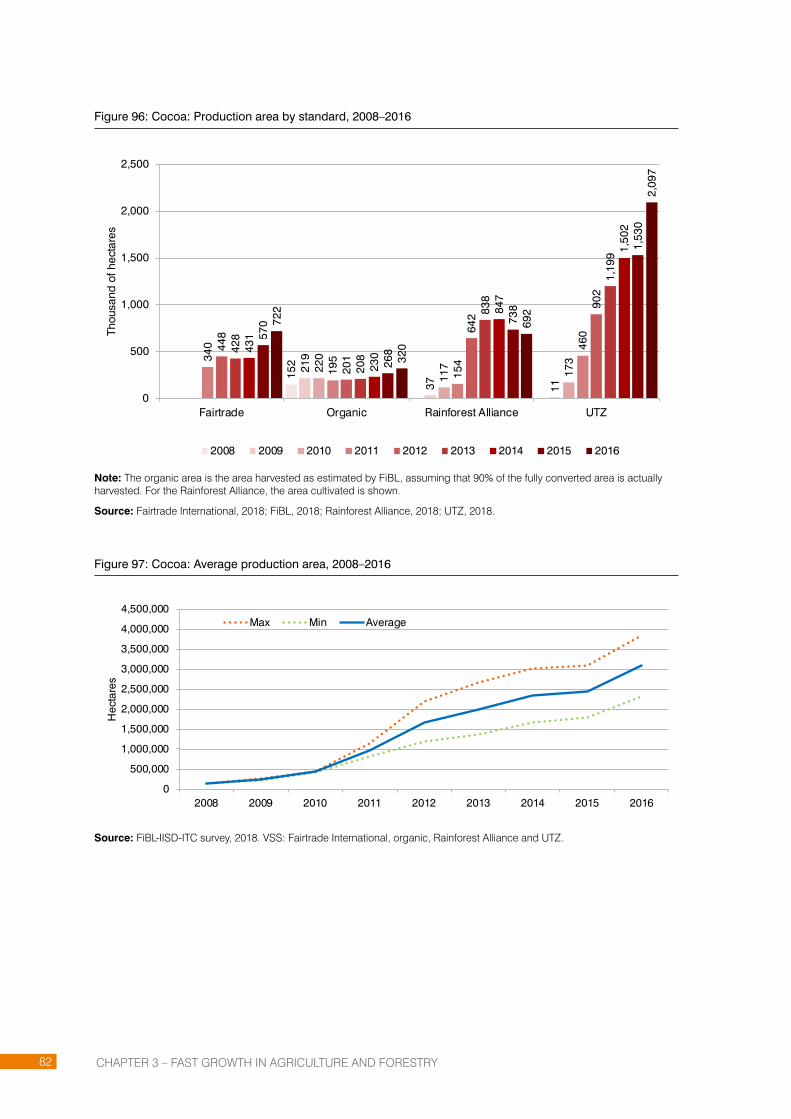
CHAPTER 3 – FAST GROWTH IN AGRICULTURE AND FORESTRy82
Figure 96: Cocoa: Production area by standard, 2008–2016
152 21
9
37 11
220
117
17334
0
195
154
460
448
201
642
902
428
208
838
1,19
9
431
230
847
1,50
2
570
268
738
1,53
0
722
320
692
2,09
7
0
500
1,000
1,500
2,000
2,500
Fairtrade Organic Rainforest Alliance UTZ
Thou
sand
of h
ecta
res
2008 2009 2010 2011 2012 2013 2014 2015 2016
Note: The organic area is the area harvested as estimated by FiBL, assuming that 90% of the fully converted area is actually harvested. For the Rainforest Alliance, the area cultivated is shown.
Source: Fairtrade International, 2018; FiBL, 2018; Rainforest Alliance, 2018; UTZ, 2018.
Figure 97: Cocoa: Average production area, 2008–2016
0
500,000
1,000,000
1,500,000
2,000,000
2,500,000
3,000,000
3,500,000
4,000,000
4,500,000
2008 2009 2010 2011 2012 2013 2014 2015 2016
Hec
tare
s
Max Min Average
Source: FiBL-IISD-ITC survey, 2018. VSS: Fairtrade International, organic, Rainforest Alliance and UTZ.

CHAPTER 3 – FAST GROWTH IN AGRICULTURE AND FORESTRy 83
COCOA
Figure 98: Cocoa: Production volume by standard, 2008–2016
62 101
12 6
106
56 70
122
108
98
213
176
109
406
535
183
114
572
691
218
117
575
880
252
156
523
918
292
157
473
1,18
8
0
200
400
600
800
1,000
1,200
1,400
Fairtrade Organic Rainforest Alliance UTZ
Thou
sand
of m
etric
tons
2008 2009 2010 2011 2012 2013 2014 2015 2016
Note: The organic production volume was estimated by FiBL based on estimated yields, as data is not available for most of the countries. UTZ defines certified volume as the estimated production potential.
Source: Fairtrade International, 2018; FiBL, 2018; Rainforest Alliance, 2018; UTZ, 2018.
Figure 99: Cocoa: Average production volume, 2008–2016
0
500,000
1,000,000
1,500,000
2,000,000
2,500,000
2008 2009 2010 2011 2012 2013 2014 2015 2016
Met
ric to
ns
Max Min Average
Source: FiBL-IISD-ITC survey, 2018. VSS: Fairtrade International, organic, Rainforest Alliance and UTZ.

CHAPTER 3 – FAST GROWTH IN AGRICULTURE AND FORESTRy84
Figure 100: Cocoa: Fairtrade International – Top countries by area, 2016
9,087
37,670
71,183
245,746
308,112
0 50,000 100,000 150,000 200,000 250,000 300,000 350,000
Ecuador
Peru
Dominican Republic
Ghana
Côte d'Ivoire
Hectares
Source: Fairtrade International, 2018.
Figure 101: Cocoa: Organic – Top 10 countries by area, 2016
6,400
7,100
7,100
12,600
12,650
19,750
20,300
23,050
30,600
153,200
0 50,000 100,000 150,000 200,000
Sao Tome and Principe
Brazil
Uganda
Panama
Ecuador
Tanzania
Sierra Leone
Peru
Congo, D.R.
Dominican Republic
Hectares
Note: The organic area harvested was estimated by FiBL based on the assumption that 90% of the fully converted area is actually harvested.
Source: FiBL, 2018. Based on national data sources and data from certifiers.
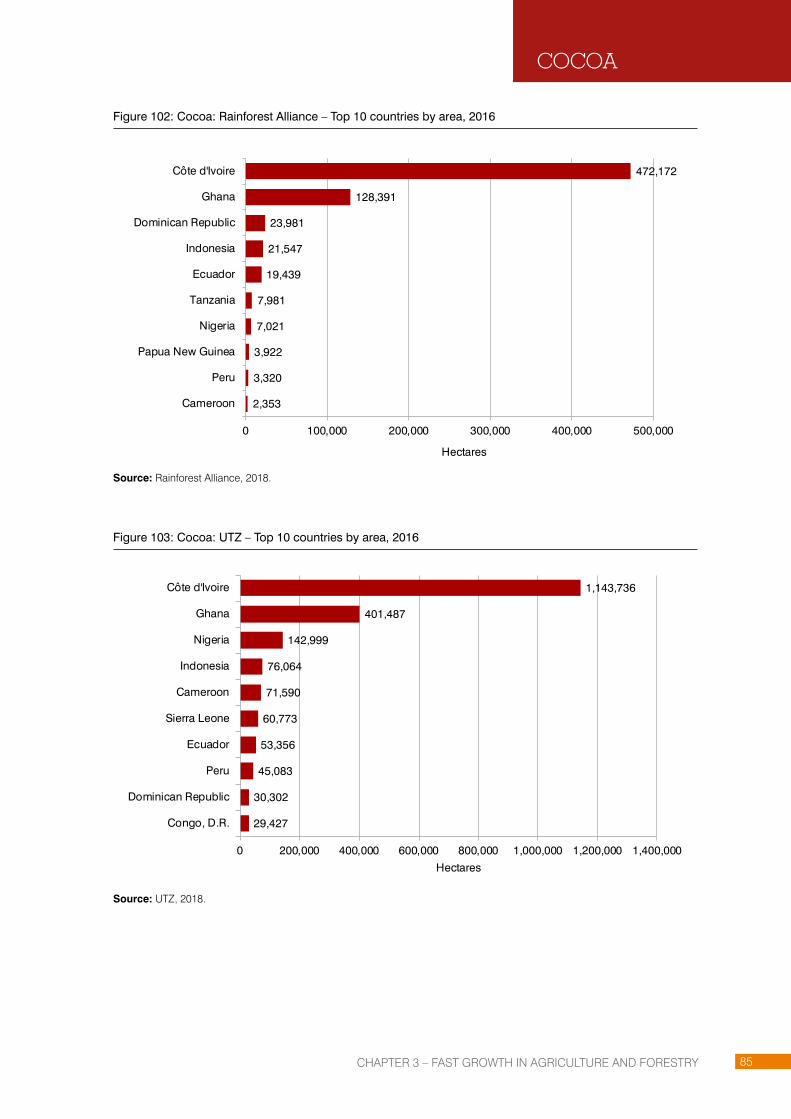
CHAPTER 3 – FAST GROWTH IN AGRICULTURE AND FORESTRy 85
COCOA
Figure 102: Cocoa: Rainforest Alliance – Top 10 countries by area, 2016
2,353
3,320
3,922
7,021
7,981
19,439
21,547
23,981
128,391
472,172
0 100,000 200,000 300,000 400,000 500,000
Cameroon
Peru
Papua New Guinea
Nigeria
Tanzania
Ecuador
Indonesia
Dominican Republic
Ghana
Côte d'Ivoire
Hectares
Source: Rainforest Alliance, 2018.
Figure 103: Cocoa: UTZ – Top 10 countries by area, 2016
29,427
30,302
45,083
53,356
60,773
71,590
76,064
142,999
401,487
1,143,736
0 200,000 400,000 600,000 800,000 1,000,000 1,200,000 1,400,000
Congo, D.R.
Dominican Republic
Peru
Ecuador
Sierra Leone
Cameroon
Indonesia
Nigeria
Ghana
Côte d'Ivoire
Hectares
Source: UTZ, 2018.

CHAPTER 3 – FAST GROWTH IN AGRICULTURE AND FORESTRy86
Africa77%
Latin America16%
Other7%
Latin America70%
Africa29%
Asia1%
ORGANIC
Africa89%
Latin America7%
Asia3%
Oceania1%
Africa89%
Latin America7%
Asia4%
Figure 104: Cocoa: Fairtrade-certified area by region, 2016
Source: Fairtrade International, 2018.
Figure 105: Cocoa: Organic-certified area by region, 2016
Note: The organic area harvested was estimated by FiBL based on the assumption that 90% of the fully converted area is actually harvested.
Figure 106: Cocoa: Rainforest Alliance-certified area by region, 2016
Source: Rainforest Alliance, 2018.
Figure 107: Cocoa: UTZ-certified area by region, 2016
Source: UTZ, 2018.

CHAPTER 3 – FAST GROWTH IN AGRICULTURE AND FORESTRy 87
Figure 108: Cocoa: Share of Fairtrade area, 2015
Source: Fairtrade International, 2017.
Figure 109: Cocoa: Share of Organic area, 2016
Source: FiBL, 2018.
Figure 110: Cocoa: Share of Rainforest Alliance area, 2016
Source: Rainforest Alliance, 2018.
Figure 111: Cocoa: Share of UTZ area, 2016
Source: UTZ, 2018.
COCOA
Cocoa23%
Other77%
Cocoa0.6%
Other99.4%
ORGANIC
Cocoa22%
Other78%
Cocoa77%
Other23%

CHAPTER 3 – FAST GROWTH IN AGRICULTURE AND FORESTRy88
COFFEE
Climate change threatens coffee production
The top five coffee-producing countries (Brazil, Viet Nam, Colombia, Indonesia, and Ethiopia) account for 69% of global production and 49% of the total harvested area for this crop (FAOSTAT, 2018). However, the top two countries, Brazil and Viet Nam, together produce half of the world’s coffee (FAOSTAT, 2018). Over the past five years (2011–2016), these five countries have increased their production by 16%, although their harvested area has risen by only 3%, indicating an increase in yields (FAOSTAT, 2018). During the same time period, in Brazil the coffee area decreased, while production increased by over 0.3 million tons (FAOSTAT, 2018). In the past few years, coffee production has struggled to keep up with strong and growing demand for coffee; Robusta coffee beans experienced several consecutive years of supply shortage owing to adverse weather conditions in the major producing countries.
Climate change adaptation in the coffee sector has become an ever-greater concern. The two most common varieties of coffee, Arabica and Robusta, require sufficient amounts of rainfall (1500–3000 mm annually) and a pattern of alternating rainy and dry periods to ensure adequate plant growth, budding and flowering (Panhuysen and Pierrot, 2014). The incidence of climate extremes, such as abnormally high temperatures, dry spells and excess rain, in the coffee-growing regions has reduced the productivity of the crop and stimulated outbreaks of such diseases as the roya fungus and coffee rust (ICO, 2013).
While VSS once accounted for a niche segment of the market, they have since grown to become a precompetitive tool for ensuring transparency and progress in improving supply chains across the mainstream coffee market. Of all the sectors covered in this report, coffee continues to be the one with the highest rate of VSS compliance. Important commitments by multinationals include Nestlé’s plan to source 90,000 tons of RA-compliant coffee by 2020 and Keurig Green Mountain’s plan for 100% standards-compliant sourcing according to various standards, including Fair Trade and RA, by 2020 (Keurig Green Mountain, 2016). Many companies, including Starbucks, Tchibo and Mondelez, have developed their own sustainability certification or verification scheme.

CHAPTER 3 – FAST GROWTH IN AGRICULTURE AND FORESTRy 89
COFFEE
At least a quarter of the world’s coffee is currently certified
Five of the voluntary sustainability standards covered in this report – 4C, Fairtrade International, organic, RA and UTZ – certify coffee production. Combined, they certified a minimum of 2.8 million hectares and a maximum of almost 5 million hectares in 2016 (average 3.9 million hectares).23 In terms of the proportion of the VSS-certified area of the global coffee area, the minimum represents 25.8%, the maximum, 45.3% and the average, 35.5%. Based on the minimum area, the certified coffee area increased by almost 80% between 2011 and 2016. With over 1.8 million hectares, 4C continues to have the largest VSS-certified (licensed) coffee area, and it registered the largest area growth: its certified area trebled between 2011 and 2016. As the 2016 data for Fairtrade International were not available at the time of publication, the latest available figures, covering 2015, were used instead.
Over 1.8 million hectares of coffee worldwide were 4C-certified in 2016, accounting for 16.6% of the global coffee area. Almost 2.8 million metric tons of 4C coffee were reported. 4C is present in some of the most important coffee-producing countries. In 2016, its largest coffee areas were in Brazil (almost 0.7 million hectares), Colombia (over 0.3 million hectares), Viet Nam (almost 170,000 hectares), Indonesia (73,400 hectares) and Peru (66,750 hectares). These five countries represented almost 71% of the standard’s total. Between 2011 and 2016, the 4C coffee area trebled. Between 2015 and 2016 alone, it grew by almost 17%.
Fairtrade International certified almost 1.3 million hectares of coffee in 2015, or nearly 12.4% of the global coffee area. Close to 560,000 metric tons were produced. The largest Fairtrade International coffee areas were in Colombia (213,000 hectares), Ethiopia (almost 208,000 hectares), United Republic of Tanzania (167,000 hectares), Peru (almost 160,000 hectares) and Mexico (almost 118,000 hectares). Together, these five countries represented 67% of the standard’s total coffee area. Between 2011 and 2015, that area increased by 61%; and between 2014 and 2015 alone by almost 17%.
For organic, the estimated harvested area represented 8% of the global coffee area,24 almost 882,000 hectares. FiBL estimates that more than 447,000 metric tons were produced in 2016. The countries with the largest organic coffee areas were Mexico (231,000 hectares), Ethiopia (almost 160,000 hectares), Peru (99,050 hectares), Indonesia (81,750 hectares) and United Republic of Tanzania (79,250 hectares), which together represented 73% of the total organic coffee area. That area increased by 60.5% between 2011 and 2016, and between 2015 and 2016, by nearly 10.5%.
RA certified more than 387,000 hectares of coffee worldwide. Over 500,000 metric tons of RA coffee were reported in 2016, 5.5% of the global coffee production volume. The five largest RA coffee areas represented almost 56% of the total RA coffee area: Brazil (over 76,300 hectares), Ethiopia (40,900 hectares), Colombia (almost 39,600 hectares), Peru (almost 35,150 hectares), and United Republic of Tanzania (almost 24,000 hectares). Between 2011 and 2016, the RA coffee area doubled, but between 2015 and 2016 it dropped by 4%.
More than 567,000 hectares of coffee were UTZ-certified in 2016, which is 5.2% of the global coffee area. UTZ estimated a production volume of over 870,000 metric tons of coffee in 2016, or 9.4% of global coffee production. Brazil has the largest UTZ coffee area, with almost 135,000 hectares, followed by Peru (almost 80,600 hectares), Honduras (50,800 hectares), Viet Nam (almost 50,600 hectares), Colombia (44,600 hectares) and India (37,200 hectares). These six countries together accounted for almost 70% of the total UTZ coffee area. Between 2011 and 2016, that area grew by almost 63%, and by over 3% between 2015 and 2016.
For tables of VSS-compliant coffee production, see the appendix with data tables by country.
23. Multiple certification: Many of the areas certified by VSS are multiple-certified. An average between the maximum and minimum area provides an estimate of the possible VSS area for a given commodity. The maximum would be the sum of the total area/production provided by the individual VSS in the country, and the minimum would be the area of the VSS with the largest area in the country.
24. In total, 933,950 hectares of organic coffee were certified in 2016 (including in-conversion areas), representing 8.5% of the global coffee area (Willer/Lernoud, 2018).

CHAPTER 3 – FAST GROWTH IN AGRICULTURE AND FORESTRy90
Figure 112: Coffee: Production area by standard, 2008–2016
0.21
0.43
0.10
0.38 0.
48
0.12
0.26
0.44 0.
52
0.17
0.32
0.57
0.80
0.55
0.19
0.35
1.03
0.87
0.62
0.32
0.51
1.46
1.01
0.64
0.43 0.47
1.66
1.11
0.62
0.36 0.
48
1.59
1.30
0.80
0.41
0.55
1.83
0.88
0.39
0.57
0.0
0.2
0.4
0.6
0.8
1.0
1.2
1.4
1.6
1.8
2.0
4C Fairtrade Organic Rainforest Alliance UTZ
Mill
ion
of h
ecta
res
2008 2009 2010 2011 2012 2013 2014 2015 2016
Note: The organic area is the area harvested as estimated by FiBL, assuming that 90% of the fully converted area is actually harvested. For the Rainforest Alliance, the area cultivated is shown. As the 2016 data for Fairtrade International were not available at the time of publication, the latest available figures, covering 2015, were used instead.
Source: Coffee Assurance Services, 2016; Fairtrade International, 2017; FiBL, 2018; Rainforest Alliance, 2018; UTZ, 2018.
Figure 113: Coffee: Average production area, 2008–2016
0
1,000,000
2,000,000
3,000,000
4,000,000
5,000,000
6,000,000
2008 2009 2010 2011 2012 2013 2014 2015 2016
Hec
tare
s
Max Min Average
Note: For Fairtrade International the 2016 data were not available. For purposes of comparison, the 2015 data were used instead.
Source: FiBL-IISD-ITC survey, 2018. VSS: Coffee Assurance Services, Fairtrade International, organic, Rainforest Alliance and UTZ.
CHAPTER 3 – FAST GROWTH IN AGRICULTURE AND FORESTRy 91
Figure 114: Coffee: Production volume by standard, 2008–2016
367
196
124
607
208
168 36
6646
236
219 39
4
906
386
254
261 47
7
1,78
2
402
255 37
8
716
2,36
0
489
265 45
5 727
2,87
2
549
264 45
7 730
2,62
9
561
342 52
2
821
2,76
4
447
509
870
0
500
1,000
1,500
2,000
2,500
3,000
3,500
4C Fairtrade Organic Rainforest Alliance UTZ
Thou
sand
of m
etric
tons
2008 2009 2010 2011 2012 2013 2014 2015 2016
Note: The organic production volume was estimated by FiBL based on estimated yields, as data are not available for most of the countries. UTZ defines certified volume as the estimated production potential. As the 2016 data for Fairtrade International were not available at the time of publication, the latest available figures, covering 2015, were used instead.
Source: Coffee Assurance Services, 2016; Fairtrade International, 2017; FiBL, 2018; Rainforest Alliance, 2018; UTZ, 2018.
Figure 115: Coffee: Average production volume, 2008–2016
0
1,000,000
2,000,000
3,000,000
4,000,000
5,000,000
6,000,000
2008 2009 2010 2011 2012 2013 2014 2015 2016
Met
ric to
ns
Max Min Average
Note: For Fairtrade International the 2016 data were not available. For purposes of comparison the 2015 data were used instead.
Source: FiBL-IISD-ITC survey, 2018. VSS: 4C, Fairtrade International, organic, Rainforest Alliance and UTZ.
COFFEE
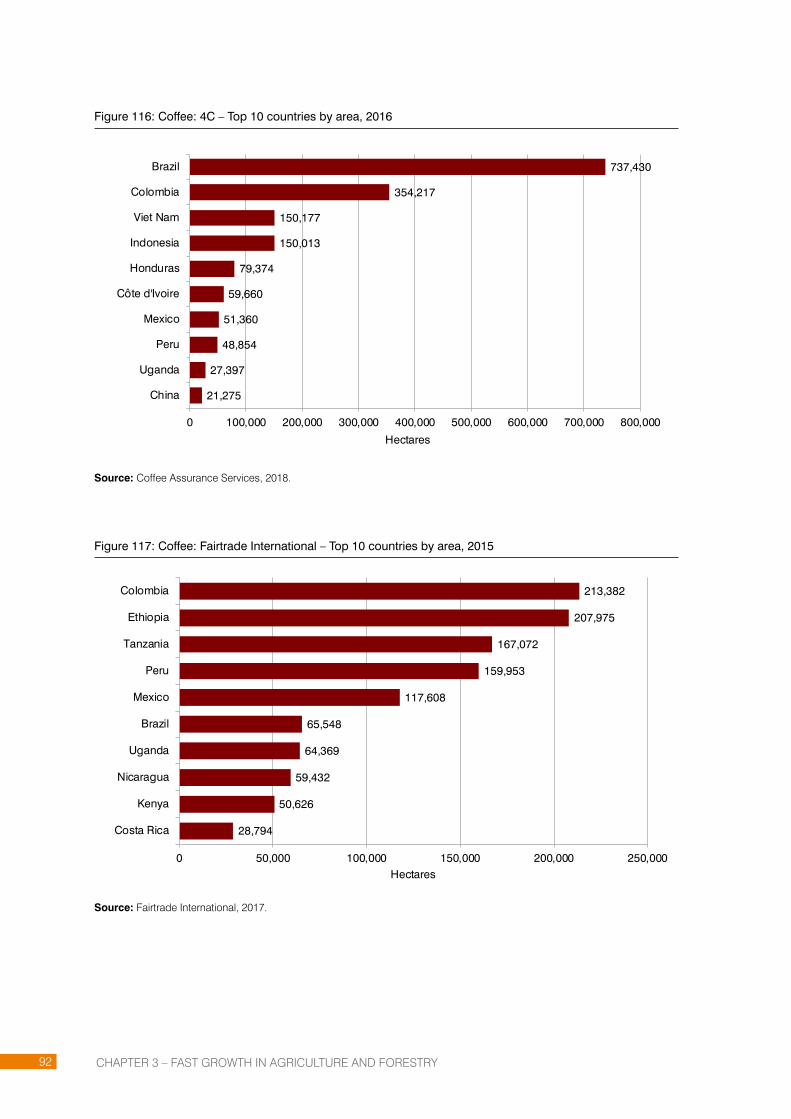
CHAPTER 3 – FAST GROWTH IN AGRICULTURE AND FORESTRy92
Figure 116: Coffee: 4C – Top 10 countries by area, 2016
21,275
27,397
48,854
51,360
59,660
79,374
150,013
150,177
354,217
737,430
0 100,000 200,000 300,000 400,000 500,000 600,000 700,000 800,000
China
Uganda
Peru
Mexico
Côte d'Ivoire
Honduras
Indonesia
Viet Nam
Colombia
Brazil
Hectares
Source: Coffee Assurance Services, 2018.
Figure 117: Coffee: Fairtrade International – Top 10 countries by area, 2015
28,794
50,626
59,432
64,369
65,548
117,608
159,953
167,072
207,975
213,382
0 50,000 100,000 150,000 200,000 250,000
Costa Rica
Kenya
Nicaragua
Uganda
Brazil
Mexico
Peru
Tanzania
Ethiopia
Colombia
Hectares
Source: Fairtrade International, 2017.
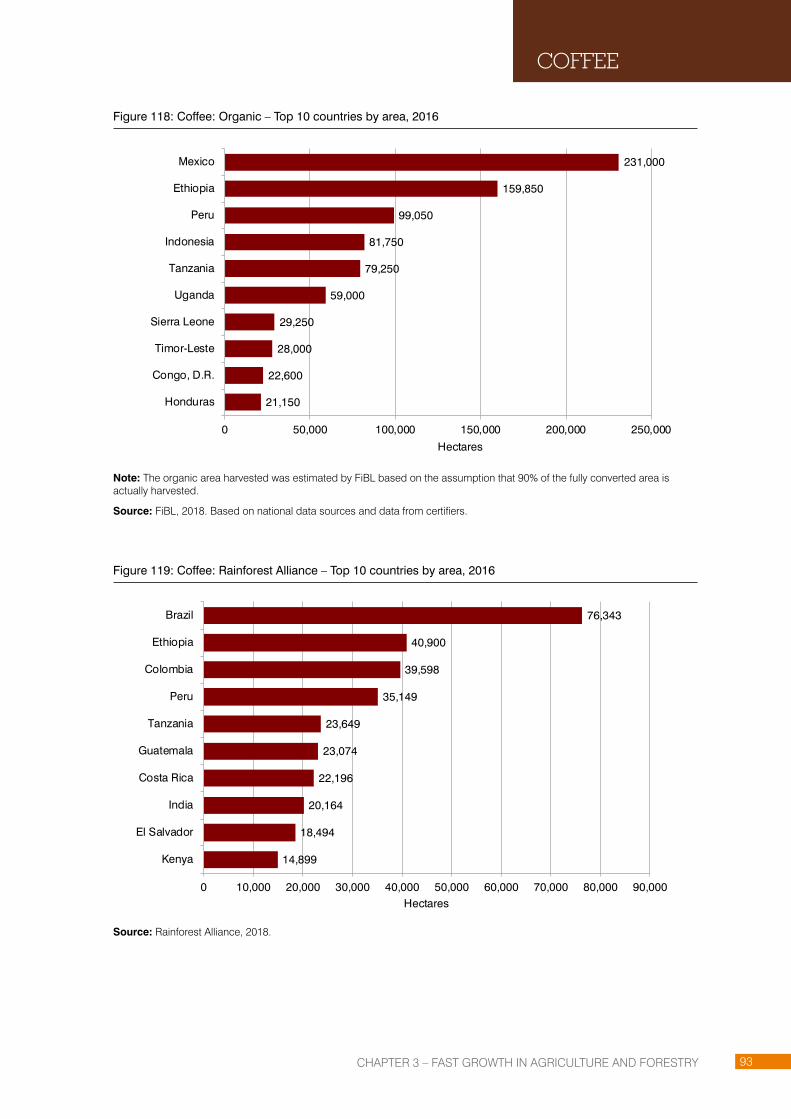
CHAPTER 3 – FAST GROWTH IN AGRICULTURE AND FORESTRy 93
Figure 118: Coffee: Organic – Top 10 countries by area, 2016
21,150
22,600
28,000
29,250
59,000
79,250
81,750
99,050
159,850
231,000
0 50,000 100,000 150,000 200,000 250,000
Honduras
Congo, D.R.
Timor-Leste
Sierra Leone
Uganda
Tanzania
Indonesia
Peru
Ethiopia
Mexico
Hectares
Note: The organic area harvested was estimated by FiBL based on the assumption that 90% of the fully converted area is actually harvested.
Source: FiBL, 2018. Based on national data sources and data from certifiers.
Figure 119: Coffee: Rainforest Alliance – Top 10 countries by area, 2016
14,899
18,494
20,164
22,196
23,074
23,649
35,149
39,598
40,900
76,343
0 10,000 20,000 30,000 40,000 50,000 60,000 70,000 80,000 90,000
Kenya
El Salvador
India
Costa Rica
Guatemala
Tanzania
Peru
Colombia
Ethiopia
Brazil
Hectares
Source: Rainforest Alliance, 2018.
COFFEE
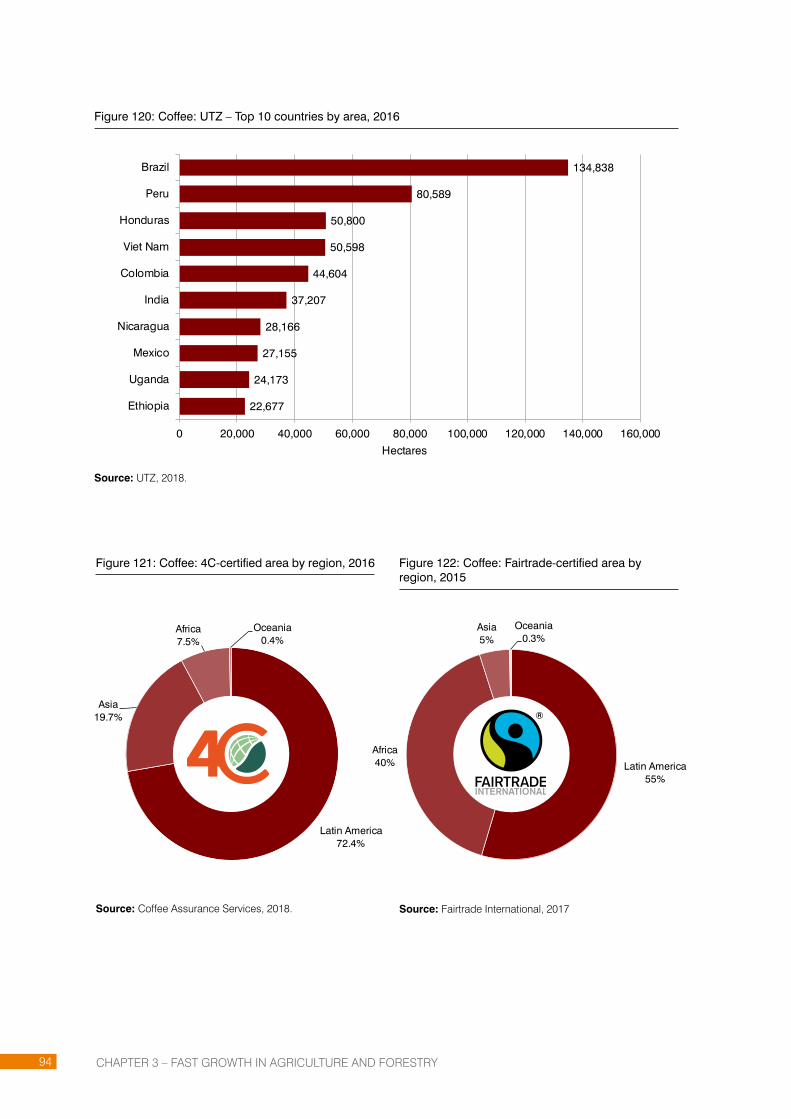
CHAPTER 3 – FAST GROWTH IN AGRICULTURE AND FORESTRy94
Figure 120: Coffee: UTZ – Top 10 countries by area, 2016
22,677
24,173
27,155
28,166
37,207
44,604
50,598
50,800
80,589
134,838
0 20,000 40,000 60,000 80,000 100,000 120,000 140,000 160,000
Ethiopia
Uganda
Mexico
Nicaragua
India
Colombia
Viet Nam
Honduras
Peru
Brazil
Hectares
Source: UTZ, 2018.
Figure 121: Coffee: 4C-certified area by region, 2016
Source: Coffee Assurance Services, 2018.
Figure 122: Coffee: Fairtrade-certified area by region, 2015
Source: Fairtrade International, 2017
Latin America55%
Africa40%
Asia5%
Oceania0.3%
Latin America72.4%
Asia19.7%
Africa7.5%
Oceania0.4%

CHAPTER 3 – FAST GROWTH IN AGRICULTURE AND FORESTRy 95
COFFEE
Latin America
46%
Africa39%
Asia13%
Oceania2%
ORGANIC
Latin America
64%
Africa25%
Asia11%
Oceania0.4%
Latin America66.5%
Asia18.6%
Africa14.5%
Oceania0.4%
Figure 123: Coffee: Organic-certified area by region, 2016
Source: FiBL, 2018. Please note that the organic area harvested was estimated by FiBL based on the assumption that 90% of the fully converted area is actually harvested.
Figure 124: Coffee: Rainforest Alliance-certified area by region, 2016
Source: Rainforest Alliance 2018.
Figure 125: Coffee: UTZ-certified area by region, 2016
Source: UTZ, 2018.

CHAPTER 3 – FAST GROWTH IN AGRICULTURE AND FORESTRy96
Figure 126: Coffee: Share of Fairtrade area, 2015
Source: Fairtrade International, 2017.
Figure 127: Coffee: Share of Organic area, 2016
Source: FiBL, 2018.
Figure 128: Coffee: Share of Rainforest Alliance area, 2016
Source: Rainforest Alliance, 2018.
Figure 129: Coffee: Share of UTZ area, 2016
Source: UTZ, 2018.
Coffee52%
Other48%
Coffee2%
Other98%
Coffee12%
Other88%
ORGANIC
Coffee21%
Other79%

CHAPTER 3 – FAST GROWTH IN AGRICULTURE AND FORESTRy 97
COTTON
Low demand and high stocks: Global cotton production dropping, keeping cotton prices low
As of 2016, the top five cotton-producing countries (China, India, United States, Pakistan, Brazil) accounted for 75% of world seed cotton production and 70% of the total harvested area for this crop (FAOSTAT, 2018). China and India produce 16 million and 14 million tons respectively, or 47% of global production (FAOSTAT, 2018). However, China’s yield is three times that of India: China’s 16 million tons are produced on just 3.4 million hectares, whereas India’s 14 million tons come from 10.5 million hectares (FAOSTAT, 2018).
Although China’s yield increased 20% over the past five years, cotton yields have been falling in the other major producing countries. As a result, world cotton production has declined from 80 million tons in 2011 to 65 million tons in 2016 (FAOSTAT, 2018). Factors such as adverse weather conditions, lower global demand, high global stock levels and fierce competition from synthetic fibres have contributed to this decline (OECD-FAO, 2016). Cotton is also one of the world’s most pesticide- and water-intensive crops.
Cotton production and area harvested are expected to be stable over the next five years as the large stock levels accumulated between 2010 and 2014 are gradually sold on the market, keeping the price of cotton relatively low (OECD-FAO, 2016). The major importers of cotton (Bangladesh, Viet Nam, China, Indonesia, Turkey) account for 67% of world import volume (USDA, 2018). However, the current trend of trading cotton yarn and fabrics instead of raw cotton will continue to dampen trade, which is expected to reach 8.7 million tons by 2025, representing a modest 7% increase from the period 2013–2015 (OECD-FAO, 2016).
While VSS have been present in the cotton market since the 1980s as organic cotton, increasing demand for social and economic accountability has led to the adoption of several additional voluntary standards over the past decade, notably Fairtrade International, CmiA and BCI. All allow synthetic fertilizers and pesticides, with the exception of organic, and BCI allows genetically modified (GM) seeds as well (BCI, 2017). As with most other agricultural sectors, growth in compliance has been driven by industry commitments, with 100% commitments expected by 2020 or earlier from such companies as Adidas, H&M, Ikea and Nike (Adidas, 2018; H&M, 2016; Nike, 2016).
CHAPTER 3 – FAST GROWTH IN AGRICULTURE AND FORESTRy98
At least 10% of the world’s cotton area is certified by at least one standard
Four of the VSS covered in this report – BCI, CmiA, Fairtrade International and organic – certify cotton production. Combined, they certified a minimum of 3.1 million hectares and a maximum of 3.4 million hectares in 2016 (average 3.3 million hectares).25 In terms of the proportion of the VSS-certified area of the global cotton area, the minimum represents 10.2%, the maximum, 11.4% and the average, 10.8%. Based on the minimum area, the certified cotton area more than trebled between 2011 and 2016. BCI had the largest VSS-certified cotton area, 2.1 million hectares, and the highest growth, a fivefold increase between 2011 and 2016.
BCI cotton was grown on more than 2.1 million hectares worldwide in 2016, or 7% of the global cotton area and 11% of the global cotton lint production volume (2.9 million metric tons). In 2016, the countries with the largest BCI cotton areas were Brazil (607,000 hectares), India (501,000 hectares), China (401,000 hectares) and Pakistan (359,000 hectares). These four countries represent almost 89% of the total BCI cotton area. Between 2011 and 2016, that area increased almost fivefold. However, between 2015 and 2016 alone it dropped by 8%.
CmiA certified almost 1.2 million hectares of cotton in 2016, or some 4% of the global cotton area and 26% of the cotton area in Africa. More than 320,000 metric tons of cotton lint were produced in 2016, which is about 1.2% of global production, and almost 20% of the cotton lint produced in Africa was CmiA-certified. CmiA was active in 10 countries. Unfortunately, country data was not available at the time this report was produced. Between 2011 and 2016, that area more than trebled, and grew by almost 21% between 2015 and 2016 alone.
Unfortunately, at the press time this reported was produced the 2016 country level data for Fairtrade International was not yet available. The latest figures available, covering 2015, were used instead. Fairtrade International certified more than 45,000 hectares of cotton in 2015, or 0.1% of the global cotton area. Almost 44,000 metric tons of cotton lint were produced, representing 0.2% of the global cotton lint production volume. The standard’s largest cotton areas were in India (almost 33,000 hectares) and Senegal (more than 3,000 hectares). Between 2011 and 2015, that area decreased by almost 40%, and by nearly 26% between 2014 and 2015 alone.
With more than 302,500 hectares, organic cotton represented 1% of the global cotton area. According to the Textile Exchange, almost 298,000 metric tons of seed cotton were registered in 2016 (0.5% of the world’s seed cotton production) and close to 108,000 metric tons of cotton lint (0.4% of global cotton lint production). India (over 189,000 hectares), the United Republic of Tanzania (almost 64,100 hectares) and China (over 9,600 hectares) had the largest organic cotton areas. Together, these countries accounted for nearly 87% of the total organic cotton area. Between 2011 and 2016, that area dropped by almost 7%, and by almost 14% between 2015 and 2016 alone, mainly due to a significant reduction in the organic cotton area in India.
For tables on VSS-compliant cotton production, see the appendix with data tables by country.
25. Multiple certification: Many of the areas certified by VSS are multiple-certified. An average between the maximum and minimum area provides an estimate of the possible VSS area for a given commodity. The maximum would be the sum of the total area/production provided by the individual VSS in the country, and the minimum would be the area of the VSS with the largest area in the country.
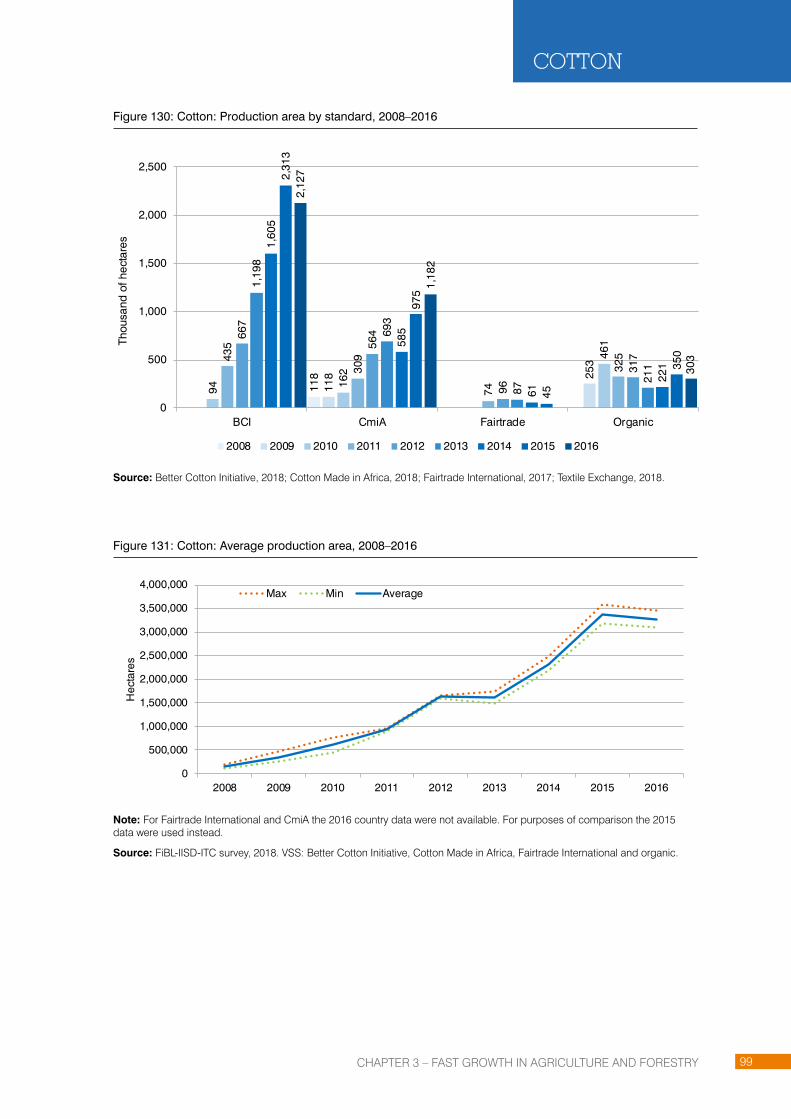
CHAPTER 3 – FAST GROWTH IN AGRICULTURE AND FORESTRy 99
COTTON
Figure 130: Cotton: Production area by standard, 2008–2016
118
118 25
3
94 162
461
435
309
74
325
667
564
96
317
1,19
8
693
87
211
1,60
5
585
61
221
2,31
3
975
45
350
2,12
7
1,18
2
303
0
500
1,000
1,500
2,000
2,500
BCI CmiA Fairtrade Organic
Thou
sand
of h
ecta
res
2008 2009 2010 2011 2012 2013 2014 2015 2016
Source: Better Cotton Initiative, 2018; Cotton Made in Africa, 2018; Fairtrade International, 2017; Textile Exchange, 2018.
Figure 131: Cotton: Average production area, 2008–2016
0
500,000
1,000,000
1,500,000
2,000,000
2,500,000
3,000,000
3,500,000
4,000,000
2008 2009 2010 2011 2012 2013 2014 2015 2016
Hec
tare
s
Max Min Average
Note: For Fairtrade International and CmiA the 2016 country data were not available. For purposes of comparison the 2015 data were used instead.
Source: FiBL-IISD-ITC survey, 2018. VSS: Better Cotton Initiative, Cotton Made in Africa, Fairtrade International and organic.

CHAPTER 3 – FAST GROWTH IN AGRICULTURE AND FORESTRy100
Figure 132: Cotton lint: Production volume by standard, 2008–2016
29
210
57
242
89 48
151
163
50 139
174
50 107
1,59
5
153
45 117
2,18
6
342
44 112
2,94
2
320
42 108
0
500
1,000
1,500
2,000
2,500
3,000
3,500
BCI CmiA Fairtrade Organic
Thou
sand
of m
etric
tons
2009 2010 2011 2012 2013 2014 2015 2016
Source: Better Cotton Initiative, 2018; Cotton Made in Africa, 2018; Fairtrade International, 2017; Textile Exchange, 2018.
Figure 133: Cotton: Better Cotton Initiative – Top 10 countries by area, 2016
8,000
13,000
16,000
59,000
62,000
85,000
359,000
401,000
501,000
607,000
0 100,000 200,000 300,000 400,000 500,000 600,000 700,000
Israel
Tajikistan
Turkey
Mozambique
Australia
United States
Pakistan
China
India
Brazil
Hectares
Source: Better Cotton Initiative (BCI), 2018.
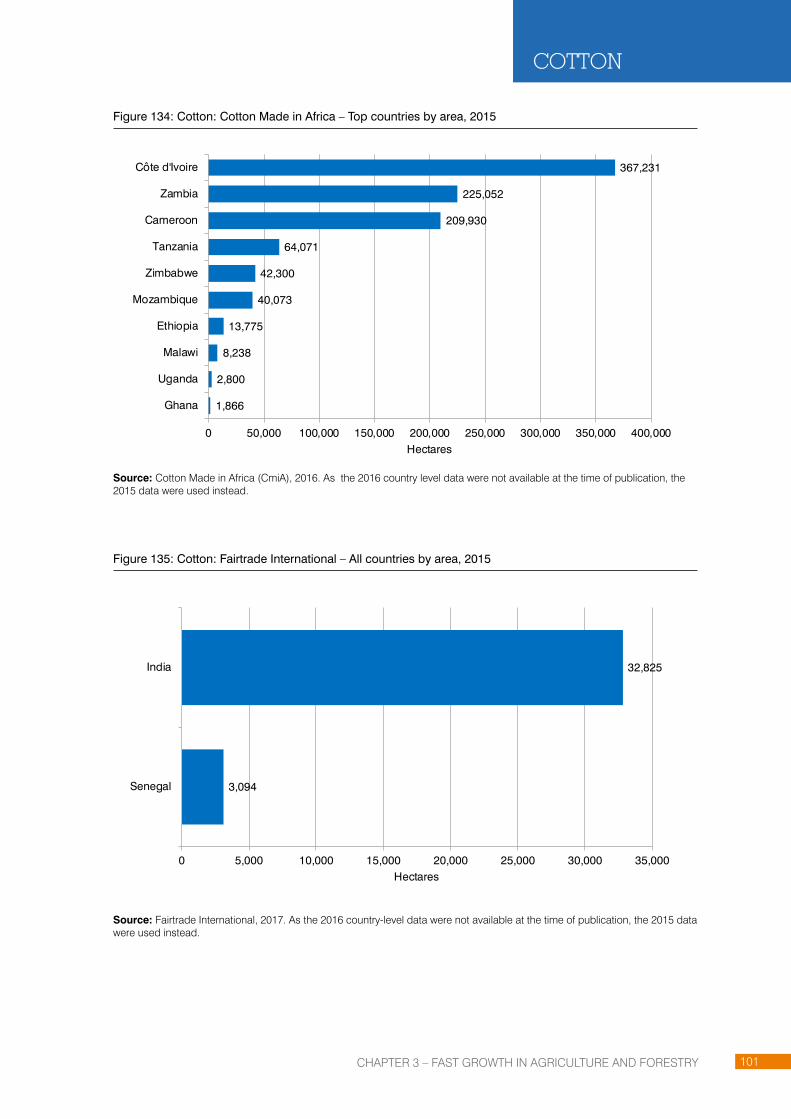
CHAPTER 3 – FAST GROWTH IN AGRICULTURE AND FORESTRy 101
Figure 134: Cotton: Cotton Made in Africa – Top countries by area, 2015
1,866
2,800
8,238
13,775
40,073
42,300
64,071
209,930
225,052
367,231
0 50,000 100,000 150,000 200,000 250,000 300,000 350,000 400,000
Ghana
Uganda
Malawi
Ethiopia
Mozambique
Zimbabwe
Tanzania
Cameroon
Zambia
Côte d'Ivoire
Hectares
Source: Cotton Made in Africa (CmiA), 2016. As the 2016 country level data were not available at the time of publication, the 2015 data were used instead.
Figure 135: Cotton: Fairtrade International – All countries by area, 2015
3,094
32,825
0 5,000 10,000 15,000 20,000 25,000 30,000 35,000
Senegal
India
Hectares
Source: Fairtrade International, 2017. As the 2016 country-level data were not available at the time of publication, the 2015 data were used instead.
COTTON

CHAPTER 3 – FAST GROWTH IN AGRICULTURE AND FORESTRy102
Figure 136: Cotton: Organic – Top 10 countries by area, 2016
2,428
2,507
3,733
4,928
5,616
7,013
8,369
9,653
64,084
189,364
0 50,000 100,000 150,000 200,000
Uganda
Benin
Turkey
Burkina Faso
Kyrgyzstan
Tajikistan
United States
China
Tanzania, U.R.
India
Hectares
Source: Textile Exchange, 2018
Figure 137: Cotton: Better Cotton Initiative-certified area by region, 2016
Source: Better Cotton Initiative (BCI), 2018.
Figure 138: Cotton: Cotton Made in Africa-certified area by country, 2015
Source: Cotton Made in Africa (CmiA), 2016.
Asia60%
Latin America
25%
North America4%
Africa3%
Oceania3% Europe
1%
Côte d'Ivoire38%
Zambia23%
Cameroon21%
Tanzania7%
Other11%

CHAPTER 3 – FAST GROWTH IN AGRICULTURE AND FORESTRy 103
Figure 140: Cotton: Organic-certified area by region, 2016
Source: Textile Exchange, 2018.
Figure 139: Cotton: Fairtrade-certified area by region, 2015
Source: Fairtrade International, 2017.
COTTON
Asia73%
Africa7%
Other20%
Asia71%
Africa25%
North America3%
Europe1% Latin America
0.3%
ORGANIC

CHAPTER 3 – FAST GROWTH IN AGRICULTURE AND FORESTRy104
PALM OIL
Large multinational companies commit to 100%-RSPO palm oil
As of 2016, the top three palm oil-producing countries (Indonesia, Malaysia and Thailand) accounted for 86% of global production and 71% of the total harvested area for this crop (FAOSTAT, 2018). Over the past 5 years (2011–2016), these countries expanded their aggregate production by 24% and their harvested area by 28%, which is indicative of continued rapid growth combined with aggregate declining yields in these traditional palm oil-producing countries (FAOSTAT, 2018).
At the global level, the opposite phenomenon – increasing yield – was observed, mainly driven by Latin American and African countries. Over the next five years, palm oil production is expected to continue growing at a similar or higher rate due to global interest in increasing palm oil production in African and Latin American countries and the rising global demand for vegetable oils. One study indicated that the global palm oil market is estimated to grow to $92.84 billion in 2021, up from $65.73 billion in 2015 (Zion Market Research, 2017).
While campaigns by such non-governmental organizations (NGOs) as Greenpeace and WWF will continue to pressure palm oil companies, retailers, consumer goods, manufacturers, and policymakers to adopt sustainable sourcing and production strategies, the industry is still subject to strong demand from Asian and African developing economies where expectations about sustainable sourcing are relatively low. As of 2017, Europe and the United States accounted for an estimated 7% of global consumption of palm oil (Index Mundi, 2018).
However, due to the urgency of sustainability issues in the industry, many companies have accelerated their commitment to standards-compliant palm oil in recent years, with such companies as AAK, KLK, McDonald’s, PepsiCo, Starbuck’s, Sainsbury and Unilever pledging to achieve 100% sourcing of RSPO- certified palm oil. Moreover, RSPO has facilitated many national initiatives in European countries, including Austria, Belgium, Denmark, France, Germany, Italy, Netherlands, Norway, Sweden, Switzerland and United Kingdom, to source 100% of their palm oil from RSPO-certified sources by 2020 (RSPO, 2017).

CHAPTER 3 – FAST GROWTH IN AGRICULTURE AND FORESTRy 105
PALM OIL
At least 12% of the world’s oil palm area is certified by at least one standard
Three of the voluntary standards covered in this report – organic, RA and RSPO – certify palm oil production. Combined, they certified a minimum of 2,465,000 hectares and a maximum of almost 2,527,000 hectares in 2015 (average 2,496,000 hectares).26 In terms of the proportion of the VSS-certified area of the global oil palm area, the minimum represents 11.7%, the maximum, 12% and the average, 11.8%. Based on the minimum area, the certified oil palm area dropped by 2.6% between 2013 and 2016. RSPO has the largest VSS-certified oil palm area, 3.2 million hectares, and organic the largest area growth; it trebled between 2013 and 2016 (2013 is the first year for which data for all three standards are available).
In 2016, organic oil palm represented 0.05% of the global oil palm area, with an estimated harvested area of 11,515 hectares.27 FiBL estimates that almost 132,310 metric tons of oil palm were produced in 2016, which is about 0.04% of global production. Organic oil palm was produced in nine countries, with the biggest areas in Mexico (6,900 hectares) and Ghana (1,550 hectares). The organic oil palm area trebled between 2013 and 2016.
Almost 64,000 hectares of oil palm worldwide were RA-certified in 2016, and nearly 1.3 million metric tons were produced. In 2016, four countries were producing RA oil palm: Guatemala (over 33,700 hectares), Colombia (almost 13,300 hectares), Honduras (almost 10,500 hectares) and Indonesia (over 6,000 hectares). The RA oil palm area increased by almost 30% between 2013 and 2016; 2013 is the first year for which data are available.
RSPO certified almost 3.2 million hectares (2.5 million hectares cultivated) of oil palm in 2016, or about 12% of the global oil palm area. Some 11.7 million metric tons of RSPO palm oil were produced that year. RSPO was active in at least 16 countries; the largest areas were in Indonesia (1.3 million hectares), Malaysia (almost 733,800 hectares) and Papua New Guinea (more than 139,000 hectares). Together, these countries accounted for close to 90% of the total RSPO palm oil area. Between 2013 and 2016, that area decreased by almost 2%.
For tables of VSS-compliant oil palm production, see the appendix with data tables by country.
26. Multiple certification: Many of the areas certified by VSS are multiple-certified. An average between the maximum and minimum area provides an estimate of the possible VSS area for a given commodity. The maximum would be the sum of the total area/production provided by the individual VSS in the country, and the minimum would be the area of the VSS with the largest area in the country.
27. In total, 12,128 hectares of organic oil palm were certified in 2016 (including in-conversion areas), representing 0.1% of the global oil palm area (Willer/Lernoud, 2018).

CHAPTER 3 – FAST GROWTH IN AGRICULTURE AND FORESTRy106
Figure 141: Oil palm: Production area by standard, 2008–2016
16,7
00
87,7
34
25,7
00 239,
949
6,40
0
599,
339
7,20
0
1,14
0,02
0
6,30
0
1,61
5,96
8
3,60
0
36,7
08
2,50
4,02
4
2,41
0
51,6
63
2,61
9,43
7
4,12
5
49,8
44
2,77
3,99
9
11,5
15
63,5
73
2,45
1,57
3
0
500,000
1,000,000
1,500,000
2,000,000
2,500,000
3,000,000
Organic Rainforest Alliance RSPO
Hec
tare
s
2008 2009 2010 2011 2012 2013 2014 2015 2016
Note: The organic area is the area harvested as estimated by FiBL, assuming that 90% of the fully converted area is actually harvested. For the Rainforest Alliance, the area cultivated is shown.
Source: FiBL, 2018; Rainforest Alliance, 2018; Roundtable on Sustainable Palm Oil (RSPO), 2018.
Figure 142: Oil palm: Average production area, 2008–2016
0
500,000
1,000,000
1,500,000
2,000,000
2,500,000
3,000,000
2008 2009 2010 2011 2012 2013 2014 2015 2016
Hec
tare
s
Max Min Average
Note: For Rainforest Alliance, data have been available since 2013. Due to the dominance of RSPO, multiple certifications do not play a major role.
Source: FiBL-IISD-ITC survey, 2018. VSS: organic, Rainforest Alliance and Roundtable on Sustainable Palm Oil (RSPO).
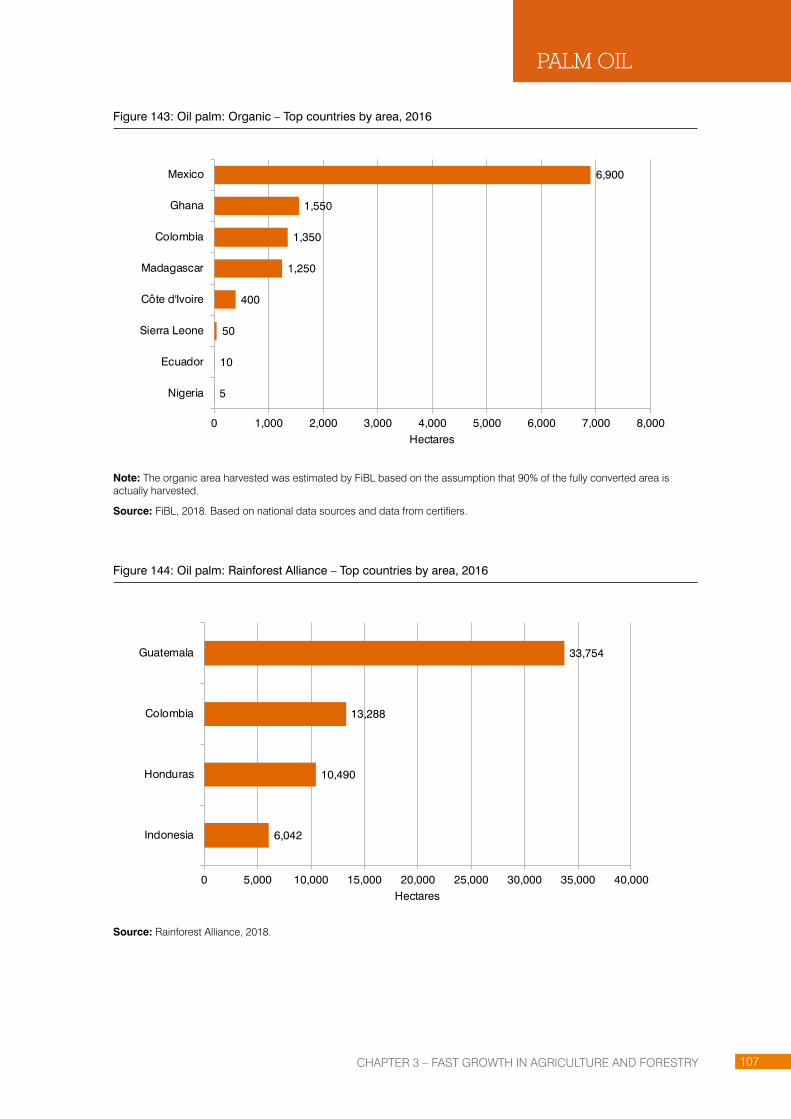
CHAPTER 3 – FAST GROWTH IN AGRICULTURE AND FORESTRy 107
PALM OIL
Figure 143: Oil palm: Organic – Top countries by area, 2016
5
10
50
400
1,250
1,350
1,550
6,900
0 1,000 2,000 3,000 4,000 5,000 6,000 7,000 8,000
Nigeria
Ecuador
Sierra Leone
Côte d'Ivoire
Madagascar
Colombia
Ghana
Mexico
Hectares
Note: The organic area harvested was estimated by FiBL based on the assumption that 90% of the fully converted area is actually harvested.
Source: FiBL, 2018. Based on national data sources and data from certifiers.
Figure 144: Oil palm: Rainforest Alliance – Top countries by area, 2016
6,042
10,490
13,288
33,754
0 5,000 10,000 15,000 20,000 25,000 30,000 35,000 40,000
Indonesia
Honduras
Colombia
Guatemala
Hectares
Source: Rainforest Alliance, 2018.
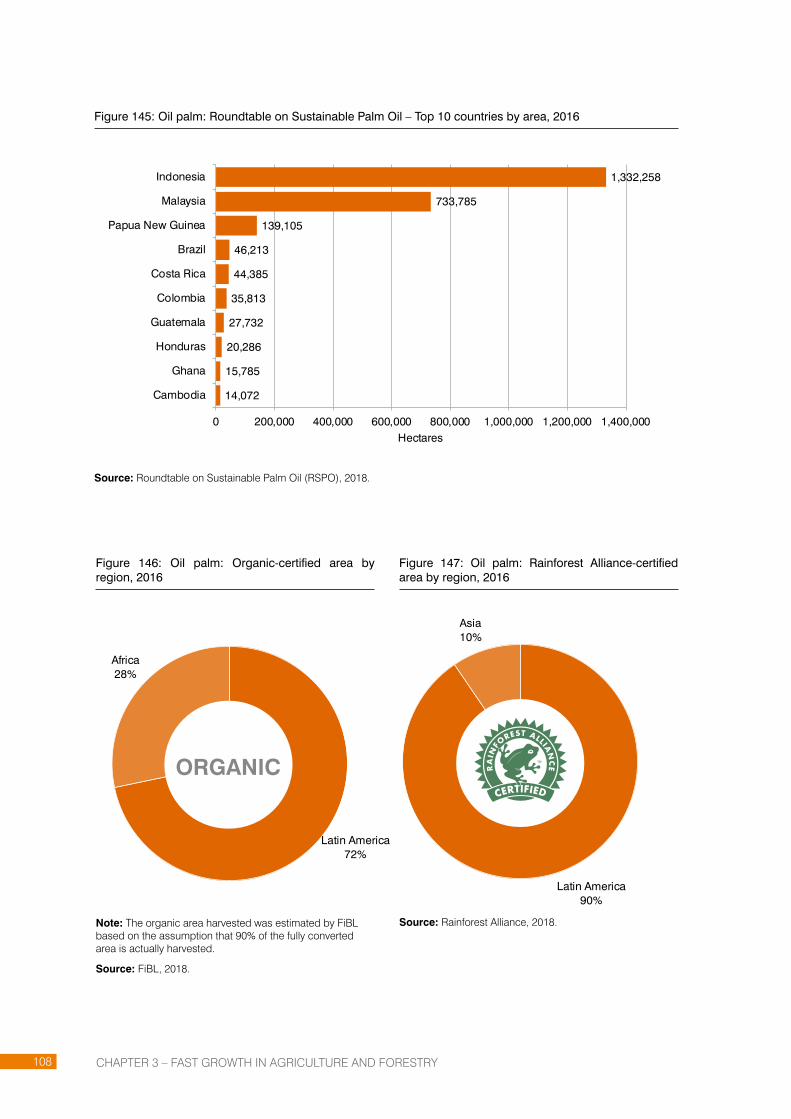
CHAPTER 3 – FAST GROWTH IN AGRICULTURE AND FORESTRy108
Figure 145: Oil palm: Roundtable on Sustainable Palm Oil – Top 10 countries by area, 2016
14,072
15,785
20,286
27,732
35,813
44,385
46,213
139,105
733,785
1,332,258
0 200,000 400,000 600,000 800,000 1,000,000 1,200,000 1,400,000
Cambodia
Ghana
Honduras
Guatemala
Colombia
Costa Rica
Brazil
Papua New Guinea
Malaysia
Indonesia
Hectares
Source: Roundtable on Sustainable Palm Oil (RSPO), 2018.
Figure 146: Oil palm: Organic-certified area by region, 2016
Note: The organic area harvested was estimated by FiBL based on the assumption that 90% of the fully converted area is actually harvested.
Source: FiBL, 2018.
Figure 147: Oil palm: Rainforest Alliance-certified area by region, 2016
Source: Rainforest Alliance, 2018.
Latin America72%
Africa28%
ORGANIC
Latin America90%
Asia10%

CHAPTER 3 – FAST GROWTH IN AGRICULTURE AND FORESTRy 109
PALM OIL
Figure 148: Oil palm: Roundtable on Sustainable Palm Oil-certified area by region, 2016
Source: Roundtable on Sustainable Palm Oil (RSPO), 2018.
Asia86%
Latin America7%
Oceania6%
Africa1%

CHAPTER 3 – FAST GROWTH IN AGRICULTURE AND FORESTRy110
SOY
70% of soybeans are produced for animal feed
As of 2016, the top five cotton-producing countries (China, India, United States, Pakistan, Brazil) accounted for 75% of world seed cotton production and 70% of the total harvested area for this crop (FAOSTAT, 2018). China and India produce 16 million and 14 million tons respectively, or 47% of global production (FAOSTAT, 2018). However, China’s yield is three times that of India: China’s 16 million tons are produced on just 3.4 million hectares, whereas India’s 14 million tons come from 10.5 million hectares (FAOSTAT, 2018).
Although China’s yield increased 20% over the past five years, cotton yields have been falling in the other major producing countries. As a result, world cotton production has declined from 80 million tons in 2011 to 65 million tons in 2016 (FAOSTAT, 2018). Factors such as adverse weather conditions, lower global demand, high global stock levels and fierce competition from synthetic fibres have contributed to this decline (OECD-FAO, 2016). Cotton is also one of the world’s most pesticide- and water-intensive crops.
Cotton production and area harvested are expected to be stable over the next five years as the large stock levels accumulated between 2010 and 2014 are gradually sold on the market, keeping the price of cotton relatively low (OECD-FAO, 2016). The major importers of cotton (Bangladesh, Viet Nam, China, Indonesia, Turkey) account for 67% of world import volume (USDA, 2018). However, the current trend of trading cotton yarn and fabrics instead of raw cotton will continue to dampen trade, which is expected to reach 8.7 million tons by 2025, representing a modest 7% increase from the period 2013–2015 (OECD-FAO, 2016).
While VSS have been present in the cotton market since the 1980s as organic cotton, increasing demand for social and economic accountability has led to the adoption of several additional voluntary standards over the past decade, notably Fairtrade International, CmiA and BCI. All allow synthetic fertilizers and pesticides, with the exception of organic, and BCI allows genetically modified (GM) seeds as well (BCI, 2017). As with most other agricultural sectors, growth in compliance has been driven by industry commitments, with 100% commitments expected by 2020 or earlier from such companies as Adidas, H&M, Ikea and Nike (Adidas, 2018; H&M, 2016; Nike, 2016).
Certified soybeans are grown on 2.1% of the global soybean area
Three of the standards covered in this report – Organic, ProTerra Foundation and RTRS – certify soybean production. Combined, they certified a minimum of 2.6 million hectares and a maximum of almost 3.5 million hectares in 2016 (average 3 million hectares).28 In terms of the proportion of the VSS-certified area of the global soybean area, the minimum represents 2.1%, the maximum, 2.8% and the average, 2.5%. Based on
28. Multiple certification: Many of the areas certified by VSS are multiple-certified. An average between the maximum and minimum area provides an estimate of the possible VSS area for a given commodity. The maximum would be the sum of the total area/production provided by the individual VSS in the country, and the minimum would be the area of the VSS with the largest area in the country.

CHAPTER 3 – FAST GROWTH IN AGRICULTURE AND FORESTRy 111
SOY
the minimum area, the certified soybean area increased by almost 50% between 2011 and 2016. ProTerra Foundation has the largest VSS-certified soybean area, 1.9 million hectares; the highest growth – a sevenfold increase from 2011 to 2016 – was noted for RTRS.
Organic soybeans represented 0.4% of the global soybean area; the harvested area was almost 490,000 hectares.29 FiBL estimates that nearly 0.8 million metric tons of soybeans were produced in 2016. The largest organic soybean area in 2016 was in China (more than 192,000 hectares), followed by India (117,000 hectares), the United States (45,400 hectares) and the Russian Federation (28,400 hectares). In total, these countries’ areas accounted for 78% of the total organic soybean area. Between 2011 and 2016, that area increased by more than 28%. However, between 2015 and 2016 it dropped by 7%, mainly due to a drop in the area reported by China.
More than 1.9 million hectares of soybean were ProTerra Foundation-certified in 2016, representing 1.6% of the global soybean area and 1.2% of global soybean production. Almost 3.9 million metric tons were produced. Seven countries produced ProTerra soybeans in 2016: Brazil (almost 1.8 million hectares), Italy (50,000 hectares) and the Russian Federation (28,000 hectares) had the largest areas. Between 2011 and 2016, the ProTerra soybean area increased by almost 56%, and by nearly 6% between 2015 and 2016 alone.
RTRS certified more than 1 million hectares of soybeans in 2016, or 0.9% of the global soybean area. In 2016, almost 3.3 million metric tons of soybeans were produced (1% of global soybean production volume). RTRS was active in eight countries; the largest areas were in Brazil (more than 690,000 hectares) and Argentina (223,770 hectares). These two countries accounted for almost 88% of the total RTRS area. Between 2011 and 2016, the RTRS soybean area increased almost sevenfold, and by 42% between 2015 and 2016 alone.
For tables of VSS-compliant soybean production, see the appendix with data tables by country.
Figure 149: Soybean: Production area by standard, 2008–2016
100
1,24
1
117
1,21
1
376
1,14
7
382
1,22
6
14430
0
1,22
6
353
301
1,48
0
450
333
1,21
5
484
528
1,81
0
735
490
1,91
6
1,04
5
0
500
1,000
1,500
2,000
2,500
Organic ProTerra RTRS
Thou
sand
of h
ecta
res
2008 2009 2010 2011 2012 2013 2014 2015 2016
Note: The organic area is the area harvested as estimated by FiBL, assuming that 90% of the fully converted area is actually harvested.
Source: FiBL, 2018; ProTerra Foundation, 2018; Round Table on Responsible Soy (RTRS), 2018.
29. In total, 560,457 hectares of organic soybeans were certified in 2016 (including in-conversion areas), representing 0.5% of the global soybean area (Willer/Lernoud, 2018).

CHAPTER 3 – FAST GROWTH IN AGRICULTURE AND FORESTRy112
Figure 150: Soybean: Average production area, 2008–2016
0
500,000
1,000,000
1,500,000
2,000,000
2,500,000
3,000,000
3,500,000
4,000,000
2008 2009 2010 2011 2012 2013 2014 2015 2016
Hec
tare
s
Max Min Average
Source: FiBL-IISD-ITC survey, 2018. VSS: organic, ProTerra Foundation and Round Table on Responsible Soy (RTRS).
Figure 151: Soybean: Production volume by standard, 2008–2016
181
4,23
3
218
4,13
0
857
3,91
3
852
4,18
3
42161
3
3,41
1
1,00
7
618
3,00
0
1,15
8
502
2,48
9
1,40
8
861
3,88
5
2,34
2
819
3,87
3
3,26
7
0
500
1,000
1,500
2,000
2,500
3,000
3,500
4,000
4,500
Organic ProTerra RTRS
Thou
sand
of m
etric
tons
2008 2009 2010 2011 2012 2013 2014 2015 2016
Note: The organic production volume was estimated by FiBL based on estimated yields, as data are not available for most of the countries.
Source: FiBL, 2018; ProTerra Foundation, 2018; Round Table on Responsible Soy (RTRS), 2018.

CHAPTER 3 – FAST GROWTH IN AGRICULTURE AND FORESTRy 113
SOY
Figure 152: Soybean: Average production volume, 2008–2016
0
1,000,000
2,000,000
3,000,000
4,000,000
5,000,000
6,000,000
7,000,000
8,000,000
9,000,000
2008 2009 2010 2011 2012 2013 2014 2015 2016
Met
ric to
ns
Max Min Average
Note: Production volume data for ProTerra Foundation have been available since 2013.
Source: FiBL-IISD-ITC survey, 2018. VSS: organic, ProTerra Foundation and Round Table on Responsible Soy (RTRS).
Figure 153: Soybean: Organic – Top 10 countries by area, 2016
8,100
9,450
10,250
13,200
13,900
17,400
28,400
45,400
117,000
192,400
0 50,000 100,000 150,000 200,000 250,000
Canada
Romania
Argentina
Austria
France
Togo
Russian Federation
United States
India
China
Hectares
Note: The organic area harvested was estimated by FiBL based on the assumption that 90% of the fully converted area is actually harvested.
Source: FiBL, 2018. Based on national data sources and data from certifiers.
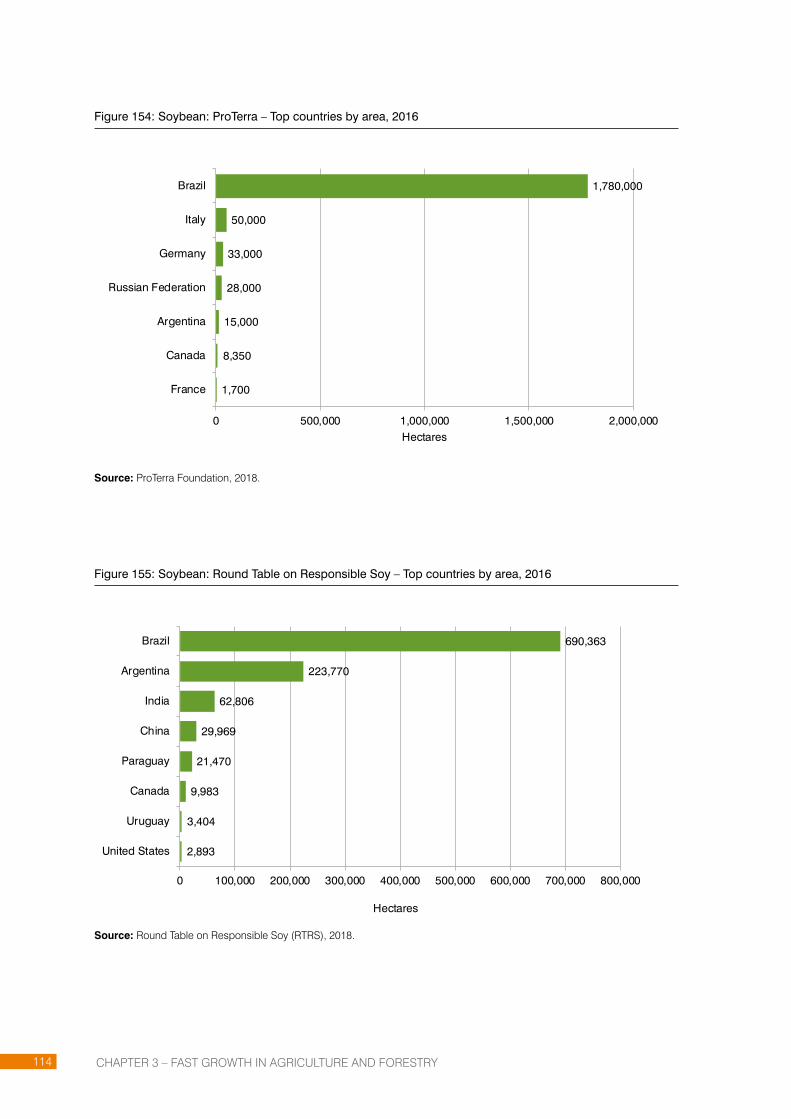
CHAPTER 3 – FAST GROWTH IN AGRICULTURE AND FORESTRy114
Figure 154: Soybean: ProTerra – Top countries by area, 2016
1,700
8,350
15,000
28,000
33,000
50,000
1,780,000
0 500,000 1,000,000 1,500,000 2,000,000
France
Canada
Argentina
Russian Federation
Germany
Italy
Brazil
Hectares
Source: ProTerra Foundation, 2018.
Figure 155: Soybean: Round Table on Responsible Soy – Top countries by area, 2016
2,893
3,404
9,983
21,470
29,969
62,806
223,770
690,363
0 100,000 200,000 300,000 400,000 500,000 600,000 700,000 800,000
United States
Uruguay
Canada
Paraguay
China
India
Argentina
Brazil
Hectares
Source: Round Table on Responsible Soy (RTRS), 2018.

CHAPTER 3 – FAST GROWTH IN AGRICULTURE AND FORESTRy 115
SOY
Figure 156: Soybean: Organic-certified area by region, 2016
Note: The organic area harvested was estimated by FiBL based on the assumption that 90% of the fully converted area is actually harvested.
Source: FiBL, 2018.
Figure 157: Soybean: ProTerra-certified area by region, 2016
Source: ProTerra Foundation, 2018.
Figure 158: Soybean: RTRS-certified area by region, 2016
Source: Round Table on Responsible Soy (RTRS), 2018.
Asia65%
Europe17%
North America
11%
Africa4%
Latin America
3%
ORGANIC
Latin America90%
Asia9%
North America1%
Latin America98.3%
Europe5.9%
North America0.4%

CHAPTER 3 – FAST GROWTH IN AGRICULTURE AND FORESTRy116
SUGARCANE
National policies and commitments from major buyers drive compliance with standards
As of 2016, the top five sugarcane-producing countries (Brazil, India, China, Thailand, and Pakistan) accounted for 74% of production and 72% of the total harvested area for this crop (FAOSTAT, 2018). Over the past five years (2011–2016), production and land area harvested have grown 4%, a rate that is roughly in line with the global increase in demand for sugar combined with the levelling of demand for sugarcane in ethanol production. Over the past decade, approximately 174 million tons of sugarcane were destined for ethanol production (OECD-FAO, 2017).
Annual global sugarcane production is forecast to increase by an estimated 12 million tons in 2017–2018, for a record total of 168 million tons, driven by increases in yield, plantation area and ethanol policies (USDA, 2017). Globally, the share of global sugarcane production destined for ethanol production is expected to continue to grow, from 20.7% in 2015 to 22.3% in 2025, driven by ethanol policies in countries like India (OECD-FAO, 2016). Over the next decade, sugarcane will continue to be the main crop for sugar production, with the share of sugar produced from sugar beet expected to decline from 14% to 12.9% during the period 2017–2026 (OECD-FAO, 2017).
National policies promoting sustainable biofuel feedstock and commitments from major downstream buyers, including Coca-Cola, Ferrero Group, General Mills, PepsiCo and Unilever, are the main drivers of compliance with VSS. Bonsucro, based on the mainstream roundtable model, enabled standards-compliant sugarcane to become one of the fastest-growing markets in recent years.
The ProTerra standard has been used for verification of good agricultural practices in the sugarcane sector since 2006 and is now being used for certification as well. In 2012, Rainforest Alliance became the latest international standard to enter the sugarcane market, also with an eye on mainstream markets.

CHAPTER 3 – FAST GROWTH IN AGRICULTURE AND FORESTRy 117
SUGARCANE
Three standards certify production of sugarcane, the world’s largest source of sugar
Three of the voluntary standards covered in this report – Bonsucro, Fairtrade International and organic – certify sugarcane production. Combined, they certified a minimum of 1.05 million hectares and a maximum of 1.1 million hectares in 2016 (average 1.08 million hectares).30 In terms of the proportion of the VSS-certified area of the global sugarcane area, the minimum represents 3.9%, the maximum, 4.1% and the average, 4.0%. Based on the minimum area, the certified sugarcane area increased by almost 27% between 2011 and 2016; however, it decreased by 8% from 2015 to 2016. Bonsucro has the largest VSS-certified sugarcane area, almost 0.9 million hectares; the largest growth was noted for Fairtrade International, whose area grew by 82% between 2011 and 2016.
Bonsucro certified over 860,000 hectares of sugarcane in 2016, or almost 3.2% of the global sugarcane area. In 2016, the standard registered almost 53 million metric tons of sugarcane, representing 2.8% of the global sugarcane production volume. Its largest areas were in Brazil (almost 793,000 hectares) and Australia (nearly 40,000 hectares); together, they accounted for 97% of Bonsucro´s total sugarcane area. Between 2011 and 2016, that area increased by almost 21%. Between 2015 and 2016, however, it fell by 5% following the decrease reported in 2015.
Fairtrade International sugarcane represented 0.6% of the global sugarcane area, or almost 153,000 hectares. Some 0.7 million metric tons of Fairtrade International cane sugar were registered in 2016. Fairtrade International certifies sugarcane only in developing countries; the largest areas in 2016 were in Paraguay (almost 16,000 hectares), India (nearly 8,000 hectares) and Costa Rica (over 6,000 hectares). Together, these three countries accounted for almost 20% of the total Fairtrade International sugarcane area. That area increased by 82% between 2011 and 2016; between 2015 and 2016, however, a drop of 18% was reported.
Almost 92,000 hectares of sugarcane worldwide were certified organic in 2016 (estimated harvested area).31 This represents 0.3% of the global sugarcane area and an estimated 0.3% of the global sugarcane production volume (4.9 million metric tons). The largest organic sugarcane areas were in Paraguay (43,600 hectares), Argentina (12,550 hectares) and Brazil (11,400 hectares). Together, these countries accounted for 72% of the total organic sugarcane area. Between 2011 and 2016, that area increased by over 50%. However, between 2015 and 2016 a drop of almost 1% was reported.
For tables of VSS-compliant sugarcane production, see the appendix with data tables by country.
30. Multiple certification: Many of the areas certified by VSS are multiple-certified. An average between the maximum and minimum area provides an estimate of the possible VSS area for a given product. The maximum would be the sum of the total area/production provided by the individual VSS in the country, and the minimum would be the area of the VSS with the largest area in the country.
31. In total, 82,983 hectares of organic sugarcane were certified in 2016 (including in-conversion areas), representing 0.3% of the global sugarcane area (Willer/Lernoud, 2018).
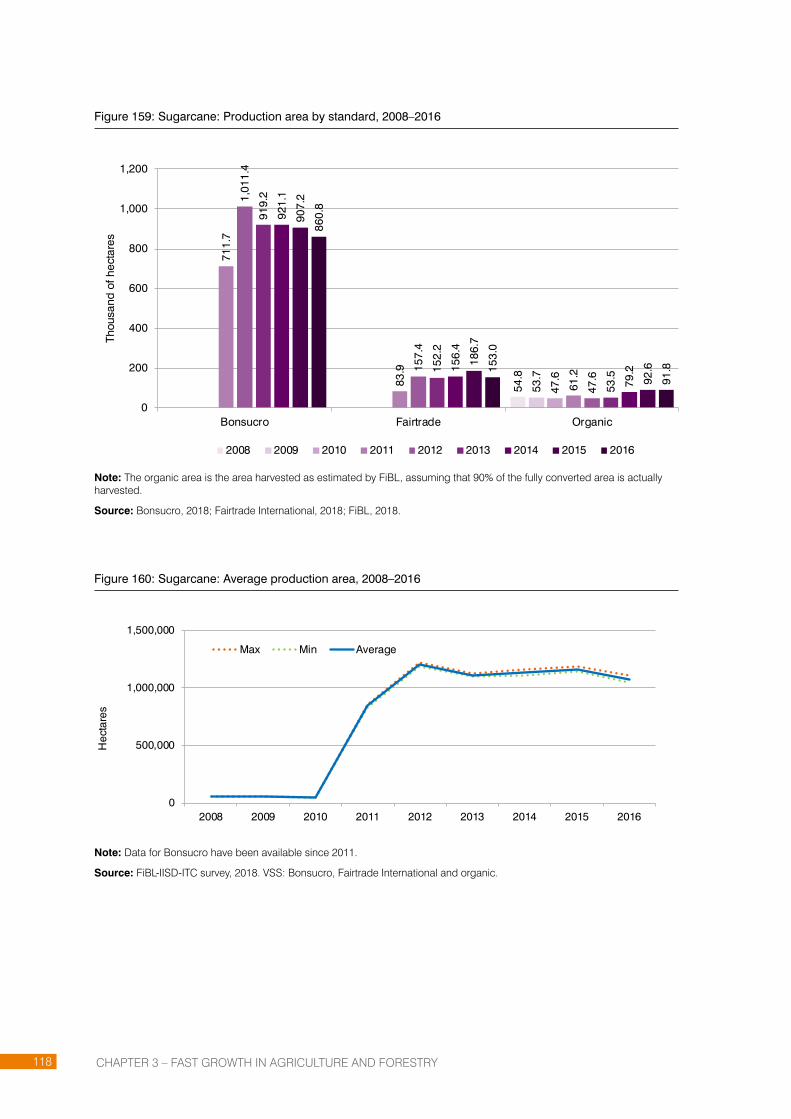
CHAPTER 3 – FAST GROWTH IN AGRICULTURE AND FORESTRy118
Figure 159: Sugarcane: Production area by standard, 2008–2016
54.8
53.7
47.6
711.
7
83.9
61.2
1,01
1.4
157.
4
47.6
919.
2
152.
2
53.5
921.
1
156.
4
79.2
907.
2
186.
7
92.6
860.
8
153.
0
91.8
0
200
400
600
800
1,000
1,200
Bonsucro Fairtrade Organic
Thou
sand
of h
ecta
res
2008 2009 2010 2011 2012 2013 2014 2015 2016
Note: The organic area is the area harvested as estimated by FiBL, assuming that 90% of the fully converted area is actually harvested.
Source: Bonsucro, 2018; Fairtrade International, 2018; FiBL, 2018.
Figure 160: Sugarcane: Average production area, 2008–2016
0
500,000
1,000,000
1,500,000
2008 2009 2010 2011 2012 2013 2014 2015 2016
Hec
tare
s
Max Min Average
Note: Data for Bonsucro have been available since 2011.
Source: FiBL-IISD-ITC survey, 2018. VSS: Bonsucro, Fairtrade International and organic.
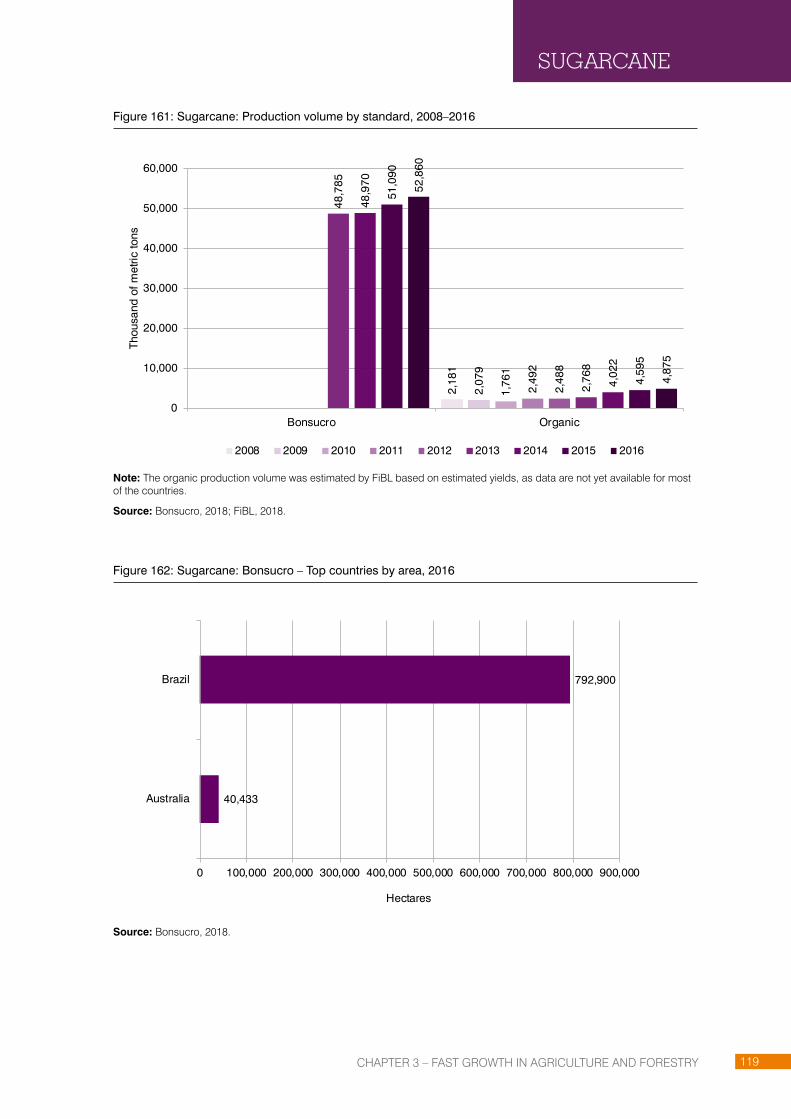
CHAPTER 3 – FAST GROWTH IN AGRICULTURE AND FORESTRy 119
Figure 161: Sugarcane: Production volume by standard, 2008–2016
2,18
1
2,07
9
1,76
1
2,49
2
2,48
8
48,7
85
2,76
8
48,9
70
4,02
2
51,0
90
4,59
5
52,8
60
4,87
5
0
10,000
20,000
30,000
40,000
50,000
60,000
Bonsucro Organic
Thou
sand
of m
etric
tons
2008 2009 2010 2011 2012 2013 2014 2015 2016
Note: The organic production volume was estimated by FiBL based on estimated yields, as data are not yet available for most of the countries.
Source: Bonsucro, 2018; FiBL, 2018.
Figure 162: Sugarcane: Bonsucro – Top countries by area, 2016
40,433
792,900
0 100,000 200,000 300,000 400,000 500,000 600,000 700,000 800,000 900,000
Australia
Brazil
Hectares
Source: Bonsucro, 2018.
SUGARCANE
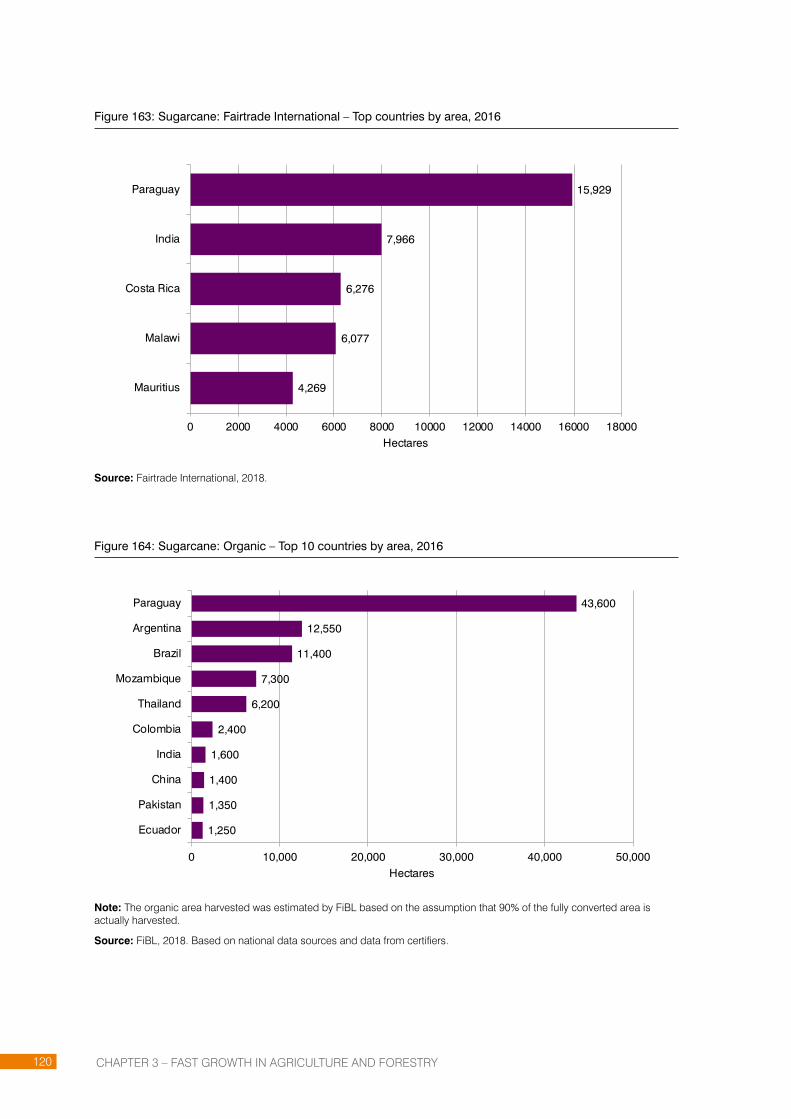
CHAPTER 3 – FAST GROWTH IN AGRICULTURE AND FORESTRy120
Figure 163: Sugarcane: Fairtrade International – Top countries by area, 2016
4,269
6,077
6,276
7,966
15,929
0 2000 4000 6000 8000 10000 12000 14000 16000 18000
Mauritius
Malawi
Costa Rica
India
Paraguay
Hectares
Source: Fairtrade International, 2018.
Figure 164: Sugarcane: Organic – Top 10 countries by area, 2016
1,250
1,350
1,400
1,600
2,400
6,200
7,300
11,400
12,550
43,600
0 10,000 20,000 30,000 40,000 50,000
Ecuador
Pakistan
China
India
Colombia
Thailand
Mozambique
Brazil
Argentina
Paraguay
Hectares
Note: The organic area harvested was estimated by FiBL based on the assumption that 90% of the fully converted area is actually harvested.
Source: FiBL, 2018. Based on national data sources and data from certifiers.
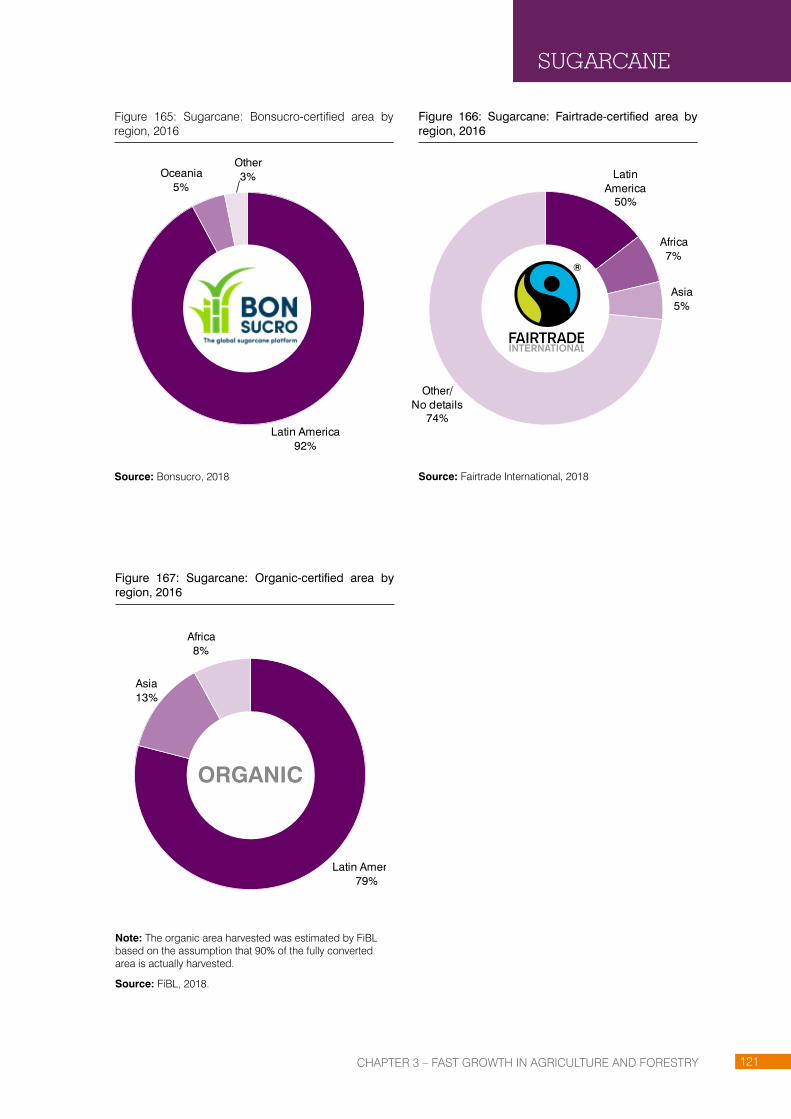
CHAPTER 3 – FAST GROWTH IN AGRICULTURE AND FORESTRy 121
SUGARCANE
Figure 165: Sugarcane: Bonsucro-certified area by region, 2016
Source: Bonsucro, 2018
Figure 166: Sugarcane: Fairtrade-certified area by region, 2016
Source: Fairtrade International, 2018
Figure 167: Sugarcane: Organic-certified area by region, 2016
Note: The organic area harvested was estimated by FiBL based on the assumption that 90% of the fully converted area is actually harvested.
Source: FiBL, 2018.
Latin America
50%
Africa7%
Asia5%
Other/No details
74%
Latin America79%
Asia13%
Africa8%
ORGANIC
Latin America92%
Oceania5%
Other3%

CHAPTER 3 – FAST GROWTH IN AGRICULTURE AND FORESTRy122
TEA
Climate change threatens tea yields
As of 2016, the top five tea-producing countries (China, India, Kenya, Sri Lanka and Turkey) account for 80% of global production and 82% of the total harvested area for this crop (FAOSTAT, 2018). Over the past five years (2011–2016), these countries have expanded their production by 29% (1 million tons) and their harvested area by 22%, indicating an improvement in yield per hectare. The total harvested area for tea production is currently 4.1 million hectares, globally.
Since tea production requires specific conditions characteristic of mountainous tropical and subtropical climates, it is limited to a few areas that are currently threatened by climate change, which is expected to disturb future growing conditions with a consequent effect on yields (Chang and Brattlof, 2015).
Nonetheless, global demand for tea keeps expanding, most notably driven by China and India, whose total tea consumption rose from 1.7 million tons in 2006–2008 to 2.6 million tons in 2013, a 58% increase (Chang, 2015). In this context, black and green tea production is expected to continue to grow over the medium term (2013–2023), with projected annual growth rates of 2.9% and 8.2%, respectively (Chang, 2015).
The tea industry is vertically and horizontally integrated, with a relatively small number of companies controlling the entire supply chain (Wal, 2008). In the United Kingdom, two companies, Tetley (owned by Tata Tea Limited) and PG Tips (owned by Unilever), account for over half of the market share. In the United States, four companies, including Lipton (owned by Unilever), account for half of the market share. These companies have been driving the uptake of standards-compliant tea. Unilever and Tetley have committed to 100% compliant sourcing by 2020 and 2016, respectively (Tetley, 2014, Unilever, 2016). By 2015, Lipton, a Unilever brand, reached 100% compliant sourcing, enabling Unilever to achieve a 66% rate of total sourcing in compliance (Unilever, 2016).

CHAPTER 3 – FAST GROWTH IN AGRICULTURE AND FORESTRy 123
TEA
13.2% of the global tea area is VSS-certified
Four of the voluntary standards covered in this report – Fairtrade International, organic, RA and UTZ – certify tea production. Combined, they certified a minimum of more than 542,000 hectares and a maximum of almost 745,000 hectares in 2016 (average 643,000 hectares).32 In terms of the proportion of the VSS-certified area of the global tea area, the minimum represents 13.2%, the maximum, 18.1%, and the average, 15.7%. Based on the minimum area, the certified tea area more than doubled (+117%) between 2011 and 2016. RA has the largest VSS-certified tea area, almost 470,000 hectares, and also the largest growth of area, which increased fourfold between 2011 and 2016.
Fairtrade International certified more than 126,000 hectares of tea in 2016, or 3.1% of the global tea area. In 2016, almost 254,000 metric tons of its tea were reported (4.3% of the global tea production volume). Kenya reported the largest Fairtrade International tea area (almost 57,000 hectares), followed by Uganda (nearly 21,000 hectares) and India (almost 18,000 hectares). Together, these countries accounted for almost 80% of the total Fairtrade International tea area. That area increased by 51% between 2011 and 2016 and by 3% between 2015 and 2016 alone.
Organic tea represented 2% of the global tea area, more than 81,000 hectares.33 FiBL estimates that close to 88,000 metric tons of organic tea were produced in 2016, which constitutes 1.5% of the global tea production volume. In 2016, the largest organic harvested areas were in China (47,000 hectares) and India (more than 14,000 hectares). Together, these two countries accounted for almost 75% of the organic tea area. Between 2011 and 2016, that area increased by 19%, and by almost 9% between 2015 and 2016 alone.
Almost 469,000 hectares of tea were RA-certified worldwide in 2016, representing 11.4% of the global tea area. More than 1 million metric tons of RA tea were reported. The country with the biggest RA tea area was Kenya (almost 187,000 hectares), followed by India (more than 108,000 hectares) and Sri Lanka (almost 32,000 hectares). Together, these countries accounted for 70% of the total RA tea area. That area increased more than fourfold between 2011 and 2016, but dropped by almost 1% between 2015 and 2016.
UTZ certified almost 68,000 hectares of tea in 2016, or close to 1.7% of the global tea area. An estimated 120,000 metric tons of tea were produced, representing 2% of the global tea production volume. The largest UTZ tea areas were in India (over 33,000 hectares) and Kenya (11,300 hectares), accounting for nearly 66% of the total UTZ tea area. Between 2011 and 2016, the UTZ-certified area almost trebled, and grew by nearly 42% between 2015 and 2016 alone.
For tables of VSS-compliant tea production, see the appendix with data tables by country.
32. Multiple certification: Many of the areas certified by VSS are multiple-certified. An average between the maximum and minimum area provides an estimate of the possible VSS area for a given product. The maximum would be the sum of the total area/production provided by the individual VSS in the country, and the minimum would be the area of the VSS with the largest area in the country.
33. In total, 107,910 hectares of organic tea were certified in 2016 (including in-conversion areas), representing 2.5% of the global tea area (Willer/Lernoud, 2018)
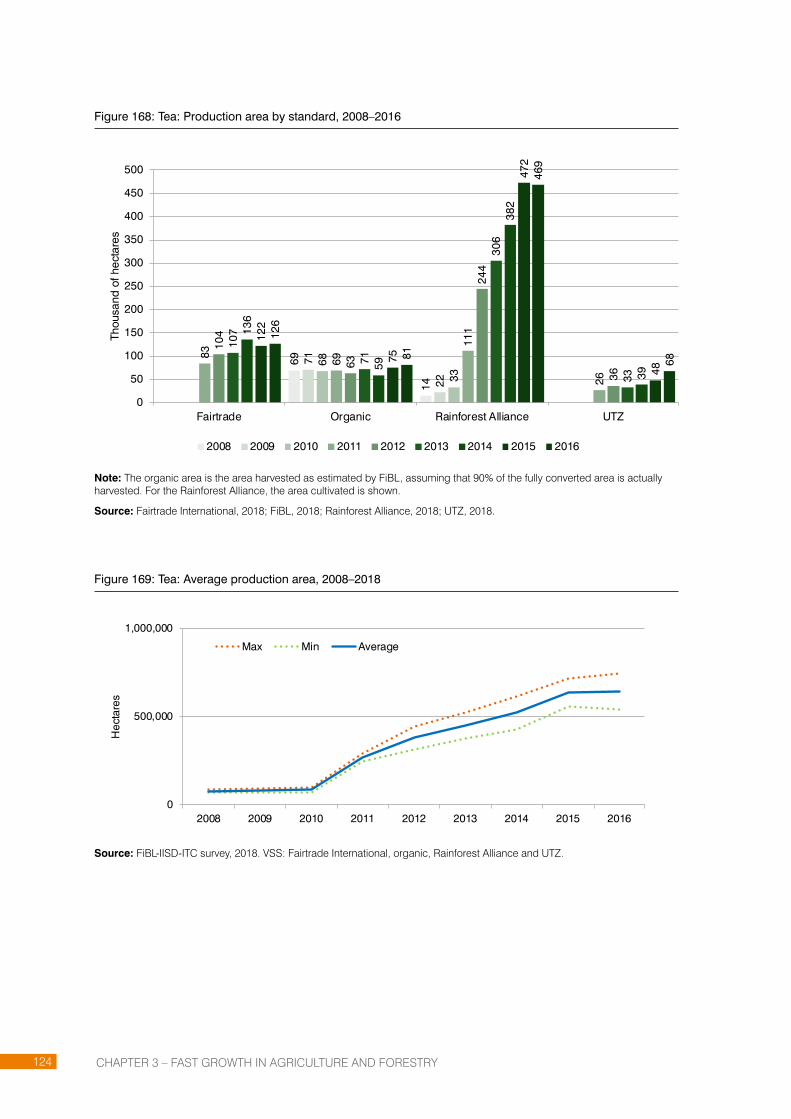
CHAPTER 3 – FAST GROWTH IN AGRICULTURE AND FORESTRy124
Figure 168: Tea: Production area by standard, 2008–2016
69
14
71
22
68
33
83
69
111
26
104
63
244
36
107
71
306
33
136
59
382
39
122
75
472
48
126
81
469
68
0
50
100
150
200
250
300
350
400
450
500
Fairtrade Organic Rainforest Alliance UTZ
Thou
sand
of h
ecta
res
2008 2009 2010 2011 2012 2013 2014 2015 2016
Note: The organic area is the area harvested as estimated by FiBL, assuming that 90% of the fully converted area is actually harvested. For the Rainforest Alliance, the area cultivated is shown.
Source: Fairtrade International, 2018; FiBL, 2018; Rainforest Alliance, 2018; UTZ, 2018.
Figure 169: Tea: Average production area, 2008–2018
0
500,000
1,000,000
2008 2009 2010 2011 2012 2013 2014 2015 2016
Hec
tare
s
Max Min Average
Source: FiBL-IISD-ITC survey, 2018. VSS: Fairtrade International, organic, Rainforest Alliance and UTZ.
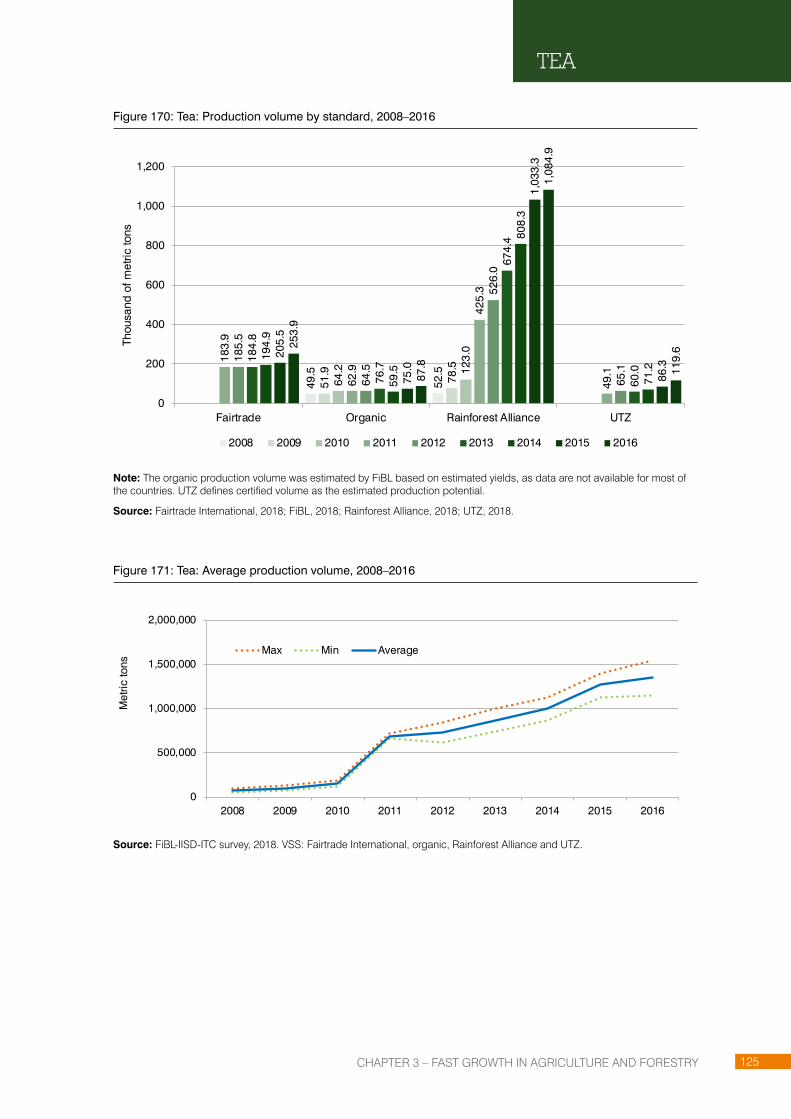
CHAPTER 3 – FAST GROWTH IN AGRICULTURE AND FORESTRy 125
Figure 170: Tea: Production volume by standard, 2008–2016
49.5
52.5
51.9
78.5
64.2 12
3.0
183.
9
62.9
425.
3
49.1
185.
5
64.5
526.
0
65.1
184.
8
76.7
674.
4
60.0
194.
9
59.5
808.
3
71.2
205.
5
75.0
1,03
3.3
86.3
253.
9
87.8
1,08
4.9
119.
6
0
200
400
600
800
1,000
1,200
Fairtrade Organic Rainforest Alliance UTZ
Thou
sand
of m
etric
tons
2008 2009 2010 2011 2012 2013 2014 2015 2016
Note: The organic production volume was estimated by FiBL based on estimated yields, as data are not available for most of the countries. UTZ defines certified volume as the estimated production potential.
Source: Fairtrade International, 2018; FiBL, 2018; Rainforest Alliance, 2018; UTZ, 2018.
Figure 171: Tea: Average production volume, 2008–2016
0
500,000
1,000,000
1,500,000
2,000,000
2008 2009 2010 2011 2012 2013 2014 2015 2016
Met
ric to
ns
Max Min Average
Source: FiBL-IISD-ITC survey, 2018. VSS: Fairtrade International, organic, Rainforest Alliance and UTZ.
TEA

CHAPTER 3 – FAST GROWTH IN AGRICULTURE AND FORESTRy126
Figure 172: Tea: Fairtrade International – Top countries by area, 2016
2,215
7,359
8,588
9,069
20,668
21,030
54,084
0 10,000 20,000 30,000 40,000 50,000 60,000
China
Malawi
Tanzania
Sri Lanka
Uganda
India
Kenya
Hectares
Source: Fairtrade International, 2018.
Figure 173: Tea: Organic – Top 10 countries by area, 2016
650
850
1,200
1,700
2,500
3,100
3,500
3,500
14,150
47,000
0 10,000 20,000 30,000 40,000 50,000
Sri Lanka
Thailand
Nepal
Japan
Indonesia
Viet Nam
Myanmar
Turkey
India
China
Hectares
Note: The organic area harvested was estimated by FiBL based on the assumption that 90% of the fully converted area is actually harvested.
Source: FiBL, 2018. Based on national data sources and data from certifiers.

CHAPTER 3 – FAST GROWTH IN AGRICULTURE AND FORESTRy 127
Figure 174: Tea: Rainforest Alliance – Top 10 countries by area, 2016
8,392
11,287
12,227
16,197
18,398
19,599
29,775
31,636
108,487
186,623
0 50,000 100,000 150,000 200,000
Burundi
Argentina
Tanzania
Rwanda
Turkey
Malawi
Indonesia
Sri Lanka
India
Kenya
Hectares
Source: Rainforest Alliance, 2018.
Figure 175: Tea: UTZ – Top 10 countries by area, 2016
52
722
1,040
1,687
4,109
4,420
4,537
6,687
11,323
33,066
0 5,000 10,000 15,000 20,000 25,000 30,000 35,000
Colombia
Argentina
China
Zimbabwe
Indonesia
Malawi
Sri Lanka
South Africa
Kenya
India
Hectares
Source: UTZ, 2018.
TEA

CHAPTER 3 – FAST GROWTH IN AGRICULTURE AND FORESTRy128
Figure 176: Tea: Fairtrade-certified area by region, 2016
Source: Fairtrade International, 2018.
Figure 177: Tea: Organic-certified area by region, 2016
Note: The organic area harvested was estimated by FiBL based on the assumption that 90% of the fully converted area is actually harvested.
Source: FiBL, 2018.
Figure 178: Tea: Rainforest Alliance-certified area by region, 2016
Source: Rainforest Alliance, 2018.
Figure 179: Tea: UTZ-certified area by region, 2016
Source: UTZ, 2018.
Africa55%
Asia38%
Europe4%
Latin America3%
Asia63%
Africa36%
Latin America1%
Asia94%
Europe4%
Africa1% Latin America
1%
ORGANIC
Africa72%
Asia26%
Other/No details2%
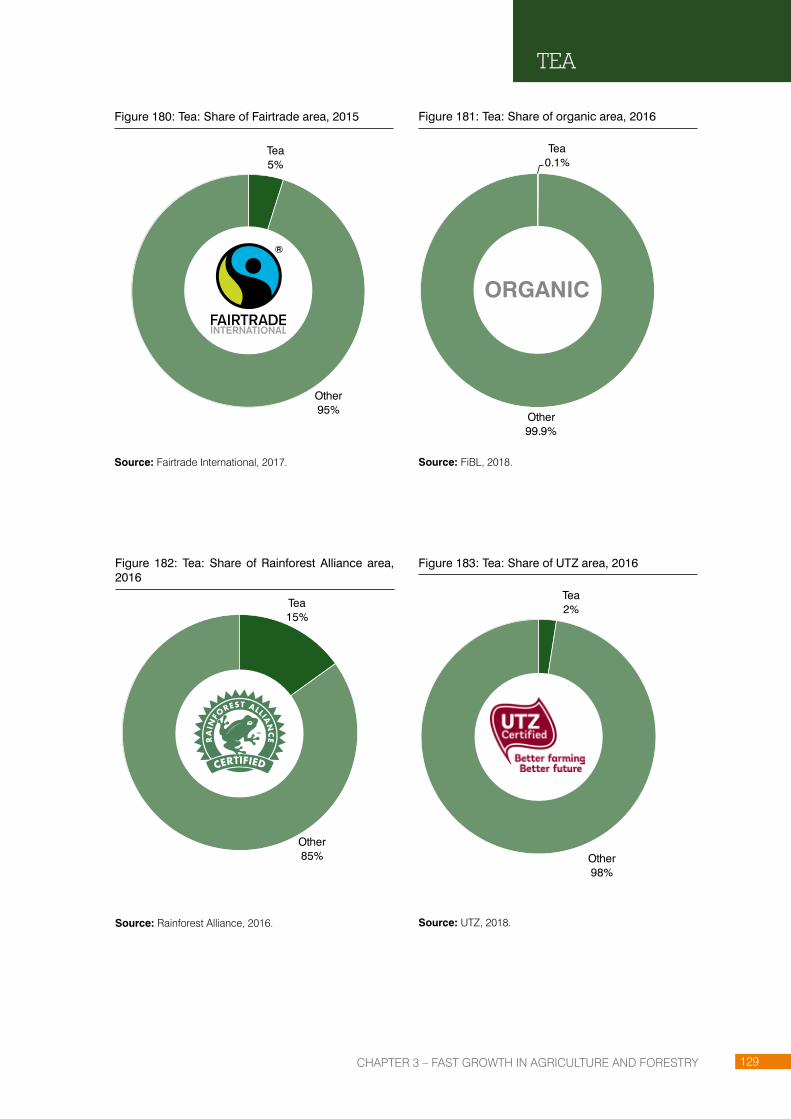
CHAPTER 3 – FAST GROWTH IN AGRICULTURE AND FORESTRy 129
TEA
Figure 180: Tea: Share of Fairtrade area, 2015
Source: Fairtrade International, 2017.
Figure 181: Tea: Share of organic area, 2016
Source: FiBL, 2018.
Figure 182: Tea: Share of Rainforest Alliance area, 2016
Source: Rainforest Alliance, 2016.
Figure 183: Tea: Share of UTZ area, 2016
Source: UTZ, 2018.
Tea15%
Other85%
Tea2%
Other98%
Tea0.1%
Other99.9%
ORGANIC
Tea5%
Other95%

CHAPTER 3 – FAST GROWTH IN AGRICULTURE AND FORESTRy130
FORESTRY
About half of the world’s forests have already been removed
Forests cover 31% of Earth’s land area, account for the employment of nearly 14 million people and contribute to revenues equivalent to 1% of the global gross domestic product (GDP) (FAO, 2016). Additionally, close to 1.6 billion people – more than 25% of the world’s population – rely on forest resources for their livelihoods (FAO, 2015). Trade in forest products was valued at over $227 billion in 2016, half of which was accounted for by pulp and paper products (FAO, 2016).
The top five exporters of forest products (United States, Canada, Germany, China and Sweden) account for 40% of the value of global exports (FAOSTAT, 2018). The top five importers (China, United States, Germany, Japan, United Kingdom) account for 43% of global imports, with China alone representing 16% (FAOSTAT, 2018). About half of the world’s forests have already been removed, and the annual rate of deforestation 34 is currently estimated at 3 million hectares (MacDicken et al., 2015). Sustainable forestry practices could, however, help reduce the pressures being felt by the world’s forests and their communities.
International policy initiatives and trade laws have been a major factor in encouraging the uptake of sustainability standards and traceability more generally. Most notably, the negotiations on the forest principles at the 1992 United Nations Conference on Environment and Development provided a framework from which the major international forest management strategies were developed. These include the FSC and PEFC standards as well as the 2008 amendment to the United States Lacey Act and the European Union’s Forest Law Enforcement, Governance and Trade Action Plan (FLEGT) and Timber Regulation (in 2013), which prohibit the trade of illegally harvested timber (Potts et al., 2014). Forest management standards played an important role in supporting the implementation of such international norms and treaties (Overdevest and Zeitlin, 2014). Major multinationals, including Ikea, Home Depot and Lowes, have made substantial commitments to standards-compliant forestry products (Potts et al., 2014).
34. Deforestation, in other words: Changing the land use from forest to something else is driven by different activities, including land clearing to make space for crops and livestock, mining, roads and dams, in addition to logging.

CHAPTER 3 – FAST GROWTH IN AGRICULTURE AND FORESTRy 131
FORESTRY
Canada has the world’s largest managed forest area
There are almost 4 billion hectares of forest worldwide (FAOSTAT, 2018). The two most important sustainable forestry standards are FSC (196 million hectares) and PEFC (301 million hectares). Together, they accounted for 428 million hectares in 2016, or almost 11% of the global total forest area (including non-productive forest areas).35
Most of the managed certified forest area was in North America (46%), followed by Europe (38%). Canada had the largest area of managed forest area (almost 158 million hectares), followed by the Russian Federation (nearly 47 million hectares) and the United States (almost 40 million hectares).
In 2017, FSC and PEFC agreed to jointly collect and publish data about double certification on a country level in response to requests from stakeholders. According to their findings, in 2018, a total of 431.4 million hectares were certified worldwide, representing a growth of 3.7 million hectares compared with 2016. Of this area, 16.5% was FSC- and PEFC-certified. Double certification exists in 31 countries.
For tables of VSS-compliant forestry, see the appendix with data tables by country.
Figure 184: Forestry: Certified area, 2004–2016
88
428
0
50
100
150
200
250
300
350
400
450
2004 2005 2006 2007 2008 2009 2010 2011 2012 2013 2014 2015 2016
Mill
ion
of h
ecta
res
Note: The totals were adjusted for multiple certification, assuming that 15% is double-certified, based on FSC and PEFC assumptions.
Source: Forest Stewardship Council (FSC), 2004–2017; Programme for the Endorsement of Forest Certification (PEFC), 2004–2017.
35. Multiple certification was taken into account assuming that 15% of the certified area is double-certified.

CHAPTER 3 – FAST GROWTH IN AGRICULTURE AND FORESTRy132
Figure 185: Forestry: Top 10 countries by area, 2016
7,252,860
7,637,823
12,062,713
14,626,340
15,239,000
20,238,037
23,641,816
39,915,623
47,423,715
157,926,998
0 50,000,000 100,000,000 150,000,000 200,000,000
Germany
Brazil
Poland
Belarus
Finland
Sweden
Australia
United States
Russian Federation
Canada
Hectares
Note: The totals were adjusted for multiple certification, assuming that 15% is double-certified, based on FSC and PEFC assumptions.
Source: Forest Stewardship Council (FSC), 2004–2017; Programme for the Endorsement of Forest Certification (PEFC), 2017
Figure 186: Forestry: Certified area by region, 2016
North America46%
Europe38%
Oceania6%
Latin America4%
Asia4%
Africa2%
Note: The totals were adjusted for multiple certification, assuming that 15% is double-certified, based on FSC and PEFC assumptions.
Source: Forest Stewardship Council (FSC), 2004–2017; Programme for the Endorsement of Forest Certification (PEFC), 2017.

TABLE OF CONTENTS FOR CHAPTER ����������������������������������������������������������������������������������������������������������������������p
TABLE OF CONTENTS FOR CHAPTER ������������������������������������������������������������������������������������������������������������������������������������������������� P
TABLE OF CONTENTS FOR CHAPTER ����������������������������������������������������������������������������������������������������������������������p
TABLE OF CONTENTS FOR CHAPTER ����������������������������������������������������������������������������������������������������������������������p
TABLE OF CONTENTS FOR CHAPTER ����������������������������������������������������������������������������������������������������������������������p
CHAPTER 4
METHODOLOGY AND DATA SOURCES
METHODOLOGY ���������������������������������������������������������������������������������������������������������������������������������������������������� 136
DATA SOURCES ������������������������������������������������������������������������������������������������������������������������������������������������������ 139
KEY ISSUES AND SUGGESTIONS IN DATA COLLECTION ������������������������������������������������������������������������������ 140

CHAPTER 4 – METHODOLOGy AND DATA SOURCES136
METHODOLOGY
The data presented in this report were obtained either directly from the standard-setting organizations or indirectly from published annual reports and other literature. For organic agriculture, data were gathered from private-sector organizations, governments and certification bodies as part of the annual survey of FiBL on organic agriculture worldwide (Willer/Lernoud, 2018). The data collection process, voluntary sustainability standards, indicators and commodities covered, as well as the quality checks carried out, are described below.
In October 2017, FiBL and IISD sent a standardized questionnaire to all the standards organizations. All of them returned data, but not consistently across all the indicators requested and not on all the commodities for 2016.
Focus on commodities
The focus was on the same crops as those presented in previous editions of The State of Sustainable Markets (Lernoud et al., 2017): bananas, cocoa, coffee, cotton, oil palm, soy, sugarcane and tea, as well as forestry. The standards organizations were also asked to provide data on additional crops covered by their standard and on the total certified area.
STANDARDS36
The following voluntary standards were analysed:
� 4C (previously 4C Association) � Better Cotton Initiative (BCI) � Bonsucro � Cotton made in Africa (CmiA) � Fairtrade International � Forest Stewardship Council (FSC) � GLOBALG.A.P. � IFOAM – Organics International37 � Programme for the Endorsement of Forest Certification (PEFC) � ProTerra Foundation � Rainforest Alliance (RA) � Roundtable on Sustainable Palm Oil (RSPO) � Round Table on Responsible Soy (RTRS) � UTZ.
36. For more information on the standards, see the ITC Standards Map website, www.sustainabilitymap.org.
37. Not all production considered organic is actually compliant with IFOAM norms. IFOAM – Organic International is nevertheless the leading global reference for defining organic standards. Market data on organic production and trade include all recognized organic production regardless of whether the production complies with IFOAM criteria per se.

CHAPTER 4 – METHODOLOGy AND DATA SOURCES 137
Focus on commodities
The standards organizations surveyed for this report were asked to provide data on the indicators below:
Indicator Definition Unit of measure
Area
Area Area certified (fully converted plus under conversion) Hectares
Area cultivated Area that was cultivated Hectares
Harvested area Area actually harvested Hectares
Production
Production valueValue of production volume that is VSS-compliant, even if not sold as
compliant at the first point of sale$ million
Production volumeProduction volume that is VSS-compliant, even if not sold as
compliant at the first point of saleMetric tons
Production volume sold under a VSS label
Volume of VSS-compliant product that is sold as compliant at the first point of sale (e.g. from cooperative to trader)
Metric tons
Operators
Certificate holder Total number of current valid certificates and in process No.
Processor
Operator who preserves and/or processes agricultural or forestry products (including slaughtering and butchering) and aquaculture
products. Packaging and labelling as VSS-compliant is also considered as processing.
No.
Producer
Production unit operated under a single management for the purpose of producing agricultural products (including processing, packaging and initial labelling of own crop and livestock products
on the farm). This includes the producers organized under a group, resource manager, community or cooperative certificate, and/or
those producing, collecting or gathering for a supply chain covered by a standard.
No.
Domestic Sales
Domestic sales value Domestic sales in $ million $ million
Domestic sales volume Domestic sales in metric tons Metric tons
International Trade
Export value Value of VSS-compliant product that is exported $ million
Export volume Volume of VSS-compliant product that is exported Metric tons
Import value Value of VSS-compliant product that is imported $ million
Import volume Volume of VSS-compliant product that is imported Metric tons
Multiple Certifications
Multiple certification – Area harvested
Percentage of VSS-compliant area harvested that is compliant under more than one VSS certification
%
This publication focuses on those indicators for which data were provided by all VSS: area, area harvested, production volume, producers/operators.
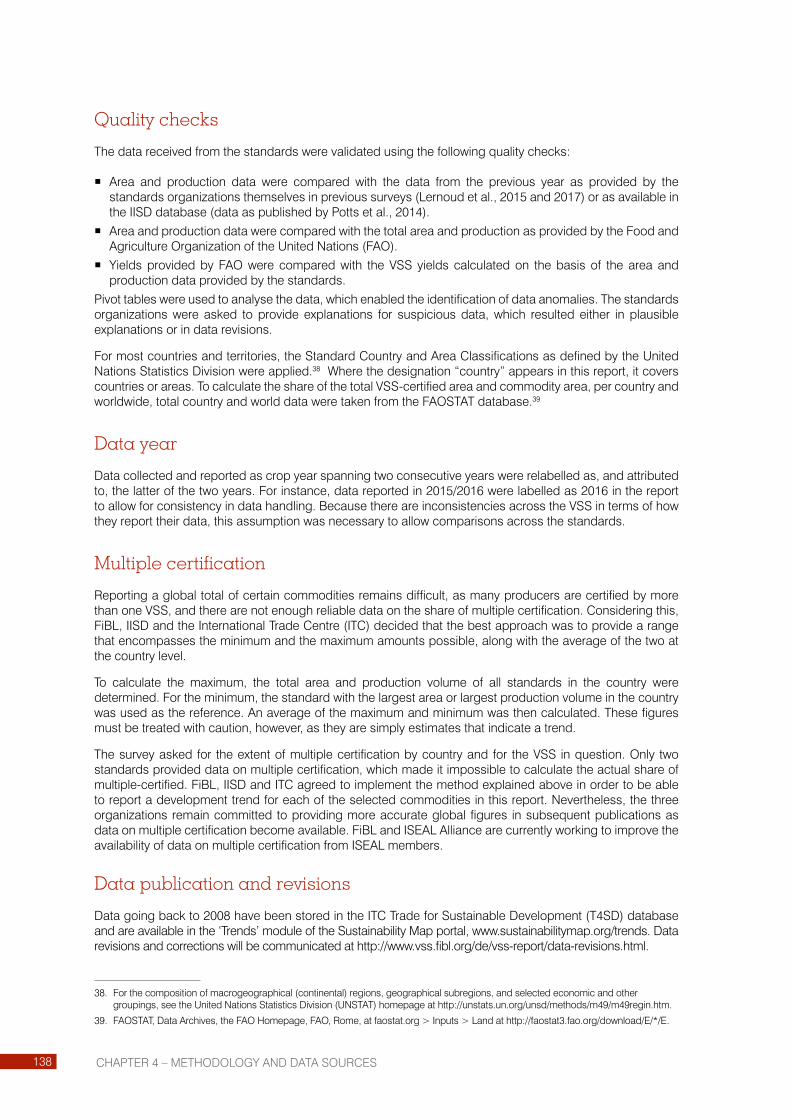
CHAPTER 4 – METHODOLOGy AND DATA SOURCES138
Quality checks
The data received from the standards were validated using the following quality checks:
� Area and production data were compared with the data from the previous year as provided by the standards organizations themselves in previous surveys (Lernoud et al., 2015 and 2017) or as available in the IISD database (data as published by Potts et al., 2014).
� Area and production data were compared with the total area and production as provided by the Food and Agriculture Organization of the United Nations (FAO).
� yields provided by FAO were compared with the VSS yields calculated on the basis of the area and production data provided by the standards.
Pivot tables were used to analyse the data, which enabled the identification of data anomalies. The standards organizations were asked to provide explanations for suspicious data, which resulted either in plausible explanations or in data revisions.
For most countries and territories, the Standard Country and Area Classifications as defined by the United Nations Statistics Division were applied.38 Where the designation “country” appears in this report, it covers countries or areas. To calculate the share of the total VSS-certified area and commodity area, per country and worldwide, total country and world data were taken from the FAOSTAT database.39
Data year
Data collected and reported as crop year spanning two consecutive years were relabelled as, and attributed to, the latter of the two years. For instance, data reported in 2015/2016 were labelled as 2016 in the report to allow for consistency in data handling. Because there are inconsistencies across the VSS in terms of how they report their data, this assumption was necessary to allow comparisons across the standards.
Multiple certification
Reporting a global total of certain commodities remains difficult, as many producers are certified by more than one VSS, and there are not enough reliable data on the share of multiple certification. Considering this, FiBL, IISD and the International Trade Centre (ITC) decided that the best approach was to provide a range that encompasses the minimum and the maximum amounts possible, along with the average of the two at the country level.
To calculate the maximum, the total area and production volume of all standards in the country were determined. For the minimum, the standard with the largest area or largest production volume in the country was used as the reference. An average of the maximum and minimum was then calculated. These figures must be treated with caution, however, as they are simply estimates that indicate a trend.
The survey asked for the extent of multiple certification by country and for the VSS in question. Only two standards provided data on multiple certification, which made it impossible to calculate the actual share of multiple-certified. FiBL, IISD and ITC agreed to implement the method explained above in order to be able to report a development trend for each of the selected commodities in this report. Nevertheless, the three organizations remain committed to providing more accurate global figures in subsequent publications as data on multiple certification become available. FiBL and ISEAL Alliance are currently working to improve the availability of data on multiple certification from ISEAL members.
Data publication and revisions
Data going back to 2008 have been stored in the ITC Trade for Sustainable Development (T4SD) database and are available in the ‘Trends’ module of the Sustainability Map portal, www.sustainabilitymap.org/trends. Data revisions and corrections will be communicated at http://www.vss.fibl.org/de/vss-report/data-revisions.html.
38. For the composition of macrogeographical (continental) regions, geographical subregions, and selected economic and other groupings, see the United Nations Statistics Division (UNSTAT) homepage at http://unstats.un.org/unsd/methods/m49/m49regin.htm.
39. FAOSTAT, Data Archives, the FAO Homepage, FAO, Rome, at faostat.org > Inputs > Land at http://faostat3.fao.org/download/E/*/E.

CHAPTER 4 – METHODOLOGy AND DATA SOURCES 139
KEY ISSUES AND SUGGESTIONS IN DATA COLLECTION
In a context where access to sustainable markets tends to be concentrated in more developed economies, policymakers, producers and businesses need better quality and transparent information to facilitate strategic planning. Areas where such data are both deeply needed and feasible include the following:
� Prices and markets: Pricing, particularly at the producer level, is extremely variable and poorly documented. Better pricing information could help producers make the right investments at the right time and/or determine the appropriate timing for bringing goods to market.
� Trade data: Trade statistics are a critical reference point in the development of international trade policy and trade-dependent industrial policy. The absence of trade data on certified products renders the relevant standards (and the practices they embody) effectively invisible within the policy-planning context. As a result, the global community misses out on critical opportunities to proactively promote better practices through more strategic planning and policies related to certified products and their effectiveness.
� Consumption data: A better understanding of the distribution of consumption, and of consumer demographics, could facilitate public planning for expanding the market presence of products employing preferred practices. However, retail-level data are typically held closely by companies, thereby limiting the potential of complementary public or development policy to match consumer preferences appropriately. Global retail data are currently available only for organic and Fairtrade products.
Better data on these and other parameters are unlikely to become available without real political and financial commitment. A shortlist of some of the more promising avenues for action would include:
� Expansion of reporting and transparency requirements for certified producers: Adoption of a coordinated approach to the specification and collection of data related to key parameters among standard-setters would be a major step towards computing accurate regional and global production levels.
� Expansion of Harmonized System (HS) coding system to include HS codes for certified goods: The International Convention on the Harmonized System (HS), which establishes a harmonized nomenclature for products so that trade statistics can be gathered and compiled at the global level, currently offers no means for differentiating between certified and uncertified products. As a result, national trade statistics remain unavailable for certified products. The elaboration of certification-specific HS codes could rely on internationally agreed norms of good practice as a basis for determining where such codes are warranted and where they are not. The elaboration of HS codes for certified products would substantially enhance market and trade data on such products.
� Expanded corporate reporting: Retail data are typically held closely by individual companies and are therefore often inaccessible to the public or policymakers. Standards initiatives, Governments and/or companies themselves could establish rules (tied to licensing, sales or voluntary precompetitive agreements) requiring companies to make certain data available on an anonymous basis for use in statistical analyses.
� National statistics on sustainable consumption: Countries could use their national statistics bureaus to conduct surveys enabling a deeper understanding of consumer preferences related to sustainable consumption. Harmonizing survey methods and mapping national consumer preferences onto actual sales could provide an important reference point for market actors seeking to leverage consumer preferences for their respective green growth strategies.

CHAPTER 4 – METHODOLOGy AND DATA SOURCES140
DATA SOURCES
� 4C: For 2008–2012, 4C data as quoted by Potts et al., 2014. For 2013–2015, data were provided by Juan Carlos Isaza, Standards Manager, George Watane, Global Coffee Platform (GCP) (www.globalcoffeeplatform.org), Bonn, Germany. For 2016 onwards, data were provided by Gustavo Bacchi, Coffee Assurance Services, Bonn, Germany (www.cas-veri.com).
� Better Cotton Initiative: For 2008–2012, BCI data as quoted by Potts et al., 2014. For 2013–2016, data were provided by Kendra Pasztor, Monitoring and Evaluation Manager, and Shannon Avison, Data Analyst, BCI, Geneva, Switzerland, www.bettercotton.org.
� Bonsucro: For 2008–2012, Bonsucro data as quoted by Potts et al., 2014. For 2013–2016, data were provided by Nicolas Viart, Head of Sustainability, and Nahuel Tuñon, Insights Analyst, Bonsucro, London, United Kingdom, www.bonsucro.com.
� Cotton made in Africa: For 2008–2011, CmiA data as quoted by Potts et al., 2014. For 2012–2015, data were provided by Maria-Verena Spohler-Kouoh, Project Manager, CmiA, Hamburg, Germany, www.cottonmadeinafrica.org.
� Fairtrade International: For 2011–2016, data were provided by Daniel Castro, Data Operations Manager, Fairtrade International, Bonn, Germany, www.fairtrade.net. Market data based on Fairtrade International Annual Reports 2005–2016, available at https://www.fairtrade.net/about-fairtrade/annual-reports.html. Fairtrade data have been revised, and the figures reported here might differ from previous Fairtrade International reports.
� Forest Stewardship Council International: Data were provided by Marion Karmann, Monitoring and Evaluation Program Manager, and Rob Ukkerman, FSC International, Bonn, Germany. FSC Annual Reports 2004–2017, www.fsc.org.
� GLOBALG.A.P.: Data were provided by Claudia Meifert, Data Mining and Statistic Support, GLOBALG.A.P, Cologne, Germany. Data from 2012–2016.
� Organic: FiBL surveys among national data providers and certifiers. Based on the data on the certified area, FiBL estimates the area harvested and the production volume. For full list of original data sources, see www.organic-world.net/yearbook. Contact: Julia Lernoud and Helga Willer, FiBL, Frick, Switzerland, [email protected] and [email protected]. The organic cotton data were provided by Liesl Truscott and Evonne Tan, Textile Exchange, United Kingdom, http://farmhub.textileexchange.org/.
� Programme for the Endorsement of Forest Certification: Data were provided by Thorsten Arndt, PEFC International, Geneva, Switzerland, www.pefc.org ; PEFC annual reports from 2005–2016.
� ProTerra Foundation: For 2008–2012, ProTerra Foundation data as quoted by Potts et al., 2014. For 2013–2016, data were provided by Augusto Freire, President, ProTerra Foundation, Brasilia, Brazil, www.proterrafoundation.org.
� Rainforest Alliance: For 2008–2012, RA data as quoted by Potts et al., 2014. For 2013 and 2014, data were provided by Joseph Cameron Booth, Assistant Market Transformation, Rainforest Alliance, London, United Kingdom, www.rainforest-alliance.org. For 2015 and 2016, data were provided by Andrea Valenzuela, Associate Certification Program, Landscapes & Livelihoods, Rainforest Alliance, San José, Costa Rica.
� Roundtable on Sustainable Palm Oil: For 2008–2012, RSPO data as quoted by Potts et al., 2014. For 2013–2016, data were provided by Jan Van Driel, RSPO Head of Certification, Roundtable on Sustainable Palm Oil, Kuala Lumpur, Malaysia, www.rspo.org.
� Round Table on Responsible Soy: For 2008–2012, RTRS data as quoted by Potts et al., 2014. For 2013–2016, data were provided by Daniel Kazimierski and Laura Villegas, Communications Officer, Round Table on Responsible Soy, Ciudad Autónoma de Buenos Aires, Argentina, www.responsiblesoy.org.
� UTZ: For 2008–2012, UTZ data as quoted by Potts et al., 2014. For 2013–2015, data were provided by Elisa Trepp, Data Analyst, and Anne Dullemeijer, Data Analyst, UTZ, Amsterdam, Netherlands, www.utz.org.


TABLE OF CONTENTS FOR CHAPTER ����������������������������������������������������������������������������������������������������������������������p
TABLE OF CONTENTS FOR CHAPTER ������������������������������������������������������������������������������������������������������������������������������������������������� P
TABLE OF CONTENTS FOR CHAPTER ����������������������������������������������������������������������������������������������������������������������p
TABLE OF CONTENTS FOR CHAPTER ����������������������������������������������������������������������������������������������������������������������p
TABLE OF CONTENTS FOR CHAPTER ����������������������������������������������������������������������������������������������������������������������p
APPENDIX I
GEOGRAPHIC OVERVIEW BY PRODUCT AND STANDARD
BANANAS ���������������������������������������������������������������������������������������������������������������������������������������������������������������� 142
COCOA ������������������������������������������������������������������������������������������������������������������������������������������������������������������� 145
COFFEE ������������������������������������������������������������������������������������������������������������������������������������������������������������������� 147
COTTON ������������������������������������������������������������������������������������������������������������������������������������������������������������������ 151
OIL PALM ����������������������������������������������������������������������������������������������������������������������������������������������������������������� 153
SOY �������������������������������������������������������������������������������������������������������������������������������������������������������������������������� 154
SUGARCANE ���������������������������������������������������������������������������������������������������������������������������������������������������������� 156
TEA ��������������������������������������������������������������������������������������������������������������������������������������������������������������������������� 158
FORESTRY ��������������������������������������������������������������������������������������������������������������������������������������������������������������� 160

APPENDIX I – GEOGRAPHIC OVERVIEW By PRODUCT AND STANDARD144
BANANAS
Table 16: Bananas: Fairtrade International 2016
Country Area [ha]Share of total
banana area [%]Production volume
[MT]Producers [no.]
Colombia 5,414 6.4% 190,579 385
Dominican Republic 12,588 46.9% 229,330 1,959
Ecuador 5,210 2.9% 73,252 708
Peru 6,797 69.0% 155,515 6,935
Other world 6,477 - 182,275 720
World 36,487 0.7% 830,951 10,707
Note: The totals include data from other countries.
Source: Fairtrade International, 2018.
Table 17: Bananas: GLOBALG.A.P. 2016
Country or economy Area [ha]Share of total banana
area [%]Producers [no.]
Brazil 1'967 0.4 15
Cameroon - - 3
Colombia 42'548 50.3 579
Costa Rica 26'240 61.9 82
Côte d'Ivoire 22 0.3 9
Dominican Republic 15'668 58.4 1'373
Ecuador 69'145 38.3 981
Egypt - - 2
France 23 - 9
Ghana - - 3
Guadeloupe (France) 21 0.8 7
Guatemala 22'260 28.5 18
Honduras 10'483 42.9 21
India n.a. n.a. 1
Indonesia - - 1
Kenya - - 1
Lebanon - - 3
Martinique (France) 3'327 56.8 72
Mexico 4'404 5.6 22
Nicaragua - - 4
Panama - - 2
Peru 6'216 63.1 5'323
Philippines 20 0.004 6
Puerto Rico - - 1
Saint Lucia 12 3.4 248
Saint Vincent/Grenadines 4 0.1 29
South Africa 6'111 116.4 19
Spain 18 0.2 349
Sri Lanka 5 - 30

APPENDIX I – GEOGRAPHIC OVERVIEW By PRODUCT AND STANDARD 145
Country or economy Area [ha]Share of total banana
area [%]Producers [no.]
Suriname - - 1
Swaziland - - 2
Thailand - - 4
Turkey 7 0.1 5
United Arab Emirates - - 2
United Kingdom 8 - 20
Other world 47'012 -
World 252'602 4.6 9'247
Note: n.a means data not available. The totals include data from other countries. *For countries with fewer than five producers, or fewer than two certificate holders, data are not published due to data confidentiality rules.
Source: GLOBALG.A.P., 2018.
Table 18: Bananas: Organic 2016
CountryEstimated area harvested [ha]
Share of total banana area [%]
Estimated production volume [MT]
Argentina 5 0.1% 100
Cameroon 15 0.02% 250
China 50 0.01% 1,500
Colombia 900 1.1% 20,650
Costa Rica 2,700 6.4% 153,400
Côte d'Ivoire 50 0.7% 2,150
Dominican Republic 20,350 75.8% 409,450
Ecuador 13,200 7.3% 154,440
Ghana 50 0.6% 550
Grenada 5 0.6% 15
Guatemala 35 0.04% 1,600
Indonesia 35 0.03% 1,650
Israel 20 0.8% 1,000
Kenya 300 0.5% 6,100
Mexico 3,100 4.0% 89,650
Peru 4,900 49.7% 170,700
Philippines 5,500 1.2% 70,200
Puerto Rico 5 0.3% 250
Senegal 250 16.9% 6,050
Turkey 15 0.2% 700
World 51,485 0.9% 1,090,405
Note: The totals include data from other countries.
Source: FiBL, 2018. Estimates based on national data sources and data from certifiers.
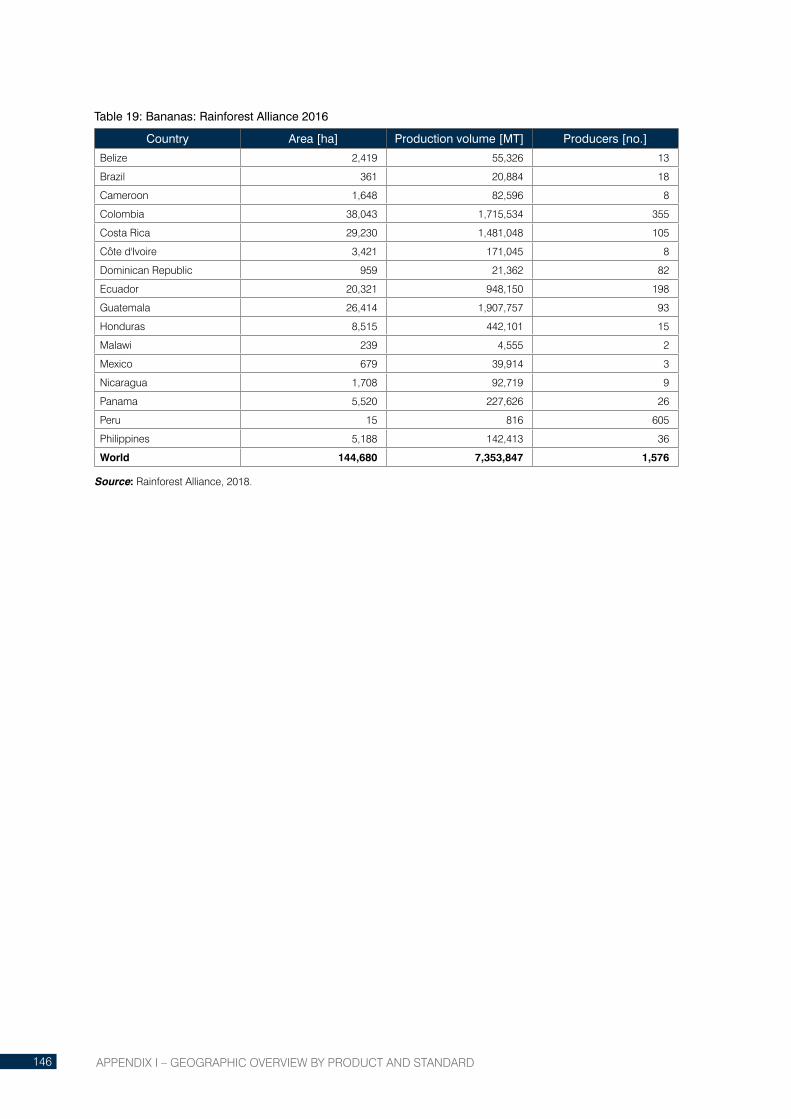
APPENDIX I – GEOGRAPHIC OVERVIEW By PRODUCT AND STANDARD146
Table 19: Bananas: Rainforest Alliance 2016
Country Area [ha] Production volume [MT] Producers [no.]
Belize 2,419 55,326 13
Brazil 361 20,884 18
Cameroon 1,648 82,596 8
Colombia 38,043 1,715,534 355
Costa Rica 29,230 1,481,048 105
Côte d'Ivoire 3,421 171,045 8
Dominican Republic 959 21,362 82
Ecuador 20,321 948,150 198
Guatemala 26,414 1,907,757 93
Honduras 8,515 442,101 15
Malawi 239 4,555 2
Mexico 679 39,914 3
Nicaragua 1,708 92,719 9
Panama 5,520 227,626 26
Peru 15 816 605
Philippines 5,188 142,413 36
World 144,680 7,353,847 1,576
Source: Rainforest Alliance, 2018.
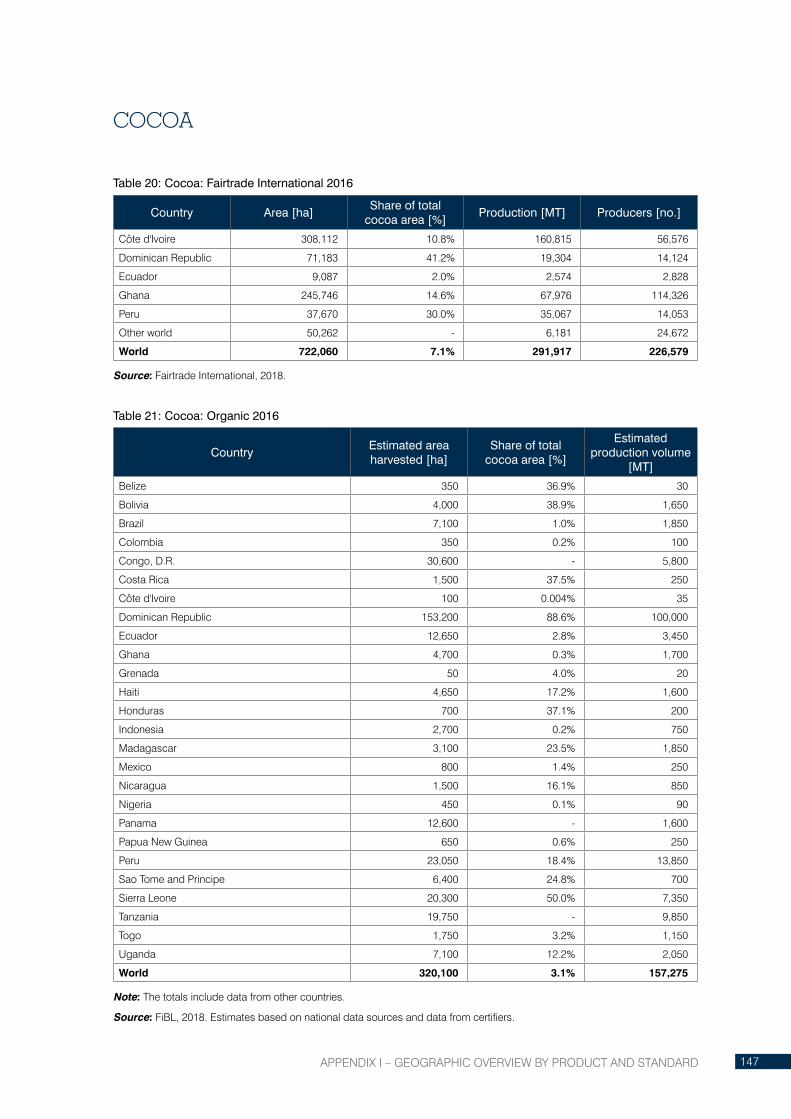
APPENDIX I – GEOGRAPHIC OVERVIEW By PRODUCT AND STANDARD 147
COCOA
Table 20: Cocoa: Fairtrade International 2016
Country Area [ha]Share of total
cocoa area [%]Production [MT] Producers [no.]
Côte d'Ivoire 308,112 10.8% 160,815 56,576
Dominican Republic 71,183 41.2% 19,304 14,124
Ecuador 9,087 2.0% 2,574 2,828
Ghana 245,746 14.6% 67,976 114,326
Peru 37,670 30.0% 35,067 14,053
Other world 50,262 - 6,181 24,672
World 722,060 7.1% 291,917 226,579
Source: Fairtrade International, 2018.
Table 21: Cocoa: Organic 2016
CountryEstimated area harvested [ha]
Share of total cocoa area [%]
Estimated production volume
[MT]
Belize 350 36.9% 30
Bolivia 4,000 38.9% 1,650
Brazil 7,100 1.0% 1,850
Colombia 350 0.2% 100
Congo, D.R. 30,600 - 5,800
Costa Rica 1,500 37.5% 250
Côte d'Ivoire 100 0.004% 35
Dominican Republic 153,200 88.6% 100,000
Ecuador 12,650 2.8% 3,450
Ghana 4,700 0.3% 1,700
Grenada 50 4.0% 20
Haiti 4,650 17.2% 1,600
Honduras 700 37.1% 200
Indonesia 2,700 0.2% 750
Madagascar 3,100 23.5% 1,850
Mexico 800 1.4% 250
Nicaragua 1,500 16.1% 850
Nigeria 450 0.1% 90
Panama 12,600 - 1,600
Papua New Guinea 650 0.6% 250
Peru 23,050 18.4% 13,850
Sao Tome and Principe 6,400 24.8% 700
Sierra Leone 20,300 50.0% 7,350
Tanzania 19,750 - 9,850
Togo 1,750 3.2% 1,150
Uganda 7,100 12.2% 2,050
World 320,100 3.1% 157,275
Note: The totals include data from other countries.
Source: FiBL, 2018. Estimates based on national data sources and data from certifiers.

APPENDIX I – GEOGRAPHIC OVERVIEW By PRODUCT AND STANDARD148
Table 22: Cocoa: Rainforest Alliance 2016
Country Area [ha] Production volume [MT] Producers [no.]
Brazil 574 251 19
Cameroon 2,353 1,702 831
Costa Rica 120 120 1
Côte d'Ivoire 472,172 300,480 174
Dominican Republic 23,981 20,406 5,067
Ecuador 19,439 24,912 2,584
Ghana 128,391 86,267 47,548
India 997 168 828
Indonesia 21,547 20,953 14,794
Nicaragua 70 18 4
Nigeria 7,021 2,863 3,328
Papua New Guinea 3,922 2,003 7,465
Peru 3,320 5,204 1,284
Tanzania 7,981 8,045 23,311
World 692,228 473,480 206,426
Source: Rainforest Alliance, 2018.
Table 23: Cocoa: UTZ 2016
Country Area harvested [ha]Share of total
cocoa area [%]
Estimated production volume
[MT]Producers [no.]
Cameroon 71,590 9.9% 35,526 17,482
Colombia 1,928 1.2% 1,016 405
Côte d'Ivoire 1,143,736 40.1% 661,876 267,757
Dominican Republic 30,302 17.5% 22,056 4,576
Ecuador 53,356 11.7% 59,626 6,897
Ghana 401,487 23.8% 181,365 124,224
Indonesia 76,064 4.5% 58,018 51,090
Nicaragua 1,701 18.3% 621 916
Nigeria 142,999 17.1% 72,955 52,663
Peru 45,083 35.9% 47,871 12,130
Sierra Leone 60,773 - 13,430 22,941
Tanzania 8,969 75.8% 5,458 14,603
Viet Nam 1,391 - 1,931 1,439
Other world 46,676 - 21,661 37,286
World 2,096,939 20.6% 1,188,166 614,508
Source: UTZ, 2018.
*Others include DR of Congo, Liberia, Mexico, Panama, Togo and Uganda.

APPENDIX I – GEOGRAPHIC OVERVIEW By PRODUCT AND STANDARD 149
COFFEE
Table 24: Coffee: 4C 2016
Country Area [ha]Share of total
coffee area [%]Production volume
[MT]Producers [no.]
Brazil 737,430 37.0% 1,385,272 28,980
Burundi 4,766 29.8% 4,243 49,649
Cameroon 4,903 4.7% 4,251 2,922
China 21,275 51.2% 47,630 3,194
Colombia 354,217 40.9% 358,444 130,597
Côte d'Ivoire 59,660 5.6% 36,732 23,808
El Salvador 18,339 13.1% 1,156 162
Ethiopia 11,655 1.7% 6,333 6
Guatemala 5,276 1.9% 4,590 534
Honduras 79,374 20.7% 120,708 15,210
India 8,586 2.2% 10,318 661
Indonesia 150,013 12.2% 86,138 51,475
Kenya 13,225 11.6% 9,130 61,919
Lao P.D.R. 1,452 1.9% 1,554 326
Mexico 51,360 8.0% 42,891 17,256
Nicaragua 12,340 10.3% 12,285 238
Papua New Guinea 6,398 11.8% 4,344 8,086
Peru 48,854 12.7% 48,940 12,364
Philippines 13,192 11.5% 3,854 8,563
Rwanda 2,736 7.8% 2,428 14,204
Tanzania 12,361 5.6% 2,832 14,777
Thailand 15,774 35.4% 14,259 4,050
Uganda 27,397 7.1% 8,946 26,811
Viet Nam 150,177 25.1% 522,530 89,217
Other Africa 921 - 789 2,183
Other Latin America 15,144 - 23,407 2,030
World 1,826,825 16.6% 2,764,002 569,222
Source: Coffee Assurance Services, 2018.
Table 25: Coffee: Fairtrade International 2015
Country Area [ha]Share of total
coffee area [%]Production volume
[MT]Producers [no.]
Bolivia 8,057 26.8% 2,577 2,298
Brazil 65,547 3.1% 87,484 9,571
Colombia 213,382 26.8% 164,676 66,497
Costa Rica 28,794 30.7% 30,653 9,656
Côte d'Ivoire 10,802 4.9% 50 n.a.
Congo, D.R. n.a. - n.a. 14,020
El Salvador n.a. - n.a. 896
Ethiopia 207,975 40.0% 18,025 145,963
Guatemala 24,512 9.8% 12,677 13,969

APPENDIX I – GEOGRAPHIC OVERVIEW By PRODUCT AND STANDARD150
Country Area [ha]Share of total
coffee area [%]Production volume
[MT]Producers [no.]
Honduras 19,019 6.9% 22,242 6,215
India 4,482 1.2% 6,610 21,488
Indonesia 27,712 2.2% 20,344 26,399
Kenya 50,626 46.0% 23,943 171,650
Mexico 117,608 16.8% 30,042 36,974
Nicaragua 59,431 55.0% 29,592 27,508
Papua New Guinea 3,485 5.0% 1,272 2,835
Peru 159,953 40.0% 87,473 45,710
Rwanda 4,540 10.1% 2,670 12,162
Tanzania 167,072 71.7% 4,447 141,799
Uganda 64,369 20.6% 4,755 44,692
Viet Nam 1,137 0.2% 4,730 652
Other African countries 18,694 - 1,747 9,028
Other Asian countries 27,334 - 3,769 23,491
Other Latin American countries
12,675 - 1,123 10,838
World 1,297,206 13.5% 560,902 844,311
Note: n.a means data not available. The 2016 data were not available at the time of publication.
Source: Fairtrade International, 2017.
Table 26: Coffee: Organic 2016
CountryEstimated area harvested [ha]
Share of total coffee area [%]
Estimated production volume [MT]
Bolivia 9,700 41.6% 7,150
Brazil 12,000 0.6% 14,050
Cameroon 50 0.05% 15
Cape Verde 500 - 90
Colombia 7,950 0.9% 5,450
Congo, D.R. 22,600 29.7% 7,100
Costa Rica 650 0.8% 550
Dominican Republic 9,400 11.9% 1,350
Ecuador 2,750 9.2% 350
El Salvador 1,200 0.9% 250
Ethiopia 159,850 22.8% 85,650
Fiji 300 - 150
Guatemala 6,950 2.5% 4,800
Honduras 21,150 5.5% 16,000
India 2,000 0.5% 1,350
Indonesia 81,750 6.7% 42,550
Jamaica 2 0.03% 2
Kenya 1,150 1.0% 450
Lao P.D.R. 1,250 1.6% 1,750
Madagascar 650 0.8% 350
Malawi 50 1.2% 85
Mexico 231,000 35.8% 54'300
Myanmar 30 0.2% 15

APPENDIX I – GEOGRAPHIC OVERVIEW By PRODUCT AND STANDARD 151
CountryEstimated area harvested [ha]
Share of total coffee area [%]
Estimated production volume [MT]
Nepal 800 30.6% 150
Nicaragua 10,450 8.7% 7,950
Panama 850 5.0% 400
Papua New Guinea 14,100 25.9% 12,200
Peru 99,050 25.8% 57,300
Philippines 250 0.2% 150
Rwanda 200 0.6% 90
Sao Tome and Principe 250 25.0% 15
Sierra Leone 29,250 - 74,750
Tanzania 79,250 35.8% 18,700
Thailand 1,250 2.8% 750
Timor-Leste 28,000 52.6% 5,600
Uganda 59,000 15.4% 25,050
United States 100 2.7% 100
World 881,982 8.0% 447,012
Source: FiBL, 2018. Estimates based on national data sources and data from certifiers.
Table 27: Coffee: Rainforest Alliance 2016
Country Area cultivated [ha] Production volume [MT] Producers [no.]
Brazil 76,343 165,114 74
China 326 700 4
Colombia 39,598 66,566 9,674
Costa Rica 22,196 29,308 24
Ecuador 82 87 120
El Salvador 18,494 11,129 544
Ethiopia 40,900 15,166 18,270
Guatemala 23,074 28,017 2,408
Honduras 11,389 28,065 1,444
India 20,164 19,241 3,147
Indonesia 11,752 11,540 9,892
Jamaica 67 35 3
Kenya 14,899 16,406 60,182
Lao P.D.R. 1,576 250 5
Malawi 617 818 2
Mexico 10,346 8,691 1,623
Nicaragua 10,366 16,428 148
Panama 222 328 2
Papua New Guinea 1,553 939 4,302
Peru 35,149 37,494 9,924
Rwanda 5,555 3,897 30,010
Sri Lanka 2 - 2
Tanzania 23,649 7,328 37,886
Uganda 9,362 9,469 27,589
Viet Nam 8,032 30,731 5,587
Zambia 1,553 885 1
World 387,265 508,632 222,850
Source: Rainforest Alliance, 2018.
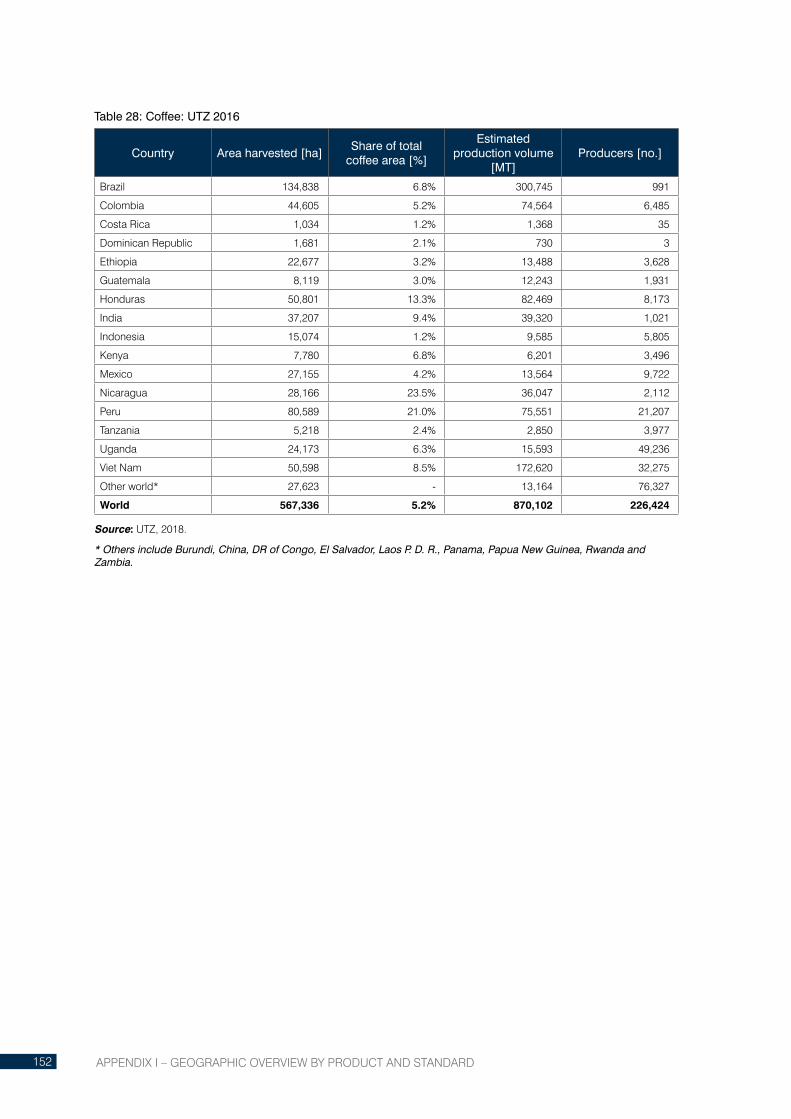
APPENDIX I – GEOGRAPHIC OVERVIEW By PRODUCT AND STANDARD152
Table 28: Coffee: UTZ 2016
Country Area harvested [ha]Share of total
coffee area [%]
Estimated production volume
[MT]Producers [no.]
Brazil 134,838 6.8% 300,745 991
Colombia 44,605 5.2% 74,564 6,485
Costa Rica 1,034 1.2% 1,368 35
Dominican Republic 1,681 2.1% 730 3
Ethiopia 22,677 3.2% 13,488 3,628
Guatemala 8,119 3.0% 12,243 1,931
Honduras 50,801 13.3% 82,469 8,173
India 37,207 9.4% 39,320 1,021
Indonesia 15,074 1.2% 9,585 5,805
Kenya 7,780 6.8% 6,201 3,496
Mexico 27,155 4.2% 13,564 9,722
Nicaragua 28,166 23.5% 36,047 2,112
Peru 80,589 21.0% 75,551 21,207
Tanzania 5,218 2.4% 2,850 3,977
Uganda 24,173 6.3% 15,593 49,236
Viet Nam 50,598 8.5% 172,620 32,275
Other world* 27,623 - 13,164 76,327
World 567,336 5.2% 870,102 226,424
Source: UTZ, 2018.
* Others include Burundi, China, DR of Congo, El Salvador, Laos P. D. R., Panama, Papua New Guinea, Rwanda and Zambia.

APPENDIX I – GEOGRAPHIC OVERVIEW By PRODUCT AND STANDARD 153
COTTON
Table 29: Cotton: Better Cotton Initiative 2016
CountrySeed cotton
area [ha]
Seed cottonshare of total seed
cotton area [%]
Seed cottonproducers
participating in Better Cotton projects [no.]
Cotton lint production volume
[MT]
Australia 62,000 22.1% 76 138,000
Brazil 607,000 60.9% 250 1,050,000
China 401,000 11.9% 62,115 932,000
India 501,000 4.8% 445,065 325,000
Israel 8,000 95.9% 84 14,000
Kazakhstan 2,000 1.8% 43 1,000
Madagascar 7,000 47.3% 4,915 1,000
Mali n.a. - 53,272 n.a.
Mozambique 59,000 58.4% 100,038 9,000
Pakistan 359,000 14.4% 128,393 316,000
Senegal n.a. - 5,036 n.a.
South Africa 7,000 - 1,618 4,000
Tajikistan 13,000 8.0% 1,051 13,000
Turkey 16,000 3.8% 374 30,000
United States 85,000 2.2% 127 109,000
World 2,127,000 7.0% 802,457 2,942,000
Note: n.a means data not available.
Source: Better Cotton Initiative (BCI), 2017.
Table 30: Cotton: Fairtrade International 2016
Country Area [ha]Share of total seed
cotton area [%]Production volume
[MT]Producers [no.]
India n.a - 37,638 35,282
Senegal n.a - 1,920 3,801
Other world n.a - 2,786 8,385
World n.a 3.9% 42,344 47,468
Note: n.a means data not available.
Source: Fairtrade International, 2018. Data on the Fairtrade certified cotton area were not available at the time of publication.

APPENDIX I – GEOGRAPHIC OVERVIEW By PRODUCT AND STANDARD154
Table 31: Cotton: Organic 2016
CountrySeed cotton
Area [ha]
Seed cotton Share of total seed cotton
area [%]
Seed cotton Production
volume [MT]
Seed cotton Producers [no.]
Cotton lintProduction
volume [MT]
Benin 2,507 0.6% 972 2,237 407
Brazil 680 0.1% 48 232 17
Burkina Faso 4,928 0.7% 1,170 8,382 469
China 9,653 0.3% 34,803 3,043 14,817
Egypt 581 1.1% 2,622 584 1,023
India 189,364 1.8% 176,544 192,148 60,184
Israel 100 1.2% 44 1 14
Kyrgyzstan 5,616 33.9% 20,508 119 7,981
Mali 1,970 0.3% 326 1,213 136
Pakistan 1,056 0.04% 1,110 2 366
Peru 337 1.9% 824 141 312
Senegal 66 0.3% 2 169 1
Tajikistan 7,013 4.3% 18,049 1,121 6,620
Tanzania 64,084 20.0% 8,233 4,244 3,229
Thailand 76 0.4% 8 66 3
Turkey 3,733 0.9% 18,942 185 7,577
Uganda 2,428 3.5% 750 6,000 300
United States 8,369 0.2% 12,927 60 4,524
World 302,562 1.0% 297,882 219,947 107,980
Source: Textile Exchange, 2018.

APPENDIX I – GEOGRAPHIC OVERVIEW By PRODUCT AND STANDARD 155
OIL PALM
Table 32: Oil palm: Organic 2016
CountryEstimated area harvested [ha]
Share of total oil palm area [%]
Estimated production volume [MT]
Colombia 1,350 0.4% 19,300
Côte d'Ivoire 400 0.1% 2,550
Ecuador 10 0.004% 100
Ghana 1,550 0.4% 10,850
Madagascar 1,250 68.9% 10,200
Mexico 6,900 11.8% 88,900
Nigeria 5 0.0002% 10
Sierra Leone 50 0.2% 400
World 11,515 0.1% 132,310
Source: FiBL, 2018. Estimates based on national data sources and data from certifiers
Table 33: Oil palm: Rainforest Alliance 2016
Country Area cultivated [ha] Production volume [MT] Producers [no.]
Colombia 13,288 127,085 7
Guatemala 33,754 850,782 76
Honduras 10,490 216,189 31
Indonesia 6,042 103,370 1
World 63,573 1,297,426 119
Source: Rainforest Alliance, 2018.

APPENDIX I – GEOGRAPHIC OVERVIEW By PRODUCT AND STANDARD156
Table 34: Oil palm: Roundtable on Sustainable Palm Oil 2016
CountryOil palm
cultivated area [ha]
Oil palmshare of total oil palm area [%]
Oil palmproduction volume
[MT]*
Palm oilproduction volume
[MT]
Brazil 46,213 32.5% 790,000 137,915
Cambodia 14,072 - 154,338 30,096
Colombia 35,813 10.8% 684,086 140,093
Costa Rica 44,385 61.3% 778,247 191,984
Côte d'Ivoire 7,414 2.8% 66,130 5,000
Ecuador 5,878 2.2% 80,786 10,512
Gabon 5,145 - 77,622 18,629
Ghana 15,785 4.5% 209,562 44,429
Guatemala 27,732 19.4% 777,404 133,687
Honduras 20,286 12.7% 359,933 83,689
Indonesia 1,332,258 14.3% 28,142,512 6,521,589
Madagascar 1,087 60.0% 6,336 1,220
Malaysia 733,785 14.7% 16,632,182 3,663,529
Papua New Guinea 139,105 - 2,780,257 631,587
Solomon Islands 6,198 37.4% 132,296 30,759
Thailand 5,247 0.8% 96,772 19,838
Other world 11,171 - 230,941 46,362
World 2,451,573 11.6% 51,999,404 11,710,919
*Note: Fresh Fruit Bunches (FFB) volume in metric tons. The totals include data from other countries.
Source: Roundtable on Sustainable Palm Oil (RSPO), 2018.

APPENDIX I – GEOGRAPHIC OVERVIEW By PRODUCT AND STANDARD 157
SOY
Table 35: Soybeans: Organic 2016
CountryEstimated area harvested [ha]
Share of total soybean area [%]
Estimated production volume [MT]
Argentina 10,250 0.1% 21,650
Austria 13,200 26.5% 28,300
Benin 150 0.1% 150
Brazil 5,400 0.02% 14,200
Bulgaria 450 3.2% 400
Burkina Faso 1,150 7.2% 1,450
Canada 8,100 0.4% 15,100
China 192,400 2.9% 346,700
Côte d'Ivoire 15 6.5% 15
Croatia 1,400 1.8% 3,050
Czech Republic 250 2.4% 650
Egypt 20 0.2% 50
France 13,900 10.2% 24,200
Germany 3,150 21.0% 8,600
Greece 40 3.3% 100
Hungary 900 1.3% 1,400
India 117,000 1.0% 142,500
Italy 5,250 1.8% 17,750
Japan 800 0.5% 1,450
Kazakhstan 6,550 6.2% 14,250
Lithuania 600 - -
Mali 100 0.5% 45
Mexico 10 0.004% 15
Moldova 350 1.0% 300
Netherlands 5 -
Poland 700 9.3% 1,350
Romania 9,450 7.6% 13,900
Russian Federation 28,400 1.3% 42,000
Serbia 450 0.2% 1,000
Slovakia 250 0.7% 450
Slovenia 25 1.0% 50
Spain 1 0.1% 2
Switzerland 350 19.8% 600
Togo 17,400 - 5,350
Turkey 200 0.5% 850
Ukraine 5,650 0.3% -
United States 45,400 0.1% 111,250
Zambia 50 0.04% 10
World 489,766 0.4% 819,137
Source: FiBL, 2018. Estimates based on national data sources and data from certifiers.
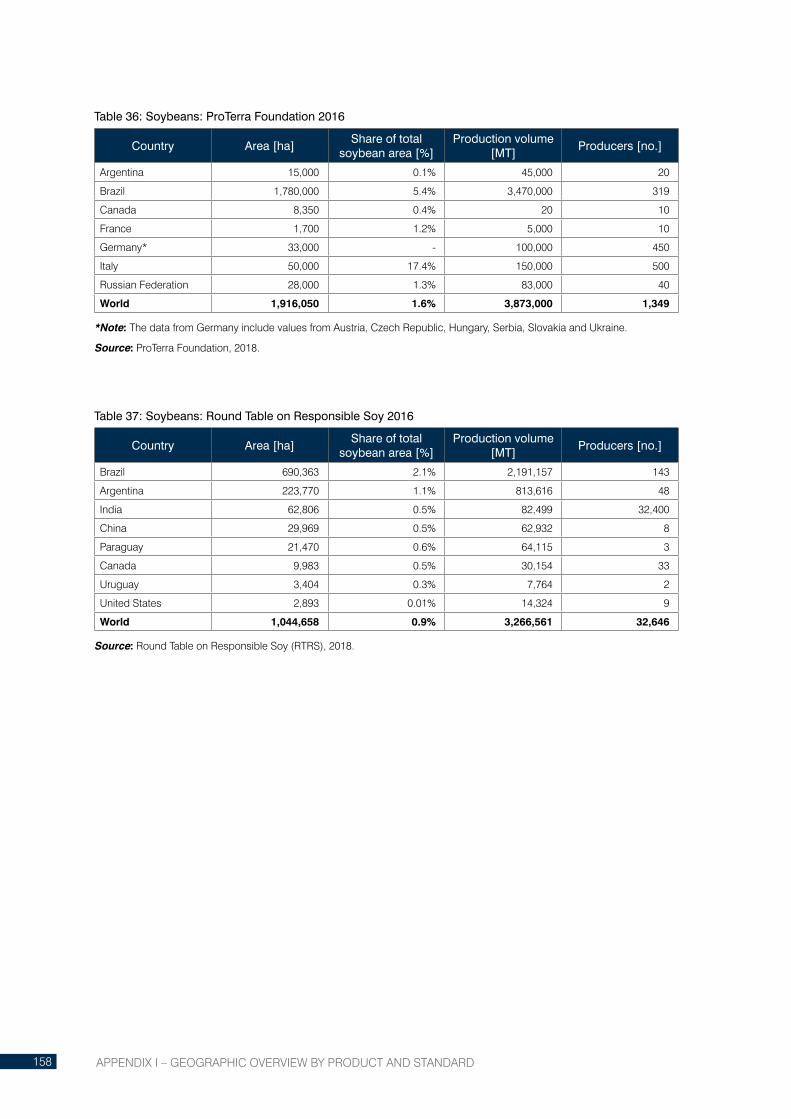
APPENDIX I – GEOGRAPHIC OVERVIEW By PRODUCT AND STANDARD158
Table 36: Soybeans: ProTerra Foundation 2016
Country Area [ha]Share of total
soybean area [%]Production volume
[MT]Producers [no.]
Argentina 15,000 0.1% 45,000 20
Brazil 1,780,000 5.4% 3,470,000 319
Canada 8,350 0.4% 20 10
France 1,700 1.2% 5,000 10
Germany* 33,000 - 100,000 450
Italy 50,000 17.4% 150,000 500
Russian Federation 28,000 1.3% 83,000 40
World 1,916,050 1.6% 3,873,000 1,349
*Note: The data from Germany include values from Austria, Czech Republic, Hungary, Serbia, Slovakia and Ukraine.
Source: ProTerra Foundation, 2018.
Table 37: Soybeans: Round Table on Responsible Soy 2016
Country Area [ha]Share of total
soybean area [%]Production volume
[MT]Producers [no.]
Brazil 690,363 2.1% 2,191,157 143
Argentina 223,770 1.1% 813,616 48
India 62,806 0.5% 82,499 32,400
China 29,969 0.5% 62,932 8
Paraguay 21,470 0.6% 64,115 3
Canada 9,983 0.5% 30,154 33
Uruguay 3,404 0.3% 7,764 2
United States 2,893 0.01% 14,324 9
World 1,044,658 0.9% 3,266,561 32,646
Source: Round Table on Responsible Soy (RTRS), 2018.

APPENDIX I – GEOGRAPHIC OVERVIEW By PRODUCT AND STANDARD 159
SUGARCANE
Table 38: Sugarcane: Bonsucro 2016
Country Area [ha]Share of total
sugarcane area [%]
Cane sugar: Production volume
[MT]Producers [no.]
Australia 40,433 9.0% 335,330 7
Brazil 792,900 7.8% 2,910,000 42
Other world 27,438 - 121,560
World 860,771 3.2% 3,366,890 49
Source: Bonsucro, 2018. The totals include data from other countries.
Table 39: Sugarcane: Fairtrade International 2016
Country Area [ha]Share of total
sugarcane area [%]
Cane sugar: Production volume
[MT]Producers [no.]
Costa Rica 6,276 9.1% 68,264 10,134
India 7,966 0.2% 92,870 4,611
Malawi 6,077 22.4% 55,848 2,380
Mauritius 4,269 8.3% 22,702 4,435
Other world 112,474 - 384,383 29,792
Paraguay 15,929 13.3% 77,454 2,711
World 152,991 0.6% 701,521 54,063
*Note: n.a means data not available.
Source: Fairtrade International, 2018.
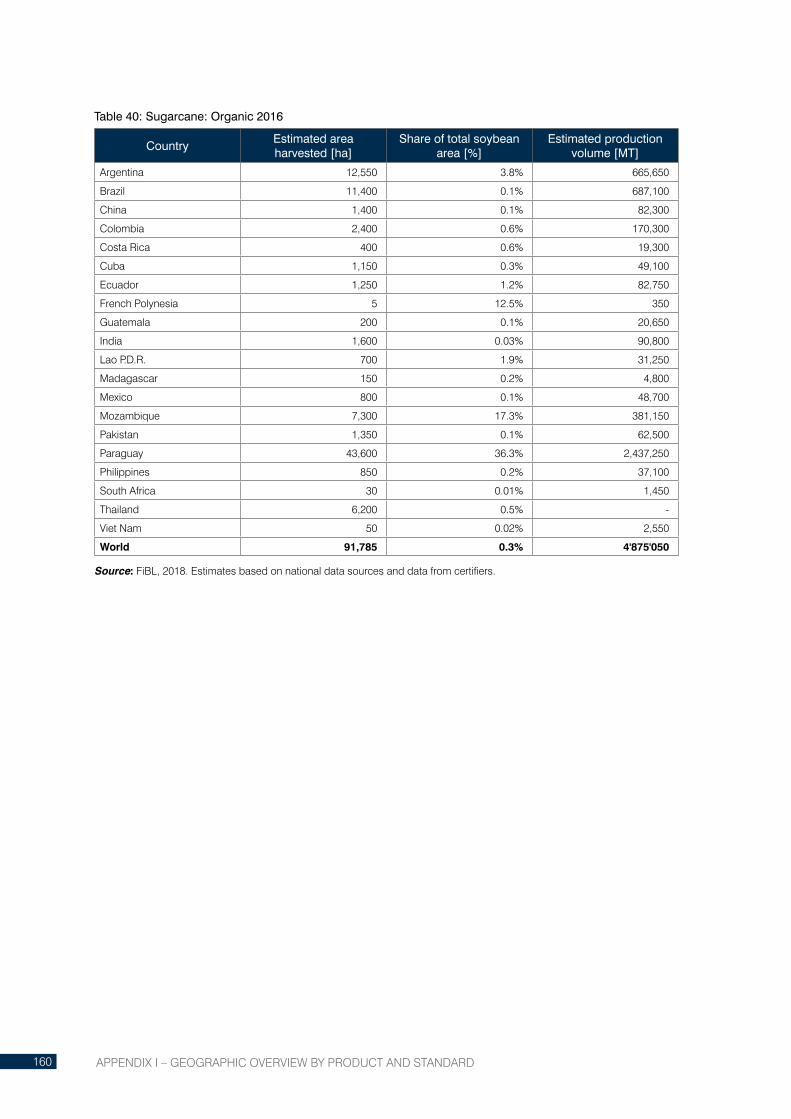
APPENDIX I – GEOGRAPHIC OVERVIEW By PRODUCT AND STANDARD160
Table 40: Sugarcane: Organic 2016
CountryEstimated area harvested [ha]
Share of total soybean area [%]
Estimated production volume [MT]
Argentina 12,550 3.8% 665,650
Brazil 11,400 0.1% 687,100
China 1,400 0.1% 82,300
Colombia 2,400 0.6% 170,300
Costa Rica 400 0.6% 19,300
Cuba 1,150 0.3% 49,100
Ecuador 1,250 1.2% 82,750
French Polynesia 5 12.5% 350
Guatemala 200 0.1% 20,650
India 1,600 0.03% 90,800
Lao P.D.R. 700 1.9% 31,250
Madagascar 150 0.2% 4,800
Mexico 800 0.1% 48,700
Mozambique 7,300 17.3% 381,150
Pakistan 1,350 0.1% 62,500
Paraguay 43,600 36.3% 2,437,250
Philippines 850 0.2% 37,100
South Africa 30 0.01% 1,450
Thailand 6,200 0.5% -
Viet Nam 50 0.02% 2,550
World 91,785 0.3% 4'875'050
Source: FiBL, 2018. Estimates based on national data sources and data from certifiers.

APPENDIX I – GEOGRAPHIC OVERVIEW By PRODUCT AND STANDARD 161
TEA
Table 41: Tea: Fairtrade International 2016
Country Area [ha]Share of total tea
area [%]Production volume
[MT]Producers [no.]
China 2,215 0.1% 3,397 2,599
India 21,030 3.6% 37,270 956
Kenya 54,084 24.8% 149,969 196,625
Malawi 7,359 41.2% 9,203 16,260
Sri Lanka 9,069 3.9% 13,459 4,972
Tanzania 8,588 45.5% 12,817 15,699
Uganda 20,668 70.2% 16,006 16,714
Other world 3,247 - 11,749 5,175
World 126,259 3.1% 253,870 259,000
Source: Fairtrade International, 2018.
Table 42: Tea: Organic 2016
CountryEstimated area harvested [ha]
Share of total tea area [%]
Estimated production volume [MT]
Argentina 50 0.1% 70
Azerbaijan 5 0.8% 10
Bangladesh 500 0.8% 550
Bolivia 150 51.4% 400
China 47,000 2.1% 50,650
Georgia 10 0.4% 10
Guatemala 400 33.7% 200
India 14,150 2.4% 11,000
Indonesia 2,500 2.1% 3,050
Iran 150 0.7% 350
Japan 1,700 3.9% 1,900
Kenya 500 0.2% 650
Lao P.D.R. 350 8.3% 350
Malaysia 25 0.9% 60
Mexico 50 -%
Myanmar 3,500 4.1% 1,700
Nepal 1,200 5.8% 1,400
Russian Federation 35 6.5% 30
Rwanda 400 2.3% 600
Sri Lanka 650 0.3% 600
Taiwan 350 3.0% 250
Tanzania 250 1.3% 300
Thailand 850 10.4% 3,250
Turkey 3,500 4.6% 6,700
Viet Nam 3,100 2.6% 3,750
World 81,375 2.0% 87,830
Source: FiBL, 2018. Estimates based on national data sources and data from certifiers.

APPENDIX I – GEOGRAPHIC OVERVIEW By PRODUCT AND STANDARD162
Table 43: Tea: Rainforest Alliance 2016
Country Area cultivated [ha] Production volume [MT] Producers [no.]
Argentina 11,287 51,869 453
Bangladesh 395 470 1
Burundi 8,392 10,930 50,478
China 5,957 11,246 4,034
Ecuador 435 3,900 1
Ethiopia 2,116 6,771 2
India 108,487 202,836 4,516
Indonesia 29,775 62,457 2,485
Japan 181 645 98
Kenya 186,623 469,446 658,079
Malawi 19,599 49,127 15,705
Nepal 414 380 869
Rwanda 16,197 26,292 28,938
Sri Lanka 31,636 51,320 132
Taiwan 95 307 5
Tanzania 12,227 27,040 15,909
Turkey 18,398 62,787 28,263
Uganda 6,051 19,375 261
Viet Nam 3,369 11,478 2,018
Zimbabwe 6,997 16,236 1,061
World 468,631 1,084,910 813,308
Source: Rainforest Alliance, 2018
Table 44: Tea: UTZ 2016
Country Area harvested [ha]Share of total tea
area [%]
Estimated production volume
[MT]Producers [no.]
China 1,040 0.05% 2,960 449
India 33,066 5.6% 54,548 2,795
Indonesia 4,109 3.5% 7,652 5
Kenya 11,323 5.2% 27,758 8,559
Malawi 4,420 24.7% 11,468 127
South Africa 6,687 - 1,561 7
Sri Lanka 4,537 2.0% 6,666 279
Other world* 2,499 - 7,028 79
World 67,679 1.7% 119,642 12,300
Source: UTZ, 2018.
* Others include Argentina, Colombia, Japan, Viet Nam and Zimbabwe.

APPENDIX I – GEOGRAPHIC OVERVIEW By PRODUCT AND STANDARD 163
FORESTRY
Table 45: Forestry: Forest Stewardship Council 2016
Country Area [ha]Share of total country
forest area [%]Forest management
certificate holders [no.]
Argentina 467,933 1.7% 12
Australia 1,234,904 1.0% 14
Austria 587 0.02% 2
Belarus 8,497,225 - 55
Belgium 1,654 0.2% 1
Belize 197,122 14.4% 2
Bolivia 981,862 1.8% 8
Bosnia and Herzegovina 1,532,625 70.1% 5
Brazil 6,264,561 1.3% 118
Bulgaria 1,079,030 28.2% 18
Cambodia 7,896 0.1% 1
Cameroon 940,945 5.0% 4
Canada 54,682,907 15.8% 68
Chile 2,311,825 13.0% 21
China 852,520 - 76
Colombia 142,886 0.2% 10
Congo, D.R. 2,625,003 1.7% 4
Costa Rica 45,163 1.6% 16
Croatia 2,039,223 - 3
Czech Republic 52,629 - 5
Denmark 213,976 35.0% 5
Dominican Republic 365 0.02% 1
Ecuador 31,718 0.3% 2
Estonia 1,370,289 61.4% 7
Fiji 85,385 8.4% 1
Finland 1,357,012 6.1% 7
France 33,987 0.2% 6
Gabon 2,033,627 8.8% 3
Germany 1,146,324 10.0% 57
Ghana 3,367 0.04% 1
Guatemala 500,263 14.1% 10
Guyana 371,680 2.2% 1
Honduras 17,815 0.4% 1
Hungary 304,354 14.7% 6
India 508,216 0.7% 8
Indonesia 2,846,184 3.1% 33
Ireland 446,647 59.2% 2
Italy 43,271 0.5% 15
Japan 396,341 1.6% 34
Lao P.D.R. 317 0.002% 1
Latvia 1,010,491 30.1% 13
Lithuania 1,089,532 50.0% 43

APPENDIX I – GEOGRAPHIC OVERVIEW By PRODUCT AND STANDARD164
Country Area [ha]Share of total country
forest area [%]Forest management
certificate holders [no.]
Luxembourg 21,446 24.7% 3
Malaysia 676,150 3.0% 12
Mexico 823,042 1.2% 69
Mozambique 50,753 0.1% 2
Namibia 211,861 3.1% 4
Netherlands 170,407 45.3% 4
New Zealand 1,270,598 12.5% 21
Nicaragua 21,783 0.7% 7
Norway 445,626 3.7% 5
Panama 22,077 0.5% 8
Papua New Guinea 37,575 0.1% 3
Paraguay 27,603 0.2% 3
Peru 482,745 0.7% 8
Poland 6,939,230 73.5% 18
Portugal 373,717 11.7% 23
Republic of Korea 391,269 6.3% 8
Romania 2,596,947 37.9% 21
Russian Federation 43,753,261 5.4% 150
Serbia 1,001,347 36.8% 3
Slovakia 146,271 7.5% 8
Slovenia 260,291 20.9% 2
Solomon Islands 40,446 1.9% 2
South Africa 1,394,388 15.1% 20
Spain 1,763,053 9.6% 28
Sri Lanka 17,880 0.9% 3
Suriname 362,740 2.4% 4
Swaziland 124,185 21.2% 4
Sweden 12,259,756 43.7% 24
Switzerland 611,683 48.8% 8
Taiwan 1,437 - 3
Tanzania 172,052 - 3
Thailand 61,830 0.4% 17
Turkey 2,365,753 20.2% 8
Uganda 39,934 1.9% 3
Ukraine 2,880,029 29.8% 50
United Kingdom 1,633,904 52.0% 37
United States 13,706,892 4.4% 111
Uruguay 980,711 53.2% 24
Venezuela 155,839 0.3% 2
Viet Nam 218,883 1.5% 29
World 196,285,055 4.9% 1,462
Source: Forestry Forest Stewardship Council (FSC), 2018.

APPENDIX I – GEOGRAPHIC OVERVIEW By PRODUCT AND STANDARD 165
Table 46: Forestry: Programme for the Endorsement of Forest Certification 2016
Country Area [ha]Share of total country
forest area [%]Certificate holders [no.]
Argentina 22,524 0.1% 18
Australia 26,578,998 21.3% 8
Austria 2,983,873 77.1% 181
Belarus 8,710,234 - 65
Belgium 299,500 43.8% 6
Bolivia - - 8
Bosnia and Herzegovina - - 353
Brazil 2,721,113 0.6% 95
Bulgaria - - 5
Canada 131,113,561 37.8 196
Chile 1,908,549 10.8% 0
China 5,835,980 - 1
Colombia - - 1
Croatia - - 1
Czech Republic 1,780,258 - 225
Denmark 256,700 41.9% 711
Dominican Republic - - 454
Egypt - - 27
Estonia 1,174,151 52.6% 17
Finland 16,571,224 - 294
France 8,206,117 48.3% 6
Germany 7,386,453 64.7% 188
Greece - - 74
Hungary - - 1
India - - 1
Indonesia 1,846,064 2.0% 64
Ireland 376,108 49.9% 41
Israel - - 1
Italy 811,040 8.7% 13
Japan 23,728 0.1% 9
Latvia 1,683,604 50.2% 2,021
Lebanon - - 9
Lithuania - - 2
Luxembourg 33,756 38.9% 1
Macao - - 163
Malaysia 4,034,697 18.2% 5
Mexico - - 3
Monaco - - 21
Morocco - - 17
Netherlands - - 2
New Zealand - - 27
Norway 7,380,750 60.9% 63
Oman - - 69
Papua New Guinea - - 41
Paraguay - - 4

APPENDIX I – GEOGRAPHIC OVERVIEW By PRODUCT AND STANDARD166
Country Area [ha]Share of total country
forest area [%]Certificate holders [no.]
Peru - - 835
Philippines - - 1
Poland 7,252,197 - 287
Republic of Korea - - 212
Romania - - 51
Russian Federation 12,039,345 1.5% 1
Saudi Arabia - - 9
Singapore - - 12
Slovakia 1,245,921 64.2% 1
Slovenia 45,351 3.6% 43
South Africa - - 1
Spain 1,967,418 10.7% 1
Sri Lanka - - 24
Sweden 11,549,700 41.1% 2
Switzerland 208,949 16.7% 204
Taiwan - - 1
Thailand - - 25
Tunisia - - 1,180
Turkey - - 270
Ukraine - - 3
United Arab Emirates - - 5
United Kingdom 1,410,288 44.9% 1,689
United States 33,252,664 10.7% 465
Uruguay 601,909 32.6% 24
Viet Nam - - 10,858
World 301,569,608 7.5% 9
Source: Programme for the Endorsement of Forest Certification (PEFC), 2018.


TABLE OF CONTENTS FOR CHAPTER ����������������������������������������������������������������������������������������������������������������������p
TABLE OF CONTENTS FOR CHAPTER ������������������������������������������������������������������������������������������������������������������������������������������������� P
TABLE OF CONTENTS FOR CHAPTER ����������������������������������������������������������������������������������������������������������������������p
TABLE OF CONTENTS FOR CHAPTER ����������������������������������������������������������������������������������������������������������������������p
TABLE OF CONTENTS FOR CHAPTER ����������������������������������������������������������������������������������������������������������������������p
APPENDIX II
REFERENCES AND FURTHER READING

APPENDIX II – REFERENCES AND FURTHER READING170
REFERENCES AND FURTHER READINGAbou Rajab, yasmin, Christoph Leuschner, Henry Barus, Aiyen Tjoa, and Dietrich Hertel (2016): Cacao Cultivation under Diverse Shade Tree Cover Allows High Carbon Storage and Sequestration without yield Losses. PLoS ONE 11, no. 2 (February 29, 2016). Available at doi:10.1371/journal.pone.0149949.
Adidas (2018). Materials. Retrieved from http://www.adidas-group.com/en/sustainability/products/materials/
Andrade, J. (2016, June). Smallholder Farmers. Retrieved February 5, 2018, from http://www.iisd.org/ssi/wp-content/up-loads/2016/08/Smallholders_publication1.pdf
Armengot, L., Barbieri, P., Andres, C., Milz, J., & Schneider, M. (2016). Cacao agroforestry systems have higher return on labor compared to full-sun monocultures. Agronomy for Sustainable Development, 36(70), 1–10. https://doi.org/10.1007/s13593-016-0406-6
Associated Press (2016): Banana Workers Win $2.5M In Dole Lawsuit. November 16, 2007. Available at http://www.cbsnews.com/news/banana-workers-win-25m-in-dole-lawsuit/
Banana Lin (2016b), Aldi commits to sustainable sourcing of bananas, April 5, 2016. Available at: http://www.bananalink.org.uk/aldi-commits-sustainable-sourcing-bananas
Banana Link (2016a): Companies. Banana link website. Norfolk. Available at http://www.bananalink.org.uk/content/companies
Banana Link (2016b): Defending Workers’ Rights in Banana Plantations in Guatemala. Banana link website. Norfolk. Available at http://www.bananalink.org.uk/defending-workers%E2%80%99-rights-banana-plantations-guatemala
Banana Link (2016c): Multinationals Lose Grip on Global Banana Exports. Banana link website. Norfolk. Available at http://www.bananalink.org.uk/multinationals-lose-grip-global-banana-exports
Banana Link (2016d): The Problem with Bananas. Banana link website. Norfolk. Available at http://www.bananalink.org.uk/the-problem-with-bananas
Barcelos, E., Rios, S. de A., Cunha, R. N. V., Lopes, R., Motoike, S. y., Babiychuk, E., . . . Kushnir, S. (2015). Oil palm natural diver-sity and the potential for yield improvement. Frontiers of Plant Science, 6, 190. https://doi.org/10.3389/fpls.2015.00190
Barraza, D., Jansen, K., van Wendel de Joode, B., & Wesseling, C. (2011). Pesticide use in banana and plantain production and risk perception among local actors in Talamanca, Costa Rica. ResearchGate, 111(5), 708–717. https://doi.org/10.1016/j.envres.2011.02.009
Barraza, Douglas, Kees Jansen, Berna van Wendel de Joode, and Catharina Wesseling (2011): Pesticide Use in Banana and Plantain Production and Risk Perception among Local Actors in Talamanca, Costa Rica. ResearchGate 111, no. 5 (March 1, 2011). Available at: 708–17. doi:10.1016/j.envres.2011.02.009.
Barros, S. (2016): Brazil Sugar Annual Report. Retrieved from https://gain.fas.usda.gov/Recent%20GAIN%20Publications/Sugar%20Annual_Sao%20Paulo%20ATO_Brazil_4-15-2016.pdf
BCI (2016): Key Facts. BCI website, Geneva. Available at http://bettercotton.org/wp-content/uploads/2015/02/BCI-Key-Facts-2015_2.pdf
BCI (2017): What is BCI’s view of Genetically Modified (GM) Cotton? BCI website, Geneva. Available at http://bettercotton.org/about-bci/qa/what-is-bcis-view-of-genetically-modified-gm-cotton/
Bernet, Thomas, Jürgen Recknagel, Ludwig Asam, Monika Messmer (2016): Biosoja aus Europa – Empfehlungen für den Anbau und den Handel von biologischer Soja in Europa. Research Institute of Organic Agriculture FiBL & Donau Soja. FiBL, Frick. Avail-able at https://shop.fibl.org/fileadmin/documents/shop/1690-biosoja-europa.pdf
Better Cotton Initiative. (2016). Annual Report 2016 (p. 33). Geneva, Switzerland: Better Cotton Initiative. Retrieved from https://bettercotton.org/wp-content/uploads/2013/12/5784-AnnualReport_PDF_MF_v5.pdf
Better Cotton Initiative. (2017). BCI Fact Sheet 2017 (p. 4). Aid by Trade Foundation. Retrieved from https://bettercotton.org/wp-content/uploads/2017/06/BCI_Fact_Sheet_2017-1.pdf
Better Cotton Initiative. (2018a). BCI History. Retrieved February 2, 2018, from https://bettercotton.org/about-bci/bci-history/
Better Cotton Initiative. (2018b). Production Principles and Criteria. Retrieved February 2, 2018, from https://bettercotton.org/about-better-cotton/better-cotton-standard-system/production-principles-and-criteria/
Bloom, J. (2016, December 22). What Is Paraquat And How Bad Is it? Retrieved February 6, 2018, from https://www.acsh.org/news/2016/12/22/what-paraquat-and-how-bad-it-10627
Bonsucro. (2016). Theory of Change. London UK: Bonsucro. Retrieved from http://www.bonsucro.com/wp-content/up-loads/2017/10/Microsoft-Word-Public-Theory-of-Change-Draft_HQ.docx.pdf
Bonsucro. (2018a). Global Programmes. Retrieved February 2, 2018, from https://www.bonsucro.com/global-programmes/
Bonsucro. (2018b). Monitoring & Evaluation. Retrieved February 2, 2018, from https://www.bonsucro.com/monitoring-evaluation/
Bonsucro. (2018c). The Certification Process. Retrieved February 2, 2018, from https://www.bonsucro.com/certification-process/
Bonsucro. (2018d). What is Bonsucro? Retrieved January 28, 2018, from https://www.bonsucro.com/what-is-bonsucro/
Chang (2015) World tea production and trade: Current and future development. FAO. Available at: http://www.fao.org/3/a-i4480e.pdf
Chang and Brattlof (2015). Socio-economic implications of climate change for tea producing countries. FAO. Available at: http://www.fao.org/3/a-i4482e.pdf

APPENDIX II – REFERENCES AND FURTHER READING 171
Chapagain, A. K., Hoekstra, A. y., Savenije, H. H. G., & Gautam, R. (2006). The water footprint of cotton consumption: An as-sessment of the impact of worldwide consumption of cotton products on the water resources in the cotton producing countries. Ecological Economics, 60(1), 186–203. https://doi.org/10.1016/j.ecolecon.2005.11.027
CIAT, & UTZ Certified. (2017). Climate Impact Tea Production Malawi (p. 39). Cali, Colombia: CGIAR. Retrieved from https://utz.org/wp-content/uploads/2017/12/CIAT-report-climate-impact-tea-production-Malawi.pdf
CIFOR (2016): Low Fertilizer Use Drives Deforestation in West Africa, Imperils REDD Implementation Says New Study. Center for International Forestry Research. Accessed October 6, 2016. Available at http://www.cifor.org/press-releases/low-fertilizer-use-drives-deforestation-in-west-africa-imperils-redd-implementation-says-new-study/
Clay, J. W. (2004). World Agriculture and the Environment: A Commodity-By-Commodity Guide To Impacts And Practices. Island Press.
Clive, James (2015): Executive Summary: Global Status of Commercialized Biotech/GM Crops: 2014 - ISAAA Brief 51-2015 | ISAAA.org. International Service for the Acquisition of Agri-Biotech Applications (ISAAA). Available at http://isaaa.org/resources/publications/briefs/51/executivesummary/default.asp
CmiA (2016): About us: Goals. Cotton Made in Africa (CmiA) website. Hamburg. Available at: http://www.cottonmadeinafrica.org/en/standards/goals
Collins, y., & Voora, V. (2016). PEFC Forest Certification Week 2016 (The Standards Reporter No. 10) (p. 4). Winnipeg, Canada: International Institute for Sustainable Development; Retrieved from http://www.iisd.org/ssi/wp-content/uploads/2017/11/PEFC-report-2017-.pdf
Committee on Sustainability Assessments. (2013). Measuring Sustainabiliity - First global report on COSA findings in agriculture (p. 114). United States: State Secretariat for Economic Affairs.
Confino, J. (2014, May 8). Major companies fail to act on responsible soy sourcing says WWF. Retrieved February 6, 2018, from http://www.theguardian.com/sustainable-business/responsible-soy-sourcing-wwf
Cotton Campaign & Uzbek-German Forum for Human Rights (2012): Review of the 2012 cotton harvest in Uzbekistan. Available at http://uzbekgermanforum.org/wp-content/uploads/2012/12/Review2012_CottonHarvestUzbekistan.pdf
Cotton made in Africa. (2016). Annual Report 2016. Hamburg, Germany: Aid for Trade Foundation. Retrieved from http://www.cottonmadeinafrica.org/en/materials/annual-reports/167-cmia-annual-report-2016/file
Cotton made in Africa. (2018a). CmiA. Retrieved February 3, 2018, from http://www.cottonmadeinafrica.org/en/about-us/african-cotton
Cotton made in Africa. (2018b). CmiA - Cotton made in Africa. Retrieved February 2, 2018, from http://www.cottonmadeinafrica.org/en/about-us/the-initiative
Cotton made in Africa. (2018c). Criteria. Retrieved February 3, 2018, from http://www.cottonmadeinafrica.org/index.php/en/stan-dards/criteria
Cotton made in Africa. (2018d). Verification. Retrieved February 3, 2018, from http://www.cottonmadeinafrica.org/index.php/en/standards/verification
Council of the European Union (2007): Council Regulation (EC) No 834/2007 of 28 June 2007 on organic production and labelling of organic products and repealing Regulation (EEC) No 2092/91. Official Journal of the European Union L. 181/1- Available at http://eur-lex.europa.eu/legal-content/EN/TXT/?uri=celex%3A32007R0834
Deith, J., & Rowlatt, J. (2015, September 8): The bitter story behind the UK’s national drink. BBC News. Retrieved from http://www.bbc.com/news/world-asia-india-34173532
Economic Research Service (ERS) of the United States Department of Agriculture (USDA) (2016): Recent Trends in GE Adoption. The ERS/USDA website. Available at https://www.ers.usda.gov/data-products/adoption-of-genetically-engineered-crops-in-the-us/recent-trends-in-ge-adoption.aspx
European Commission (2017): Voluntary schemes. Website of the Directorate-General for Energy, Brussels. Last update: 08/04/2017: Available at https://ec.europa.eu/energy/en/topics/renewable-energy/biofuels/voluntary-schemes
European Parliament and of the Council (2009): Directive 2009/28/EC of the European Parliament and of the Council of 23 April 2009 on the promotion of the use of energy from renewable sources and amending and subsequently repealing Directives 2001/77/EC and 2003/30/EC (Text with EEA relevance). OJ L 140, 5.6.2009. Available at https://ec.europa.eu/energy/en/topics/renewable-energy/renewable-energy-directive
Fairtrade International (2006): Building Trust. Annual Report 2005–2006. Fairtrade International, Bonn, Germany. http://www.fairtrade.net/resources/annual-reports.html
Fairtrade International (2007): Shaping Global Partnership. Annual Report 2006–2007. Fairtrade International, Bonn, Germany. http://www.fairtrade.net/resources/annual-reports.html
Fairtrade International (2008): An Inspiration for Change. Annual Report 2007–2008. Fairtrade International, Bonn, Germany. http://www.fairtrade.net/resources/annual-reports.html
Fairtrade International (2009): Fairtrade Leading the Way. Annual Report 2008–2009. Fairtrade International, Bonn, Germany. http://www.fairtrade.net/resources/annual-reports.html
Fairtrade International (2010): Growing Stronger Together. Annual Report 2009–2010. Fairtrade International, Bonn, Germany. http://www.fairtrade.net/resources/annual-reports.html
Fairtrade International (2012): For Producers, With Producers. Annual Report 2011–2012. Fairtrade International, Bonn, Germany. http://www.fairtrade.net/resources/annual-reports.html

APPENDIX II – REFERENCES AND FURTHER READING172
Fairtrade International (2013): Unlocking the Power. Annual Report 2012–2013. Fairtrade International, Bonn, Germany. http://www.fairtrade.net/resources/annual-reports.html
Fairtrade International (2014): Strong Producers, Strong Futures. Annual Report 2013–2014. Fairtrade International, Bonn, Ger-many. http://www.fairtrade.net/resources/annual-reports.html
Fairtrade International (2015): Global Change, Local Leadership. Annual Report 2014–2015. Fairtrade International, Bonn, Ger-many. Available at http://annualreport.fairtrade.net/en/
Fairtrade International (2016): Driving Sales, Deeping Impact. Annual Report 2015–2016. Fairtrade International, Bonn, Germany. Available at https://annualreport15-16.fairtrade.net/en/
Fairtrade International (2016a): Fairtrade Global Strategy 2016-2020. Fairtrade International website. Bonn. Available at: http://www.fairtrade.net/about-fairtrade/our-vision/our-strategy.html
Fairtrade International. (2018a). FAQs. Retrieved February 3, 2018, from https://www.fairtrade.net/about-fairtrade/faqs.html
Fairtrade International. (2018b). What is Fairtrade? Retrieved February 3, 2018, from https://www.fairtrade.net/about-fairtrade/what-is-fairtrade.html
Fairtrade International. (2018c, January 12). Fairtrade Announces Two New Initiatives Supported by European Union. Retrieved February 3, 2018, from https://www.fairtrade.net/new/latest-news/single-view/article/fairtrade-announces-two-new-initiatives-sup-ported-by-european-union.html
FAO (2005): Second International Banana Conference - Reversing the Race to the Bottom. Retrieved from http://www.fao.org/fileadmin/templates/banana/documents/IBC2_finalReport_en05.pdf
FAO (2014): AQUASTAT - Irrigated Crops. Retrieved from http://www.fao.org/nr/water/aquastat/infographics/Irrigated_eng.pdf
FAO (2014): Impact on international voluntary standards on smallholder market participation in developing countries – A review of the literature. Food and Agriculture Organization of the United Nations (FAO). Rome. Available at: http://www.fao.org/publications/card/en/c/2858ceb4-4b8f-47af-9ba5-7c4e360bbf2d/
FAO (2016): 2016 State of the World’s Forests. Food and Agriculture Organization of the United Nations (FAO). Rome. Available at: http://www.fao.org/3/a-i5850e.pdf
FAO (2016a): 2016 State of the World’s Forests. Food and Agriculture Organization of the United Nations (FAO). Rome. Available at: http://www.fao.org/3/a-i5850e.pdf
FAO/UNECE (2015): Forest Products – Annual Market Review 2014–2015, Geneva, Switzerland. Available at: http://www.unece.org/fileadmin/DAM/timber/publications/2015-FPAMR-E.pdf
FAOSTAT (2018). FAOSTAT Database. Available at: http://www.fao.org/faostat/en/
Ferrigno, S. (2012). An Insider’s Guide to Cotton & Sustainability. MCL Global.
Food and Agriculture Organization of the United Nations (FAO) (1986): Chapter 3: Crop water needs. Irrigation water needs. Food and Agriculture Organization of the United Nations (FAO). Rome. Available at http://www.fao.org/docrep/s2022e/s2022e07.htm#3.3.4
Food and Agriculture Organization of the United Nations (FAO) (2016): FAOSTAT. Retrieved from http://faostat.fao.org/default.aspx?lang=en
Forest Stewardship Council (December 2012): Global FSC certificates: type and distribution. Bonn, Germany. Link: https://ic.fsc.org/preview.facts-and-figures-december-2012.a-1258.pdf
Forest Stewardship Council (December 2013): Global FSC certificates: type and distribution. Bonn, Germany. Link: https://ic.fsc.org/preview.facts-and-figures-december-2013.a-2834.pdf
Forest Stewardship Council (July 2014): Market Info Pack, An overview of recent trends and current status of FSC certification. Bonn, Germany. Link: https://ic.fsc.org/preview.2014-fsc-market-info-pack.a-3730.pdf
Forest Stewardship Council. (2015). FSC: 2016 Annual Review (p. 32). Bonn, Germany: Forest Stewardship Council. Retrieved from https://ic-es.fsc.org/en/annual-review/2016
Forest Stewardship Council. (2018a). Chain of Custody Certification. Retrieved February 4, 2018, from https://ic.fsc.org/en/what-is-fsc-certification/chain-of-custody-certification
Forest Stewardship Council. (2018b). Forest Management Certification. Retrieved February 4, 2018, from https://ic.fsc.org/en/what-is-fsc-certification/forest-management-certification
Forest Stewardship Council. (2018c). What we do: Projects and Initiatives. Retrieved February 4, 2018, from https://ic.fsc.org/en/what-is-fsc/what-we-do
Fountain, A. C., & Hütz-Adams, F. (2015). Cocoa barometer 2015 – USA Edition. VOICE Network.
FSC (2016): Types of FSC Certificates. Forest Stewardship Council (FSC). Bonn. Available at https://ic.fsc.org/en/certification/types-of-certification
FSC (2016b): FSC Global Strategic Plan 2015-2020. Forest Stewardship Council (FSC). Bonn. Available at https://ic.fsc.org/en/about-fsc/fsc-global-strategic-plan-2015-2020
GCP (2016): About. Global Coffee Platform website. Bonn. Available at http://www.globalcoffeeplatform.org/about/overview
GCP (2016a): Baseline Common Code. Global Coffee Platform website. Bonn Available at http://www.globalcoffeeplatform.org/assets/files/GCP_Doc_01_Baseline-Common-Code_v2.1_en.pdf

APPENDIX II – REFERENCES AND FURTHER READING 173
Giovannucci, D., Lewin, B., & Varangis, P. (2004). Coffee markets : New paradigms in global supply and demand (No. 28300) (pp. 1–150). The World Bank; Retrieved from http://documents.worldbank.org/curated/en/899311468167958765/Coffee-markets-New-paradigms-in-global-supply-and-demand
Global Coffee Platform. (2016). Baseline Common Code. Global Coffee Platform. Retrieved from http://www.globalcoffeeplat-form.org/assets/files/GCP_Doc_01_Baseline-Common-Code_v2.1_en.pdf
Global Coffee Platform. (2018a). GCP Baseline. Retrieved February 2, 2018, from http://www.globalcoffeeplatform.org/baseline-common-code/gcp-baseline
Global Coffee Platform. (2018b). GCP Connect. Retrieved February 2, 2018, from http://www.globalcoffeeplatform.org/the-global-platform/gcp-connect
Global Coffee Platform. (2018c). Launch of the Global Coffee Platform. Retrieved February 2, 2018, from http://www.globalcof-feeplatform.com/latest/2016/launch-of-the-global-coffee-platform
Global Coffee Platform. (2018d). Local Action Global Change. Retrieved February 2, 2018, from http://www.globalcoffeeplatform.org
Global Coffee Platform. (2018e, January 30). New ownership of the 4C Verification Scheme will result in benefits for the coffee sector. Retrieved February 2, 2018, from http://www.globalcoffeeplatform.org/latest/2018/new-ownership-for-the-4c-verification-scheme-will-result-in-benefits-for-the-coffee-sector
GLOBALG.A.P. (2016): Certification. GLOBALG.A.P. website. Cologne. Available at http://www.globalgap.org/uk_en/what-we-do/globalg.a.p.-certification/
GLOBALG.A.P. (2018a). Certification. Retrieved February 4, 2018, from https://www.globalgap.org/uk_en/what-we-do/globalg.a.p.-certification/
GLOBALG.A.P. (2018b). GLOBALG.A.P.+ Add-On. Retrieved February 4, 2018, from https://www.globalgap.org/uk_en/what-we-do/globalg.a.p.-certification/globalg.a.p.-add-on/index.html
GLOBALG.A.P. (2018c). History. Retrieved February 4, 2018, from https://www.globalgap.org/uk_en/who-we-are/about-us/history/
GMO compass (2014): Genetically modified plants: Global Cultivation Area – Soybean. The GMO Compass website. Available at http://www.gmo-compass.org/eng/agri_biotechnology/gmo_planting/342.genetically_modified_soybean_global_area_under_cultivation.html- Accessed April 3, 2017.
Gurusubramanian, G., Rahman, A., Sarmah, M., Ray, S., & Bora, S. (2008). Pesticide usage pattern in tea ecosystem, their retro-spects and alternative measures. Journal of Environmental Biology, 29(6), 813–826.
Gutierrez, A. P., Ponti, L., Herren, H., Baumgärtner, J., & Kenmore, P. E. (2015). Deconstructing Indian cotton: Weather, yields, and suicides. Environmental Sciences Europe, 27(1), 12. https://doi.org/10.1186/s12302-015-0043-8
H & M (2016): H&M Sustainability Report 2015. Retrieved from http://sustainability.hm.com/
Halweil, B. (2002). Why your Daily Fix Can Fix More than your Head: Coffee, If Grown Right, Can Be One of the Rare Human Industries That Actually Restore the Earth’s Health. World Watch, 1(May), •••. Retrieved from http://www.thefreelibrary.com/Why+your+daily+fix+can+fix+more+than+your+head%3A+coffee,+if+grown...-a085920463
HCV Network. (2018). What are High Conservation Values? — HCV Resource Network. Retrieved February 4, 2018, from https://www.hcvnetwork.org/about-hcvf
Huber, Beate and Otto Schmid (2017): Standards and Regulations. In Willer, H. and J. Lernoud (Eds.) (2017): The World of Or-ganic Agriculture. Statistics and Emerging Trends. FiBL, Frick and IFOAM – Organics International, Bonn, Germany.
Human Rights Watch (2004, June 10): El Salvador: Child labor on sugar plantations. Available at http://www.hrw.org/news/2004/06/09/el-salvador-child-labor-sugar-plantations
ICCO (2014): Cocoa Market Situation - 24 July 2014. Available at http://www.icco.org/about-us/international-cocoa-agreements/cat_view/30-related-documents/45-statistics-other-statistics.html
ICO (2013). ICO Annual review 2012/13. Retrieved from http://www.ico.org/news/annual-review-2012-13-e.pdf
IFOAM – Organics International (2016): Organic 3.0 - The Next Phase of Organic Development. IFOAM – Organics International, Bonn. Available at: https://www.ifoam.bio/en/organic-policy-guarantee/organic-30-next-phase-organic-development
IFOAM. (2018). What We Do. Retrieved February 4, 2018, from https://www.ifoam.bio/en/what-we-do-1
Index Mundi (2018) Palm Oil Domestic Consumption by Country in 1000 MT. Available at: https://www.indexmundi.com/agriculture/?commodity=palm-oil&graph=domestic-consumption
Indonesia Investments (2005): Forest Moratorium Indonesia Extended but Has Limited Success. Indonesia Investments web-site. Available at http://www.indonesia-investments.com/news/todays-headlines/forest-moratorium-indonesia-extended-but-has-limited-success/item5560?
Indonesia Investments (2017): Palm Oil. Indonesia Investments website. Available at http://www.indonesia-investments.com/business/commodities/palm-oil/item166
International Institute for Environment and Development (IIED) (2013): Reducing ‘forest footprints’: tackling demand for forest-risk commodities. Available at http://pubs.iied.org/pdfs/17167IIED.pdf
International Trade Centre (ITC) (2015): Standards Map website, www.standardsmap.org, International Trade Centre (ITC), Ge-neva, Switzerland.
ISAAA (2014): Slides & Tables: Global Status of Commercialized Biotech/GM Crops: 2014 - ISAAA Brief 49-2014. Available at http://www.isaaa.org/resources/publications/briefs/49/pptslides/default.asp
APPENDIX II – REFERENCES AND FURTHER READING174
ISAAA (2016): Pocket K No. 16: Biotech Crop Highlights in 2015. International Service for the Acquisition of Agri-biotech Applica-tions. Available at: http://www.isaaa.org/resources/publications/pocketk/16/
ISEAL Alliance. (2018). About ISEAL. Retrieved January 30, 2018, from https://www.isealalliance.org/about-iseal
James, C. (2015): Executive Summary: Global Status of Commercialized Biotech/GM Crops: 2014 - ISAAA Brief 51-2015 | ISAAA.org. International Service for the Acquisition of Agri-Biotech Applications (ISAAA). Retrieved from http://isaaa.org/resources/pub-lications/briefs/51/executivesummary/default.asp
Jha, S., Bacon, C. M., Philpott, S. M., Méndez, V. E., Läderach, P., & Rice, R. A. (2014). Shade Coffee: Update on a Disappearing Refuge for Biodiversity. Bioscience, •••, biu038. https://doi.org/10.1093/biosci/biu038
Joode, Berna van Wendel de, Benoit Barbeau, Maryse F. Bouchard, Ana María Mora, Åsa Skytt, Leonel Córdoba, Rosario Que-sada, Thomas Lundh, Christian H. Lindh, and Donna Mergler (2016): Manganese Concentrations in Drinking Water from Villages near Banana Plantations with Aerial Mancozeb Spraying in Costa Rica: Results from the Infants’ Environmental Health Study (ISA). ResearchGate, 215, 247–257. https://doi.org/10.1016/j.envpol.2016.04.015
Kaimowitz, D., and J. Smith (2001): Soybean Technology and the Loss of Natural Vegetation in Brazil and Bolivia. Center for Inter-national Forestry Research. Available at: http://www.cifor.org/library/738/soybean-technology-and-the-loss-of-natural-vegetation-in-brazil-and-bolivia/ https://doi.org/10.1079/9780851994512.0195
Keurig Green Mountain (2016). Brewing Transformation: Sustainability at Keurig Green Mountain. Keurig Green Mountain. Available at: http://www.keuriggreenmountain.com/~/media/Sustainability/PDF/ReportsDisclosures/KeurigSustainabilityReport_2016.ashx
Kraft, K. (2017, June 22). Thoughts On The UTZ And Rainforest Alliance Merger. Retrieved January 28, 2018, from https://dailycof-feenews.com/2017/06/22/thoughts-on-the-utz-and-rainforest-alliance-merger/
Kranthi, K. (2015): Why this Kolaveri-di syndrome in cotton? Weekly Publication of Cotton Association of India 19th Dec 2015. Available at http://krkranthi.blogspot.ch/2015/12/why-this-kolaveri-di-syndrome-in-cotton.html
Laine, P. (2015, June 8): Interview with Patrick Laine, CEO of the Better Cotton Initiative [In person].
Laine, P. (2015, June): BCI Members’ Update. Presentation presented at the Better Cotton Initiative Members’ Meeting, Istanbul, Turkey.
Lawson, Sam, Art Blundell, Bruce Caberle, Naomi Basik, Michael Jenkins, and Kerstin Canby (2014): Consumer Goods and De-forestation: An Analysis of the Extent and Nature of Illegality in Forest Conversion for Agriculture and Timber Plantations. Forest Trends, September 2014.
Lernoud, Julia and Helga Willer (2018): Current Statistics on organic agriculture worldwide. In Willer, H. and J. Lernoud (Eds.) (2018): The World of Organic Agriculture. Statistics and Emerging Trends. FiBL, Frick and IFOAM – Organics International, Bonn, Germany.
MacDicken, K. Jonsson, Ö., Piña, L., Marklund, L., Maulo, S., Contessa, V. and Adikari, y. (2015). Global Forest Resources As-sessment 2015: How are the world’s forests changing? Second Edition. FAO. Available at: http://www.fao.org/3/a-i4793e.pdf
Markets and Markets (2013): Markets and Markets: Global Chocolate Market worth $ 98.3 billion by 2016. Available at: http://www.marketsandmarkets.com/PressReleases/global-chocolate-market.asp
May, Peter H., Gilberto C., C. Mascarenhas, and Jason Potts (2004): Sustainable Coffee Trade, the Role of Coffee Contracts. Win-nipeg: IISD, May 2004. Available at https://www.theguardian.com/environment/2016/jun/01/leaked-figures-show-spike-in-palm-oil-use-for-biodiesel-in-europe
McCarthy, B. (2016). Supply Change: Tracking Corporate Commitments to Deforestation-free Supply Chains (p. 24). Washington, D.C.: Forest Trends; Available at http://www.forest-trends.org/documents/files/doc_5248.pdf
Meng, X., Qin, y., & Jia, L. (2014). Comprehensive evaluation of passenger train service plan based on complex network theory. Measurement, 58, 221–229. https://doi.org/10.1016/j.measurement.2014.08.038
NASA Earth Observatory (2015): Soybeans in the Brazilian Cerrado : Image of the Day [Text.Article]. Retrieved from https://earthobservatory.nasa.gov/IOTD/view.php?id=85364
Nieburg, Olivier (2014): Paying the Price of Chocolate: Breaking Cocoa Farming’s Cycle of Poverty.” ConfectioneryNews.com. Accessed December 22, 2016. http://www.confectionerynews.com/Commodities/Price-of-Chocolate-Breaking-poverty-cycle-in-cocoa-farming
Nielsen (2015): The Sustainability Imperative – New insights on consumer expectations October 2015. New york, United States. Available at: http://www.nielsen.com/content/dam/nielsenglobal/dk/docs/global-sustainability-report-oct-2015.pdf
Nike (2016): Nike Fy14015 Sustainable Business Report. Retrieved from http://about.nike.com/pages/sustainable-innovation
OECD-FAO (2016). OECD-FAO Agricultural Outlook 2016-2025. OECD. Available at: http://www.fao.org/3/a-i5778e.pdf
OECD-FAO (2017). OECD-FAO Agricultural Outlook 2017-2026. OECD. Available at: http://www.fao.org/3/a-i7465e.pdf
Overdevest, Christine, and Jonathan Zeitlin (2014): Assembling an Experimentalist Regime: Transnational Governance Interac-tions in the Forest Sector. Regulation & Governance 8, no. 1 (March 1, 2014): 22–48. doi:10.1111/j.1748-5991.2012.01133.x. Available at: https://doi.org/.
Oxfam (2013): Understanding Wage Issues in the Tea Industry. Retrieved April 24, 2017, from https://www.oxfam.org/sites/www.oxfam.org/files/file_attachments/oxfam_etp_understanding_wage_issues_in_the_tea_industry_1.pdf
Pacheco, P. (2012). Soybean and Oil Palm Expansion in South America: A Review of Main Trends and Implications. Center for International Forestry Research; https://doi.org/10.17528/cifor/003776

APPENDIX II – REFERENCES AND FURTHER READING 175
Panhuysen, S., & Pierrot, J. (2014). Coffee barometer 2014. Hivos, IUCN Nederland, Oxfam Novib, Solidaridad. WWF.
PEFC (2016): PEFC Forest Certification Week 2016. Available at: http://pefc.org/pefc-week-2016/home
PEFC. (2016). PEFC Annual Review 2016 (p. 32). Geneva, Switzerland: PEFC.
PEFC. (2018). Overview. Retrieved February 4, 2018, from https://www.pefc.org/about-pefc/overview
Pipitone, Laurent (2015): Presentations-Cocoa Market Outlook Conference 2015. Available at http://www.icco.org/about-us/inter-national-cocoa-agreements/cat_view/252-cocoa-market-outlook-conference-september-2015/253-presentations-cocoa-market-outlook-conference-2015.html
Potts, J., Lynch, M., Wilkings, A., Huppé, G. A., Cunningham, M., & Voora, V. A. (2014). The state of sustainability initiatives review 2014: Standards and the green economy. Winnipeg, MB: International Institute for Sustainable Development; Available at https://www.iisd.org/pdf/2014/ssi_2014.pdf
Potts, Jason; Lynch, Matthew; Wilkings, Ann; Huppé, Gabriel; Cunningham, Maxine and Voora, Vivek (Eds.) (2014): The State of Sustainability Initiatives Review 2014. Standards and the Green Economy. 1st edition. International Institute for Sustainable Devel-opment (IISD) and International Institute for Environment and Development (IIED), Winnipeg and London.
Potts, Jason; Van der Meer, Jessica; Daitchman, and Jaclyn; Huppé (2010): The State of Sustainability Initiatives Review 2010. Sustainability and Transparency. 1st edition. International Institute for Sustainable Development (IISD) and International Institute for Environment and Development (IIED), Winnipeg and London.
Product Board MVO (2011): Fact Sheet Soy. Available at: http://141.105.120.208/dsc/wpcontent/uploads/2014/04/MVO-Fact-Sheet-Soy.pdf
Product Board MVO (2011): Fact Sheet Soy. Retrieved from http://141.105.120.208/dsc/wp-content/uploads/2014/04/MVO-Fact-Sheet-Soy.pdf
ProForest (2004): The Basel Criteria for Responsible Soy Production. August 2004. Prepared by ProForest for Coop Switzerland in cooperation with WWF Switzerland. Coop, Basel. Available at: http://d2ouvy59p0dg6k.cloudfront.net/downloads/05_02_16_ba-sel_criteria_engl.pdf
ProForest. (2004). The Basel Criteria for Responsible Soy Production. Oxford, United Kingdom: Coop Switzerland and WWF.
Programme for the Endorsement of Forest Certification (PEFC) (2006): PEFC Annual Review 2005, PEFC International, Geneva, Switzerland. Http://www.pefc.org/. Available at: http://pefc.org/resources/brochures/organizational-documents/166-annual-re-view-2005
Programme for the Endorsement of Forest Certification (PEFC) (2007): PEFC Annual Review 2006, PEFC International, Geneva, Switzerland. Http://www.pefc.org/. Available at: http://pefc.org/resources/brochures/organizational-documents/167-annual-re-view-2006
Programme for the Endorsement of Forest Certification (PEFC) (2008): PEFC Annual Review 2007, PEFC International, Geneva, Switzerland. Http://www.pefc.org/. Available at: http://pefc.org/resources/brochures/organizational-documents/160-annual-re-view-2007
Programme for the Endorsement of Forest Certification (PEFC) (2009): PEFC Annual Review 2008, PEFC International, Geneva, Switzerland. Http://www.pefc.org/. Available at: http://pefc.org/resources/brochures/organizational-documents/161-annual-re-view-2008
Programme for the Endorsement of Forest Certification (PEFC) (2010): PEFC Annual Review 2009, PEFC International, Ge-neva, Switzerland. http://www.pefc.org/. Available at: http://pefc.org/resources/brochures/organizational-documents/513-annual-review-2009
Programme for the Endorsement of Forest Certification (PEFC) (2011): PEFC Annual Review 2010, PEFC International, Ge-neva, Switzerland. http://www.pefc.org/. Available at: http://pefc.org/resources/brochures/organizational-documents/739-annual-review-2010
Programme for the Endorsement of Forest Certification (PEFC) (2012): PEFC Annual Review 2011, PEFC International, Ge-neva, Switzerland. http://www.pefc.org/. Available at: http://pefc.org/resources/brochures/organizational-documents/982-annual-review-2011
Programme for the Endorsement of Forest Certification (PEFC) (2013): PEFC Annual Review 2012, PEFC International, Geneva, Switzerland. http://www.pefc.org. Available at: http://pefc.org/resources/brochures/organizational-documents?limitstart=0
Programme for the Endorsement of Forest Certification (PEFC) (2014): PEFC Annual Review 2013, PEFC International, Geneva, Switzerland. http://www.pefc.org. Link: http://pefc.org/resources/brochures/organizational-documents?limitstart=0
Programme for the Endorsement of Forest Certification (PEFC) (2015): PEFC Annual Review 2014, PEFC International, Geneva, Switzerland. http://www.pefc.org. Available at: http://pefc.org/resources/brochures/organizational-documents?limitstart=0
ProTerra (2016): Revision of the Standard. Available at: http://www.proterrafoundation.org/index.php/standard/revision-of-proter-ra-standard
ProTerra Foundation. (2018). The Standard. Retrieved February 4, 2018, from http://www.proterrafoundation.org/the-standard/
Rainforest Alliance. (2017, June 6). The Rainforest Alliance and UTZ to Merge, Forming New, Stronger Organization. Retrieved February 4, 2018, from https://www.rainforest-alliance.org/articles/rainforest-alliance-utz-merger
Rainforest Alliance. (2018). Q&A on the UTZ / Rainforest Alliance Merger. Retrieved February 4, 2018, from https://www.rainforest-alliance.org/faqs/rainforest-utz-merger

APPENDIX II – REFERENCES AND FURTHER READING176
Reuters (2016): Latam Banana Workers’ Claims over Pesticide Are Revived in U.S. Reuters, September 2, 2016. Available at http://www.reuters.com/article/bananaworkers-pesticide-idUSL1N1BE0Sy
Rochester, I. J., & Bange, M. (2016). Nitrogen Fertiliser Requirements of High-yielding Irrigated Transgenic Cotton. Crop & Pasture Science, 67(6), 641–648. https://doi.org/10.1071/CP15278
RSPO (2016): How RSPO certification works. Roundtable on Sustainable Palm Oil website. Available at http://www.rspo.org/certification/how-rspo-certification-works
RSPO (2017): National commitments. Roundtable on Sustainable Palm Oil website. Available at: http://www.rspo.org/certification/national-commitments
RSPO. (2017a). RSPO Impact Update Report 2017 (p. 47). Kuala Lumpur, Malaysia: RSPO. Retrieved from https://www.rspo.org/toc/RSPO-Impact-Update-Report-2017_221117.pdf
RSPO. (2017b, December 21). Mainstreaming sustainable palm oil in North America. Retrieved February 5, 2018, from https://rspo.org/news-and-events/news/mainstreaming-sustainable-palm-oil-in-north-america
RSPO. (2018, February 1). RSPO Credits put dreams within reach. Retrieved February 5, 2018, from https://rspo.org/news-and-events/news/rspo-credits-put-dreams-within-reach
RTRS. (2014): Acquiring RTRS Soy Credits. The website of the Round Table for Sustainable Soy (RTRS), http://www.respon-siblesoy.org, RTRS, Buenos Aires, Argentina, http://www.responsiblesoy.org/contribute-to-change/adquiriendo-creditos-de-soja-rtrs/?lang=en
RTRS. (2016): New Version of The RTRS Soy Production Standard – Approved. Available at: http://www.responsiblesoy.org/nueva-version-del-estandar-rtrs-de-produccion-de-soja-aprobada/?lang=en
RTRS. (2017). 2017: a year of strong growth for the Round Table on Responsible Soy. Retrieved February 5, 2018, from http://www.responsiblesoy.org/2017-un-ano-de-fuerte-crecimiento-para-la-roundtable-on-responsible-soy/?lang=en
Ryan, Ó. (2012). Chocolate Nations: Living and Dying for Cocoa in West Africa. Zed Books Ltd.
SAN (2016): SAN 2017 Standard: What’s new? SAN website. Available at: http://sanstandard2017.ag/
SEEP (2012): Fact Sheet on Pesticide Use in Cotton Production. International Cotton Advisory Committee: The Expert Panel on Social, Environmental and Economic Performance of Cotton Production (SEEP), April 2012.
Simpson, C. (2011): Victoria’s Secret revealed in child picking Burkina Faso cotton. Bloomberg Markets Magazine. Available at: http://www.bloomberg.com/news/2011-12-15/victorias-secret-revealed-in-child-picking-burkina-faso-cotton.html
Sivaram, B. (2008): Productivity improvement and labour relations in the tea industry in South Asia. Available at the International Labour Organization website, http://www.ilo.org/public/english/dialogue/sector/papers/proschem/proasia5.htm
SPOTT (2017): The Sustainable Palm Oil Transparency Toolkit website. Available at: http://www.sustainablepalmoil.org/europe/
Stigson, P. (2013). The Resource Nexus: Linkages Between Resource Systems. In Reference Module in Earth Systems and Envi-ronmental Sciences. Elsevier; Available at http://www.sciencedirect.com/science/article/pii/B9780124095489058978 https://doi.org/10.1016/B978-0-12-409548-9.05897-8
Tetley (2014): Tetley tea is good for you. Tetley website. Available at: http://www.tetley.com.mt/about-us/sustainability
Exchange, T. (2017). Organic Cotton Market Report 2017. Texas, United States: Textile Exchange.
The Economist (2002): Banana Skins. The Economist, April 25, 2002. Available at: http://www.economist.com/node/1101652
The Economist (2014): We Have No Bananas Today. The Economist, February 27, 2014. Available at: http://www.economist.com/blogs/feastandfamine/2014/02/bananas
The Guardian (2016), Lidl follows Asda in plan to buy all bananas from sustainable sources, February 1, 2016, Available at: https://www.theguardian.com/business/2016/feb/01/lidl-promises-stock-only-bananas-sustainable-sources
The ProTerra Foundation. (2018). Non-GMO certification for soy, sugar & tree nuts. Retrieved February 4, 2018, from http://www.proterrafoundation.org/
Turley, L. (2015). PEFC Forest Certification Week 2015 (The Standards Reporter No. 9) (p. 4). Winnipeg, Canada: International Institute for Sustainable Development; Retrieved from http://www.iisd.org/ssi/wp-content/uploads/2016/01/The-Standards-Re-porter-Report-9.pdf
Turley, L. (2016): The Landscape Approach: Moving towards sustainable land use patterns. SSI Commentary. IISD. Available at: http://www.iisd.org/ssi/wp-content/uploads/2016/05/Landscape-Approach.pdf
U.S. Department of Labor (2017): List of Goods Produced by Child Labor or Forced Labor. Retrieved April 24, 2017, from https://www.dol.gov/ilab/reports/child-labor/list-of-goods/
United Nations Development Programme (UNDP) (2010): Sugar scoping paper.
United Nations Development Programme (UNDP). (2010). Geneva: Sugar Scoping Paper - Green Commodities Facility.
Unilever (2016): Unilever Sustainable Sourcing: Tea. Unilever website. Available at: https://www.unilever.com/sustainable-living/the-sustainable-living-plan/reducing-environmental-impact/sustainable-sourcing/sustainable-tea-leading-the-industry/
United Nations Department of Economic and Social Affairs (2015): SDGs Sustainable Development Knowledge Platform. Re-trieved August 1, 2016. Available at: https://sustainabledevelopment.un.org/sdgs
United Nations (2016): UN Comtrade Database. Retrieved February 8, 2017, from https://comtrade.un.org/

APPENDIX II – REFERENCES AND FURTHER READING 177
United Nations Department of Economic and Social Affairs. (2017, May 11). Goal 17. Sustainable Development Knowledge Plat-form. Retrieved January 29, 2018, from https://sustainabledevelopment.un.org/sdg17
United States Department of Agriculture (USDA) (2016): PSD Online - Custom Query [Database]. Retrieved from http://apps.fas.usda.gov/psdonline/psdquery.aspx
USDA (2017). Sugar: World Markets and Trade. United States Department of Agriculture. November 2017. Available at: https://apps.fas.usda.gov/psdonline/circulars/sugar.pdf
USDA (2018) Cotton: World markets and trade. USDA. Available at: https://apps.fas.usda.gov/psdonline/circulars/cotton.pdf
USDA (April 2007): Can Brazil Meet the World’s Growing Need for Ethanol? United States Department of Agriculture (USDA). USDA website. Available at: https://www.ers.usda.gov/amber-waves/2011/december/can-brazil-meet-the-world-s-growing-need-for-ethanol/
USDA Foreign Agricultural Services (2016): Brazil Sugar. Global Agricultural Information Network, USDA Foreign Agricultural Services. Available at: http://gain.fas.usda.gov/Recent%20GAIN%20Publications/Sugar%20Annual_Sao%20Paulo%20ATO_Bra-zil_4-15-2016.pdf
USDA Foreign Agricultural Services database (2017): Available at: http://apps.fas.usda.gov/psdonline/psdquery.aspx
UTZ (2015): Inspiring Growth 2014 Achievements, Annual Report 2014 data. UTZ, Amsterdam, The Netherlands. Available at: https://www.utzcertified.org/images/stories/site/pdf/downloads/ANNUALREPORTANNEX2014.pdf
UTZ (2016): Measuring impact. Available at: https://www.utz.org/what-we-offer/measuring-impact/
Uzbek-German Forum for Human Rights, & Cotton Campaign (2012): Review of the 2012 Cotton Harvest in Uzbekistan. Retrieved from http://www.cottoncampaign.org/uploads/3/9/4/7/39474145/review2012_cottonharvestuzbekistan.pdf
Vaast, P., Bertrand, B., Perriot, J.-J., Guyot, B., & Génard, M. (2006). Fruit thinning and shade improve bean characteristics and beverage quality of coffee (Coffee arabica L.) under optimal conditions. Journal of the Science of Food and Agriculture, 86(2), 197–204. https://doi.org/10.1002/jsfa.2338
Valdes, C. (2011, December 1): Can Brazil Meet the World’s Growing Need for Ethanol? Retrieved from http://www.ers.usda.gov/amber-waves/2011/december/can-brazil-meet-the-world-s-growing-need-for-ethanol/
Viart, N., Seixas, R., & Tunon, N. (2017). Bonsucro Outcome Report 2017 (No. Version 1.0) (p. 53). London, United Kingdom: Bonsucro; Retrieved from https://www.bonsucro.com/wp-content/uploads/2017/01/Bonsucro-Outcome-Report-2017_Final.pdf
Vijay, V., Pimm, S. L., Jenkins, C. N., & Smith, S. J. (2016). The Impacts of Oil Palm on Recent Deforestation and Biodiversity Loss. PLoS One, 11(7), e0159668. https://doi.org/10.1371/journal.pone.0159668
Voora Vivek (2016): A Blueprint for Enabling Sustainable Commodities: Voluntary Sustainability Standards and the Cotton Sec-tor. Commentary Report. IISD. Available at: http://www.iisd.org/ssi/wp-content/uploads/2016/11/Cotton-sector_commentary.pdf
Voora, V. (2014, November). Roundtable for Sustainable Palm Oil 11th Annual General Assembly. The Standards Reporter, p. 4.
Wageningen University (2017): What is Panama Disease? Retrieved from http://www.fusariumwilt.org/index.php/en/the-problem/
Wakker, Eric, Joanna de Rozario, and Sawit watch Indonesia ([S.l.]) (2004): Greasy Palms: The Social and Ecological Impacts of Large-Scale Oil Palm Plantation Development in Southeast Asia. Friends of the Earth, 2004.
Wal, van der S. (2008): Sustainability issues in the tea sector: a comparative analysis of six leading producing countries. Sustain-ability Issues in the Tea Sector: A Comparative Analysis of Six Leading Producing Countries.
Wallengren, M. (2016): SPECIAL REPORT: The Amazing 85 years History of Organic Coffee | Spilling the Beans. Retrieved April 23, 2017, from http://spilling-the-beans.net/special-report-the-extraordinary-and-amazing-85-years-history-of-organic-coffee/
WCF (2012). Cocoa market update. World Cocoa Foundation, March. Available at: http://worldcocoafoundation.org/wp-content/uploads/Cocoa-Market-Update-as-of-3.20.2012.pdf
Willer, H., & Lernoud, J. (Eds.). (2018). The World of Organic Agriculture. Statistics and Emerging Trends 2018. Research Institute of Organic Agriculture (FiBL). Bonn: Frick and IFOAM – Organic International; Available at http://www.organic-world.net/yearbook/yearbook2018/pdf.html
World Bank (2017) Commodity Markets Outlook. April 2017. World Bank. Available at: http://pubdocs.worldbank.org/en/174381493046968144/CMO-April-2017-Full-Report.pdf
World Cocoa Foundation (2016a): Challenges. World Cocoa Foundation website, Washington. Available at: http://www.world-cocoafoundation.org/about-cocoa/challenges/
World Cocoa Foundation (2016b): Cocoa Value Chain. World Cocoa Foundation website, Washington. Available at: http://www.worldcocoafoundation.org/about-cocoa/cocoa-value-chain/
World Resources Institute (2014): RELEASE: First Detailed Public Maps of RSPO Certified Palm Oil Concessions Released. Re-trieved April 24, 2017, from http://www.wri.org/news/2014/06/release-first-detailed-public-maps-rspo-certified-palm-oil-conces-sions-released
WWF. (2017). Soy roundtable. Retrieved February 6, 2018, from http://wwf.panda.org/what_we_do/footprint/agriculture/soy/re-sponsiblesoy/soy_roundtable/
Zion Market Research (2017). Palm Oil Market Analysis by Derivative (Crude Palm Oil, Palm Kernel Oil, Palm Kernel Cake, and Others), and for Edible Oil, Cosmetics, Bio-diesel, Lubricants, Surfactants and Other Applications - Global Industry Perspective, Comprehensive Analysis, and Forecast, 2015 – 2021. Zion Market Research. Available at: https://globenewswire.com/news-release/2017/11/03/1174294/0/en/Global-Palm-Oil-Market-to-Cross-USD-92-84-Billion-in-2021-Zion-Market-Research.html


Printed by ITC Digital Printing Service.
A free pdf is available on ITC’s website at: www.intracen.org/publications.

ISBN 978-92-9137-408-3Financed by: