the status of bank lending to smes in the middle...
TRANSCRIPT
0
FINANCIAL FLAGSHIP
THE STATUS OF BANK LENDING TO SMES IN THE MIDDLE EAST AND NORTH AFRICA
REGION: THE RESULTS OF A JOINT SURVEY OF THE UNION OF ARAB BANKS AND THE WORLD
BANK
ROBERTO ROCHA, SUBIKA FARAZI, RANIA KHOURI AND DOUGLAS PEARCE*
JANUARY 2011
* Roberto Rocha, Subika Farazi, and Douglas Pearce are from the Middle East and North Africa Region of the World Bank;
Rania Khouri is from the Union of Arab Banks. The paper is part of a broader World Bank project that takes stock of financial
development in the MENA region. The authors are grateful to Zsofia Arvai, Laurent Gonnet, Margaret Miller, Cedric Mousset,
Sahar Nasr, Youssef Saadani, Diego Sourrouille, and Constantinos Stephanou, for their valuable contributions in the early stages
of the design and implementation of the survey, including participation in pilot interviews. The authors are also grateful to
comments and suggestions from Thorsten Beck, Erik Feyen, Maria Soledad Martinez Peria, and Teymour Abdel Aziz.
The Union of Arab Banks
The World Bank
0
Table of Contents
1. Introduction ..............................................................................................................................3
2. Overview of Previous Surveys .................................................................................................5
3. The MENA Survey ....................................................................................................................6
4. Main Survey Results .................................................................................................................8
4.1. Overall Extent of SME Lending in MENA ...................................................................... 8
4.2. Strategic Approach to SME Banking ............................................................................... 8
4.3. SME Products ................................................................................................................. 10
4.4. Risk Management ........................................................................................................... 11
5. A Preliminary Analysis of the Dataset ..................................................................................14
6. Summary of Findings and Policy Implications ....................................................................18
Figures………………………………………………………………………………………… ...20
Tables………………………………………………………………………………………… ....43
Appendix Table 1: Descriptive Statistics of the Variables Used in Regression Analysis ......54
Appendix Table 2: Correlations between variables used in Regression Analysis .................55
Appendix Table 3: Definition and Sources of variables used in Regression Analysis ...........56
References .....................................................................................................................................56

1
1. Introduction
The financing of small and medium sized enterprises (SMEs) has attracted great interest from
academics and policy-makers around the world. SMEs play an essential role in building a
competitive private sector and contributing significantly to employment and economic activity.1
Despite their importance, SMEs seem significantly more financially constrained than large firms,
especially in developing countries. Indeed, enterprise-level surveys conducted by the World
Bank show that a much smaller share of SMEs has a loan or a line of credit by comparison with
large firms, and also that access to finance is relatively more constrained in lower and middle
income countries (Figure 1a). Other studies using enterprise-level data show that the lack of
access to external finance constitutes a major constraint to SME growth.2
Despite the importance of the topic of SME finance, there has been relatively little research on
the supply side of bank finance to SMEs. Notable exceptions are Beck, Demirguc-Kunt, and
Peria (2008 and 2009), and De la Torre, Peria, and Schmukler (2010), which provided the first
measures of the extent of bank lending to SMEs, as well as the drivers and obstacles to further
SME lending. These studies were based on two surveys, the first covering 45 developing and
developed countries and the second 3 Latin American countries and one Central European
country. The results show that most banks increasingly see SMEs as an attractive business, in
contrast with the traditional view that SME lending is dominated by small banks and based on
relationship lending. However, the studies also show that institutional obstacles to SME lending
remain and that the SME market is still far from saturated.
The ongoing efforts to investigate further the status of bank lending to SMEs are particularly
relevant for the Middle East and North Africa (MENA) region. As shown in Figures 1b and 1c,
enterprise-level surveys conducted by the World Bank suggest that SMEs are particularly
financially constrained in MENA countries – only 20 percent of SMEs in MENA have a loan or
a line of credit, a lower share than any other region, and only 10 percent of their investment
expenditures are financed by a bank loan, a share that is higher only to the one in Sub-Saharan
Africa. These results have motivated the design and implementation of a survey of bank lending
to SMEs in the MENA region that complements the information provided by enterprise surveys
and provides further insights into the challenge of enhancing SME access to finance.
The objective of this paper is to report the results of a joint survey of the Union of Arab Banks
and the World Bank (henceforth the MENA survey), including not only the bank responses but
also the statistical analysis of the dataset. The MENA survey was conducted between December
2009 and April 2010 and secured a high response rate across the region. It draws on material
from the two previous surveys conducted by the World Bank, thus allowing for comparisons
with previous results. However, the MENA survey also contains new material, designed to
address the specificities of the MENA region and provide more information and granularity to
1 According to Ayyagari et al., (2007) SMEs account for more than 60% of manufacturing employment across 76
developed and developing economies. 2 Schiffer and Weder (2001), IADB (2004) and Beck et al. (2005, 2006 and 2008) show SMEs perceive access to
finance and cost of credit to be greater obstacles than large firms and these factors affect their growth.
2
some key issues, including long-run targets for SME lending and the deficiencies in financial
infrastructure. Here in this section we report the main stylized facts and results.
First, like the banks surveyed in the two previous surveys, MENA banks also regard the SME
segment as potentially profitable, and most banks are already engaged in SME lending to some
degree. The drivers that motivate banks to engage in SME lending include the potential
profitability of the SME market, the saturation of the large corporate market, the need to enhance
returns, and the desire to diversify risks. Larger banks (measured by total loans) have not played
a more significant role in SME finance in MENA, but banks with a larger branch network and/or
that have set up SME units seem to do more SME lending, suggesting that relationship lending
may still be important in a region where financial infrastructure remains generally deficient.
Second, despite the interest in the SME sector, lending volumes are still not very impressive.
The share of SME lending in total lending is only 8 percent, of which 2 percent in the GCC (Gulf
Cooperation Council) countries, and 13 percent in the non-GCC countries. The low share of
SME lending in the GCC reflects largely the characteristics of concentrated oil economies. The
share of SME lending in the non-GCC is higher, but still lower than the shares of SME lending
in developing and developed countries (Beck, Demirguc-Kunt, and Peria (2008), and OECD
(2010)). Most importantly, the shares of SME lending in total lending in both the GCC and non-
GCC regions are substantially below the banks‟ own long-run targets, also suggesting substantial
room for further lending to SMEs.
Third, MENA banks quote the lack of SME transparency and the weak financial infrastructure
(weak credit information, weak creditor rights and collateral infrastructure), as the main
obstacles for further engagement in SME finance. Banks complain less about regulatory
obstacles (e.g. interest rate ceilings), excessive competition in the SME market, or lack of
demand for loans from SMEs. Within an overall environment of weak financial infrastructure,
the countries that are able to strengthen creditor rights and provide more information to creditors
succeed in inducing more SME lending overall or more long-term lending to SMEs.
Fourth, state-owned banks in MENA still play an important role in providing finance to SMEs,
with an average share of SME lending which is similar to that of private banks. This reflects
largely the gaps in SME finance in the region and their mandates in this area. The generally
weak quality of financial infrastructure in MENA is probably one of the main reasons why
private banks have not engaged more in SME finance in several countries, although many private
banks are making inroads in this area, suggesting that these banks have better SME strategies and
lending technologies.
Fifth, state banks seem to be taking greater risks than private banks in their SME lending
business. They are less selective in their strategies to target SMEs, have a lower ratio of
collateralized loans to SMEs, and a higher share of investment lending in total SME lending. At
the same time, they also seem to have less developed SME lending technologies and risk
management systems. A lower share of state banks has dedicated SME units, makes use of
credit scoring, and conducts stress tests.

3
Sixth, several MENA countries have introduced special interventions to induce banks to lend
more to SMEs. In addition to the use of state banks, special programs have included exemptions
on reserve requirements, credit subsidies and partial credit guarantee schemes. Guarantee
schemes have proved particularly popular and are in operation in ten MENA countries. The
paper provides some evidence that these schemes have contributed to more SME lending,
although it is difficult to evaluate the extent to which these schemes are cost-effective.
While state banks and other interventions such as guarantee schemes may have a played an
important role in providing finance to SMEs in an environment where financial infrastructure
remains weak, the results also allow for the identification of MENA‟s policy agenda in the area
of SME finance. Strengthening credit information systems and creditor rights should remain the
priority item in the legal/regulatory agenda. Credit guarantee schemes may play an important
role, but it is essential to ensure that these schemes are well-designed and cost-effective. Finally,
avoiding overly restrictive entry requirements and allowing the entry of international and
regional banks showing leadership in SME finance can improve competition and produce
positive direct and indirect effects in the market for SME lending.
The rest of the paper is structured as follows. The second section provides an overview of the
two previous SME banking surveys and their main results. The third section reviews how the
MENA survey was designed and implemented. The fourth section discusses the overall survey
results. This includes the actual and target bank lending to SMEs, the main strategic approaches
adopted by MENA banks in dealing with SMEs, the main products offered, and the risk
management techniques employed. The fifth section presents a preliminary econometric analysis
of the dataset built from the survey results and other sources. Finally, the sixth section concludes
and identifies the key policy implications.
2. Overview of Previous Surveys
As mentioned before, two World Bank surveys were conducted in recent years as part of an
effort to investigate the status of bank lending to SMEs. These surveys share some important
common elements, but also have important differences. Both surveys provide some
measurement of SME lending, investigate the main drivers and obstacles to further SME lending,
the main business models developed and the main risk management techniques adopted, but with
different emphasis on each of these components. The two surveys are also based on very
different samples, regarding their size, the types of bank surveyed, and the regional coverage.
The first survey covered 91 large banks in 45 countries and provided the basis for two separate
studies – Beck, Demirguc-Kunt and Martinez Peria (2008 and 2009). The first study provides an
overall assessment of the survey results while the second provides an econometric analysis of the
dataset. This survey included a quantitative component, allowing the authors to obtain measures
of the share of SME loans in total loans, the share of investment loans in SME loans, percentages
of applications approved, and loan fees and interest rates. Besides comparing SME lending in
developed and developing countries, and investigating drivers and obstacles, the two studies also
made comparisons between government, private, and foreign banks.

4
In the first study, Beck, Demirguc-Kunt and Martinez Peria (2008) report that the average share
of SME lending is smaller in developing countries (16 percent of total lending) by comparison
with the average share in developed countries (22 percent of total lending). Banks in developing
and developed countries are primarily attracted by the potential profitability of the SME sector
and serve SMEs primarily through dedicated SME units. Government programs are considered
favorable and prudential regulations are not perceived as burdensome. Scoring models are used
by most banks but they are just one of the inputs in loan decision. Banks in developing countries
report that macroeconomic instability is the main obstacle to SME lending, rather than flaws in
the legal and contractual framework. However, the second study (Beck, Demirguc-Kunt and
Martinez Peria, 2009), based on the statistical analysis of the dataset concludes that the
differences in SME lending between developing and developed countries are actually explained
by differences in the quality of the legal and contractual environment (weaker in developing
countries). Overall, their analysis suggests that the enabling environment is more important than
firm size or bank ownership in shaping bank financing to SMEs.
The study by de la Torre, Martinez Peria and Schmukler (2009) relies primarily on on-site
interviews with 37 banks in Argentina, Chile, Colombia and Serbia. The survey did not focus on
measuring SME lending, but included 92 questions covering the strategic approach to SME
lending, business models, and risk management. The authors complement the information from
the interviews with a survey by the International Finance Corporation (IFC) across 8 developed
and developing countries and annual surveys undertaken by FRS (Inmark Group) in 7 countries.
All in all, data from 48 banks and one leasing company in 12 countries was used in the analysis.
This study investigates to what extent the conventional wisdom on SME lending holds in
practice – the conventional view is that large banks are not attracted to SME lending and that the
SME business is dominated by small banks and based on relationship lending. Their results show
that the conventional view is not prevalent in practice. Like the study by Beck, Demirguc-Kunt
and Martinez Peria (2008), they find that the SME segment is perceived to be profitable and that
most banks are interested in serving SMEs, including large and foreign banks. Almost all the
banks in the sample have separate SME units and offer a wide range of products and services. In
addition to relationship lending, banks apply different transactional technologies such as credit
scoring, risk-rating tools, and special products such as leasing and factoring. There are
significant differences across banks and countries regarding the use of particular techniques, but
these technologies allow banks to compensate for weaknesses in the enabling environment.
Interestingly, the use of government supported programs is reported to be low.
3. The MENA Survey
Our survey (henceforth the MENA survey) was developed and conducted jointly with the Union
of Arab Banks (UAB), which is the regional association of all banking associations in the region
and has a membership of about 330 banks. The MENA survey has 50 questions distributed into
four broad sections. Like the two previous surveys, we included qualitative questions in three
broad areas: the strategic approach to SME lending, the main products offered to SMEs, and the
risk management techniques employed. Moreover, like the survey by Beck, Demirguc-Kunt and
Peria (2008), we also included a fourth and quantitative section designed to measure the extent of
SME lending, the share of investment loans in total SME loans, and other variables.

5
Many questions in the MENA survey were directly drawn from the two previous surveys,
allowing for comparisons of some of the main results. At the same time, the MENA survey has
new questions, designed to cover topics that were not covered in the previous surveys, but that
are important for MENA, or designed to provide granularity on some of the obstacles to SME
lending. For example, the MENA survey has included a new question on long-run targets for
SME lending that allows us to assess the additional room for SME finance by each country. The
survey also provides more granularity on some of the problems with financial infrastructure such
as creditor rights (an area where the MENA region fares very poorly), asks questions on gender
and Islamic finance, and finally includes some questions on the status of Basel II
implementation, because of its potential effects on SME finance.
The first version of the MENA survey was tested in a pilot set of interviews with 6 banks in 2
countries – Morocco and Egypt. The results of these interviews provided important insights for
the final revisions. The UAB and World Bank teams finalized the revisions and launched the
survey in December 2009. The survey was sent in English, French, and Arabic. The UAB also
played a fundamental role in the follow-up phase (January-May 2010), through constant
communication with member banks, collecting responses, checking for inconsistencies, and
frequently requesting revisions. The final response rate was high – slightly less than half of the
universe, due largely to the active follow-up of UAB staff in headquarters and regional offices.
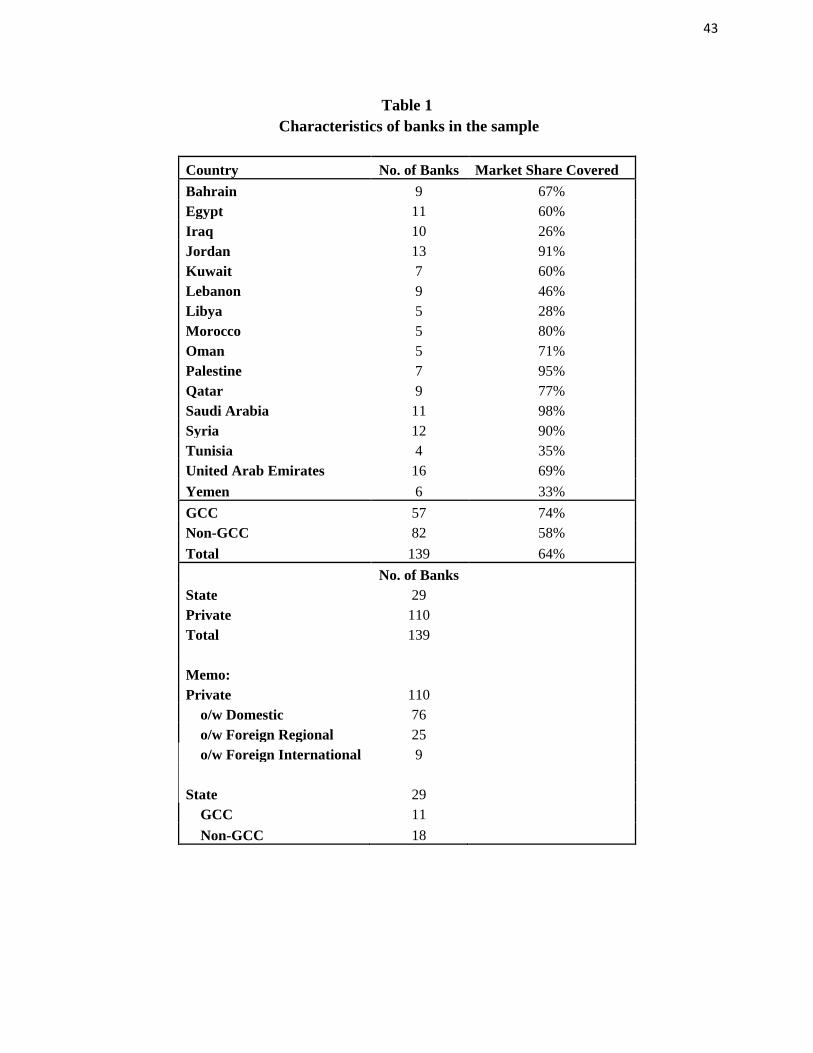
Table 1 reports the number of banks and countries from MENA that responded to our survey
along with their market share. We obtained responses from a total of 139 banks in 16 countries.
On average the banks that responded account for 64% of the banking system loans. Among the
16 countries in our sample, 6 are from the GCC and remaining 10 are from outside the GCC. The
57 GCC banks account for 74% of loans in GCC banking systems, while the 82 non-GCC banks
account for 58% of non-GCC banking system loans. The sample includes 29 state banks and 110
private banks. Out of the private banks, 76 are domestic banks and 34 are foreign banks.
However, foreign banks are usually subsidiaries of a parent bank domiciled in a MENA country.
There are very few subsidiaries of international banks domiciled outside the region. This implies
that it is difficult to assess differences in the behavior of foreign and domestic banks, as most
foreign banks in the sample are part of a MENA regional group that shares the same strategies
and lending technologies among its subsidiaries. Therefore, in the paper we explore more the
differences between GCC and non-GCC banks, as well as the differences between state and
private banks, rather than the differences between foreign and domestic banks.
The survey does not ask the banks to use a predetermined classification of SMEs, because this
would have generated technical difficulties and could have resulted in a very low response. In
line with other surveys, banks were asked to provide their own definitions for SMEs, in terms of
employees and turnover. As shown in Table 2, the average minimum number of employees
defining a small firm is 3 in the GCC and 4 in the non-GCC countries. The average maximum
number of employees defining a small firm in the GCC and non-GCC is 24 and 17 employees
respectively, while the average maximum number of employees defining a medium firm is 90 for
the GCC and 58 for the non-GCC countries. These average thresholds adopted by the banks are
much smaller than those adopted in the EU.
6
The same is true for turnover, which is the measure used by most banks to classify their SMEs.
As shown in Table 2, the average minimum turnover for defining a small enterprise in the non-
GCC is US$61,000, a small number by comparison with the EU‟s threshold of US$2.9 million.
Likewise, the maximum turnover for defining a medium enterprise in the non-GCC region is
US$4.7 million, a small number by comparison with the EU‟s US$70 million. However, it is
also noticeable that when turnover thresholds are divided by per capita income the differences
vis-à-vis the EU are much smaller. This is not surprising, and reveals that MENA banks are
adapting their definitions of SMEs to the reality of their markets, which generally comprise
much smaller firms operating with fewer employees. That being said, it is also true that there are
still differences in the definitions of SMEs across banks and countries, and therefore, there is
always some measurement error that must be taken into account when comparing results.
4. Main Survey Results
4.1. Overall Extent of SME Lending in MENA
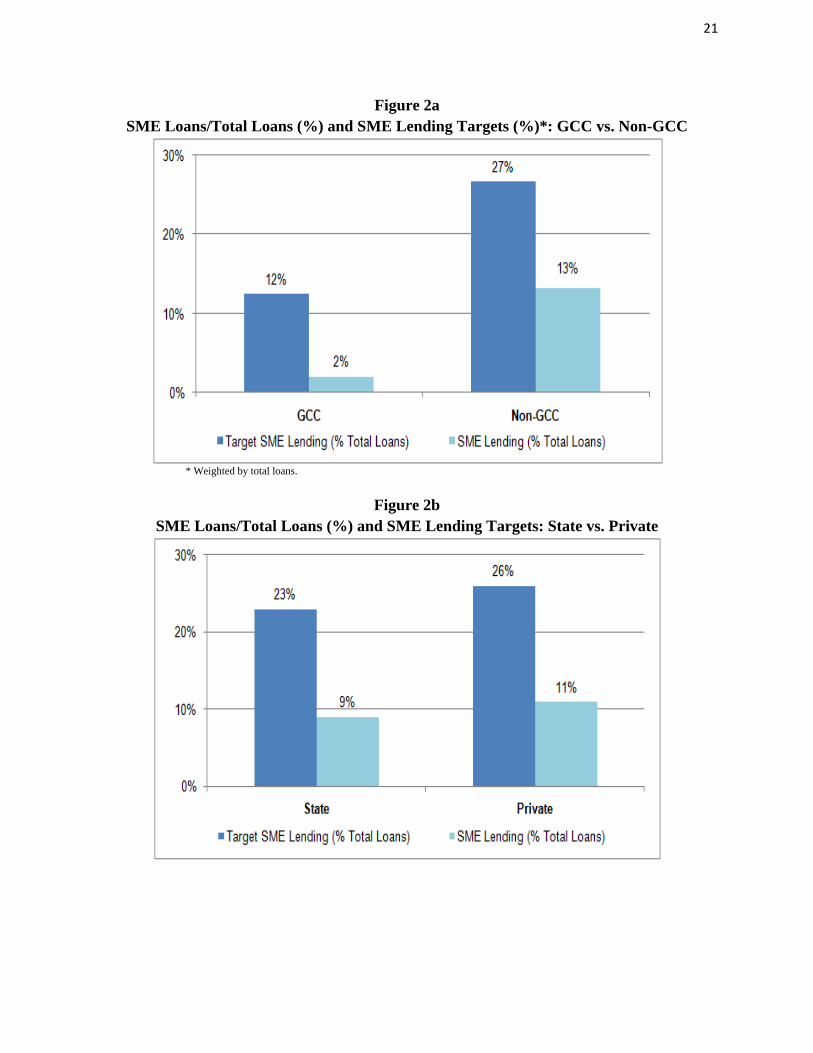
The average share of SME lending in MENA is low – less than 8 percent of total lending – but
there are significant differences between the two main sub-regions and individual countries, as
shown in Table 3 and Figures 2a and 3a. The average share of SME lending in the GCC is only
2 percent, while the share of SME lending in the non-GCC region is 13 percent. This is a
significantly higher figure, although still lower than those reported by Beck, Demirguc-Kunt and
Martinez Peria (2008), for both developing and developed countries, and also lower than the
average share of five OECD countries (OECD 2010), as shown in Table 4.
It is noticeable that the average share of SME lending is consistently low across all GCC
countries, while there is more variation among non-GCC countries. The low share of SME
lending in the GCC reflects to a large extent the structure of oil-based economies – less
diversified, dominated by very large enterprises, and characterized by appreciated exchange rates
and small non-oil traded sectors. These factors imply a more narrow space for SMEs to flourish,
especially in non-oil sectors producing traded goods. Moreover, GCC countries tend to have
small populations, and the nationals tend to find attractive positions in the public sector, which
may also discourage risk-taking in the SME sector. By contrast, in the non-GCC countries there
is probably scope for more SME growth across a wider range of economic sectors, including
traded sectors, and also as part of supply chains linked to large enterprises.
In the case of non-GCC countries, three sub-groups can be identified: a first group with SME
lending below 10% of total lending (Syria, Egypt), an intermediate group with SME lending
between 10%-15% of total lending (Palestine, Jordan), and a third group with SME loans
between 15%-24% of total loans (Tunisia, Lebanon, Yemen, and Morocco). There could be an
element of error in country comparisons, related to different definitions of SMEs adopted by the
banks. However, Figure 3b indicates that there is broad consistency between the results of
enterprise surveys and the results of this survey (the comparison is only made where both survey
results are available). The countries with the highest shares of enterprises with a loan tend to be
the countries with the highest share of SME loans in total loans – Morocco, Lebanon, and
Yemen, while the countries with the lowest shares of enterprises with a loan tend to also have
small shares of SME loans – Syria, Egypt, and the Palestine (the correlation between the two
variables is 0.54, and the ranking correlation is 0.68). Therefore, despite the different
7
methodologies, there is broad consistency between the results of the enterprise surveys and the
MENA survey.3
There seems to be significant scope for further SME lending in MENA, as shown by the large
differences between the long-run targets and the actual shares of SME lending reported by the
banks (Table 3 and Figure 2a). This is true in both the GCC and the non-GCC regions, although
targets are significantly lower in the GCC (about 12% of total lending), revealing that the banks
themselves have concluded that there are “natural” limits to profitable SME lending in oil-based
economies. In the case of non-GCC countries, the long-run target is much higher and around
27% of total lending. It is interesting to note that this target is very similar to the actual share of
SME lending in developed economies. This could be more than a coincidence, and reflect
expectations by the banks that the enabling environment and market conditions in MENA will
eventually converge to those already prevailing in developed countries, creating the conditions
for further and profitable SME lending.
State banks play an important role in SME lending in several MENA countries, as indicated by
an average share of SME loans of 9% of total lending. This share is very close to the average
share of private banks (Table 5 and Figure 2b). The long-run targets for SME lending for State
and private banks are also similar. Moreover, while the differences between the average shares
of SME loans in GCC and non-GCC countries are large and statistically significant, the
differences between state and private banks are not statistically significant, as shown in Table 5.
The important role played by state banks could reflect their mandates to fill a gap in SME
lending, especially where the enabling environment remains weak and the private banks are still
reluctant to take more risk, despite the potential profitability of the SME business. This result
will be further explored below.
In addition to having a larger SME portfolio overall, non-GCC banks also extend a larger share
of investment loans than GCC banks. As shown in Table 5, the differences are statistically
significant, whether the averages are weighted or unweighted. It is also noticeable that State
banks have a larger share of investment loans in their SME loan portfolios, although the
difference between the two averages is not statistically significant (this result is revisited in
section 5). Finally, there are no significant differences between foreign and private domestic
banks in our sample. As mentioned before, this is not surprising, as most banks classified as
foreign banks in our sample are in fact part of a regional group that shares the same strategy and
lending technologies across the mother bank and the subsidiaries and branches.
The analysis of frequency distributions at the individual bank level sheds further light on the
patterns of SME lending in MENA. As shown in Figures 4a-4b, all the distributions are
positively and strongly skewed, with a high concentration of institutions with small shares. In
the case of the GCC, some banks maintain shares of SME loans above 5% of total loans, but the
maximum share is 10%, still a low number by international comparison. In the non-GCC, a
large number of banks also operate with low shares, although there is also a sizable group of
3 Since the first draft of this paper was released, the authors have made further efforts to confirm and validate the
numbers. This has resulted in some adjustments of country averages, especially for Morocco, whose average of
SME lending in total lending declined from 33 percent to 24 percent.
8
banks that seem very engaged in SME lending, with shares of SME loans around one third of
total loans. A similar pattern is observed in the case of private banks. Most institutions operate
with low shares, but there is a sizable group that seems more engaged in the SME business. By
contrast, the distribution of SME lending among state banks is more uneven.
The clustering of banks operating with low shares of SME lending could reflect a set of common
obstacles such as weak financial infrastructure. The banks in the intermediate range of the
distribution could be operating in countries with better enabling environments, or could be doing
relationship lending with a large branch network, or could still be leading banks with more
advanced SME lending technologies. These questions will be pursued further in section 5.
4.2. Strategic Approach to SME Banking
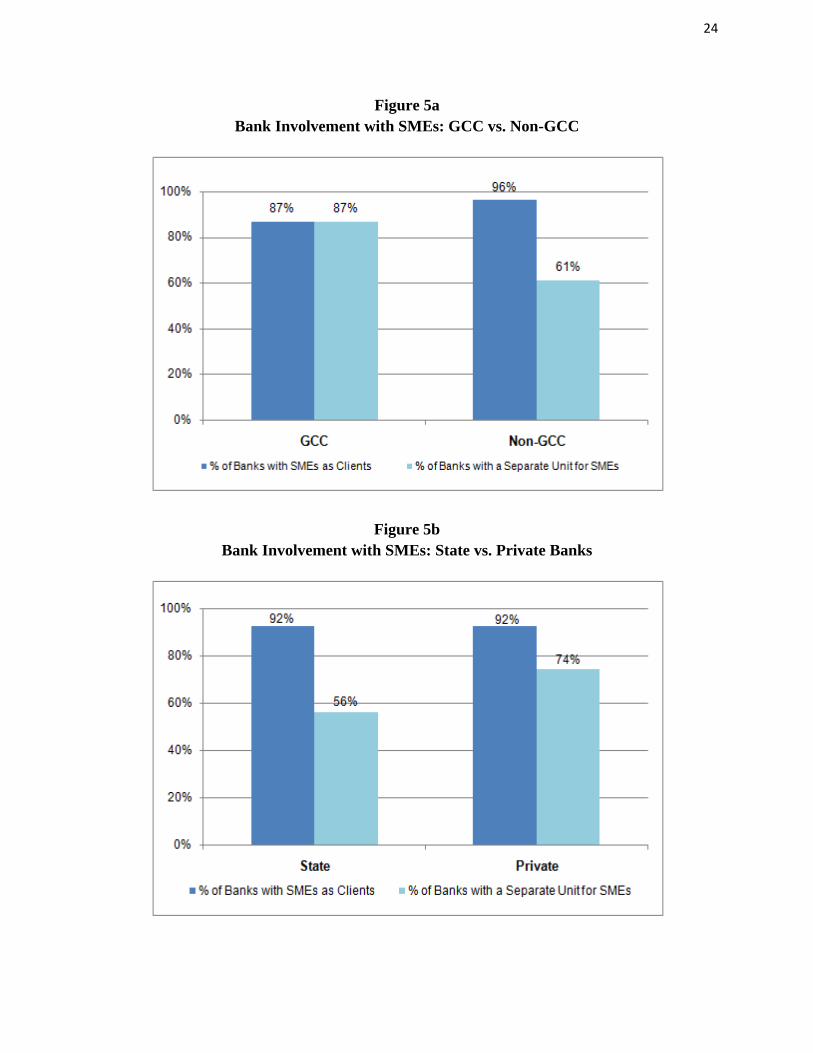
In line with other surveys, most banks in MENA are already engaged in the SME sector, despite
the low share of lending in many of these banks. As shown in Figure 5a, about 87 percent of
banks in the GCC already have SMEs as clients, and the same percentage already has a separate
unit to manage the SME business. The percentage of non-GCC banks that already has SMEs as
clients is even higher at 96 percent, as shown in Figure 5a. This is expected, given the relatively
higher importance of SMEs in non-GCC economies, and the higher average share of SME
lending among non-GCC banks. What seems surprising is the lower share of non-GCC banks
with a dedicated SME unit.
The lower share of non-GCC banks with dedicated SME units reflects to some extent the
relatively low share of state banks with these units (most state banks are in the non-GCC
countries). As shown in Figure 5b, although state banks are also very engaged in the SME
business, only 56 percent have already set up a separate SME unit, while in the case of private
banks this figure is significantly higher at 74 percent. All in all, these figures indicate that many
private banks are committed to SME lending and willing to allocate internal resources to develop
the SME business and reach their long-run targets for SME lending. Even in the GCC, where
SME lending plays a comparatively less important role, most banks have already a dedicated
SME unit presumably created to reach the proposed targets.
There are a number of common factors driving banks to engage with SMEs across regions and
ownership structures. In line with the previous surveys, the most important factor mentioned by
both GCC and non-GCC banks is the perceived profitability of the SME segment (Figure 6a).4
Other important and inter-related factors include the saturation of the market for large corporates
and the need to diversify the loan portfolio. The prospects of generating business through cross-
selling are rated as important or very important by a large share of GCC and non-GCC banks
alike. Interestingly, government programs are rated as relatively less important, especially in the
GCC. Government programs are generally more important among non-GCC banks, although a
closer look at the questionnaire reveals significant differences across non-GCC countries.
4 In this question the banks were asked to provide an answer following a four-point scoring scale: not important,
marginally important, important, and very important. The two highest scores are reported. The same format was
used for other questions in the survey.

9
A large share of state banks is also attracted to the SME business due to the perceived
profitability of the sector (Figure 6b), but the share is somewhat lower than the one for private
banks. Interestingly, supply chain links and cross selling do not seem to be important drivers for
state banks. These responses could reflect the broad policy mandates imposed on state banks to
serve the SME sector, or the lower level of development of SME strategies in these banks,
possibly also related to the absence of an SME unit in several of these banks.
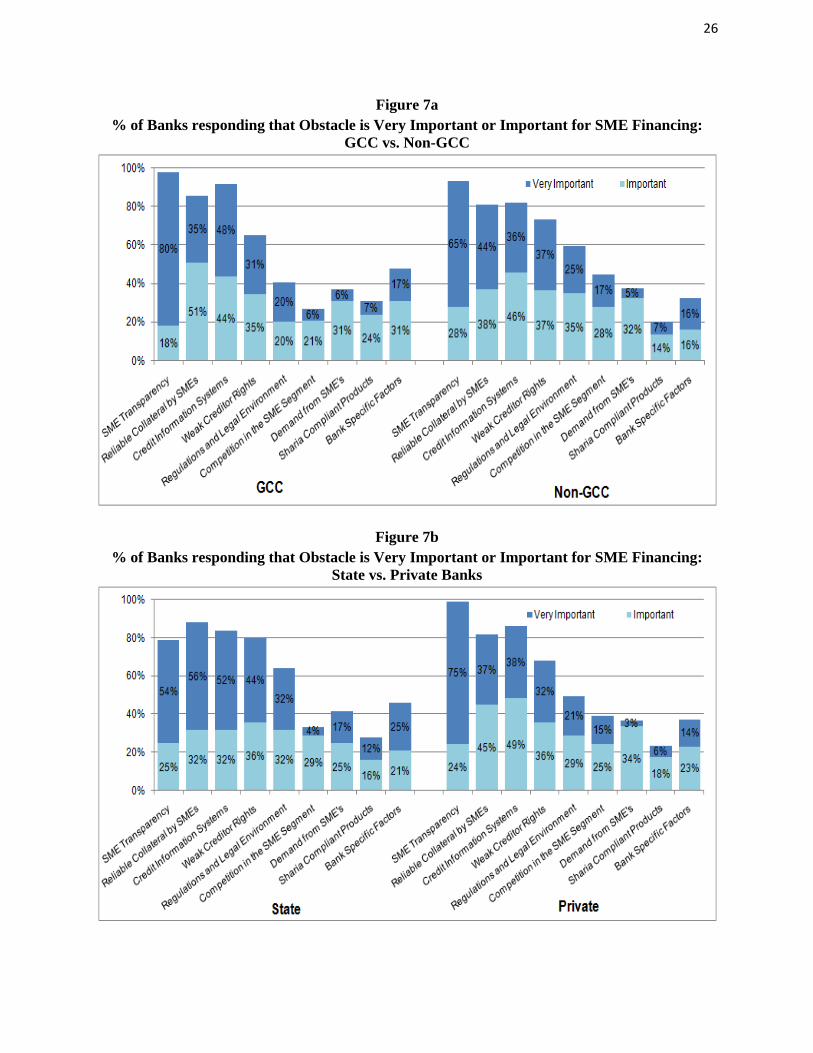
Regarding the obstacles to SME lending, the responses in the MENA survey were more clear and
consistent than those in the two previous surveys conducted in Latin America and worldwide.
As shown in Figures 7a and 7b, MENA banks complain primarily about SME opacity and about
the weak financial infrastructure (lack of reliable collateral, weak credit information systems, and
weak creditor rights). They complain much less about restrictive regulations (e.g. interest rate
controls), excessive competition in the SME segment, or weak demand for loans from SMEs.
This pattern is consistently observed in both GCC and non-GCC banks, and also between state
and private banks. Interestingly, however, a larger share of state banks indicated that their own
internal technical weaknesses constitute an obstacle to SME lending.
The contrast with the two previous surveys is striking. In the Latin American survey (de la
Torre, Martinez Peria, and Schmukler (2010)), banks indicated many types of obstacles,
including macroeconomic factors, regulations, and excessive competition in the SME business,
and the patterns were not consistent across countries. For example, the legal and contractual
environment was identified as an important obstacle in only two countries. In the survey
conducted by Beck, Demirguc-Kunt and Martinez Peria (2008), macroeconomic factors and
competition in the SME segment were also identified as the major obstacles, not the legal and
contractual environment. The greater concern expressed by MENA banks about the quality of
financial infrastructure is not surprising, considering that the region fares very poorly in this area.
As shown in Table 6, the region has the lowest legal rights index among all the regions.
Moreover, while the credit information index has improved in recent years, but the coverage of
credit reporting systems is still very limited.5
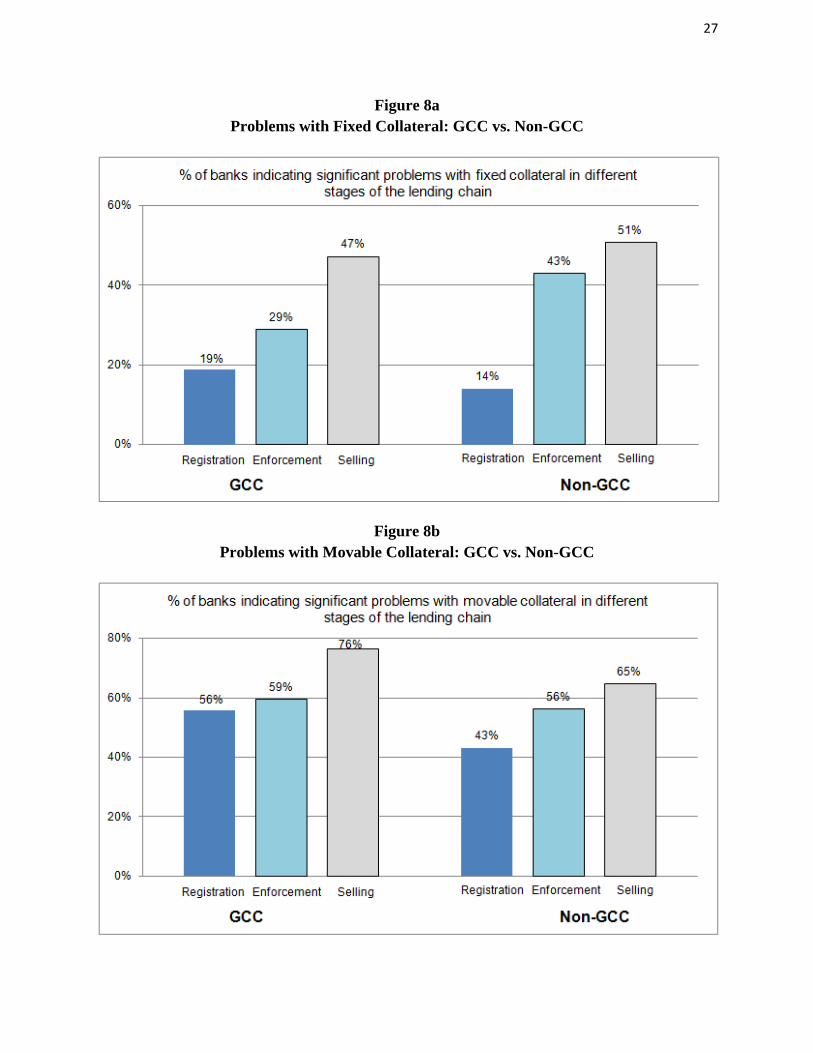
In order to obtain more detailed information on the weaknesses of collateral regimes in MENA –
an area where the region fares very poorly – the survey included questions on the problems faced
by banks on the different elements of the secured lending chain – especially the registration,
enforcement, and final sale of the seized collateral. Moreover, the questions were broken down
by fixed and movable collateral. The answers are reported in Figures 8a-8b and 8c-8d, for GCC
and non-GCC countries and for state and private banks.
As shown in Figures 8a-8d, there are significant problems in the registration, enforcement, and
selling of collateral, especially movable collateral. While a relative low share of banks reports
serious problems with the registration of fixed collateral, a high share of banks reports that
registries of movables remain very deficient. Enforcement of collateral is an even bigger
problem, especially for movables, but also for fixed collateral in the case of non-GCC banks.
Finally, an even larger share of banks reports problems in selling the seized collateral. Again,
5 Maddedu (2010) provides a detailed analysis of the quality of credit information systems in MENA, while Alvarez
de la Campa (2010) and Uttamchandani (2010) examine the effectiveness of collateral and insolvency regimes.
10
this is true for both GCC and non-GCC banks, and applies both to fixed and movable collateral.
The same pattern of responses applies to state and private banks, although it is also noticeable
that a larger share of state banks complains about the collateral regime than private banks. These
responses reveal that creditors perceive high risks in SME lending that can only be partially
offset through greater reliance on relationship lending, or through the use of other lending
techniques such as leasing and factoring, or even through access to a guarantee scheme.
4.3. SME Products
As shown in Figure 9a, almost all the banks that responded to the survey offer loans to SMEs,
with deposit and cash management accounts, trade finance, and payments and transfers following
closely behind as the most widely offered SME finance products. More than 85 percent of banks
in both regions reported offering each of these services, which confirms that SME finance is
much broader than SME lending, despite the tendency in literature to often equate the two.
Actual SME uptake of these services is likely to be higher for current accounts and payments –
which are used for daily transactions - than for loans and trade finance.
Only 76 percent of state banks offered payments and transfers, or trade finance, which was
markedly lower than for private banks at 88 percent and 94 percent respectively, and may reflect
a relative emphasis on more conventional SME lending (Figure 9b). At the other end of the
spectrum, services that are least widely offered are insurance (19 percent of GCC banks, 34
percent of non-GCC banks), and leasing (31 percent in GCC, 27 percent in non-GCC), and these
are typically offered through wholly-owned subsidiaries. A larger share of private banks offers
insurance and leasing products than state banks, but the differences are not very large.
It is perhaps surprising that neither leasing (a form of asset financing) or factoring (a form of
supply chain financing) are more developed among MENA banks, as these technologies seem to
offer a solution to weaknesses in legal and contractual regimes.6 However, while leasing and
factoring are in principle well suited to countries with weak collateral regimes, in practice weak
protection of ownership rights and contract enforcement dilute or even eliminate their supposed
advantages. The low presence of banks in leasing can be explained in many MENA countries by
the lack of clarity in the legal framework for leasing, including leasing definition, balance in
responsibilities between lessor and lessee, regulations for different forms of leasing, a
cumbersome process for registering leased assets, weak asset repossession processes, and
unfavorable tax treatment.7 Follow-up interviews with some MENA banks also revealed
difficulties in disposing of the repossessed assets in thin secondary markets.
An analysis of distribution channels used by banks to service SMEs points to the importance of
branches offering services tailored to SME needs, which may reflect the continuing importance
of „relationship banking‟ (Figures 10a-10b). „Limited service branches‟ including dedicated
SME business center branches are widely used distribution channels. Private banks are the
largest users of limited service branches (94 percent), and place less reliance on full service
6 This view is commonly expressed in the SME Finance literature. See e.g., Berger and Udell (2006), De la Torre,
Martinez Peria, and Schmukler (2010). 7 See Al-Sugheyer and Sultanov (2010).
11
branches (39 percent for private banks, 56 percent for state banks). This suggests a greater
emphasis by private banks on cost efficiency, and perhaps also that state banks may benefit from
a legacy of more extensive branch networks. ATMs are important, but mobile branches are not
widely used for SME financing, although points of sale (POS) are widely used by GCC banks
(58 percent) for services such as payments, transfers, and potentially also withdrawals and
deposits. The low use of mobile branches and agents may reflect a lack of emphasis on serving
rural SMEs, or restrictive regulations on the use of agents to offer banking services, although it
may also suggest that a minimum level of bank staff is required to adequately meet SME needs.
GCC banks are much more active in Islamic Finance than non-GCC banks, with 59 percent of
GCC banks offering Shariah-compliant products, as versus 30 percent of non-GCC banks
(Figure 11a). A further 32 percent of GCC banks plan to offer Islamic products in the next 12
months, and 26 percent of non-GCC banks. This implies that up to 91 percent of GCC banks are
or will be engaged in Islamic finance, and over half (56 percent) of non-GCC banks. State banks
seem more engaged in Islamic finance than private banks, although by a narrow margin. All
banks offering Shariah-compliant products offer Murabaha (cost plus) financing, which is more
typically used for working capital. Ijara, which is similar to leasing, is the next most prevalent
for GCC, private and state banks. Islamic finance seems to be an area of increasing involvement
for both GCC and non-GCC banks.
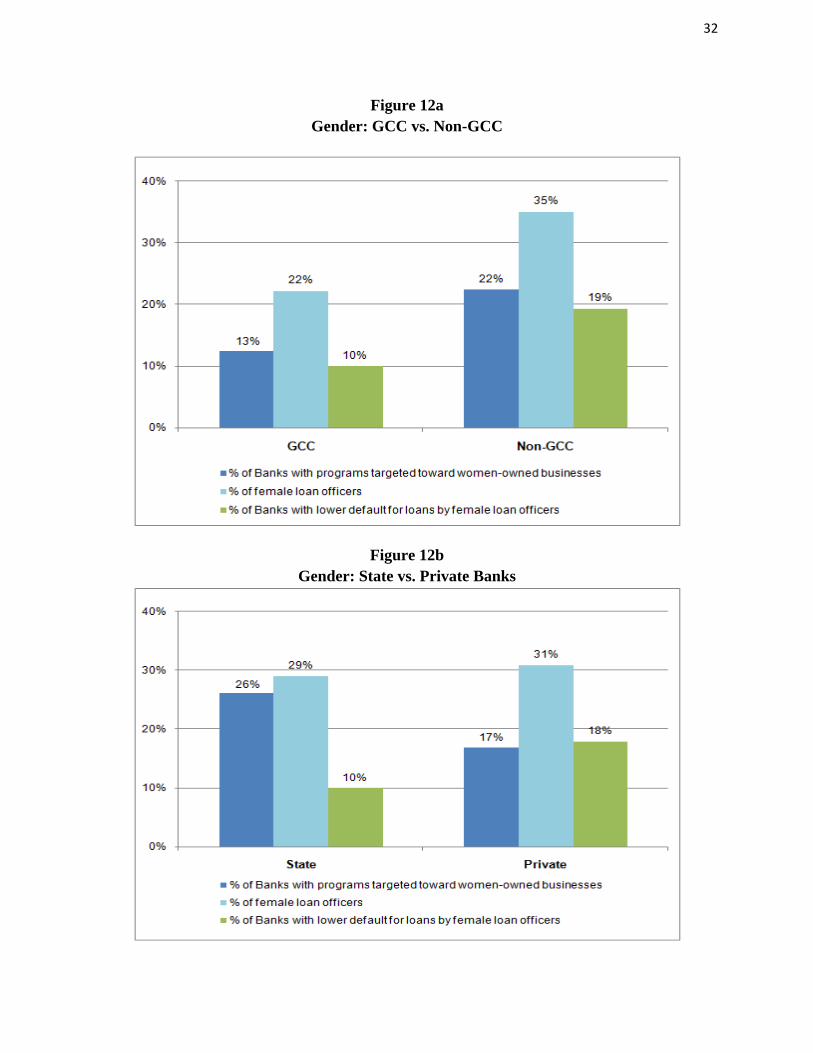
A very low share of banks run programs targeted at female-owned businesses. As shown in
Figure 12a, only 13 percent of GCC banks maintained this type of program, and the figure in the
non-GCC was not much higher (22 percent). Interestingly, state banks seem more proactive than
private banks in this area, as shown in Figure 12b. It is also noticeable that only 22 percent of
loan officers of GCC banks are women (35 percent for non-GCC banks). This is despite the
additional access to finance constraints that women can face, and the fact that in some MENA
countries only female loan officers can deal with female clients, particularly for site visits.
Finally, a very low share of banks reported that female loan officers are better at managing risk
and ensuring client repayment – only 10 percent of GCC banks and 19 percent of non-GCC
banks reported that the percentage of defaulted loans was lower for female loan officers. The
great majority of respondents indicated that there were no significant differences in loan
performance, while a few reported that male officers performed better. This seems in contrast
with research showing that the default probability for female loan officers can be as much as 4.5
percent lower than for their male counterparts.8
4.4. Risk Management
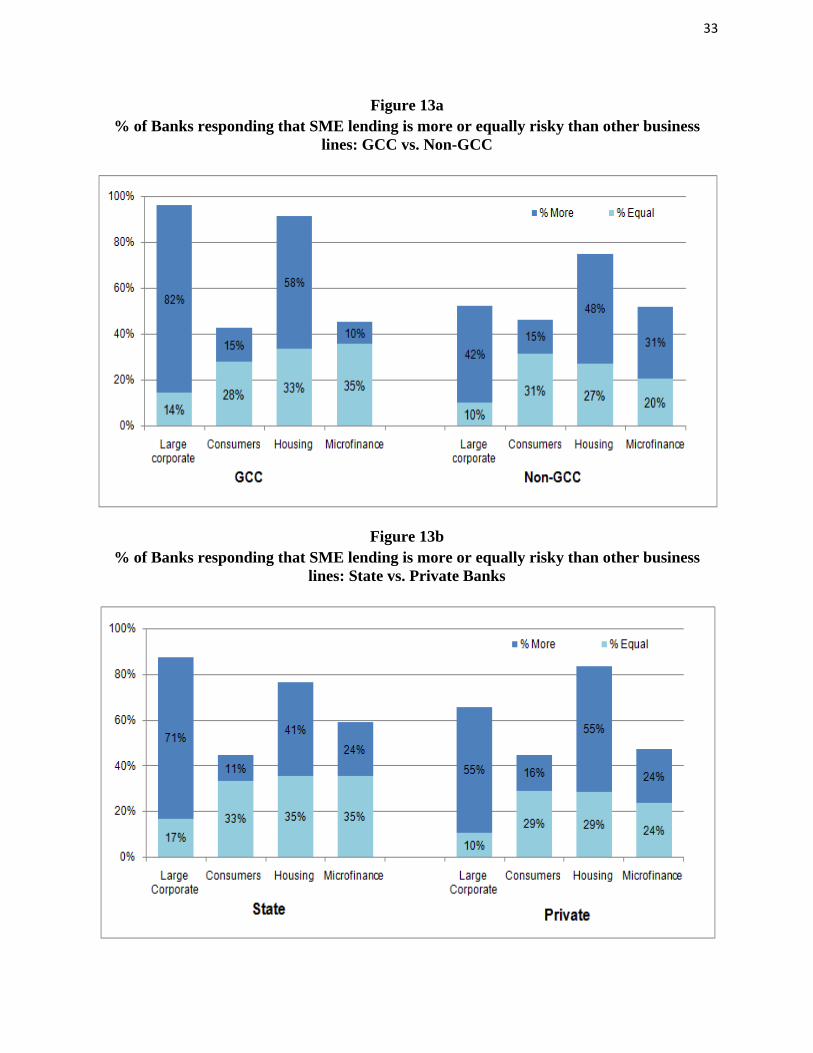
A large share of GCC banks perceives SMEs as riskier than large corporates and housing loans,
as shown in Figure 13a. This result is consistent with the low share of SME loans in the loan
portfolio of GCC banks, and with the large share of GCC banks that have set up SME units to
develop the SME business while managing the perceived high risks. SMEs are also perceived to
be risky by non-GCC banks, but not nearly to the same degree. Intriguingly, a larger share of
state banks perceive SMEs as riskier than large corporates, relative to private banks (Figure 13b),
8 Beck, Behr, and Guttler (2009).

12
but this perception does not prevent them from engaging in the SME business, possibly
reflecting their mandates to fill the SME financing gap, regardless of the associated risks.
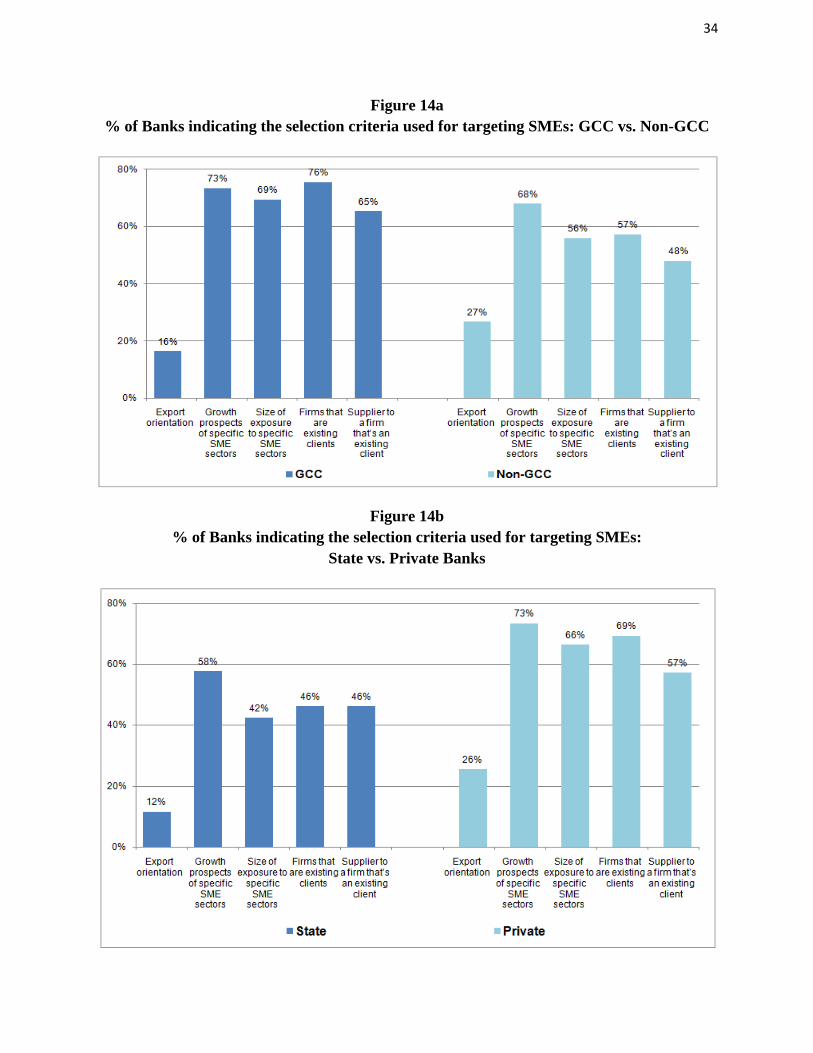
GCC banks seem to adopt stricter selection criteria for engaging in SME lending, relative to non-
GCC banks. As shown in Figure 14a, in selecting potential SMEs, a larger share of GCC banks
considers specific factors such as the growth prospects of specific SME sectors, the size of their
exposure to these sectors, and the existing clientele. The apparently stricter selection criteria
adopted by GCC banks is consistent with the higher perception of risk in the SME business
among these banks, and with the smaller volumes of SME lending as well. Interestingly, GCC
banks do not target exporting SMEs, a result which can be explained by the limited number of
exporting SMEs in oil economies (Figure 15c).
At the same time, the apparently lesser relevance of selection criteria among non-GCC banks
disguises large differences between state and private banks. As shown in Figure 14b, a much
lower share of state banks adopts selection criteria to identify and screen their clients and build
up their SME portfolios than private banks. This again probably reflects the broad mandates of
state banks to fill the SME financing gap and serve the SME sector.
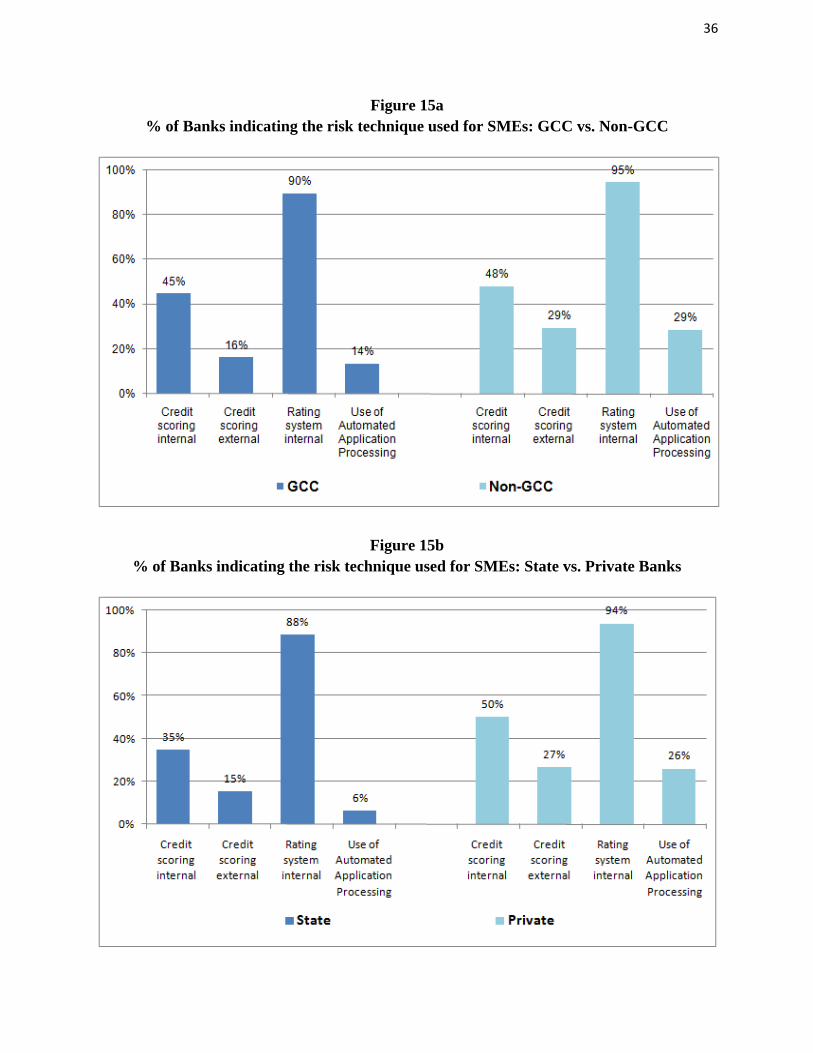
Less than half of GCC and non-GCC banks have developed internal scoring models to assess the
risk of current and prospective clients (Figure 15a). An even smaller share makes use of external
scoring. Since most public registries and private credit bureaus still do not provide scoring
models, the respondent banks are referring to models developed by external consulting firms,
frequently non-customized models. Almost all the banks are making an effort to develop
internal rating systems, combining credit scores of the owner with other information from the
SME, both qualitative and quantitative. It is noticeable that very few banks use automated
application processing. This result reflects to some extent the weak state of development of
credit reporting systems in MENA, and the limited reliance on the quality of internal credit
scores. However, the other two surveys also reported that internal scoring is only one element in
the lending decision, suggesting that many banks in other developing countries are struggling
with similar challenges.
At the same time, the average results reported by non-GCC banks disguise significant differences
between state and private banks. As shown in Figure 15b, a significantly lower share of state
banks has developed internal credit scores or internal ratings systems, and a very low share has
adopted automated application processing, again revealing that these banks have not developed
their SME lending technologies and risk management systems as much as the private banks.
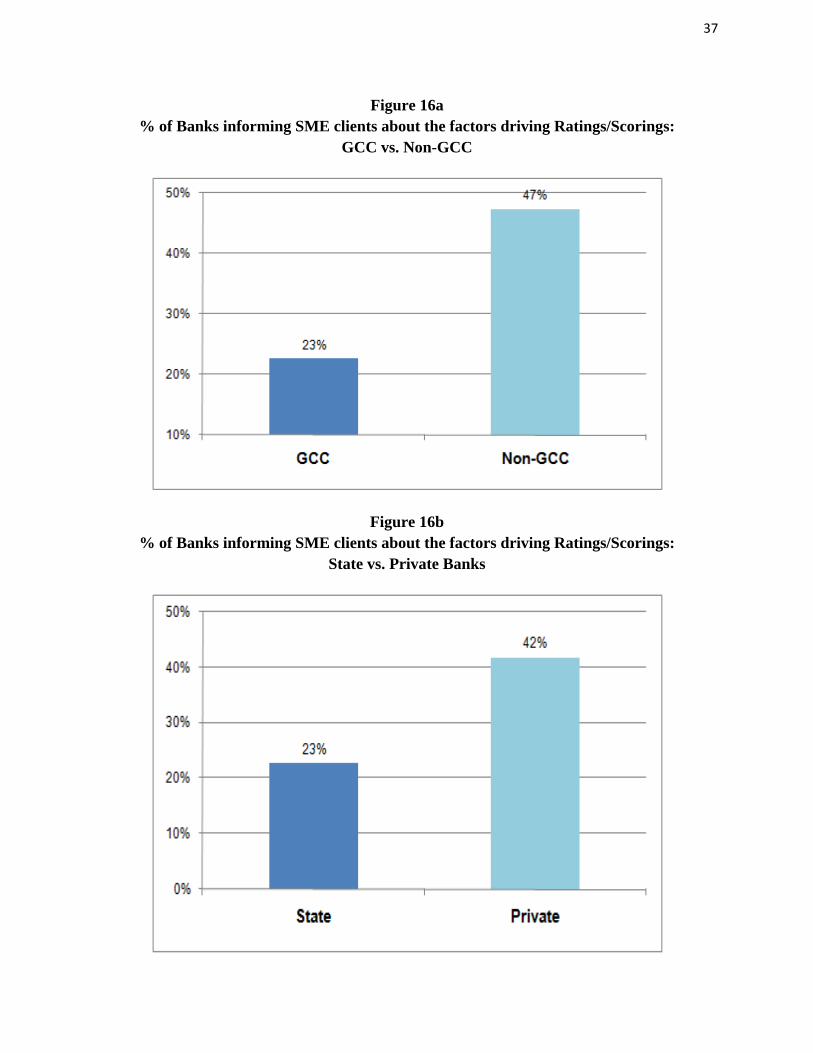
A very low share of GCC banks informs their SME clients about the factors driving their internal
score or ratings, as shown in Figure 16a. The same is true for state banks, as shown in Figure
16b. In the case of state banks, this result is probably associated with the low development and
use of credit scores. In any case, these are not welcome findings, as they reveal missed
opportunities to increase awareness among SMEs of their weaknesses and encourage
improvements in performance.9 A much larger share of non-GCC and private banks informs
9 Ayadi (2005).
13
their SME clients about the factors driving their scores/ratings, but there is clearly scope for
further improvements here as well.
MENA banks conduct stress tests to assess their exposures to large losses, but by very different
degrees. As shown in Figure 17a, GCC banks seem particularly concerned with the slowdown of
particular sectors, especially hydrocarbons and real estate and much less concerned with
currency shocks. This is not surprising considering that these banks operate in highly
concentrated oil economies with abundant foreign reserves. By contrast, non-GCC banks are
more concerned with currency and commodity price shocks, reflecting their higher
vulnerabilities in these areas. However, the most striking finding is the large differences
between state and private banks (17b). In general, a much lower share of state banks conducts
regular stress tests than private banks, despite their mandates and the associate risks that they
take, including the risks in the SME lending business.
A large share of GCC banks imposes higher collateral requirements on SMEs, relative to large
corporates, as shown in Figure 18a. This again reflects the higher perception of risk in the SME
business among GCC banks. When asked about the reasons for the higher collateral, a large
share of GCC banks indicated that the lack of stability, competent management, and difficulties
to evaluate SMEs were very important reasons (see the upper part of the bars in Figure 18b). By
contrast, less than half of non-GCC banks impose higher collateral on SMEs. The reasons for
the higher collateral are the same but the relative importance is generally lower.
Again, the average responses reported by non-GCC banks disguise important differences
between state and private banks. As shown in Figure 18c, it is noteworthy that only 45 percent
of state banks impose higher collateral requirements on SMEs, a small share by comparison with
that of private banks – 64 percent. This difference holds despite the fact that a large share of
state banks complains about the lack of SME stability and the difficulty to evaluate SMEs. This
result again reveals that state banks are willing to take higher risks and be exposed to larger
losses, relative to private banks, in order to fulfill their mandates.
Assessing the status of compliance with Basel 2 provides some information on a bank‟s capacity
to manage risks in general, including the risks of the SME portfolio. It is also relevant for
assessing the possible impact on SME lending, as banks can benefit from lower capital charges
under certain conditions. As shown in Figure 19a, a large share of GCC banks has already made
progress in adopting Basel 2. Most banks are adopting the standardized approach, which in
principle should enable them to classify SMEs in the retail portfolio and get a lower capital
charge. By contrast, one third of non-GCC banks have not yet adopted Basel 2, suggesting that
they are generally behind in their capacity to manage risks.
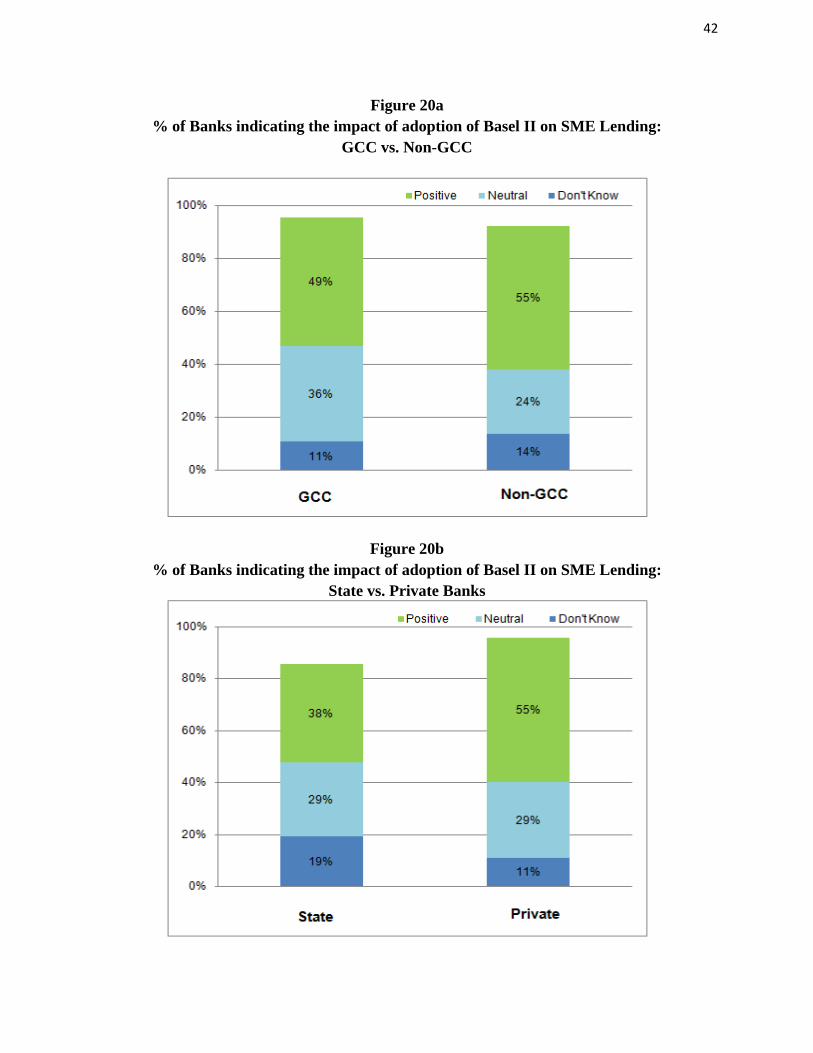
The breakdown of the responses between state and private banks provides additional insights.
As shown in Figure 20b, almost half of state banks have not yet adopted Basel 2, a much higher
share than that reported by private banks. This suggests again that state banks in MENA have
generally lagged behind in the development of their governance and risk management systems,
despite the fact that these banks are fulfilling mandates and taking credit risk.
14
A large share of MENA banks indicates that the impact of the adoption of Basel II on SME
lending will be either neutral or positive. As shown in Figures 20a-20b, this response was
consistent across banks. These responses are also consistent with a study commissioned by the
European Commission with the objective to assess the consequences of Basel II on the European
economy with particular attention to SMEs – it concluded that the overall impact of Basel II
would be positive for Europe‟s SMEs, despite possible variations across sectors, segments of
SMEs, regions, and other dimensions.10
5. A Preliminary Analysis of the Dataset
This section provides an econometric analysis of the dataset to explore further the factors that
contribute to SME lending in MENA. More specifically, we want to test further the differences
between regions and ownership structures while controlling for other factors. We also want to
examine whether large banks play an important role in SME finance (Berger and Udell, 2006; de
la Torre et al., 2008 and Beck et al., 2009), and whether banks are engaged in relationship
lending (Berger et al., 1995, 2001; Berger and Udell, 1996; Sengupta, 2007). Finally, we want to
assess the impact of financial infrastructure and special interventions such as partial credit
guarantee schemes on overall SME lending and the share of SME investment loans.
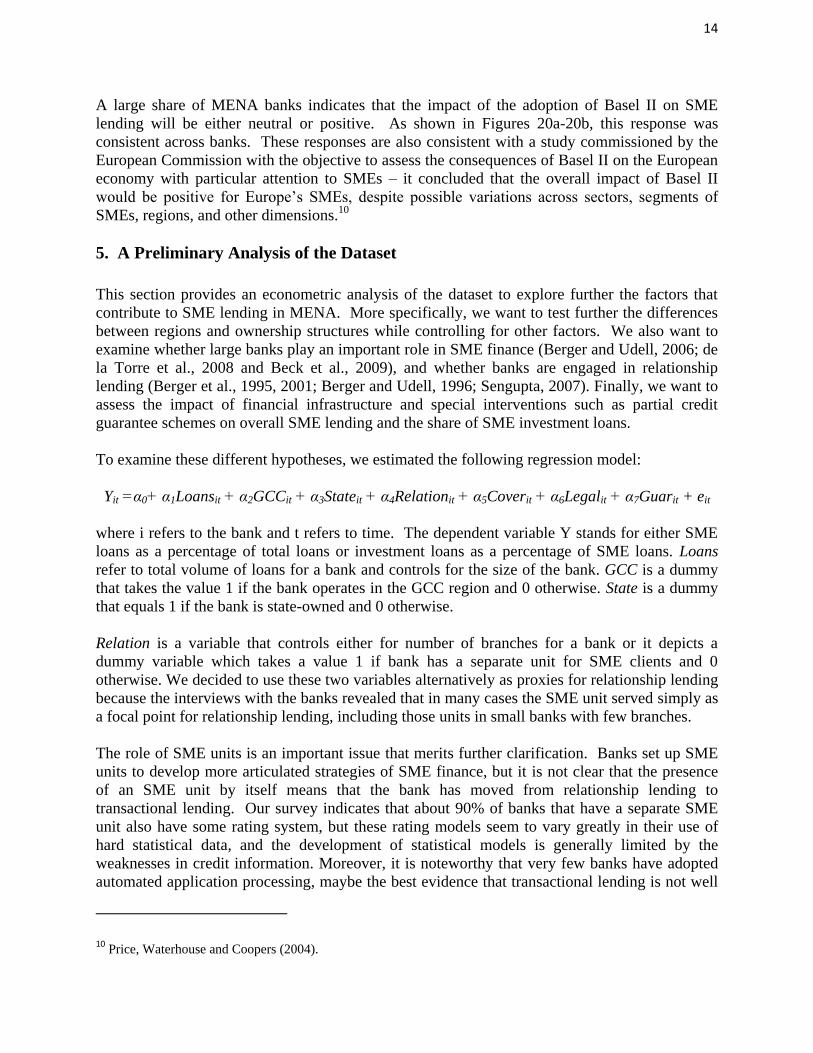
To examine these different hypotheses, we estimated the following regression model:
Yit =α0+ α1Loansit + α2GCCit + α3Stateit + α4Relationit + α5Coverit + α6Legalit + α7Guarit + eit
where i refers to the bank and t refers to time. The dependent variable Y stands for either SME
loans as a percentage of total loans or investment loans as a percentage of SME loans. Loans
refer to total volume of loans for a bank and controls for the size of the bank. GCC is a dummy
that takes the value 1 if the bank operates in the GCC region and 0 otherwise. State is a dummy
that equals 1 if the bank is state-owned and 0 otherwise.
Relation is a variable that controls either for number of branches for a bank or it depicts a
dummy variable which takes a value 1 if bank has a separate unit for SME clients and 0
otherwise. We decided to use these two variables alternatively as proxies for relationship lending
because the interviews with the banks revealed that in many cases the SME unit served simply as
a focal point for relationship lending, including those units in small banks with few branches.
The role of SME units is an important issue that merits further clarification. Banks set up SME
units to develop more articulated strategies of SME finance, but it is not clear that the presence
of an SME unit by itself means that the bank has moved from relationship lending to
transactional lending. Our survey indicates that about 90% of banks that have a separate SME
unit also have some rating system, but these rating models seem to vary greatly in their use of
hard statistical data, and the development of statistical models is generally limited by the
weaknesses in credit information. Moreover, it is noteworthy that very few banks have adopted
automated application processing, maybe the best evidence that transactional lending is not well
10 Price, Waterhouse and Coopers (2004).

15
developed in MENA yet. Therefore, while many SME units seem to be developing more
sophisticated lending techniques, in most cases they are still conducting relationship lending,
although in a more effective way.
We also look at how the quality of financial infrastructure in a country affects SME lending.
Cover is a variable that represents the volume of credit information provided to lenders by public
credit registries or private credit bureaus. This variable is based on information from the World
Bank‟s Doing Business Database and is defined by the highest coverage ratio of either the public
registry or the private bureau.11
The Legal variable measures the quality of the legal and
contractual framework, and is represented by several alternative legal indicators from the World
Bank‟s Doing Business database. We use: (i) the legal rights index that measures the degree to
which collateral and bankruptcy laws protect the rights of lenders, (ii) the time to register a
property, (iii) the time to enforce a contract and (iv) the time to close a business. All these
indicators capture the strength of creditor rights and the risks of SME lending.
Finally, we look at the impact of a particular type of government intervention – partial credit
guarantee schemes (PCGs). These schemes have become a popular tool to stimulate SME
lending in many countries, and 10 MENA countries have already introduced such schemes.12
Guar is a variable that measures the size of PCGs through the ratio of outstanding guarantees to
GDP. Table 7 provides information on the stock of outstanding guarantees (in % of GDP) of
MENA PCGs. Some schemes are still very young and have not yet accumulated a significant
volume of guarantees.
Our analysis includes all the countries listed in Table 1 except for Libya (where we could not
verify the data). Most banks reported information for at least two years in the 2007-2009 period,
allowing us to build a panel of about 240 observations. The appendix tables provide descriptive
statistics of the variables used in the regression, the correlation matrix and the definitions and
sources of the variables.
For estimation we first use Ordinary Least Squares (OLS), where we relax the assumptions of
independence and homoskedasticy and report two sets of standard errors: Huber/White robust
standard errors and robust standard errors corrected for possible intra-bank correlation. We
realize the potential endogeneity of the partial credit guarantee variable – the volume of
outstanding guarantees reflects at least partly the demand for guarantees from banks lending to
SMEs. Therefore, we also use Two State Least Squares (2SLS) and employ the lag of
outstanding guarantees and the median statutory coverage ratios of the guarantee schemes as
instrumental variables (IVs). The coverage ratio is the share of the loan which is guaranteed and
is one of the key statutory rules of a guarantee scheme. Coverage ratios remained constant
during the estimation period and it can be argued that they only affected SME lending through
11 We also used the sum of coverage of credit registry and credit bureau and our results did not change significantly.
We prefer to use the maximum coverage indicator, as the sum can result in significant double counting of coverage. 12 Saadani, Arvai, and Rocha (2010) provide an assessment of PCGs in MENA. The IFC (2010) provides an overall
assessment of policy interventions that have been introduced to induce more lending.
16
the operations of the guarantee scheme. These IVs seem reasonable and also satisfy the formal
tests of instrument validity and relevance in most of the regressions.13
OLS results are reported in Tables 8.1 and 8.2, while 2SLS results are reported in Tables 8.3 and
8.4. In Tables 8.1 and 8.3, the share of SME loans in total loans is the dependent variable, while
Tables 8.2 and 8.4 report the results for the share of investment loans in SME loans as the
dependent variable. In all the tables we report separately the results for the number of branches
or the presence of a dedicated SME unit as the measure of relationship lending. We also report
separately the results for each of the four legal indicators.
Total loans have a negative and mostly significant coefficient for both OLS and 2SLS results
(Tables 8.1 and 8.3). This shows that large banks are less engaged in SME lending, controlling
for other factors. Tables 8.2 and 8.4 show that large banks are also less involved in long-term
SME lending, although these results are not so robust as those in the previous regressions.
Overall, these results are probably capturing the presence of large wholesale banks in the MENA
region that are primarily engaged in project finance and do not target SMEs.
The GCC dummy coefficient is negative and significant in Tables 8.1 and 8.3, suggesting that
the share of SME loans remains significantly lower among GCC banks after controlling for other
factors, a result consistent with our earlier analysis. The same pattern holds for investment
lending to SMEs. As shown in Tables 8.2 and 8.4, GCC banks are also less engaged in long-
term SME lending relative to non-GCC banks.
The state dummy coefficient in Tables 8.1 and 8.3 is not statistically significant, indicating that
there are no significant differences between state and private banks regarding overall SME
lending. This result confirms our previous analysis that state banks remain important players in
SME finance in the MENA region. Moreover, the results in Table 8.2 and 8.4 suggest that state
banks do more investment lending than private banks – the coefficient of the state dummy is
positive and mostly significant, even when the errors are clustered. We note that although the
difference between the simple averages of the share of investment loans is not statistically
significant (Table 5), it becomes significant when controlling for other factors. The result
confirms that state banks are taking more risk in SME lending and compensating for the
weaknesses in financial infrastructure, as discussed in the previous section.
Banks in the MENA region still seem to rely on relationship lending, possibly to compensate for
the weak financial infrastructure. As shown in Tables 8.1 through 8.4, the coefficient of the
branch variable is positive and significant in many regressions, especially where the share of
investment loans in SME loans is the dependent variable. Interestingly, the reverse seems to
happen with SME unit dummy. It is positive and significant in most regressions where the share
of SME loans is the dependent variable, but not significant when the share of investment loans is
the dependent variable. These results are not always uniform, but suggest that banks use
relationship lending to overcome information asymmetries and the opaqueness of SMEs. As
mentioned before, the survey does not allow us to identify the extent to which these SME units
are relying on statistical models in their lending decisions. There is a movement in the direction
13 We also tested the share of government ownership in the scheme as an instrument and obtained similar results.
17
of transactional lending, but we note again that power of these techniques is still limited by the
poor quality of credit information in most MENA countries.
The coefficient of the variable measuring coverage of credit information is positive but generally
not significant when the share of SME loans is the dependent variable (Tables 8.1 and 8.3). It
performs slightly better when the share of investment loans is the dependent variable (Tables 8.2
and 8.4), but the results for this variable are rather disappointing, as MENA banks report the lack
of good credit information as one of the major obstacles to further SME lending. It is possible
that statistical testing within a MENA-only sample is hindered by the limited variability of
coverage ratios in the region. As mentioned before, the region does not fare well in this area and
most MENA countries report very low coverage ratios, especially the Non-GCC countries.
The four variables measuring the quality of the legal framework have the expected signs and are
generally significant in Tables 8.1 and 8.3. Although MENA does not compare well with other
regions in this area either, these results show that the countries that have made an effort to
strengthen creditor rights have succeeded in increasing the share of SME lending. Interestingly,
the legal variables are not significant when the share of SME investment loans is the dependent
variable (Tables 8.2 and 8.4). This suggests that the legal framework affects the overall volume
of SME lending but not its composition. In other words, a strong legal framework promotes
SME lending overall by facilitating the recovery of the loan and/or the collateral, but may not
have such a strong impact on the decision to extend the maturity of the loan.
Finally, the variable measuring the size of guarantee schemes is positive and significant in most
OLS regressions reported in Tables 8.1 and 8.2. This implies that these schemes have
contributed both to more SME lending and to a higher share of investment lending. Indeed, the
countries which seem to have a larger share of SME lending in MENA – Morocco, Lebanon and
Tunisia – also have larger guarantee schemes, as shown in Figure 3a and Table 7. Moreover,
Tables 8.3 and 8.4 show that the credit guarantee variable remains generally positive and
significant after correcting for endogeneity bias, especially when the total share of SME loans is
the dependent variable.
These results suggest that guarantee schemes have contributed to SME lending in a period when
MENA countries are still addressing their weaknesses in financial infrastructure. At the same
time, it is also important to stress that these results do not necessarily imply that these guarantee
schemes are cost-effective, additional, or promote good practice SME lending. For example,
whether they are able to target and reach the maximum possible number of credit constrained
SMEs with the volume of guarantees offered (cost-effectiveness), or whether banks use the PCG
to extend loans to start-up or smaller SMEs (additionality). In this regard, Saadani, Arvai and
Rocha (2010) provide a preliminary assessment of PCGs in MENA and argue that there is scope
for design improvements leading to gains in outreach and additionality.
All in all, these results are consistent with the survey responses reported in the previous section.
They are admittedly subject to a number of limitations, including possible measurement errors in
the dependent variable (due to different definitions of SMEs adopted by the banks), the narrow
variance of some of the right hand side variables, and also the limitations of some of the
indicators used. The regressions explain only about one third of the variations in SME lending

18
across banks, indicating the existence of other important bank and country-level effects. For
example, some individual banks have better strategies and lending technologies, and there are
country-level effects and programs that are not easily measurable (e.g. interest subsidies,
exemptions on reserve requirements). Even acknowledging these caveats, however, we believe
that the results are insightful and help in initiating more research in this important area.
6. Summary of Findings and Policy Implications
This paper reports the results of a survey of SME lending with unusually high coverage of banks
in the MENA region. The paper shows that the average SME loan portfolio in MENA is
relatively small amounting to less than 8 percent of total loans. The survey also shows the wide
differences in the scale of SME lending between GCC and non-GCC countries (much smaller in
the former group), as well as the scope for further SME lending in both sets of countries,
revealed by the large difference between the long-run targets and the actual lending levels.
State banks play an important role in SME lending in many MENA countries, to a large extent a
compensatory role for the low private bank involvement in SME finance in these countries.
Moreover, state banks seem to take more risk than private banks, as indicated by broader
selection criteria, more exposure to term lending, and softer collateral requirements. However,
they do not seem to have developed sufficient risk management capacity to manage these risks –
a smaller share of state banks has introduced dedicated SME units, adopted internal scoring
models, and conducted regular stress tests to monitor the risks related to SME lending.
Several MENA countries have introduced credit guarantee schemes, and there is some evidence
that these schemes may have contributed to more SME lending. The countries with the largest
shares of SME loans in the total loan portfolio are the ones with the largest schemes, and the
statistical analysis of the dataset also suggests that credit guarantee schemes may have induced
more SME lending, controlling for other factors. However, these results do not necessarily mean
that MENA credit guarantee schemes are cost-effective, in the sense of reaching the maximum
number of viable and credit-constrained SMEs within their overall guarantee envelope.
These and other policy interventions are in many countries compensating for weaknesses in
financial infrastructure, including weaknesses in collateral and insolvency regimes, as well as
deficiencies in credit information systems. These interventions may be well justified, but they
should not be the main components of the architecture of SME finance in the MENA region.
Improving financial infrastructure should be the priority item in the policy agenda of MENA
countries. MENA banks report that deficiencies in financial infrastructure are one of the major
obstacles for further SME lending, and the statistical analysis of the dataset largely confirms this
survey result. Improving financial infrastructure will entail expanding the range of movable
assets that can be used as collateral, improving registries for movables, and improving
enforcement and sales procedures for both fixed and movable assets. It also entails upgrading
public credit registries, and more importantly, introducing private credit bureaus capable of
significantly expanding coverage and the depth of credit information.

19
Competition policy can also contribute to further SME lending. The survey results suggest that
there are private banks that have more effective lending technologies and that are able to
generate and manage a significant SME portfolio, even within weak enabling environments. The
entry of these banks into other MENA countries could contribute to more SME lending, both
directly and through spillover effects. In this case, the policy implication is to ensure that entry
requirements are not overly restrictive and that banking markets remain contestable. Moreover,
the impact of the entry of foreign banks on SME lending can be magnified if there are credit
registries/bureaus with good coverage and depth providing these new foreign banks access to
substantive credit information on prospective SME borrowers.14
Governments play a critical role in promoting an enabling environment in which private banks
can fulfill their SME finance targets prudently and responsibly. In the interim, state banks would
be well advised to place a higher emphasis on risk management, so that the greater risks they are
currently taking in extending SME finance arise from well informed decisions and are better
monitored. Likewise, credit guarantee schemes can play an important role and can even be
expanded in some countries, but most schemes can be improved in design and should start
conducting comprehensive reviews that include evaluations of impact.
Lastly, it is important to recognize that the potential for SME finance is also a function of the
structure of the economy and the size of the SME sector. In the case of non-GCC countries, there
is huge potential for expanding SME finance, with large numbers of smaller enterprises
underserved and low levels of bank competition to serve them. In the case of GCC countries, the
size of the SME sector may remain more constrained by the nature of oil economies, but there is
also scope for further SME finance, especially if access to finance is also expanded for resident
non-nationals.
14 Maddedu provides a review of credit reporting systems in MENA (2010). Azoategui, Martinez Peria, and Rocha
(2010) provide an analysis of bank competition in MENA, showing that the region is generally less competitive than
other regions, and also showing that bank competition indices are determined inter alia by entry regulations, and the
quality of credit information.

20
Figure 1a
Share of Firms with a Loan/Line of Credit from Financial Institutions
Figure 1b
% of Firms with a Loan/Line of Credit from Financial Institution, MENA and other
Regions
Figure 1c
% of Investment Finance by Bank Financing, MENA and other Regions
Source: World Bank Enterprise Surveys (2006-2009)
21
Figure 2a
SME Loans/Total Loans (%) and SME Lending Targets (%)*: GCC vs. Non-GCC
* Weighted by total loans.
Figure 2b
SME Loans/Total Loans (%) and SME Lending Targets: State vs. Private

22
Figure 3a
SME Loans/Total Loans (%)*: MENA Countries
*Reported numbers are weighted averages and Non-GCC average includes Iraqi banks that were not reported
in the graph as the coverage Iraq is not more than 30%.
Figure 3b
Comparison of Enterprise Surveys and SME Banking Survey
Source: ICA assessments, MENA SME survey.

23
Figure 4a SME Loans/Total Loans (%): GCC vs. Non-GCC Bank
Skewness: 1.39 Skewness: 1.52 Kurtosis: 3.94 Kurtosis: 5.78
Figure 4b SME Loans/Total Loans (%): State vs. Private Bank
Skewness: 1.35 Skewness: 1.96 Kurtosis: 3.90 Kurtosis: 7.36
02
46
810
Fre
quen
cy
0 2 4 6 8 10SME Loans % of Total Loans - GCC
02
46
810
Fre
quen
cy
0 20 40 60 80SME Loans % of Total Loans - Non-GCC
01
23
Freq
uenc
y
0 10 20 30 40SME Loans % of Total Loans - State
010
2030
Freq
uenc
y
0 20 40 60 80SME Loans % of Total Loans - Private
24
Figure 5a
Bank Involvement with SMEs: GCC vs. Non-GCC
Figure 5b
Bank Involvement with SMEs: State vs. Private Banks

25
Figure 6a
% of Banks responding that Driver is Very Important or Important for SME Financing:
GCC vs. Non-GCC
Figure 6b
% of Banks responding that Driver is Very Important or Important for SME Financing:
State vs. Private Banks
26
Figure 7a
% of Banks responding that Obstacle is Very Important or Important for SME Financing:
GCC vs. Non-GCC
Figure 7b
% of Banks responding that Obstacle is Very Important or Important for SME Financing:
State vs. Private Banks
27
Figure 8a
Problems with Fixed Collateral: GCC vs. Non-GCC
Figure 8b
Problems with Movable Collateral: GCC vs. Non-GCC

28
Figure 8c
Problems with Fixed Collateral: State vs. Private Banks
Figure 8d
Problems with Movable Collateral: State vs. Private Banks

29
Figure 9a
Products and Services offered to SMEs: GCC vs. Non-GCC
Figure 9b
Products and Services offered to SMEs: State vs. Private Banks

30
Figure 10a
% of Banks using various Distribution Channels to serve SMEs: GCC vs. Non-GCC
Figure 10b
% of Banks using various Distribution Channels to serve SMEs: State vs. Private Banks

31
Figure 11a
Shariah-compliant Products: GCC vs. Non-GCC
Figure 11b
Shariah-compliant Products: State vs. Private Banks
32
Figure 12a
Gender: GCC vs. Non-GCC
Figure 12b
Gender: State vs. Private Banks
33
Figure 13a
% of Banks responding that SME lending is more or equally risky than other business
lines: GCC vs. Non-GCC
Figure 13b
% of Banks responding that SME lending is more or equally risky than other business
lines: State vs. Private Banks
34
Figure 14a
% of Banks indicating the selection criteria used for targeting SMEs: GCC vs. Non-GCC
Figure 14b
% of Banks indicating the selection criteria used for targeting SMEs:
State vs. Private Banks

35
Figure 14c
Comparison of Exports, Oil and Non-Oil Economies in MENA
Source: ICA assessments.
36
Figure 15a
% of Banks indicating the risk technique used for SMEs: GCC vs. Non-GCC
Figure 15b
% of Banks indicating the risk technique used for SMEs: State vs. Private Banks
37
Figure 16a
% of Banks informing SME clients about the factors driving Ratings/Scorings:
GCC vs. Non-GCC
Figure 16b
% of Banks informing SME clients about the factors driving Ratings/Scorings:
State vs. Private Banks

38
Figure 17a
% of Banks indicating the stress test used for SMEs: GCC vs. Non-GCC
Figure 17b
% of Banks indicating the stress test used for SMEs: State vs. Private Banks

39
Figure 18a
% of Banks indicating that collateral requirements are higher for SMEs than for larger
corporates: GCC vs. Non-GCC
Figure 18b
% of Banks indicating the reason as Very Important or Important for higher SME
collateral: GCC vs. Non-GCC

40
Figure 18c
% of Banks indicating that collateral requirements are higher for SMEs than for larger
corporates: State vs. Private Banks
Figure 18d
% of Banks indicating the reason as Very Important or Important for higher SME
collateral: State vs. Private Banks

41
Figure 19a
% of Banks complying with Basel II: GCC vs. Non-GCC
Figure 19b
% of Banks complying with Basel II: State vs. Private Banks
42
Figure 20a
% of Banks indicating the impact of adoption of Basel II on SME Lending:
GCC vs. Non-GCC
Figure 20b
% of Banks indicating the impact of adoption of Basel II on SME Lending:
State vs. Private Banks
43
Table 1
Characteristics of banks in the sample
Country No. of Banks Market Share Covered
Bahrain 9 67%
Egypt 11 60%
Iraq 10 26%
Jordan 13 91%
Kuwait 7 60%
Lebanon 9 46%
Libya 5 28%
Morocco 5 80%
Oman 5 71%
Palestine 7 95%
Qatar 9 77%
Saudi Arabia 11 98%
Syria 12 90%
Tunisia 4 35%
United Arab Emirates 16 69%
Yemen 6 33%
GCC 57 74%
Non-GCC 82 58%
Total 139 64%
No. of Banks
State 29
Private 110
Total 139
Memo:
Private 110
o/w Domestic 76
o/w Foreign Regional 25
o/w Foreign International 9
State 29
GCC 11
Non-GCC 18
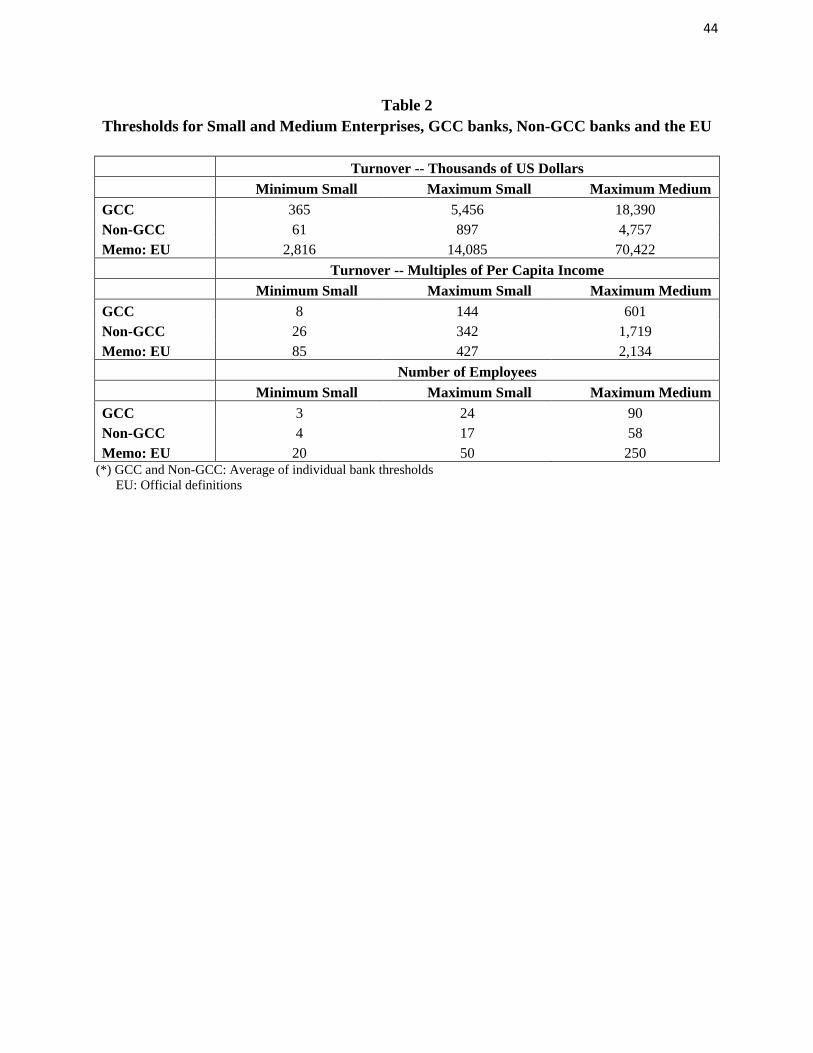
44
Table 2
Thresholds for Small and Medium Enterprises, GCC banks, Non-GCC banks and the EU
Turnover -- Thousands of US Dollars
Minimum Small Maximum Small Maximum Medium
GCC 365 5,456 18,390
Non-GCC 61 897 4,757
Memo: EU 2,816 14,085 70,422
Turnover -- Multiples of Per Capita Income
Minimum Small Maximum Small Maximum Medium
GCC 8 144 601
Non-GCC 26 342 1,719
Memo: EU 85 427 2,134
Number of Employees
Minimum Small Maximum Small Maximum Medium
GCC 3 24 90
Non-GCC 4 17 58
Memo: EU 20 50 250 (*) GCC and Non-GCC: Average of individual bank thresholds
EU: Official definitions

45
Table 3
Weighted Actual and Target SME Lending
Country
Target for
SME
Lending
No. of Banks Actual SME
Lending No. of Banks
Bahrain 5.88 3 1.14 6
Egypt 24.72 7 5.22 9
Jordan 25.276 12 10.40 13
Kuwait 9.22 6 2.45 4
Lebanon 30.64 8 16.14 8
Morocco 29.4 3 23.79 5
Oman 11.39 5 2.48 4
Palestine 27.84 4 6.20 4
Qatar 15.14 7 0.49 5
Saudi Arabia 8.90 9 1.70 7
Syria 13.90 9 4.12 10
Tunisia 15.66 4 15.34 4
United Arab Emirates 24.26 8 3.85 7
Yemen 22.71 4 20.25 2
GCC 12.47 38 2.02 33
Non-GCC 26.71 61 13.16 65
MENA 19.59 99 7.59 98 (*) Non-GCC and MENA averages and totals include Iraq, but it is not reported in the table above as its coverage
is less than 30%. Iraq is however included in the remaining analysis. Libyan banks are not included in the
average and quantitative data analysis as their figures could not be verified during the follow-up process. Libya is
however included in qualitative analysis.
Table 4
Average share of SME Loans in total Bank Loans
Developed Countries Developing Countries
Source
OECD
(2010)1
World Bank
(2008)2
World Bank
(2008)3 World Bank/UAB (2010)
Number of countries 5 countries 7 countries 38 countries
15 Middle
East countries
9 Non-GCC
countries
SME Loans/Total Loans (%) 26.8 22.1 16.2 7.59 13.16 1 Canada, France, Korea, Sweden, and the US.
2, 3 Beck, Demirguc-Kunt, Peria (2008).

46
Table 5
Test of Differences in means between regions and ownership of banks
Weighted Averages*
GCC Non-GCC t-test p-value
SME Loans/Total Loans (%) 2.02 13.16 4.77 0.00***
Investment Loans/SME Loans (%) 15.43 26.40 4.38 0.00***
Un-weighted Averages
GCC Non-GCC t-test p-value
SME Loans/Total Loans (%) 2.08 15.82 6.89 0.00***
Investment Loans/SME Loans (%) 14.68 30.69 3.64 0.00***
Private State t-test p-value
SME Loans/Total Loans (%) 11.34 8.99 0.82 0.42
Investment Loans/SME Loans (%) 22.43 32.38 1.40 0.18
Domestic
(Private) Foreign t-test p-value
SME Loans/Total Loans (%) 11.67 10.56 0.29 0.77
Investment Loans/SME Loans (%) 22.80 21.48 0.27 0.79 * Total loans for banks are used to construct the weighted averages.

47
Table 6
Measures of Financial Infrastructure, MENA and other Regions
Region
Legal Rights
Index
Coverage
Public Credit
Registry
Coverage
Private Credit
Bureau
Credit
Information
Index
Middle East & North Africa 3.5 3.5 2.6 2.6
GCC 3.8 4.2 6.4 2.9
Non-GCC 3.2 3.7 0.0 2.5
East Asia 5.3 8.9 14.6 3.7
Eastern Europe 6.8 2.4 14.1 3.5
Former Soviet Union 5.7 0.5 1.1 1.7
High income: Non-OECD 6.5 0.0 46.3 4.5
High income: OECD 6.8 8.1 58.1 4.9
Latin America 4.4 10.6 36.2 4.6
South Asia 5.7 0.5 2.0 2.9
Sub-Saharan Africa 5.2 1.0 6.9 1.5
Source: The Doing Business Database
Table 7
Outstanding Guarantees as a % of GDP
Country 2007 2008 2009
Egypt 0.08% 0.08% 0.09%
Jordan 0.07% 0.07% 0.07%
Lebanon 0.85% 0.84% 0.87%
Morocco 0.33% 0.35% 0.41%
Palestine 0.05% 0.16% 0.27%
Saudi Arabia 0.01% 0.01% 0.02%
Tunisia 0.34% 0.39% 0.50% Source: Saadani, Arvai, and Rocha (2010)

48
Table 8.1: Determinants of Lending to SMEs (OLS) Dependent Variable: Share of SME Loans in Total Bank Loans
Regressions are estimated via OLS at bank level for the year 2007 to 2009. Robust t statistics in brackets and (bank level) clustered t statistics in parenthesis.* significant at 10%; ** significant at
5%; *** significant at 1%
1 2 3 4 5 6 7 8 9 10 11
Log Total loans -1.47 -2.53 -2.53 -2.26 -1.33 -1.09 -2.44 -2.53 -2.14 -1.72 -1.52
[3.81]*** [4.60]*** [4.59]*** [4.08]*** [2.48]** [2.28]** [6.33]*** [6.51]*** [5.36]*** [4.22]*** [3.80]***
(2.50)** (3.15)*** (3.14)*** (2.78)*** (1.70)* (1.52) (4.18)*** (4.32)*** (3.49)*** (2.73)*** (2.57)**
GCC Dummy -9.36 -4.13 -6.14 -7.44 -11.71 -5.41 -5.19 -6.21 -8.14 -9.79 -5.36
[7.08]*** [2.13]** [2.80]*** [3.46]*** [4.98]*** [3.11]*** [3.20]*** [3.61]*** [4.23]*** [4.75]*** [3.60]***
(4.30)*** (1.34) (1.74)* (2.19)** (3.15)*** (1.98)* (2.03)** (2.26)** (2.67)*** (2.98)*** (2.30)**
State Ownership Dummy 0.59 0.86 2.00 0.96 1.54 1.24 1.50 2.23 1.65 1.75 1.29
[0.40] [0.52] [1.18] [0.60] [0.96] [0.73] [0.97] [1.39] [1.10] [1.12] [0.84]
(0.25) (0.31) (0.71) (0.36) (0.57) (0.44) (0.58) (0.83) (0.66) (0.66) (0.50)
Log Number of Branches 1.58 1.20 1.72 0.69 0.17
[1.95]* [1.43] [2.16]** [0.94] [0.24]
(1.27) (0.92) (1.42) (0.62) (0.15)
Separate Unit for SME Clients Dummy 6.39 5.25 6.12 4.45 2.86 [3.12]*** [2.56]** [3.05]*** [2.18]** [1.24] (1.96)* (1.62) (1.93)* (1.38) (0.75)
Maximum Coverage Registry or Bureau 0.00 -0.01 0.08 0.03 -0.08 -0.01 -0.02 0.06 0.01 -0.03
[0.04] [0.22] [1.69]* [0.61] [1.63] [0.21] [0.32] [1.12] [0.21] [0.56]
(0.03) (0.17) (1.37) (0.43) (1.28) (0.16) (0.25) (0.94) (0.15) (0.43)
Legal Rights Index 1.92 1.53
[2.27]** [1.79]*
(1.36) (1.09)
Time to Register Property -0.07 -0.06
[4.27]*** [3.78]***
(2.96)*** (2.58)**
Time to Enforce a Contract -0.03 -0.02
[5.91]*** [4.17]***
(3.77)*** (2.73)***
Time to Close a Business -2.48 -1.70
[3.67]*** [2.62]***
(2.43)** (1.74)*
Partial Credit Guarantee % of GDP 10.16 10.31 8.51 7.19 11.91 12.37 12.47 10.98 10.12 13.58
[3.87]*** [3.95]*** [3.09]*** [2.66]*** [4.32]*** [4.75]*** [4.92]*** [4.02]*** [3.91]*** [5.06]***
(2.49)** (2.52)** (1.98)* (1.71)* (2.74)*** (3.20)*** (3.32)*** (2.68)*** (2.63)** (3.37)***
Observations 245 239 239 239 239 203 220 220 220 220 184
R-squared 0.32 0.35 0.37 0.37 0.42 0.39 0.39 0.41 0.41 0.42 0.39
Number of Countries 15 15 15 15 15 13 15 15 15 15 13
Number of Banks 96 96 96 96 96 82 88 88 88 88 74
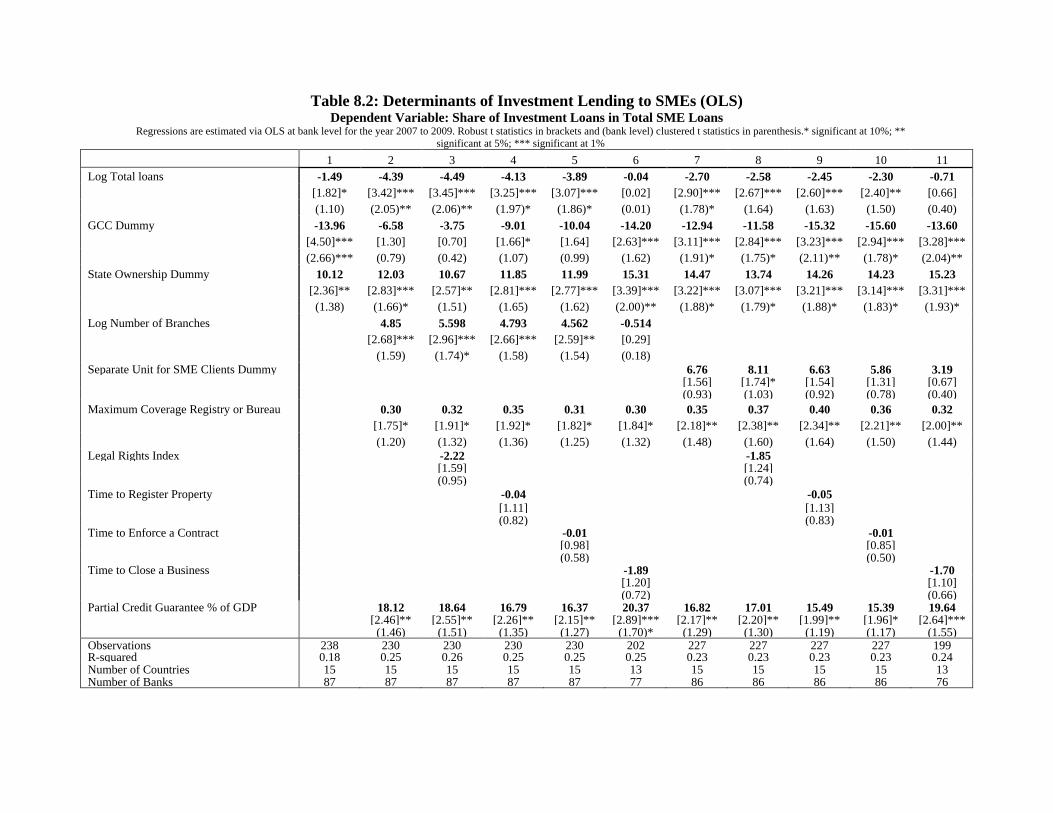
57
Table 8.2: Determinants of Investment Lending to SMEs (OLS) Dependent Variable: Share of Investment Loans in Total SME Loans
Regressions are estimated via OLS at bank level for the year 2007 to 2009. Robust t statistics in brackets and (bank level) clustered t statistics in parenthesis.* significant at 10%; **
significant at 5%; *** significant at 1%
1 2 3 4 5 6 7 8 9 10 11
Log Total loans -1.49 -4.39 -4.49 -4.13 -3.89 -0.04 -2.70 -2.58 -2.45 -2.30 -0.71
[1.82]* [3.42]*** [3.45]*** [3.25]*** [3.07]*** [0.02] [2.90]*** [2.67]*** [2.60]*** [2.40]** [0.66]
(1.10) (2.05)** (2.06)** (1.97)* (1.86)* (0.01) (1.78)* (1.64) (1.63) (1.50) (0.40)
GCC Dummy -13.96 -6.58 -3.75 -9.01 -10.04 -14.20 -12.94 -11.58 -15.32 -15.60 -13.60
[4.50]*** [1.30] [0.70] [1.66]* [1.64] [2.63]*** [3.11]*** [2.84]*** [3.23]*** [2.94]*** [3.28]***
(2.66)*** (0.79) (0.42) (1.07) (0.99) (1.62) (1.91)* (1.75)* (2.11)** (1.78)* (2.04)**
State Ownership Dummy 10.12 12.03 10.67 11.85 11.99 15.31 14.47 13.74 14.26 14.23 15.23
[2.36]** [2.83]*** [2.57]** [2.81]*** [2.77]*** [3.39]*** [3.22]*** [3.07]*** [3.21]*** [3.14]*** [3.31]***
(1.38) (1.66)* (1.51) (1.65) (1.62) (2.00)** (1.88)* (1.79)* (1.88)* (1.83)* (1.93)*
Log Number of Branches 4.85 5.598 4.793 4.562 -0.514
[2.68]*** [2.96]*** [2.66]*** [2.59]** [0.29]
(1.59) (1.74)* (1.58) (1.54) (0.18)
Separate Unit for SME Clients Dummy 6.76 8.11 6.63 5.86 3.19 [1.56] [1.74]* [1.54] [1.31] [0.67] (0.93) (1.03) (0.92) (0.78) (0.40)
Maximum Coverage Registry or Bureau 0.30 0.32 0.35 0.31 0.30 0.35 0.37 0.40 0.36 0.32
[1.75]* [1.91]* [1.92]* [1.82]* [1.84]* [2.18]** [2.38]** [2.34]** [2.21]** [2.00]**
(1.20) (1.32) (1.36) (1.25) (1.32) (1.48) (1.60) (1.64) (1.50) (1.44)
Legal Rights Index -2.22 -1.85 [1.59] [1.24] (0.95) (0.74)
Time to Register Property -0.04 -0.05
[1.11] [1.13] (0.82) (0.83) Time to Enforce a Contract -0.01 -0.01 [0.98] [0.85] (0.58) (0.50) Time to Close a Business -1.89 -1.70 [1.20] [1.10] (0.72) (0.66) Partial Credit Guarantee % of GDP 18.12 18.64 16.79 16.37 20.37 16.82 17.01 15.49 15.39 19.64 [2.46]** [2.55]** [2.26]** [2.15]** [2.89]*** [2.17]** [2.20]** [1.99]** [1.96]* [2.64]*** (1.46) (1.51) (1.35) (1.27) (1.70)* (1.29) (1.30) (1.19) (1.17) (1.55) Observations 238 230 230 230 230 202 227 227 227 227 199 R-squared 0.18 0.25 0.26 0.25 0.25 0.25 0.23 0.23 0.23 0.23 0.24 Number of Countries 15 15 15 15 15 13 15 15 15 15 13 Number of Banks 87 87 87 87 87 77 86 86 86 86 76

57
Table 8.3: Determinants of Lending to SMEs (2SLS) Dependent Variable: Share of SME Loans in Total Bank Loans
Regressions are estimated via 2SLS at bank level for the year 2007 to 2009. Robust t statistics in brackets and (bank level) clustered t statistics in parenthesis.* significant at 10%; ** significant at
5%; *** significant at 1% 1 2 3 4 5 6 7 8 9 10 11
Log Total loans -1.92 -2.70 -2.69 -2.27 -1.61 -1.05 -2.47 -2.56 -2.04 -1.86 -1.33
[4.19]*** [4.35]*** [4.34]*** [3.62]*** [2.69]*** [2.01]** [5.55]*** [5.70]*** [4.39]*** [3.92]*** [3.03]***
(3.25)*** (3.54)*** (3.55)*** (2.91)*** (2.20)** (1.50) (4.41)*** (4.54)*** (3.43)*** (3.06)*** (2.32)**
GCC Dummy -5.64 -2.93 -5.04 -8.79 -10.08 -5.74 -4.67 -5.69 -9.79 -8.67 -5.80
[3.01]*** [1.29] [2.01]** [3.09]*** [3.71]*** [2.92]*** [2.35]** [2.76]*** [3.83]*** [3.46]*** [3.22]***
(2.21)** (0.97) (1.49) (2.34)** (2.75)*** (2.15)** (1.75)* (2.05)** (2.91)*** (2.55)** (2.39)**
State Ownership Dummy 1.11 0.09 1.27 0.12 0.91 0.74 1.24 1.94 1.16 1.46 0.99
[0.62] [0.05] [0.64] [0.06] [0.49] [0.37] [0.71] [1.05] [0.69] [0.82] [0.56]
(0.45) (0.03) (0.46) (0.05) (0.35) (0.26) (0.51) (0.75) (0.50) (0.59) (0.40)
Log Number of Branches 1.91 1.52 1.98 1.03 0.46
[2.18]** [1.70]* [2.32]** [1.33] [0.66]
(1.70)* (1.31) (1.83)* (1.05) (0.48)
Separate Unit for SME Clients Dummy 6.86 5.65 6.10 5.06 3.13 [2.96]*** [2.47]** [2.68]*** [2.20]** [1.19] (2.23)** (1.85)* (2.03)** (1.65) (0.86)
Maximum Coverage Registry or Bureau -0.03 -0.04 0.15 0.01 -0.04 -0.04 -0.05 0.13 -0.02 -0.01
[0.44] [0.71] [2.53]** [0.11] [0.83] [0.71] [0.88] [2.03]** [0.34] [0.14] (0.37) (0.60) (2.41)** (0.08) (0.70) (0.59) (0.73) (1.97)* (0.27) (0.12) Legal Rights Index 1.94 1.55
[1.97]* [1.56]
(1.43) (1.14)
Time to Register Property -0.14 -0.12
[3.54]*** [3.28]***
(2.69)*** (2.48)**
Time to Enforce a Contract -0.03 -0.02
[4.60]*** [3.04]***
(3.45)*** (2.34)**
Time to Close a Business -1.64 -1.00
[2.66]*** [1.64]
(1.95)* (1.20)
Partial Credit Guarantee % of GDP 10.29 10.03 9.71 7.93 7.53 11.65 11.89 11.66 9.97 10.15 13.09
[3.27]*** [3.15]*** [3.08]*** [2.35]** [2.28]** [3.39]*** [3.60]*** [3.64]*** [2.90]*** [3.09]*** [3.81]***
(2.41)** (2.31)** (2.26)** (1.73)* (1.67)* (2.46)** (2.66)*** (2.69)*** (2.15)** (2.28)** (2.78)***
Observations 177 177 177 177 177 151 162 162 162 162 136
Number of Countries 15 15 15 15 15 13 15 15 15 15 13
Number of Banks 96 96 96 96 96 82 88 88 88 88 74
Kleibergen-Paap F statistic 5779 6924 8522 7827 7878 13195 6186 7759 6870 6524 11728
Hansen J statistic 1.31 0.07 2.3 0.04 0.12 3.31 0.14 0.72 0 0.01 2.61
P value of Hansen J statistic 0.25 0.8 0.13 0.83 0.73 0.07 0.71 0.4 0.97 0.94 0.11

57
Table 8.4: Determinants of Lending to SMEs (2SLS) Dependent Variable: Share of SME Investment Loans in Total SME Loans
Regressions are estimated via 2SLS at bank level for the year 2007 to 2009. Robust t statistics in brackets and (bank level) clustered t statistics in parenthesis.* significant at 10%; ** significant at
5%; *** significant at 1%
1 2 3 4 5 6 7 8 9 10 11
Log Total loans -2.00 -4.20 -4.37 -3.95 -3.74 -0.23 -2.45 -2.37 -2.16 -2.07 -0.82
[2.01]** [2.68]*** [2.76]*** [2.50]** [2.40]** [0.11] [2.21]** [2.06]** [1.92]* [1.83]* [0.64]
(1.47) (1.94)* (1.99)** (1.82)* (1.74)* (0.08) (1.63) (1.52) (1.42) (1.36) (0.46)
GCC Dummy -7.34 -5.03 -2.11 -7.46 -8.16 -12.88 -12.04 -10.81 -15.63 -14.66 -12.77
[1.77]* [0.81] [0.32] [1.00] [1.08] [1.92]* [2.41]** [2.22]** [2.48]** [2.32]** [2.57]**
(1.26) (0.58) (0.23) (0.72) (0.77) (1.36) (1.72)* (1.58) (1.78)* (1.65) (1.84)*
State Ownership Dummy 12.12 10.91 9.64 10.71 10.86 13.97 13.39 12.82 12.93 13.11 14.15
[2.26]** [2.14]** [1.93]* [2.13]** [2.09]** [2.55]** [2.47]** [2.36]** [2.44]** [2.39]** [2.52]**
(1.61) (1.53) (1.38) (1.52) (1.49) (1.81)* (1.76)* (1.68)* (1.74)* (1.69)* (1.79)*
Log Number of Branches 4.85 5.65 4.67 4.53 -0.29
[2.21]** [2.46]** [2.17]** [2.12]** [0.13]
(1.58) (1.75)* (1.55) (1.51) (0.09)
Separate Unit for SME Clients Dummy 6.66 7.87 6.53 5.76 4.01
[1.29] [1.40] [1.27] [1.08] [0.71] (0.93) (1.01) (0.91) (0.78) (0.50)
Maximum Coverage Registry or Bureau 0.23 0.26 0.30 0.24 0.27 0.30 0.33 0.41 0.31 0.29
[1.23] [1.40] [1.28] [1.30] [1.53] [1.74]* [1.88]* [1.87]* [1.77]* [1.73]*
(0.89) (1.01) (0.93) (0.94) (1.11) (1.25) (1.36) (1.35) (1.28) (1.25)
Legal Rights Index -2.18 -1.66
[1.32] [0.93]
(0.94) (0.66)
Time to Register Property -0.06 -0.09
[0.60] [0.97]
(0.43) (0.70)
Time to Enforce a Contract -0.01 -0.01
[0.71] [0.70]
(0.51) (0.50)
Time to Close a Business -2.01 -1.82
[1.12] [1.02]
(0.79) (0.72)
Partial Credit Guarantee % of GDP 19.46 17.24 18.17 16.31 15.85 19.68 15.80 16.42 14.33 14.53 18.74
[2.27]** [1.97]* [2.09]** [1.84]* [1.74]* [2.34]** [1.69]* [1.76]* [1.53] [1.53] [2.08]**
(1.61) (1.39) (1.48) (1.30) (1.23) (1.65) (1.19) (1.24) (1.08) (1.08) (1.47)
Observations 164 164 164 164 164 145 162 162 162 162 143
Number of Countries 15 15 15 15 15 13 15 15 15 15 13
Number of Banks 87 87 87 87 87 77 86 86 86 86 76
Kleibergen-Paap F statistic 5970 7520 9116 8327 7617 13006 7565 9062 8184 7473 13011
Hansen J statistic 0.16 0.29 0 0.4 0.46 2.88 0.01 0.35 0.01 0 3.13
P value of Hansen J statistic 0.69 0.59 0.98 0.53 0.5 0.09 0.93 0.55 0.93 0.95 0.08
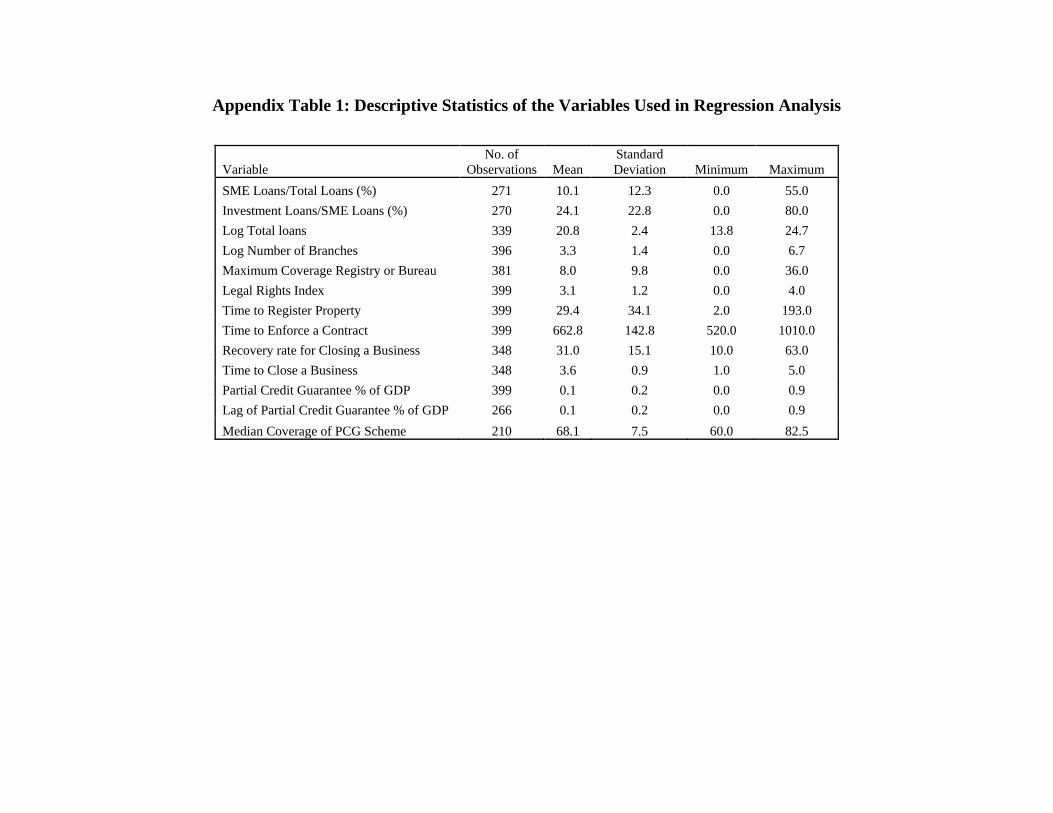
57
Appendix Table 1: Descriptive Statistics of the Variables Used in Regression Analysis
Variable
No. of
Observations Mean
Standard
Deviation Minimum Maximum
SME Loans/Total Loans (%) 271 10.1 12.3 0.0 55.0
Investment Loans/SME Loans (%) 270 24.1 22.8 0.0 80.0
Log Total loans 339 20.8 2.4 13.8 24.7
Log Number of Branches 396 3.3 1.4 0.0 6.7
Maximum Coverage Registry or Bureau 381 8.0 9.8 0.0 36.0
Legal Rights Index 399 3.1 1.2 0.0 4.0
Time to Register Property 399 29.4 34.1 2.0 193.0
Time to Enforce a Contract 399 662.8 142.8 520.0 1010.0
Recovery rate for Closing a Business 348 31.0 15.1 10.0 63.0
Time to Close a Business 348 3.6 0.9 1.0 5.0
Partial Credit Guarantee % of GDP 399 0.1 0.2 0.0 0.9
Lag of Partial Credit Guarantee % of GDP 266 0.1 0.2 0.0 0.9
Median Coverage of PCG Scheme 210 68.1 7.5 60.0 82.5
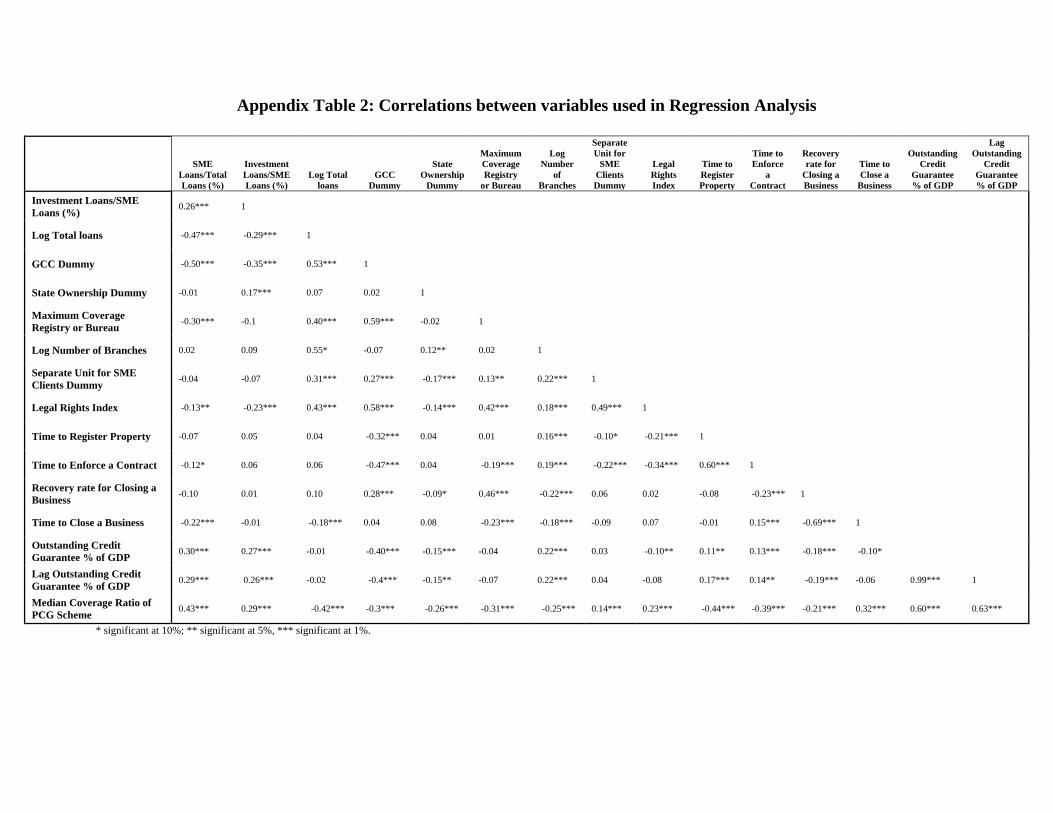
57
Appendix Table 2: Correlations between variables used in Regression Analysis
SME
Loans/Total
Loans (%)
Investment
Loans/SME
Loans (%)
Log Total
loans
GCC
Dummy
State
Ownership
Dummy
Maximum
Coverage
Registry
or Bureau
Log
Number
of
Branches
Separate
Unit for
SME
Clients
Dummy
Legal
Rights
Index
Time to
Register
Property
Time to
Enforce
a
Contract
Recovery
rate for
Closing a
Business
Time to
Close a
Business
Outstanding
Credit
Guarantee
% of GDP
Lag
Outstanding
Credit
Guarantee
% of GDP
Investment Loans/SME
Loans (%) 0.26*** 1
Log Total loans -0.47*** -0.29*** 1
GCC Dummy -0.50*** -0.35*** 0.53*** 1
State Ownership Dummy -0.01 0.17*** 0.07 0.02 1
Maximum Coverage
Registry or Bureau -0.30*** -0.1 0.40*** 0.59*** -0.02 1
Log Number of Branches 0.02 0.09 0.55* -0.07 0.12** 0.02 1
Separate Unit for SME
Clients Dummy -0.04 -0.07 0.31*** 0.27*** -0.17*** 0.13** 0.22*** 1
Legal Rights Index -0.13** -0.23*** 0.43*** 0.58*** -0.14*** 0.42*** 0.18*** 0.49*** 1
Time to Register Property -0.07 0.05 0.04 -0.32*** 0.04 0.01 0.16*** -0.10* -0.21*** 1
Time to Enforce a Contract -0.12* 0.06 0.06 -0.47*** 0.04 -0.19*** 0.19*** -0.22*** -0.34*** 0.60*** 1
Recovery rate for Closing a
Business -0.10 0.01 0.10 0.28*** -0.09* 0.46*** -0.22*** 0.06 0.02 -0.08 -0.23*** 1
Time to Close a Business -0.22*** -0.01 -0.18*** 0.04 0.08 -0.23*** -0.18*** -0.09 0.07 -0.01 0.15*** -0.69*** 1
Outstanding Credit
Guarantee % of GDP 0.30*** 0.27*** -0.01 -0.40*** -0.15*** -0.04 0.22*** 0.03 -0.10** 0.11** 0.13*** -0.18*** -0.10*
Lag Outstanding Credit
Guarantee % of GDP 0.29*** 0.26*** -0.02 -0.4*** -0.15** -0.07 0.22*** 0.04 -0.08 0.17*** 0.14** -0.19*** -0.06 0.99*** 1
Median Coverage Ratio of
PCG Scheme 0.43*** 0.29*** -0.42*** -0.3*** -0.26*** -0.31*** -0.25*** 0.14*** 0.23*** -0.44*** -0.39*** -0.21*** 0.32*** 0.60*** 0.63***
* significant at 10%; ** significant at 5%, *** significant at 1%.
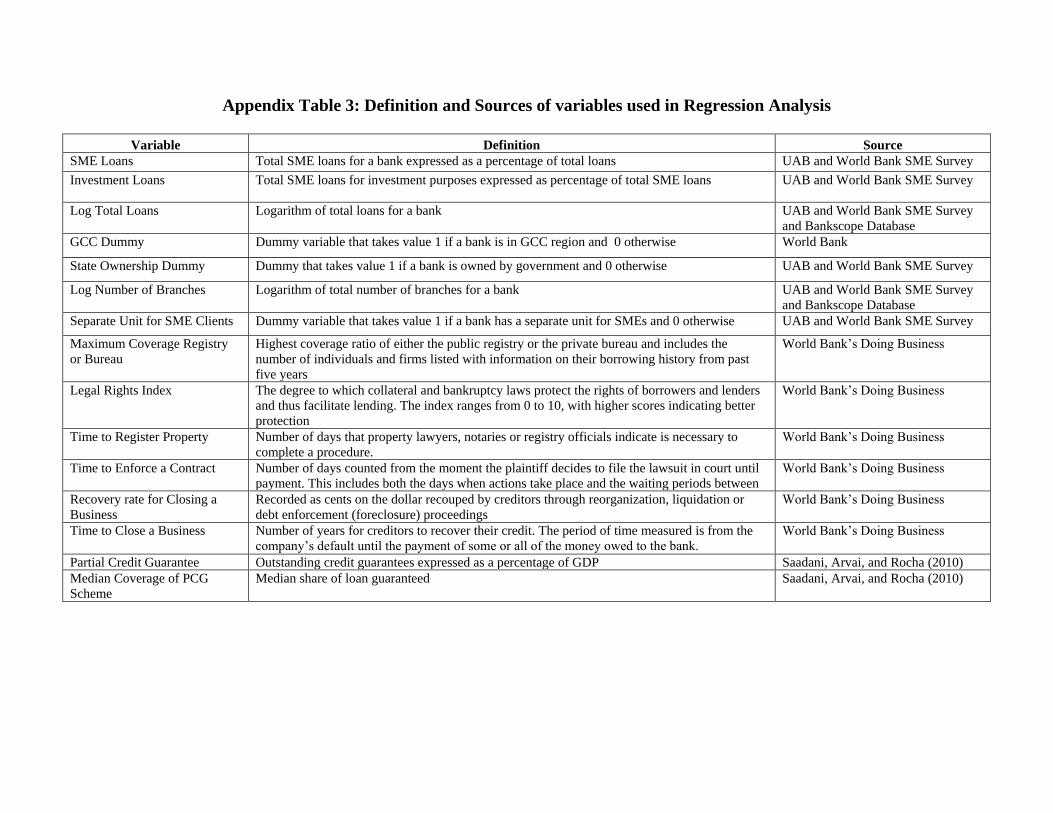
57
Appendix Table 3: Definition and Sources of variables used in Regression Analysis
Variable Definition Source
SME Loans Total SME loans for a bank expressed as a percentage of total loans UAB and World Bank SME Survey
Investment Loans Total SME loans for investment purposes expressed as percentage of total SME loans UAB and World Bank SME Survey
Log Total Loans Logarithm of total loans for a bank UAB and World Bank SME Survey
and Bankscope Database
GCC Dummy Dummy variable that takes value 1 if a bank is in GCC region and 0 otherwise World Bank
State Ownership Dummy Dummy that takes value 1 if a bank is owned by government and 0 otherwise UAB and World Bank SME Survey
Log Number of Branches Logarithm of total number of branches for a bank UAB and World Bank SME Survey
and Bankscope Database
Separate Unit for SME Clients Dummy variable that takes value 1 if a bank has a separate unit for SMEs and 0 otherwise UAB and World Bank SME Survey
Maximum Coverage Registry
or Bureau
Highest coverage ratio of either the public registry or the private bureau and includes the
number of individuals and firms listed with information on their borrowing history from past
five years
World Bank‟s Doing Business
Legal Rights Index The degree to which collateral and bankruptcy laws protect the rights of borrowers and lenders
and thus facilitate lending. The index ranges from 0 to 10, with higher scores indicating better
protection
World Bank‟s Doing Business
Time to Register Property Number of days that property lawyers, notaries or registry officials indicate is necessary to
complete a procedure.
World Bank‟s Doing Business
Time to Enforce a Contract Number of days counted from the moment the plaintiff decides to file the lawsuit in court until
payment. This includes both the days when actions take place and the waiting periods between
World Bank‟s Doing Business
Recovery rate for Closing a
Business
Recorded as cents on the dollar recouped by creditors through reorganization, liquidation or
debt enforcement (foreclosure) proceedings
World Bank‟s Doing Business
Time to Close a Business Number of years for creditors to recover their credit. The period of time measured is from the
company‟s default until the payment of some or all of the money owed to the bank.
World Bank‟s Doing Business
Partial Credit Guarantee Outstanding credit guarantees expressed as a percentage of GDP Saadani, Arvai, and Rocha (2010)
Median Coverage of PCG
Scheme
Median share of loan guaranteed Saadani, Arvai, and Rocha (2010)

57
References
Al-Sugheyer, Bilal and Murat Sultanov, 2010, “Leasing in Middle East and Northern Africa
Region: A Preliminary Assessment”. Unpublished Manuscript (available at MENA Finance Flagship
website:
http://web.worldbank.org/WBSITE/EXTERNAL/COUNTRIES/MENAEXT/EXTMNAREGTOPPOVRED/0,,
contentMDK:22734614~pagePK:34004173~piPK:34003707~theSitePK:497110,00.html)
Altman, E. and Sabato, G., 2007. “Modeling Credit Risk for SMEs: Evidence from the US
Market”. Abacus 43, 332-357
Alvarez de la Campa, A, 2010, “Increasing Access to Credit through Reforming Secured
Transactions in the MENA Region”. Unpublished manuscript (available at MENA Finance Flagship
website:
http://web.worldbank.org/WBSITE/EXTERNAL/COUNTRIES/MENAEXT/EXTMNAREGTOPPOVRED/0,,
contentMDK:22734614~pagePK:34004173~piPK:34003707~theSitePK:497110,00.html)
Anzoategui, D, Martinez Peria, M., and Rocha, R, 2010, “Banking Competition in the Middle
east and North Africa Region”. Policy Research Paper 5363, The World Bank, Washington DC.
Ayadi, R., 2005, “The New Basel Capital Accord and SME Financing”. Center for European
Policy Studies, Brussels.
Ayyagari, M., Beck, T., and Demirgüç-Kunt, A., 2007. “Small and Medium Enterprises across
the Globe”. Small Business Economics 29, 415-434.
Beck, T., and Demirgüç-Kunt, A., 2006. “Small and Medium-Size Enterprises: Access to
Finance as a Growth Constraint”. Journal of Banking and Finance 30, 2931-2943.
Beck, T., Demirgüç-Kunt, A., Laeven, L., and Maksimovic, V., 2006. “The Determinants of
Financing Obstacles”. Journal of International Money and Finance 25, 932-952.
Beck, T., Demirgüç-Kunt, A., and Maksimovic, V., 2005. “Financial and Legal Constraints to
Firm Growth: Does Firm Size Matter?” Journal of Finance 60, 137-177.
Beck, T., Behr, P., and Güttler, A., 2010. “Gender and Banking: Are Women Better Loan
Officers?”. European Banking Center Discussion Paper No. 2009-19.
Beck, T., Demirguc-Kunt, A., and Martinez Peria, M., 2009. “Bank financing for SMEs:
Evidence across countries and bank-ownership types”. European Banking Center Discussion
Paper No. 2009-20.
Beck, T., Demirguc-Kunt, A., and Martinez Peria, M. 2008. “Bank Financing for SMEs around
the World: Drivers, Obstacles, Business Models, and Lending Practices”. World Bank Policy
Research Working Paper 4785.

57
Beck, T., and Demirgüç-Kunt, A., 2006. “Small and Medium-Size Enterprises: Access to
Finance as a Growth Constraint”. Journal of Banking and Finance 30, 2931-2943.
Beck, T., Demirgüç-Kunt, A., Laeven, L., and Maksimovic, V., 2006. “The Determinants of
Financing Obstacles”. Journal of International Money and Finance 25, 932-952.
Beck, T., Demirgüç-Kunt, A., and Maksimovic, V., 2008. “Financing Patterns around the World:
Are Small Firms Different?”. Journal of Financial Economics 89, 467-87.
Berger, A., and Udell, G., 2006. “A More Complete Conceptual Framework for SME Finance”.
Journal of Banking and Finance 30, 2945-2966.
Berger, A., Kayshap, A., and Scalise, J., 1995. “The Transformation of the U.S. Banking
Industry: What a Long Strange Trip It‟s Been”. Brookings Papers on Economic Activity vol. 2.
Berger, A. N. and Udell, G. F., 1996. “Universal Banking and the Future of Small Business
Lending”. In: Saunders, A., Walter I., (Eds.), Financial System Design: The Case for Universal
Banking. Irwin (Richard D), Burr Ridge, IL, 559-627.
De la Torre, A., Martinez Peria, M.S. and Schmukler, S., 2010. “Bank Involvement with SMEs:
Beyond Relationship Lending”. Journal of Banking and Finance”.
De Vries, H., Blind, K., Mangelsdorf, A., Verheul, H., and Der Zwan, J., 2009. “SME Access to
European Standardization. Enabling Small and Medium- sized Enterprises to achieve greater
benefit from Standards and from Involvement in Standardization”. Rotterdam School of
Management, Erasmus University.
Dietsch, M., and Petey, J., 2004. “Should SME Exposures be Treated as Retail or Corporate
Exposures? A Comparative Analysis of Default Probabilities and Asset Correlations in French
and German SMEs”. Journal of Banking and Finance 28, 773-788.
IADB, 2004. “Unlocking Credit: The Quest for Deep and Stable Lending”. The Johns Hopkins
University Press.
International Finance Corporation (IFC), 2010. “G20 Report: Scaling up SME Access to
Finance”. IFC, Washington DC.
Jacobson, T., Linde, J., and Roszbach, K., 2005. “Credit Risk versus Capital Requirements under
Basel II: Are SME Loans and Retail Credit Really Different?”. Journal of Financial Services
Research, 28, 43-75
Madeddu, O., 2010, “The Status of Information Sharing and Credit Reporting Infrastructure in
the Middle East and North Africa”. Unpublished Manuscript (available at MENA Finance Flagship
website:
http://web.worldbank.org/WBSITE/EXTERNAL/COUNTRIES/MENAEXT/EXTMNAREGTOPPOVRED/0,,
contentMDK:22734614~pagePK:34004173~piPK:34003707~theSitePK:497110,00.html)
57
Price Waterhouse and Coopers, 2004. Study on the Financial and Macroeconomic Consequences
of the Draft Proposed New Capital Requirements for Banks and Investment Firms in the EU.
Saadani, Y, Z. Arvai, and R. Rocha, 2010, “Assessing Credit Guarantee Schemes in the Middle
East and North Africa Region”. Unpublished manuscript (available at MENA Finance Flagship
website:
http://web.worldbank.org/WBSITE/EXTERNAL/COUNTRIES/MENAEXT/EXTMNAREGTOPPOVRED/0,,
contentMDK:22734614~pagePK:34004173~piPK:34003707~theSitePK:497110,00.html)
Schiffer, M. and Weder, B., 2001. “Firm Size and the Business Environment: Worldwide Survey
Results”. International Finance Corporation Discussion Paper 43.
Sengupta, R., 2007. “Foreign Entry and Bank Competition”, Journal of Financial Economics,
84(2), 502-528.
Stephanou, C. and Rodriguez, C., 2008. “Bank Financing to Small- and Medium-Sized
Enterprises (SMEs) in Colombia”. World Bank Policy Research Working Paper 4481. The
World bank, Washington DC.
Strahan, P. E. and Weston, J., 1996. “Small Business Lending and Bank Consolidation: Is There
Cause for Concern?”. Current Issues in Economics and Finance, Federal Reserve Bank of
New York, 2:1-6.
Uttamchandani, M., 2010, “No Way Out: The lack of efficient insolvency regimes in the MENA
region”.Unpublished manuscript (available at MENA Finance Flagship website:
http://web.worldbank.org/WBSITE/EXTERNAL/COUNTRIES/MENAEXT/EXTMNAREGTOPPOVRED/0,,
contentMDK:22734614~pagePK:34004173~piPK:34003707~theSitePK:497110,00.html)
World Bank, 2007a. “Bank Financing to Small and Medium Enterprises: Survey Results from
Argentina and Chile”. World Bank Country Study. The World Bank, Washington DC.
World Bank, 2007b. “Bank Lending to Small and Medium Enterprises: The Republic of Serbia.
World Bank Country Study”. The World Bank, Washington DC.