the step-by-step guide to building your custom attribution...
TRANSCRIPT

THE STEP-BY-STEP GUIDETO BUILDING YOUR
CUSTOMATTRIBUTION MODEL
WHITE PAPER

2
If you’re searching for information about attribution, you’ve come to the right place. In a few short pages, you’re about to get all the practical advice you need to run with the pros.
Solving the attribution problem will be one of the most important things you do to boost return on investment (ROI) for your organization. In fact, 58% of marketers depend on attribution to allocate their marketing budget to the most effective channels.1
Building a solid attribution model may take time, but you can’t argue with the results. In this guide, we’ll show you how to get the attribution you deserve. You just need to learn to crawl and walk before you can run.
INTRODUCTION
Insist on objectivity and let the data tell the story. It’s easy to get passionate about a campaign, channel, or technology, but try to keep the big picture in view. If you put too much focus on one idea or theory, you could overlook important revelations.
Pace yourself. Optimization is an ongoing process, so never stop collecting and organizing your data. It might take some time to get the ball rolling, but it’ll be worth it.
Acknowledge that no attribution model is perfect. Use multiple models and keep refining them. You may never be able to measure everything perfectly, but never stop trying.
Set goals that foster collaboration. When you hit your goals, reward the whole team across functions. Even if it’s with something small like a party, celebrating success is a great way for team members to cheer each other on.
Define your goals as a team—both in and out of marketing. Some of your key stakeholders may be in sales, business development, analytics, or even finance. If you have trouble making inroads, try opening with this phrase: “What’s your key objective?”
Five keys to attribution success

3
crawlMost of your customer’s journey is done before they ever speak to a salesperson. People discover, forget, rediscover, research, and comparison shop across multiple touchpoints, both organic and paid, before they ever make a purchase.
As true as that is for retail brands, it’s even more significant for B2B companies. Business customers have longer sales cycles and need to convince multiple decision stakeholders. For them, a typical sales cycle can take up to six months and cover potentially dozens of channels: display campaigns, email nurturing, white papers, and events, just to name a few.
Attribution will give you the full picture of how all your efforts work together to get the customer from a lead to a sale. Before you begin, your team needs to agree on predefined customer checkpoints so you can track the flow between stages.
DEFINE YOURBUY CYCLE
Complex buyer journey

4
crawlYou will quickly discover that different systems will tell you different stories about your performance. What you need is a single source of truth that you can use as a reference point for all your other systems.
We recommend setting up Google Analytics as early as possible and getting all your decision makers on board. As you add more systems and data sources, make sure that all your data—from sales, marketing, and finance—feeds back into one source. It’s a great way to eliminate wasted budget and make sure that you have the full picture of what’s working.
IMPLEMENT A SINGLE SOURCE OF TRUTH
The right tools for every step of the customer journey
ACQUISITION-FOCUSED TOOLS
Demand Side Platform / DisplayContent / Social Marketing Platforms
Website CMS/WCM/RTPData Enrichment and Prospecting
Lead Scoring / Predictive AnalyticsSales and Marketing Automation
Sales Enablement
INFRASTRUCTURE
Digital AnalyticsTesting Marketing CloudCustomer Relationship Management (CRM)Data Management PlatformBig Data ArchitectureBusiness Intelligence
RETENTION-FOCUSED TOOLS
Advocacy / Networking / Event ManagementCustomer Success
AWARENESS
ADVOCACY AND EVANGELISM
PRODUCT ADOPTION
GROWTH
RESULTS
EDUCATION
CONSIDERATION
CONFIG
55
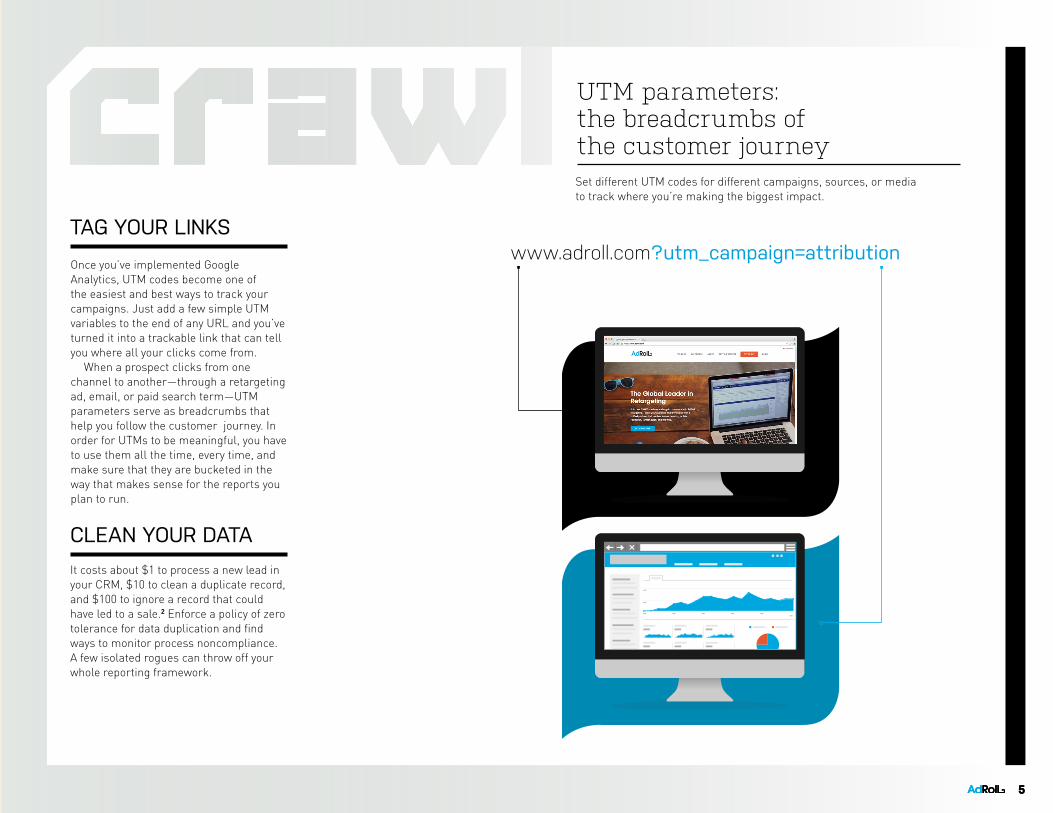
crawlOnce you’ve implemented Google Analytics, UTM codes become one of the easiest and best ways to track your campaigns. Just add a few simple UTM variables to the end of any URL and you’ve turned it into a trackable link that can tell you where all your clicks come from.
When a prospect clicks from one channel to another—through a retargeting ad, email, or paid search term—UTM parameters serve as breadcrumbs that help you follow the customer journey. In order for UTMs to be meaningful, you have to use them all the time, every time, and make sure that they are bucketed in the way that makes sense for the reports you plan to run.
It costs about $1 to process a new lead in your CRM, $10 to clean a duplicate record, and $100 to ignore a record that could have led to a sale.2 Enforce a policy of zero tolerance for data duplication and find ways to monitor process noncompliance. A few isolated rogues can throw off your whole reporting framework.
TAG YOUR LINKS
CLEAN YOUR DATA
www.adroll.com?utm_campaign=attribution
UTM parameters: the breadcrumbs of the customer journeySet different UTM codes for different campaigns, sources, or media to track where you’re making the biggest impact.

6
walkThere’s more to attribution than passive data collection. Get your team used to taking an active, data-oriented approach to problem solving by setting up some A/B tests. For most companies, A/B tests on ad creative are a great place to start. They’re easy to set up and simple to track, and they often provide meaningful results within days.
Be sure to keep your tests simple so that you can understand specifically what drove the performance. When you’re testing a headline, make sure the ads have the same design. When you’re testing a call to action (CTA), make sure the rest of the ad copy is the same. When you’re testing green buttons vs. blue buttons, make sure the buttons are otherwise identical.
It won’t take long before your team is hooked on measurable results.
ESTABLISH A CULTURE OF TESTING ?
7% 3%
A/B test for success
STEP 1 Start by testing headlines, images, layouts, copy, and
CTA buttons to drive higher performance.
STEP 2Monitor which program has
the highest performance.Take into account N-size,
and make sure to reach statistical significance.
STEP 3 This is a sound, data-driven
approach to marketing.

7
walkSometimes the touch you want to measure isn’t a touch at all: view-through conversions track customers who didn’t click when they saw the ad but did convert later. According to Yahoo! Advertising Solutions, even consumers who didn’t click on a display ad increased their search activity—and, more importantly, converted at a significantly higher rate than people who had never seen the ad.3
Different tactics resonate with different people. Grouping your customers into look-alike cohorts lets you compare apples to apples when you review the data. There are many ways to think about grouping customers: B2B companies often slice data by vertical, company size, or geographical region. B2B brands are likely to look at gender, age, or past purchase behavior.
To make sure you’re looking at campaign performance within the same cohorts, apply conversion goals within each channel based on metrics like cost per click, cost per lead, and view-through conversion windows.
TRACK VIEW-THROUGH CONVERSIONS
SET UP COMMON CUSTOMER PROFILES
Average number of days allotted for view-through attribution by industry
<2
<5
<8
<10
<10
<10
<10
<10
<14
<30
Apparel and Beauty
Media and Entertainment
Finance
Auto
Home
Technology
Healthcare
Education
Travel
Consumer Packaged Goods
DAYS INDUSTRY

8
runNot all lead sources are created equal. Maybe that contact you made at the conference is 50% more likely to convert than someone who attended a webinar—but who has the higher lifetime value?
Over time, you’ll end up gathering a vast library of customer data that lets you look at large-scale trends for even the longest customer buy cycles. You’ll also end up with a richer data set, one that includes subtle customer cues like user device or time of day. Once you start layering all those bits of data on top of each other, you can arrive at some really sophisticated conclusions about your customers, how they behave, and where to focus your marketing resources.
To that end, try to consolidate all your signals into a single marketing tool or data warehouse. Once they’re in, you can use matching tools and data partners to uncover nuanced trends in customer behavior.
You’ll need a lot of tools to store, sort, and respond to all this data. So do you buy those tools, or do you build them? We recommend investing in a small suite of robust analytics and testing tools that will help you get to market faster. Then turn to your internal engineering team to build perfect-fit replacements without losing an opportunity to gather data.
REFINE YOUR INTERNAL METRICS
BUY TIME TO BUILD
Centralize all your data
ORGANIC AND OFFLINE
PAID
NURTUREDIRECT
DATA WAREHOUSE
9
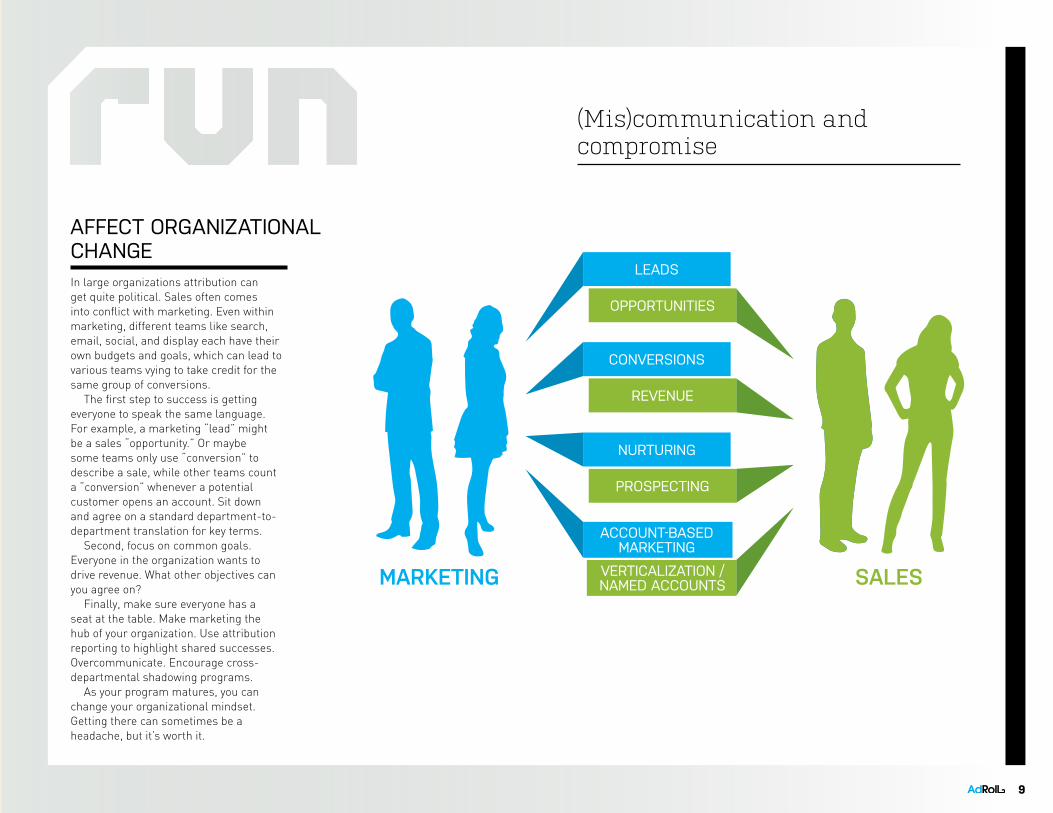
runIn large organizations attribution can get quite political. Sales often comes into conflict with marketing. Even within marketing, different teams like search, email, social, and display each have their own budgets and goals, which can lead to various teams vying to take credit for the same group of conversions.
The first step to success is getting everyone to speak the same language. For example, a marketing “lead” might be a sales “opportunity.” Or maybe some teams only use “conversion” to describe a sale, while other teams count a “conversion” whenever a potential customer opens an account. Sit down and agree on a standard department-to-department translation for key terms.
Second, focus on common goals. Everyone in the organization wants to drive revenue. What other objectives can you agree on?
Finally, make sure everyone has a seat at the table. Make marketing the hub of your organization. Use attribution reporting to highlight shared successes. Overcommunicate. Encourage cross-departmental shadowing programs.
As your program matures, you can change your organizational mindset. Getting there can sometimes be a headache, but it’s worth it.
AFFECT ORGANIZATIONAL CHANGE
Graphic to come
MARKETING SALES
(Mis)communication and compromise
LEADS
CONVERSIONS
NURTURING
ACCOUNT-BASED MARKETING
OPPORTUNITIES
REVENUE
PROSPECTING
VERTICALIZATION /NAMED ACCOUNTS

10
SOURCES1 AdRoll, State of the Industry2 SiriusDecisions, The Impact of Bad Data on Demand Creation3 Yahoo! Advertising Solutions, Search and Display White Paper
ABOUT USAdRoll is the global leader in retargeting, with over 20,000 active advertisers worldwide. The company’s innovative and easy-to-use marketing platform enables brands of all sizes to create personalized ad campaigns based on their own website and mobile data, ensuring maximum return on online advertising spend. The company has offices in San Francisco, New York City, Dublin, Sydney, London, and Tokyo. The company is backed by leading investors such as Foundation Capital, Institutional Venture Partners, Northgate Capital, Glenmede, Accel Partners, Merus Capital, and Peter Thiel. Learn more at www.adroll.com.
With the tips in this guide, you can start building an attribution model that gives you real insight into your customers and shows you where and how to best invest your marketing dollars. When you’re ready to take the next step, reach out to your AdRoll representative for even more marketing strategies.
For more on attribution, watch our on-demand webinar, Are You Using the Wrong Attribution Model?
CONCLUSION
conclusion