the strategic capability of asian network airlines to
TRANSCRIPT
- 1-
The strategic capability of Asian network airlines to compete with low-cost
carriers
James Pearson1*
, John F. O’Connell2, David Pitfield1, Tim Ryley1
1Transport Studies Group, Loughborough University, Loughborough, LE11 3TU, UK2Centre for Air Transport, Cranfield University, Martell House, Bedford, MK43 0TR, UK
Abstract:Never before have network airlines been so exposed and vulnerable to low-cost carriers (LCCs). While LCCshad 26.3% of all world seats in 2013, Southeast Asia had 57.7% and South Asia 58.4% - and these figures willonly increase. There are many consequences of LCCs on network airlines, including inadequately meeting theexpectations of customers, so increasing dissatisfaction, and not offering sufficient value-for-money. Clearly, itis fundamentally important for Asian network airlines to respond appropriately to LCCs. This paper looks at thestrategic capability of 22 of the top Asian network airlines in competing with LCCswhich is achieved byanalysing questionnairedata from these airlines in terms of 37 competitive responses across six distinct responsecategories. This paperalso investigates how strategic capability varies by Asian sub-region and by airlineperformance, with performance based upon eight different performance areas. The results show that strategiccapability varies widely, with Vietnam Airlines possessing the strongest strategic capability and SilkAir theweakest. Of others that compete heavily with LCCs, Malaysia Airlines and Garuda Indonesia have strongcapabilities, while Philippine Airlines does not. As a whole, network airlines within Southeast Asia have thegreatest strategic capability, andNortheast Asia the weakest. There is a reasonably strong correlation of betweenstrategic capability and overall performance, which suggests that those airlines with strong strategic capabilityshould achieve strong overall performance.
Keywords: Competition, competitive responses, Asia, network airlines, low-cost carriers
1. Introduction
Never before have network airlines, or full-service airlines, been so exposed and
vulnerable to low-cost carriers (LCCs) with Doganis (2006, p.22) suggesting that: “the most
threatening challenge to be faced will be the irresistible rise of the low-cost sector.” In recent
times, this has been particularly evident in Asia due to expanding open skies, rising
disposable incomes within fast-growing economies, and often large populations yet
comparatively poor surface transport (Torr, 2014). While LCCs seats represented 26.3% of
all seats worldwide in 2013, they represented 57.7% in Southeast Asia and 58.4% in South
Asia (CAPA, 2014). Northeast Asia lagged with just 9.3%, but this is inevitably going to rise
as open skiesare increasingly becoming legislated; while a political mind-set, notably in
China, is beginning to embrace and encourage the continued development and expansion of
LCCs to advance economic prosperity (Airline Leader, 2013).As a whole, Asia-Pacific
*Corresponding author. Tel.: +07896 003258E-mail address:[email protected]
- 2-
represented 29% of worldwide revenue passenger kilometres (RPKs) in 2012, which is
forecasted to grow to 34% by 2032 (Airbus, 2013).
Doganis (2006, p.12) reasoned that “the most significant trend [for airlines] has been the
gradualliberalisation of international air transport…with profound effects on both market
structure and operating patterns.” Thus,many barriers-to-entry reduce which facilitates the
entry of new, nimble, and lower-cost competitors, and which therefore produces formidable
challenges for legacy operators. Indeed, the rise of LCCs has “potentially crippling
circumstances” (CAPA, 2009) for network airlines within short- and medium-haul markets.
Hanaoka et al (2014) found that the entry of one Asia-based LCC on one route may affect
the fare, frequency, and profitability of related competitive routes for the entire network.
Clearly, there are enormous challenges facing Asian network airlines as to how they
effectively respond to LCCs. Therefore, a critical and unanswered question looms – just how
capable are Asian network airlines in competing with LCCs? Given the current growth of
LCCs in Asia and the pending enlargement partly as a result of ASEAN open skies set for
implementation by 2015, the threats facing incumbents are to escalate even further (Tan,
2014; Fu and Oum, 2014). Thus, this paper seeksto establish the strategic capability of Asian
network airlines, how their strategic capability varies by sub-region within Asia, and whether
airline performance differs by strategic capability.
2. Existing literature
Embedded ideologies of LCCs include a lower average price, an increased emphasis on
value-for-money, and empowering the customer with an additional range of airline choice in
the form of low fares and unbundled products. The literature is replete with the shortcomings
of the full service airlines as they have inadequately met the expectations of the short-haul
market segments, and the resulting dissatisfaction, largely attributable to cross-price elasticity,
has triggered many passengers to switch to LCCs.Ultimately, the price of the ticket has been
the key decision-making determinant, which has shifted enormous volumes of traffic towards
the lean business models of LCCs, while at the same time stimulating new traffic influxes.
Subsequently, network airlines havereacted by removing layersof cost in order to induce
lower fares, which overall reduced yields, but was counteracted by an increase in traffic and
load factors.
“Low-cost carriers represent an increasing and significant threat to the long-term viability
of legacy airlines” (Taneja, 2010, p.xxxiii). O'Connell (2007) stated that the ability of LCCs
- 3-
to offer an adequate portion of their service quality at less than 50 per cent of the cost of
network airlinesjeopardises the future of network carriers in short-haul markets. This is
further strengthened by Merkert and Pearson (2014) finding that an insignificant relationship
exists between service quality, a key part of the proposition of network airlines, and airline
profitability.
Yet Ryans (2009, p.14) is adamant: “The emergence of low-cost competition is certainly
not all bad news for traditional companies.” This is because it frequently means that there is
a sizeable segment of a market that is not sufficiently satisfied with the value propositions of
incumbent firms– such customers seek ‘good enough’ products at low prices. While these
customers may lack meaningful purchasing power on an individual basis vis-à-vis those
customers with greater incomes and greater willingness and ability to spend more, they may
collectively represent a considerable market opportunity (Ryans, 2009). Some management at
existing firms may recognise the emerging opportunity that is presented and may take the
time and effort to learn from their low-cost competitors for their own benefit. They may
realise that new entrants with lower costs, lower prices, straightforward propositions and
value-for-money initiatives may be forthcoming and have an opportunity to act expeditiously
which is anappropriate response in today’s fast paced marketplace (Roberts and Stockport,
2014).
Yet management in legacy companies are laggards and this lack of agility causes many
problems. Ryans (2009, p.83) reverberates this theme by stating “one of the toughest
decisions executives in traditional companies face today is whether to respond to their low-
cost competitors, and, if so, what should be the timing and extent of that response.”
Theseshortcomings can have enormous ramifications coupled with an unwillingness to
believe that the threat is real or will have severe impacts (Hamel and Prahalad, 2013). The
short/medium-haul sectors of the network airlines are facing increasingly treacherous
problems when confronting the relentless growth and evolution of LCCs as they continue to
attack and penetrate the incumbents’ core markets. Evidence from both the academic and
commercial worlds clearly shows that evolving LCCs are increasingly targeting higher-
yielding business travellers as they are offering enhanced differentiated products from cost-
effective platforms at prices lower than the legacy competitors in order to capture a higher
PRASM (passenger revenue per available seat mile), which is damaging and threatening to
network airlines (Klophaus et al, 2012; Airline Leader, 2012)
The threat posed by LCCs varies in intensity. This depends upon whether LCCs are
emerging, growing, or evolving, with Gross and Luck (2013) arguing that network airlines
- 4-
faced with LCCs in all three positions are in a particularly precarious situation as strategies
must be implemented by network airlines at each stage to counteract and circumvent these
situations. Rumelt (2011) finds that the objectives of firms are often a secondary
consideration in the design of response strategies, while Markides (2006)argues that the
threats posed by low-cost competitors should be based upon a firm’s objectives, resources,
and core competencies. Taneja et al (2014) insists that threats should not be the foundation to
strategy formation, while Dutton and Jackson (1987) believe that strategic responses must
change according to the intensity and timing of aspecific threat. The degree and nature of
responses by network airlines to LCCs will depend upon the evolving strategies(e.g. assigned
seating, code-sharing activities, and greater use of primary airports) and likely future action
of LCCs.
Against increasing competitive challenges for Asian network airlines,thispaper is
structured as follows. Section 3 provides a comprehensive overview of the methodology, an
array of competitive responses available to network airlines,and theformulae used to ascertain
the strategic capability of network carriers. The results are then presented and discussed in
sections 4 and 5, while section 6 outlines the concluding remarks.
3. Methodology
This paper aims to establish the strategic capability of Asian network airlines. In this
research, the strategic capability of each Asian network airline indicates the degree to which
they may be capable of competing with LCCs. The process of ascertaining strategic
capability concerns the application of an IATA commissioned methodology implemented
by O’Connell (2007, p.298), who sought “to provide a methodology which measured the
capability of how much each full service airline could respond to low cost carriers and
[to] compare each airline’s response strategy.” The strategic capability of each
incumbent airline is determined by a two phased methodology. Firstly by the strategies
that it deems important in competing against low cost carriers and secondly by the
difficulties (constraining elements) that it encounters when implementing these
strategies.
The starting point of the analysis was the collection of data from questionnaireswith senior
management in strategy, finance, or business development from 22 Asian network airlines
across three Asia sub-regions. These airlines can be seen in Table 1. Those who participated
in this research were mainly contacted via the professional social networking site LinkedIn,
- 5-
and later asked to participate. The data used in this paper is just one part of the data obtained
from the questionnaires using Bristol Online Survey.
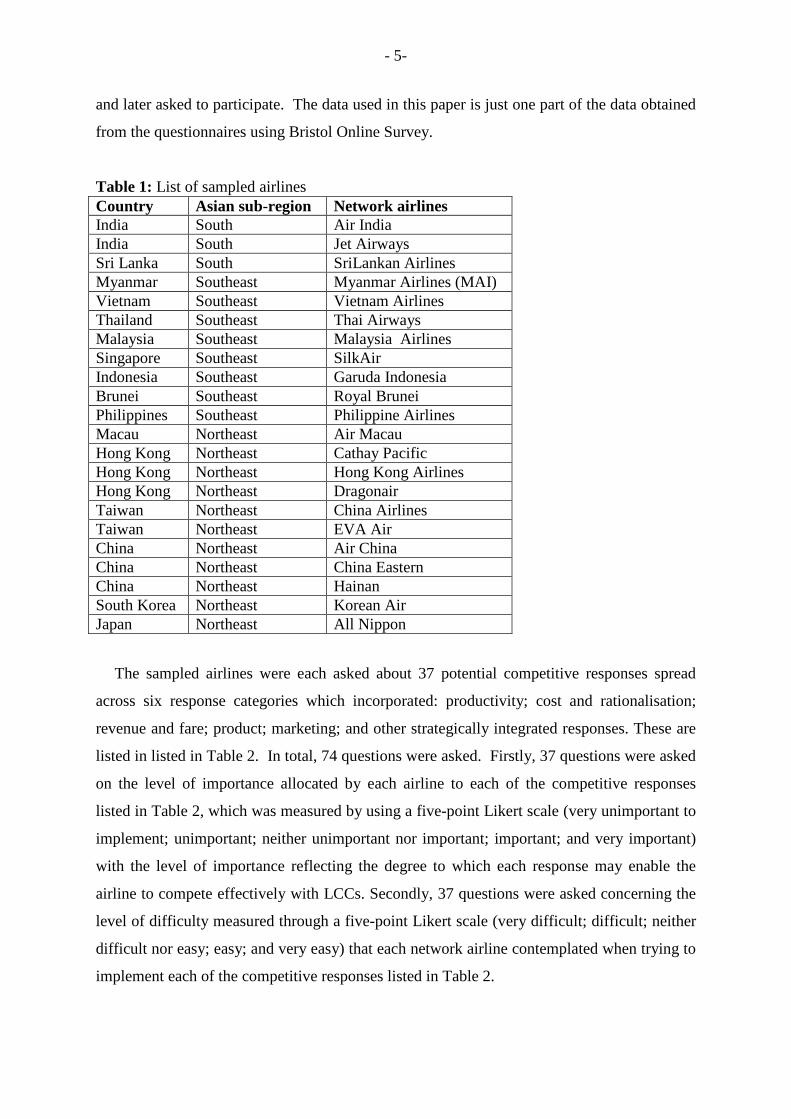
Table 1: List of sampled airlines
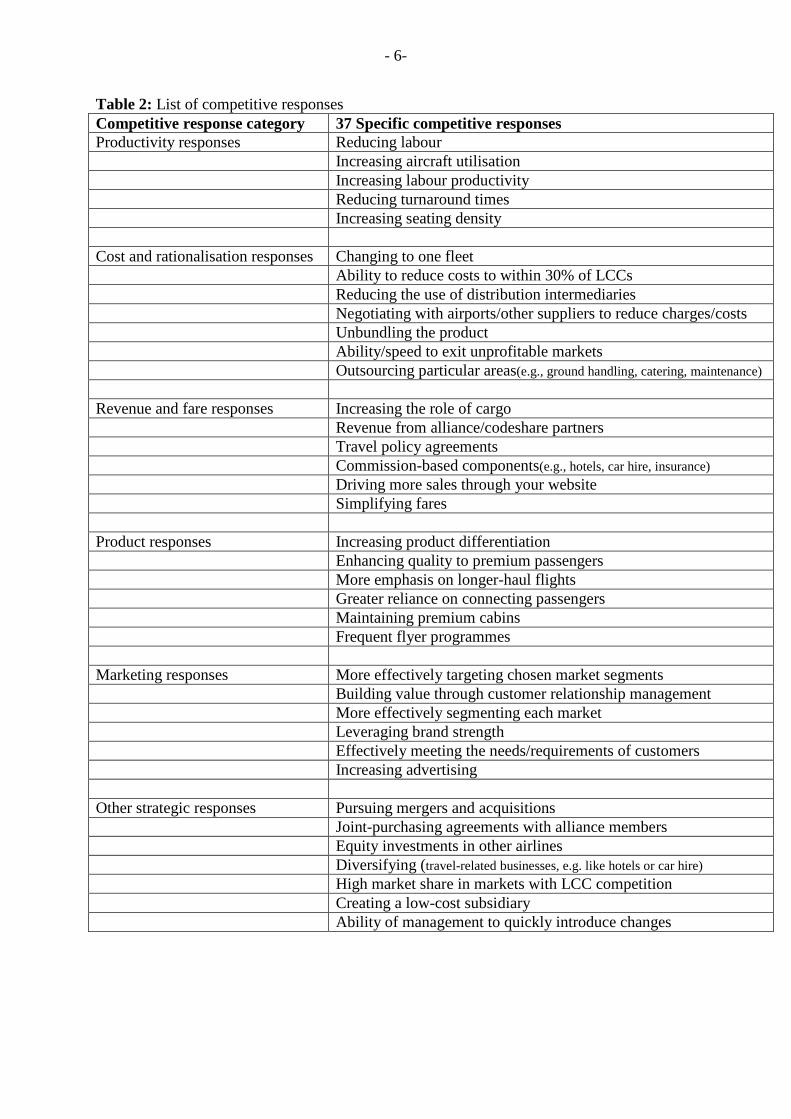
The sampled airlines were each asked about 37 potential competitive responses spread
across six response categories which incorporated: productivity; cost and rationalisation;
revenue and fare; product; marketing; and other strategically integrated responses. These are
listed in listed in Table 2. In total, 74 questions were asked. Firstly, 37 questions were asked
on the level of importance allocated by each airline to each of the competitive responses
listed in Table 2, which was measured by using a five-point Likert scale (very unimportant to
implement; unimportant; neither unimportant nor important; important; and very important)
with the level of importance reflecting the degree to which each response may enable the
airline to compete effectively with LCCs. Secondly, 37 questions were asked concerning the
level of difficulty measured through a five-point Likert scale (very difficult; difficult; neither
difficult nor easy; easy; and very easy) that each network airline contemplated when trying to
implement each of the competitive responses listed in Table 2.
Country Asian sub-region Network airlinesIndia South Air IndiaIndia South Jet AirwaysSri Lanka South SriLankan AirlinesMyanmar Southeast Myanmar Airlines (MAI)Vietnam Southeast Vietnam AirlinesThailand Southeast Thai AirwaysMalaysia Southeast Malaysia AirlinesSingapore Southeast SilkAirIndonesia Southeast Garuda IndonesiaBrunei Southeast Royal BruneiPhilippines Southeast Philippine AirlinesMacau Northeast Air MacauHong Kong Northeast Cathay PacificHong Kong Northeast Hong Kong AirlinesHong Kong Northeast DragonairTaiwan Northeast China AirlinesTaiwan Northeast EVA AirChina Northeast Air ChinaChina Northeast China EasternChina Northeast HainanSouth Korea Northeast Korean AirJapan Northeast All Nippon
- 6-
Table 2: List of competitive responsesCompetitive response category 37 Specific competitive responsesProductivity responses Reducing labour
Increasing aircraft utilisationIncreasing labour productivityReducing turnaround timesIncreasing seating density
Cost and rationalisation responses Changing to one fleetAbility to reduce costs to within 30% of LCCsReducing the use of distribution intermediariesNegotiating with airports/other suppliers to reduce charges/costsUnbundling the productAbility/speed to exit unprofitable marketsOutsourcing particular areas(e.g., ground handling, catering, maintenance)
Revenue and fare responses Increasing the role of cargoRevenue from alliance/codeshare partnersTravel policy agreementsCommission-based components(e.g., hotels, car hire, insurance)
Driving more sales through your websiteSimplifying fares
Product responses Increasing product differentiationEnhancing quality to premium passengersMore emphasis on longer-haul flightsGreater reliance on connecting passengersMaintaining premium cabinsFrequent flyer programmes
Marketing responses More effectively targeting chosen market segmentsBuilding value through customer relationship managementMore effectively segmenting each marketLeveraging brand strengthEffectively meeting the needs/requirements of customersIncreasing advertising
Other strategic responses Pursuing mergers and acquisitionsJoint-purchasing agreements with alliance membersEquity investments in other airlinesDiversifying (travel-related businesses, e.g. like hotels or car hire)
High market share in markets with LCC competitionCreating a low-cost subsidiaryAbility of management to quickly introduce changes
- 7-
An objective of the study was to measure the strategic capability of how each full service
airline would compete/respond with low cost carriers. O’Connell’s (2007) methodology was
used as a template as it was endorsed and validated by IATA, which established the
mathematical formulae for the strategic capability of incumbent network airlines to compete
against low cost carriers using the two phased methodology of establishing competitive
responses, which were identified as being effective in competing against LCCs together with
the level of difficulty that the incumbent airlines would encounter when instigating these
strategies. The airline with the lowest average score for difficulty was classified as the
benchmark airline, as this had the least difficulty of all sampled airlines in implementing the
competitive responses. Francis et al. (2005) showed that benchmarking is the most common
technique for airlines to improve performance. Benchmarking provides a roadmap to airlines
to encompass ‘best practices’ and ways to circumnavigate problems, thereby strengthening
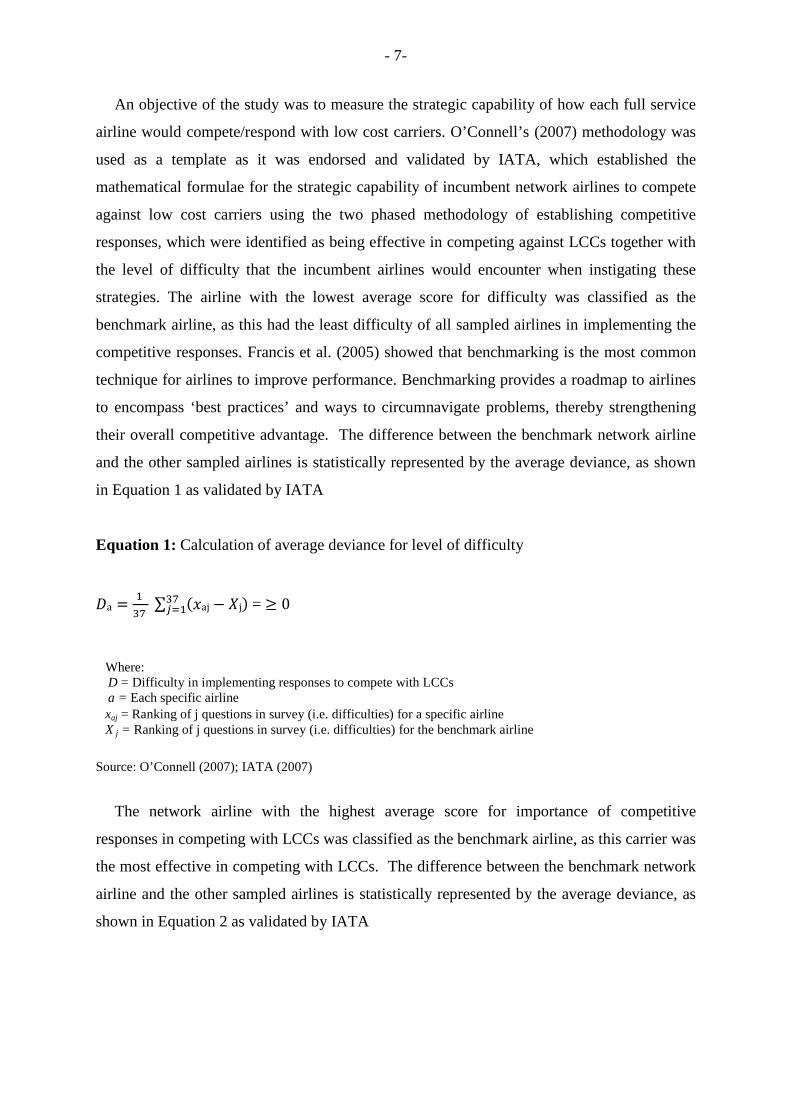
their overall competitive advantage. The difference between the benchmark network airline
and the other sampled airlines is statistically represented by the average deviance, as shown
in Equation 1 as validated by IATA
Equation 1: Calculation of average deviance for level of difficulty
aܦ =ଵ�
ଷ�∑ ajݔ) − ܺj)ଷୀଵ = ≥ 0
Source: O’Connell (2007); IATA (2007)
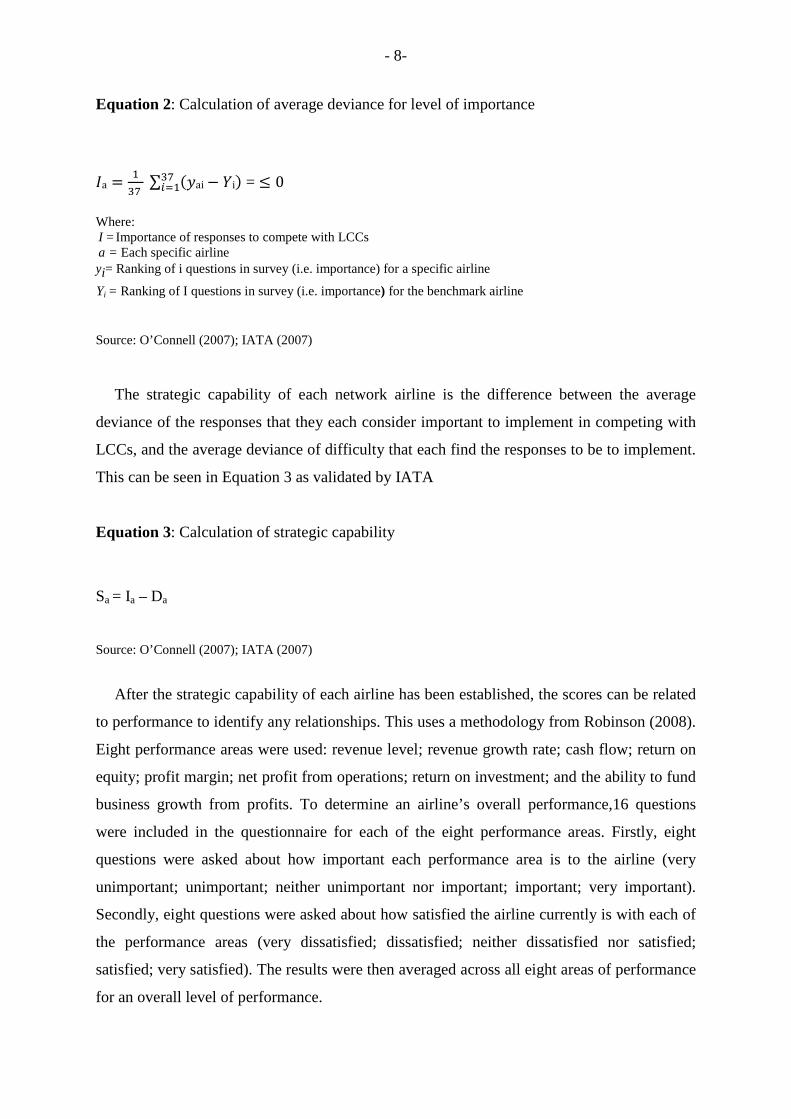
The network airline with the highest average score for importance of competitive
responses in competing with LCCs was classified as the benchmark airline, as this carrier was
the most effective in competing with LCCs. The difference between the benchmark network
airline and the other sampled airlines is statistically represented by the average deviance, as
shown in Equation 2 as validated by IATA
Where:D = Difficulty in implementing responses to compete with LCCsa = Each specific airlinexaj = Ranking of j questions in survey (i.e. difficulties) for a specific airlineX j = Ranking of j questions in survey (i.e. difficulties) for the benchmark airline
- 8-
Equation 2: Calculation of average deviance for level of importance
aܫ =ଵ
ଷ�∑ aiݕ) − iܻ)ଷୀଵ = ≤ 0
Where:I = Importance of responses to compete with LCCsa = Each specific airlineyi= Ranking of i questions in survey (i.e. importance) for a specific airline
Yi = Ranking of I questions in survey (i.e. importance) for the benchmark airline
Source: O’Connell (2007); IATA (2007)
The strategic capability of each network airline is the difference between the average
deviance of the responses that they each consider important to implement in competing with
LCCs, and the average deviance of difficulty that each find the responses to be to implement.
This can be seen in Equation 3 as validated by IATA
Equation 3: Calculation of strategic capability
Sa = Ia – Da
Source: O’Connell (2007); IATA (2007)
After the strategic capability of each airline has been established, the scores can be related
to performance to identify any relationships. This uses a methodology from Robinson (2008).
Eight performance areas were used: revenue level; revenue growth rate; cash flow; return on
equity; profit margin; net profit from operations; return on investment; and the ability to fund
business growth from profits. To determine an airline’s overall performance,16 questions
were included in the questionnaire for each of the eight performance areas. Firstly, eight
questions were asked about how important each performance area is to the airline (very
unimportant; unimportant; neither unimportant nor important; important; very important).
Secondly, eight questions were asked about how satisfied the airline currently is with each of
the performance areas (very dissatisfied; dissatisfied; neither dissatisfied nor satisfied;
satisfied; very satisfied). The results were then averaged across all eight areas of performance
for an overall level of performance.
- 9-
4. Results of the strategic capability of Asia’s incumbent network airlines to compete
with Asian LCCs
The results are divided into two parts. Firstly, chapter 4 analyses the strategic capabilities of
the sampled Asian network airlines along with how strategic capability varies by sub-region.
Chapter 5 then explores the relationship between strategic capability and performance.
4.1 Strategic capability by airline
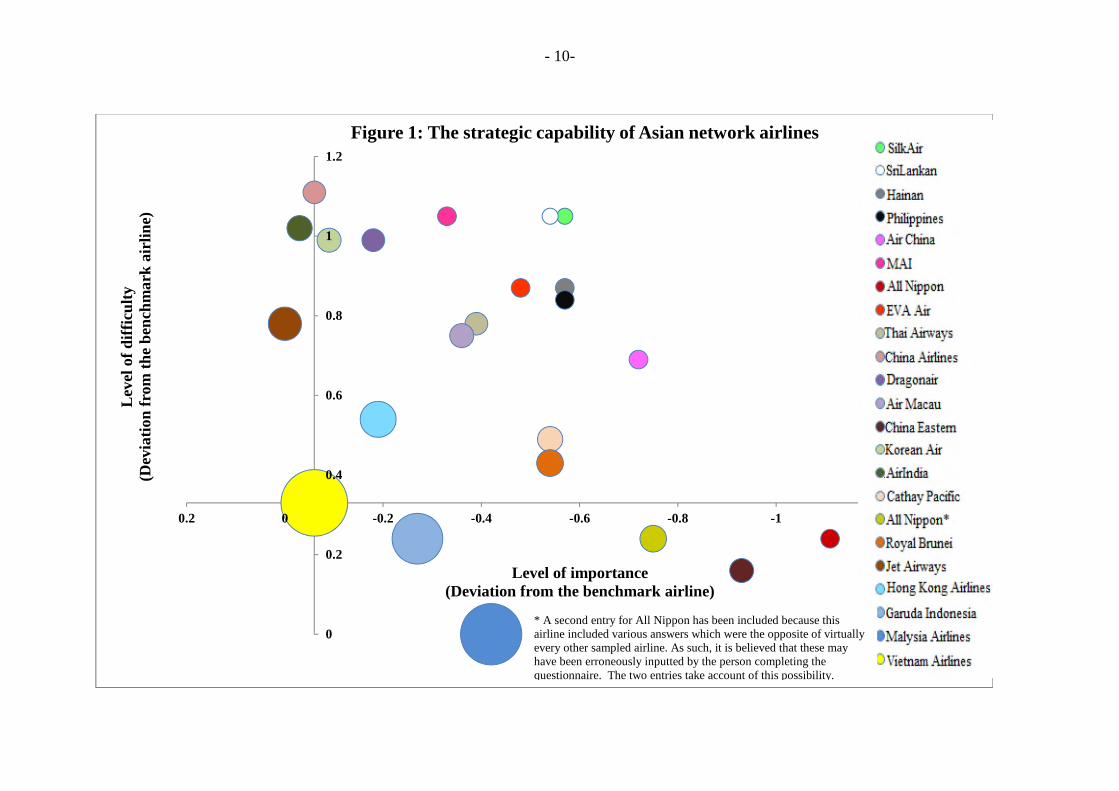
The interrelationship between the level of difficulty and the level of importance of
competitive responses for each airline explains the widely varying strategic capabilities to
compete with LCCs, as shown in Figure 1. Note that the size of the circles reflects the
relative strategic capability of each airline in comparison to the airline with the greatest
overall strategic capability.
- 10-
0
0.2
0.4
0.6
0.8
1
1.2
-1.2-1-0.8-0.6-0.4-0.200.2
Lev
elof
dif
ficu
lty
(Dev
iati
onfr
omth
eb
ench
mar
kai
rlin
e)
Level of importance(Deviation from the benchmark airline)
Figure 1: The strategic capability of Asian network airlines-0.57
-0.54
-0.57
-0.57
-0.72
-0.33
-1.11
-0.48
-0.39
-0.06
-0.18
-0.36
-0.93
-0.09
-0.03
-0.54
-0.75
-0.54
0.00
-0.19
-0.27
-0.42
-0.06
* A second entry for All Nippon has been included because thisairline included various answers which were the opposite of virtuallyevery other sampled airline. As such, it is believed that these mayhave been erroneously inputted by the person completing thequestionnaire. The two entries take account of this possibility.
- 11-
The strategic capabilities of each sub-region in Asiais determined by the average of all
analysed airlines within them. Given the use of ordinal data, it is assumed for this purpose
that there was commonality as to the interpretation by each respondent of each of the five
levels of importance (very unimportant to very important) and difficulty (very difficult to
very easy).As expected, network airlines from Southeast Asia have the strongest capability
with -0.98, thus meaning they are better placed, overall, to compete with LCCs than those
from South Asia (-1.14) and Northeast Asia (-1.17). The relative strength of network airlines
from Southeast Asia is advantageous given this sub-region had an LCC penetration of 58.6%
in 2013, which is almost as high as for South Asia (61.6%) (CAPA, 2014). That Southeast
Asia is best placed is despite SilkAir, the regional and narrowbody operator partner of
Singapore Airlines, having the weakest capability of all 22 airlines, with -1.62 and just 24.1%
of the capability of the strongest overall airline, Vietnam Airlines. The very weak position of
SilkAir is primarily because it finds all of the analysed responses to be 55.7% more difficult
to implement than the average level of difficulty across all the other sampled airlines. In
particular, SilkAir finds these competitive responses to be very difficult to implement:
reducing labour; reduce costs to within 30% of LCCs; changing to one fleet; increasing the
role of cargo; increasing product differentiation; and effectively meeting the needs and
requirements of its customers. Overall, SilkAir finds these response categories to the most
difficult, indicating the widespread nature of its challenges: other strategically integrated
responses (4.57 out of five), productivity (4.20), and marketing (4.17).
4.1.1. Vietnam Airlines
Vietnam Airlines is positioned as the benchmark airline as the data concluded that it has
the strongest strategic capability to compete with LCCs.This suggests that it found all 37
competitive responses to be relatively easy and relatively important to implement when
compared against the other sampled Asian network airlines. Its strength in competing with
LCCs is fortunate because Vietnam is at the forefront of LCC growth and development
within the Asia-Pacific region (Anna.aero, 2011), thus price-based competition is likely to
only increase. VietJet is Vietnam’s largest LCC and OAG data for 2014 indicates that it has
a market share by seat capacity of 13% overall and 25% domestically, while CAPA (2014;
2012) anticipates a 50% share of domestic services in the near future as it is aggressively
pushing “to exploit the huge potential of Vietnam’s international low-cost airline market”.
The proliferation of LCCs within Vietnam is set to increase as the country seeks to create a
- 12-
liberal operating environment, for example by removing fare caps and regulations (Airline
Leader, 2012), whichis a precursor for LCCs to thrive.
The strategic strength of Vietnam Airlinesis aided by the following attributes: it is the only
network airline of any real size within Southeast Asia that is entirely government-owned; it is
heavily protected; it is dominant within Vietnam as it commands a 50% market share overall
and 62% share domestically in mid-2014(CAPA, 2014); and because it has a 70% equity
stake in Jetstar Pacific, its low-cost subsidiary. Jetstar Pacific thereby enables indirect
participation by Vietnam Airlines in the budget travel segment and when these two airlines
are scaled together the combined market share swells to 57.3% overall and 75% domestically
(CAPA, 2014).
In competing with LCCs and in terms of the six competitive response categories, Vietnam
Airlines found product,revenue and fare, and marketing to be the most important to
implement. Indeed, it was one of the very few Asian network airlines that found marketing
responses to be very important, while it stressed great importance in being customer-driven
which may have a positive impact on its PRASM together withachieving greater customer
loyalty. It placed slightly less emphasis on the categories of cost and rationalisation and
productivity, which was noticeable when compared to the patterns of the responses for the
airlines generally. In particular, Vietnam Airlines found that, unlike most of the sampled
airlines, the following responses wereall very important for them in competing with LCCs:
increasing product differentiation; effectively targeting chosen segments; meeting the needs
and requirements of targeted market customers; negotiating with airports and other suppliers
to reduce costs; driving commission-based components; and offering convenience in booking
travel-related products and services. These strategies have the capability to grow revenues
for Vietnam Airlines while providing value-adding ingredients for travellers.
Despite the significance of increasing product differentiation for Vietnam Airlines,it was,
surprisingly, one of the few carriers from the sample of 22 airlinesthat found this to be very
difficult to achieve. This may hinder its attempts to leverage its geographic position by
becoming more of a hub-and-spoke operator, with an increasing number of long-haul
services, especially as it is already a latecomer in this respect. Its product is not rated very
highly when compared to international standards as it has a 3-starrating while many of its
network airline competitors have higher – for example, Thai Airways 4*; Japan Airlines 4*;
Cathay Pacific 4*; Asiana 5*; Malaysia 5*; Singapore Airlines 5*
(SkyTrax, 2014) (footnote 1 here) – which undermines its attempt to become a more
significant airline in the global marketplace. This partially explains why it finds
- 13-
differentiation very difficult while at the same time it finds meeting the needs and
requirements of its targeted customers difficult. As Vietnam continues to prosper
economically more carriers will be attracted by its affluence and the market dominance of the
flag carriers will be acutely challenged into the future; clearly, it is important that Vietnam
Airlines is able to respond accordingly.
The Vietnamese incumbent found the 37 competitive responses to be easier to implement
than the majority of sampled airlines. In particular, it was the only airline of all 22 to consider
a low-cost subsidiary to be easy to implement and this strategy of offering a dual-brand
increases its differentiation and passenger appeal as it now better meetsthe needs and
requirements of a wider range of targeted customers (seePearson and Merkert, 2014). This
may enable both airlines to concentrate on their relative strengths as the barriers to entry
increase which will potentially dissuade new entrants.
Furthermore, Vietnam Airlines found revenue and fare competitive responses to be easy to
implement, especially in terms of growing revenues from cargo; driving more sales through
its own website; simplifying fares;and driving commission-based components. Even though
Vietnam Airlines had the strongest strategic capability among the sampled incumbents, it
would have been even stronger if it could reduce costs to within 30% of LCCs and increase
its product differentiation, which were two key entities that it found very difficult to
incorporate.
4.1.2 Malaysia Airlines
Malaysia Airlines has the second strongest strategic capability, and at 92.9% of that of
Vietnam Airlines it is near the maximum identified (footnote 2 here).This therefore means
that it is better placed to compete with LCCs in comparison to 20 other sampled Asian
network airlines. As a country, Malaysia is overwhelmed by LCC activity, as OAG analysis
reveals that it’s responsible for 50.6% of the penetration. AirAsia Malaysia is very dominant
with 46.0% market share domestically and 23.7% internationallyin mid-2014 (footnote 3
here), as compared to Malaysia Airlines’ 38.5% domestically and 26.3% internationally
(CAPA, 2014). AirAsia’s core competence is its ethos of cost leadership, while it is
asymmetrically positioned at the other end of the airline business model continuum to
Malaysia Airlines. In addition, AirAsia is very profitable, fast-growing, entrepreneurial, and
challenging (Ong and Tan, 2010). At the same time, Malindo is increasingly growing. This
is a joint-venture between Lion Air, which is one of Asia’s largest LCCs that currently
operatesa fleet of over 100 aircraft with another 520 on order, and Malaysia’s National
- 14-
Aerospace and Defence Industries (NADI). Malindo is a hybrid operator that offers low
average fares witha product that rivals that of Malaysia Airlines, sodelivering a value-for-
money proposition to passengers. OAG analysis reveals that it presently has a 5.8% market
share as it only commenced operations in May 2013, but is fast-growing and very threatening
for the Malaysian flag carrier. Malaysia Airlines is therefore increasingly squeezed from both
perspectives: from very price-sensitive and lower-yielding customers that provide volume;
and from those that have a greater willingness and ability to pay. It is Malaysia Airlines,
more than most other network airlines, that needs to be able to compete effectively with
LCCs.
The position of Malaysia Airlines in Figure 1 indicates that it is the benchmarked airline
for level of difficulty, which means that it finds the 37 competitive responses to be easier to
implement than any other of the sampled airlines. At the same timeit also finds them to be
less important than 30%of the surveyed airlines. Its strong strategic capability is therefore
primarily attributable to the ease with which it finds the competitive responses to
implement,which is partly due by having to adapt through necessity, asAirAsia Malaysia is
now maturing having reached 12 years in service and is becoming an iconic and prominent
business model. In comparison to the overall benchmarked Vietnam Airlines, Malaysia
Airlines finds difficulties in:its ability to quickly exit from unprofitable markets; creating a
low-cost subsidiary; using and leveraging FFPs; simplifying fares; and increasing the role of
cargo. Malaysia Airline finds productivity, cost and rationalisation, and marketing response
easier to implement than Vietnam Airlines, the airline with the strongest overall strategic
capability. This ease is especially (footnote 4 here) in terms of unbundling the product; the
ability to reduce costs within 30% of LCCs; travel policy agreements; increasing product
differentiation; effectively targeting chosen segments; and meeting the needs and
requirements of targeted customers.Research on Malaysia Airlines has concluded that the
airline has adequately met the needs of the passenger requirements in terms of service quality
and schedule, while Air Asia’s has done so through the single entity of fares (Suki, 2014;
Ong and Tan, 2010; O’Connell and Williams, 2005).
Despite Malaysia Airlines’ strong strategic capability, the airline is unprofitable andhas
lost $1.3 billion over the past three years. It lost $354 million in its 2013 financial year,
which was more significant than in 2012 (Malaysia Airlines, 2014).Malaysia Airlines (2014)
attributed theselosses to an array of issues but prioritised: the depreciation of the Ringgit
against the US dollar generated large foreign exchange losseswhich is highly problematic as
almost 60% of its costs are in US Dollars, which significantly increases the cost base;
- 15-
escalating operating costs such as fuel which increased by almost 11% over the twelve-month
period between 2012-2013; and lower yields from intensifying competition from both Gulf
and European airlines explicitly attacking its long-haul operations, and LCCs continuing to
encroach onto its short-haul markets. It is clear that LCCs have significantly impacted
Malaysia Airlines, and it urgently needs a solid platform in which to launch hard-hitting
strategies to outflank its advancing and relentless competition.
4.1.3 Thai Airways
Thai Airways, with its lower strategic capability and greater exposure to LCCs, is
especially vulnerable, as OAG data illustrates that, in mid-2014,Thai AirAsia
possessesgreater market share domestically than Thailand’s flag carrier with 26.9% against
21.8% respectively. Thai Airways is also beginning to struggle in the international sector as
its market shareis now only 10% morethan Thai AirAsia and is very concerned as it continues
to lose ground. Thai Airways will be increasingly pressured following the introduction in
December 2013 of another Asian LCC in Thai Lion, which focuses solely on low fares under
a strict cost leadership business model. Combined,Thai Lion and Thai AirAsia will
introduce16 new aircraft in 2014and have the option to scale this much higher in subsequent
years. Thus it is imperative that Thai Airways responds expeditiously and appropriately to
this influx. This questionnairerevealed that, unlike most Asian network airlines, Thai Airways
considers the following specific responses to be very important in competing with LCCs:
negotiating with airports and other providers to reduce charges and costs; outsourcing
particular areas; revenue from alliance and codeshare partners; using and leveraging their
FFP; and creating a low-cost subsidiary.
Furthermore, Aspire Aviation (2013) identified that Thai Airways “must gain efficiencies
wherever it can and make some bold moves.” This has recently included the offering for sale
of 18 older and fuel-inefficient aircraft. Thai Airways’ bold move emanated by setting up two
subsidiary airlines with lower cost structures than the incumbent through the creation of Thai
Smile, a light-premium hybrid operator, and through its domestic LCC subsidiary,Nok
Air.Theseseparate brands each have unique products and value propositions that arefocused
on particular segments (Pearson and Merkert, 2014). Nok Air has become Thailand’s most
profitable operator, with an 11% net margin in 2013 (ACI, 2013), and Taylor (2013) shows it
anticipates adding 12 new aircraft by 2015 for a total of 33. The three carriers in the Thai
Airways group have an overall market share(domestic and international) of 36.6% in mid-
2014 (CAPA, 2014), about double Thai AirAsia’s. Nevertheless, Thai Airways’ own strategic
- 16-
capability is 6.7% below the average capability of all 22 airlines, and this clearly must be
strengthened if it is to survive and prosper as Thailand’s domestic and international markets
inevitably become more competitive.
4.1.4 Philippine Airlines
The Philippines has the largest infiltration of LCCs than any other Asian country and
Philippine Airlines is pivoted in the centre of this mass invasion. The income distribution in
the Philippines is distorted as the upper 50% of households have 80% of the income and the
highest 10% accounted for 34% of the consumption (Africa, 2011). Therefore, the majority of
the Filipino population or travellers to the Philippines are budget conscious which has inturn
triggered the rapid expansion of LCCs, as CAPA (2014)determined that LCCs hold around
92.0%of the domestic seat capacity, which is the world’s highest penetration, and the LCCs
control around one-third of the International market in 2013. Despite this, Philippines
Airlines has weakstrategic capability, with just 27.7% of the capability of the benchmarked
airline, Vietnam Airlines. With the fourth lowest capability of all 22 airlines, Philippines
Airlines significantly underperforms compared to its peers and struggles considerably in
competing with LCCs. Manuela (2011) found thatthe Philippine-domiciled carriers must
discount heavily in order to stimulate passenger activity. A passenger survey of passengers
travelling on Philippine Airlines in 2012 undertaken by O’Connell and Vanoverbeke (2014)
found that the fare was the most important purchasing criteria for economy passengers flying
to the Philippines.
Philippine Airlines found the 37 competitive responses significantly more difficult to
implement and equally less important than the benchmark airline, Vietnam Airlines. The
Philippine incumbent found the following responses to be especially difficult: ability and
speed to exit unprofitable markets; increasing seating density; increasing the role of cargo;
more effectively segmenting each market; and building value through CRM. Philippine
Airlines also found it very difficult to generate more connecting passengers, which is a
proposition strongly supported by O’Connell and Vanoverbeke (2014) who found that just
13.4% of Philippine Airlinespassengers from its North American routes transferred in Manila
to other Filipino destinations in 2012. The situation is further exacerbated as the incumbent is
not currently a member of any of the three global alliances (accounting for 61% of the global
traffic) which would allow Philippine Airlines to connect and transfer passengers to their vast
networks.Philippine Airlines indicated that there were a number of issues that it deemed
unimportant when competing with LCCs which included: changing to one fleet: negotiating
- 17-
with airports and other providers to reduce costs;and commission-based components.
Meanwhile, other concerns were raised that were categorised as even less important and
comprised: reducing labour; the ability to quickly introduce changes; leveraging brand
strength; outsourcing; and leveraging their FFP. These are all essential strategies that should
be prioritised when competing against LCCs, for otherwise Philippine Airlines will continue
to struggle in its pursuit of combating its low fare aggressors. Nevertheless, the Philippine
flag carrier placed greater emphasis on certain responses than the airline with the strongest
overall capability, notably: revenue from alliance or codeshare partners; more emphasis on
longer-haul flights; greater reliance on connecting passengers; reducing the use of
distribution intermediaries; andincreasing seating density, which demonstrates its intent to
strategically position itself more into the long haul markets where it can avail of feed traffic
from partners. Clearly it has no long-term strategic plan in place in dealing with LCCs, which
is a dangerous prognosis.
4.1.5 Jet Airways and Air India
Jet Airways and Air India placed a very similar higher level of importance on particular
competitive responses than Vietnam Airlines had emphasised. However, they also found
responses to be considerably more difficult to implement. They particularly stressed the
importance of reducing the use of distribution intermediaries; simplifying fares; maintaining
premium cabins; and leveraging brand strength. Jet Airways and Air India found simplifying
fares to be very important with virtually every other sampled airline considering it less
important.O’Connell et al (2013) demonstrated that fares on Indian domestic markets have
fallen by 57% from 2005 to 2009, while IATA (2012) reported that the average Indian ticket
price of $95 is about $11 below that of the cost to break-even, which highlights the
significance of fare structures and their associated issues. Both airlines have been slow at
implementing changes, which largely accounts for their poor financial performance. For
example, Air India lost an accumulated $3.2 billion in the three financial years ending March
2014, and Jet Airways lost $919 millionin the same period (CAPA, 2014a; CAPA, 2014b).
Their slowness in implementing changes is especially disadvantageous given the excessive
competition from LCCs that they have experienced, thus the need to strengthen their
capabilities, beginning with cost-cutting, if they are to clawback market share and to
strengthen their competitive advantage. Indeed, Air India, in its committee report on its cost
cutting programme, and Jet Airways, in its turbine restructuring programme, both emphasised
the significance of eliminating commissions for bookings and growing direct sales. The
- 18-
responses on which they place greater emphasis partly indicates their similar approaches to
restructuring: adopting certain fundamental LCC practices while retaining the core elements
of network airlines, thereby somewhat hybridising. This approach has been successfully
implemented by Aer Lingus.
Overall, network airlines from South Asia have nearly the weakest strategic capability
of all three sub-regions, at -1.14. That this sub-region also has the highest LCC penetration –
61.6% (CAPA, 2014) – clearly indicates the challenges faced by airlines from this area. This
is especially the case for Air India and SriLankan, the latter the second least capable of
competing with LCCs (-1.59). Indeed, they desperately need to be able to effectively respond
to LCCs but they are unable to do so
4.1.6 Cathay Pacific and Hong Kong Airlines
Network airlines in Hong Kong are very vulnerable to new LCC entry from the insatiable
growth of LCCs and because LCCs in Hong Kong in 2013 had just 5% market share (CAPA,
2014), with Hong Kong “one of the bigger pieces of the puzzle that’s been missing from the
LCC map” (Wang and Lee, 2014). Their vulnerability is not just because of increased price
competition but also, and perhaps more importantly, to the declining number of slots and
gates, thereby reducing expansion potential. Will Horton, a senior analyst based in Hong
Kong for the Centre for Aviation, said that “Cathay is extremely worried” (Wang and Lee,
2014). However, both Cathay Pacific and Hong Kong Airlines have above-average strategic
capabilities, at -1.03 and -0.73 respectively, so are better placed than many to compete with
LCCs. Hong Kong Airlines’ overall position is strengthened further because Hong Kong
Express has been modified into an LCC, so it is now effectively its low-cost subsidiary.
Thus, Hong Kong Airlines will focus upon the premium segment while Hong Kong Express
targets leisure and labour traffic. In contrast, Cathay Pacific has no plan for its own low-cost
subsidiary, and will instead make necessary changes itself to increase its competitiveness,
particularly regarding adjusting to customer requirements (IATA, 2013). Indeed, this
questionnaire established that Cathay Pacific finds increasing product differentiation and
enhancing quality to premium passengers to be both easy and very important.
Despite the relative strength of Cathay Pacific and Hong Kong Airlines, network airlines
within Northeast Asia have the lowest strategic capability of all sub-regions. This suggests
that they are not ready or able to effectively compete with LCCs, which partly explains why
so many of them have created or have announced or planned low-cost subsidiaries (footnote 5
here), thereby believing they need not instigate so many changes themselves. However, they
- 19-
would benefit more from strengthening their own existence, thus increasing their capability to
compete by reducing costs, increasing efficiency and productivity, or adapting their product
and marketing responses to better reflect the changing reality. This may also assist in
increasing barriers to entry, thereby potentially reducing the likelihood of new entry.
5. Strategic capability and performance
The identified strategic capability of all sampled network airlines was then measured
against their overall performance (the level of importance and current satisfaction with each
of the eight performance areas and then averaged). This can be seen in Figure 2.Vietnam
Airlines was measured as the benchmark airline as it had the strongest overall strategic
capability, and all the other data points for the other airlines were rescaled accordingly. As
the benchmark airline, Vietnam Airlines is set to 100% because otherwise all the data points
would become clustered in the centre of the diagram and may therefore be very difficult to
interpret.
- 20-
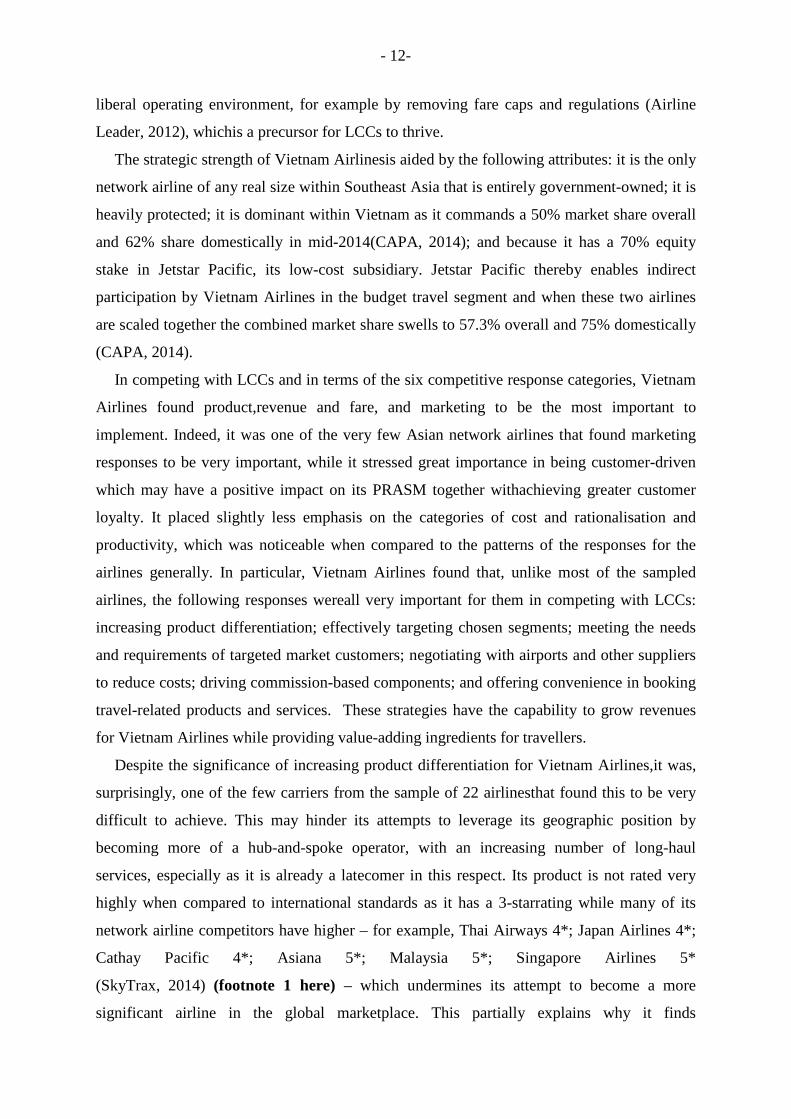
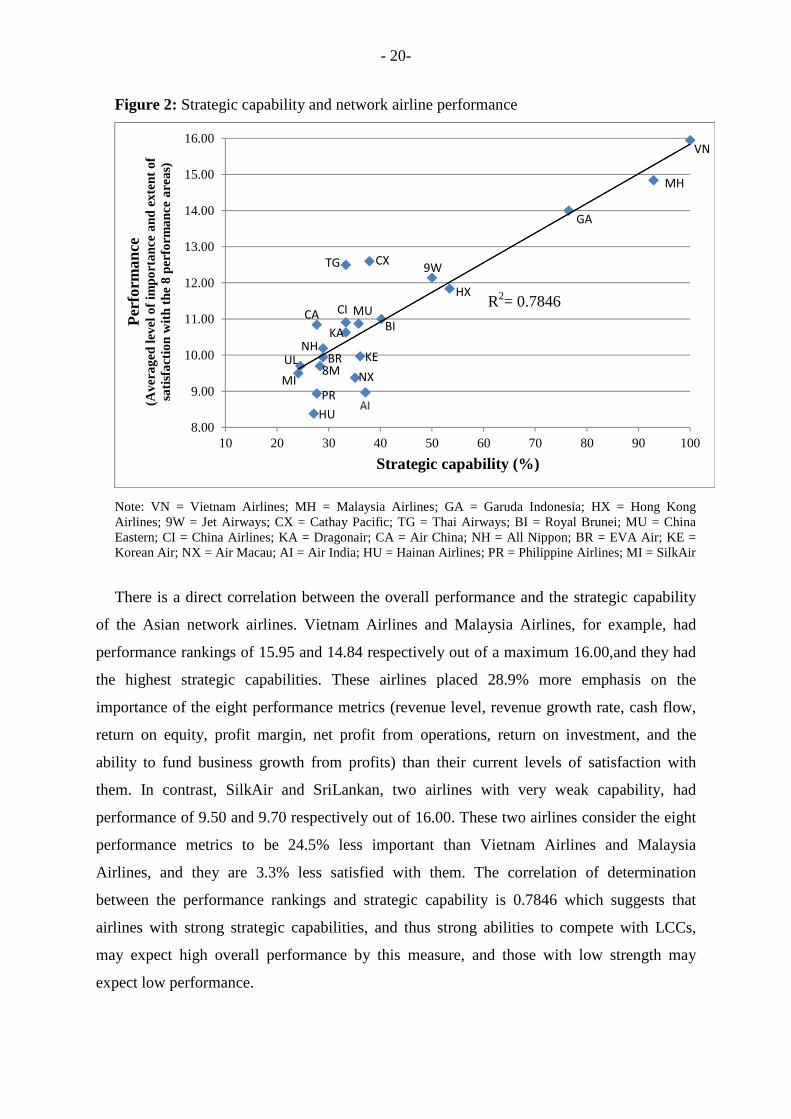
Figure 2: Strategic capability and network airline performance
Note: VN = Vietnam Airlines; MH = Malaysia Airlines; GA = Garuda Indonesia; HX = Hong KongAirlines; 9W = Jet Airways; CX = Cathay Pacific; TG = Thai Airways; BI = Royal Brunei; MU = ChinaEastern; CI = China Airlines; KA = Dragonair; CA = Air China; NH = All Nippon; BR = EVA Air; KE =Korean Air; NX = Air Macau; AI = Air India; HU = Hainan Airlines; PR = Philippine Airlines; MI = SilkAir
There is a direct correlation between the overall performance and the strategic capability
of the Asian network airlines. Vietnam Airlines and Malaysia Airlines, for example, had
performance rankings of 15.95 and 14.84 respectively out of a maximum 16.00,and they had
the highest strategic capabilities. These airlines placed 28.9% more emphasis on the
importance of the eight performance metrics (revenue level, revenue growth rate, cash flow,
return on equity, profit margin, net profit from operations, return on investment, and the
ability to fund business growth from profits) than their current levels of satisfaction with
them. In contrast, SilkAir and SriLankan, two airlines with very weak capability, had
performance of 9.50 and 9.70 respectively out of 16.00. These two airlines consider the eight
performance metrics to be 24.5% less important than Vietnam Airlines and Malaysia
Airlines, and they are 3.3% less satisfied with them. The correlation of determination
between the performance rankings and strategic capability is 0.7846 which suggests that
airlines with strong strategic capabilities, and thus strong abilities to compete with LCCs,
may expect high overall performance by this measure, and those with low strength may
expect low performance.
MU
HX
CX
BI
VN
BR
9W
GA
UL
KA
PR
MH
NH
NX8M
HU
CA
KE
MI
CI
TG
8.00
9.00
10.00
11.00
12.00
13.00
14.00
15.00
16.00
10 20 30 40 50 60 70 80 90 100
Per
form
ance
(Av
era
ged
lev
elo
fim
po
rta
nce
an
dex
ten
to
fsa
tisf
act
ion
wit
hth
e8
per
form
an
cea
rea
s)
Strategic capability (%)
R2= 0.7846
- 21-
6. Conclusions
The worldwide LCC penetration rate has grown from 8% in 2001 to 26.3% in 2013.
Within Asia-Pacific, it has increased from 1.1% to 24.5% in this time period. South and
Southeast Asia are at the forefront of LCC development within Asia, with around double the
worldwide rate. LCCs there have grown exponentially, and growth in the past four years, in
particular, has been considerable. This is forecast to continue as there are still many
opportunities, especially given population growth, already large populations, rising
disposable incomes, and often comparatively poor surface alternatives. That Northeast Asia
has an LCC penetration of less than half the worldwide average indicates the potential of its
own further developments, which are increasingly being undertaken.
Irrespective of sub-region, network airlines face an increasingly competitive external
environment, which potentially results in many negative implications. Theoretically, it also
offers a variety of opportunities, particularly in terms of determining precisely their strategic
intention and positioning, refocusing upon their coreand away from LCCs to achieve greater
PRASM, and rationalising costs and becoming more productive. There are many ways by
which network airlines may respond to LCCs, and this paper looked at 37 competitive
responses across six response categories to establish how capable 22 Asian network airlines
are in competing with LCCs. The determination of capability is an important starting point
for them.
This paper found that the strategic capability varies widely by airline, which is to be
expected given the differing levels of importance and difficulty placed by each airline on the
competitive responses. The strength of strategic capability does not directly reflect the
degree of competition faced by LCCs, for it varies widely. In terms of those that presently
compete strongly with LCCs, Vietnam Airlines, Malaysia Airlines, and Garuda Indonesia all
are reasonably well placed to compete as they have comparatively strong strategic
capabilities. In comparison, Air India, Thai Airways, Philippine Airlines, SilkAir all have
notably weaker capabilities and so are more exposed. Nevertheless, the possession of a
strong capability does not necessarily mean that it is fully or properly leveraged.
Those network airlines in countries that are yet to see much LCC activity – including
China, Hong Kong, Taiwan, Myanmar, and Japan – need to strengthen their strategic
capabilities asthey are relatively weak. Indeed, Northeast Asia was found to have the
weakest overall strategic capability of all three regions. The reasonably strong correlation
between strategic capability and overall performance indicates the imperativeness of
- 22-
strengthening and exploiting strategic capability. This will become increasingly important as
LCCs further penetrate.
References
ACI (2013),International Air Travel Update, (http://www.aci-na.org/sites/default/files/kaplan_final_slides.pdf, accessed 1st June, 2014).
Africa, T. (2011), Family Income Distribution in the Philippines, 1985-2009: Essentially theSame, (http://makuhari.wordpress.com/2011/03/07/family-income-distribution-in-the-philippines-1985-2009-essentially-the-same/, accessed 31 January 2014).
Airbus (2013), Global Market Forecast: 2013-2032,(available athttp://www.airbus.com/company/market/forecast/, accessed 5th June 2014).
Airline Leader (2014), Northeast Asia outlook, (available athttp://www.airlineleader.com/regional-focus/north-asia-outlook-2014, accessed 6th June,2014).
Airliner Leader (2013), A Growth Upside Like Never Before: North Asia's LCCs,(http://www.airlineleader.com/this-months-highlights/a-growth-upside-like-never-before-north-asias-lccs, accessed 4th August, 2014).
Airline Leader (2012), Vietnam: Sowing the Seeds for Future Growth,(http://www.airlineleader.com/country-in-focus/vietnam-sowing-the-seeds-for-future-growth,accessed 6th June, 2014).
Anna.aero (2011), Vietnam’s Traffic Continues to Boom as Country Prepares for LondonServices, (http://www.anna.aero/2011/12/01/vietnam-traffic-continues-to-boom-as-country-prepares-for-london-services/,accessed 6th June, 2014).
Aspire Aviation (2013), Thai Airways Pressured by an Increasingly Competitive Market,(http://www.aspireaviation.com/2013/09/26/thai-airways-pressured-by-an-increasingly-competitive-market/,accessed 6th June, 2014).
Aviation Week (2014), LCC Showdown Looms in Southeast Asia,(http://aviationweek.com/awin/lcc-showdown-looms-southeast-asia, accessed 5th August,2014).
Berdy, P. and Zhong, F. (2013), China’s Aviation Renaissance, volume 2, Ascend forAviation.
CAPA (2014a), Air India profile, Subscription Only.
CAPA (2014b), Jet Airways profile, Subscription Only.
CAPA (2014), Low-Cost Carrier Data, Subscription Only.
- 23-
CAPA (2013), VietJet Starts to Exploit Huge Potential of Vietnam’s International Low-CostAirline Market, (http://centreforaviation.com/analysis/vietjet-starts-to-exploit-huge-potential-of-vietnams-international-low-cost-airline-market-98404, accessed 1st June, 2014).
CAPA (2009), How the Legacy Full ServiceAirlines have Responded to Rising LCCCompetition, (http://www.centreforaviation.com/analysis/how-the-legacy-full-service-airlines-have-responded-to-rising-lcc-competition-14504, accessed 3rd January, 2014).
China Airlines (2014), China Airlines and Tigerair Set to Launch Budget Carrier/Low CostCarrier Tigerair Taiwan, (http://www.china-airlines.com/en/newsen/newsen000859.htm,accessed 5th June, 2014).
Doganis, R. (2006), The Airline Business, second edition, Routledge, Abingdon.
Dutton, J. E. and Jackson, S. E. (1987), Categorising Strategic Issues: Links to OrganisationalAction, Academy of Management Review, volume 12, p.p.76-90,DOI:10.5465/AMR.1987.4306483.
Forsyth, P. (2005), Competition Versus Predation in Aviation Markets: A survey ofexperience in North America, Europe, and Australia, Ashgate, Aldershot.
Francis, G., Humphreys, I., Fry, J. (2005). The Nature and Prevalence of the Use ofPerformance Measurement Techniques by Airlines, Journal of Air Transport Management,volume11, pp.207-217, DOI: dx.doi.org/10.1016/j.jairtraman.2004.10.003.
Fu, X. and Oum, T. (2014), Air Transport Liberalization and its Effects on AirlineCompetition and Traffic Growth: an overview, in Peoples, J. (ed), Advances in AirlineEconomics, Emerald, pp.11-44.
Gross, S. and Luck, M. (2013), The Low Cost Carrier Worldwide, Ashgate, Aldershot.
Hamel, G. and Prahalad, C. K., (2013), Creating Global Strategic Capability, in: Wood, N.and Vahlne, J. E. (eds), Strategies in global competition, Routledge, Abingdon.
Hanaoka, S., Takebayashi, M., Ishikura, T., Saraswati, B. (2014).Low-Cost Carriers VersusFull Service Carriers in ASEAN: The Impact of Liberalization Policy on Competition,Journal of Air Transport Management, volume 40, pp. 96-105, DOI:10.1016/j.jairtraman.2014.06.008.
Holloway, S. (2008), Straight and Level: Practical Airline Economics, third edition, Ashgate,
Aldershot.
IATA (2013), Cathay Pacific: Celebrate Differences,
(http://www.iata.org/publications/airlines-international/april-2013/Pages/ceo-interview-
cathay.aspx, accessed 6th June, 2014).
IATA (2012). Special Report: Putting the Pieces Together, (http://training-www.iata.org/publications/airlines-international/october-2012/Pages/india.aspx, accessed 4th
June, 2014).
- 24-
IATA (2007). O’Connell correspondence with IATA executives on Airline Strategy - foundin O’Connell, J. F. (2007), The Strategic Response of Full Service Airlines to the Low CostCarrier: Threat and the Perception of Passengers to Each Type of Carrier, PhD thesis,Cranfield University.
Johnson, G., Scholes, K. and Whittington, R. (2007), Exploring Corporate Strategy, eighth
edition, Pearson Education, Harrow.
Klophaus, R. Conrady, R., and Fichert, F. (2012), Low Cost Carriers Going Hybrid:Evidence from Europe, Journal of Air Transport Management, volume 24, pp.54-58, DOI:10.1016/j.jairtraman.2012.01.015
Malaysia Airlines, 2013 Annual Report, (available at
http://ir.chartnexus.com/mas/report.php,accessed 4th June, 2014).
Manuela, W.S. (2011), Factors Affecting Airline Profits: Evidence from the Philippines,
Journal of Applied Business Research, volume 27,pp 17-22.
Markides, C. (2006), Disruptive Innovation: In Need of Better Theory, Product Innovation
Management, volume 23, pp.19-25, DOI: 10.1111/j.1540-5885.2005.00177.x
Merkert, R. and Pearson, J. (2014),A Non-parametric Efficiency Measure Incorporating
Perceived Airline Service Levels and Profitability, Journal of Transport Economics and
Policy [in press].
Roberts, N. and Stockport, G. J. (2014), Defining Strategic Flexibility, in: Sushil, A. and
Stohr, E. A. (eds), The Flexible Enterprise, Springer, India.
OAG (Official Airline Guide), Airline Capacity Database, Subscription Only.
O’Connell, J.F. and Vanoverbeke, K. (2014).Philippine Airlines, Flying in a changinglandscape, Journal of Tourism Economics, DOI:http://dx.doi.org/10.5367/te.2014.0403.
O′Connell, J. F., Krishnamurthy, P., Warnock-Smith, D., Lei, Z., Miyoshi, C. (2013), An investigation into the core underlying problems of India’s airlines, Transport Policy, volume29, pp.160-169, DOI: 10.1016/j.tranpol.2013.05.002.
O’Connell, J. F. (2007), The Strategic Response of Full Service Airlines to the Low CostCarrier: Threat and the Perception of Passengers to Each Type of Carrier, PhD thesis,Cranfield University.
O’Connell, J.F. and Williams, G. (2005).Passengers’ Perceptions of Low Cost Airlines andFull Service Carriers: A Case Study Involving Ryanair, Aer Lingus, Air Asia and MalaysiaAirlines, Journal of Air Transport Management, volume 11, pp. 259-272, DOI:10.1016/j.jairtraman.2005.01.007.
- 25-
Ong, W. L. and Tang, A. K. G. (2010), A Note on the Determinants of Airline Choice: TheCase of Air Asia and Malaysia Airlines, Journal of Air Transport Management, volume16pp.209-212, DOI: 10.1016/j.jairtraman.2009.06.001.
Pearson, J. and Merkert, R. (2014),Airlines-within-airlines: ABusiness Model Moving East,Journal of Air Transport Management, volume 38, pp.21-26, DOI:10.1016/j.jairtraman.2013.12.014
Robinson, M. S. (2008), Understanding the Resource-Based View: Implications ofMethodological Choice and a New Creative Context, PhD thesis, Queensland Universityof Technology.
Rumelt, R. (2011) Good strategy, bad strategy, Profile Books, London
Ryans, A., (2009), Beating LowCost Competition: How Premium Brands can Respond toCut Price Rivals, John Wiley & Sons, Chichester.
Schofield, A. (2013), Taiwan-based Carriers Unveil LCC Start-UpPlans,(http://aviationweek.com/awin/taiwan-based-carriers-unveil-lcc-start-–plans, accessed6th June, 2014).
SkyTrax (2014), Vietnam Airlines, (http://www.airlinequality.com/Airlines/VN.htm -accessed 5th June, 2014).
Suki, N. M. (2014),Passenger Satisfaction with Airline Service Quality in Malaysia: AStructural Equation ModellingApproach, Research in Transportation Business &Management, volume 10,pp.26-32, DOI: 10.1016/j.rtbm.2014.04.001.
Tan, A. K. J. (2014), The ASEAN Single Aviation Market: Liberalizing the Airline Industry,ERIA Policy Brief, June.
Taneja, S. Pryor, M. G., Sewell, S., and Recuero, A. M. (2014), Strategic Crisis Management:A Basis for Renewal and Crisis Prevention, Journal of Management Policy and Practice,volume 15, pp.78-85.
Taneja, N. K. (2010), Looking Beyond the Runway: Airlines Innovating with Best Practiceswhile Facing Realities, Ashgate, Aldershot.
Taylor, E. (2013),Nok Air to Add 12 Aircraft by 2015,(http://www.flightglobal.com/news/articles/nok-air-to-add-12-aircraft-by-2015-390456/,accessed 4th August).
Teece D. J. (2007), Explicating DynamicCapabilities: The Nature and Micro Foundations of(Sustainable) Enterprise Performance, Strategic Management Journal, volume 28, pp.1319-1350, DOI: 10.1002/smj.640.
Thompson, S. (2013), Myanmar: Yangon International Airport Prepares for Huge PassengerGrowth, (http://www.airport-world.com/component/k2/item/2761-myanmar-yangon-international-airport-prepares-for-huge-passenger-growthaccessed 6th June).
- 26-
Wang, J. and Lee, S. (2014), Asia’s Budget Airline Invasion, (available athttp://www.businessweek.com/articles/2014-02-13/asias-budget-airline-invasion-cathay-pacific-defends-hong-kong, accessed 6th June, 2014).
Zhang, A., Hanaoka, S., Inamura, H., and Ishikura, T. (2009), Low Cost Carriers in Asia:Deregulation, Regional Liberalization and Secondary Airports, Research in TransportationEconomics, volume 24, pp.36-50, DOI: 10.1016/j.retrec.2009.01.001.
Footnotes:
1 The official SkyTrax ranking has existed since 1999 and is based on looking at thestandards of 800 different items/areas across an airline's frontline product and staff serviceareas and also the airport and cabin service environments.
2 The data for Malaysia Airlines was obtained prior to the loss of flights MH370 and MH17
3 The inclusion of AirAsia X, AirAsia’s medium- and long-haul subsidiary that is based inMalaysia, means thatthe Malaysia-based elements of the AirAsia Group has an internationalmarket share of 31.7%. The inclusion of Indonesia AirAsia increases this to 37.9% (CAPA,2014)
4 For instance, where there is at least a two-point difference, for example Malaysia Airlinesdeeming a response to be neither easy nor difficult (score of three of five) and VietnamAirlines considering it very difficult (score of five). All responses are at least difficult forVietnam Airlines
5 For example, Air India Express; Nok Air; Jetstar Asia; Tigerair; Citilink; Jetstar Pacific;Hong Kong Express; Tigerair Taiwan; V Air; PAL Express; Air Busan; Jin Air; andPeach. Various low-cost subsidiaries are planned in China, for example China United (fromChina Eastern) and Jiuyuan Airlines (from Juneyao)