the strategic corporate investments handbook
TRANSCRIPT


i
The Strategic Corporate Investments Handbook


The Strategic Corporate Investments Handbook
David Whittaker
EUROMONEY
BOOKS

Published byEuromoney Institutional Investor PLCNestor House, Playhouse YardLondon EC4V 5EXUnited Kingdom
Tel: +44 (0)20 7779 8999 or USA 11 800 437 9997Fax: +44 (0)20 7779 8300www.euromoneybooks.comE-mail: [email protected]
Copyright © 2014 Euromoney Institutional Investor PLC
ISBN 978 1 78137 267 8
This publication is not included in the CLA Licence and must not be copied without the permission of the publisher.
All rights reserved. No part of this publication may be reproduced or used in any form (graphic, electronic or mechanical, including photocopying, recording, taping or information storage and retrieval systems) without permission by the publisher. This publication is designed to provide accurate and authoritative information with regard to the subject matter covered. In the preparation of this book, every effort has been made to offer the most current, correct and clearly expressed information possible. The materials presented in this publication are for informational purposes only. They reflect the subjective views of authors and contributors and do not necessarily represent current or past practices or beliefs of any organisation. In this publication, none of the contributors, their past or present employers, the editor or the publisher is engaged in rendering accounting, business, financial, investment, legal, tax or other professional advice or services whatsoever and is not liable for any losses, financial or otherwise, associated with adopting any ideas, approaches or frameworks contained in this book. If investment advice or other expert assistance is required, the individual services of a competent professional should be sought.
The views expressed in this book are the views of the author and do not reflect the views of Euromoney Institutional Investor PLC. The author alone is responsible for accuracy of content.
Note: Electronic books are not to be copied, forwarded or resold. No alterations, additions or other modifications are to be made to the digital content. Use is for purchaser’s sole use. Permission must be sought from the publisher with regard to any content from this publication that the purchaser wishes to reproduce ([email protected]). Libraries and booksellers and ebook distributors must obtain a licence from the publishers ([email protected]). If there is found to be misuse or activity in contravention of this clause action will be brought by the publisher and damages will be pursued.
Typeset by Phoenix Photosetting, Chatham, Kent
v
Contents
Acknowledgements xiiiAbout the author xivIntroduction xv
1 Strategy and corporate growth 1Strategic planning 1Efficient strategic planning approach 1
Mission, goals and objectives 1Position audit 3Corporate appraisal 3Environmental analysis 5Competitor analysis 5Options available 6Evaluation 6Performance measurement 7Conclusion 7
Marketing strategies 7Product positioning 8
Post-investment financial and performance management 10Capital budgeting 13Other areas of investment appraisal 17
Monthly cash flows 17Capital rationing 17Unequal project lives 20Weighted average cost of capital 22Post-monitoring the corporate investment 23
Review and control 29Organic versus acquisitive growth 29Organic growth 31The new product or business development process 32
Idea generation 33Test the concept 33Commercial analysis 33Market testing 34Pre-launch 34Commercial launch 35Post-launch evaluation 35
Sales pipeline management 35
vi
Contents
Acquisitive growth 36Step 1 – due diligence 36Step 2 – acquisition value 37
Asset-based valuations 37Free cash flow 39Multiples-based approaches 40Terminal value 42Enterprise value 44
Step 3 – acquirer actuals and projections 45Step 4 – combined actuals and projections 45
Price earnings ratio approaches 45Dividend models 45
Company mergers 46Joint ventures 52Diversification 52Due diligence 54
Due diligence for mergers and acquisitions decisions 54Appoint legal and accountancy professionals 54Assess information about the business and its relationships 54
Market research 56Market testing 58Desk research 59
Market reports as a source of secondary research 59Published accounts as a source of secondary research 59Journals and subscription websites as a source of secondary research 66Government published data as a source of secondary research 66Customer desk research as a source of secondary research 66
Business plans 66Executive summary 67The nature of the business 67The mission statement 67The résumés of the senior team 67Short, medium and long-term objectives 68Operational plan 68Market size and opportunity 68Market segmentation 69Investment required and financial projections 69
2 Sources of finance 70Initial public offering 70
London Stock Exchange – main listing 75London Stock Exchange – AIMS listing 75Pre-IPO preparation 75
Comprehensive business plan 76

Contents
vii
Suitability for an IPO 76Assess the management team 76Board appointments 77Internal controls 77Improving operational efficiency 77Financial performance 77
The IPO process 77Appoint a sponsor 78Appoint advisors 78Draft prospectus 79Initial price review 80Draft documents to the UKLA 80Initial meeting with the exchange 80Public relations presentation 80Analyst presentation 81Due diligence on the prospectus 81Submission of the prospectus to the UKLA 81Formal application for listing and admission 81Payment of UKLA and exchange fees 81Listing and trading admission granted 81Trading commences 81Registrar appointed 81
Post-IPO compliance 81Rights issues 83Debt capital 86
Planning different debt structures 87Corporate investment funds 87Infrastructure fund governance and controls 87
Introduction 88Investment fund structure 88Corporate governance and the investment process 89
Business case reporting pre-funding (Phase 1) 90Business case reporting funding (Phase 2) 92Authorisation levels 95
Internal controls and assurance 95Risk management 97Investor performance reporting 98
Private equity 98Different types of private equity transaction 101
Buyout 101Development capital 101Growth capital 101Venture capital 101Turnaround capital 102
viii
Contents
Buyout capital financial analysis implications 102Development capital financial analysis implications 102Growth capital financial analysis implications 102Venture capital financial analysis implications 103Secondary private equity transaction 103Recapitalisation 103
Project finance as a source of funding 107Material and key project finance areas 113
Reserve accounts 113Dividends 113Financial asset accounting 114Revenue recognition 114
3 Corporate investment decisions 115Disposals 115Refinancing 119Capital structures 121Dividend policy 121Working capital management 125Sale and lease back decisions 132
Advantages of sale and lease back 132Disadvantages of sale and lease back 132Financial evaluation 132
Lease versus buy decisions 133The advantages of leased equipment 134The disadvantages of leased equipment 134Lease versus purchase decisions 134Consider the lease terms before taking the decision 136
Credit analysis 136Restructuring and distressed debt 138
Improve business performance 139Reschedule debts 141Strategic disposals 141Capital reconstruction 145
4 Other areas 151Credible business projections 151
Financial modelling best practice 151Scope 157Designing the financial model 157Layout 157Finalising the existing business corporate financial model 158Sources of error 158Self-testing the model 159
Contents
ix
Top level analytical review 159Key output review 163Flex and sensitivity review 163
Using the model 163Disclaimers 163Sales documents 164
Reviewing and auditing financial models 164Limited scope financial model reviews 164
Design review 165Analytical review 165Degree of integration and reconciliation of financial statement forecasts 165Flex testing and sensitivity review 166Parallel or shadow modelling 166Macro review 167
Financial model audits – corporate finance models 168Scoping 171Work plan 182Coding review 182Analytical review 186Data book and legal documentation 186Tax 186Accounting 186Review comments 186Iterations and base case clearance process 187Sensitivities 187Second senior review 187Partner sign off 187
Project information memorandum 187Well-structured 188Professionally presented and well-written 188
Offering memorandum 188The company disposal process 188
Preparation 190First round 190Second round 192Negotiate 193Deal closure 193
Internal controls 193The sales cycle 194The purchases cycle 194Payroll 195The stock cycle 195Bank account and cash 195
Corporate governance 195
x
Contents
The UK Corporate Governance Code 196Comply or explain 197The main principles of the Code 197
Section A: Leadership 197Section B: Effectiveness 197Section C: Accountability 198Section D: Remuneration 198Section E: Relations with shareholders 198
Corporate investment risk 199Examples of risk management techniques 200
SWOT 200PESTL 200Risk register 201Scenario analysis 201
Excel’s scenario manager 202Interest rate risk management 202
Fixed versus floating rate debt 203Forward rate agreements 203Interest rate futures 203
Interest rate options 203Interest rate swaps 204Exchange rate risk management 204
Forward exchange rates 204Other exchange rate hedging strategies 204
Insurance 205Political risk insurance 205
Risk transfer 206Risk and return 206Risk management best practice case study 208
Risk identification and risk recording 209Risk measurement 212
A critical evaluation of business plans 214Business case proposals – controls and processes 215
5 Conclusions 220
Appendix 1 Project information memorandum 221Disclaimer 221Table of contents 222Glossary of terms 222Project background 224Transaction overview 225
Introduction 225Project structure 225
Contents
xi
Financials 227Base case and scenario analysis 231Location 232Project risks and mitigation 232
Construction risk 232Fuel supply risk 232Offtake risk 232Technological risk 232Operating risk 232Environmental and licensing risk 233
Contact us 233
Appendix 2 Confidential offer memorandum 234Cover 234Table of contents 234Disclaimer and notice 234Industry overview 235Overview of the business 235Ownership and control 235Strategy and business model 235Products and services 236Market segmentation 236Management and employees 236Facilities and premises 236Information systems 236Proprietary technology and intellectual property 236Legal, regulatory and environmental 236Financial performance 237
Historic income statement summary 237Historic balance sheet 238Historic cash flows 239Historic financial ratios 240
Financial statement forecasts 241Projected income statement summary 241Projected balance sheet 242Projected cash flows 243Projected financial ratios 244
Acquisition and transaction information 244
Appendix 3 Strategic planning case study 245Exercise 245
Market size/growth 245Market share 246Competitor analysis 246

xii
Contents
Environmental analysis 247Financial analysis 248Required 252
Answer 252
Glossary 260

xiii
Acknowledgements
I would like to dedicate this book to all the people who have been influential in my career. I would also like to make a special acknowledgement to my family for their support.

xiv
About the author
David Whittaker is an experienced finance and commercial professional who has supported and added value to strategic, financial and commercial decision making in corporations for over two decades. He is a business school graduate and a chartered management accountant. He has led several seminars and training courses. He has published four other successful Euromoney titles.

xv
Introduction
This book has been written in order to give readers the opportunity to gain skills and knowledge which integrate corporate strategy with finance. Furthermore, this book will assist readers to enhance the business value creation process in a more controlled and less risky way.
It addresses the areas of corporate strategy and growth supported by a methodology of maximising value at minimal risk. The sources of finance that can support the corporate strategy and growth are discussed. Other investment decisions to increase the value of the corporate over the corporation’s life cycle are discussed. Other areas are addressed including the key documentation for engaging with potential investors or buyers, the necessity to prepare credible projections, how to manage risks and critically evaluate corporate invest-ment opportunities.
It is important to note that the figures, illustrations or the case studies used in this book do not represent any past, current or indeed future corporate finance transactions or projects of any kind. The numbers and results contained herein are purely fictional.
David WhittakerAugust, 2014


1
Chapter 1
Strategy and corporate growth
Strategic planning
Strategic planning can be defined as an organisation’s process which defines its strategic direction and decision making in order to fulfil its goals, mission and vision. We will now discuss the efficient strategic planning approach. This is a framework that allows a company to achieve its goals, mission and vision in an efficient and effective manner.
Efficient strategic planning approach
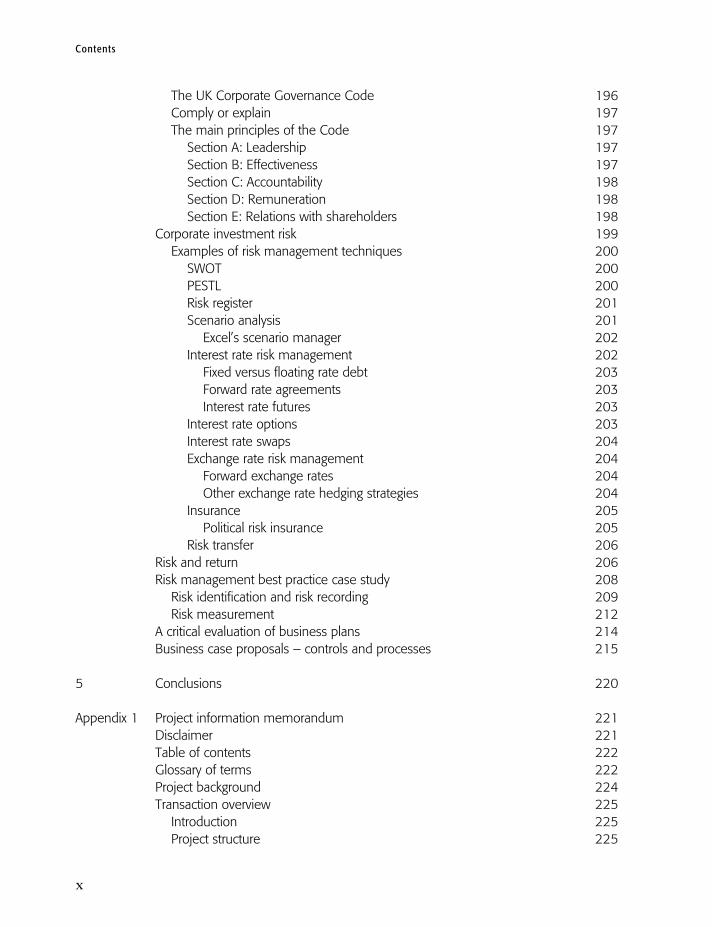
The efficient strategic planning approach shown in Exhibit 1.1 outlines a basis for sustain-able corporate growth and competitive advantage. We will discuss this approach in more detail below.
Mission, goals and objectives
The mission statement outlines the fundamental purpose of the organisation. For example, an engineering, procurement and construction (EPC) contractor may have the mission of providing quality infrastructure at competitive prices thus maximising the value of its share-holders. The objectives may be to grow the company organically and by acquisition in the Eastern European market achieve a goal by the end of year five of 200% growth in both turnover and earnings before interest taxation depreciation and amortisation (EBITDA). Objectives need to be supported by measurable goals with a clearly defined timescale to achieve them. In summary, all objectives should be specific, measurable, agreed, realistic and time (SMART) deliverable.
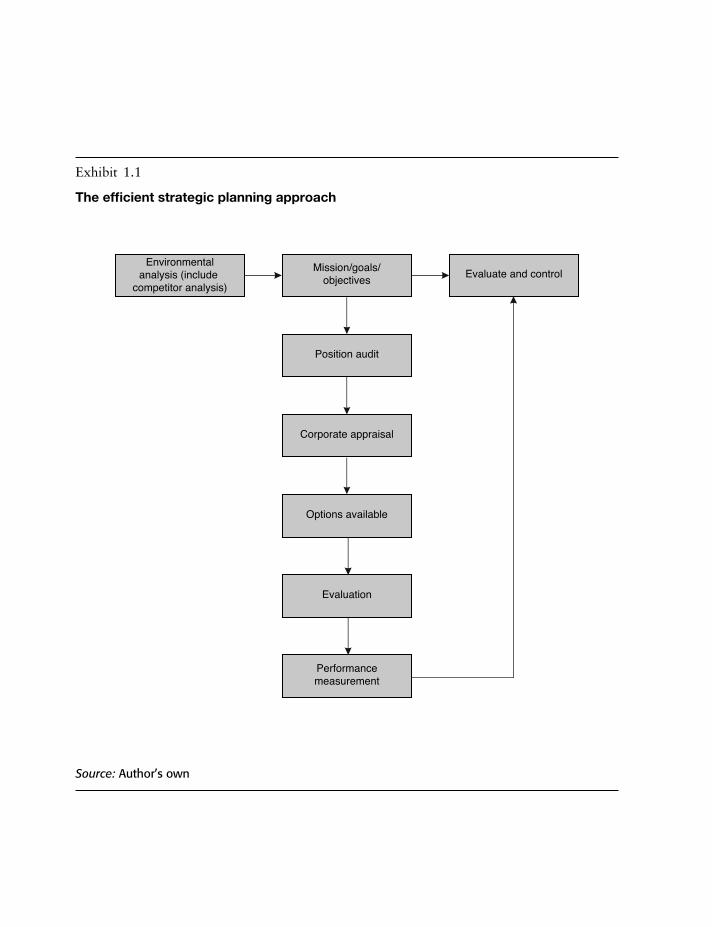
Exhibit 1.1
The efficient strategic planning approach
Environmentalanalysis (include
competitor analysis)
Mission/goals/objectives Evaluate and control
Position audit
Corporate appraisal
Options available
Evaluation
Performancemeasurement
Source: Author’s own

Strategy and corporate growth
3
Position audit
The position audit will allow senior management to have a clear view of where the business is today. The important areas that will have to be addressed include the following.
• Have the organisation’s goals and objectives been achieved? • How does the turnover versus profitability look?• How well is the working capital being managed?• How well is the company able to service the debt levels of lenders and provide returns
to shareholders or investors? • How do employee performance management issues look? That is, are key management
team members performing against their objectives?• How good are the organisation’s information systems? • What critical management information is lacking?• How efficient are the sales processes and how strong are the order book and contract
pipeline?• Does the organisation have any future business development opportunities?• How well is the organisation performing financially and what is the financial strategy and
is it suitable to support the future growth plans?
It is inevitable that a list of actions will come from the position audit. These actions will be necessary in order to take advantage of opportunities and the potential impact of threats. It is important that the list of actions is translated into a managed and planned execution program.
In summary, a business position audit provides a clear snapshot of a business as it stands at the present moment. It represents a systematic assessment of the current strength and weaknesses of an organisation as a pre-requisite for future strategic planning.
Corporate appraisal
Corporate appraisal is often referred to as strengths, weaknesses, opportunities and threats (SWOT) analysis. This process is a critical evaluation of the strengths and weaknesses, opportunities and threats in relation to the internal and environmental variables impacting an organisation in order to evaluate the organisation’s position prior to drafting the long-term strategic plan.
In summary, strengths and weaknesses are normally variables within the organisation and opportunities and threats are normally outside the organisation.
Examples of potential sources of strengths, weaknesses, opportunities, and threats are as follows.
• Strengths. # The advantages of the business or product proposition. # The product capabilities given the customer’s needs. # The competitive advantages in terms of competitors, for example, better distribution
channels, better technology. # The innovative aspects of the product/business.

The Strategic Corporate Investments Handbook
4
# Any unique selling points. # The resources, assets, people, for example, a team with critical mass. # The experience, knowledge and data. # The processes, systems, IT and communications.
• Weaknesses. # The disadvantages of the business or product proposition. # The gaps in capabilities or market needs. # The competitive weakness versus other similar businesses. # The financial constraints such as a high debt capacity. # Any poor processes and systems. # A lack of necessary accreditations. # Any restrictions on IT, systems or communications.
• Opportunities. # The market developments. # The competitors’ weaknesses or vulnerabilities. # Any geographical or export opportunities. # Any seasonal influences or trends. # The current styles or trends. # Any niche markets or specialist segments of existing markets.
• Threats. # The political factors which may affect the company. # The legislative changes such as taxation. # The environmental pressure such as emissions, pollution and so on. # The IT or computer technology that may reduce the demand for the company’s prod-
ucts and services. # Any new competitors entering the market with attractive and competitive offerings. # The consumer demand decrease due to recessionary impacts. # The technological threats such as new methods of distribution such as e-commerce
which may act as an alternative to retail outlet distribution.
An ideal way to tackle potential opportunities is to match the organisation’s core strengths or competencies where possible. For example, a livestock farm has the opportunity of using its chicken pieces for fried chicken fast food outlets in developing markets where fast food demand is likely to grow as the lower middle class or the socio-economic profile is increasing and has the disposable income to purchase such goods and services. The know-how required to grow from the core skills of a chicken producer to a strategy of forward vertical integra-tion into the fast food outlets is lower than that required to organically grow into something totally unrelated to the organisation’s core skills. Indeed, the development costs and time associated with such a business strategy are also likely to result in lower organic growth in a totally unrelated business. A further example of organic growth from a company’s core business is a commercial airline that may have a growth opportunity of expanding into freight markets by offering international air cargo services. This will obviously involve the use of existing assets (that is, aircraft) in order to generate further business prosperity and cash flows.
Strategy and corporate growth
5
Threats can often be avoided by utilising the organisation’s strengths.The organisation’s weaknesses can often be addressed in the form of an opportunity.
Their weaknesses must be minimised in order to avoid the potential threats.
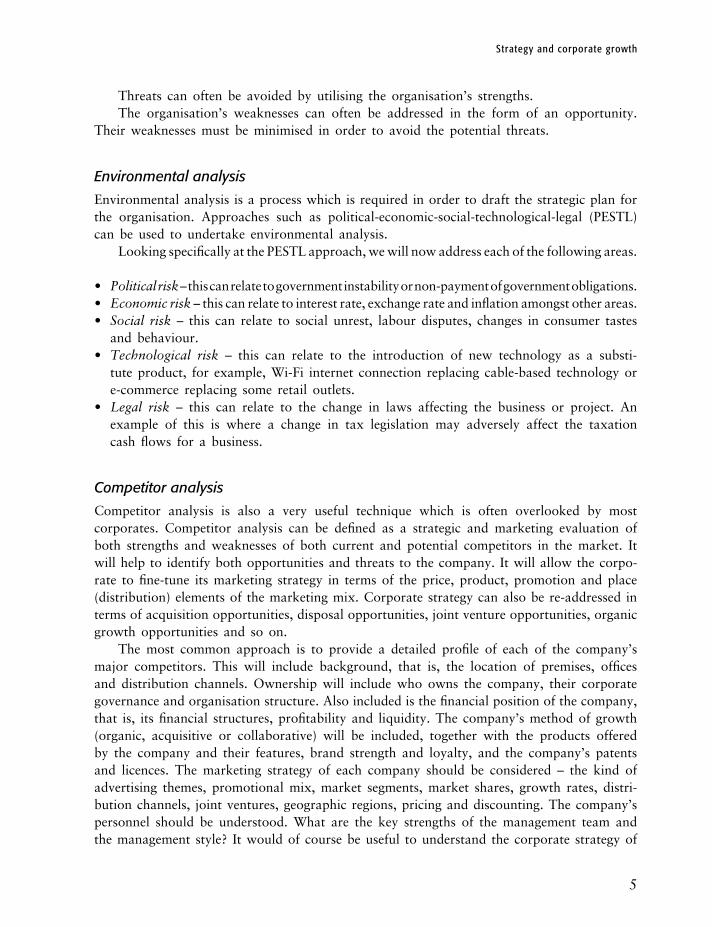
Environmental analysis
Environmental analysis is a process which is required in order to draft the strategic plan for the organisation. Approaches such as political-economic-social-technological-legal (PESTL) can be used to undertake environmental analysis.
Looking specifically at the PESTL approach, we will now address each of the following areas.
• Political risk – this can relate to government instability or non-payment of government obligations.• Economic risk – this can relate to interest rate, exchange rate and inflation amongst other areas.• Social risk – this can relate to social unrest, labour disputes, changes in consumer tastes
and behaviour.• Technological risk – this can relate to the introduction of new technology as a substi-
tute product, for example, Wi-Fi internet connection replacing cable-based technology or e-commerce replacing some retail outlets.
• Legal risk – this can relate to the change in laws affecting the business or project. An example of this is where a change in tax legislation may adversely affect the taxation cash flows for a business.
Competitor analysis
Competitor analysis is also a very useful technique which is often overlooked by most corporates. Competitor analysis can be defined as a strategic and marketing evaluation of both strengths and weaknesses of both current and potential competitors in the market. It will help to identify both opportunities and threats to the company. It will allow the corpo-rate to fine-tune its marketing strategy in terms of the price, product, promotion and place (distribution) elements of the marketing mix. Corporate strategy can also be re-addressed in terms of acquisition opportunities, disposal opportunities, joint venture opportunities, organic growth opportunities and so on.
The most common approach is to provide a detailed profile of each of the company’s major competitors. This will include background, that is, the location of premises, offices and distribution channels. Ownership will include who owns the company, their corporate governance and organisation structure. Also included is the financial position of the company, that is, its financial structures, profitability and liquidity. The company’s method of growth (organic, acquisitive or collaborative) will be included, together with the products offered by the company and their features, brand strength and loyalty, and the company’s patents and licences. The marketing strategy of each company should be considered – the kind of advertising themes, promotional mix, market segments, market shares, growth rates, distri-bution channels, joint ventures, geographic regions, pricing and discounting. The company’s personnel should be understood. What are the key strengths of the management team and the management style? It would of course be useful to understand the corporate strategy of

The Strategic Corporate Investments Handbook
6
each of the competitors, that is, their mission, objectives, growth plans and their acquisition and disposal activity.
Options available
There are a number of strategic options that are available which could be used in order to respond to an opportunity or a threat. These options can include organic growth, acquisition or merger, joint ventures, franchising or licensing, exporting, divestment, do nothing, withdraw from the market or consolidate or rationalise. Each of these areas will be discussed in detail.
Organic growth strategies are business development techniques that promote corporate growth by increased output and larger sales volume of the existing business or a start-up which requires assembling the management team, planning and promoting the business. The opposite of organic growth strategies includes mergers and acquisitions activity, and takeovers of competitors and synergistic businesses.
An acquisition is the purchase of one company by another for a certain consideration package. This consideration package can be made up of cash, shares and debt according to how the parties see fit. The acquirer obviously has a controlling interest over the target company.
A merger represents a business combination of two companies bringing together their operations on certain financing terms, that is, share exchanges, debt or cash financing.
A joint venture is a business arrangement whereby two or more parties agree to work together to undertake a certain opportunity or project. Often each party will contribute an agreed amount of equity. The parties to the joint venture are responsible for the profits and losses arising from the venture often through a specifically incorporated vehicle such as a limited company.
A divestment is the opposite of making an investment. It represents the action of disposing of a company’s asset through a sale.
The doing nothing option obviously equates to a course of action that involves not changing one’s strategic position.
A strategic option may be considered which involves leaving the market. For example, an airline which is experiencing a very poor business performance for a certain route or set of routes may withdraw its service from that particular market and redeploy its aircraft and staff to alternative routes and destinations which may lead to more business prosperity.
The strategic option of rationalisation may involve a restructuring or turnaround of an underperforming business. A cash negative business can be transformed into a cash generative business. Where a restructuring decision is required there is a need to plan the initiative in both words and numbers. Ideally a restructuring or cost reduction plan needs to be included in the budget and certainly the five or 10-year strategic plan of the organisation. The stra-tegic option of undertaking a restructuring should then be performance managed in terms of feedback and control against the planned financials and any non-financial key performance indicators (KPI) identified.
Evaluation
The evaluation stage involves the evaluation of each of the strategic options that a company may consider. Each strategic option should be evaluated both in terms of the qualitative
Strategy and corporate growth
7
advantages and disadvantages of the proposed strategy and the quantitative effect on the forecast financial position of the organisation.
Performance measurement
The post-investment financials and performance is where the management team are running the company with a primary objective of providing an adequate return to its shareholders by maximising the value of the company, servicing the debts of its lenders, and remaining financially viable. It is important that optimal processes and controls are evident in the organisation. Consequently, a unique edge which this book seeks to address is the process for ensuring optimal planning and control of the corporate investment.
Conclusion
We strongly recommend that all businesses undertake a five to 10-year plan on an annual basis. This will ensure that the organisation is both strategically and financially prepared to grow sustainably and it can pre-empt and react against any opportunities or threats appropriately. This will involve going through the efficient strategic planning approach as outlined in Exhibit 1.1. It would be necessary to revisit the mission statement, evaluate the last strategic plan’s objectives and targets, undertake an environmental analysis, a position audit and a corporate appraisal, consider the options appraisal and evaluate this. The plan should be put in action by the key directors and senior executives with targets. The targets should be measurable in the form of KPIs.
Marketing strategies
The concept of marketing and the application of marketing strategies to your business is an extremely useful tool kit in order to fine-tune your business offerings. The marketing concept can be defined as follows.
The management process responsible for identifying, anticipating and satisfying customer requirements profitably.1
The tool kit that is used in order to meet this is called the marketing mix of product, price, promotion and place (4 P’s). This is a set of variables an organisation can use to influence a customer’s purchase decision for goods or a service.
• Product: this represents the product or service’s package of benefits, including guarantees, warranties and after sales service.
• Price: the pricing element includes price promotions, discounts and periods of credit, interest free credit and payment terms offered for the goods or services.
• Promotion: the promotional mix or promotional plan is comprised of four subcategories: advertising, personal (or direct) selling, sales promotion and public relations.

The Strategic Corporate Investments Handbook
8
• Place: place is where the product can be purchased from, for example, channels of distri-bution, such as retail outlets and online e-commerce. Typical distribution channels today include the internet, email, shops/branches, post, telephone, catalogues, other distributors and so on.
The primary goal of any marketing strategy is to satisfy the strategic goals of the company, for example, competitive strategy must support the corporate strategy, mission and the goals of the company.
The mission statement and corporate objectives should be reviewed in conjunction with the organisation’s five or 10-year plan.
It would be necessary to audit the external marketing environment by using the PESTL approach. Competitive benchmarking of ‘marketing mix’ practices would need to be under-taken of both your own company and in comparison with your competitors. The company must obtain regular market intelligence, evaluate this and make recommendations. It is recommended that the company formulates and evaluates its own competitive strategy. The strategic marketing process should lead to the production of a detailed action plan. The marketing strategy should be reviewed and feedback obtained periodically. It would be necessary to undertake a regular marketing audit in order to maintain a competitive position in the market.
Product positioning
Indeed there are different ways of fine-tuning a company’s marketing mix. Competitive positioning is about the company’s role in the competitive marketplace. Undifferentiated (or homogenous) positioning is the targeting of an entire market with a single marketing mix (the 4 P’s). Differentiated targeting is the targeting of different market segments and a specific marketing mix for each segment. Concentrated positioning is the targeting of a single market segment only with a single marketing mix, for example, single segment focus.
The product life cycle illustrates the succession of stages that a product goes through in terms of its sales or market share. The market environment in which a product is sold is always changing and, therefore, must be managed as it moves through a succession of different stages. A product or service typically goes through the stages of introduction, growth, maturity and decline. There would need to be different marketing strategies applied at different stages of the product’s life cycle.
Branding means a trade name, symbol or logo synonymous or identifiable to an organ-isation, or its product or service, for example, Adidas and its associated logo. Branding has certain advantages of marketing, such as the ability to support new products and services that are launched, as consumers associate with and know the brand that has strong loyalty and recognition. If a product or service has a strong brand it is possible to sell your products or services at a premium price than less well-branded products. Strong branding can have the benefit of being able to grow the business by franchising or licensing, an example of this is McDonalds. It is often the case that branded products and services have a longer life cycle.
Indeed brands can be used to a company’s advantage in order to increase the value of a company. A line extension strategy may be used in order to launch new sizes or flavours of

Strategy and corporate growth
9
a product under the same brand name. A brand extension strategy can be adopted whereby a new product can be launched using the same brand name.
Market segmentation is the grouping of customers, with each sub-group or segment of customers having a common need, want or value. Each sub-group or segment will be affected by different targeting strategies; they will behave differently and respond differently to vari-able ‘tailored’ marketing mixes. There are certain advantages that can be associated with a market segmentation strategy, such as the ability to match closely features of a product or service to certain customer groupings or niches. Thus, the company may be able to produce a greater level of customer satisfaction. It may be possible that by segmenting the market that the company will be able to create better brand and customer loyalty. A segmenta-tion marketing strategy may lead to the more efficient use of marketing resources such as advertising. However, on the other side of the coin, there are a number of disadvantages and indeed reasons not to engage in a market segmentation strategy. The first reason is that the segment may not be profitable enough to serve. It may be that there is not sufficient promotional media that can economically create consumer awareness. The segment may already be very competitive. Also, there may be circumstances where the company lacks the competencies to deliver the product or service but an acquisition is uneconomic.
Relationship marketing is about devoting marketing resources to the maintenance of the company’s existing customer base, as well as trying to attract new customers. Customer loyalty and retention has become critical to the long-term survival of companies; relationship marketing aims to build excellent relationships with customers in order to retain their loyalty.
Below are a number of management accounting methods that could be used in order to add value to the marketing process. These methods can help to create strategies to improve customer or product profitability in areas such as changing the price of the products, stimu-lating the volume sold, reducing the amount of support that incurs specific customer or product cost. It may help to make the decision to stop selling a certain product or to sell it to a certain customer grouping.
Customer profitability analysis involves relating specific costs to serving customers or groups of customers, so that their relative profitability can be assessed. It would be usual to use a closely correlated driver of the costs for allocation purposes, that is, similar to an activity-based costing approach. Customer profitability analysis focuses on cost reduction by understanding how customers consume different support resources, for example, processing, delivery, sales visits, telephone support and internet support. It allows an organisation to concentrate on the most profitable of its customers.
Direct product profitability analysis is a decision making tool that helps a company by providing a better indication of the profitability of products. The process allocates direct product costs to individual products. It would be usual to use a closely correlated driver of the costs for allocation purposes, that is, similar to an activity-based costing approach. These costs are subtracted from the gross profit to derive direct product profitability for each product. The normal indirect costs attributed to products would be distribution, warehousing and retailing. Direct product profitability would ignore indirect costs such as head office overheads, only product specific fixed (indirect) cost would be analysed.
Distribution channel profitability is about relating specific distribution costs to serving customers or groups of customers, so that their relative profitability can be assessed. Typical

The Strategic Corporate Investments Handbook
10
distribution chain channels today include the internet, email, shops/branches, post, telephone, catalogues, other distributors and so on.
Post-investment financial and performance management
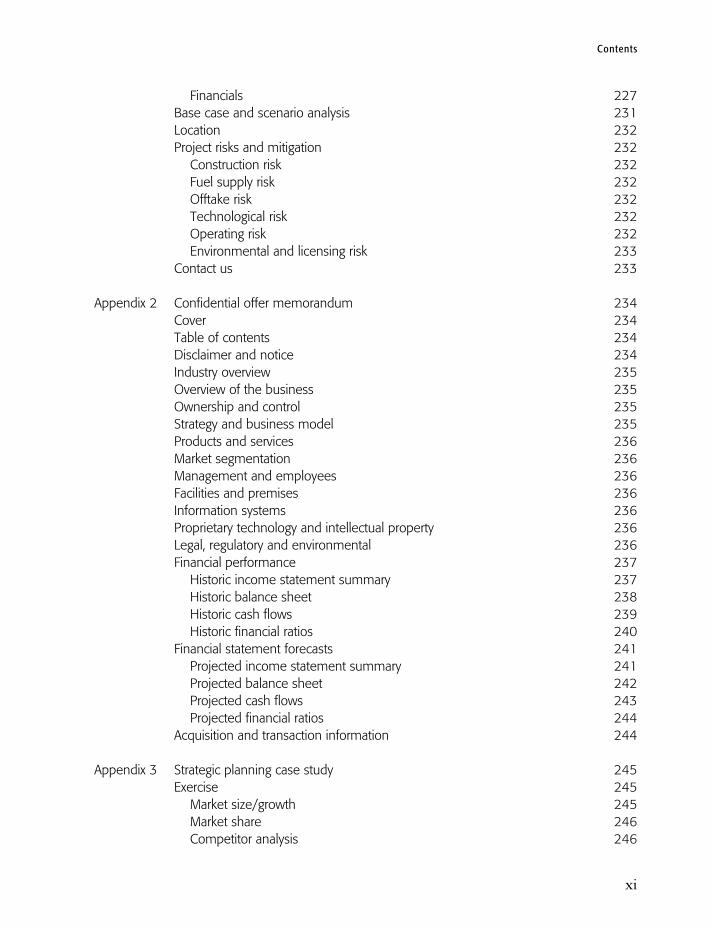
Exhibit 1.2 shows a post-investment financial and performance management process model that seeks to maximise the value of the company invested in along the way of the investment period and throughout the corporate life cycle. Essentially this involves the process of strategic planning, budgeting and target setting, monitoring against the actual performance and the management. We can define strategic planning as the process that sets out where the company is likely to want to go in terms of its strategic vision. This is often defined through the use of a mission statement, which summarises the fundamental purpose of an organisation.
Exhibit 1.2
Post-investment financial and performance management
Strategic plan
Budgets and targets
Actuals Performancemanagement
Source: Author’s own

Strategy and corporate growth
11
Strategic planning also involves the process of looking at the business in terms of its SWOT analysis. A SWOT analysis can help a business to understand how it is positioned relative to its market and competition as discussed above.
Another area in which to attain a competitive advantage is through leading edge budgeting techniques. Budgets and targets can be set by traditional budgeting techniques, such as zero-based budgeting and activity-based costing/management (ABC/M). The purpose of budgeting is to help the organisation to provide a forecast of revenues, expenditures, profit and loss, cash flow and balance sheet over the next accounting year usually on a monthly basis. The budgeting process will seek to set targets on a functional and departmental level that links to the overall financial goals of the company. It is important that the first budget year ties up with the forecast of the company’s deals, financial projections or financial model, which is translated into budgetary terms for the organisation. The financial model should be used for reforecast purposes by the organisation.
It is advantageous for the organisation to promote efficient budgeting approaches that avoid being non-incremental and are more aligned to a zero-based budgeting. This is a method of budgeting in which all expenses must be justified for each budget period. Zero-based budgeting starts from a ‘zero base’ and each department within the company is evaluated for its needs and costs. Budgets are then forecast around what is needed for the forthcoming budget period. It is irrelevant whether the budget is higher or lower than what has been spent historically or allocated as budgets for previous years. The clear advantage is that a very lean and efficient budget is set for the organisation which will obviously help to improve the EBITDA year on year and plan the overall financial position.
A further area to gain a great advantage and improve EBITDA, which we know is a critical target for corporate financial success, is the use of ABC/M techniques.
ABC/M is a management accounting technique that identifies activities in an organisation and assigns the cost of each activity with resources to all products and services according to the actual consumption of the resources. This technique attributes more indirect costs or overheads to the direct costs compared with conventional costing models. Consequently, ABC/M allows an organisation to have the following strategic advantages.
• To allocate more resources on profitable products, departments and activities.• To control the costs at any per product level and on a departmental level.• To find unnecessary costs that may be eliminated.• To set the price of a product or service more strategically and realistically. • To identify the profitability of customers.
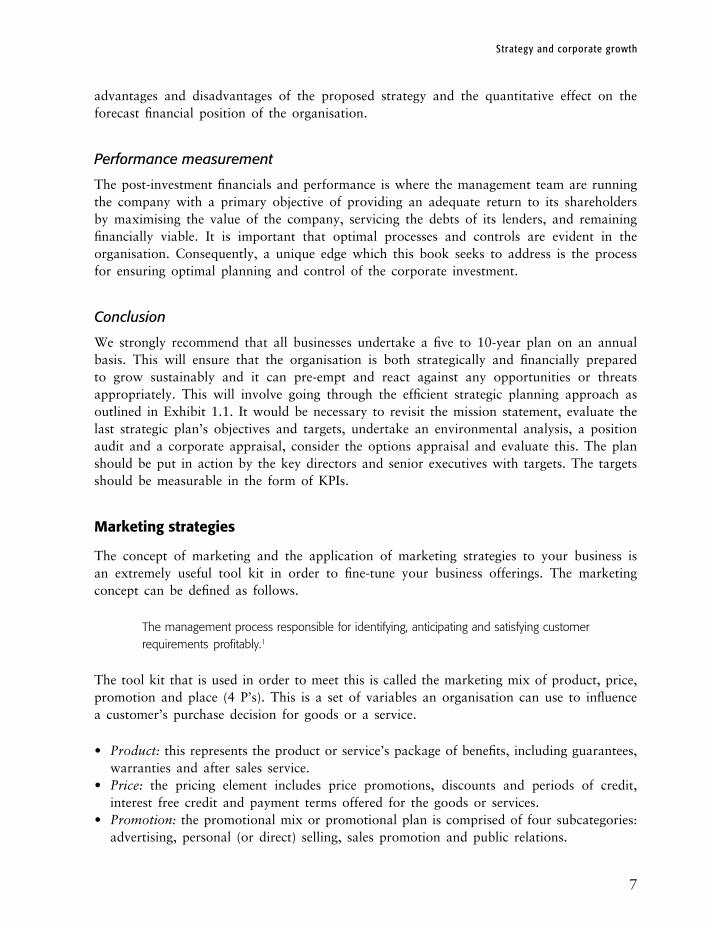
An example of the use of ABC/M can be seen in Exhibit 1.3. This shows the use of activity-based costing techniques for customer profitability purposes. The general process that it adopted is as follows.
• To allocate costs to activity pools.• To compute activity rates.• To measure customer profitability.
Exhibit 1.3
Activity-based costing example
Source: Author’s own
Assumptions - ABC
Company A manufactures and distributes fire alarms to retail outlets
Overhead costs Activity cost
poolActivity
measures
Assembling
unitsNumber of
units
Manufacturing overhead per annum £1,000,000 Processing
ordersNumber of
orders
Selling and administrative overhead per annum £500,000 Supporting customers
Number of customers
Total overhead costs £1,500,000 Other Not applicable
Allocation of overhead to activity cost pool
Assembling
unitsProcessing
ordersSupporting customers Other Total
Manufacturing overhead 60.0% 25.0% 5.0% 10.0% 100.0%
Selling and administrative overhead 15.0% 35.0% 30.0% 20.0% 100.0%
Unit of activityNumber of
unitsNumber of
ordersNumber of customers
Total activity 2,000 350 150
Red Alert – customer
Number of orders placed per annum £006
Number of units (fire alarms) purchased per annum £100
Direct costs of production £250
Selling price of fire alarm £700
1 Allocate costs to activity pools
Assembling units Processing orders Supporting customers Other Total
Manufacturing overhead £600,000 £250,000 0£50,000 £100,000 £1,000,000
Selling & administrative overhead 0£75,000 £175,000 £150,000 £100,000 0£500,000
Total activity £675,000 £425,000 £200,000 £200,000 £1,500,000
2 Compute activity rates
Assembling units Processing orders Supporting customers Other Total
Total cost £675,000 £425,000 £200,000 £200,000 £1,500,000
Unit of activity Number of units Number of orders Number of customers
Total activity 2,000 350 150
Activity rate £338 £1,214 £1,333
Per unit Per order Per customer
Customer profitability Red Alert – customer
Sales £70,000
Direct cost of sales £25,000
Assembling units £33,750
Processing order £7,286
Supporting Customers £1,333
Customer profitability £2,631

Strategy and corporate growth
13
This approach is demonstrated in Exhibit 1.3 for a company that manufactures and distributes fire alarms to retail outlets. There is a requirement to find the profitability of the Red Alert customer. Each activity in the process is allocated an ‘activity cost pool’, that is, assembling units, processing orders and supporting customers. The activity cost pools are then given an activity measure which most closely correlates or drives the cost, that is, the number of units for assembly, the number of orders for processing and the number of customers needing support. These are often called ‘cost drivers’.
The first part of the process is to allocate costs to activity pools. From researching a significant amount of historic data it has been found that a certain percentage of time is attributable to certain tasks that drive the manufacturing, selling and administration overheads. The activities that drive these costs are assembling units, processing orders and supporting customers. The section ‘1 Allocate costs to activity pools’ shows the allocation of overheads to the activity pools. This is simply the allocation of the overhead costs to the activity cost pool by multiplying the percentages.
The next step is to compute the activity rates, that is, the cost per activity unit. This involves calculating the costs of each of the cost drivers or activity pools, that is, assembling units, processing orders or supporting customers. By referencing the next section ‘2 Compute activity rates’, we find the total cost of each activity pool is linked in. The total activity for each pool is also linked in order to compute the activity rate in pounds. In summary, we have activity rates for assembling units of £338 per unit assembled. We have an activity rate of £1,214 per order for the processing of orders. We have an activity rate of £1,333 per customer for support.
The ‘customer profitability’ output shows the calculation of the customer profitability. Sales are equal to the number of units purchased per annum at the selling price per fire alarm. The direct cost of production is equal to the rate per unit at the number of units purchased. The ‘Assembly unit’ cost is equal to the number of orders placed by Red Alert at the activity rate for assembling units. The processing order cost is equal to the number of orders placed by Red Alert at the activity rate for processing orders. The cost of supporting customers is the activity rate per customer. Customer profitability is simply calculated by sales less total costs.
ABC exercise
Using Exhibit 1.3 inflate the overhead costs by 25% and assign the costs to the activity pools, compute the activity rates and derive the customer profitability for the Red Alert customer.
Capital budgeting
The ability for a company to make financially viable incremental business decisions involving large amounts of capital investment is critical and can be managed and controlled through adequate capital budgeting processes and techniques.
The Strategic Corporate Investments Handbook
14
Capital investment appraisal techniques can be used when a company has incremental business opportunities or projects to appraise. Capital investment appraisal typically involves the use of discounted cash flow techniques (DCF) to undertake the financial evaluation of an incremental capital expenditure decision and the benefits and costs associated with that investment opportunity. Capital investment appraisals involve the entire process of plan-ning expenditures whose returns are expected to extend beyond one year. The very obvious examples of capital expenditures are plant and machinery, buildings and land. The less obvious types of investments are research and development projects, advertising and promo-tional campaigns.
Before we start to look at the example of a capital investment appraisal shown in Exhibit 1.4, it is best to consider the main definitions used in capital investment appraisals.
The payback period for a capital investment decision can be either expressed in undis-counted terms or discounted cash flow terms. It is simply the amount of time in years and months that it takes to breakeven in cash flow terms either discounted or undiscounted.
The internal rate of return (IRR) for a capital investment decision can be defined as the discount rate at which the net present value (NPV) of the future stream of net cash flows equal zero. This rate can be linked to the company’s weighted average cost of capital (WACC) for financial evaluation purposes. Therefore, ignoring any qualitative factors if the project’s IRR exceeds the company’s WACC, the project will incrementally add value to the company as a whole.
The NPV for a capital investment decision can be defined as the value of a series of cash flows discounted at the required rate of return to derive a value in today’s money. It accounts for the time value of money in the discounting process, that is, the opportunity cost of the rate of return is considered. Therefore, ignoring any qualitative factors, if the project’s NPV exceeds zero then the project will incrementally add value to the company as a whole.
In Exhibit 1.4, a retail company has raised £300 million of capital which it is now free to invest in a number of retail outlets, that is, buying the properties’ leases of 10 years and opening and running stores in certain areas. The project’s economic life is 10 years and the timeline and period of analysis reflect this.

Strategy and corporate growth
15
Exhibit 1.4
Capital investment appraisal
Cash flow 2011 2012 2013 2014 2015 2016 2017 2018 2019 2020
Capital investment appraisal
Period ending 31 Dec 2011
31 Dec 2012
31 Dec 2013
31 Dec 2014
31 Dec 2015
31 Dec 2016
31 Dec 2017
31 Dec 2018
31 Dec 2019
31 Dec 2020
Forecast – £ million
EBITDA 28.0 28.1 28.1 28.1 28.2 28.2 28.2 28.2 28.2 28.2
Movement in working capital (increase/(decrease) in cash flow) –14.5 –0.1 –0.1 –0.1 –0.1 –0.2 –0.2 –0.2 –0.2 –0.2
Taxes paid 0.0 –5.2 –5.7 –5.8 –5.8 –5.9 –6.0 –6.1 –6.2 –6.3
VAT (paid)/received –3.8 1.9 1.9 1.9 1.9 1.9 1.9 1.9 1.9 1.9
Cash flow from operating activities 9.8 24.6 24.1 24.1 24.1 24.1 23.9 23.8 23.7 23.7
Capital expenditure –84.4 0.0 0.0 0.0 0.0 0.0 0.0 0.0 0.0 0.0
–74.5 24.6 24.1 24.1 24.1 24.1 23.9 23.8 23.7 23.7
Net cash flow –74.5 24.6 24.1 24.1 24.1 24.1 23.9 23.8 23.7 23.7
Summary
Capital investment appraisal
Project results Base case Capital evaluation criteria
Net present value £48.1 >£0
IRR 29.2% >12%
Discounted payback period
Payback year 2016 2014
Payback month 1 1
Payback period
Payback year 2015 2013
Payback month 1 1
NPV/£ invested £0.57 >£1.2
Source: Author’s own
For the purpose of evaluating these incremental projects the finance director of the company in conjunction with the board of directors has formulated some capital investment appraisal criteria as follows.

The Strategic Corporate Investments Handbook
16
A discount rate has been set at 12%, this represents the company’s WACC and effectively the hurdle rate for discounted cash flow (DCF) analysis purposes. The investment appraisal criteria or benchmarks such as NPV, IRR discounted and undiscounted payback years can be seen in the Summary.
Further criteria are made regarding the NPV per pound sterling invested. This is a useful metric when a company has several capital investment appraisals to consider and has raised limited funds for investment. In financial speak we call this capital rationing and the organisa-tion will seek to maximise the NPV per pound sterling of capital invested. This can be used as a ranking mechanism for the allocation of capital subject to other evaluation criteria both quantita-tive and qualitative.
It is because we are looking at cash investments, that the investment appraisal model will not include accounting adjustments, and the key outputs will be based upon cash flow forecasts. However a ‘profit and loss’ extract is included in the profit and loss output. The profit and loss extract is required in order to compute the cash flow timing effects of the working capital in the cash flow output.
Turning our attention to the cash flow we can see that the EBITDA is linked from the profit and loss account. The movement in working capital, taxes paid for both corporation tax and VAT are included in order to derive a cash flow from operating activities. The capital expenditure is also included in order to derive the net cash flow for the project which is pre funding.
First, the NPV is shown, which represents the stream of cash flow over the 10-year period discounted at the 12% discount rate. Excel’s NPV function can assume that the cash flows arise either at the beginning of the period or at the end of the period. In this particular example the cash flows arise at the end of the period. If we wanted to make the assumption that the cash flows arise at the beginning of the period we would simply add a ‘1’ after the cash flow stream in the NPV formula.
Second, the IRR is shown. The calculation simply takes the stream of cash flows over a 10 year period and uses the discount rate as a guess to find the discount rate at which the NPV equals zero. In order to compute the discounted payback period metric the cash flows are discounted using first principles; the cash flow for each year is multiplied by (1(/(1+r)^n)) where r is the discount rate and n is the year number.
The payback period takes the previous period’s negative cumulative cash flow and the next period’s positive cash flow and assumes equal timings of cash flow throughout the year and calculates the months required to breakeven. The payback period is the same as the logic above except that the cash flows are not discounted.
The NPV per pound sterling invested is calculated by taking the NPV and simply dividing by the capital expenditure.
The results show the base case business compared with the qualitative capital evalua-tion criteria.
Capital investment appraisal exercise
Based upon the a stream of net cash flows arising in Exhibit 1.4, please increase each number by 45%, add logic to the cash flow outputs, and increase the capital expenditure. Develop the analysis further so that you calculate the payback, IRR and NPV for capital investment appraisals.

Strategy and corporate growth
17
Other areas of investment appraisal
There are other areas of investment appraisal that are worthy of our attention. We shall discuss these now with reference to relative examples.
Monthly cash flows
An example of the use of monthly cash flow timing can be seen in Exhibit 1.5. Excel’s ‘XNPV’ formula can be used to calculate the NPV by accessing the discount rate, the net cash flows and the monthly dates. Similarly, the IRR is calculated in cell B12, by using Excel’s ‘XIRR’ formula. The net cash flows are accessed and the range of monthly dates, together with a given discount rate.
The example also includes a cross check to prove that our monthly logic is indeed mate-rially correct. We calculate the number of days per month. We can see the discount factor per month is simply the number of days per month divided by 365 days per year. This is shown cumulatively. The cash flows are discounted by making the following calculation.
Net Cash Flow multiplied by 1/(1+Discount Rate) ^ Discount factor cumulative
The sum of the discounted cash flow gives a very minor difference to the Excel formula.
Monthly cash flows exercise
Based upon the figures used in Exhibit 1.5 use Excel and increase the net cash flow by 25% and the project by 20 years at 1% growth per month, then calculate the NPV, IRR using the XNPV and XIRR formulas and also calculate the NPV from first principles as a cross check.
Capital rationing
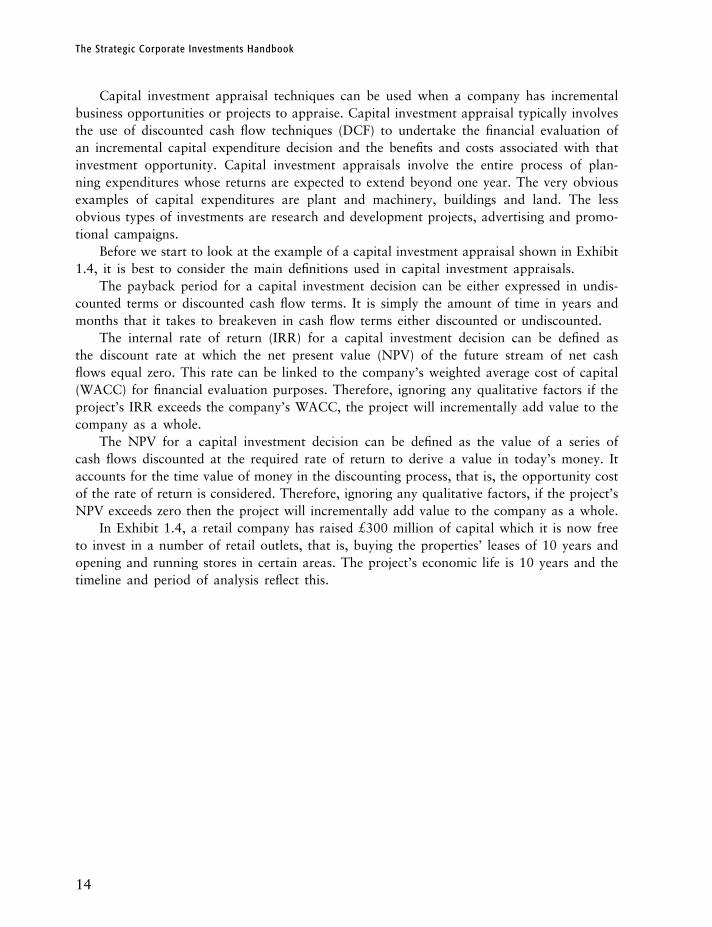
An example of the use of capital rationing can be seen in Exhibit 1.6 and shows a meth-odology for the available project opportunities given that the company has a limit of £6 million to invest. The illustration shows the available project opportunities available from 1 to 10. The project costs, NPV, and the NPV per pound sterling invested is shown. The projects have been shown by relative ranking in terms of the greatest NPV per pound sterling of capital.
Exhibit 1.6 shows the ranking by project which maximises the NPV for the company given its £6 million capital availability. The project costs are allocated on this basis, together with the NPV.
We can see the optimum investment plan is to invest £5.3 million which will give a £3.2 million NPV. It is important to note that the eighth most attractive investment proposal would take us over the £6 million capital limit and is thus not selected.

Exh
ibit
1.5
NP
V m
ont
hly
exam
ple
CASH
FlO
w
Mon
thly
cas
h fl
ows
Per
iod
/mon
th e
nd
ing
31 D
ec 2
010
31 J
an 2
011
28 F
eb 2
011
31 M
ar 2
011
30 A
pr
2011
31 M
ay 2
011
30 J
un
201
1
Fore
cast
- £
mil
lion
Net
cas
h fl
ow
–1
08,0
00.0
48.3
50.7
53.2
55.9
58.7
Net
pre
sen
t va
lue
£19,
441.
2
IRR
14.4
%
Mon
thly
cas
h fl
ows
firs
t p
rin
cip
les
Day
s p
er m
onth
3128
3130
3130
Dis
coun
t fac
tor
per
mon
th
0.08
490.
0767
0.08
490.
0822
0.08
490.
0822
Dis
coun
t fa
ctor
cum
ulat
ive
0.
0849
0.16
160.
2466
0.32
880.
4137
0.49
59
Year
Net
pre
sen
t va
lue
Dis
coun
ted
cash
flow
s£1
9,25
5.0
–106
,965
.547
.449
.351
.353
.355
.5
Chec
k£1
86.2
0.
96%
Sour
ce: A
utho
r’s o
wn
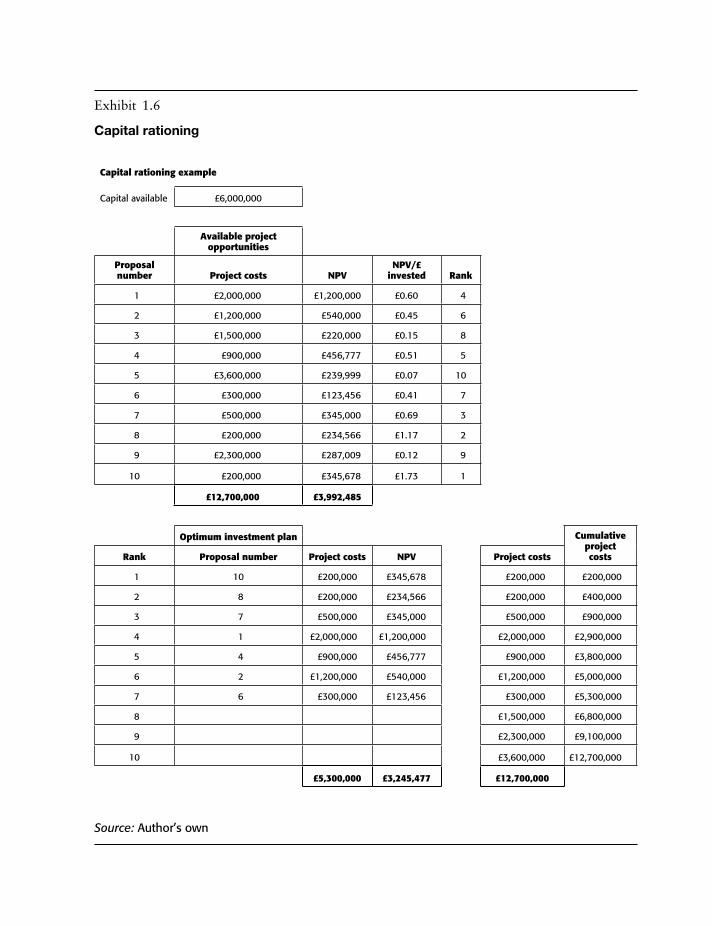
Exhibit 1.6
Capital rationing
Capital rationing example
Capital available £6,000,000
Available project
opportunities
Proposal number Project costs NPV
NPV/£ invested Rank
1 £2,000,000 £1,200,000 £0.60 4
2 £1,200,000 £540,000 £0.45 6
3 £1,500,000 £220,000 £0.15 8
4 £900,000 £456,777 £0.51 5
5 £3,600,000 £239,999 £0.07 10
6 £300,000 £123,456 £0.41 7
7 £500,000 £345,000 £0.69 3
8 £200,000 £234,566 £1.17 2
9 £2,300,000 £287,009 £0.12 9
10 £200,000 £345,678 £1.73 1
£12,700,000 £3,992,485
Optimum investment plan CumulativeprojectcostsRank Proposal number Project costs NPV Project costs
1 10 £200,000 £345,678 £200,000 £200,000
2 8 £200,000 £234,566 £200,000 £400,000
3 7 £500,000 £345,000 £500,000 £900,000
4 1 £2,000,000 £1,200,000 £2,000,000 £2,900,000
5 4 £900,000 £456,777 £900,000 £3,800,000
6 2 £1,200,000 £540,000 £1,200,000 £5,000,000
7 6 £300,000 £123,456 £300,000 £5,300,000
8 £1,500,000 £6,800,000
9 £2,300,000 £9,100,000
10 £3,600,000 £12,700,000
£5,300,000 £3,245,477 £12,700,000
Source: Author’s own

The Strategic Corporate Investments Handbook
20
Capital rationing exercise
Using Exhibit 1.6 add 25% to each NPV and 22% to each project cost for each of the proposal numbers. Please complete the optimum investment plan based upon the available investment opportunities. Please compute the NPV/pound sterling invested and the relative rank, and prepare the optimum investment plan that maximises the company’s NPV.
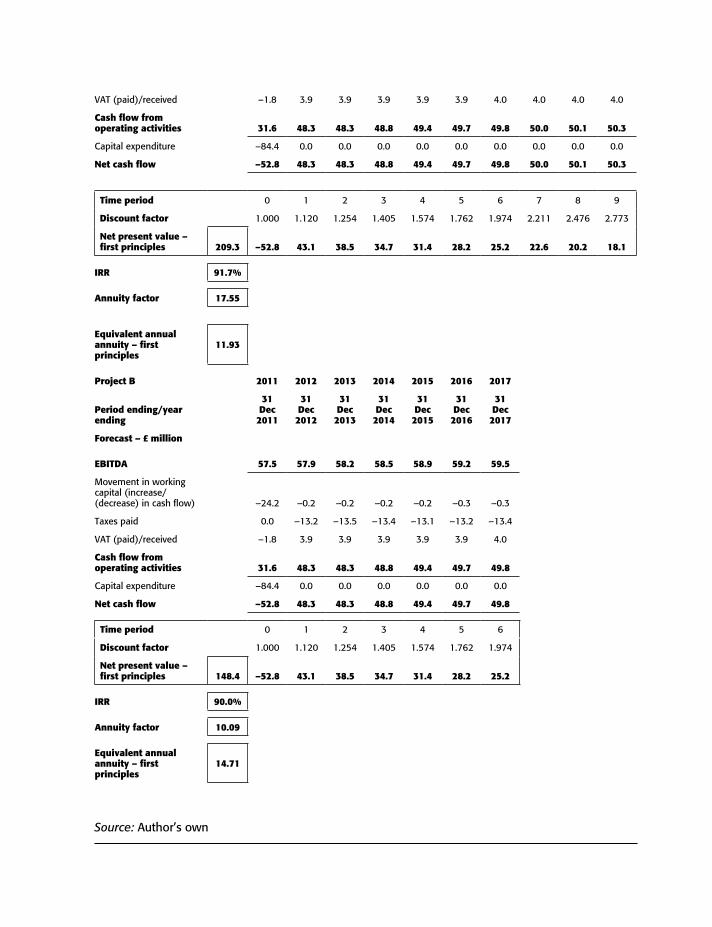
Unequal project lives
An example of the use of unequal project lives can be seen in Exhibit 1.7. Here we show the evaluation technique that outlines comparing two projects with unequal lives. At the top are the discount rates and the relative project lives.
In the summaries ‘Project A’ and ‘Project B’ we can see the net cash flow being discounted in order to arrive at the NPV for each project alternative. The annuity factor is calculated for each project. The different variable being the project life of each. The NPV is divided by the annuity factor in order to find the equivalent annual annuity. Project B has the highest and should therefore be selected. A useful cross check for an annuity factor is the NPV less the annuity which should always equal zero. The annuity factor is calculated as follows.
= (((1+Discount Rate) ^ Project Years)–1)/Discount Rate
The above calculation will allow you take account of the time value money component in order to make a comparison between the two investment proposals.
Exhibit 1.7
Unequal project lives
Discount rate 12.00%
Project A years 10
Project B years 7
Project A 2011 2012 2013 2014 2015 2016 2017 2018 2019 2020
Period ending/ year ending
31 Dec 2011
31 Dec 2012
31 Dec 2013
31 Dec 2014
31 Dec 2015
31 Dec 2016
31 Dec 2017
31 Dec 2018
31 Dec 2019
31 Dec 2020
Forecast – £ million
EBITDA 57.5 57.9 58.2 58.5 58.9 59.2 59.5 59.8 60.1 60.4
Movement in working capital (increase/(decrease) in cash flow) –24.2 –0.2 –0.2 –0.2 –0.2 –0.3 –0.3 –0.3 –0.3 –0.3
Taxes paid 0.0 –13.2 –13.5 –13.4 –13.1 –13.2 –13.4 –13.6 –13.8 –13.9
Continued
VAT (paid)/received –1.8 3.9 3.9 3.9 3.9 3.9 4.0 4.0 4.0 4.0
Cash flow from operating activities 31.6 48.3 48.3 48.8 49.4 49.7 49.8 50.0 50.1 50.3
Capital expenditure –84.4 0.0 0.0 0.0 0.0 0.0 0.0 0.0 0.0 0.0
Net cash flow –52.8 48.3 48.3 48.8 49.4 49.7 49.8 50.0 50.1 50.3
Time period 0 1 2 3 4 5 6 7 8 9
Discount factor 1.000 1.120 1.254 1.405 1.574 1.762 1.974 2.211 2.476 2.773
Net present value – first principles 209.3 –52.8 43.1 38.5 34.7 31.4 28.2 25.2 22.6 20.2 18.1
IRR 91.7%
Annuity factor 17.55
Equivalent annual annuity – first principles
11.93
Project B 2011 2012 2013 2014 2015 2016 2017
Period ending/year ending
31 Dec 2011
31 Dec 2012
31 Dec 2013
31 Dec 2014
31 Dec 2015
31 Dec 2016
31 Dec 2017
Forecast – £ million
EBITDA 57.5 57.9 58.2 58.5 58.9 59.2 59.5
Movement in working capital (increase/(decrease) in cash flow) –24.2 –0.2 –0.2 –0.2 –0.2 –0.3 –0.3
Taxes paid 0.0 –13.2 –13.5 –13.4 –13.1 –13.2 –13.4
VAT (paid)/received –1.8 3.9 3.9 3.9 3.9 3.9 4.0
Cash flow from operating activities 31.6 48.3 48.3 48.8 49.4 49.7 49.8
Capital expenditure –84.4 0.0 0.0 0.0 0.0 0.0 0.0
Net cash flow –52.8 48.3 48.3 48.8 49.4 49.7 49.8
Time period 0 1 2 3 4 5 6
Discount factor 1.000 1.120 1.254 1.405 1.574 1.762 1.974
Net present value – first principles 148.4 –52.8 43.1 38.5 34.7 31.4 28.2 25.2
IRR 90.0%
Annuity factor 10.09
Equivalent annual annuity – first principles
14.71
Source: Author’s own
The Strategic Corporate Investments Handbook
22
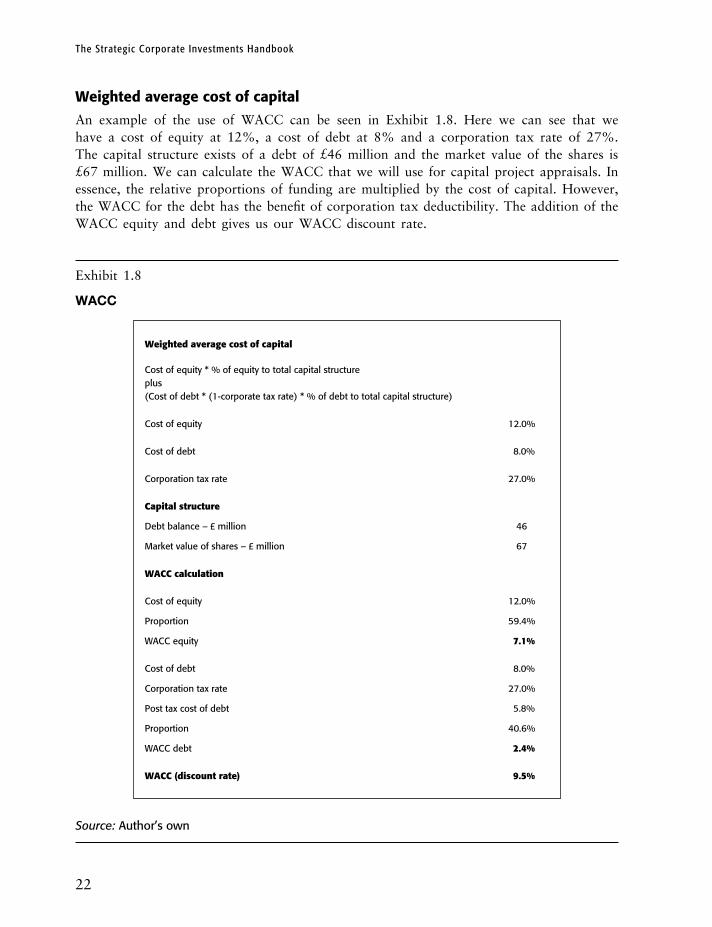
Weighted average cost of capital
An example of the use of WACC can be seen in Exhibit 1.8. Here we can see that we have a cost of equity at 12%, a cost of debt at 8% and a corporation tax rate of 27%. The capital structure exists of a debt of £46 million and the market value of the shares is £67 million. We can calculate the WACC that we will use for capital project appraisals. In essence, the relative proportions of funding are multiplied by the cost of capital. However, the WACC for the debt has the benefit of corporation tax deductibility. The addition of the WACC equity and debt gives us our WACC discount rate.
Exhibit 1.8
WACC
weighted average cost of capital
Cost of equity * % of equity to total capital structureplus(Cost of debt * (1-corporate tax rate) * % of debt to total capital structure)
Cost of equity 12.0%
Cost of debt 8.0%
Corporation tax rate 27.0%
Capital structure
Debt balance – £ million 46
Market value of shares – £ million 67
wACC calculation
Cost of equity 12.0%
Proportion 59.4%
WACC equity 7.1%
Cost of debt 8.0%
Corporation tax rate 27.0%
Post tax cost of debt 5.8%
Proportion 40.6%
WACC debt 2.4%
wACC (discount rate) 9.5%
Source: Author’s own
Strategy and corporate growth
23
WACC exercise
Using Exhibit 1.8 vary the assumptions by 20% and calculate the WACC for equity and WACC for debt leading to the WACC discount rate.
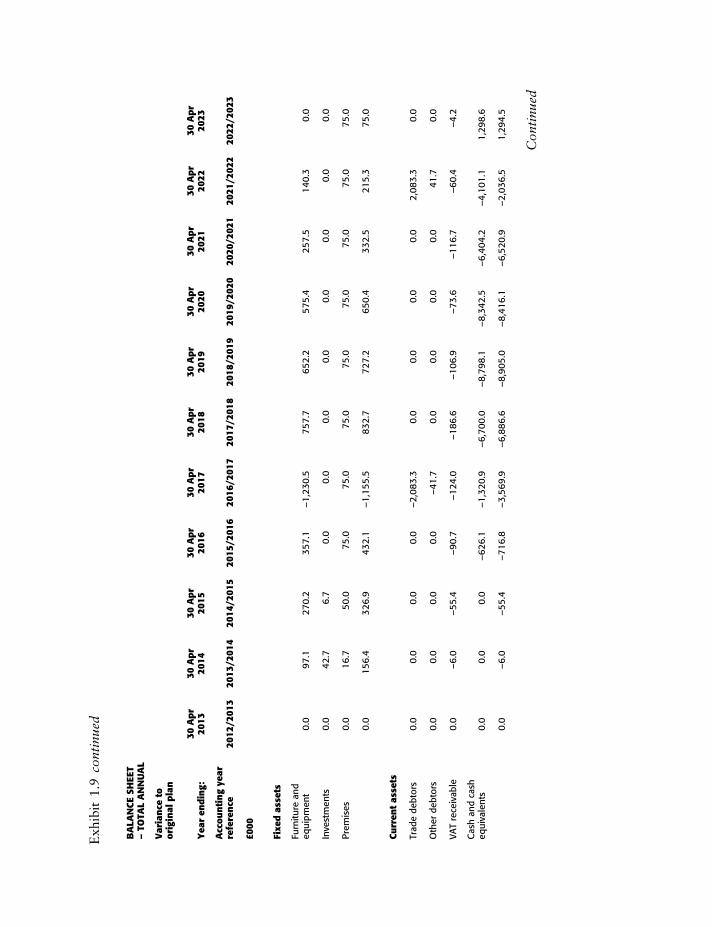
Post-monitoring the corporate investment
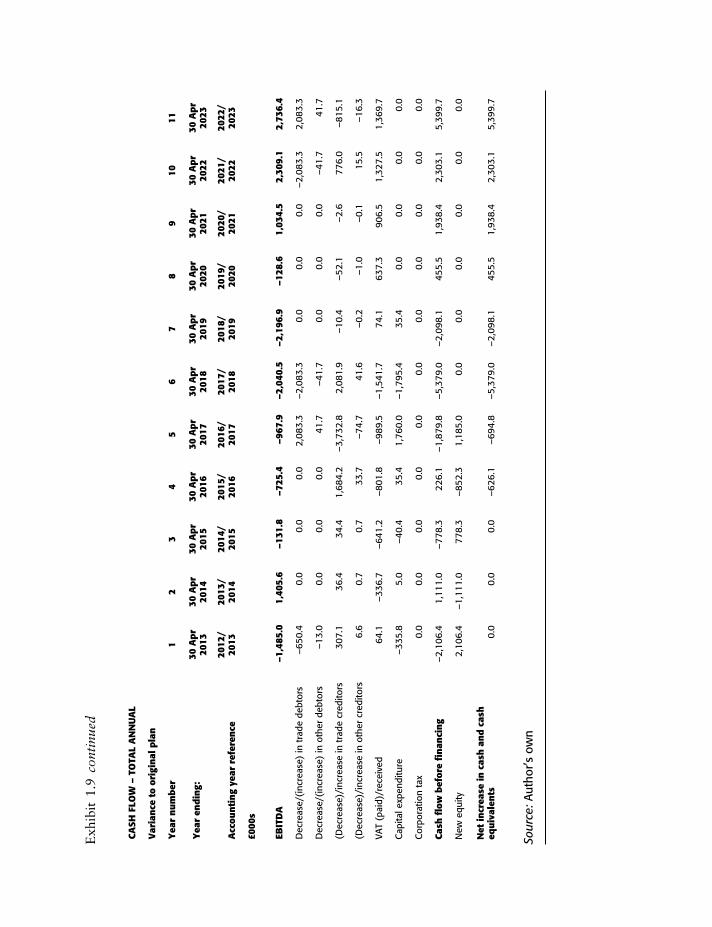
In order to control and post-monitor the investments there is a key issue to address the problem at the highest level first. Consequently, it will be necessary to control the annual total company key financial statements, that is, profit and loss, cash flow and balance sheet. Consequently, if we freeze these outputs as at the close of the transaction and compare the ongoing re-forecast we can undertake variance analysis to this original plan. The re-forecast would comprise the actual to date plus the forecast. The forecast would have similar logic as per the original plan.
It is normally straightforward to make the comparison at such a high level for control purposes. So for the purposes of our post-monitoring we will keep matters at this level and demonstrate an example of the use of post-monitoring in Exhibit 1.9.

PR
OFI
T A
ND
lO
SS A
CCO
uN
T –
TOTA
l A
NN
uA
l
Var
ian
ce t
o or
igin
al p
lan
Yea
r n
um
ber
12
34
56
78
910
Yea
r en
din
g:30
Ap
r 20
1330
Ap
r 20
1430
Ap
r 20
1530
Ap
r 20
1630
Ap
r 20
1730
Ap
r 20
1830
Ap
r 20
1930
Ap
r 20
2030
Ap
r 20
2130
Ap
r 20
22
Acc
oun
tin
g ye
ar
refe
ren
ce20
12/
2013
2013
/ 20
1420
14/
2015
2015
/ 20
1620
16/
2017
2017
/ 20
1820
18/
2019
2019
/ 20
2020
20/
2021
2021
/ 20
22
£000
s
Turn
over
Cor
e m
anag
ed
serv
ice
cont
ract
0.0
–3,9
73.3
–6,6
66.7
–7,5
00.0
–11,
250.
0–1
1,25
0.0
3,33
3.3
6,66
6.7
8,14
0.0
11,2
50.0
Out
of s
cope
–
core
man
aged
se
rvic
e co
ntra
ct0.
00.
00.
00.
00.
00.
00.
00.
00.
00.
0
Oth
er in
com
e0.
0–1
08.4
0.0
0.0
0.0
0.0
0.0
0.0
0.0
0.0
Tota
l tu
rnov
er0.
0–4
,081
.7–6
,666
.7–7
,500
.0–1
1,25
0.0
–11,
250.
03,
333.
36,
666.
78,
140.
011
,250
.0
Turn
over
gro
wth
p
er a
nn
um
0.0
–0.9
0.5
0.1
0.0
0.0
0.1
0.0
0.0
0.0
Dir
ect
man
aged
se
rvic
e co
sts
Staf
f cos
ts0.
0–2
,493
.2–2
,785
.4–3
,162
.1–4
,903
.7–4
,476
.32,
567.
33,
315.
13,
498.
04,
328.
4
Serv
ice
prov
ider
co
sts
–583
.8–1
,872
.3–3
,069
.4–3
,266
.7–4
,883
.3–4
,529
.22,
564.
63,
313.
53,
291.
14,
331.
3
Gen
eral
cos
ts0.
0–1
42.9
0.0
0.0
–30.
060
.00.
00.
011
2.9
0.0
Bad
deb
ts0.
00.
00.
00.
00.
00.
00.
00.
00.
00.
0
Exh
ibit
1.9
Po
st-m
oni
tori
ng o
utso
urci
ng c
om
pan
y
Con
tinu
ed

Amor
tisat
ion
and
depr
ecia
tion
0.0
–112
.7–4
0.8
–88.
1–1
17.3
–140
.370
.176
.894
.711
7.3
Tota
l dir
ect
man
aged
ser
vice
co
sts
–583
.8–4
,621
.1–5
,895
.6–6
,516
.8–9
,934
.4–9
,085
.75,
201.
96,
705.
46,
996.
78,
777.
0
Gro
ss m
argi
n58
3.8
539.
4–7
71.1
–983
.2–1
,315
.6–2
,164
.3–1
,868
.6–3
8.8
1,14
3.3
2,47
3.0
Gro
ss m
argi
n %
13.0
%0.
7%–1
.5%
–0.6
%–0
.3%
–0.5
%–1
.0%
–0.7
%–0
.4%
–0.3
%
Cen
tral
cos
ts
Staf
f cos
ts41
7.2
–595
.9–2
88.8
–121
.4–1
65.8
–101
.80.
00.
00.
00.
0
Con
sulta
ncy
102.
0–8
0.8
–26.
70.
00.
00.
080
.80.
00.
00.
0
Adm
inis
trat
ion
0.0
–81.
0–1
5.0
–12.
0–1
8.0
–6.0
132.
00.
00.
00.
0
Gen
eral
cos
ts0.
0–9
5.9
–37.
30.
00.
00.
035
.30.
00.
00.
0
Insu
ranc
e0.
00.
0–2
70.7
–187
.5–2
81.3
–281
.283
.316
6.7
203.
528
1.3
Bus
ines
s de
velo
pmen
t–2
50.0
–125
.3–4
1.7
–25.
00.
012
5.0
67.0
0.0
0.0
0.0
Fina
nce
cost
s0.
00.
00.
00.
00.
00.
00.
00.
00.
00.
0
Amor
tisat
ion
and
depr
ecia
tion
0.0
–48.
7–8
9.2
–52.
6–5
5.1
–52.
50.
00.
022
3.2
0.0
Tota
l cen
tral
co
sts
269.
2–1
,027
.6–7
69.3
–398
.5–5
20.1
–316
.639
8.4
166.
742
6.7
281.
3
Taxa
tion
0.0
0.0
0.0
0.0
0.0
0.0
0.0
0.0
0.0
0.0
Pro
fit/
(los
s)
314.
61,
567.
0–1
.8–5
84.7
–795
.5–1
,847
.7–2
,267
.0–2
05.4
716.
62,
191.
8
EBIT
DA
314.
61,
405.
6–1
31.8
–725
.4–9
67.9
–2,0
40.5
–2,1
96.9
–128
.61,
034.
52,
309.
1
Con
tinu
ed
Exh
ibit
1.9
con
tinu
ed
BA
lAN
CE S
HEE
T –
TOTA
l A
NN
uA
l
Var
ian
ce t
o or
igin
al p
lan
Yea
r en
din
g:30
Ap
r 20
1330
Ap
r 20
1430
Ap
r 20
1530
Ap
r 20
1630
Ap
r 20
1730
Ap
r 20
1830
Ap
r 20
1930
Ap
r 20
2030
Ap
r 20
2130
Ap
r 20
2230
Ap
r 20
23
Acc
oun
tin
g ye
ar
refe
ren
ce20
12/2
013
2013
/201
420
14/2
015
2015
/201
620
16/2
017
2017
/201
820
18/2
019
2019
/202
020
20/2
021
2021
/202
220
22/2
023
£000
Fixe
d a
sset
s
Furn
iture
and
eq
uipm
ent
0.0
97.1
270.
235
7.1
–1,2
30.5
757.
765
2.2
575.
425
7.5
140.
30.
0
Inve
stm
ents
0.0
42.7
6.7
0.0
0.0
0.0
0.0
0.0
0.0
0.0
0.0
Prem
ises
0.0
16.7
50.0
75.0
75.0
75.0
75.0
75.0
75.0
75.0
75.0
0.
015
6.4
326.
943
2.1
–1,1
55.5
832.
772
7.2
650.
433
2.5
215.
375
.0
Curr
ent
asse
ts
Trad
e de
btor
s0.
00.
00.
00.
0–2
,083
.30.
00.
00.
00.
02,
083.
30.
0
Oth
er d
ebto
rs0.
00.
00.
00.
0–4
1.7
0.0
0.0
0.0
0.0
41.7
0.0
VAT
rece
ivab
le0.
0–6
.0–5
5.4
–90.
7–1
24.0
–186
.6–1
06.9
–73.
6–1
16.7
–60.
4–4
.2
Cas
h an
d ca
sh
equi
vale
nts
0.0
0.0
0.0
–626
.1–1
,320
.9–6
,700
.0–8
,798
.1–8
,342
.5–6
,404
.2–4
,101
.11,
298.
6
0.
0–6
.0–5
5.4
–716
.8–3
,569
.9–6
,886
.6–8
,905
.0–8
,416
.1–6
,520
.9–2
,036
.51,
294.
5
Con
tinu
ed

Cred
itor
s: a
mou
nts
fal
lin
g d
ue
wit
hin
on
e ye
ar
Trad
e pa
yabl
es0.
036
.470
.81,
755.
0–1
,977
.810
4.2
93.8
41.7
39.1
815.
10.
0
Oth
er p
ayab
les
0.0
0.7
1.4
35.1
–39.
62.
11.
90.
80.
816
.30.
0
Cor
pora
tion
tax
paya
ble
0.0
0.0
0.0
0.0
0.0
0.0
0.0
0.0
0.0
0.0
0.0
VAT
paya
ble
0.0
–342
.7–1
,033
.3–1
,870
.3–2
,893
.1–4
,497
.5–4
,343
.8–3
,673
.1–2
,809
.7–1
,425
.90.
0
Shor
t-te
rm
borr
owin
gs0.
00.
00.
00.
00.
00.
00.
00.
00.
00.
00.
0
0.
0–3
05.6
–961
.1–8
0.2
–4,9
10.4
–4,3
91.3
–4,2
48.1
–3,6
30.6
–2,7
69.8
–594
.50.
0
Net
cur
rent
ass
ets
0.0
299.
690
5.7
–636
.61,
340.
5–2
,495
.4–4
,656
.9–4
,785
.5–3
,751
.0–1
,441
.91,
294.
5
Tota
l ass
ets
less
cu
rren
t li
abil
itie
s0.
045
6.0
1,23
2.5
–204
.418
5.0
–1,6
62.6
–3,9
29.6
–4,1
35.1
–3,4
18.5
–1,2
26.7
1,36
9.5
Cred
itor
s:
amou
nts
fal
lin
g d
ue
afte
r on
e ye
ar
Long
-ter
m
borr
owin
gs0.
00.
00.
00.
00.
00.
00.
00.
00.
00.
00.
0
Net
ass
ets
0.0
456.
01,
232.
5–2
04.4
185.
0–1
,662
.6–3
,929
.6–4
,135
.1–3
,418
.5–1
,226
.71,
369.
5
Shar
ehol
der
s’
equ
ity
Shar
e ca
pita
l1,
583.
7–1
,111
.0–3
32.7
–1,1
85.0
0.0
0.0
0.0
0.0
0.0
0.0
0.0
Reta
ined
pro
fit–1
,583
.71,
567.
01,
565.
298
0.5
185.
0–1
,662
.6–3
,929
.6–4
,135
.1–3
,418
.5–1
,226
.71,
369.
5
Tota
l sh
areh
old
ers’
eq
uit
y0.
045
6.0
1,23
2.5
–204
.418
5.0
–1,6
62.6
–3,9
29.6
–4,1
35.1
–3,4
18.5
–1,2
26.7
1,36
9.5
Con
tinu
ed
CASH
FlO
w –
TO
TAl
AN
Nu
Al
Var
ian
ce t
o or
igin
al p
lan
Yea
r n
um
ber
12
34
56
78
910
11
Yea
r en
din
g:30
Ap
r 20
1330
Ap
r 20
1430
Ap
r 20
1530
Ap
r 20
1630
Ap
r 20
1730
Ap
r 20
1830
Ap
r 20
1930
Ap
r 20
2030
Ap
r 20
2130
Ap
r 20
2230
Ap
r 20
23
Acc
oun
tin
g ye
ar r
efer
ence
2012
/ 20
1320
13/
2014
2014
/ 20
1520
15/
2016
2016
/ 20
1720
17/
2018
2018
/ 20
1920
19/
2020
2020
/ 20
2120
21/
2022
2022
/ 20
23
£000
s
EBIT
DA
–1,4
85.0
1,40
5.6
–131
.8–7
25.4
–967
.9–2
,040
.5–2
,196
.9–1
28.6
1,03
4.5
2,30
9.1
2,73
6.4
Dec
reas
e/(i
ncre
ase)
in tr
ade
debt
ors
–650
.40.
00.
00.
02,
083.
3–2
,083
.30.
00.
00.
0–2
,083
.32,
083.
3
Dec
reas
e/(i
ncre
ase)
in o
ther
deb
tors
–13.
00.
00.
00.
041
.7–4
1.7
0.0
0.0
0.0
–41.
741
.7
(Dec
reas
e)/i
ncre
ase
in tr
ade
cred
itors
307.
136
.434
.41,
684.
2–3
,732
.82,
081.
9–1
0.4
–52.
1–2
.677
6.0
–815
.1
(Dec
reas
e)/i
ncre
ase
in o
ther
cre
dito
rs6.
60.
70.
733
.7–7
4.7
41.6
–0.2
–1.0
–0.1
15.5
–16.
3
VAT
(pai
d)/r
ecei
ved
64.1
–336
.7–6
41.2
–801
.8–9
89.5
–1,5
41.7
74.1
637.
390
6.5
1,32
7.5
1,36
9.7
Cap
ital e
xpen
ditu
re–3
35.8
5.0
–40.
435
.41,
760.
0–1
,795
.435
.40.
00.
00.
00.
0
Cor
pora
tion
tax
0.0
0.0
0.0
0.0
0.0
0.0
0.0
0.0
0.0
0.0
0.0
Cash
flow
bef
ore
fin
anci
ng
–2,1
06.4
1,11
1.0
–778
.322
6.1
–1,8
79.8
–5,3
79.0
–2,0
98.1
455.
51,
938.
42,
303.
15,
399.
7
New
equ
ity2,
106.
4–1
,111
.077
8.3
–852
.31,
185.
00.
00.
00.
00.
00.
00.
0
Net
incr
ease
in c
ash
an
d c
ash
eq
uiv
alen
ts0.
00.
00.
0–6
26.1
–694
.8–5
,379
.0–2
,098
.145
5.5
1,93
8.4
2,30
3.1
5,39
9.7
Exh
ibit
1.9
con
tinu
ed
Sour
ce: A
utho
r’s o
wn

Strategy and corporate growth
29
Review and control
After implementing a system for performance measurement, it is required to provide a review and undertake corrective control against the strategic plan. We can achieve this by under-taking regular management reporting against the plan in the form of variance analysis and commentaries for key material variances.
Organic growth versus acquisitive growth
Organic growth is the rate of expansion through a company’s own business activity. Growth is usually measured in terms of assets, turnover and profits. Core competencies are usually exploited in order to assess organic growth.
A good example of a major corporate that has used organic growth well is that of the Apple Corporation. This can be seen by the use of their own internal product development process for the iMac, iPod, iPad and iPhone brands.
Microsoft, on the other hand, has completed over 100 acquisitions since around 1986. It will be very useful for us to now look at the merits of both organic growth and
growth by merger and acquisition (M&A). First, the merits of organic growth are as follows.
• It can allow the corporate to deliver unique value propositions through the use of its own new product development process.
• It can also lead to better brands and the use of the corporate’s own distribution channels to serve its customers.
• In overall terms, organic growth can simply allow a more disciplined and focused growth strategy.
Second, below are the merits of growth by M&A activity.
• M&A activity can help to reduce the competition in the marketplace.• It can instantly add new brands and products and/or service lines to the company.• It can add a new customer base and distribution channel for the company’s existing
products.• New geographic channels may also become available.• It is also possible to assess certain economies of scale thus increasing the acquirer’s
profitability.• The time to realise the benefits of the market and generate profits and revenues can be
significantly reduced.• The acquisition may inject a breath of fresh air bringing new management skills into the
company.
The reader is now likely to be asking the question: ‘So what’s the most financially advanta-geous route to business growth – organic or acquisition?’
In essence, the choice is dependent upon the market or industry scenario as well as the strategic vision of the company. It is indeed advisable to use a constant mix of both methods
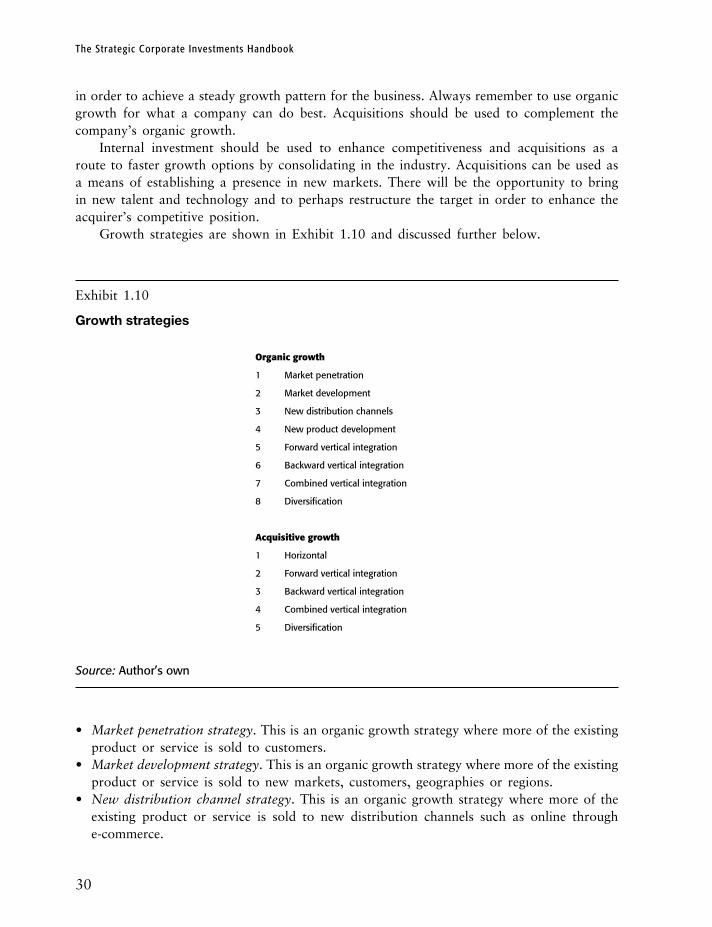
The Strategic Corporate Investments Handbook
30
in order to achieve a steady growth pattern for the business. Always remember to use organic growth for what a company can do best. Acquisitions should be used to complement the company’s organic growth.
Internal investment should be used to enhance competitiveness and acquisitions as a route to faster growth options by consolidating in the industry. Acquisitions can be used as a means of establishing a presence in new markets. There will be the opportunity to bring in new talent and technology and to perhaps restructure the target in order to enhance the acquirer’s competitive position.
Growth strategies are shown in Exhibit 1.10 and discussed further below.
Exhibit 1.10
Growth strategies
Organic growth
1 Market penetration
2 Market development
3 New distribution channels
4 New product development
5 Forward vertical integration
6 Backward vertical integration
7 Combined vertical integration
8 Diversification
Acquisitive growth
1 Horizontal
2 Forward vertical integration
3 Backward vertical integration
4 Combined vertical integration
5 Diversification
Source: Author’s own
• Market penetration strategy. This is an organic growth strategy where more of the existing product or service is sold to customers.
• Market development strategy. This is an organic growth strategy where more of the existing product or service is sold to new markets, customers, geographies or regions.
• New distribution channel strategy. This is an organic growth strategy where more of the existing product or service is sold to new distribution channels such as online through e-commerce.

Strategy and corporate growth
31
• New product development strategy. This is an organic growth strategy where new products are developed for new customers and new markets.
• Forward vertical integration strategy. This is where the company owns the distribution channel or sales outlet. This could be a car manufacturer who owns its showrooms or retail outlets. This can be achieved organically or acquisitively.
• Backward vertical integration strategy. This is where the company owns the source of supply. This could be a company in the energy industry which owns a portfolio of gas-fired power plants and also owns the fuel source, that is, the gas pipelines and the oil fields. This can be achieved organically or acquisitively.
• Combined vertical integration strategy. This is where the company is both forward and backwards integrated. An example of this is the major players in the oil industry, such as Shell and BP. They undertake the exploration and production, drilling and extracting, together with distributing the fuel to their own petrol retail outlets. This can be achieved organically or acquisitively. There are certain strategic benefits that a company can obtain from vertical integration strategies. First, there is more ability to co-ordinate the supply and demand of the products and services. Second, there is an increase in certainty over supply and demand which can lead to better investment decisions. Third, there will be a stronger bargaining position in the market with no dependence upon highly priced suppliers. Fourth, the costs of supply are likely to be lower. The disadvantage of vertical integration strategies is that there is the need to ensure performance through the whole chain as supply is made internally only.
• Acquisitive horizontal growth strategy. This is the process of buying competing businesses. The benefits included increased economies of scale through bulk purchasing and the ability to reduce the amount of central overheads required to support the business.
• Diversification growth strategy. This can be achieved organically or acquisitively.
There are likely to be a number of strategic reasons for acquisition as follows.
• It provides the skills and technology at a faster rate and lower cost than the company could grow organically.
• It can provide the acquirer with the benefit of improving the target company’s performance.• It allows the acquirer the chance to find early successes that can be developed.• It can allow the acquirer to remove any excess capacity upon consolidation.• It can allow the acquirer to access the product lines or distribution channels of the target
company.
It is imperative that the strategic fit of the target to the organisation is viewed as being more important than an attractive acquisition price.
Organic growth
Organic growth strategies are business development techniques that promote corporate growth by increased output and larger sales volume of its existing business or a start-up which requires assembling the management team, planning and promoting the business. The opposite
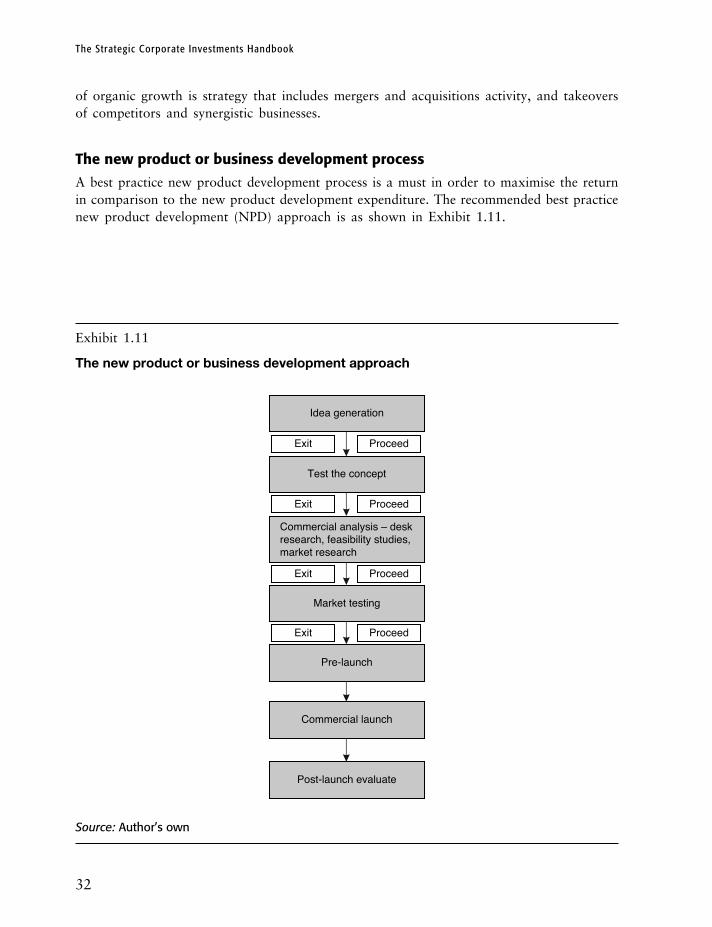
The Strategic Corporate Investments Handbook
32
of organic growth is strategy that includes mergers and acquisitions activity, and takeovers of competitors and synergistic businesses.
The new product or business development process
A best practice new product development process is a must in order to maximise the return in comparison to the new product development expenditure. The recommended best practice new product development (NPD) approach is as shown in Exhibit 1.11.
Exhibit 1.11
The new product or business development approach
Idea generation
Test the concept
Commercial analysis – deskresearch, feasibility studies, market research
Market testing
ProceedExit
Pre-launch
Commercial launch
Post-launch evaluate
ProceedExit
ProceedExit
ProceedExit
Source: Author’s own
Strategy and corporate growth
33
Idea generation
Idea generation will involve the basic internal and external SWOT analysis. The strengths and weaknesses of existing products and service lines should be compared with those of the company’s competitors. External opportunities and threats should be evaluated as necessary. Indeed the company should take a look at the top three competitors’ product/services, what can be improved upon or incorporated into the company’s products or services?
Further sources of new business opportunity can come from new product workshops and brainstorming sessions. The company should have regular team meetings that focus on idea generation. In summary, a corporate should always be open to new ideas that can potentially generate business opportunities.
Test the concept
It is important to point out that the testing of the concept is different from test marketing. Indeed, knowing where the marketing concept will work best is the biggest part of testing the concept. The key question to be asked is: ‘Does the consumer understand, need or even want the product or service?’
Commercial analysis
It is necessary to set a series of metrics or KPIs in order to monitor progress at this stage. The amount of time spent in each stage of the NPD process will help to reduce unnecessary and unrealistic product development time and expenditure. There is a three step process which should be undertaken during the commercial analysis phase which will typically include desk research, feasibility studies and market research. It is important that each project is evaluated at the idea stage in terms of feasibility. Should the idea proceed further? It is necessary to set certain criteria for ideas that could be continued through the NPD process or dropped. The typical type of criteria would be as follows; market size, volumes, price, risks, cash flows, IRR, NPV and payback.
Desk research should typically be the first phase when considering the overall viability of the business proposal. Desk research is also known as secondary research. Desk research, involves the collection, evaluation and analysis of existing sources. Secondary sources of data include market reports, statutory accounts, magazine, journal and newspaper content. The desk research should include aspects such as market size, potential barriers to entry, compe-tiveness of the market and possible competitive advantage. If, based upon the secondary data, there looks to be a commercially viable business or project then it is advisable to proceed to the feasibility study stage.
Feasibility studies are evaluations undertaken to determine and document a project or business’ viability. The objective of such a study would be to identify the SWOT resources required. In summary terms, the identification of the costs and benefits both quantifiable and non-quantifiable. In general, the feasibility study should cover market feasibility, operational feasibility, political feasibility, financial feasibility, economic feasibility, legal feasibility and technical feasibility. Feasibility studies are an ideal first place to start when screening a new
The Strategic Corporate Investments Handbook
34
business concept. There are several areas which need to tick the feasibility box in order for the business to be successful.
One of the first areas that should be assessed for any business venture is its financial viability. This can be defined as the ability to provide satisfactory returns to both the company’s shareholders and its lenders at an acceptable level of risk for the return likely to be received.
If the business venture can be said to be financially viable there are other tests that will need to be applied, for example, technical viability. The first question is: Can the technical offering or delivery model operate as intended? For example, if the business relies upon temporary power generation units can these operate satisfactorily in the requirement setting? Has the supplier or manufacturer of the equipment an established track record with various clients for the technology?
It is indeed important that in order to provide the cash flows, the technical infrastructure is capable of delivering the solution. Where a new technology is involved more technical feasibility needs to be undertaken than for a proven technology.
Political viability is important to assess the political stability of the country where the business or project is to be operated. This is particularly relevant if the government is to be your client.
Legal viability covers how the transparency of the legal and regulatory regime in the country will affect the project’s viability. It is important to note that most commercial ventures involve commercial and financial structures that can be very complex and may require legal enforcement.
So, it is highly recommended that at the preliminary stages a high level feasibility study is undertaken in order to limit the risks and expenditure involved.
Market testing
Testing the new proposed product or service in a test area or market before a total market rollout is likely to limit wasted NPD budgets and prevent any product launch failure or even give insight for fine-tuning of the marketing mix. More specifically, market testing relates to the process of undertaking test marketing in order to simulate or replicate a market rollout of the product or business. It is used to gain feedback or acceptability before rollout to the mass market.
It is extremely important that the profile of the consumers used in the test area region or market are demographically similar to that of the proposal target market. There are a number of important decisions to make before undertaking a test market, such as: Which test market? What are the means of success? How long should the test market be run?
Pre-launch
Here, it is important that the main functions of the business undertake the necessary preparations prior to the launch of the new product. The production or operations func-tion should make plans to produce the new product. The marketing function should make plans to distribute the product. The finance function will provide the finance to launch the new product.

Strategy and corporate growth
35
Commercial launch
At the commercial launch of the product or service it is important that critical areas are monitored. For example: Are consumers purchasing the volumes as estimated? Are the distribution channels fully stocked? Are customer services or technical support monitoring and receiving customer feedback?
Post-launch evaluation
It is necessary to evaluate the efficiency of the new products or services with a view to continuous improvement. The typical type of criteria would be as follows: market size, volumes, price, risks, cash flows, IRR, NPV and payback.
Sales pipeline management
The management of the company’s sales pipeline is likely to be critical to the revenue levels achieved in the coming months or years. If the sales pipeline is well managed then the company will stay in control of its sales performance and ensure an adequate sales level. The main KPIs which will help to control and maximise sales are as follows.
• The deal size (£ million) in your pipeline.• The number of live deals in your pipeline.• The percentage of deals completed, that is, the percentage of customer deals to leads.• The average time a deal stays in the pipeline before win closure, that is, from lead to
customer deal closure.
So if we put things in context, the greater the number of deals that a company has in its pipeline, the greater the size of the deals, the less time that it takes to complete a customer deal the higher the sales performance would be. It would enhance the sales pipeline insight if the corporate could classify its deals into a number of recognised stages that would be appropriate for the business and its sector. If, for example, we look at a professional services company we can identify the following typical stages for its sales pipeline.
• Expression of interest stage.• Meeting stage.• Proposal stage.• Client terms stage.
The KPIs outlined are reported in a matrix by each of the four pipeline stages identified for the business. If the report is produced on a monthly basis representing a monthly rolling sales pipeline status report, the company would have better control and be in the position to take corrective action for pipeline management purposes. Indeed, there would be insight into the sales pipeline process and the chance to see what the sales team could improve upon.
Exhibit 1.12 shows the number of deals in the pipeline and their value. The deals in the pipeline are shown as a certain percentage. The deal close rate for the year is also shown.
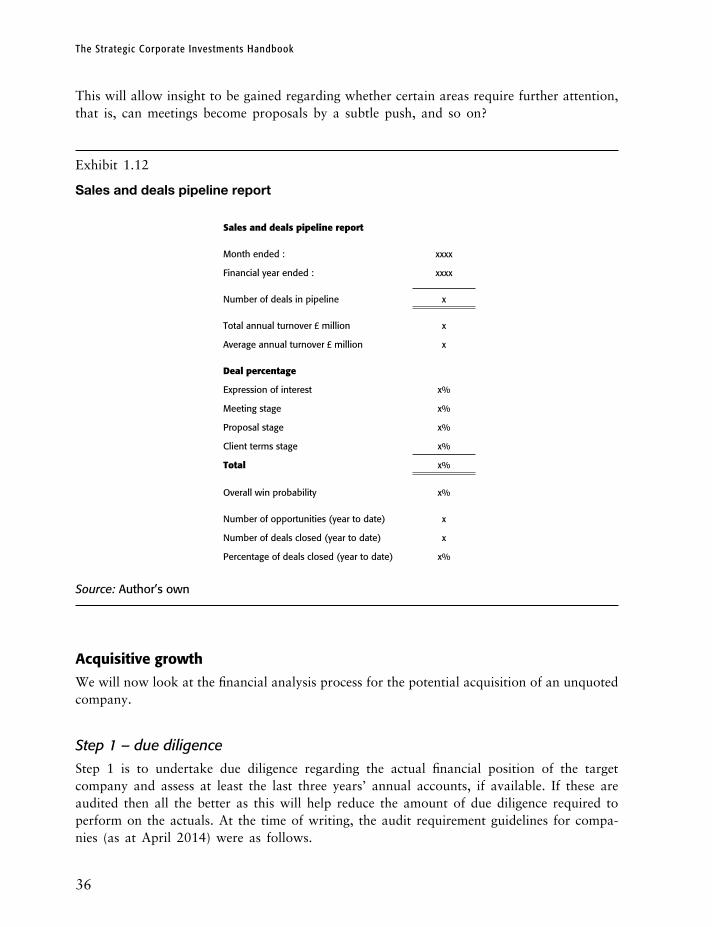
The Strategic Corporate Investments Handbook
36
This will allow insight to be gained regarding whether certain areas require further attention, that is, can meetings become proposals by a subtle push, and so on?
Exhibit 1.12
Sales and deals pipeline report
Sales and deals pipeline report
Month ended : xxxx
Financial year ended : xxxx
Number of deals in pipeline x
Total annual turnover £ million x
Average annual turnover £ million x
Deal percentage
Expression of interest x%
Meeting stage x%
Proposal stage x%
Client terms stage x%
Total x%
Overall win probability x%
Number of opportunities (year to date) x
Number of deals closed (year to date) x
Percentage of deals closed (year to date) x%
Source: Author’s own
Acquisitive growth
We will now look at the financial analysis process for the potential acquisition of an unquoted company.
Step 1 – due diligence
Step 1 is to undertake due diligence regarding the actual financial position of the target company and assess at least the last three years’ annual accounts, if available. If these are audited then all the better as this will help reduce the amount of due diligence required to perform on the actuals. At the time of writing, the audit requirement guidelines for compa-nies (as at April 2014) were as follows.
Strategy and corporate growth
37
• If the company’s financial year ends on or before 30 September 2012, the company may qualify for an audit exemption if it has both: # an annual turnover of no more than £6.5 million; and # assets worth no more than £3.26 million.
• If the company’s financial year ends on or after 1 October 2012, the company may qualify for an audit exemption if it has at least two of the following: # an annual turnover of no more than £6.5 million; # assets worth no more than £3.26 million; or # 50 or fewer employees on average.
There are likely to be audit guidelines for other countries of course. These should always be checked.
This effectively means that those companies that fall outside this scope are subject to an audit – albeit reduced disclosure requirements are needed for medium-sized companies. These companies must satisfy the criteria.
It is advisable to evaluate the degree of non-disclosure in the medium-sized company audited accounts if your acquisition target falls into this category. If the non-disclosed items appear to be areas that are material to your potential acquisition target then it is obviously advisable to undertake further due diligence.
Where we have audited company accounts with no exemptions as at 31 March 2010 there is a need to bridge the gap between two dates in terms of the actuals and undertake the necessary due diligence. Given that the acquisition date is 1 January 2011, we would be required to derive a balance sheet position of 31 December 2010 for inclusion of the target’s opening financials.
Step 2 – acquisition value
Step 2 is to place an acquisition value on the target. Valuing a business is an art and not a science as there are a number of potential valuation techniques or methods at our disposal for us to attempt to place a valuation on the target company. Given that the target is an unquoted company we will demonstrate the following approaches.
Asset-based valuations
Exhibit 1.13 shows an example of an asset-based valuation approach. We can see the target company’s balance sheet at historic cost. However, upon evaluation of the company’s balance sheet we find that the current value of certain balance sheets assets is as follows.
• Fixed assets NBV £11 million.• Accounts receivable £3 million bad debt are expected.• Stock £3.2 million market value is higher.
Based upon the required current values we can recalculate the net assets at current value and thus complete the double entry journal adjustments. Essentially, we have included revaluation journal entries (see Exhibit 1.14). Essentially, we have included revaluation journal entries
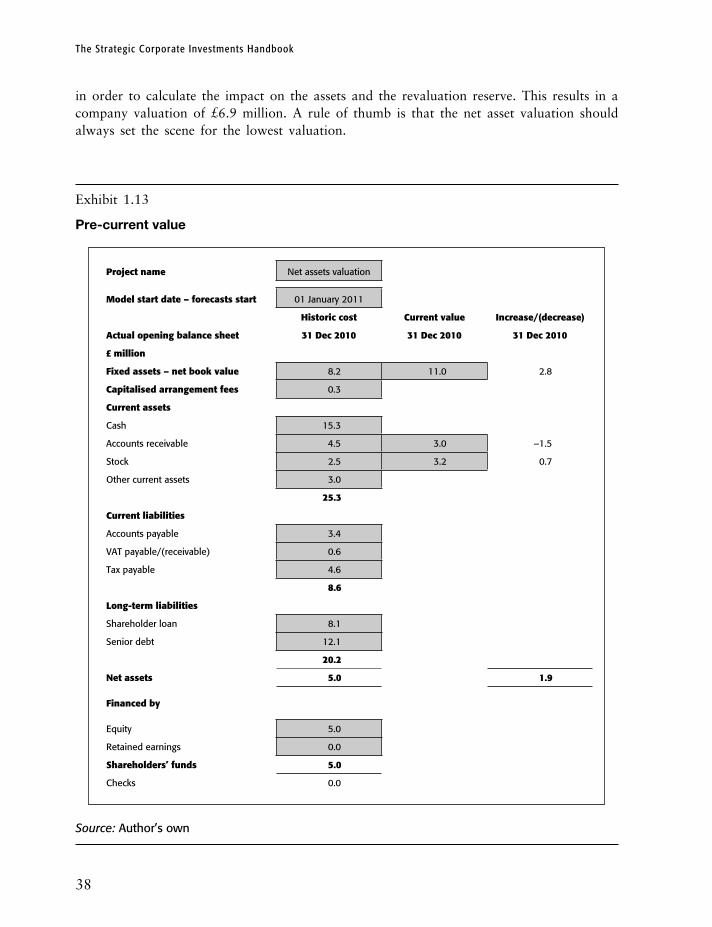
The Strategic Corporate Investments Handbook
38
in order to calculate the impact on the assets and the revaluation reserve. This results in a company valuation of £6.9 million. A rule of thumb is that the net asset valuation should always set the scene for the lowest valuation.
Exhibit 1.13
Pre-current value
Project name Net assets valuation
Model start date – forecasts start 01 January 2011
Historic cost Current value Increase/(decrease)
Actual opening balance sheet 31 Dec 2010 31 Dec 2010 31 Dec 2010
£ million
Fixed assets – net book value 8.2 11.0 2.8
Capitalised arrangement fees 0.3
Current assets
Cash 15.3
Accounts receivable 4.5 3.0 –1.5
Stock 2.5 3.2 0.7
Other current assets 3.0
25.3
Current liabilities
Accounts payable 3.4
VAT payable/(receivable) 0.6
Tax payable 4.6
8.6
long-term liabilities
Shareholder loan 8.1
Senior debt 12.1
20.2
Net assets 5.0 1.9
Financed by
Equity 5.0
Retained earnings 0.0
Shareholders’ funds 5.0
Checks 0.0
Source: Author’s own
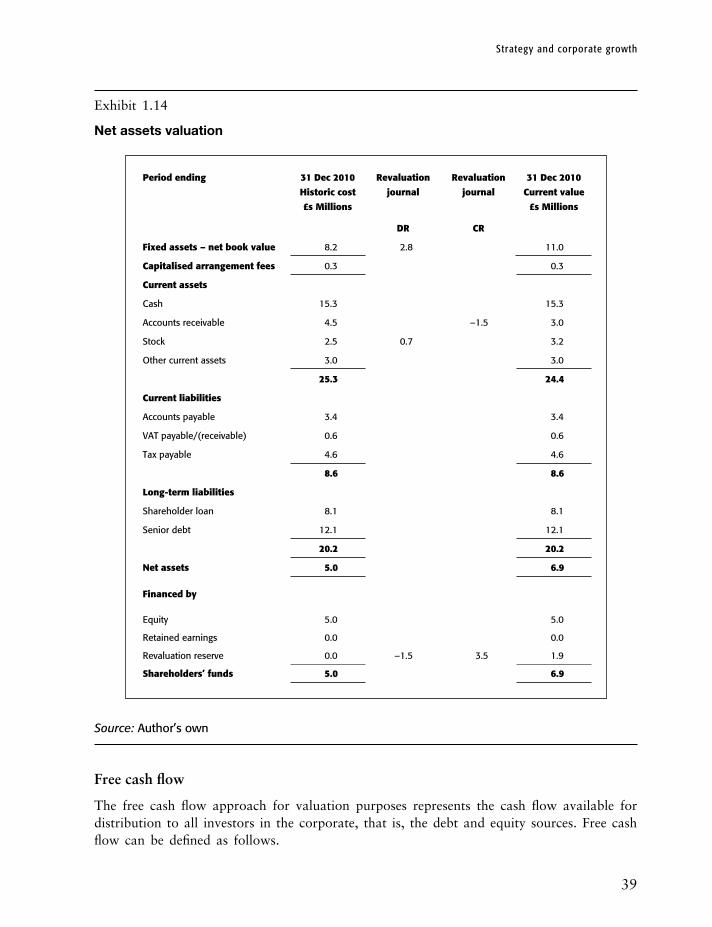
Strategy and corporate growth
39
Exhibit 1.14
Net assets valuation
Period ending 31 Dec 2010
Historic cost
£s Millions
Revaluation
journal
Revaluation
journal
31 Dec 2010
Current value
£s Millions
DR CR
Fixed assets – net book value 8.2 2.8 11.0
Capitalised arrangement fees 0.3 0.3
Current assets
Cash 15.3 15.3
Accounts receivable 4.5 –1.5 3.0
Stock 2.5 0.7 3.2
Other current assets 3.0 3.0
25.3 24.4
Current liabilities
Accounts payable 3.4 3.4
VAT payable/(receivable) 0.6 0.6
Tax payable 4.6 4.6
8.6 8.6
long-term liabilities
Shareholder loan 8.1 8.1
Senior debt 12.1 12.1
20.2 20.2
Net assets 5.0 6.9
Financed by
Equity 5.0 5.0
Retained earnings 0.0 0.0
Revaluation reserve 0.0 –1.5 3.5 1.9
Shareholders’ funds 5.0 6.9
Source: Author’s own
Free cash flow
The free cash flow approach for valuation purposes represents the cash flow available for distribution to all investors in the corporate, that is, the debt and equity sources. Free cash flow can be defined as follows.

The Strategic Corporate Investments Handbook
40
EBITDAplus Depreciation/amortisationplus Change in working capitalless Capital expenditureless Taxation.
Multiples-based approaches
The exit multiple approach assumes that a business will be sold at the end of a certain year in the forecast. The exit multiple used is usually derived by using financial analysis associated with comparable companies. The analysis of comparable companies will help identify the range of multiples that can be applied. The most common basis used is an EBITDA multiple which is based upon enterprise value/EBITDA. The EBITDA multiple is then applied to the EBITDA for the year of exit or sales of the business. A terminal value is usually calculated at the year of exit.
Exhibit 1.15 shows an example of an EBITDA multiple calculation that would typically be made for each comparable company usually from their latest accounts with the view to applying a mean or indeed average of these statistics.
In Exhibit 1.15 we can find the enterprise value of the particular company for the valuation date of 31 December 2010. The market price per ordinary share is £6.78 and there are currently 16.8 million in issue. We can derive the market price of the ordinary shares by simply multiplying these two numbers. The debt and the cash are taken from the balance sheet. Using this calculation basis we derive an enterprise value for the company of £108.6 million.
The EBITDA for the year ending 31 December 2010 is £10 million, therefore, our EBITDA multiple is 10.9.
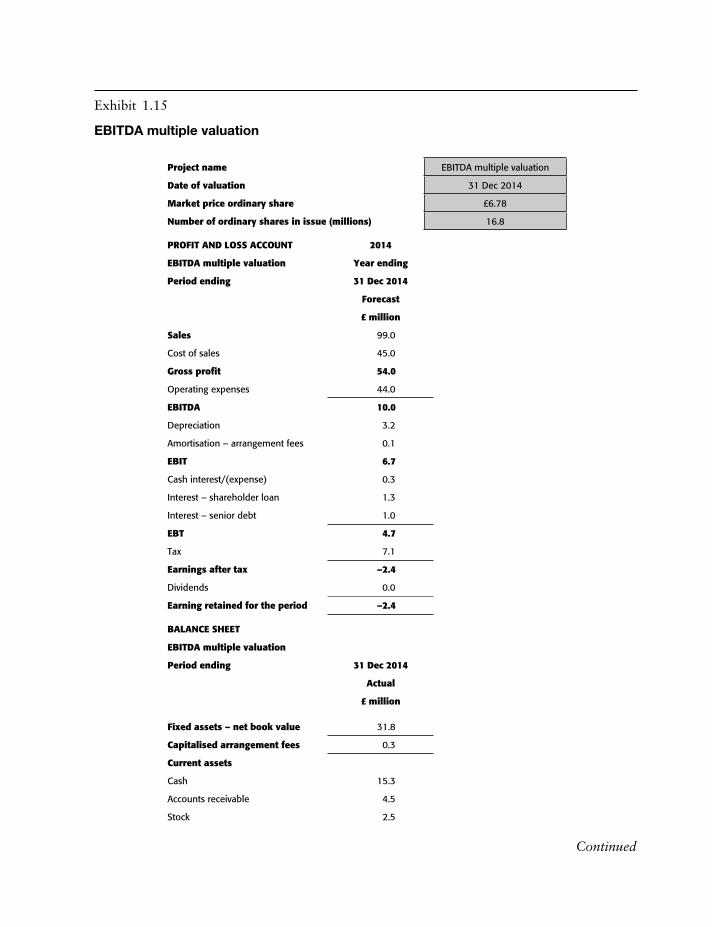
Exhibit 1.15
EBITDA multiple valuation
Project name EBITDA multiple valuation
Date of valuation 31 Dec 2014
Market price ordinary share £6.78
Number of ordinary shares in issue (millions) 16.8
PROFIT AND lOSS ACCOuNT 2014
EBITDA multiple valuation Year ending
Period ending 31 Dec 2014
Forecast
£ million
Sales 99.0
Cost of sales 45.0
Gross profit 54.0
Operating expenses 44.0
EBITDA 10.0
Depreciation 3.2
Amortisation – arrangement fees 0.1
EBIT 6.7
Cash interest/(expense) 0.3
Interest – shareholder loan 1.3
Interest – senior debt 1.0
EBT 4.7
Tax 7.1
Earnings after tax –2.4
Dividends 0.0
Earning retained for the period –2.4
BAlANCE SHEET
EBITDA multiple valuation
Period ending 31 Dec 2014
Actual
£ million
Fixed assets – net book value 31.8
Capitalised arrangement fees 0.3
Current assets
Cash 15.3
Accounts receivable 4.5
Stock 2.5
Continued

The Strategic Corporate Investments Handbook
42
Other current assets 3.0
25.3
Current liabilities
Accounts payable 3.4
VAT payable/(receivable) 0.6
Tax payable 4.6
8.6
long-term liabilities
Senior debt 10.0
10.0
Net assets 38.8
Financed by
Equity 16.8
Retained earnings 22.0
Shareholders’ funds 38.8
SuMMARY
EBITDA multiple valuation
Date of valuation 31 Dec 2014
Ordinary shares at market value £113.9
add Debt £10.0
less Cash –£15.3
Enterprise value £108.6
EBITDA 10.0
EBITDA multiple 10.9
Source: Author’s own
Terminal value
A terminal value approach is the present value based upon a point in time of all future cash flows at a growth rate into the future. There are two main methods of the terminal value calculations: the EBITDA multiple approach and the perpetuity growth approach.
The calculation for a perpetuity based terminal value is as follows.
FCF Final Year / (Discount Rate – Growth Rate)
Exhibit 1.15 continued
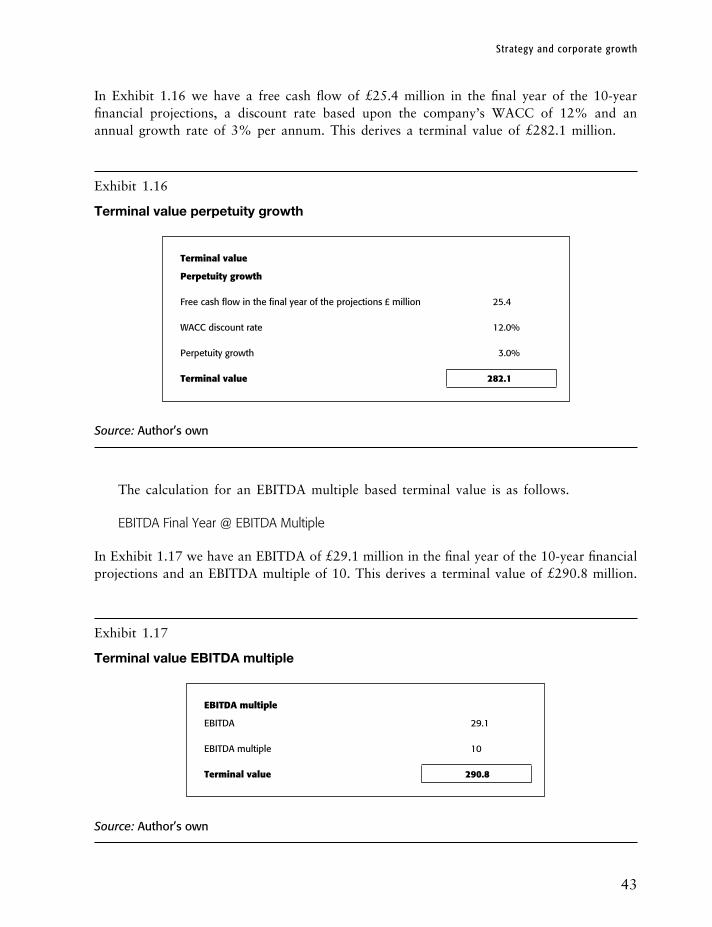
Strategy and corporate growth
43
In Exhibit 1.16 we have a free cash flow of £25.4 million in the final year of the 10-year financial projections, a discount rate based upon the company’s WACC of 12% and an annual growth rate of 3% per annum. This derives a terminal value of £282.1 million.
Exhibit 1.16
Terminal value perpetuity growth
Terminal value
Perpetuity growth
Free cash flow in the final year of the projections £ million 25.4
WACC discount rate 12.0%
Perpetuity growth 3.0%
Terminal value 282.1
Source: Author’s own
The calculation for an EBITDA multiple based terminal value is as follows.
EBITDA Final Year @ EBITDA Multiple
In Exhibit 1.17 we have an EBITDA of £29.1 million in the final year of the 10-year financial projections and an EBITDA multiple of 10. This derives a terminal value of £290.8 million.
Exhibit 1.17
Terminal value EBITDA multiple
EBITDA multiple
EBITDA 29.1
EBITDA multiple 10
Terminal value 290.8
Source: Author’s own

The Strategic Corporate Investments Handbook
44
So the question which would spring to mind now is: what are the respective limitations of the two alternative approaches? Put simply, both bases have a limitation associated with constant growth. In terms of popularity, in the real world, the EBITDA multiple is far more widely adopted by practitioners.
Enterprise value
Enterprise value is a valuation measure that reflects the market value of the whole business. Enterprise value is normally valued at market values and can be defined as follows.
Ordinary shares (equity) at market valueadd Debt at market valueadd Preferences shares at market valueless Cash.
In Exhibit 1.18 we are required to find the enterprise value of the particular company for the valuation date of 31 December 2010. The market price per ordinary share is £4.67 and there are currently 16.8 million in issue. We can derive the market price of the ordinary shares by simply multiplying these two numbers. The debt and the cash are taken from the balance sheet. Using this calculation basis we derive an enterprise value for the company of £83.4 million.
Exhibit 1.18
Enterprise value
Project name Enterprise value
Date of valuation 31 Dec 2014
Market price ordinary share £4.67
Number of ordinary shares in issue (million) 16.8
Date of valuation 31 December 2014
Ordinary shares at market value £78.5
add Debt £20.2
less Cash –£15.3
Enterprise value £83.4
Source: Author’s own

Strategy and corporate growth
45
Step 3 – acquirer actuals and projections
Step 3 is to prepare the acquirer actuals and projections. The acquiring company is required to provide its projections annually over the 10-year period. This will be the acquirers’ financial position assuming that the company continues as it is without acquiring the target company.
Step 4 – combined actuals and projections
Step 4 is to prepare the combined company actuals and projections. The combined company position will be projected accordingly over the 10-year period. The combined plan will include the quantifiable synergies, the goodwill accounting treatment and the acquisition funding.
The valuation techniques for a quoted company will differ because shares are being purchased and sold in the target company. Consequently in addition to the valuation methods outlined in Step 2 relating to the valuation of a private company target, we can also outline the following techniques.
Price earnings ratio approaches
The price earnings (PE) ratio approach uses the relationship between earnings and the market price per share to value the company. This is a stock market ratio which is used as a measure of growth prospects for a company’s shares. The price earnings ratio is defined as follows.
Market Price per Share / Earnings per Share
Dividend models
The dividend model is a financial model that values shares in a company which considers the present value of the company’s dividend cash flow stream. Consequently, discounted cash flow techniques are used accordingly.
The dividend streams are likely to be based upon financial forecasts produced by a financial model. There would be a terminal value calculated from the last date of the fore-cast period accordingly.
For the example in Exhibit 1.19 we are using a WACC discount rate of 12% to discount the 10-year dividend cash flow stream included in the cash flow forecast of our financial model. Given the NPV that is derived we can then add our terminal value calculation to derive our final dividend model valuation £350 million. The terminal value selected for this purpose is based upon an EBITDA multiple basis. Consequently, based upon an EBITDA of £29.1 million and a multiple of 10 we derive a terminal value of £290.8 million. The NPV of the dividend streams is £59.2 million. The dividend stream plus terminal value results in a valuation of £350 million.

The Strategic Corporate Investments Handbook
46
Exhibit 1.19
Dividend model valuation
Dividend model valuation
Perpetuity growth
Free cash flow in the final year of the projections £ million 25.4
WACC discount rate 12.0%
Perpetuity growth 3.0%
Terminal value £ million 282.1
EBITDA multiple
EBITDA £ million 29.1
EBITDA multiple 10
Terminal value £ million 290.8
NPV of dividend stream £ million 59.2
Dividend model valuation £ million 350.0
Source: Author’s own
Company acquisitions exercise
Based upon the financial model built to date add the various valuation methods assuming that you are dealing with a publicly quoted target. Finance the acquisition as 50% debt and 50% equity. Ensure that you compute the credit ratios and stock market ratios as appropriate.
Company mergers
At a high level, a merger happens when two companies agree to combine and operate as a single new company rather than remain separately owned entities and operations. Such a business combination is often referred to as a merger of equals and the companies can often be of similar size. A business combination of equal companies will be called a merger when the Chairman or the board of the two companies agree that the merger will be of mutual benefit. Mergers can be few and far between as often one party is likely to have a stronger position than the other. However, let us consider the strategic and financial benefits of a possible merger.

Strategy and corporate growth
47
• The two companies may benefit from a reduction in surplus capacity in their particular industry thus leading to a lower combined cost base.
• The resulting merger may increase market power, that is, more distribution outlets and so on.
• There may be synergistic benefit whereby the sum of the combined entities may well be greate than the sum of the separate entities, that is, 2+2=5.
• Economies of scale may be experienced through the ability to negotiate better supplier contracts due to higher business volumes and so on.
Let us now turn to Exhibit 1.20. The assumptions can be identified in the General Inputs sheet and the company’s financial position is shown in the Summary sheet. The model layout and design is similar to our convention for financial model builds outlined earlier in this book. Exhibit 1.20 shows the position of Company A prior to the merger with Company B.
We can see from the results in Exhibit 1.20 that Company A has a sufficiently stable position in terms of its cash position and its credit ratios for its lenders are within acceptable target levels. Certain stock market statistics are calculated which will later be benchmarked against the combined company position. These include earnings per share (EPS), market price per share and dividend per share.
Exhibit 1.20
Company A prior to a merger
Company cash position
£ million
Min balance 0.0
Year of min balance 31 Dec 2011
Max balance 51.2
Year of max balance 31 Dec 2020
lenders credit ratios Min Target Year of min/max Average
ok Target max
Debt to equity ratio – max 20.3% 80.0% 31 Dec 2011 11.8%
ok Target max
Free cash flow to debt – min 263.7% 60.0% 31 Dec 2011 1540.3%
ok Target max
Debt to EBITDA – max 20.3% 60.00% 31 Dec 2011 8.4%
ok Target max
Debt to net assets – max 23.1% 90.00% 31 Dec 2012 13.2%
ok Target min
Interest cover – min 102.3 2.0 31 Dec 2012 211.3
Continued

The Strategic Corporate Investments Handbook
48
Stock market ratios
Earnings per
share PE ratio Market price per share
31 Dec 2010 £15.78
31 Dec 2011 £3.01 6.5 £19.55
31 Dec 2012 £3.05 6.5 £19.83
31 Dec 2013 £3.12 6.5 £20.28
31 Dec 2014 £3.20 6.5 £20.80
31 Dec 2015 £3.25 6.5 £21.10
31 Dec 2016 £3.28 6.5 £21.33
31 Dec 2017 £3.32 6.5 £21.56
31 Dec 2018 £3.35 6.5 £21.79
31 Dec 2019 £3.39 6.5 £22.03
31 Dec 2020 £3.42 6.5 £22.26
Stock market ratios
Free cash flow
per share Dividend per share
31 Dec 2011 £1.93 £3.13
31 Dec 2012 £3.83 £3.69
31 Dec 2013 £3.89 £3.13
31 Dec 2014 £3.97 £3.20
31 Dec 2015 £4.05 £3.25
31 Dec 2016 £4.09 £3.28
31 Dec 2017 £4.12 £3.32
31 Dec 2018 £4.15 £3.35
31 Dec 2019 £4.19 –0.5 £3.39
31 Dec 2020 £4.22 £3.42
Source: Author’s own
Exhibit 1.21 shows the current financial position and projections of Company B pre-merger. The assumptions can be identified in the General Inputs sheet and the company’s financial position is shown in the Summary sheet. The model layout and design is similar to our convention for financial model builds outlined earlier in this book. Exhibit 1.21 shows the position of Company B prior to the merger with Company A.
We can see from the results in Exhibit 1.21 that Company B has a sufficiently stable position in terms of its cash position, its credit ratios for its lenders are within acceptable target levels. Certain stock market statistics are calculated which will later be benchmarked against the combined company position. These include EPS, market price per share and dividend per share.
Exhibit 1.20 continued
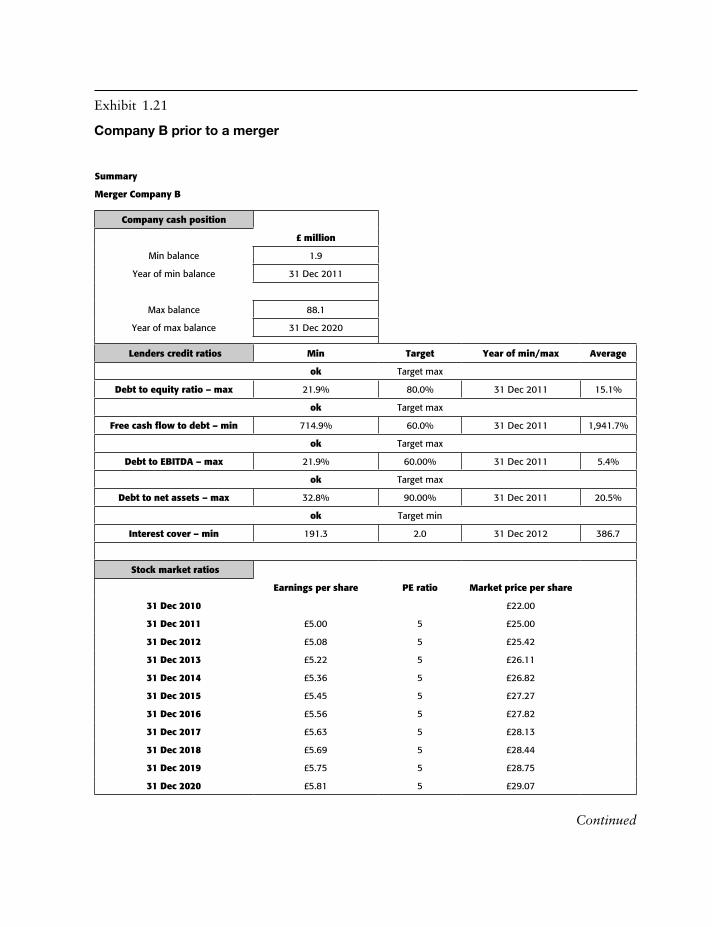
Exhibit 1.21
Company B prior to a merger
Summary
Merger Company B
Company cash position
£ million
Min balance 1.9
Year of min balance 31 Dec 2011
Max balance 88.1
Year of max balance 31 Dec 2020
lenders credit ratios Min Target Year of min/max Average
ok Target max
Debt to equity ratio – max 21.9% 80.0% 31 Dec 2011 15.1%
ok Target max
Free cash flow to debt – min 714.9% 60.0% 31 Dec 2011 1,941.7%
ok Target max
Debt to EBITDA – max 21.9% 60.00% 31 Dec 2011 5.4%
ok Target max
Debt to net assets – max 32.8% 90.00% 31 Dec 2011 20.5%
ok Target min
Interest cover – min 191.3 2.0 31 Dec 2012 386.7
Stock market ratios
Earnings per share PE ratio Market price per share
31 Dec 2010 £22.00
31 Dec 2011 £5.00 5 £25.00
31 Dec 2012 £5.08 5 £25.42
31 Dec 2013 £5.22 5 £26.11
31 Dec 2014 £5.36 5 £26.82
31 Dec 2015 £5.45 5 £27.27
31 Dec 2016 £5.56 5 £27.82
31 Dec 2017 £5.63 5 £28.13
31 Dec 2018 £5.69 5 £28.44
31 Dec 2019 £5.75 5 £28.75
31 Dec 2020 £5.81 5 £29.07
Continued

The Strategic Corporate Investments Handbook
50
Stock market ratios
Free cash flow per share Dividend per share
31 Dec 2011 £4.56 £5.86
31 Dec 2012 £5.98 £5.08
31 Dec 2013 £6.11 £5.22
31 Dec 2014 £6.23 £5.36
31 Dec 2015 £6.36 £5.45
31 Dec 2016 £6.43 £5.56
31 Dec 2017 £6.48 £5.63
31 Dec 2018 £6.55 £5.69
31 Dec 2019 £6.61 £5.75
31 Dec 2020 £6.68 £5.81
Source: Author’s own
The merged company’s financial projections are shown in Exhibit 1.22, this reflects the increased sales growth, increased margins or reduced cost of sales and the reduced central overheads. Here the financial results of the two companies are consolidated with the excep-tion of the dividends that are now made at the consolidated plc level as opposed to the subsidiary level. We have assumed a 50% dividend payout ratio in each year. As there are no corporation tax losses arising, tax is computed at the subsidiary level. It is important to note that there are often financial benefits that occur if one company has a tax loss position and the other has large taxable profits in terms of group relief for corporation tax purposes. The base results arising from the merger can be seen in Exhibit 1.22.
Exhibit 1.22
Merged company projections
Summary
Merged company projections
Company cash position
£ million
Min balance 3.3
Year of min balance 31 Dec 2010
Max balance 405.0
Year of max balance 31 Dec 2020
Exhibit 1.21 continued
Continued

lenders credit ratios Min Target Year of min/max Average
ok Target max
Debt to equity ratio – max 21.2% 80.0% 31 Dec 2011 9.1%
ok Target max
Free cash flow to debt – min 838.7% 60.0% 31 Dec 2011 7,111.4%
ok Target max
Debt to EBITDA – max 21.2% 60.00% 31 Dec 2011 3.0%
ok Target max
Debt to net assets – max 11.9% 90.00% 31 Dec 2011 3.7%
ok Target min
Interest cover – min 222.8 2.0 31 Dec 2012 1,023.4
Stock market ratios
Earnings per share PE ratio Market price per share
31 Dec 2010
31 Dec 2011 £5.95 6 £35.70
31 Dec 2012 £6.30 6 £37.81
31 Dec 2013 £6.70 6 £40.23
31 Dec 2014 £7.13 6 £42.79
31 Dec 2015 £7.50 6 £45.02
31 Dec 2016 £7.89 6 £47.33
31 Dec 2017 £8.26 6 £49.54
31 Dec 2018 £8.64 6 £51.83
31 Dec 2019 £9.03 6 £54.20
31 Dec 2020 £9.44 6 £56.66
Stock market ratios
Free cash flow per share Dividend per share
31 Dec 2011 £5.68 £3.39
31 Dec 2012 £7.34 £4.84
31 Dec 2013 £7.74 £5.77
31 Dec 2014 £8.17 £6.45
31 Dec 2015 £8.62 £6.98
31 Dec 2016 £9.01 £7.43
31 Dec 2017 £9.39 £7.85
31 Dec 2018 £9.79 £8.24
31 Dec 2019 £10.21 £8.64
31 Dec 2020 £10.64 £9.04
Source: Author’s own

The Strategic Corporate Investments Handbook
52
We can see from the results in Exhibit 1.22 that the combined company has a sufficiently stable position in terms of its cash position and its credit ratios for its lenders are within acceptable target levels.
In summary, based upon the assumptions, the earnings per share per annum is greater than each of the separate companies. The market price per share is also greater than each of the separate companies. The market price per share is based upon a PE ratio that is between the current values of each company separately.
Accordingly, it is highly recommended that sensitivity analysis and scenario planning is undertaken around the key variables that affect the key output metrics for a merger.
The real acid test is whether the combined company can deliver upon such a combined projection and may recommend that the first year of the plan is given as a budgetary target and for the first year of integration and performance to be measured against this.
Joint ventures
A joint venture is a business arrangement whereby two or more parties agree to work together to undertake a certain opportunity or project. Often each party will contribute an agreed amount of equity. The parties to the joint venture are responsible for the profits and losses arising from the venture often through a specifically incorporated vehicle such as a limited company.
The advantage of a joint venture is the ability to combine capital and complementary know-how.
The difficulty or disadvantage is often how the rewards should be split between the venture parties. Other disadvantages include the cultural fit between the parties and the potential for any lack of communication that may arise.
An example of a joint venture could be where there is a private public partnership contract for the build own and operation of a university campus and buildings. Here, Company A specialising in construction would build the required facilities. Company B specialising in facilities management would undertake the operational facilities management. Both Company A and Company B would contribute 50% of the equity capital each. Clearly either party would not be able to undertake the contract without the other party’s expertise. There may also be capital constraints facing each party and the equity contribution of the alternative party may be beneficial.
However, it is very important to undertake the correct type of strategic evaluation before entering into a joint venture relationship and indeed an agreement. The starting point is to evaluate both or all of each company’s corporate strategies in order to evaluate the degree of synergy for the joint venture. It is necessary to assess the suitability of each party to undertake their respective roles.
Diversification
Diversification can be defined as a corporate strategy which increases business gained from new markets or products or service lines. It is necessary to invest in non-core business activi-ties which are unrelated to the existing business activities of the organisation.

Strategy and corporate growth
53
Why would an organisation look to undertake a diversification strategy? First, diversi-fication may represent a growth opportunity for the management of the company, that is, new markets and new products may be necessary in order to grow the company as currently there is very little opportunity for growth given the company’s current markets and prod-ucts. Second, this strategic option would lead to risk reduction, that is, the company could adopt new products and markets where the cash flows are not correlated with the existing markets and products. Third, the management of the company may want to undertake more attractive growth opportunities than its existing markets and products.
However, diversification can obviously represent a high risk strategy. Of course entering an unknown market with an unknown product or service produces a position of uncer-tainty for the company. Such a strategy is likely to require a vast investment in resources, that is, capital expenditure and human resources. It is, therefore, recommended that a company only follows such a strategy if the current market and products do not show potential for growth.
In order to evaluate the risk of a diversification strategy the following questions should be asked.
• Is the new business opportunity presented by the diversification strategy more attrac-tive in terms of the potential IRRs or shareholder value added than by the existing markets and products?
• Does the cost of entry represent too much of a barrier for existing financial capacity?• Does the new diversified business gain any competitive advantage from the existing
business?
However, an example of a corporate that has successfully adopted a strategy of growth by diversification is the Virgin Group. The company started with a core business of music production and has grown into travel and mobile phones. The following areas have contrib-uted to this success.
• An understanding of institutionalised markets. Virgin’s management team have done well in identifying complacency in the market. It is this expertise/experience coupled with the strategy to offer more for less that has help the Group plough through complacent busi-ness industries.
• The Virgin brand name could overcome barriers to entry. The Virgin brand name is a consumer’s champion as mentioned previously and is a much respected brand with the British public.
• Limiting risk in joint ventures. Any company, corporation or organisation in a joint venture with the Virgin Group has the benefit of limiting its risk in the marketplace.
• Management are not restricted. A flat management structure helps encourage innovation; provides flexibility and promotes the values of shared ownership and responsibility.
• Innovation. Virgin’s senior staff consists of individuals with successful careers. The Group acquires like-minded partners in ventures who match their ability to innovate and differentiate.

The Strategic Corporate Investments Handbook
54
Due diligence
Due diligence relates to the need to evaluate or audit a potential corporate investment opportunity. It is a process that should highlight all the material facts relating to an invest-ment opportunity.
There are certain transactions that obviously require due diligence and certain investor types will need to undertake a certain due diligence process.
For the purposes of this book we will keep our discussion of the due diligence process to the following transaction types: mergers and acquisitions for buyers.
Due diligence for mergers and acquisitions decisions
It is obviously very important to ensure that you know what condition a business is in before you make the decision to make the final purchase transaction. The due diligence process usually takes place upon the signing of a term sheet for the purchase of the business. It is only when both the potential sellers and buyers’ lawyers have agreed these terms that the prospective seller will give the potential acquirer access to inside information. This informa-tion will include the financial information, sales and business data.
In order to undertake due diligence of the potential business it is important to carry out the following tasks.
Appoint legal and accountancy professionals
First, it is important to instruct a lawyer or law firm specialising in mergers and acquisitions assignments. You will also require the services of an accountant or accountancy company with acquisition due diligence skills in order to evaluate the financials of the target company and highlight any irregularities or risks.
Assess information about the business and its relationships
You should ensure that the lawyer evaluates the certificate of incorporation, the articles of association and memorandum of association.
It is necessary to assess a statement of all the geographic locations where the company undertakes its business.
The accountant needs to collect copies of the statutory accounts filed with Companies House – the corporation tax returns and the VAT returns. The accountant needs to assess the general ledger, chart of accounts and the trial balance. The management accounts and budgets will also be useful. The accountant will need to assess and arrive at a materially accurate financial position. It would be necessary to obtain three to five years of actuals which represent the profit and loss account, cash flow and balance sheet of the target.
It is necessary to assess any supporting documentation for the assets and liabilities of the target company; for example, any loan facility agreements or title deeds to certain owned property or buildings used for business purposes.
Independent research must be undertaken regarding any articles, including internet sites or press releases relating to the proposed target company. This is critical as it is essential
Strategy and corporate growth
55
to understand whether the company has a reputation problem which requires public rela-tions attention in the future. Acquiring a company with a poor reputation would involve considerable work and may not be advantageous.
Target management and key accounting personnel should be interviewed to evaluate and assess an understanding of the operations and the accounting, reporting and control systems. This is a key area as strong management controls and information are important to business perfor-mance. This may highlight an area for a potential synergistic gain because improved management controls can lead to an improvement in business performance, insight and opportunity.
The key terms of all significant customer and supplier contracts should be understood to see that these seem reasonable and if there is scope for improvement if the business is purchased.
Contracts which have a remaining term in excess of a year must be evaluated. Ensure that the company has developed a sufficient order book or sales pipeline. This is clearly critical to the valuation placed on the target company and the need to improve the business development efforts and strength of the current team.
It is necessary to evaluate a schedule of any transactions (including purchase, sale, financing or loan agreements) between the company and any shareholder, member, officer, director, employee or associates of the company.
The Articles of Incorporation of the Company should be evaluated in order to understand whether there are any constraints which will affect the purchase of the business.
The minutes of the last three years of meetings of the board of directors of the company, any committees and of the stockholders of the company should be examined together with copies of written consents in lieu of such meetings.
Materials prepared for distribution to shareholders or directors in the past five years should be evaluated.
It is important to examine the list of jurisdictions in which the company is qualified to do business as a foreign corporation together with whether they have sufficient licences to trade.
The management and investment studies or reports of the company must be evaluated, including any valuations and appraisals of the company or divisions during the last three years.
The brochures and reports describing the company and its products must be examined. All organisational charts and policy manuals, including corporate codes of conduct should be evaluated.
A list of the business or trade associations of which the company is a member and copies of any documents relating to such membership must be assessed.
A list of bank accounts must be checked. The list of authorised signatories should be obtained to ensure that there is control over the bank accounts and that they are regularly reviewed and reconciled. Ensure that you review a complete set of bank statements and reconcile these to the accounts.
In terms of the company’s markets, it is necessary to understand the markets served by the company and their target market segments. The total market size for the target company’s products and services must be assessed.
A list of major competitors should be prepared, outlining their competing products. Also, an assessment of the relative market share of the each company in each of the product lines in which they compete should be provided. It may be useful to prepare a competitor analysis of each company.

The Strategic Corporate Investments Handbook
56
The current business or marketing plan should be assessed with respect to each product or service line, to understand the company’s existing marketing strategy and any contem-plated changes.
It is necessary to assess current and historical market research and customer surveys, and market research into geographic expansion opportunities or new product development.
A list or description of each specific product or service the company has sold or supplied for the past three years should be assessed, together with the gross margin earned for each product line.
The historical sales data by product or service line for the past three years should also be assessed.
The production capacities should be evaluated by facility and the current utilisation of capacity should be reviewed. Is there excess capacity? Can any excess capacity be used for any other opportunities?
A current price list for all products sold, together with the pricing strategy for each product or service, should be assessed. How do these prices look in comparison with competitors’ offerings? Would a different pricing strategy have a favourable impact?
The channels of distribution used for each of the company’s products and services should be identified. Is there a potential channel that is not being used to sell the company’s prod-ucts and services? Or indeed is it possible to distribute these products through your own existing distribution channels?
Copies of all labels, packaging, advertising, and promotional materials for all products (or services) for the past five years should be evaluated. This will be useful to assess whether the marketing team have been undertaking the necessary promotions. If not, an opportunity will exist to further stimulate sales.
Copies of all warranties applicable to products or services sold or supplied for the past three years should be evaluated.
A schedule of the company’s 10 top accounts or largest customers should be assessed, including the amount sold annually, a description of discounts, promotional allowances, payment terms, rebates or referral fees for each.
A detailed breakdown of customer churn data should be provided for the past three years. It is important to understand why these customers are churning as it may be related to competitors’ offerings, and a required change in marketing mix that has not been under-taken but could present an opportunity for the potential acquirer.
In summary, we need to understand where the potential target is currently. We need to assess the valuation without any value added opportunities, so that we maximise the chance of purchasing a company knowing its current position with an opportunity of increasing the value of the company by understanding its strengths and weaknesses, the opportunities and any potential threats and risks.
Market research
Market research can be defined as a systematic way of investigating markets and collecting data and information. This book is intended only as an introduction to the specialised area of market research. For a more in depth understanding and application of market research

Strategy and corporate growth
57
techniques, we recommend reading a more in-depth and specialist book. The intention here is to make readers aware of the great potential of market research to assist the corporate investment decision making process.
Market research in itself is a very specialist discipline where many corporations seek to engage market research companies to conduct such research. The insights often assessed form such great value that the marketing mix and corporate positioning can be optimised in order to maximise the corporate investment opportunity.
Exhibit 1.23 starts with the problem definition, that is, what is it that we need to under-stand about the market in more detail or depth?
Exhibit 1.23
The market research process
Define problem
Scope of informationand data requirement
Collect information and data
Data analysis andinterpretation
Conclusions
Source: Author’s own
The Strategic Corporate Investments Handbook
58
From the problem definition stage we would be able to state the scope of the informa-tion and data that is required in order to fulfil our problem definition objective.
We would then need to find a way to collect the information and data that we require for our market research project. This could be achieved in a variety of ways. This may include observing the market, interviewing potential buyers or consumers, undertaking statistical sampling techniques and designing questionnaires.
The next step in our market research process is to analyse the data and information that we have collected. We use databases and spreadsheet applications in order to summarise and identify trends, opportunities and threats.
From our market research project we are able to conclude certain areas in order to fine-tune or feed in to our marketing strategy for our business or product.
A very useful area of applying market research techniques is the forecast and determina-tion of the market size and the company’s share of this particular market. Indeed a critical area for potential corporate business opportunities is to be able to assess the market size. It is vital that we can understand our total market size and our potential share of it. For this purpose there are certain techniques used for estimating market size and share.
• Past sales analysis of the industry.• Market testing.• Researching buyers or consumers’ behaviour through questionnaires or sampling techniques.
Secondary or desk research into the past sales of the industry from market reports is a useful place to start. We can get a further understanding of the main drivers that contribute to the market demand and project the growth of the market.
Primary market research will allow us to design a basis for forecasting the total market size, particularly in the circumstances of a new market opportunity. We would start by defining the target market characteristics. For example, the socio-economic group of the buyer and the place of purchase, that is, the distribution channel. If we structure the primary research of our potential market size based upon a test market or region we can use this to extrapolate our findings to the full market size in order to estimate demand. The question then becomes what share of this market would we be happy with? The market size and share should be supported by sufficient financial analysis and evaluation in order to make the corporate investment decision or indeed to fine-tune it.
Market testing
Market testing has been referred to under ‘The new product or business development approach’ and shown in Exhibit 1.11.
You can either use the demographic group for your target market or a geographical group or region. This aims to test the whole marketing mix, that is, price, promotion, product and place on a smaller scale than the total target market. Of course, there are a number of deci-sions that need to be made about the test market. Such as: What market region should be tested? What are the typical demographic attributes of the target market? How long should the market test be run for? What are the key measures for success or failure?

Strategy and corporate growth
59
A test marketing approach is usually justified on the grounds of risk reduction and expense minimisation. If the corporate can be a pioneer and enter a new market it is more likely to benefit from a larger market share than if it was a new entrant to an existing market with numerous competitors.
Of course, test marketing still requires a considerable amount of expenditure. So the question now would be: Is there an alternative to test marketing?
Indeed, there is the alternative of virtual test marketing that gives computer simulations of markets. The market obviously consists of consumers, competitors, products, and the external environment. The marketing mix can be used to simulate demand and result in returns to the corporate investor. The scope of virtual test marketing and market modelling are beyond the reach of this book and readers wishing to explore this area are recommended to seek a book addressing that topic.
Desk research
Desk research is the gathering and analysis of already available reports and information. So, effectively, this is about analysing information that already exists. This is also known as secondary research.
If you are considering a new business opportunity this should always be considered as the starting point. It is the best place to start as the cost is minimised as internal resources and existing external data sources are used. It would be more beneficial to see if the intelligence required could first be assessed from this source rather than perhaps engaging costly consultants, which may not lead to any incremental benefit. This secondary research can include market reports, annual and published accounts, magazines and periodicals, journal articles and website based intelligence.
Now let us turn to the discussion of the value of each source of secondary data and consider the value added to the business.
Market reports as a source of secondary research
Market reports are a very useful source when considering or researching a potential business oppor-tunity. For example, a secondary market report may be useful to a mobile telecoms operator looking to enter a particular international market. The market report is likely to inform them of the market size and its segments (for example, tablet phones, low-end smartphones, high-end market phones), the consumer trends, tastes and preferences. The major competitors in the market may be disclosed. Of course, if we are presented with such market intelligence we could assess the attractiveness of our market entry relative to these aspects. We could use the frameworks outlined earlier, such as SWOT or PESTL analysis, to consider the risks of the external business environment and consider the marketing mix of the offering in order to position matters optimally.
Published accounts as a source of secondary research
Published and statutory accounts must be published by all sizes of company regardless of whether they are a limited company or a public limited company. However, the drawback is often whether we will get the level of detail and disclosure that we would ideally like.

The Strategic Corporate Investments Handbook
60
The advantage of the availability of such accounts is the ability to get a feel for the potential investment and returns that are likely on entering a potential market. The evaluation of a number of companies’ published accounts may be of interest to those seeking suitable acquisition targets. Providing the business disclosed in the statutory accounts represents the opportunity that interests you then you would be able to get some interesting financial information at this initial stage of investigations.
As an example, a chain of UK theme parks is considering providing an in-house capability and service of providing digital photography solutions to their customers using the amuse-ment park. In order to undertake preliminary research regarding the financials of providing such a service it has been decided to collect and evaluate the existing statutory accounts of such service providers in the UK. One of the existing businesses that provides this service is shown in Exhibit 1.24.
Exhibit 1.24
Statutory accounts – Another Company Limited
Another Company limited
Directors’ report
The directors present their report and the audited financial statements for the year ended 31 Dec 2014.
Principal activities
Another Company Limited is a UK-based supplier of digital photography solutions to theme parks and our tourist attractions throughout the UK.
This involves the design, construction and operation of digital imagery systems.
Review of the business
These financial statements are prepared for the year ended 31 Dec 2014.
The comparatives are for the year ended 31 Dec 2013.
Another Company limited
PROFIT AND lOSS ACCOuNT
Note 2013£
2014£
Turnover 2 28,064,795 28,897,225
Cost of sales 24,994,378 26,040,369
Gross profit 3 3,070,417 2,856,856
Other operating income 4 1,019,899 1,505,225
Administrative expenses 5 3,749,400 3,930,028
Operating (loss)/profit 340,916 432,053
Interest receivable 6 5,000 670
Interest payable 7 254,832 127,539
Profit on ordinary activities before tax 91,084 305,184
Continued

Taxation 24,593 82,400
Profit on ordinary activities after tax 66,491 222,784
Another Company limited
BAlANCE SHEET
Note 2013
£2014
£
Fixed assets
Intangible assets 9 573,499 404,660
Tangible fixed assets 10 1,521,719 1,314,293
Investments 11 352,320 181,181
2,447,538 1,900,134
Current assets
Stock 12 1,325,081 1,081,611
Debtors 13 8,111,466 7,989,011
Cash at bank and in hand 1,427,780 793,713
10,864,327 9,864,335
Creditors’ amounts falling due within one year 14 6,121,471 4,351,291
Net current assets 4,742,856 5,513,044
Net assets 7,190,394 7,413,178
Capital reserves
Called up share capital 16 1,042 1,042
Profit and loss account 17 7,189,352 7,412,136
Shareholders’ funds 18 7,190,394 7,413,178
These financial statements were approved by the board of directors and authorised for issue on 31 March 2014.
Another Company limited
Notes
2013£
2014£
2 Turnover
Product A 2,000,330 2,092,506
Product B 4,500,020 4,707,382
Product C 3,567,155 3,731,530
Product D 7,997,290 8,365,807
Total 18,064,795 18,897,225
Continued
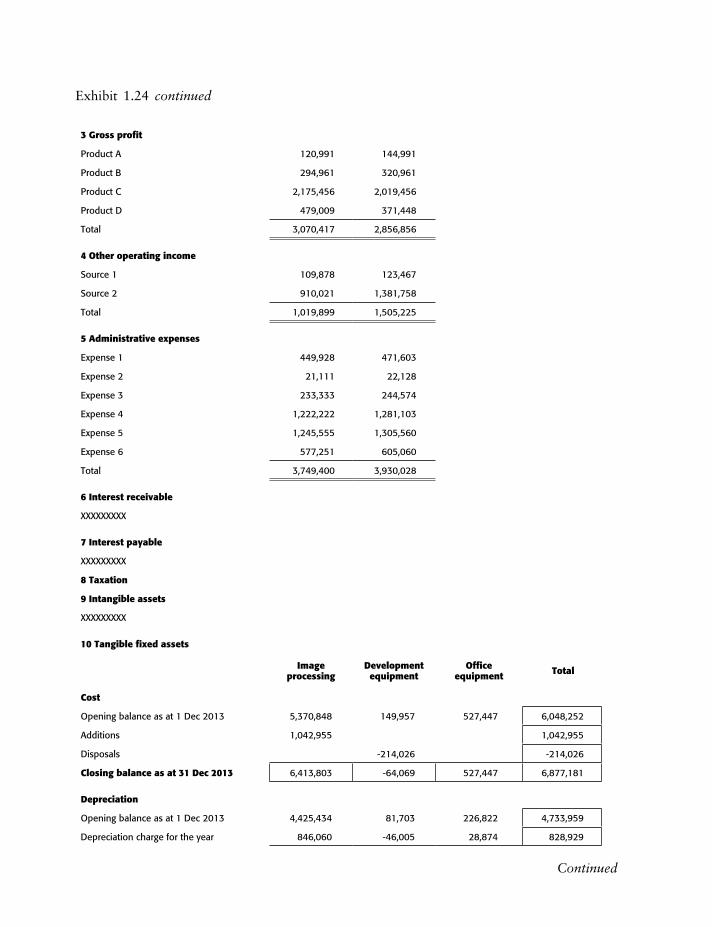
3 Gross profit
Product A 120,991 144,991
Product B 294,961 320,961
Product C 2,175,456 2,019,456
Product D 479,009 371,448
Total 3,070,417 2,856,856
4 Other operating income
Source 1 109,878 123,467
Source 2 910,021 1,381,758
Total 1,019,899 1,505,225
5 Administrative expenses
Expense 1 449,928 471,603
Expense 2 21,111 22,128
Expense 3 233,333 244,574
Expense 4 1,222,222 1,281,103
Expense 5 1,245,555 1,305,560
Expense 6 577,251 605,060
Total 3,749,400 3,930,028
6 Interest receivable
XXXXXXXXX
7 Interest payable
XXXXXXXXX
8 Taxation
9 Intangible assets
XXXXXXXXX
10 Tangible fixed assets
Imageprocessing
Development equipment
Office equipment Total
Cost
Opening balance as at 1 Dec 2013 5,370,848 149,957 527,447 6,048,252
Additions 1,042,955 1,042,955
Disposals -214,026 -214,026
Closing balance as at 31 Dec 2013 6,413,803 -64,069 527,447 6,877,181
Depreciation
Opening balance as at 1 Dec 2013 4,425,434 81,703 226,822 4,733,959
Depreciation charge for the year 846,060 -46,005 28,874 828,929
Exhibit 1.24 continued
Continued
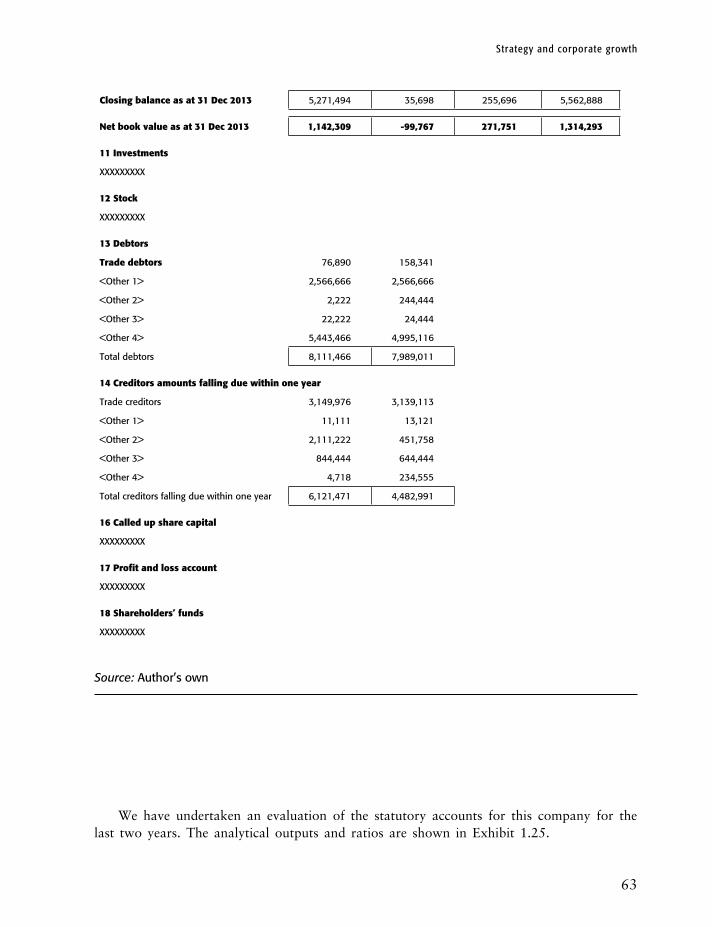
Strategy and corporate growth
63
Closing balance as at 31 Dec 2013 5,271,494 35,698 255,696 5,562,888
Net book value as at 31 Dec 2013 1,142,309 -99,767 271,751 1,314,293
11 Investments
XXXXXXXXX
12 Stock
XXXXXXXXX
13 Debtors
Trade debtors 76,890 158,341
<Other 1> 2,566,666 2,566,666
<Other 2> 2,222 244,444
<Other 3> 22,222 24,444
<Other 4> 5,443,466 4,995,116
Total debtors 8,111,466 7,989,011
14 Creditors amounts falling due within one year
Trade creditors 3,149,976 3,139,113
<Other 1> 11,111 13,121
<Other 2> 2,111,222 451,758
<Other 3> 844,444 644,444
<Other 4> 4,718 234,555
Total creditors falling due within one year 6,121,471 4,482,991
16 Called up share capital
XXXXXXXXX
17 Profit and loss account
XXXXXXXXX
18 Shareholders’ funds
XXXXXXXXX
Source: Author’s own
We have undertaken an evaluation of the statutory accounts for this company for the last two years. The analytical outputs and ratios are shown in Exhibit 1.25.

Exhibit 1.25
Evaluation of statutory accounts of Another Company Limited
Another Company limited
Ratios
2013 2014
Profit analysis
Turnover growth % 3.0%
Turnover by product £
Product A 2,000,330 2,092,506
Product B 4,500,020 4,707,382
Product C 3,567,155 3,731,530
Product D 7,997,290 8,365,807
Total turnover 28,064,795 28,897,225
Gross margin % 10.9 9.9
Gross margin £
Product A 120,991 144,991
Product B 294,961 320,961
Product C 2,175,456 2,019,456
Product D 479,009 371,448
Total 3,070,417 2,856,856
Gross margin (%)
Product A 6.0 6.9
Product B 6.6 6.8
Product C 61.0 54.1
Product D 6.0 4.4
Total 10.9 9.9
Other operating income
Source 1 109,878 123,467
Source 2 910,021 1,381,758
Total 1,019,899 1,505,225
Continued
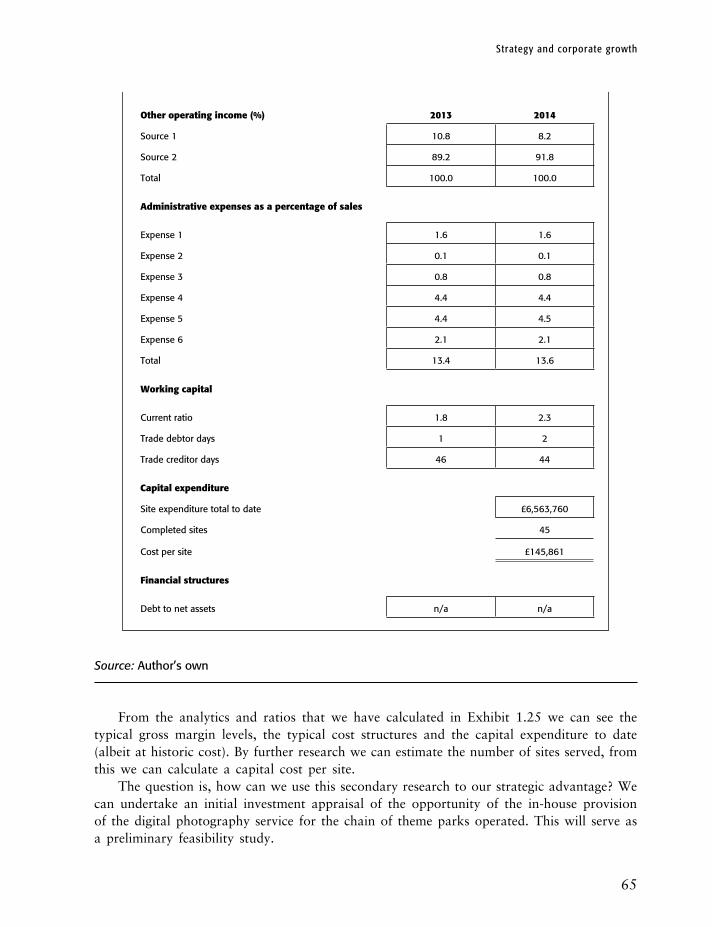
Strategy and corporate growth
65
Other operating income (%) 2013 2014
Source 1 10.8 8.2
Source 2 89.2 91.8
Total 100.0 100.0
Administrative expenses as a percentage of sales
Expense 1 1.6 1.6
Expense 2 0.1 0.1
Expense 3 0.8 0.8
Expense 4 4.4 4.4
Expense 5 4.4 4.5
Expense 6 2.1 2.1
Total 13.4 13.6
working capital
Current ratio 1.8 2.3
Trade debtor days 1 2
Trade creditor days 46 44
Capital expenditure
Site expenditure total to date £6,563,760
Completed sites 45
Cost per site £145,861
Financial structures
Debt to net assets n/a n/a
Source: Author’s own
From the analytics and ratios that we have calculated in Exhibit 1.25 we can see the typical gross margin levels, the typical cost structures and the capital expenditure to date (albeit at historic cost). By further research we can estimate the number of sites served, from this we can calculate a capital cost per site.
The question is, how can we use this secondary research to our strategic advantage? We can undertake an initial investment appraisal of the opportunity of the in-house provision of the digital photography service for the chain of theme parks operated. This will serve as a preliminary feasibility study.
The Strategic Corporate Investments Handbook
66
Journals and subscription websites as a source of secondary research
We probably do not need to tell readers about the vast amount of quality subscription websites or journal publications that provide business investors with very good market intelligence. An excellent business and financial paper is indeed the Financial Times and its website, ft.com. Indeed, Euromoney also provides a very good range of journals, such as the Institutional Investor, AirFinance Journal and Infrastructure Journal.
Government published data as a source of secondary research
This is a useful resource for economic and financial information such as base interest rates, gross domestic product growth and trends, inflation rates and unemployment. Almost every country has published economic data which is useful for making investment decisions.
A good example is the research undertaken regarding inflation trends in a particular country concerning the general price index. This will act as a very good guide to estimate the potential real return on investment. Although it is important to state the trends of general price information over a number of years would, of course, only serve as an estimate to a guide for future inflation. However, a guide is much better than no intelligence at all. If the economy has shown trends of hyper-inflation then it is advisable to be on your guard to ensure that the cash flow is insulated from such effects.
Economic indicators of high GDP growth point to a prosperous economy with high spending power, as does a low rate of unemployment. A low base rate may indicate a cost effective source of borrowing for our corporate investment decisions.
Customer desk research as a source of secondary research
One of the best ways of gaining market intelligence is through your existing customers or clients. These are the current buyers who would also be aware of competitive offerings.
Business plans
It is essential that any business or management team that seeks investment-based financing is able to prepare and present a compelling business plan. Of course, the business planning document’s main purpose when raising finance is to sell the business proposal to the potential investors. In essence, the company or management team will have to demonstrate that by investing in the venture it can provide the private equity company with an excellent return from a compelling business.
The business planning document should address the nature of the business and its targets, and show an understanding of the market size and opportunity. It should consider how it would deliver its products or services, and how it will sell and promote its products or services. It should understand the company’s relative strengths and weak-nesses in relation to its competitors, illustrate the potential threats from its environment, show the financial projections demonstrate a viable business and outline the investment need and size.
Strategy and corporate growth
67
The business plan should be prepared by the company’s management. The objective is that the plan is owned by the management team. The targets included should be challenging, clear and achievable. The private equity company is seeking an understanding of why the business proposition is unique and why they believe that it will be a success.
It is critical that the business planning document is prepared to a high standard and contains all the areas that are required by a potential investor company before it is presented.
Executive summary
This provides readers with a high summary of the business plan. Of course, it must be placed at the front of the document. It should address the following headings.
• The nature of the business.• The management team.• The mission statement.• The market size and opportunity.• The operational plan.• The investment required and financial projections.
The executive summary should be no more than two or three pages long and represent no more than 1,500 words. The words need to deliver a succinct message to the potential investor company as the attractiveness of this summary will determine how much further interest is shown from the potential investor.
The nature of the business
This section is used to outline the product, service or opportunity. Here it is advantageous to spell out the unique selling proposition.
The mission statement
The mission statement should be a clear and succinct representation of the enterprise’s purpose for existing. For example, an accounting outsourcing company may exist to provide value added services at competitive rates.
The résumés of the senior team
It is very important that any company that is seeking investors’ backing is able to demon-strate that it has a management team that can successfully run the operation. This means a management team of a Chief Executive, Sales & Marketing Director, Operations Director and a Finance Director. The investor will be looking for a team which demonstrates comple-mentary skills and experience, and that has a track record or clear potential for running the

The Strategic Corporate Investments Handbook
68
company successfully. A full CV of each management team member should be added to the business planning document.
It is highly recommended that you appoint a Non-executive Director to your board. Research has proven that such an appointment usually adds strength to your board.
It is also good to outline the procedures the company has in place for rewarding and evaluating the management team.
Short, medium and long-term objectives
It is necessary to identify the number of clients, industry sectors and/or contract targets to be achieved. It is advisable to show year on year growth. Indeed potential investors will expect to see year on year growth in terms of revenue. For example, at the end of year 1, 2, 3, 4, and 5.
Operational plan
Presentation of the operational plan will help to inform the potential investor’s company how the management team plans to run its operations, that is, how it will deliver its products or services and provide certain support functions. The operational plan should consider and outline the organisation’s structure, the rollout of certain departments’ infrastructure and the headcount as the business grows. Is it proposed to adopt a regional structure for distribu-tion of products and services? Where will the headquarters be located? Is it advisable to be located in a major city with good transport links? In short, the company must be able to demonstrate that it has an efficient operation.
Market size and opportunity
Obviously, it is necessary to sell a credible proposal that is supported by sufficient oppor-tunity and market size for the business. Market analysis and research must be undertaken, both by using desk research techniques and commissioning market research organisations. The following must be addressed.
• Market size. The size of the company’s target market in terms of volumes, pounds sterling and growth expectations.
• Number of competitors. It is important to get a feel for the degree of competition in the target market. Clearly, an already tapped market is likely to present a higher challenge to penetrate than a new market opportunity.
• Barriers to entry. It is advisable to outline how easy it would be for new market entrants to enter the proposed market. The higher the potential barriers to entry, the better for opportunity. Examples of potential barriers to entry are, perhaps, higher capital investment requirements, government or regulatory requirements amongst many others.
• Clients’ needs. It is important to show a detailed understanding of the clients’ needs and how they buy and make their decisions. It would be advantageous to show who the buyers are and who can influence them.

Strategy and corporate growth
69
Market segmentation
It is also advantageous to show sectors of the target market and how segmenting these will lead to improved opportunity and value creation.
• Details of current competitors. Who are the competitors? What are their relative strengths and weaknesses in relation to the company? What makes the company different to the competitors? How can the company differentiate its offering in terms of price, service and so on?
• Environmental threats? Legal or regulatory matters and other areas.• How the company plans to sell and promote its services.
# Qualification: ensure that the customers meet a certain criteria which would represent a viable business opportunity.
# Marketing: the use of promotions and branding. # Press and media: profile raising. # Pipeline management: ensure that the company always reports, plans and controls the
sales pipeline. # Prioritisation of market segments: show which target market segments are the company’s
priority.
Investment required and financial projections
This is indeed a major part of why this book has been written. It is extremely important to demonstrate financially viable projections based upon the business plan together with an indication of the amount of investment required from the potential investors. A financial model needs to be built whereby the outputs will be attached to the business planning document as an appendix. This is ideally a chance to demonstrate to the potential investor that the projections provided have a realistic chance of attaining the results demonstrated, that is, the company’s plan demonstrates the delivery of the return that the private equity company requires. The company will be expected to be able to present a set of integrated financial statements, that is, profit and loss account, balance sheet and cash flow. The annual statements should be backed up by monthly forecasts. The adoption of financial modelling best practice (FMBP) will help to clearly outline the assumptions that the forecasts are based upon. The assumptions and their source should be identified. The key outputs should be the revenue growth, EBITDA growth, cash levels, funding structure, the rates of return and exit valuations. Scenario and sensitivity analysis should be performed upon the key outputs of the transaction. A typical scenario is a low, mid and high case for the company’s sales or revenue targets.
It is also advisable to outline the financial management and accounting systems and processes that are in place to plan and control the investment, that is, budgets and manage-ment reporting systems.
1 Chartered Institute of Marketing (CIM)

70
Chapter 2
Sources of finance
There are several sources of finance that can be adopted in order to finance and grow a corporate. These options are outlined in this section.
Initial public offering
The initial public offering (IPO) represents the first stage of a private company selling its shares to the general public and, of course, is a source of long-term finance for expan-sion purposes.
For the first time in its history the company is subject to stock market discipline, so it needs to ensure that its shares are attractively priced and dividend income can be paid to its shareholders.
The advantage of going public by offering shares to members of the public will help the company’s senior management and directors retain a large degree of control which may not be the case with other funding sources. A well-managed private limited company with a strong balance sheet, cash position and profits is indeed in a good position to go public and raise capital through the use of the IPO route.
Another advantage of the IPO route will include the access to capital initially and greater access to the stock markets’ funds in the future. It is possible for the company’s directors and its existing shareholders to retain shares and use these for such purposes as providing share option benefits to key members of staff and the potential to use shares for financing potential mergers or acquisitions.
One would usually expect that generally the company’s debt to equity ratio and valu-ation may improve which could lead to it being able to attract much better interest rates from lenders.
There is also a greater public relations image associated with a public limited company than that of a private limited company.
The disadvantage of going public with an IPO includes the high professional fees involving accountants and lawyers. So in 2014 terms, a small company may be expected to pay as much as £300,000.
In addition to these professional fees, the underwriter requires a payment which can also be quite large and is based upon a percentage of the financing raised through the IPO route. The underwriter’s fee is usually in the 6% to 15% range. The job of the underwriter in an IPO transaction is to help the company to decide whether it should raise shares by the ordinary share capital route or by the preference share route. The underwriter will help to decide on the best price and when to take the IPO to market.
A prospectus is required in order to inform the prospective investors about the opportu-nity. A prospectus is a legal document which has to be legally produced and filed with the Securities and Exchange Commission. The prospectus will include background information
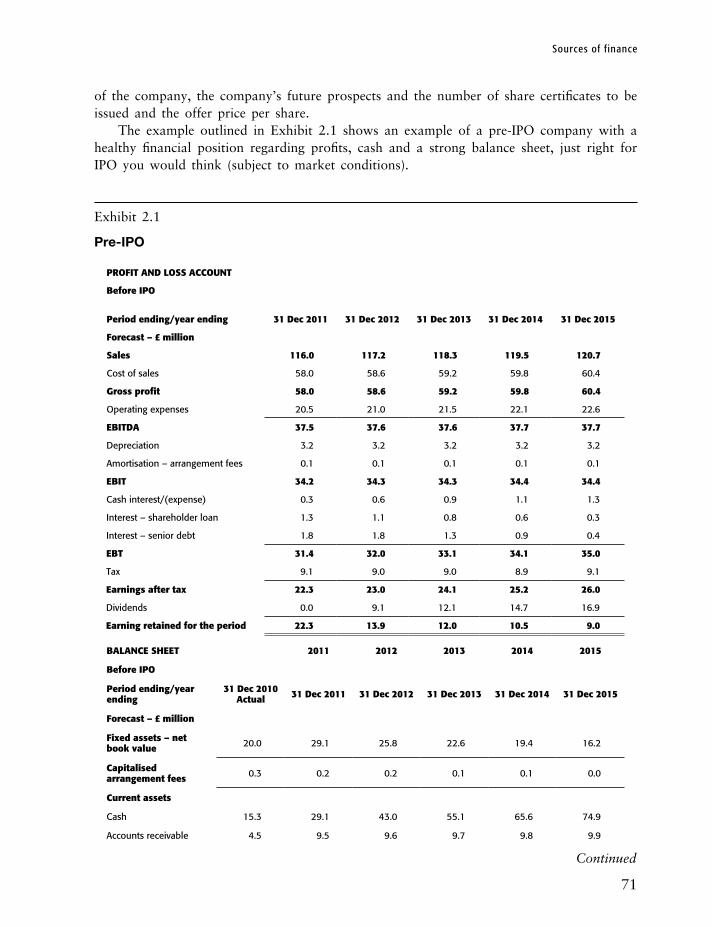
Sources of f inance
71
of the company, the company’s future prospects and the number of share certificates to be issued and the offer price per share.
The example outlined in Exhibit 2.1 shows an example of a pre-IPO company with a healthy financial position regarding profits, cash and a strong balance sheet, just right for IPO you would think (subject to market conditions).
Exhibit 2.1
Pre-IPO
PROFIT AND lOSS ACCOuNT
Before IPO
Period ending/year ending 31 Dec 2011 31 Dec 2012 31 Dec 2013 31 Dec 2014 31 Dec 2015
Forecast – £ million
Sales 116.0 117.2 118.3 119.5 120.7
Cost of sales 58.0 58.6 59.2 59.8 60.4
Gross profit 58.0 58.6 59.2 59.8 60.4
Operating expenses 20.5 21.0 21.5 22.1 22.6
EBITDA 37.5 37.6 37.6 37.7 37.7
Depreciation 3.2 3.2 3.2 3.2 3.2
Amortisation – arrangement fees 0.1 0.1 0.1 0.1 0.1
EBIT 34.2 34.3 34.3 34.4 34.4
Cash interest/(expense) 0.3 0.6 0.9 1.1 1.3
Interest – shareholder loan 1.3 1.1 0.8 0.6 0.3
Interest – senior debt 1.8 1.8 1.3 0.9 0.4
EBT 31.4 32.0 33.1 34.1 35.0
Tax 9.1 9.0 9.0 8.9 9.1
Earnings after tax 22.3 23.0 24.1 25.2 26.0
Dividends 0.0 9.1 12.1 14.7 16.9
Earning retained for the period 22.3 13.9 12.0 10.5 9.0
BAlANCE SHEET 2011 2012 2013 2014 2015
Before IPO
Period ending/year ending
31 Dec 2010Actual 31 Dec 2011 31 Dec 2012 31 Dec 2013 31 Dec 2014 31 Dec 2015
Forecast – £ million
Fixed assets – net book value 20.0 29.1 25.8 22.6 19.4 16.2
Capitalised arrangement fees 0.3 0.2 0.2 0.1 0.1 0.0
Current assets
Cash 15.3 29.1 43.0 55.1 65.6 74.9
Accounts receivable 4.5 9.5 9.6 9.7 9.8 9.9
Continued
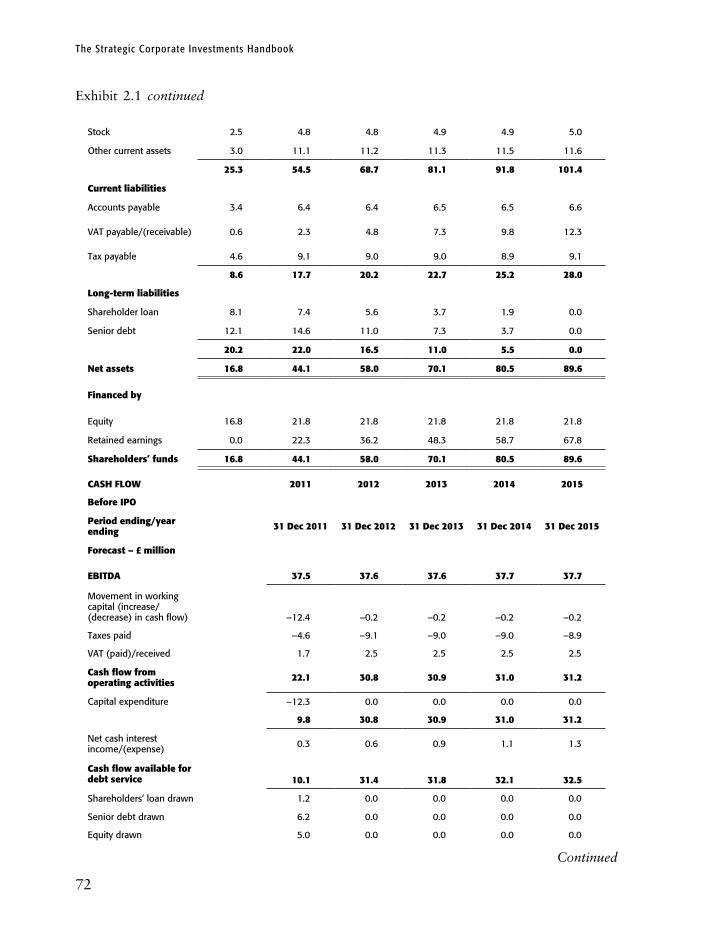
The Strategic Corporate Investments Handbook
72
Stock 2.5 4.8 4.8 4.9 4.9 5.0
Other current assets 3.0 11.1 11.2 11.3 11.5 11.6
25.3 54.5 68.7 81.1 91.8 101.4
Current liabilities
Accounts payable 3.4 6.4 6.4 6.5 6.5 6.6
VAT payable/(receivable) 0.6 2.3 4.8 7.3 9.8 12.3
Tax payable 4.6 9.1 9.0 9.0 8.9 9.1
8.6 17.7 20.2 22.7 25.2 28.0
long-term liabilities
Shareholder loan 8.1 7.4 5.6 3.7 1.9 0.0
Senior debt 12.1 14.6 11.0 7.3 3.7 0.0
20.2 22.0 16.5 11.0 5.5 0.0
Net assets 16.8 44.1 58.0 70.1 80.5 89.6
Financed by
Equity 16.8 21.8 21.8 21.8 21.8 21.8
Retained earnings 0.0 22.3 36.2 48.3 58.7 67.8
Shareholders’ funds 16.8 44.1 58.0 70.1 80.5 89.6
CASH FlOw 2011 2012 2013 2014 2015
Before IPO
Period ending/year ending 31 Dec 2011 31 Dec 2012 31 Dec 2013 31 Dec 2014 31 Dec 2015
Forecast – £ million
EBITDA 37.5 37.6 37.6 37.7 37.7
Movement in working capital (increase/(decrease) in cash flow)
–12.4 –0.2 –0.2 –0.2 –0.2
Taxes paid –4.6 –9.1 –9.0 –9.0 –8.9
VAT (paid)/received 1.7 2.5 2.5 2.5 2.5
Cash flow from operating activities 22.1 30.8 30.9 31.0 31.2
Capital expenditure –12.3 0.0 0.0 0.0 0.0
9.8 30.8 30.9 31.0 31.2
Net cash interest income/(expense) 0.3 0.6 0.9 1.1 1.3
Cash flow available for debt service
10.1 31.4 31.8 32.1 32.5
Shareholders’ loan drawn 1.2 0.0 0.0 0.0 0.0
Senior debt drawn 6.2 0.0 0.0 0.0 0.0
Equity drawn 5.0 0.0 0.0 0.0 0.0
Exhibit 2.1 continued
Continued
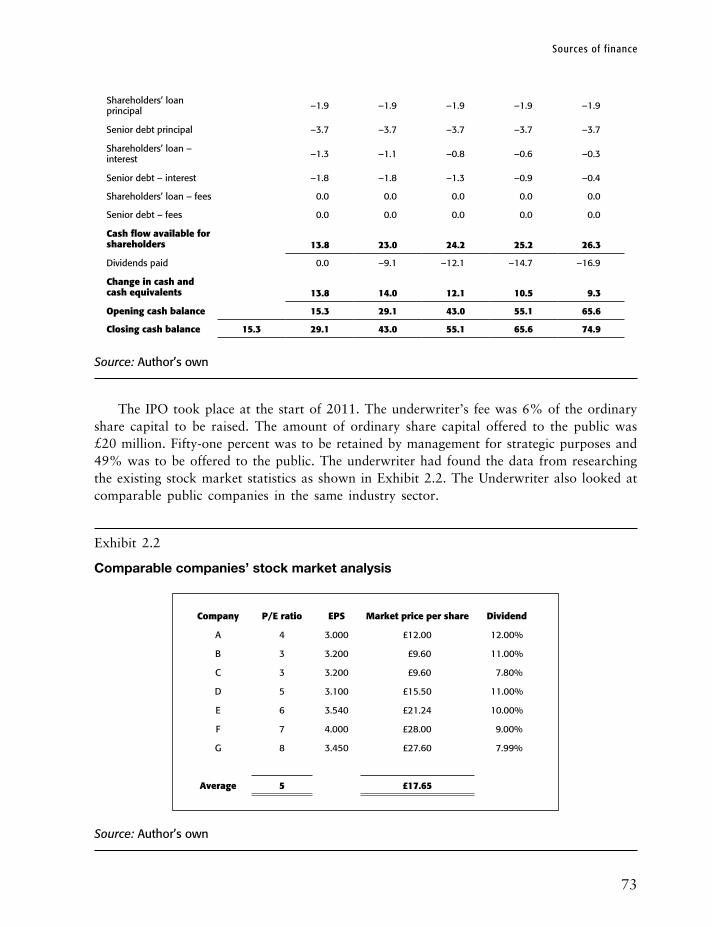
Sources of f inance
73
Shareholders’ loan principal –1.9 –1.9 –1.9 –1.9 –1.9
Senior debt principal –3.7 –3.7 –3.7 –3.7 –3.7
Shareholders’ loan – interest –1.3 –1.1 –0.8 –0.6 –0.3
Senior debt – interest –1.8 –1.8 –1.3 –0.9 –0.4
Shareholders’ loan – fees 0.0 0.0 0.0 0.0 0.0
Senior debt – fees 0.0 0.0 0.0 0.0 0.0
Cash flow available for shareholders
13.8 23.0 24.2 25.2 26.3
Dividends paid 0.0 –9.1 –12.1 –14.7 –16.9
Change in cash and cash equivalents
13.8 14.0 12.1 10.5 9.3
Opening cash balance 15.3 29.1 43.0 55.1 65.6
Closing cash balance 15.3 29.1 43.0 55.1 65.6 74.9
Source: Author’s own
The IPO took place at the start of 2011. The underwriter’s fee was 6% of the ordinary share capital to be raised. The amount of ordinary share capital offered to the public was £20 million. Fifty-one percent was to be retained by management for strategic purposes and 49% was to be offered to the public. The underwriter had found the data from researching the existing stock market statistics as shown in Exhibit 2.2. The Underwriter also looked at comparable public companies in the same industry sector.
Exhibit 2.2
Comparable companies’ stock market analysis
Company P/E ratio EPS Market price per share Dividend
A 4 3.000 £12.00 12.00%
B 3 3.200 £9.60 11.00%
C 3 3.200 £9.60 7.80%
D 5 3.100 £15.50 11.00%
E 6 3.540 £21.24 10.00%
F 7 4.000 £28.00 9.00%
G 8 3.450 £27.60 7.99%
Average 5 £17.65
Source: Author’s own
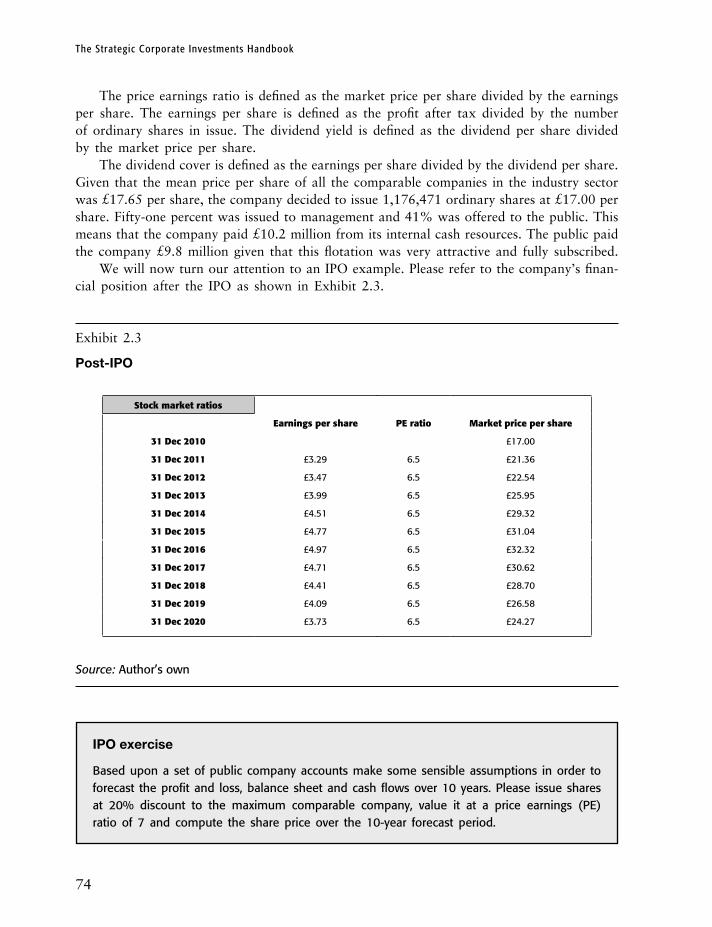
The Strategic Corporate Investments Handbook
74
The price earnings ratio is defined as the market price per share divided by the earnings per share. The earnings per share is defined as the profit after tax divided by the number of ordinary shares in issue. The dividend yield is defined as the dividend per share divided by the market price per share.
The dividend cover is defined as the earnings per share divided by the dividend per share. Given that the mean price per share of all the comparable companies in the industry sector was £17.65 per share, the company decided to issue 1,176,471 ordinary shares at £17.00 per share. Fifty-one percent was issued to management and 41% was offered to the public. This means that the company paid £10.2 million from its internal cash resources. The public paid the company £9.8 million given that this flotation was very attractive and fully subscribed.
We will now turn our attention to an IPO example. Please refer to the company’s finan-cial position after the IPO as shown in Exhibit 2.3.
Exhibit 2.3
Post-IPO
Stock market ratios
Earnings per share PE ratio Market price per share
31 Dec 2010 £17.00
31 Dec 2011 £3.29 6.5 £21.36
31 Dec 2012 £3.47 6.5 £22.54
31 Dec 2013 £3.99 6.5 £25.95
31 Dec 2014 £4.51 6.5 £29.32
31 Dec 2015 £4.77 6.5 £31.04
31 Dec 2016 £4.97 6.5 £32.32
31 Dec 2017 £4.71 6.5 £30.62
31 Dec 2018 £4.41 6.5 £28.70
31 Dec 2019 £4.09 6.5 £26.58
31 Dec 2020 £3.73 6.5 £24.27
Source: Author’s own
IPO exercise
Based upon a set of public company accounts make some sensible assumptions in order to forecast the profit and loss, balance sheet and cash flows over 10 years. Please issue shares at 20% discount to the maximum comparable company, value it at a price earnings (PE) ratio of 7 and compute the share price over the 10-year forecast period.
Sources of f inance
75
The decision to turn a private limited company into a public limited company is a critical decision which needs to be timed correctly and the key challenges need due consideration.
Planning and preparation are essential in order to get things right. The timing of the IPO would also need to be right. There are numerous stock exchanges around the world that all provide the benefit of raising capital from shareholders. The top stock exchanges include London, Shanghai, Tokyo, Hong Kong, New York and Toronto. Each has its own requirements for listing and the regulation of its listed companies. There are numerous other stock exchanges around the world which have lower market capitalisations. However, for the purpose of this book we shall concentrate on one world-leading stock exchange – the London Stock Exchange.
London Stock Exchange – main listing
There are two types of main listings available on the London Stock Exchange, the Premium and Standard. Being listed technically means that the company has been admitted to the official list of the United Kingdom Listing Authority (UKLA). Issuers that seek a Premium Listing are required to comply with super equivalent listing rules. The additional requirements include a track record of three years’ business operations and the need for a clean working capital statement for the next 12 months supported by a reporting accountant.
London Stock Exchange – AIMS listing
The AIMS is a stock market specifically for small and growing companies. It was established in 1995. There are around 1,600 companies listed.
Pre-IPO preparation
It is critical that a company that is prepared to go public through the IPO route undertakes a preparation process typically for six months to two years, depending upon the organisation. Such advance preparation is a critical factor for a smooth and efficient execution process and the ability to raise funding. Exhibit 2.4 shows a typical readiness process for a company.

The Strategic Corporate Investments Handbook
76
Exhibit 2.4
The efficient IPO preparation approach
Comprehensive business plan Suitability for an IPO Assess the
management team
Board appointments Internal controls Improvingoperational efficiency
Financial performance
Source: Author’s own
Comprehensive business plan
For the purposes of an IPO, a company needs a comprehensive business plan that sets out its products, markets, competitive environment, strategy, capabilities and growth objectives.
Suitability for an IPO
Companies engaging in successful IPOs tend to have a clearly defined vision for the future performance of the business that can be articulated credibly, clearly and quantifiably.
Companies that are in mature or shrinking industries, operate within small markets, or provide a narrow range of products to small niche customer segments may not be suitable for an IPO. Essentially what is required is a growth business which can show leadership in its markets together with relatively high barriers to entry for its competitors. A requirement for a company that wishes to go public is that it must normally have available at least a three-year independent trading and revenue earning track record together with at least a three-year period of audited or published accounts. The period ending for these accounts should be for a minimum of six months before the date of the flotation.
Assess the management team
A company’s management team will need to explain the business, its strategy and prospects to investors, and demonstrate knowledge of the sector, as well as its challenges, in order to

Sources of f inance
77
gain the support and confidence of the market. The directors of a company will be account-able to its new and existing shareholders for the performance of the business when it is a public company. Therefore, as a company prepares for its IPO it may need to ensure that its management has sufficient depth and breadth of skills to cope with the potential issues that it may face either financially, strategically or operationally.
Board appointments
A board of directors must be assembled that will be different from the day to day senior management team. It will also be necessary to appoint some non-executive directors.
Internal controls
It is extremely important that in order to protect your business from potential fraud or misappropriation it is critical that strong internal controls are in place. It is recommended that there is sufficient documentation, segregation of duties, sufficient authorisation and an overall review of the critical transaction cycles in the company.
Improving operational efficiency
The company’s operational efficiency will need to be reviewed and benchmarked against a competitor in the market who is best in class. The use of key performance indicators (KPIs) will be appropriate, possibly supported by the use of business process reengineering (BPR) techniques. BPR techniques are beyond the scope of this book and if the reader is interested they are advised to seek a specialist text on this subject.
Financial performance
A company should expect to show investors an attractive pattern of revenue and earnings before interest tax depreciation and amortisation (EBITDA) growth and a sound balance sheet post-flotation. For a company seeking a Premium Listing, its financial statements need to be stated in International Financial Reporting Standards (IFRS). Key areas of focus include audited and interim financial statements for at least three years. Important details are the capital structure, detailed budgets, meetings with auditors, budgets versus actuals management reporting, details of the use of the IPO proceeds, details of the company’s financial control systems, and the company’s working capital requirements and debt covenants.
The IPO process
When the IPO readiness process is almost complete it is necessary to plan the IPO process which is usually shorter and often takes three to six months. Exhibit 2.5 outlines the steps typically required.
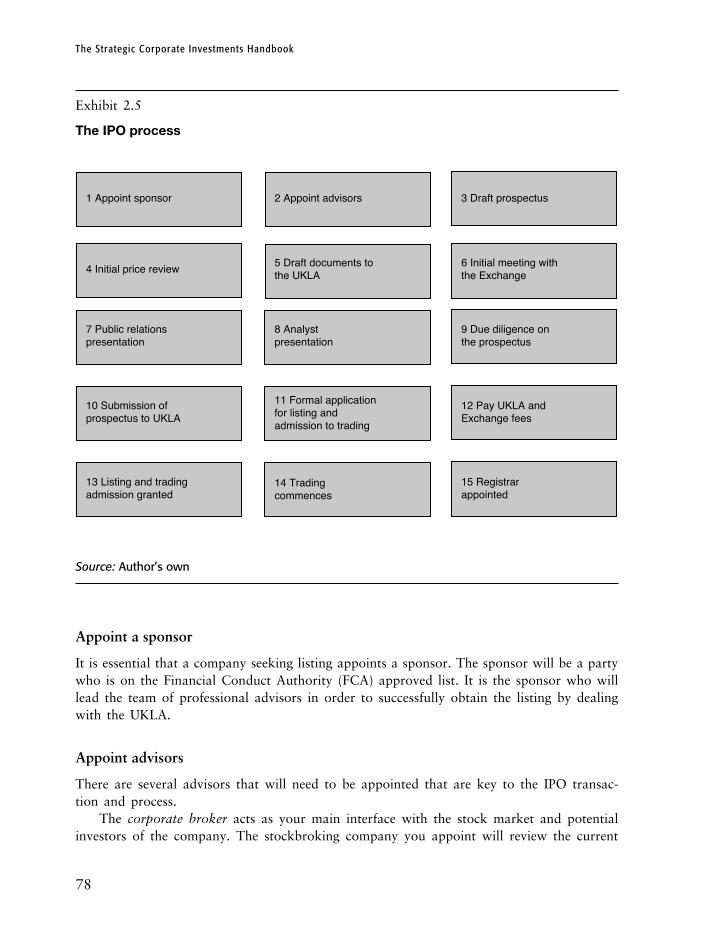
The Strategic Corporate Investments Handbook
78
Exhibit 2.5
The IPO process
1 Appoint sponsor 2 Appoint advisors 3 Draft prospectus
4 Initial price review 5 Draft documents to the UKLA
6 Initial meeting with the Exchange
7 Public relationspresentation
8 Analyst presentation
9 Due diligence onthe prospectus
10 Submission ofprospectus to UKLA
11 Formal application for listing andadmission to trading
12 Pay UKLA and Exchange fees
13 Listing and trading admission granted
14 Trading commences
15 Registrarappointed
Source: Author’s own
Appoint a sponsor
It is essential that a company seeking listing appoints a sponsor. The sponsor will be a party who is on the Financial Conduct Authority (FCA) approved list. It is the sponsor who will lead the team of professional advisors in order to successfully obtain the listing by dealing with the UKLA.
Appoint advisors
There are several advisors that will need to be appointed that are key to the IPO transac-tion and process.
The corporate broker acts as your main interface with the stock market and potential investors of the company. The stockbroking company you appoint will review the current

Sources of f inance
79
conditions in the stock market, and provide vital feedback on investors’ likely response to the issue.
The public relations agency will handle the company’s public relations both pre and post-flotation.
The reporting accountant will be required to review the financial history and projections of the company so that the potential investors can make an informed choice regarding their investment in the company’s shares.
Lawyers are required in most flotation transactions as one side is required to advise the company and another to advise the sponsor.
Draft prospectus
The draft prospectus is prepared by the company, sponsor and the lawyer. The draft prospectus should have a typical table of contents as shown in Box 2.1.
Continued
Box 2.1Table of contents – draft prospectus
The offer – number of shares and the priceDisclaimerSummaryIssuer – legal and commercial nameIssuer – domicile and legal formIssuer – current operations and principal activitiesIssuer – highlightsManagement teamOpportunities for further growthCurrent trading and prospectsStrategy and opportunities for further growthSignificant recent trends affecting the Group and the industry in which it operatesGroup structureMajor shareholdersHistorical financial informationPro forma financial informationProfit forecastQualifications in the audit report on the historical financial informationSufficient working capitalType and class of securitiesCurrencyIssued share capitalRights attaching to the shares
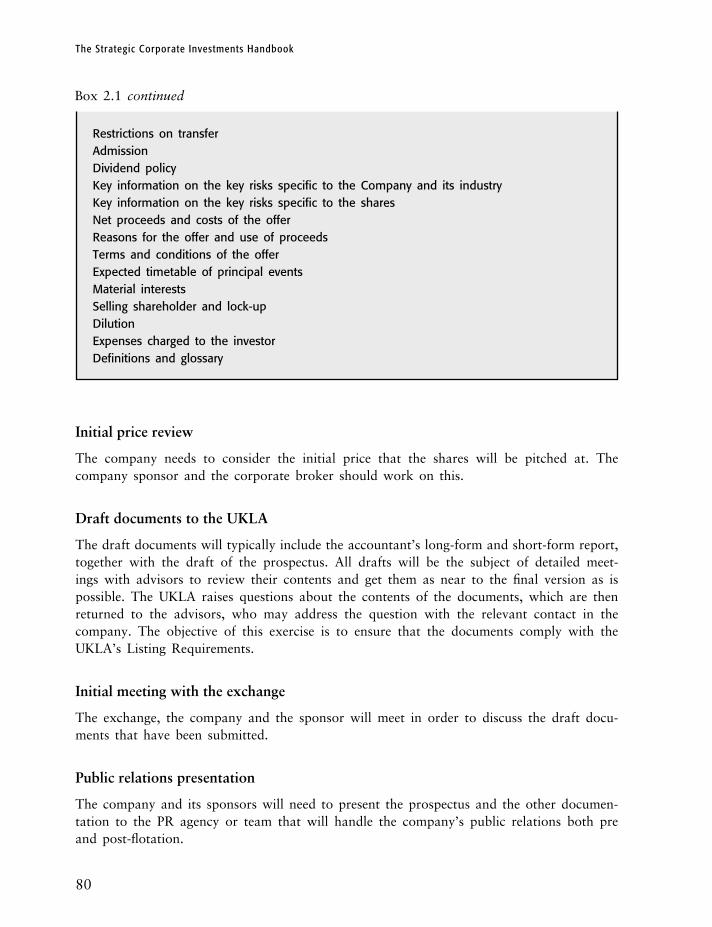
The Strategic Corporate Investments Handbook
80
Initial price review
The company needs to consider the initial price that the shares will be pitched at. The company sponsor and the corporate broker should work on this.
Draft documents to the UKLA
The draft documents will typically include the accountant’s long-form and short-form report, together with the draft of the prospectus. All drafts will be the subject of detailed meet-ings with advisors to review their contents and get them as near to the final version as is possible. The UKLA raises questions about the contents of the documents, which are then returned to the advisors, who may address the question with the relevant contact in the company. The objective of this exercise is to ensure that the documents comply with the UKLA’s Listing Requirements.
Initial meeting with the exchange
The exchange, the company and the sponsor will meet in order to discuss the draft docu-ments that have been submitted.
Public relations presentation
The company and its sponsors will need to present the prospectus and the other documen-tation to the PR agency or team that will handle the company’s public relations both pre and post-flotation.
Restrictions on transferAdmissionDividend policyKey information on the key risks specific to the Company and its industryKey information on the key risks specific to the sharesNet proceeds and costs of the offerReasons for the offer and use of proceedsTerms and conditions of the offerExpected timetable of principal eventsMaterial interestsSelling shareholder and lock-upDilutionExpenses charged to the investorDefinitions and glossary
Box 2.1 continued

Sources of f inance
81
Analyst presentation
The company and its sponsors will need to present the prospectus and the other documentation to the analysts, typically from the investment bank’s team, who will handle the company’s investment profile both pre and post-flotation.
Due diligence on the prospectus
The advisors will perform due diligence on the prospectus and raise any issues with the company and the sponsor as necessary.
Submission of the prospectus to the UKLA
After the advisors have performed due diligence on the prospectus the final prospectus is submitted to the UKLA.
Formal application for listing and admission
Following the formal application for listing, the UKLA and the exchange will grant admis-sion to the company.
Payment of UKLA and exchange fees
It is necessary for the sponsor to pay, on behalf of the company, the exchange fees and the UKLA fees.
Listing and trading admission granted
After the fees have been paid the company’s stock is granted admission to the exchange.
Trading commences
Trading of the company’s shares now commences on the stock exchange.
Registrar appointed
It will be necessary to appoint a registrar who will be responsible for maintaining the company’s share register.
Post-IPO compliance
Now that the company is a public limited company it will have to behave accordingly, of course. There are a number of critical areas to address as follows.
All publicly listed companies are required to publish their annual report and accounts, including their audited financial statements no later than six months after the end of the

The Strategic Corporate Investments Handbook
82
financial year. There is a penalty for any public company failing to do so and it will face having the listing and trading of its shares suspended. This penalty appears so high that it really is paramount for all companies to comply with such deadlines. There is also the requirement for a public limited company to prepare unaudited interim figures within four months of the end of its half-year. The penalty is as per the failure to publish the audited account – a suspension of the listing of the shares and its trading. The results must be sent to the UKLA and published to the market.
There are certain responsibilities that the directors of the public limited company will now have. The directors of a newly-listed public limited company will have already accepted certain legal responsibilities under Company law. This will include the information that was made avail-able by the company to the market during the flotation process. So all of the directors of the public limited company have individual and collective responsibility for the company’s continuing compliance with the UKLA’s Listing Rules and the Admission and Disclosure Standards. In addi-tion to these responsibilities, a public limited company’s directors are responsible for a series of further requirements and duties which they have to meet; these include restrictions on insider share dealing and a greater disclosure of many aspects of directors’ activities. These extra respon-sibilities are not really comparable to life as a private limited company. Any changes at board level must be announced immediately, once a decision has been made, even if the precise timing of the change has not yet been set. The UK code of the corporate governance guidelines must be complied with which forms part of the UKLA’s Listing Rules which is outlined under ‘Corporate governance’ in Chapter 4 of this book.
There are further requirements that the management must comply with such as the range of factors including the proportion of share capital in public hands, which should normally stay at above 25% of the total. Material or major shareholders in a public listed company must also disclose any significant changes in the percentage of stock that they hold. They must make this disclosure to the company, which in turn must disclose the information to the market accordingly.
It is very important to point out that all directors of a listed company, and even some employees in contact with price-sensitive information, have to meet with a range of restrictions on their share dealing activities due to potential insider dealing issues. These are addressed in a document called the Model Code, which is designed to prevent such people with unpublished price-sensitive information, or who may be perceived as having access to such information, from dealing on the basis of it, and thereby gaining an advantage over other shareholders who do not have such information. It is the director’s duty to inform the company, which in turn must make an announcement to the market, of details of all the dealings they conduct in their company’s shares. The UKLA’s Listing Rules outline the Model Code in full. The range of restrictions imposed by the Model Code include a full ban on dealing in your company’s shares when you are (or could be) in possession of price-sensitive information, or within a minimum period – normally two months – before the announcement of regular information such as annual results. Also, directors must first get approval for their share dealings from the company chairman or from a designated director specifically appointed to monitor and approve their fellow directors’ share dealings under the Model Code. Overall, the Model Code sets a minimum standard of good practice for the company’s agreed procedures and many listed companies go well beyond it in setting their own guidelines.
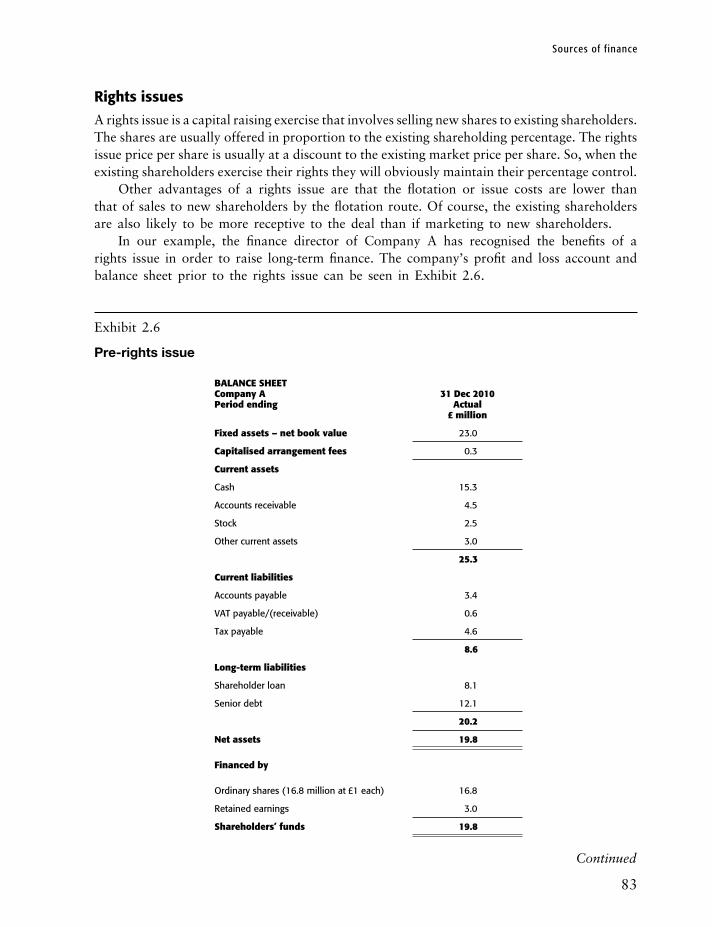
Sources of f inance
83
Rights issues
A rights issue is a capital raising exercise that involves selling new shares to existing shareholders. The shares are usually offered in proportion to the existing shareholding percentage. The rights issue price per share is usually at a discount to the existing market price per share. So, when the existing shareholders exercise their rights they will obviously maintain their percentage control.
Other advantages of a rights issue are that the flotation or issue costs are lower than that of sales to new shareholders by the flotation route. Of course, the existing shareholders are also likely to be more receptive to the deal than if marketing to new shareholders.
In our example, the finance director of Company A has recognised the benefits of a rights issue in order to raise long-term finance. The company’s profit and loss account and balance sheet prior to the rights issue can be seen in Exhibit 2.6.
Exhibit 2.6
Pre-rights issue
BAlANCE SHEETCompany APeriod ending
31 Dec 2010Actual
£ million
Fixed assets – net book value 23.0
Capitalised arrangement fees 0.3
Current assets
Cash 15.3
Accounts receivable 4.5
Stock 2.5
Other current assets 3.0
25.3
Current liabilities
Accounts payable 3.4
VAT payable/(receivable) 0.6
Tax payable 4.6
8.6
long-term liabilities
Shareholder loan 8.1
Senior debt 12.1
20.2
Net assets 19.8
Financed by
Ordinary shares (16.8 million at £1 each) 16.8
Retained earnings 3.0
Shareholders’ funds 19.8
Continued

The Strategic Corporate Investments Handbook
84
PROFIT AND lOSS ACCOuNTCompany APeriod ending
Year ending31 Dec 2010
Forecast – £ million
Sales 100.0
Cost of sales 50.0
Gross profit 50.0
Operating expenses 20.5
EBITDA 29.5
Depreciation 2.8
Amortisation – arrangement fees 0.1
EBIT 26.7
Cash interest/(expense) 0.3
Interest – shareholder loan 1.1
Interest – senior debt 0.9
EBT 24.9
Tax 7.3
Earnings after tax 17.6
Source: Author’s own
We can see from Exhibit 2.6 that Company A earns £17.6 million after taxation and currently has 16.8 million ordinary shares in issue. Consequently, this gives a current earn-ings per share of £1.05. The company’s current market price per share is £3.26. The finance director wants to raise an additional £35 million through a rights issue.
So the burning question is, how many shares should be issued and at what price per share? First, most rights issues are made at a price which is lower than the current market price per share. Company A has decided to issue the shares at £3.00 each which means that it will issue 11.66 million new shares to existing shareholders, that is, 0.69 shares per existing share held by each shareholder. As soon as the rights issue has been actioned, the company has 28.46 million ordinary shares in issue valued at £89.75 million giving a share price of £3.15 per share. However, the stock market will value the new shares at a higher price than £3.15 per share if it has the confidence to believe that Company A can invest the extra capital raised at a rate of return greater than the shareholders’ required rate of return, but the stock market will value the new shares lower if it cannot have such confidence. Of course, stock market behaviour is not a science! However, it is recommended that the company continues to reforecast the performance against the stock market post-rights issue.
We will now turn our attention to the post-rights issue example in Exhibit 2.7.
Exhibit 2.6 continued
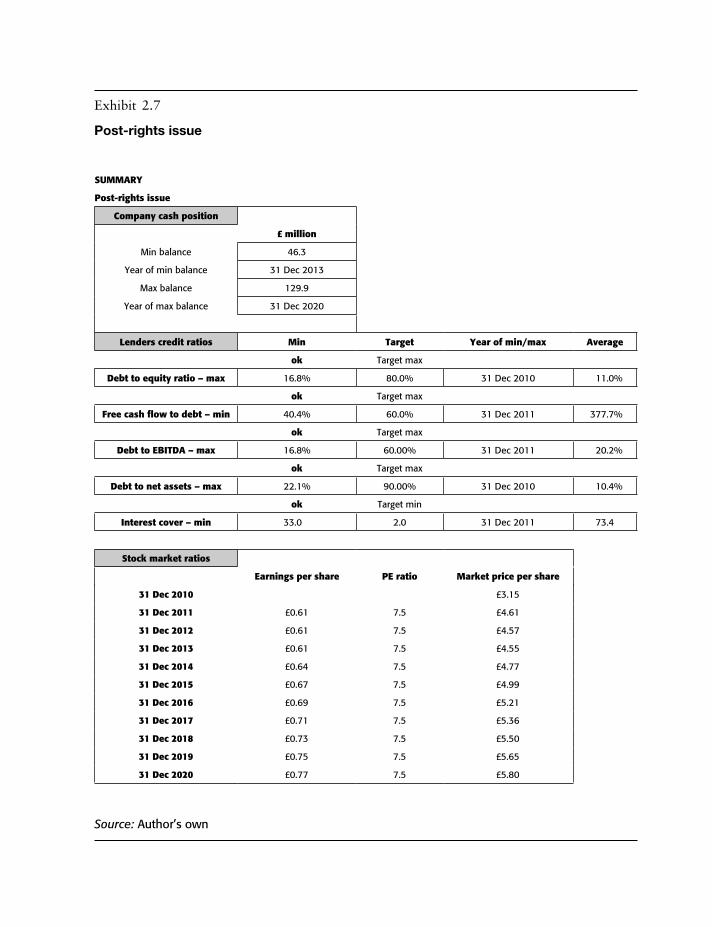
Exhibit 2.7
Post-rights issue
SuMMARY
Post-rights issue
Company cash position
£ million
Min balance 46.3
Year of min balance 31 Dec 2013
Max balance 129.9
Year of max balance 31 Dec 2020
lenders credit ratios Min Target Year of min/max Average
ok Target max
Debt to equity ratio – max 16.8% 80.0% 31 Dec 2010 11.0%
ok Target max
Free cash flow to debt – min 40.4% 60.0% 31 Dec 2011 377.7%
ok Target max
Debt to EBITDA – max 16.8% 60.00% 31 Dec 2011 20.2%
ok Target max
Debt to net assets – max 22.1% 90.00% 31 Dec 2010 10.4%
ok Target min
Interest cover – min 33.0% 2.0 31 Dec 2011 73.4
Stock market ratios
Earnings per share PE ratio Market price per share
31 Dec 2010 £3.15
31 Dec 2011 £0.61 7.5 £4.61
31 Dec 2012 £0.61 7.5 £4.57
31 Dec 2013 £0.61 7.5 £4.55
31 Dec 2014 £0.64 7.5 £4.77
31 Dec 2015 £0.67 7.5 £4.99
31 Dec 2016 £0.69 7.5 £5.21
31 Dec 2017 £0.71 7.5 £5.36
31 Dec 2018 £0.73 7.5 £5.50
31 Dec 2019 £0.75 7.5 £5.65
31 Dec 2020 £0.77 7.5 £5.80
Source: Author’s own
The Strategic Corporate Investments Handbook
86
The results show a positive cash balance over the life of the 10-year reforecast. All the lenders’ credit ratios meet the targets. The earnings per share shows a rising growth over the 10 years valued at the current PE ratio and appears to show share price growth. The other area that the company needs to be in tune with is its dividend policy which obviously affects the company’s share price growth. This will be addressed under ‘Dividend policy’ in Chapter 3 of this book.
Debt capital
We will now look at the nature of debt capital. It is important that we start with several definitions of the types of long-term debt.
Mortgaged debt is debt which is secured by the way of a charge on certain fixed assets of the borrower. If assets have charges on them as security they cannot be sold by the borrower.
Debt with a floating charge is debt that is secured against all assets of the company. Here, the company will have a greater degree of flexibility over its asset base. In the event that the company defaults on the interest and or principal the lender will have the right to appoint a receiver to administer the assets until the debt position is rectified.
Unsecured debt is sometimes called naked debt. This type of debt has no security. The only security is the lender’s agreement. The holders of this type of debt will, in the event of liquidation, be paid after the mortgaged debt and floating charge debt.
The advantages of long-term debt to a corporate is as follows.
• The cost of debt is limited and debt holders do not participate in upside financial rewards of the company like a shareholder.
• There will be no dilution in the control of the company as the shareholders do not have to share their ownership with the lenders.
• The interest on debt is usually tax deductible for corporate tax purposes thus reducing the cost of debt to the corporate.
• The cost of debt is lower than the cost of equity funding.
Despite the advantages above there are indeed disadvantages associated with raising debt finance as follows.
• The amount of debt that a company can raise is governed by its debt capacity. There are certain elements of financial policy that govern the fact that the debt ratio cannot exceed a certain level. If the debt ratio exceeds certain levels of comfort then the cost of borrowing will increase.
• The debt repayments are fixed charges. There is a risk that if the company’s cash flows are volatile there is the chance that the debt cannot be repaid.
So the question that would arise is: When is it the right time to raise additional debt? The following conditions will favour the raising of additional debt.
• If the existing debt ratio is reasonably low for the type of business.
Sources of f inance
87
• If the company’s cash flows are expected to be relatively stable or rising and the company is listed, then increases in the company’s earnings will increase the earnings per share for the ordinary shareholders. So to put this more simply, the larger the amount of debt the larger the potential returns to the shareholders.
• If inflation is expected to rise in the future and a low cost of fixed interest debt can be raised then the cost of debt will reduce in real terms.
Planning different debt structures
It is recognised that companies will often negotiate and consider different types of debt structures. Below, we outline examples of different types of debt structure that could be adopted. There are several types of debt repayment schedules that may be suitable for a company depending on the company’s expected future cash flows.
An amortised debt schedule is where a lender pays an equal periodic instalment of interest and principal.
A bullet debt schedule is where a lender pays the principal in a single payment at the end of the term.
A sculpted debt schedule is where a lender pays the principal which is profiled to meet certain lenders’ credit ratios over the term of the debt. Sculpted debt profiles are typically used in project finance, public-private partnership (PPP) and private finance initiative (PFI) transactions.
A straight line debt schedule is where a lender pays the principal in equal payments over the life of the term.
Corporate investment funds
If a large business opportunity requires funding, a good source can often be a corporate investment fund. A fund manager is needed to administer the fund. In the UK, a fund is regulated by the FCA. The objective of the FCA is to provide the confidence for financial services customers to find financial products that meet their needs from companies that they can trust. The FCA has the power to authorise and regulate fund managers. It is possible to list your fund on a major stock exchange.
However, in order to attract investors and ensure sufficient returns to these investors, either equity or debt investors, it is necessary to demonstrate corporate governance over the fund and strong investment controls. Below, we demonstrate the type of policy and procedure that should be put in place and followed.
Infrastructure fund governance and controls
A typical table of contents for a fund would be as follows.
• Introduction.• Investment fund structure.• Corporate governance and the investment process.• Internal controls and assurance.

The Strategic Corporate Investments Handbook
88
• Risk management.• Investor performance reporting.
Introduction
This policy and procedure document is to ensure that the project and portfolio returns are maximised and the debt is serviceable from the initial stage, financial close and post-financial close over the life of the asset or concession.
Investment fund structure
The investment fund structure is shown in Exhibit 2.8, in which we can see an investment fund structure that shows investment flows (both funding and dividends) from both the corporate’s available funds and private investors’ funding. Other private investors can invest directly in any of the industry funds. Each infrastructure fund will have a number of special purpose vehicles (SPVs) that are financed through the funds’ equity and external senior debt.
Exhibit 2.8
Investment fund structure
Corporate investor
Private investors
Otherprivate
investors
Otherprivate
investors
InvestmentManagement
HoldingCompany
InfrastructureIndustry Fund 3
InfrastructureIndustry Fund 1
InfrastructureIndustry Fund 2
SPV 1 SPV 2 SPV 3 SPV 1 SPV 2 SPV 3 SPV 1 SPV 2 SPV 3
Source: Author’s own

Sources of f inance
89
Of course, dividend streams which are expected to exceed the cost of funds will be paid to the investment management companies from the SPVs and in turn dividends are paid back to the original investors, that is, investment management companies and private investors and other private investors (at around 20% to 25% real pre-tax expected return).
Each SPV will be expected to service the debt and be compliant with the lender covenants in term of its ratios, reserve account requirements and dividend distribution covenants.
Corporate governance and the investment process
The internal corporate governance covers all aspects of management from plans to internal controls over both the investment companies and the SPVs.
So, an investment management process would ideally focus around the organisation’s practices and processes to ensure that the opportunities are evaluated, appraised, ranked and selected as a suitable fit to the infrastructure fund’s vision. The different levels of approvals and corporate governance processes are key together with adequate business case processes. Exhibit 2.9 shows the procedures that should be placed around such investment proposals.
Exhibit 2.9
Investment process
Evaluation procedure
Reporting format
Authorisation process
Authorisation levels
Viable Reject
Pre-fund Fund
Source: Author’s own
The Strategic Corporate Investments Handbook
90
The investment process shown in Exhibit 2.9 starts with the ‘evaluation procedure’ which outlines the methodology for making the investment decisions.
The second box involves the ‘reporting format’ which outlines the words and numbers associated with the business case. The reporting format will be different depending whether the proposal is at the pre-funding stage (before engaging with external investors – lenders or potential equity investors) or the funding stage (engaging with lenders and investors).
The third box involves the ‘authorisation process’. This involves the submission of the proposal form by the proposer within the organisation which is evaluated at the appropriate level. The proposal will ultimately be considered an unviable or viable opportunity. If viable the proposal will progress to Phase 2 (the funding stage), it will be authorised accordingly and the funds agreed.
Business case reporting pre-funding (Phase 1)
The outputs and scope of analysis are shown in Exhibit 2.10. The outputs (net present value (NPV) and internal rate of return (IRR)) should be calculated or compared by using the required post-tax weighted average cost of capital (WACC) as defined below.
Real Cost Of Equity = Real Required Return on Equity @ Equity %
plus
Real Cost Debt = (1+ (Nominal Cost of Debt @ (1- Corporation Tax Rate) @ Debt %) / (1+Inflation))-1
Real Post-Tax WACC = Real Cost Of Equity plus Real Cost Debt.
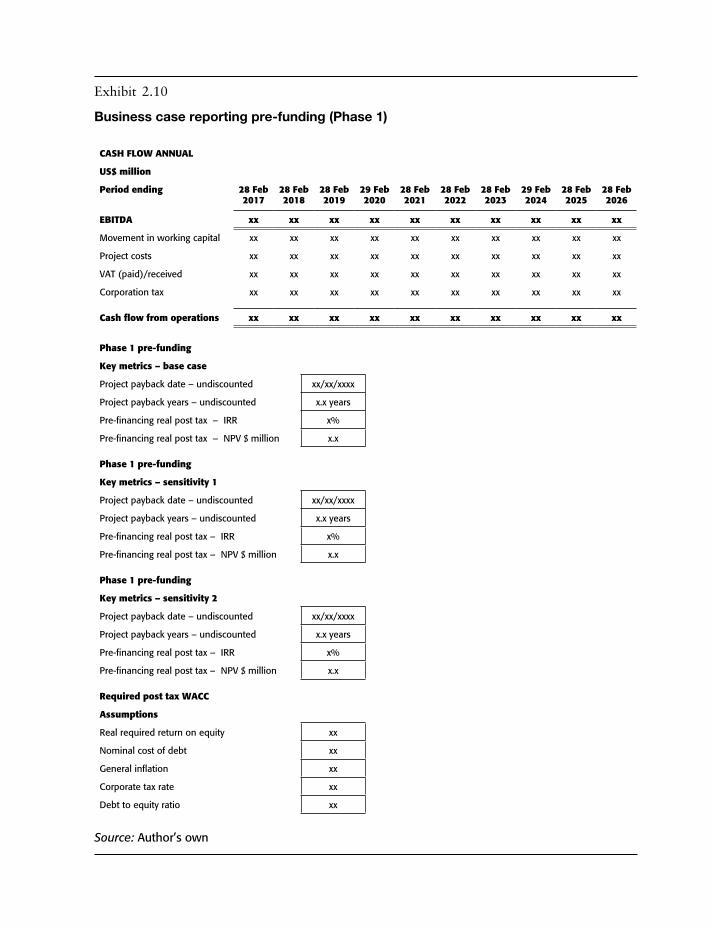
Exhibit 2.10
Business case reporting pre-funding (Phase 1)
CASH FlOw ANNuAl
uS$ million
Period ending 28 Feb 2017
28 Feb 2018
28 Feb 2019
29 Feb 2020
28 Feb 2021
28 Feb 2022
28 Feb 2023
29 Feb 2024
28 Feb 2025
28 Feb 2026
EBITDA xx xx xx xx xx xx xx xx xx xx
Movement in working capital xx xx xx xx xx xx xx xx xx xx
Project costs xx xx xx xx xx xx xx xx xx xx
VAT (paid)/received xx xx xx xx xx xx xx xx xx xx
Corporation tax xx xx xx xx xx xx xx xx xx xx
Cash flow from operations xx xx xx xx xx xx xx xx xx xx
Phase 1 pre-funding
Key metrics – base case
Project payback date – undiscounted xx/xx/xxxx
Project payback years – undiscounted x.x years
Pre-financing real post tax – IRR x%
Pre-financing real post tax – NPV $ million x.x
Phase 1 pre-funding
Key metrics – sensitivity 1
Project payback date – undiscounted xx/xx/xxxx
Project payback years – undiscounted x.x years
Pre-financing real post tax – IRR x%
Pre-financing real post tax – NPV $ million x.x
Phase 1 pre-funding
Key metrics – sensitivity 2
Project payback date – undiscounted xx/xx/xxxx
Project payback years – undiscounted x.x years
Pre-financing real post tax – IRR x%
Pre-financing real post tax – NPV $ million x.x
Required post tax wACC
Assumptions
Real required return on equity xx
Nominal cost of debt xx
General inflation xx
Corporate tax rate xx
Debt to equity ratio xx
Source: Author’s own
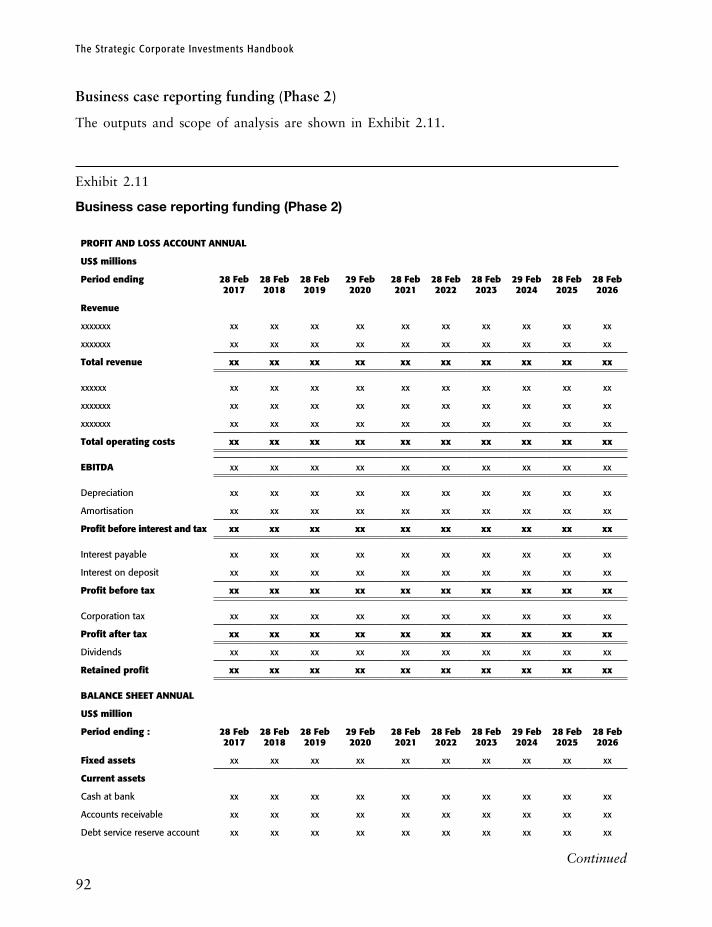
The Strategic Corporate Investments Handbook
92
Business case reporting funding (Phase 2)
The outputs and scope of analysis are shown in Exhibit 2.11.
Exhibit 2.11
Business case reporting funding (Phase 2)
PROFIT AND lOSS ACCOuNT ANNuAl
uS$ millions
Period ending 28 Feb 2017
28 Feb 2018
28 Feb 2019
29 Feb 2020
28 Feb 2021
28 Feb 2022
28 Feb 2023
29 Feb 2024
28 Feb 2025
28 Feb 2026
Revenue
xxxxxxx xx xx xx xx xx xx xx xx xx xx
xxxxxxx xx xx xx xx xx xx xx xx xx xx
Total revenue xx xx xx xx xx xx xx xx xx xx
xxxxxx xx xx xx xx xx xx xx xx xx xx
xxxxxxx xx xx xx xx xx xx xx xx xx xx
xxxxxxx xx xx xx xx xx xx xx xx xx xx
Total operating costs xx xx xx xx xx xx xx xx xx xx
EBITDA xx xx xx xx xx xx xx xx xx xx
Depreciation xx xx xx xx xx xx xx xx xx xx
Amortisation xx xx xx xx xx xx xx xx xx xx
Profit before interest and tax xx xx xx xx xx xx xx xx xx xx
Interest payable xx xx xx xx xx xx xx xx xx xx
Interest on deposit xx xx xx xx xx xx xx xx xx xx
Profit before tax xx xx xx xx xx xx xx xx xx xx
Corporation tax xx xx xx xx xx xx xx xx xx xx
Profit after tax xx xx xx xx xx xx xx xx xx xx
Dividends xx xx xx xx xx xx xx xx xx xx
Retained profit xx xx xx xx xx xx xx xx xx xx
BAlANCE SHEET ANNuAl
uS$ million
Period ending : 28 Feb 2017
28 Feb 2018
28 Feb 2019
29 Feb 2020
28 Feb 2021
28 Feb 2022
28 Feb 2023
29 Feb 2024
28 Feb 2025
28 Feb 2026
Fixed assets xx xx xx xx xx xx xx xx xx xx
Current assets
Cash at bank xx xx xx xx xx xx xx xx xx xx
Accounts receivable xx xx xx xx xx xx xx xx xx xx
Debt service reserve account xx xx xx xx xx xx xx xx xx xx
Continued

Maintenance reserve account xx xx xx xx xx xx xx xx xx xx
VAT receivable xx xx xx xx xx xx xx xx xx xx
xx xx xx xx xx xx xx xx xx xx
Current liabilities
Overdraft xx xx xx xx xx xx xx xx xx xx
Accounts payable xx xx xx xx xx xx xx xx xx xx
VAT payable xx xx xx xx xx xx xx xx xx xx
Corporation tax payable xx xx xx xx xx xx xx xx xx xx
xx xx xx xx xx xx xx xx xx xx
Net current assets xx xx xx xx xx xx xx xx xx xx
Total assets less net current assets
xx xx xx xx xx xx xx xx xx xx
long-term liabilities
Senior debt xx xx xx xx xx xx xx xx xx xx
Subordinated debt xx xx xx xx xx xx xx xx xx xx
xx xx xx xx xx xx xx xx xx xx
Net assets xx xx xx xx xx xx xx xx xx xx
Capital and reserves
Share capital xx xx xx xx xx xx xx xx xx xx
Retained profit xx xx xx xx xx xx xx xx xx xx
Total capital and reserves xx xx xx xx xx xx xx xx xx xx
CASH FlOw ANNuAl
uS$ million
Period ending : 28 Feb 2017
28 Feb 2018
28 Feb 2019
29 Feb 2020
28 Feb 2021
28 Feb 2022
28 Feb 2023
29 Feb 2024
28 Feb 2025
28 Feb 2026
EBITDA xx xx xx xx xx xx xx xx xx xx
Movement in working capital xx xx xx xx xx xx xx xx xx xx
Project costs xx xx xx xx xx xx xx xx xx xx
VAT (paid)/received xx xx xx xx xx xx xx xx xx xx
Corporation tax xx xx xx xx xx xx xx xx xx xx
Cash flow from operations xx xx xx xx xx xx xx xx xx xx
Interest on deposit xx xx xx xx xx xx xx xx xx xx
Interest during construction xx xx xx xx xx xx xx xx xx xx
Cash flow before funding xx xx xx xx xx xx xx xx xx xx
Equity drawn xx xx xx xx xx xx xx xx xx xx
Senior debt drawn xx xx xx xx xx xx xx xx xx xx
Sub debt drawn xx xx xx xx xx xx xx xx xx xx
Continued

Cash flow available for debt service (CAFDS)
xx xx xx xx xx xx xx xx xx xx
Senior debt – interest xx xx xx xx xx xx xx xx xx xx
Senior debt – principal xx xx xx xx xx xx xx xx xx xx
Cash flow available before transfers to reserves
xx xx xx xx xx xx xx xx xx xx
Transfer (to)/from DSRA xx xx xx xx xx xx xx xx xx xx
Transfer (to)/from MRA xx xx xx xx xx xx xx xx xx xx
Cash flow available for subordinated investors
xx xx xx xx xx xx xx xx xx xx
Subordinated debt – interest xx xx xx xx xx xx xx xx xx xx
Subordinated debt – principal xx xx xx xx xx xx xx xx xx xx
Cash flow before dividends xx xx xx xx xx xx xx xx xx xx
Dividends xx xx xx xx xx xx xx xx xx xx
Cash flow CF xx xx xx xx xx xx xx xx xx xx
Closing cash balance xx xx xx xx xx xx xx xx xx xx
SuMMARY
Project specimen Case: base case
Source and use of funds Project returns Nominal Real Tariff
uS$ million
Amount financed Consortium Tariff base year price levels
xx/xx/xxxx
Energy charge (N/MWh) xx
Engineering procurement and construction
xx Equity IRR xx xx Capacity charge (N 000/MW/
month) xx
Planning and approval xx
Professional fees xx Equity and sub debt IRR
xx xx
Land acquisition xx
Infrastructure costs (water and so on) xx Senior lenders ratios Min Target min
Date of min Average
Transmission network connection xx
Fuel connection xx Annual debt service cover ratios
Other xx Forward x.xx x.xx 29 Feb 2016 x.xx
Bank fees xx Historic x.xx x.xx 31 Aug 2016 x.xx
Acquisition costs xx
Exhibit 2.11 continued
Continued

Sources of f inance
95
Interest during construction xx llCR x.xx x.xx 31 Aug 2016 x.xx
DSRA xx
MRA xx Key metrics
Total project costs xx Project payback date – undiscounted
xx/xx/xxxx
Project payback years – undiscounted
x.x years
Financed by Pre-financing real post tax – IRR
xx.xx%
Pre-financing real post tax – NPV $ million
xx.xx
Senior debt xx Equity payback date – undiscounted
xx/xx/xxxx
Subordinated debt xx Equity payback years – undiscounted
x.x years
Equity xx
Total xx
Check xx
Debt % xx
Equity % xx
MRA fully funded? xx
DRRA fully funded? xx
Max overdraft? xx
Source: Author’s own
Authorisation levels
The infrastructure investment fund drawdown of equity and payment of dividends will have to be authorised at the three levels shown below because of their materiality and criticalness to the fund’s success.
Board ALLChief Executive Officer ALLChief Financial Officer ALLFinance Analyst N/ABusiness Proposer N/A
Internal controls and assuranceThere is a key internal control check (that is, the bank accounts) for each investment manage-ment company given that cash will flow around the investment management companies to
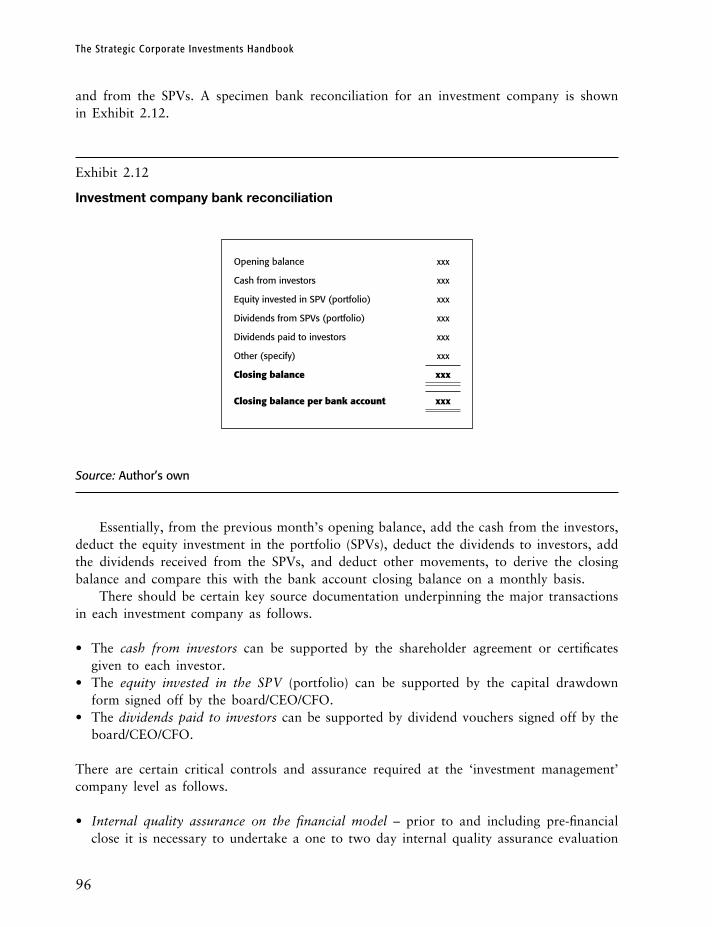
The Strategic Corporate Investments Handbook
96
and from the SPVs. A specimen bank reconciliation for an investment company is shown in Exhibit 2.12.
Exhibit 2.12
Investment company bank reconciliation
Opening balance xxx
Cash from investors xxx
Equity invested in SPV (portfolio) xxx
Dividends from SPVs (portfolio) xxx
Dividends paid to investors xxx
Other (specify) xxx
Closing balance xxx
Closing balance per bank account xxx
Source: Author’s own
Essentially, from the previous month’s opening balance, add the cash from the investors, deduct the equity investment in the portfolio (SPVs), deduct the dividends to investors, add the dividends received from the SPVs, and deduct other movements, to derive the closing balance and compare this with the bank account closing balance on a monthly basis.
There should be certain key source documentation underpinning the major transactions in each investment company as follows.
• The cash from investors can be supported by the shareholder agreement or certificates given to each investor.
• The equity invested in the SPV (portfolio) can be supported by the capital drawdown form signed off by the board/CEO/CFO.
• The dividends paid to investors can be supported by dividend vouchers signed off by the board/CEO/CFO.
There are certain critical controls and assurance required at the ‘investment management’ company level as follows.
• Internal quality assurance on the financial model – prior to and including pre-financial close it is necessary to undertake a one to two day internal quality assurance evaluation

Sources of f inance
97
prior to each update being released for internal decision making, investor evaluation and the lenders. An opinion would not be given.
• External financial model audit – prior to financial close and the drawdown of the funds required, each project will have an external audit opinion provided by a Big 4 accoun-tancy company.
• Management reporting and budgetary control – each investment management company should have monthly management reporting of actuals with variances to budget and commentaries and a budgetary control process.
• Internal controls and audit – each investment management company will have strong internal controls supported by internal audit compliance evaluation as expected of any company.
• External annual accounts audit – each investment management company will have an external annual audit opinion provided for its accounts signed off by a Big 4 accountancy company.
There are certain critical controls and assurance required at the SPV company level as follows.
• Internal controls and audit – each investment management company will have strong internal controls supported by internal audit compliance evaluation as expected of any company. This will be the responsibility of each SPV financial director or chief financial officer.
• Management reporting and budgetary control – each SPV should have monthly manage-ment reporting of actuals to budget with variances to budget and commentaries and a budgetary control process.
• External annual accounts audit – each investment management company will have an external annual audit opinion provided for its accounts signed off by a Big 4 accountancy company. This will be the responsibility of each SPV financial director or chief financial officer.
• Post-financial close reforecasts – a post-financial close projection model should be prepared by the lead consortium partner on either a three monthly or six monthly periodic basis. This output should state the actuals plus the reforecast compared with the original financial close position. The results should be made available to both the consortium partners and the senior lenders. This will be the responsibility of each SPV financial director or chief financial officer with support from the investment management company.
• Post-financial close reforecasts audit – for the first debt service period an audit opinion should be provided on the post-financial close project model version submitted to both the consortium partners and the senior lenders. This will be the responsibility of each SPV financial director or chief financial officer with support from the investment manage-ment company.
Risk management
Once the risks are identified they can be recorded in a risk register. An example of a risk register is shown in Exhibit 2.13. The risks that are measured before mitigation can be mitigated by the use of the appropriate risk management technique such interest rate risk management, exchange rate risk management, insurance or the transfer of the risks to another party better suited to manage it. The mitigated risks can be re-assessed using such mitigation techniques and recorded in the risk register.
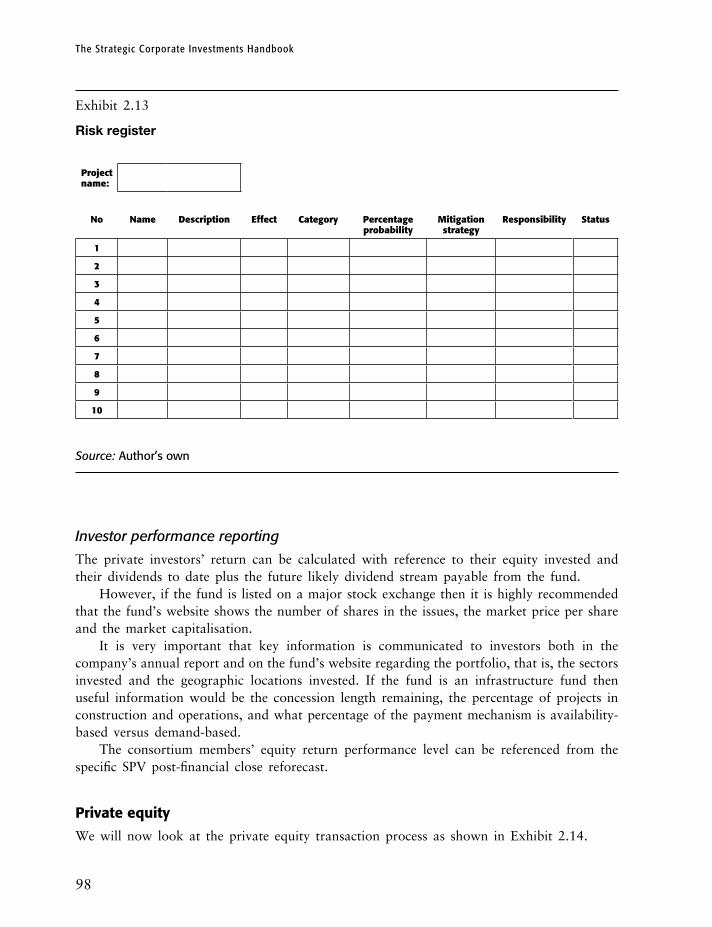
The Strategic Corporate Investments Handbook
98
Exhibit 2.13
Risk register
Project name:
No Name Description Effect Category Percentage probability
Mitigation strategy
Responsibility Status
1
2
3
4
5
6
7
8
9
10
Source: Author’s own
Investor performance reporting
The private investors’ return can be calculated with reference to their equity invested and their dividends to date plus the future likely dividend stream payable from the fund.
However, if the fund is listed on a major stock exchange then it is highly recommended that the fund’s website shows the number of shares in the issues, the market price per share and the market capitalisation.
It is very important that key information is communicated to investors both in the company’s annual report and on the fund’s website regarding the portfolio, that is, the sectors invested and the geographic locations invested. If the fund is an infrastructure fund then useful information would be the concession length remaining, the percentage of projects in construction and operations, and what percentage of the payment mechanism is availability-based versus demand-based.
The consortium members’ equity return performance level can be referenced from the specific SPV post-financial close reforecast.
Private equity
We will now look at the private equity transaction process as shown in Exhibit 2.14.

Sources of f inance
99
Exhibit 2.14
The private equity business model
Fund raising
Preliminary analysis andevaluation
Valuation
Structuring
Due diligence
Transaction
Post investment –performance management
Source: Author’s own
• Fund raising. This involves the process of the fund manager, that is, the general partner, creating a private equity fund through the investment of its limited partners who are typi-cally its investors. The capital is raised usually from private investors (wealthy families), companies, pension companies and financial institutions.
• Preliminary analysis and evaluation. The preliminary evaluation stage is all about devel-oping the initial dialogue between the management team and the private equity investment team. This will involve presentations and analysis by both parties.
• Valuation. The valuation process is the stage of placing a purchase price on the business target. There are various techniques that could be used to provide a range of the upper

The Strategic Corporate Investments Handbook
100
and lower valuation levels. Valuation techniques are demonstrated in this book – the techniques are an art not a science.
• Structuring. The transaction will need to be structured in terms of its long-term financial structures and usually for incentives for the management team with equity and bonuses based upon achieving certain performance targets.
• Due diligence. This is an independent evaluation of a target company on behalf of its potential investors. The scope of such an evaluation includes the business plan, material financial information and opinions. It is extremely important that any investor is aware of the potential risks and opportunities of the target company.
• Transaction. This is the stage of the process which includes the production of legal documentation in order to support the transaction. This may include the shareholders’ agreements, the lenders’ agreements and possibly an update of the management team’s remuneration package in order to incentivise. The key financial terms should, of course, be reflected in the financial forecasts and modelling.
• Post-investment. This involves the ongoing implementation of the business plan, refore-casts, budgeting and performance management. There will be methods of performance management between the investment team and the management team. This will involve a member of the investment team working with the portfolio company’s board of direc-tors. This will be facilitated through regular reporting and progress meetings between the portfolio company and the investment company.
• Exit strategy. This involves the shareholders in a portfolio company selling part or all of their holding. There are numerous methods of exit strategy which are available, such as initial public offering, sale to a corporate, secondary leveraged buyouts and recapitalisations.
Private equity is often a good source of funding for a growing private company seeking to expand. Private equity can be defined as a source of finance which provides equity capital for non-publicly traded companies. In a typical leveraged buyout deal the private equity company buys the majority of the private shareholding of an existing company. This can be differentiated from venture capital where the private equity company typically invests in start-up companies and does normally take a majority shareholding.
The corporate has the following advantages when undertaking a private equity based transaction.
• This type of funder will be committed to the business due to their vested interest and the need to make attractive returns on their exit.
• A private equity company has the ability to bring in valuable skills, contacts and experi-ence to the business. They often provide a member of the company who will sit on the board to assist the corporate with strategic decision making and direction.
• The private equity company will have an exit date in mind, which will allow the corporate to manage and grow a viable company from that date in the future.
The corporate has the following disadvantages when undertaking a private equity based transaction.
• It may be a time consuming process, such potential investors will seek information on the business and its past results, forecasts and plans.
Sources of f inance
101
• Due to a person from the private equity company sitting on the board the corporate is likely to lose decision making power.
• After projecting the target company’s financial position and ensuring that the lenders’ covenants are not breached, there is a requirement to ensure that the sponsor, typically the private equity company has sufficient returns given the equity contribution and the acquisition price of the company. Sponsors and private equity companies have typically looked for around 19% to 20% minimum returns on exit from the company. Although the private equity company may consider an exit strategy through IPOs or other strate-gies it is typical that the exit occurs through a sale in a three to seven year time frame. Consequently, a financial analysis from a sponsor’s viewpoint will consider the key variables of equity percentage, exit date, multiples and the effect upon the IRR.
Different types of private equity transaction
We will now outline the different types of private equity transactions and discuss how these may influence a financial analysis approach.
Buyout
The typical characteristics of a buyout transaction, are first that they are leveraged or that they have a high debt to equity ratio. Also, a buyout transaction is typically undertaken in mature or declining markets. The shareholder stake that the private equity investor will normally take is that of a majority shareholder.
Development capital
The typical characteristic of a development capital opportunity, is first that they are not leveraged with debt. Also, a development capital transaction is typically undertaken in mature or declining markets. The shareholder stake that the private equity investor will normally take is that of a minority shareholder.
Growth capital
The typical characteristic of a growth capital opportunity, is first that they are not lever-aged with debt. Also, a growth capital transaction is typically undertaken in growth markets. The shareholder stake that the private equity investor will normally take is that of a minority shareholder.
Venture capital
The typical characteristic of a venture capital opportunity, is first that they are not leveraged with debt. Also, a venture capital transaction is typically undertaken in new markets. The shareholder stake that the private equity investor will normally take is that of a minority shareholder.

The Strategic Corporate Investments Handbook
102
Turnaround capital
This is where a company is underperforming or has a distressed debt position. There is no real set parameter for the funding structure here. Things really need to be done on a case by case approach ensuring financial viability.
Buyout capital financial analysis implications
A buyout company transaction will have financial history, a current EBITDA, the ability to forecast its EBITDA, a current actual profit and loss balance sheet and cash flow. It is likely to be in the position that comparable company data is available in the industry and, therefore, reasonable EBITDA multiples can be applied to existing and future EBITDA levels. Here, the company needs to be valued at the buyout stage and a funding structure applied to financially plan and control the company over the investment period until exit in three to five years. The ultimate return will be determined upon the exit of the investment less the net debt.
Development capital financial analysis implications
A development capital transaction will have financial history, a current EBITDA, the ability to forecast its EBITDA, a current actual profit and loss balance sheet and cash flow. It is likely to be in the position that comparable company data is available in the industry and, therefore, reasonable EBITDA multiples can be applied to existing and future EBITDA levels. Here, the company needs to be valued at the development capital stage and a funding struc-ture applied which would typically involve a minority capital injection, to financially plan and control the company over the investment period until exit in three to five years. The ultimate return will be determined upon exit of the investment less the net debt.
Growth capital financial analysis implications
A growth capital transaction may not have financial history, a current EBITDA, a current actual profit and loss balance sheet and cash flow. Of course, there will be the need to undertake financial projections from a zero base with no previous trading position.
Comparable company data is unlikely to be available in the industry and, therefore, reasonable EBITDA multiples can be applied for valuation purposes. Here, the company needs to be valued at the growth capital stage and a funding structure applied which would typically involve a minority capital injection, to financially plan and control the company over the investment period until exit in three to five years. The ultimate return will be determined upon exit of the investment less the net debt.
Growth capital is often structured as either preference shares or equity, although certain investors will use various debt structures for the company. Often, companies that look for growth capital funding are not good candidates to borrow additional debt, either because of the stability and indeed potential volatility of the company’s earnings or because of its existing debt levels.

Sources of f inance
103
Venture capital financial analysis implications
A venture capital transaction will not have financial history, a current EBITDA, a current actual profit and loss balance sheet and cash flow. Of course, there will be the need to undertake financial projections from a zero base with no previous trading position.
Comparable company data is unlikely to be available in the industry and, therefore, reasonable EBITDA multiples cannot be applied for valuation purposes. Here, the company needs to be valued at the start-up stage and a funding structure applied which would typi-cally involve a minority capital injection, to financially plan and control the company over the investment period until exit in three to five years. The ultimate return will be determined upon exit of the investment less the net debt.
An important aspect of the venture capital investment process is the valuation of the business seeking outside investment. For such early stage companies we can use traditional company valuation methods.
Secondary private equity transaction
This occurs when a company within a buyout fund is purchased by another buyout fund rather than a corporate buyer. Sellers of private equity investments sell not only the invest-ments in the funds but also their remaining commitments to the funds. A simple secondary market sale of a limited partnership fund is when the buyer exchanges a simple cash payment to the seller for both the investments in the fund as committed and undrawn commitments to the funds. However, other commercial and funding structures can also be adopted.
A significant amount of funding is committed to secondary market funds from private equity investors who seek to enhance their private equity investments.
From a financial modelling and analysis viewpoint, financial due diligence must be under-taken of the actual position and financial forecasts of the portfolio or fund.
The secondary market can typically comprise any type of private equity transaction, that is, venture capital, leverage buyouts, distressed debts and so on.
Recapitalisation
Recapitalisation is the event when a company has more earnings and/or cash flow than was originally envisaged, equity is repaid to the investors and, if funding is required, replaced with new debt. This is an exit strategy that increases the IRR to the private equity and allows an early exit. Some or all of the equity is released back to the buyout fund and replaced with debt. This transaction usually has the effect of a double hit for the private equity investor; first, a positive cash flow is received earlier than expected thus increasing the expected IRR, and then the multiple made on the final exit is increased.

Exhibit 2.15
Summary pre-recapitalisation
SuMMARY
Pre-recapitalisation
Sponsors returns Exit year IRR
3 105.3%
4 74.4%
5 59.1%
6 50.2%
7 44.6%
Equity valuation at entry
Entry year EBITDA 5.3
Entry year EBITDA multiple 7.5
39.7
less Debt –2
plus Cash 15.3
Equity price 53.0
Sources and uses of funds
Sources of funds
Debt 31.0 60.0%
Equity contribution 20.7 40.0%
Cash on hand 15.3
67.0 100.0%
uses of funds
Purchase of existing equity 53.0
Repayment of existing debt 2.0
Upfront fees 12.0
67.0
Check 0.0
lenders credit ratios Target
ok Target min
Debt to EBITDA – max 104.7% 60.00%
ok Target max
Debt to net assets – max 32.0% 90.00%
ok Target min
Interest cover – min 13.4 2.0
Year of min/max Average
Debt to EBITDA – max 31 Dec 2011 57.8%
Continued
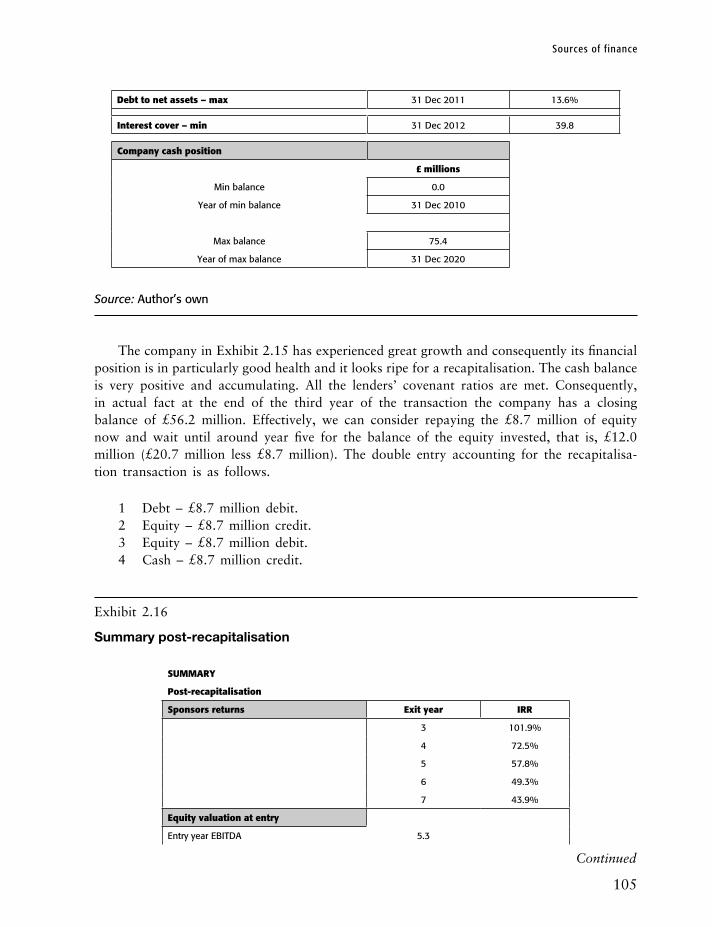
Sources of f inance
105
Debt to net assets – max 31 Dec 2011 13.6%
Interest cover – min 31 Dec 2012 39.8
Company cash position
£ millions
Min balance 0.0
Year of min balance 31 Dec 2010
Max balance 75.4
Year of max balance 31 Dec 2020
Source: Author’s own
The company in Exhibit 2.15 has experienced great growth and consequently its financial position is in particularly good health and it looks ripe for a recapitalisation. The cash balance is very positive and accumulating. All the lenders’ covenant ratios are met. Consequently, in actual fact at the end of the third year of the transaction the company has a closing balance of £56.2 million. Effectively, we can consider repaying the £8.7 million of equity now and wait until around year five for the balance of the equity invested, that is, £12.0 million (£20.7 million less £8.7 million). The double entry accounting for the recapitalisa-tion transaction is as follows.
1 Debt – £8.7 million debit.2 Equity – £8.7 million credit.3 Equity – £8.7 million debit.4 Cash – £8.7 million credit.
Exhibit 2.16
Summary post-recapitalisation
SuMMARY
Post-recapitalisation
Sponsors returns Exit year IRR
3 101.9%
4 72.5%
5 57.8%
6 49.3%
7 43.9%
Equity valuation at entry
Entry year EBITDA 5.3
Continued
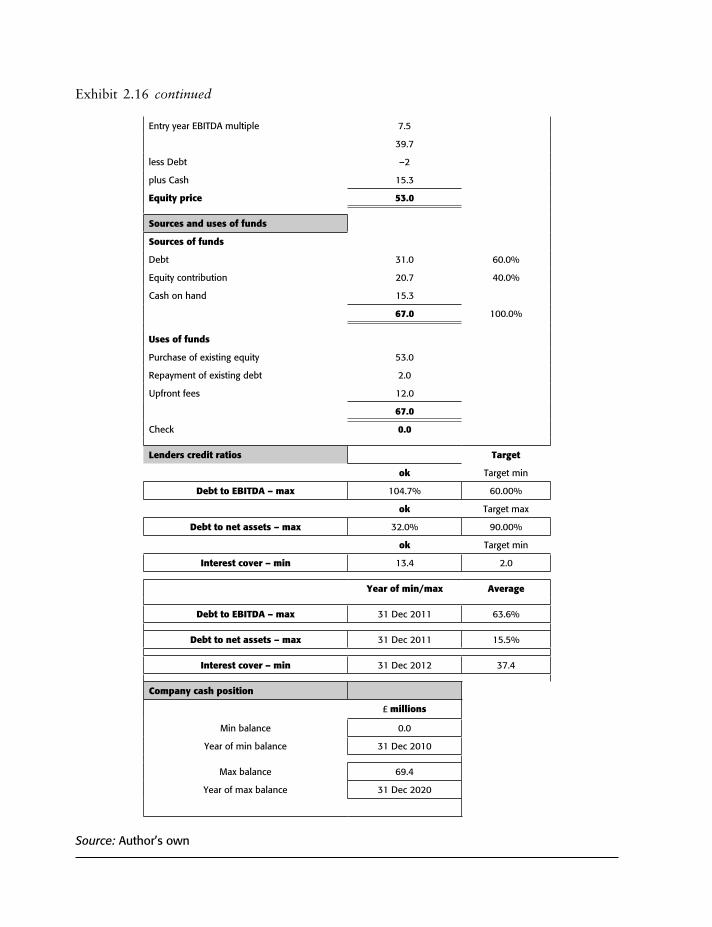
Entry year EBITDA multiple 7.5
39.7
less Debt –2
plus Cash 15.3
Equity price 53.0
Sources and uses of funds
Sources of funds
Debt 31.0 60.0%
Equity contribution 20.7 40.0%
Cash on hand 15.3
67.0 100.0%
uses of funds
Purchase of existing equity 53.0
Repayment of existing debt 2.0
Upfront fees 12.0
67.0
Check 0.0
lenders credit ratios Target
ok Target min
Debt to EBITDA – max 104.7% 60.00%
ok Target max
Debt to net assets – max 32.0% 90.00%
ok Target min
Interest cover – min 13.4 2.0
Year of min/max Average
Debt to EBITDA – max 31 Dec 2011 63.6%
Debt to net assets – max 31 Dec 2011 15.5%
Interest cover – min 31 Dec 2012 37.4
Company cash position
£ millions
Min balance 0.0
Year of min balance 31 Dec 2010
Max balance 69.4
Year of max balance 31 Dec 2020
Source: Author’s own
Exhibit 2.16 continued

Sources of f inance
107
An assumption is that there is an increase in the debt balance by the new debt raised. The debt is swapped for equity. The equity balance will be reduced by repaying the equity to the private equity company.
The cash flow will show senior debt raised in the year 31 December 2013 of £8.7 million and the repayment of the equity of £8.7 million.
In summary, we can see that the lenders’ credit ratios have reached the required targets. The company’s cash position is indeed healthy at a minimum of £0 million in 2010 and a maximum of £69.4 million.
In essence, we need to ensure that we have a financially viable company post-recapitalisation.
Project finance as a source of funding
The definition of project finance which is outlined below is taken from that provided by the International Project Finance Association.
The financing of long-term infrastructure, industrial projects and public services based upon a non-recourse or limited recourse financial structure where project debt and equity are used to finance the project are paid back from the cash flow generated by the project.
Project finance is a source of non-recourse or limited recourse finance whereby the project debt is secured by the project assets and secured by the project cash flows. The benefits to the corporate lender or the project sponsor are as follows.
• It helps to keep the debt off the balance sheet and does not increase the corporate gearing ratio.
• A lower potential cost of financing. • It protects the corporate debt capacity.• It protects the corporate assets from project risk.• Projects that may be too big for one party will allow financing to be provided by the
project’s partners as equity or a syndicate of banks as senior lenders.• It allows overseas business ventures.
There are certain risks that are inherent in a project finance transaction which need to be mitigated through the allocation of risk through various mechanisms and contractual arrange-ments. The following typical risks can be mitigated or reduced in the following ways.
• Construction phase risk > sponsor completion guarantees or construction risk insurance.• Operational phase risk > government guarantees minimum volumes.• Technological risk > proven technology.• Currency risk > hedging or back to back contracts.• Political risk > insurance or stable country.• Force majeure risk > insurance.
A typical project finance contract structure for a design build finance and operate project is shown in Exhibit 2.17.

The Strategic Corporate Investments Handbook
108
Exhibit 2.17
A typical project finance contractual structure – design build finance and operate
Sub debt andequity
Consortium
Blended returns
Debt
SeniorLenders
Syndicate
Debt servicing
SpecialPurposeCompany
Project agreement
Unitary payment
PublicSector Body
Design andBuildContractors
Construction
FacilitiesManagementContractors
Services
Source: Author’s own
The typical key outputs that are used to make a decision regarding an infrastructure project financing are as follows. We will now discuss the logic behind each of the output metrics included in Exhibit 2.18.
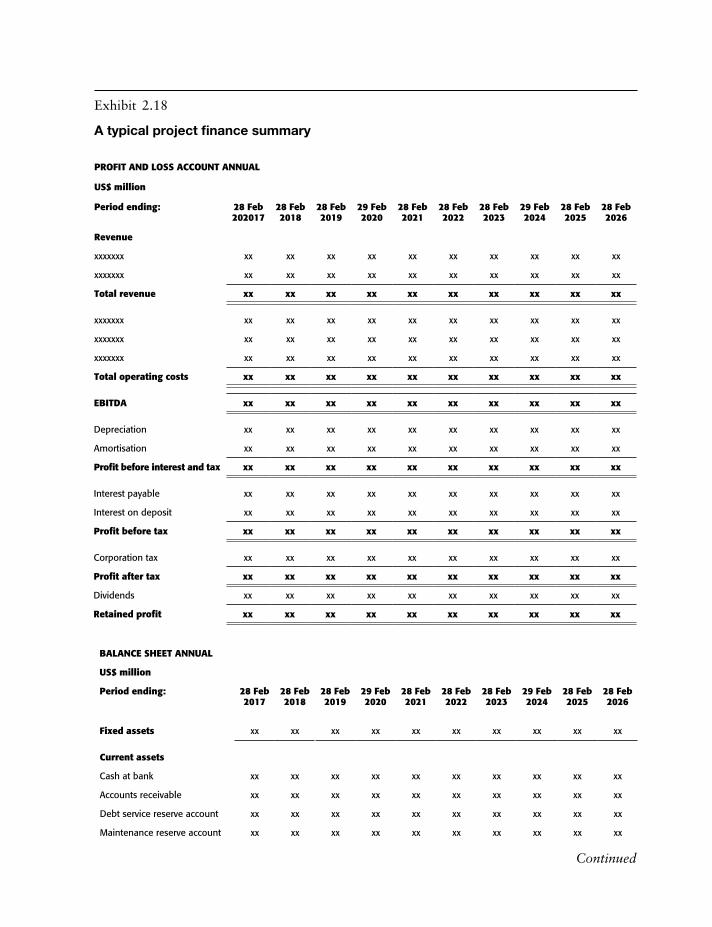
Exhibit 2.18
A typical project finance summary
PROFIT AND lOSS ACCOuNT ANNuAl
uS$ million
Period ending: 28 Feb 202017
28 Feb 2018
28 Feb 2019
29 Feb 2020
28 Feb 2021
28 Feb 2022
28 Feb 2023
29 Feb 2024
28 Feb 2025
28 Feb 2026
Revenue
xxxxxxx xx xx xx xx xx xx xx xx xx xx
xxxxxxx xx xx xx xx xx xx xx xx xx xx
Total revenue xx xx xx xx xx xx xx xx xx xx
xxxxxxx xx xx xx xx xx xx xx xx xx xx
xxxxxxx xx xx xx xx xx xx xx xx xx xx
xxxxxxx xx xx xx xx xx xx xx xx xx xx
Total operating costs xx xx xx xx xx xx xx xx xx xx
EBITDA xx xx xx xx xx xx xx xx xx xx
Depreciation xx xx xx xx xx xx xx xx xx xx
Amortisation xx xx xx xx xx xx xx xx xx xx
Profit before interest and tax xx xx xx xx xx xx xx xx xx xx
Interest payable xx xx xx xx xx xx xx xx xx xx
Interest on deposit xx xx xx xx xx xx xx xx xx xx
Profit before tax xx xx xx xx xx xx xx xx xx xx
Corporation tax xx xx xx xx xx xx xx xx xx xx
Profit after tax xx xx xx xx xx xx xx xx xx xx
Dividends xx xx xx xx xx xx xx xx xx xx
Retained profit xx xx xx xx xx xx xx xx xx xx
BAlANCE SHEET ANNuAl
uS$ million
Period ending: 28 Feb 2017
28 Feb 2018
28 Feb 2019
29 Feb 2020
28 Feb 2021
28 Feb 2022
28 Feb 2023
29 Feb 2024
28 Feb 2025
28 Feb 2026
Fixed assets xx xx xx xx xx xx xx xx xx xx
Current assets
Cash at bank xx xx xx xx xx xx xx xx xx xx
Accounts receivable xx xx xx xx xx xx xx xx xx xx
Debt service reserve account xx xx xx xx xx xx xx xx xx xx
Maintenance reserve account xx xx xx xx xx xx xx xx xx xx
Continued
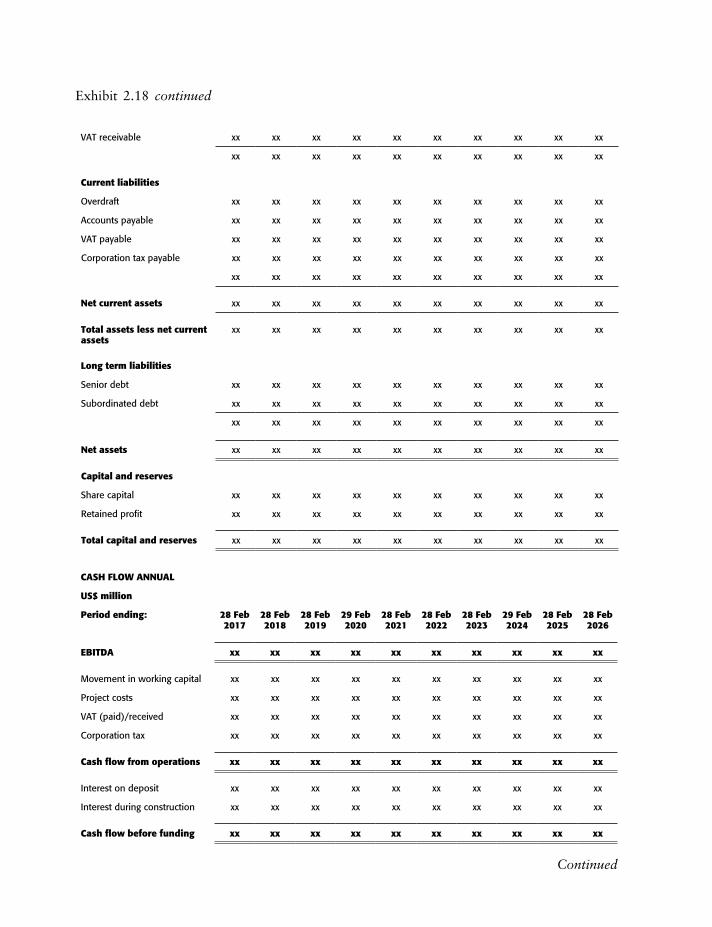
VAT receivable xx xx xx xx xx xx xx xx xx xx
xx xx xx xx xx xx xx xx xx xx
Current liabilities
Overdraft xx xx xx xx xx xx xx xx xx xx
Accounts payable xx xx xx xx xx xx xx xx xx xx
VAT payable xx xx xx xx xx xx xx xx xx xx
Corporation tax payable xx xx xx xx xx xx xx xx xx xx
xx xx xx xx xx xx xx xx xx xx
Net current assets xx xx xx xx xx xx xx xx xx xx
Total assets less net current assets
xx xx xx xx xx xx xx xx xx xx
long term liabilities
Senior debt xx xx xx xx xx xx xx xx xx xx
Subordinated debt xx xx xx xx xx xx xx xx xx xx
xx xx xx xx xx xx xx xx xx xx
Net assets xx xx xx xx xx xx xx xx xx xx
Capital and reserves
Share capital xx xx xx xx xx xx xx xx xx xx
Retained profit xx xx xx xx xx xx xx xx xx xx
Total capital and reserves xx xx xx xx xx xx xx xx xx xx
CASH FlOw ANNuAl
uS$ million
Period ending: 28 Feb 2017
28 Feb 2018
28 Feb 2019
29 Feb 2020
28 Feb 2021
28 Feb 2022
28 Feb 2023
29 Feb 2024
28 Feb 2025
28 Feb 2026
EBITDA xx xx xx xx xx xx xx xx xx xx
Movement in working capital xx xx xx xx xx xx xx xx xx xx
Project costs xx xx xx xx xx xx xx xx xx xx
VAT (paid)/received xx xx xx xx xx xx xx xx xx xx
Corporation tax xx xx xx xx xx xx xx xx xx xx
Cash flow from operations xx xx xx xx xx xx xx xx xx xx
Interest on deposit xx xx xx xx xx xx xx xx xx xx
Interest during construction xx xx xx xx xx xx xx xx xx xx
Cash flow before funding xx xx xx xx xx xx xx xx xx xx
Exhibit 2.18 continued
Continued

Equity drawn xx xx xx xx xx xx xx xx xx xx
Senior debt drawn xx xx xx xx xx xx xx xx xx xx
Sub debt drawn xx xx xx xx xx xx xx xx xx xx
Cash flow available for debt service (CAFDS) xx xx xx xx xx xx xx xx xx xx
Senior debt – interest xx xx xx xx xx xx xx xx xx xx
Senior debt – principal xx xx xx xx xx xx xx xx xx xx
Cash flow available before transfers to reserves xx xx xx xx xx xx xx xx xx xx
Transfer (to)/from DSRA xx xx xx xx xx xx xx xx xx xx
Transfer (to)/from MRA xx xx xx xx xx xx xx xx xx xx
Cash flow available for subordinated investors xx xx xx xx xx xx xx xx xx xx
Subordinated debt – interest xx xx xx xx xx xx xx xx xx xx
Subordinated debt – principal xx xx xx xx xx xx xx xx xx xx
Cash flow before dividends xx xx xx xx xx xx xx xx xx xx
Dividends xx xx xx xx xx xx xx xx xx xx
Cash flow CF xx xx xx xx xx xx xx xx xx xx
Closing cash balance xx xx xx xx xx xx xx xx xx xx
SuMMARY
Project specimen Case: base case
Source and use of funds Project returns Nominal Real Tariff
uS$ million xx/xx/xxxx
Amount financed Consortium xx xx Tariff base year price levels
xx
Engineering procurement and construction
Equity IRR Energy charge (N/MWh)
xx
Planning and approval xx Equity and sub debt IRR xx xx Capacity charge (N 000/MW/
month)
xx
Professional fees xx
Land acquisition xx Senior lenders ratios Min Target min
Date of min Average
Infrastructure costs (water and so on)
xx Annual debt service cover ratios
x.xx x.xx
Transmission network connection xx Forward x.xx x.xx 29 Feb 2016 x.xx
Fuel connection xx Historic x.xx x.xx 31 Aug 2016 x.xx
Other xx llCR x.xx x.xx 31 Aug 2016 x.xx
Continued

The Strategic Corporate Investments Handbook
112
Bank fees xx
Acquisition costs xx Key metrics
Interest during construction xx Project payback date – undiscounted
xx/xx/xxxx
DSRA xx Project payback years – undiscounted
x.x years
MRA xx Pre-financing real post tax – IRR
xx.xx%
Total project costs xx Pre-financing real post tax – NPV $m
xx.xx
Financed by Equity payback date – undiscounted
xx/xx/xxxx
Senior debt xx Equity payback years – undiscounted
x.x years
Subordinated debt
Equity xx
Total xx
Check xx
Debt % xx
Equity % xx
MRA fully funded? xx
DRRA fully funded? xx
Max overdraft? xx
Source: Author’s own
• Project IRR before tax. The project IRR represents the internal rate of return where the NPV of the pre-financing cash flows before tax equals zero.
• Project IRR after tax. The project IRR represents the internal rate of return where the NPV of the pre-financing cash flows after tax equals zero.
• Equity IRR. The equity IRR represents the IRR where the NPV of the equity cash flows after tax equals zero. Essentially the equity net cash flow represents the dividend received in relation to the equity investment made.
• Equity and sub debt IRR. The equity IRR represents the internal rate of return where the NPV of the equity and shareholder loan cash flows after tax equals zero. Essentially the equity net cash flow represents the dividend received in relation to the equity investment made plus the interest and principal received in relation to the debt advanced.
• Real tariff per month. The amount of the tariff paid by the government is represented in real terms, that is, at the current price levels.
• ADSCR – forward. The forward annual debt service cover ratio (ADSCR) is equal to the current six monthly period plus the next six monthly period at each six monthly.
Exhibit 2.18 continued
Sources of f inance
113
• ADSCR – historic. The historic annual debt service cover ratio is equal to the current six monthly period plus the next six monthly period at each six monthly.
• LLCR. The loan life cover ratio (LLCR) is the ratio of the NPV of cash available for debt service during the term of the senior debt to the outstanding balance of the senior debt. This is calculated at each six monthly interval and is represented as both a minimum and an average. The target minimum is compared with this output result accordingly.
• PLCR. The project life cover ratio (PLCR) is the ratio of the NPV of cash available for debt service during the life of the project to the outstanding balance of the senior debt. This is calculated at each six monthly interval and is represented as both a minimum and an average. The target minimum is compared with this output result accordingly.
Material and key project finance areas
There are certain other key project finance areas that are worthy of discussion as follows.
Reserve accounts
The project finance lenders’ agreements usually ask for cash reserve accounts to be maintained to ensure that critical items, such as debt service capacity (debt service reserve accounts) and maintaining the asset (maintenance reserve accounts), are provided for in cash terms. There can be other cash accounts such as change in laws reserve accounts and so on. These are all based upon cash transfers or cash release in order to meet the defined targets as per the lenders’ agreements. The difference between the opening and closing balance is transferred from or to the cash account to meet the requirement.
Dividends
Dividends are the payments made to the investors of equity in project finance transactions. Prior to distribution of any dividend, there are restrictions placed on the special purpose
company in terms of the dividend lock ups that may be triggered by virtue of the restrictive covenants that may be found in the lenders’ agreement and the facility agreement. There are often minimum ADSCR and LLCR levels that must be met in the six monthly period, and perhaps the need to meet the maintenance reserve requirements. The cash available for dividends is calculated as follows.
Opening cash balance (per the balance sheet)
plus
Cash flow generated in the period prior to dividends (per the cash flow)
Opening retained earnings (per the balance sheet)
plus
Profit before dividends (per the profit and loss account)

The Strategic Corporate Investments Handbook
114
The dividend declared per the profit and loss account ensures that the cash available is paid out to the extent that there are sufficient distributable reserves available, that is, retained earnings. For simplicity, given that we are working at a six monthly level the profit and loss account and cash flow entries are amended to be the same.
Financial asset accounting
An important starting point is to determine whether the private sector operator has an asset of the property used to provide the contracted services, or alternatively a financial asset being a debt due from the public sector body for the fair value of the property. This asset should be recorded at the outset and reduced in subsequent years as payments are received from the purchaser. Finance income on this financial asset should be recorded in subsequent years using a property specific rate. The remainder of the tariff payments (that is, the full payments, less the capital repayment and the imputed financial charge) should be recorded as operating profit. Under IFRS (IFRIC 12), there is an initial assessment of who has the benefits and risks of the property, taking into account the potential variations in property profits.
The type of areas that will help to lead to the conclusion that the property is the asset of the private sector operator is as follows. However, it should be noted that the general accounting treatment adopted for the special purpose company is that of ‘financial asset accounting’.
The following characteristics are usually evident where the private sector operator recog-nises the property as a fixed asset in their books. This will help demonstrate why the vast majority of PPPs or project financings are being accounted for as a financial asset. First, there are often potential penalties for underperformance of the property which can be significant and have a reasonable possibility of occurring. Second, relevant costs are both significant and highly uncertain, and all potential material cost variations will be borne by the private sector operator. Third, obsolescence or changes in technology are significant and the public sector contractor will bear the costs and any associated risks. Fourth, when the residual risk is significant and borne by the private sector operator. Also, when the years of the PFI contract are materially less than the useful economic life of the property. In most UK design build finance and operate contracts, these types of arrangements do not generally hold true, therefore financial asset accounting is adopted.
However, we know from our financial close position that we need to account for a financial asset. Again under IFRIC 12 (IFRS), there is an initial assessment of who has the benefits and risks of the property, taking into account the potential variations in property profits. The points that are considered above will again be relevant. Where it is concluded that the operator has an asset of the property, they should record this asset in their balance sheet. This asset should be recorded at its cost and then depreciated to its expected residual value over its economic useful life.
Revenue recognition
Revenue is recognised in line with the operating costs’ charge to the profit and loss account, that is, simply apply the mark up to the costs as the assumptions. The finance or contract debtor interest is also a source of revenue.

115
Chapter 3
Corporate investment decisions
Disposals
The ingredients for a successful sale of a company include the price achieved, structuring the consideration package, company valuations, due diligence and a well prepared information memorandum. The role of the financial advisor will be to ensure that all bidders for the company engage in a competitive process.
When undertaking a disposal, the accounting treatment that should be observed should be IFRS. The material areas of IFRS 5 Relating to Discontinued Operations which should be addressed when accounting and planning for disposals are as follows.
Classification as discontinuing. A discontinued operation is a component of an entity that either has been disposed of or is classified as held for sale, and:
• represents either a separate major line of business or a geographical area of operations; and • is part of a single co-ordinated plan to dispose of a separate major line of business or
geographical area of operations; or • is a subsidiary acquired exclusively with a view to resale and the disposal involves loss
of control.
Income statement. The sum of the post-tax profit or loss of the discontinued operation and the post-tax gain or loss recognised on the measurement to fair value, less cost to sell or fair value adjustments on the disposal of the assets (or disposal group), should be presented as a single amount on the face of the statement of comprehensive income. If the entity presents profit or loss in a separate income statement, a section identified as relating to discontinued operations is presented in that separate statement. This effectively means that the discontinued profit and loss items should be shown up to the disposal date and the gain or loss or disposal shown.
Detailed disclosure of revenue, expenses, pre-tax profit or loss and related income taxes is required either in the notes or in the statement of comprehensive income in a section distinct from continuing operations. Such detailed disclosures must cover both the current and all prior periods presented in the financial statements. This effectively means that the discontinued cash flow items should be shown up to the disposal date.
Detailed notes and disclosures should not concern us at the financial planning and analysis stage.
Cash flow statement. The net cash flows attributable to the operating, investing and financing activities of a discontinued operation should be separately presented on the face of the cash flow statement or disclosed in the notes. Detailed notes and disclosures should not concern us at the financial planning and analysis stage.

The Strategic Corporate Investments Handbook
116
Balance sheet. The net assets at fair value should be excluded from the balance sheet from the date of disposal.
We will now turn our attention to a disposal example as shown in Example 3.1.
Exhibit 3.1
Disposals
PROFIT AND lOSS ACCOuNT
Consolidated
Period ending/year ending
31 Dec 2011
31 Jan 2012
29 Feb 2012
31 Mar 2012
30 Apr 2012
31 May 2012
30 Jun 2012
31 Jul 2012
31 Aug 2012
30 Sept 2012
Forecast – £ million
Sales 300.0 303.0 306.0 206.1 104.1 105.1 106.2 107.2 108.3 109.4
Cost of sales 150.0 151.5 153.0 103.0 52.0 52.6 53.1 53.6 54.1 54.7
Gross profit 150.0 151.5 153.0 103.0 52.0 52.6 53.1 53.6 54.1 54.7
Operating expenses 61.5 63.0 64.6 44.2 22.6 23.2 23.8 24.4 25.0 25.6
EBITDA 88.5 88.5 88.4 58.9 29.4 29.4 29.3 29.2 29.2 29.1
Depreciation 9.7 9.7 9.7 6.5 3.2 3.2 3.2 3.2 3.2 3.2
Amortisation – arrangement fees
0.2 0.2 0.2 0.2 0.1 0.0 0.0 0.0 0.0 0.0
EBIT 78.6 78.5 78.5 52.3 26.1 26.1 26.1 26.0 25.9 25.9
Cash interest/(expense) 0.9 1.4 2.0 1.7 1.0 1.1 1.3 1.5 1.7 1.9
Interest – shareholder loan 3.9 3.3 2.5 1.1 0.3 0.0 0.0 0.0 0.0 0.0
Interest – senior debt 3.1 3.0 2.2 1.0 0.2 0.0 0.0 0.0 0.0 0.0
Profit/(loss) on disposal of subs
0.0 0.0 0.0 –72.5 –3.2 0.0 0.0 0.0 0.0 0.0
EBT 72.5 73.7 75.8 –20.6 23.4 27.3 27.4 27.6 27.7 27.7
Tax 21.3 21.2 21.0 13.8 7.0 7.2 7.3 7.3 7.3 7.4
Earnings after tax 51.2 52.5 54.8 –34.4 16.4 20.1 20.2 20.3 20.3 20.4
Dividends
Earning retained for the period 51.2 52.5 54.8 –34.4 16.4 20.1 20.2 20.3 20.3 20.4
CASH FlOw
Consolidated
Period ending/year ending
31 Dec 2011
31 Jan
2012
29 Feb
2012
31 Mar 2012
30 Apr
2012
31 May 2012
30 Jun
2012
31 Jul
2012
31 Aug 2012
30 Sept 2012
Forecast – £ million
EBITDA 88.5 88.5 88.4 58.9 29.4 29.4 29.3 29.2 29.2 29.1
Movement in working capital (increase/(decrease) in cash flow) –29.4 –0.5 –0.5 –0.3 –0.2 –0.2 –0.2 –0.2 –0.2 –0.2
Continued

Taxes paid –13.9 –21.3 –21.2 –14.0 –6.9 –7.0 –7.2 –7.3 –7.3 –7.3
VAT (paid)/received 3.4 5.9 5.9 3.9 2.0 2.0 2.0 1.9 1.9 1.9
Cash flow from operating activities 48.6 72.5 72.6 48.5 24.3 24.1 23.9 23.8 23.6 23.5
Capital expenditure –36.9 0.0 0.0 0.0 0.0 0.0 0.0 0.0 0.0 0.0
11.7 72.5 72.6 48.5 24.3 24.1 23.9 23.8 23.6 23.5
Net cash interest income/(expense) 0.9 1.4 2.0 1.7 1.0 1.1 1.3 1.5 1.7 1.9
Cash flow available for debt service 12.6 74.0 74.7 50.2 25.3 25.3 25.2 25.3 25.4 25.4
Sale of subsidiaries 0.0 0.0 0.0 100.0 110.0 0.0 0.0 0.0 0.0 0.0
Shareholders’ loan drawn 3.5 0.0 0.0 0.0 0.0 0.0 0.0 0.0 0.0 0.0
Senior debt drawn 18.5 0.0 0.0 0.0 0.0 0.0 0.0 0.0 0.0 0.0
Equity drawn 15.0 0.0 0.0 0.0 0.0 0.0 0.0 0.0 0.0 0.0
Shareholders’ loan principal –5.6 –5.6 –5.6 –3.7 –1.9 0.0 0.0 0.0 0.0 0.0
Senior debt principal –11.0 –11.0 –11.0 –7.3 –3.7 0.0 0.0 0.0 0.0 0.0
Shareholders’ loan – interest –3.9 –3.3 –2.5 –1.1 –0.3 0.0 0.0 0.0 0.0 0.0
Senior debt – interest –3.1 –3.0 –2.2 –1.0 –0.2 0.0 0.0 0.0 0.0 0.0
Shareholders’ loan – fees –0.1 0.0 0.0 0.0 0.0 0.0 0.0 0.0 0.0 0.0
Senior debt – fees –0.3 0.0 0.0 0.0 0.0 0.0 0.0 0.0 0.0 0.0
Cash flow available for shareholders 25.7 51.2 53.5 137.1 129.3 25.3 25.2 25.3 25.4 25.4
Dividends paid
Change in cash and cash equivalents 25.7 51.2 53.5 137.1 129.3 25.3 25.2 25.3 25.4 25.4
BAlANCE SHEET
Consolidated
Period ending/year ending
31 Dec 2010
31 Dec 2011
31 Jan
2012
29 Feb
2012
31 Mar 2012
30 Apr
2012
31 May 2012
30 Jun
2012
31 Jul
2012
31 Aug 2012
30 Sept 2012
Actual – £
million
Forecast – £ million
Fixed assets – net book value 60.0 87.3 102.1 117.4 34.6 11.9 8.7 5.5 2.3 0.0 0.0
Capitalised arrangement fees 0.9 1.0 0.7 0.5 0.2 0.0 0.0 0.0 0.0 0.0 0.0
Current assets 0.0 0.0 0.0 0.0 0.0 0.0 0.0 0.0 0.0 0.0 0.0
Cash 45.8 71.6 122.7 176.2 254.5 306.5 331.8 357.0 382.3 407.7 433.1
Accounts receivable 13.6 24.7 24.9 25.2 16.9 8.6 8.6 8.7 8.8 8.9 9.0
Continued
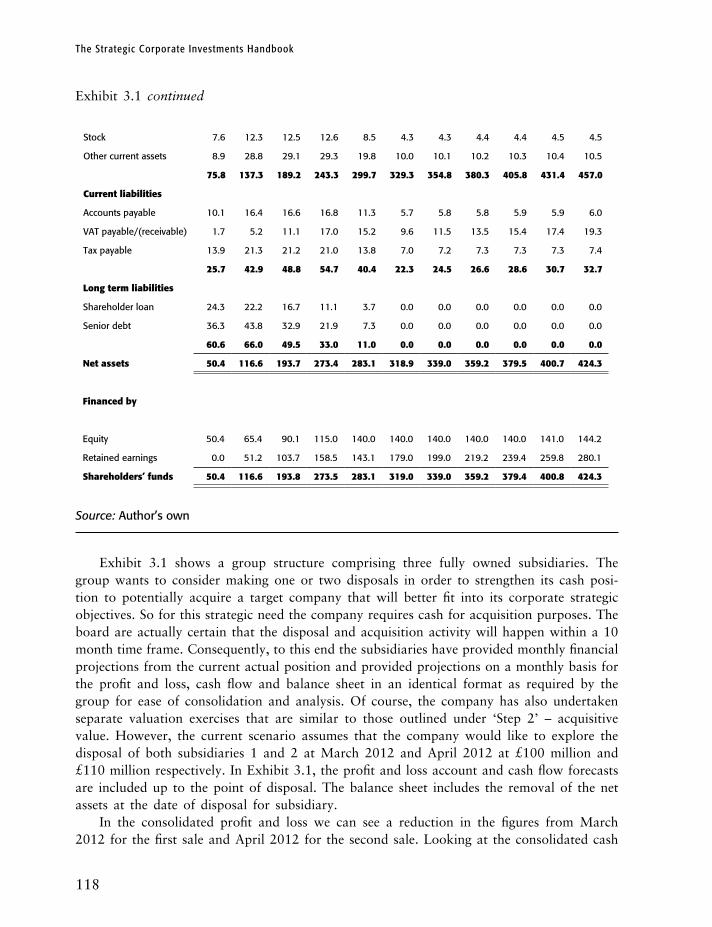
The Strategic Corporate Investments Handbook
118
Stock 7.6 12.3 12.5 12.6 8.5 4.3 4.3 4.4 4.4 4.5 4.5
Other current assets 8.9 28.8 29.1 29.3 19.8 10.0 10.1 10.2 10.3 10.4 10.5
75.8 137.3 189.2 243.3 299.7 329.3 354.8 380.3 405.8 431.4 457.0
Current liabilities
Accounts payable 10.1 16.4 16.6 16.8 11.3 5.7 5.8 5.8 5.9 5.9 6.0
VAT payable/(receivable) 1.7 5.2 11.1 17.0 15.2 9.6 11.5 13.5 15.4 17.4 19.3
Tax payable 13.9 21.3 21.2 21.0 13.8 7.0 7.2 7.3 7.3 7.3 7.4
25.7 42.9 48.8 54.7 40.4 22.3 24.5 26.6 28.6 30.7 32.7
long term liabilities
Shareholder loan 24.3 22.2 16.7 11.1 3.7 0.0 0.0 0.0 0.0 0.0 0.0
Senior debt 36.3 43.8 32.9 21.9 7.3 0.0 0.0 0.0 0.0 0.0 0.0
60.6 66.0 49.5 33.0 11.0 0.0 0.0 0.0 0.0 0.0 0.0
Net assets 50.4 116.6 193.7 273.4 283.1 318.9 339.0 359.2 379.5 400.7 424.3
Financed by
Equity 50.4 65.4 90.1 115.0 140.0 140.0 140.0 140.0 140.0 141.0 144.2
Retained earnings 0.0 51.2 103.7 158.5 143.1 179.0 199.0 219.2 239.4 259.8 280.1
Shareholders’ funds 50.4 116.6 193.8 273.5 283.1 319.0 339.0 359.2 379.4 400.8 424.3
Source: Author’s own
Exhibit 3.1 shows a group structure comprising three fully owned subsidiaries. The group wants to consider making one or two disposals in order to strengthen its cash posi-tion to potentially acquire a target company that will better fit into its corporate strategic objectives. So for this strategic need the company requires cash for acquisition purposes. The board are actually certain that the disposal and acquisition activity will happen within a 10 month time frame. Consequently, to this end the subsidiaries have provided monthly financial projections from the current actual position and provided projections on a monthly basis for the profit and loss, cash flow and balance sheet in an identical format as required by the group for ease of consolidation and analysis. Of course, the company has also undertaken separate valuation exercises that are similar to those outlined under ‘Step 2’ – acquisitive value. However, the current scenario assumes that the company would like to explore the disposal of both subsidiaries 1 and 2 at March 2012 and April 2012 at £100 million and £110 million respectively. In Exhibit 3.1, the profit and loss account and cash flow forecasts are included up to the point of disposal. The balance sheet includes the removal of the net assets at the date of disposal for subsidiary.
In the consolidated profit and loss we can see a reduction in the figures from March 2012 for the first sale and April 2012 for the second sale. Looking at the consolidated cash
Exhibit 3.1 continued
Corporate investment decisions
119
flow we can see the cash receipt arising from the sale of the subsidiaries for £100 million in March 2012 and £110 million in April 2012. Turning our attention to the consolidated balance sheet from March 2012 and April 2012 we can see a reduction in the net assets forecasted. We can see an increase in the cash balance which represents mainly the effect of the receipts from the sale of the subsidiaries.
The company would now be in a position to use its cash resources with or without other forms of long-term funding to pursue its acquisition target. Of course, the model gives the flexibility to explore different disposal timings and amounts as necessary.
Disposal exercise
Please undertake some financial analysis for disposal purposes showing the effect on the consolidated position. Create the planning outputs from four wholly owned subsidiaries in the same format as Exhibit 3.1 over a monthly timeline for 12 months. Set up the input assumptions as a flexible disposal date and amount for each subsidiary. The end objective is to prepare the consolidated projections post-disposal. You will probably want to use Excel with some test numbers in order to experiment how your business could benefit from stra-tegic disposals. Perhaps you have the opportunity to divest from one business and reinvest in a business that presents a better rate of return and growth?
Refinancing
Refinancing is when the terms of the existing debt for the company are replaced with better debt terms which can often be available due to changes in market conditions. The terms of the refinanced logic would have to be incorporated in the particular company’s corporate finance model and an evaluation undertaken regarding the overall effect on the company’s financial position in terms of shareholder returns, general liquidity and the lenders’ credit ratios.
Please refer to the company’s financial position before refinancing as shown in Exhibit 3.2. At present the company has £12.1 million of senior debt which bears an interest rate of 12%.
The market interest rate has fallen and it has been decided to refinance the £12.1 million debt at more favourable interest rates. Of course, there is a fee payable for undertaking this refinancing transaction which is repayable to the bank. A revised interest rate of 8% with an arrangement fee of 0.9% has been offered. The company has reforecasted the effect of the refinancing terms on the company’s financial projections accordingly (profit and loss, cash flow and balance sheet).
Over £2 million of net interest over the 5 year facility has been saved. We can see this by referencing the cash flow sheet in each example. The senior debt interest and fee have been highlighted and summed accordingly. In terms of the overall financial position of the company, as expected the shareholder returns are improved, the cash position and the interest cover slightly. This can be seen by referencing the summary sheet for both the before and after cases.

Exhibit 3.2
Pre and post-refinancing
SuMMARY
Pre-refinancing
Company cash position
£ millions
Min balance 15.3
Year of min balance 31 Dec 2010
Max balance 104.0
Year of max balance 31 Dec 2020
lenders credit ratios Min Target Year of min/max Average
ok Target max
Debt to equity ratio – max 32.7% 80.0% 31 Dec 2010 24.8%
ok Target max
Free cash flow to debt – min 70.1% 60.0% 31 Dec 2011 363.8%
ok Target max
Debt to EBITDA – max 32.7% 60.00% 31 Dec 2011 27.0%
ok Target max
Debt to net assets – max 72.0% 90.00% 31 Dec 2010 27.7%
ok Target min
Interest cover – min 28.6 2.0 31 Dec 2011 59.1
SuMMARY
Post-refinancing
Company cash position
£ millions
Min balance 15.3
Year of min balance 31 Dec 2010
Max balance 131.0
Year of max balance 31 Dec 2020
lenders’ credit ratios Min Target Year of min/max Average
ok Target max
Debt to equity ratio – max 33.3% 80.0% 31 Dec 2011 26.1%
ok Target min
Free cash flow to debt – min 67.2% 60.0% 31 Dec 2011 404.0%
ok Target max
Debt to EBITDA – max 33.3% 60.00% 31 Dec 2011 24.3%
ok Target max
Debt to net assets – max 72.0% 90.00% 31 Dec 2010 27.6%
ok Target min
Interest cover – min 28.4 2.0 31 Dec 2011 56.3
Source: Author’s own

Corporate investment decisions
121
Capital structures
An optimal capital structure refers to the maximum of debt and equity capital. The weighted average cost of capital (WACC) will have an effect on the valuation of the company. This is because the WACC should be the discount rate that incremental business decisions and projects are evaluated for discounted cash flow purposes. So, if a company has £70 million of debt and £30 million of equity it is said to have a 70% debt equity ratio. Indeed, many of the readers may have heard of the Miller & Modigliani theorem where it is recognised that there is an optimum debt ratio which recognises the impact of gearing and its tax deductibility effect upon the cost of debt (that is, usually interest) and the effect upon the shareholders’ required rate of return due to the perceived risk of not getting dividend pay-outs, due to the risk of having to pay the interest and principal for the debt before the shareholder gets any dividend income.
We will now turn our attention to the example for capital structure shown in Exhibit 3.3.Exhibit 3.3 shows the interest and principal cash flows calculated for debt. The debt
is included as the debt as an investment. The principals and interest cash flow (net of tax savings) are shown as positives in order to calculate the internal rate of return (IRR) or the cost of debt.
Based upon the IRR derived for the cost of debt and the cost of equity we can calculate the WACC. Consequently, based upon our assumptions, the WACC is currently 11.84%.
We can extend our analysis of our financial modelling by trying to find the optimum debt equity ratio, that is, debt percentage where WACC is minimal and where we recommend that the company operates financially in order to maximise its value and the net present value (NPV) of its incremental investments. The optimum is found by considering the relative rates of return from the investors and their risk profiles together with the tax deductible savings effect of the interest costs on the debt for corporation tax purposes.
A recommended approach for finding the optimum point is to set up a two variable data table in Excel which considers different mixes of debt and equity. Of course, it is important to note that we can only have a combination of debt and equity that equals 100%. We can then find the debt percentage based upon realistic assumptions that gives the lowest WACC. If we can find the lowest WACC then we can maximise the value of our corporate investments.
Capital structures exercise
Based upon a 25% nominal return on equity, a 14% interest rate, a debt equity ratio of 70% and a corporation tax rate of 30% please compute the WACC.
Dividend policy
The dividend policy involves a financial decision as to whether to distribute the profits to the shareholders in the form of dividends or to retain the profits and reinvest the cash in the company’s future projects. There is a belief that the best dividend policy is where the balance is met which maximises the future dividend stream and the market share price.
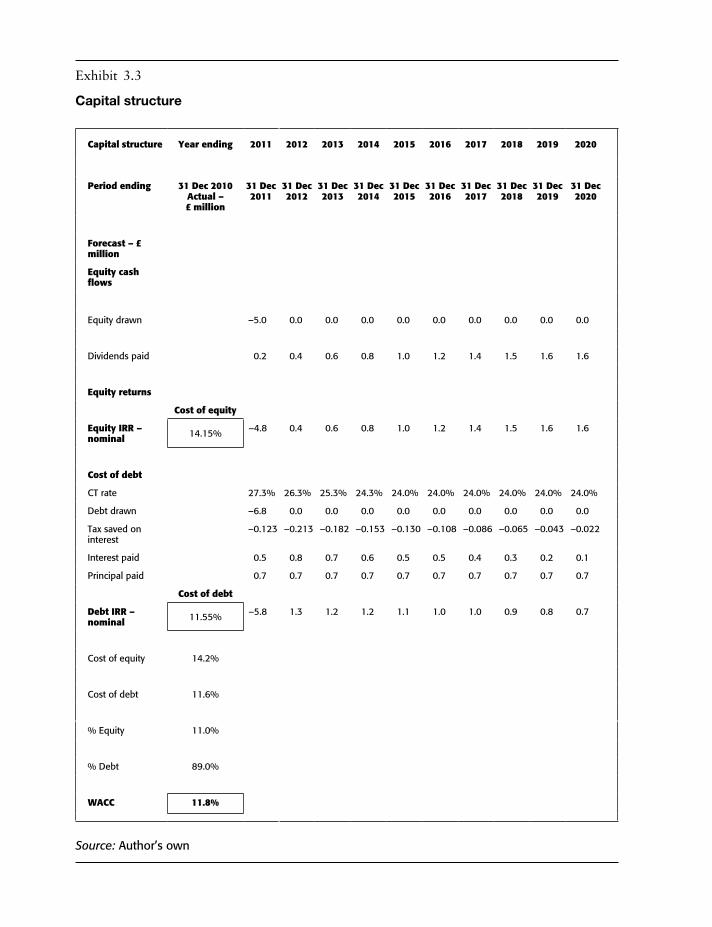
Exhibit 3.3
Capital structure
Capital structure Year ending 2011 2012 2013 2014 2015 2016 2017 2018 2019 2020
Period ending 31 Dec 2010Actual – £ million
31 Dec 2011
31 Dec 2012
31 Dec 2013
31 Dec 2014
31 Dec 2015
31 Dec 2016
31 Dec 2017
31 Dec 2018
31 Dec 2019
31 Dec 2020
Forecast – £ million
Equity cash flows
Equity drawn –5.0 0.0 0.0 0.0 0.0 0.0 0.0 0.0 0.0 0.0
Dividends paid 0.2 0.4 0.6 0.8 1.0 1.2 1.4 1.5 1.6 1.6
Equity returns
Cost of equity
Equity IRR – nominal 14.15% –4.8 0.4 0.6 0.8 1.0 1.2 1.4 1.5 1.6 1.6
Cost of debt
CT rate 27.3% 26.3% 25.3% 24.3% 24.0% 24.0% 24.0% 24.0% 24.0% 24.0%
Debt drawn –6.8 0.0 0.0 0.0 0.0 0.0 0.0 0.0 0.0 0.0
Tax saved on interest
–0.123 –0.213 –0.182 –0.153 –0.130 –0.108 –0.086 –0.065 –0.043 –0.022
Interest paid 0.5 0.8 0.7 0.6 0.5 0.5 0.4 0.3 0.2 0.1
Principal paid 0.7 0.7 0.7 0.7 0.7 0.7 0.7 0.7 0.7 0.7
Cost of debt
Debt IRR – nominal 11.55% –5.8 1.3 1.2 1.2 1.1 1.0 1.0 0.9 0.8 0.7
Cost of equity 14.2%
Cost of debt 11.6%
% Equity 11.0%
% Debt 89.0%
wACC 11.8%
Source: Author’s own

Corporate investment decisions
123
In terms of whether a company should pay a dividend, there are several factors that will enter the decision. The constraints around the dividend policy will include the company’s cash position, its legal position regarding its maintenance of capital through distributable reserves. It is usual for the dividend not to exceed the lower of its cash position or distrib-utable reserves position.
There are a number of considerations that a financial manager and the board of plc directors should take into account when considering distribution to its shareholders as follows.
• The liquidity position of the organisation may well be an important factor. It may be the case that although a company has high profitability, its cash position prevents it from paying a dividend. In such circumstances the board can often decide not to pay a dividend.
• The internal investment opportunities that face the company’s board of directors and the IRR of these relative to paying a dividend to the shareholders can be a factor in a dividend decision.
• The stability of the company’s earnings will dictate the dividend policy to a degree. For example, a company with stable and more predictable earnings is more likely to be able to pay out a higher proportion of its earnings than a company that has volatile and fluctuating earnings.
• The company’s debt position will be a factor. A company may decide to redeem debt instead of paying its shareholders a dividend.
• The control factor will often be an important decision in a company’s dividend distribu-tion decision. For example, a certain group may wish to keep control of the company and the board may decide to rely more on internal funding.
• The tax position of the company’s shareholders can be an additional factor when deciding to pay a dividend. A large company with a vast number of shareholders may be in a high dividend payout ratio. However, if the company is small with a small number of share-holders paying income tax at higher rates, the company may pay relatively low payouts of dividends. In such circumstances the retention of the funds by the company is likely to lead to higher capital gains in the form of share price growth where the company can invest in profitable opportunities.
• The rate of expansion or growth of a company may also be an important factor, that is, whether the company needs to invest in capital expenditure for future growth. If the company needs to make substantial capital investments it is less likely that it will make a high dividend distribution.
• The need to send positive messages to the stock market is an important consideration. The majority of companies seek to maintain a stable dividend per share. From a purely logical viewpoint, it is a safe assumption that stable dividends are likely to lead to higher share prices. From a shareholder’s point of view, a shareholder is more likely to value their investment more positively from a stable dividend cash flow stream as it attaches a lower discount rate and lower risk perspective allowing a potentially higher share price. Conversely, a company with an unstable dividend stream is likely to have a lower share price due to a higher discount rate being applied due to the risk associated with such cash flows.
We will now turn our attention to the dividend policy example in Exhibit 3.4.

Exhibit 3.4
Dividend policy
SuMMARY
Dividend policy
Company cash position
£ million
Min balance 3.3
Year of min balance 31 Dec 2010
Max balance 1,221.3
Year of max balance 31 Dec 2020
lenders credit ratios Min Target Year of min/max Average
ok Target max
Debt to equity ratio – max 21.2% 80.0% 31 Dec 2011 9.1%
ok Target max
Free cash flow to debt – min 838.7% 60.0% 31 Dec 2011 7,111.4%
ok Target max
Debt to EBITDA – max 21.2% 60.00% 31 Dec 2011 3.0%
ok Target max
Debt to net assets – max 11.9% 90.00% 31 Dec 2011 3.7%
ok Target min
Interest cover – min 222.8 2.0 31 Dec 2012 1,023.4
Stock market ratios
Earnings per share PE ratio Market price per share
31 Dec 2011 £14.07 10.5 £147.70
31 Dec 2012 £14.90 10.5 £156.41
31 Dec 2013 £15.85 10.5 £166.43
31 Dec 2014 £16.86 10.5 £177.03
31 Dec 2015 £17.74 10.5 £186.28
31 Dec 2016 £18.65 10.5 £195.81
31 Dec 2017 £19.52 10.5 £204.96
31 Dec 2018 £20.42 10.5 £214.44
31 Dec 2019 £21.36 10.5 £224.26
31 Dec 2020 £22.33 10.5 £234.42
Stock market ratios
Free cash flow per share Dividend per share Dividend per share
31 Dec 2011 £13.42 £6.75
31 Dec 2012 £17.36 £6.92 2.5%
Continued
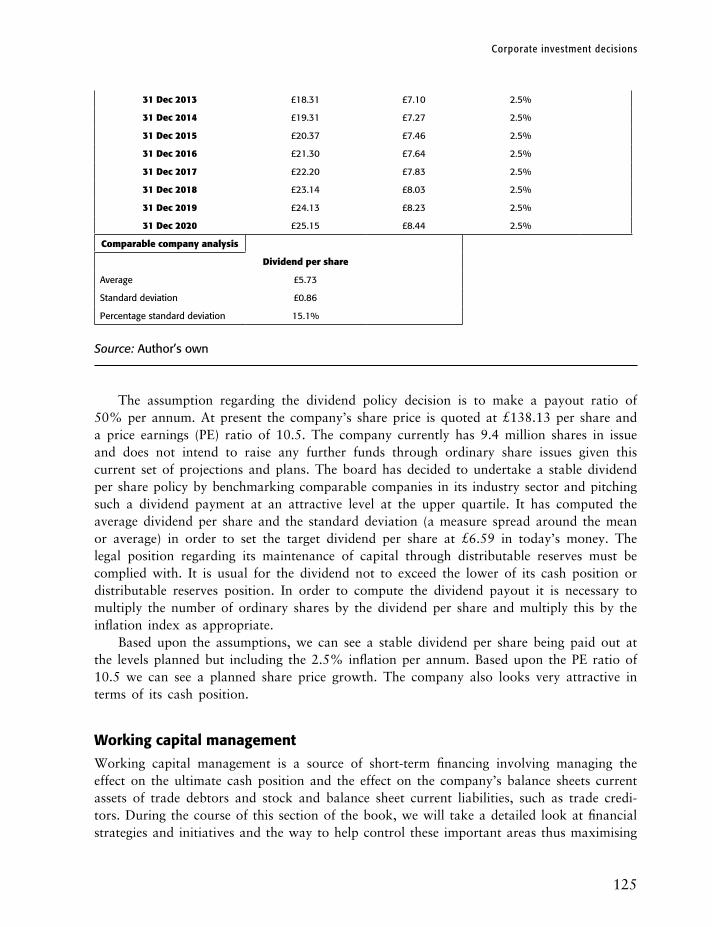
Corporate investment decisions
125
31 Dec 2013 £18.31 £7.10 2.5%
31 Dec 2014 £19.31 £7.27 2.5%
31 Dec 2015 £20.37 £7.46 2.5%
31 Dec 2016 £21.30 £7.64 2.5%
31 Dec 2017 £22.20 £7.83 2.5%
31 Dec 2018 £23.14 £8.03 2.5%
31 Dec 2019 £24.13 £8.23 2.5%
31 Dec 2020 £25.15 £8.44 2.5%
Comparable company analysis
Dividend per share
Average £5.73
Standard deviation £0.86
Percentage standard deviation 15.1%
Source: Author’s own
The assumption regarding the dividend policy decision is to make a payout ratio of 50% per annum. At present the company’s share price is quoted at £138.13 per share and a price earnings (PE) ratio of 10.5. The company currently has 9.4 million shares in issue and does not intend to raise any further funds through ordinary share issues given this current set of projections and plans. The board has decided to undertake a stable dividend per share policy by benchmarking comparable companies in its industry sector and pitching such a dividend payment at an attractive level at the upper quartile. It has computed the average dividend per share and the standard deviation (a measure spread around the mean or average) in order to set the target dividend per share at £6.59 in today’s money. The legal position regarding its maintenance of capital through distributable reserves must be complied with. It is usual for the dividend not to exceed the lower of its cash position or distributable reserves position. In order to compute the dividend payout it is necessary to multiply the number of ordinary shares by the dividend per share and multiply this by the inflation index as appropriate.
Based upon the assumptions, we can see a stable dividend per share being paid out at the levels planned but including the 2.5% inflation per annum. Based upon the PE ratio of 10.5 we can see a planned share price growth. The company also looks very attractive in terms of its cash position.
Working capital management
Working capital management is a source of short-term financing involving managing the effect on the ultimate cash position and the effect on the company’s balance sheets current assets of trade debtors and stock and balance sheet current liabilities, such as trade credi-tors. During the course of this section of the book, we will take a detailed look at financial strategies and initiatives and the way to help control these important areas thus maximising

The Strategic Corporate Investments Handbook
126
the cash position for the organisation. The following are methods for easing any short-term working capital problems that a business may encounter.
• The company could postpone any capital expenditure plans until a later date.• The company could try to press its debtors for an earlier payment.• The company could try to sell off any assets that the company may own.• The company could try to extend any credit timing with suppliers.• The company could reduce its dividend payments.
However the converse position of holding cash has the following benefits.
• There is a transaction motive of holding day to day cash, that is, the ability to pay creditors.• There is a precautionary motive of holding cash, that is, the ability to pay for any unfore-
seen requirements.• There is the speculative motive which attaches to the need to undertake business oppor-
tunities such as potential acquisitions.
Strategic initiatives involving trade debtors include managing trade credit terms and invoice discounting.
Let us first look at a decision regarding the extension of trade credit terms to all the customers of a company. The company expects sales of £3 million per month. The variable cost of sales is £2 million per month – all payable in the month of sale. If the company extended the credit period allowed to its trade debtors from 30 days to 60 days it estimates that sales would increase by 20%. So if this company has a cost of capital of 12%, would the extension of the trade debtors’ credit be financially justifiable?
Please see the example of a trade debtor credit extension shown in Exhibit 3.5.The current trade debtors’ balance at the end of the year is £2,958,904. (The current
trade debtors are calculated by multiplying the sales per month and multiplying this by the current debtor days and dividing this number by 365). The revised trade debtors’ position under the extended credit terms of 60 days is £7,101,370 (12*£3,000,000*1.2*30/365). This is calculated by taking the annual sales and increasing this by forecasted growth rate, multiplying this by the revised credit period and dividing this by 365. This gives an overall increase in the trade debtors of £4,142,466 which would need to be financed at 12%, arising in an incremental cost to the company of £497,096. The incremental contribution to fixed costs and profit is £2,400,000 based upon the increased sales and contribution ratio to sales. This appears to be a worthwhile policy when looking at the net benefit £1,902,904.
We will now look at a decision involving invoice discounting or factoring. Invoice discounting usually provides up to 80% of the outstanding trade debtors by the financial institution or factor. The invoices are sent to the factor or financial institution as the goods or services are applied. On receipt of the invoices up to 80% of the invoice value is made available to the company. The remaining amount invoiced is paid to the company by the factor once payment has been received from the customer.
Exhibit 3.6 shows a specific example of when a company wants to discount £10 million of invoices now at 75% advance and a 17% fee rate to the factoring company or financial institution upon settlement of the invoices in 60 days.
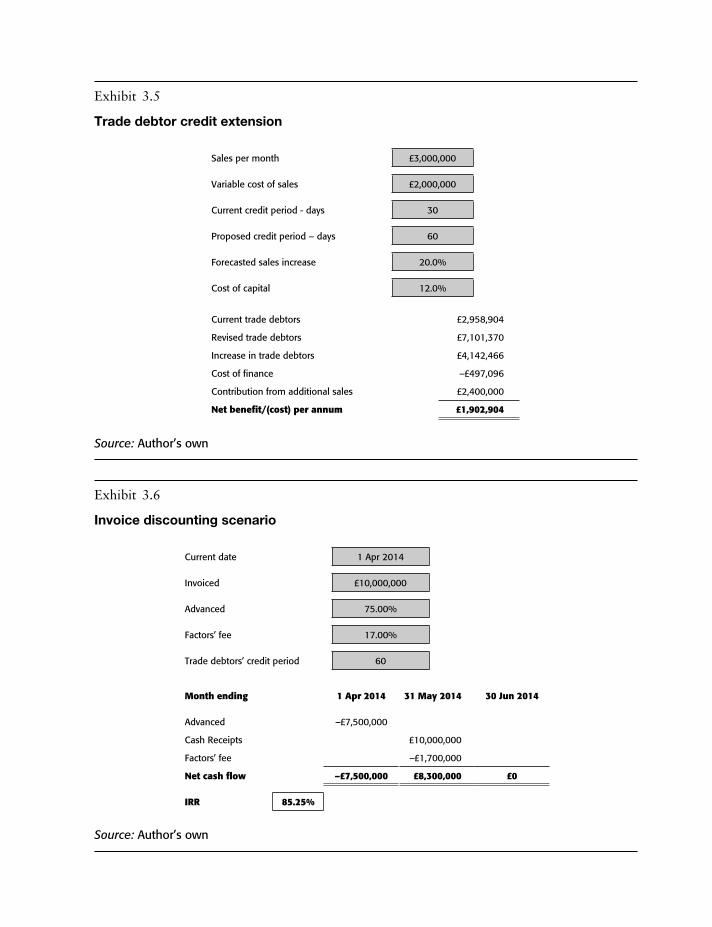
Exhibit 3.5
Trade debtor credit extension
Sales per month £3,000,000
Variable cost of sales £2,000,000
Current credit period - days 30
Proposed credit period – days 60
Forecasted sales increase 20.0%
Cost of capital 12.0%
Current trade debtors £2,958,904
Revised trade debtors £7,101,370
Increase in trade debtors £4,142,466
Cost of finance –£497,096
Contribution from additional sales £2,400,000
Net benefit/(cost) per annum £1,902,904
Source: Author’s own
Exhibit 3.6
Invoice discounting scenario
Current date 1 Apr 2014
Invoiced £10,000,000
Advanced 75.00%
Factors’ fee 17.00%
Trade debtors’ credit period 60
Month ending 1 Apr 2014 31 May 2014 30 Jun 2014
Advanced –£7,500,000
Cash Receipts £10,000,000
Factors’ fee –£1,700,000
Net cash flow –£7,500,000 £8,300,000 £0
IRR 85.25%
Source: Author’s own
The Strategic Corporate Investments Handbook
128
So, based upon the terms of the factoring or invoice discounting deal in Exhibit 3.6, 75% of the £10 million is advanced immediately to the company by the factoring company on presentation of the invoices. In 60 days’ time the cash is collected from the customer and the factor takes their 17% fee for doing the transaction. When looked at, the cost of finance for this transaction or the return to the factor is obviously expensive as a source of short-term funding for the company.
In summary, the advantages to a corporate of using invoice discounting as a short-term form of financing is as follows.
• It can help to reduce administration and or cash collection costs.• It obviously helps short-term liquidity.• It does not reduce the corporate debt capacity in any way.
In summary, the disadvantage to a corporate of using invoice discounting as a short-term form of financing from the example in Exhibit 3.6 is that the cost of this short-term financing is high when compared with other sources.
Strategic initiatives involving stock include managing stock through the classical reorder system and just-in-time (JIT) inventory management approaches.
There are several techniques available for stock and inventory control purposes, all of which have the overall purpose of establishing what, when and how much stock to order so as to maintain a balance between ordering and holding stocks or inventory. Before progressing to consider the mechanics and processes behind a stock control system we need to understand the costs associated with stocks and inventory. These techniques are summarised below.
• Ordering costs. If the ordering costs represent a fixed cost per order placed then this will affect the company’s stock control policy.
• Purchase costs. The company’s stock control policy will only be affected by purchase costs if quantity discounts are offered by suppliers.
• Holding costs. If you have a warehouse and equipment these costs will be assumed as fixed and, therefore, will not affect the company’s stock control policy. Holding costs that vary with the number of items of inventory held in stock are to be taken into account and will affect the company’s stock control policy. It is important to point out that a very important stock holding cost is the cost of capital that will be tied up to finance the stock holding.
The classical system of stock control is what is used for most stock control systems. There are certain key factors that will need to be taken into consideration as follows.
• A reorder lead time allows for the time between placing an order and receiving it into stock.• An economic order quantity (EOQ) is the standard formula used to arrive at an optimum
point between holding too much or too little stock. This formula is typically used in stock control software.
• Demand forecasting is a critical variable for any stock control system. However, depending upon the nature of the products such demand levels may vary according to

Corporate investment decisions
129
the predictability. A demand forecasting technique may vary from a simple estimated stable number per month to the need to use regression analysis or multiple regression analysis techniques. These statistical methods are largely outside the scope of this book.
We will now turn our attention to the example of a classical stock control system in Exhibit 3.7. For each product required for resale and to be held in stock, an EOQ and reorder lead time should be computed. This will tell the buyer how much to order and when.
Exhibit 3.7
Classical stock control system
Classical stock control system
SKU number ABC123
Stock price per unit £100.00
Annual demand 2,000
Order cost per unit £20.00
Cost of capital 12%
Delivery lead time – weeks 3
Economic order quantity 82
Reorder level 115
Source: Author’s own
So, product ABC123 has a purchase price of £100, an annual demand of 2,000 units, an order cost of £20, the cost of financing working capital is at 12% per annum, and the delivery lead time is three weeks (that is, it takes three weeks from the point of placing the order to receiving the product into stock).
The EOQ is calculated as the point at which the cost of ordering and holding the stock is minimised as follows.
Square root of (2*Order Cost Per Unit*Annual Demand)/ (Stock Price Per Unit*Cost Of Capital)
that is,
Square root of (2*£20*2,000)/ (£100*12%)
The reorder level is calculated as per the weekly demand within the lead time. Therefore, the annual demand is multiplied by the delivery lead time in weeks and divided by 52 weeks in the year – 2,000/52*3.
The Strategic Corporate Investments Handbook
130
The just-in-time stock control system aims to reduce costs by keeping stock levels to a minimum. Stock items are delivered when they are needed and used immediately. There is a risk of running out of stock, so the company needs to be very sure that its suppliers can deliver on demand and that it has close relationships with them.
In very practical terms, if the company has multiple products then it will need to consider commercial software based upon such concepts that have been described. The following points should be considered.
• What is the basis of data capture, for example, electronic point of sale (EPOS) and bar coding?
• Does the system comply with the correct economic calculation basis, that is, EOQs and reorder levels?
• What additional information or requirements are needed from a stock control system, for example, integration with purchase order systems, good received notes, integration with accounting ledgers and systems?
Stock control exercise
Please build a stock control system in Excel for a company that has only 10 product lines. Use simple linear regression to forecast the annual demand based upon five years’ monthly trading history. Your outputs should include the EOQ and the reorder level for each product.
Strategic initiatives involving cash include managing cash through the cash flow forecasting and short-term cash deposits. We will look in more detail at the costs and benefits of holding cash. The cost of holding cash can be the lost interest on invested cash. We recognise that the benefit of holding cash allows a corporate to pay for its day to day transactions and it allows it to have a buffer for any unforeseen requirements. It also allows companies to take advantage of any possible future acquisitions and so on. So, when a company has excess cash, which it may want to think about investing, it will have to consider the following areas which are critical to its future cash flows.
• The rate of return that can be assessed from the investment.• The risk associated with the investment.• The liquidity associated with the investment, that is, how easy it would be to realise the
cash and returns.
There are certain investments that could be considered as follows.
• The organisation could reduce an overdraft of one of its bank accounts. This will generate a high return due to the interest saved. The risk associated with this course of action is likely to be low. It will, of course, be limited to the amount of the overdraft. This is likely to be a liquid course of action and almost instantaneous.

Corporate investment decisions
131
• The organisation could make a bank deposit. This would give a fairly low return. The risk of this course of action is low. However, some notice is generally required to make a withdrawal.
• The organisation could make a money market deposit. The return would depend upon the time to maturity. This would not be too liquid.
• The organisation could invest in government stocks or treasury bills. These have a low return, low risk and are of medium liquidity.
• The organisation could invest in ordinary shares on the stock exchange which can give high returns at high risk and liquidity is simple, through the sale of the stocks.
Strategic initiatives involving trade creditors include managing trade credit terms will now be looked at. Specifically, at an example of when a company has been offered a discount of 2% on an invoiced amount if settled within 10 days rather than the standard 30 days payment terms given by the supplier for an £8 million purchase (see Exhibit 3.8).
Exhibit 3.8
Supplier early settlement terms
Current date 1 Apr 2014
Invoiced £8,000,000
Supplier discount 2.00%
Trade debtors credit period 30
Month ending 11 Apr 2014 30 Apr 2014
Discounted payment –£7,840,000
Non-discounted payment forgone £8,000,000
Net cash flow –£7,840,000 £8,000,000
IRR 47.42%
Source: Author’s own
Based upon the terms of the early discounting deal we can see in Exhibit 3.8 that by paying 98% of the £8 million in 10 days to the supplier and avoiding the £8 million payment in 30 days (that is, on 30 April 2011) yields an IRR of 47.42%. This course of action is likely to add value to the organisation buying the services as their WACC is likely to be much lower than the IRR for this decision.
The Strategic Corporate Investments Handbook
132
Sale and lease back decisions
A sale and lease back transaction is when a company sells an asset and then leases the asset back from the buyer at competitive terms.
Advantages of sale and lease back
The first advantage is that the company can access equity and capital while maintaining the use of an asset for the business for cash flow generation purposes. As we are also aware, lease rental payments give tax relief for corporation tax purposes.
The company’s financial position is also likely to improve after a sale and lease back, that is, the debt to equity is likely to be improved and its cash position is likely to be enhanced. Cash can be used to further reduce the company’s debt position.
Disadvantages of sale and lease back
A main disadvantage of a sale and lease back is that you will lose the benefit of the capital allowances for your owned asset.
Financial evaluation
Exhibit 3.9 shows the assumptions and results for a sale and lease back evaluation.It is recommended practice to evaluate the sale or lease back decision using discounted
cash flow techniques and to make a final financial decision regarding the transaction and the effect upon the company. This will derive a result that considers the time value of money and the incremental effect on the company’s cash position by undertaking the transaction.
In Exhibit 3.9, the company uses its 12.5% WACC as the discount rate for discounted cash flow (DCF) appraisal purposes. The company making the appraisal is in a tax paying position and can, therefore, offset any operating expenditure and capital allowances for corporation tax purposes. The company’s marginal rate of corporation tax is 28% and it can claim 20% reducing balance capital allowance for this type of capital purchase if it decides to purchase the equipment.
The lease terms that have been offered for this equipment is a five-year lease with an annual lease rent of £5 million.
Based upon the assumptions above we can calculate the incremental NPV as follows.First, cash is received for the sale of the asset to the financial institution of £10 million.
By selling this asset the company forgoes the capital allowances over the five-year period. The incremental lease rentals are paid and the corporation tax is saved on the lease rentals.
This results in a negative NPV of £9 million. However, when negotiating with a financial institution on a sale and lease back transaction it is advisable to evaluate the term offered by attempting to get as close to a zero or positive NPV as possible. The result derived in the analysis in Exhibit 3.9 is not as clear cut as that and the company should reject the transaction.
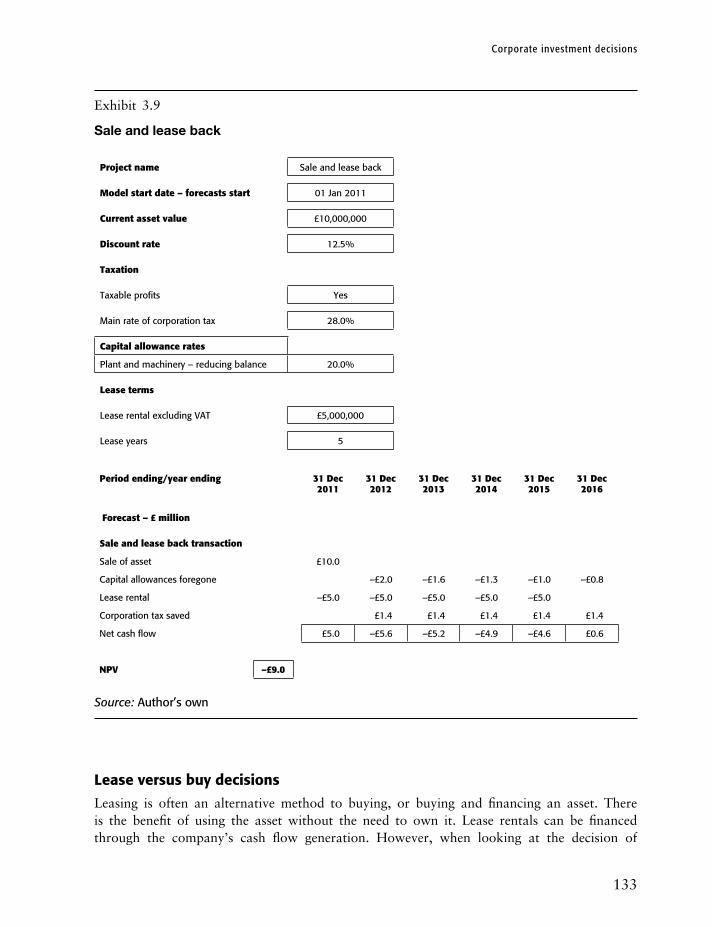
Corporate investment decisions
133
Exhibit 3.9
Sale and lease back
Project name Sale and lease back
Model start date – forecasts start 01 Jan 2011
Current asset value £10,000,000
Discount rate 12.5%
Taxation
Taxable profits Yes
Main rate of corporation tax 28.0%
Capital allowance rates
Plant and machinery – reducing balance 20.0%
lease terms
Lease rental excluding VAT £5,000,000
Lease years 5
Period ending/year ending 31 Dec 2011
31 Dec 2012
31 Dec 2013
31 Dec 2014
31 Dec 2015
31 Dec 2016
Forecast – £ million
Sale and lease back transaction
Sale of asset £10.0
Capital allowances foregone –£2.0 –£1.6 –£1.3 –£1.0 –£0.8
Lease rental –£5.0 –£5.0 –£5.0 –£5.0 –£5.0
Corporation tax saved £1.4 £1.4 £1.4 £1.4 £1.4
Net cash flow £5.0 –£5.6 –£5.2 –£4.9 –£4.6 £0.6
NPV –£9.0
Source: Author’s own
Lease versus buy decisions
Leasing is often an alternative method to buying, or buying and financing an asset. There is the benefit of using the asset without the need to own it. Lease rentals can be financed through the company’s cash flow generation. However, when looking at the decision of
The Strategic Corporate Investments Handbook
134
whether to lease or buy an asset or equipment we need to consider both the qualitative advantages and disadvantage of the lease versus purchase decision and the financial outcome through financial evaluation.
The advantages of leased equipment
• The leasing company usually has a lot of technical knowledge regarding the equipment that it leases and can provide support and advice.
• The leased equipment can often allow the corporation to update the equipment more easily than ownership and thus benefit from the latest technology.
• Leasing will come with the benefit that the lease rental payments are tax deductible for corporation tax purposes.
• Leasing will not require a big capital outlay, deposit, or financing that is associated with a purchase and or financing decision.
The disadvantages of leased equipment
• The main financial advantage is that the company will lose the capital allowances.• Tax depreciation benefits associated with buying and owing an asset or equipment are lost.• The company will not benefit from the resale value of the asset or equipment at the time
of upgrade.
Lease versus purchase decisions
Exhibit 3.10 shows the assumptions and results for a lease versus purchase evaluation.It is recommended practice to evaluate the lease or buy decision using discounted cash
flow techniques and to make a final financial decision or option appraisal of the two sources of financing the equipment based upon the option that derives the lowest NPV of the net cash flow. This will represent the option that considering the time value of money has the lowest cost result.
In Exhibit 3.10, the company uses its 12.5% WACC as the discount rate for DCF appraisal purposes. The company making the appraisal is in a tax paying position and can, therefore, offset any operating expenditure and capital allowances for corporation tax purposes. The company’s marginal rate of corporation tax is 28% and it can claim 20% reducing balance capital allowance for this type of capital purchase if it decides to purchase the equipment.
The lease terms that have been offered for this equipment is a seven-year lease with an annual lease rent of £3,500. The cost of buying this equipment is £55,000 and the resale or residual value at the end of seven years is £1,000.
Based upon these assumptions we can calculate the cost of both the options as follows.In terms of the leasing course of action, we can see the lease rental being paid in each of
the seven years with an offset of the tax deductibility element for corporation tax purposes, with a time lag because corporation tax is normally paid 10 months after the accounting year end. The net cash flow is then summed for each year and the NPV is calculated for this option.
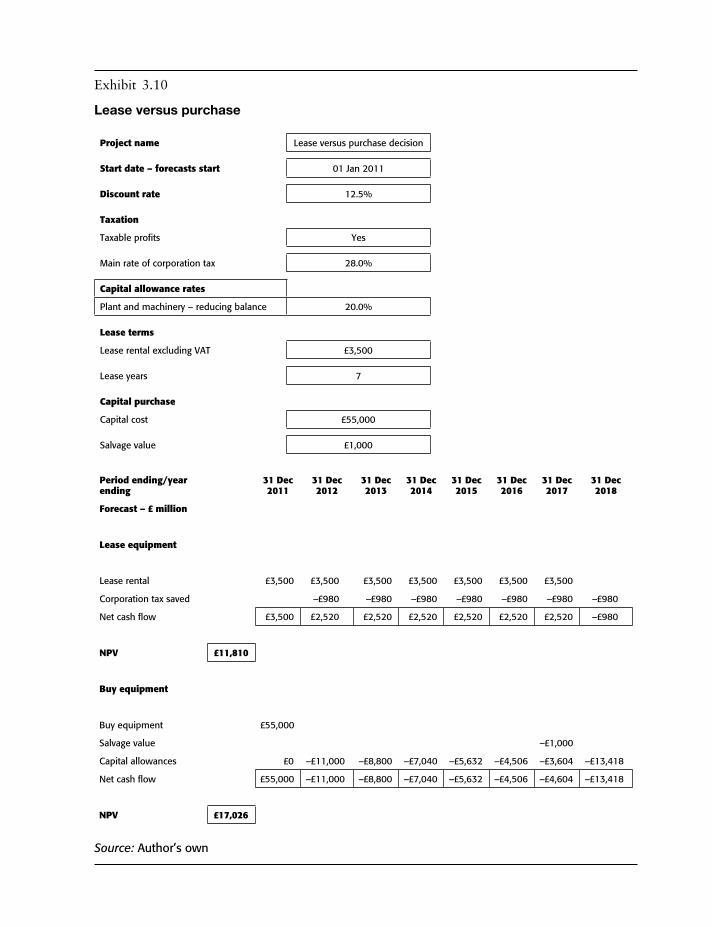
Exhibit 3.10
Lease versus purchase
Project name Lease versus purchase decision
Start date – forecasts start 01 Jan 2011
Discount rate 12.5%
Taxation
Taxable profits Yes
Main rate of corporation tax 28.0%
Capital allowance rates
Plant and machinery – reducing balance 20.0%
lease terms
Lease rental excluding VAT £3,500
Lease years 7
Capital purchase
Capital cost £55,000
Salvage value £1,000
Period ending/year ending
31 Dec 2011
31 Dec 2012
31 Dec 2013
31 Dec 2014
31 Dec 2015
31 Dec 2016
31 Dec 2017
31 Dec 2018
Forecast – £ million
lease equipment
Lease rental £3,500 £3,500 £3,500 £3,500 £3,500 £3,500 £3,500
Corporation tax saved –£980 –£980 –£980 –£980 –£980 –£980 –£980
Net cash flow £3,500 £2,520 £2,520 £2,520 £2,520 £2,520 £2,520 –£980
NPV £11,810
Buy equipment
Buy equipment £55,000
Salvage value –£1,000
Capital allowances £0 –£11,000 –£8,800 –£7,040 –£5,632 –£4,506 –£3,604 –£13,418
Net cash flow £55,000 –£11,000 –£8,800 –£7,040 –£5,632 –£4,506 –£4,604 –£13,418
NPV £17,026
Source: Author’s own
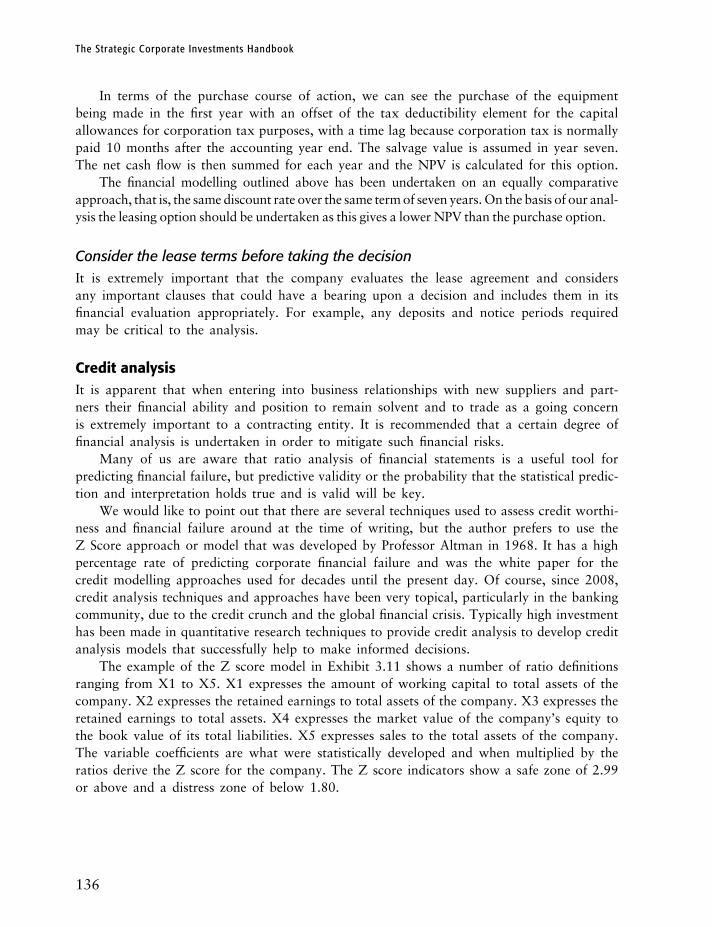
The Strategic Corporate Investments Handbook
136
In terms of the purchase course of action, we can see the purchase of the equipment being made in the first year with an offset of the tax deductibility element for the capital allowances for corporation tax purposes, with a time lag because corporation tax is normally paid 10 months after the accounting year end. The salvage value is assumed in year seven. The net cash flow is then summed for each year and the NPV is calculated for this option.
The financial modelling outlined above has been undertaken on an equally comparative approach, that is, the same discount rate over the same term of seven years. On the basis of our anal-ysis the leasing option should be undertaken as this gives a lower NPV than the purchase option.
Consider the lease terms before taking the decisionIt is extremely important that the company evaluates the lease agreement and considers any important clauses that could have a bearing upon a decision and includes them in its financial evaluation appropriately. For example, any deposits and notice periods required may be critical to the analysis.
Credit analysisIt is apparent that when entering into business relationships with new suppliers and part-ners their financial ability and position to remain solvent and to trade as a going concern is extremely important to a contracting entity. It is recommended that a certain degree of financial analysis is undertaken in order to mitigate such financial risks.
Many of us are aware that ratio analysis of financial statements is a useful tool for predicting financial failure, but predictive validity or the probability that the statistical predic-tion and interpretation holds true and is valid will be key.
We would like to point out that there are several techniques used to assess credit worthi-ness and financial failure around at the time of writing, but the author prefers to use the Z Score approach or model that was developed by Professor Altman in 1968. It has a high percentage rate of predicting corporate financial failure and was the white paper for the credit modelling approaches used for decades until the present day. Of course, since 2008, credit analysis techniques and approaches have been very topical, particularly in the banking community, due to the credit crunch and the global financial crisis. Typically high investment has been made in quantitative research techniques to provide credit analysis to develop credit analysis models that successfully help to make informed decisions.
The example of the Z score model in Exhibit 3.11 shows a number of ratio definitions ranging from X1 to X5. X1 expresses the amount of working capital to total assets of the company. X2 expresses the retained earnings to total assets of the company. X3 expresses the retained earnings to total assets. X4 expresses the market value of the company’s equity to the book value of its total liabilities. X5 expresses sales to the total assets of the company. The variable coefficients are what were statistically developed and when multiplied by the ratios derive the Z score for the company. The Z score indicators show a safe zone of 2.99 or above and a distress zone of below 1.80.
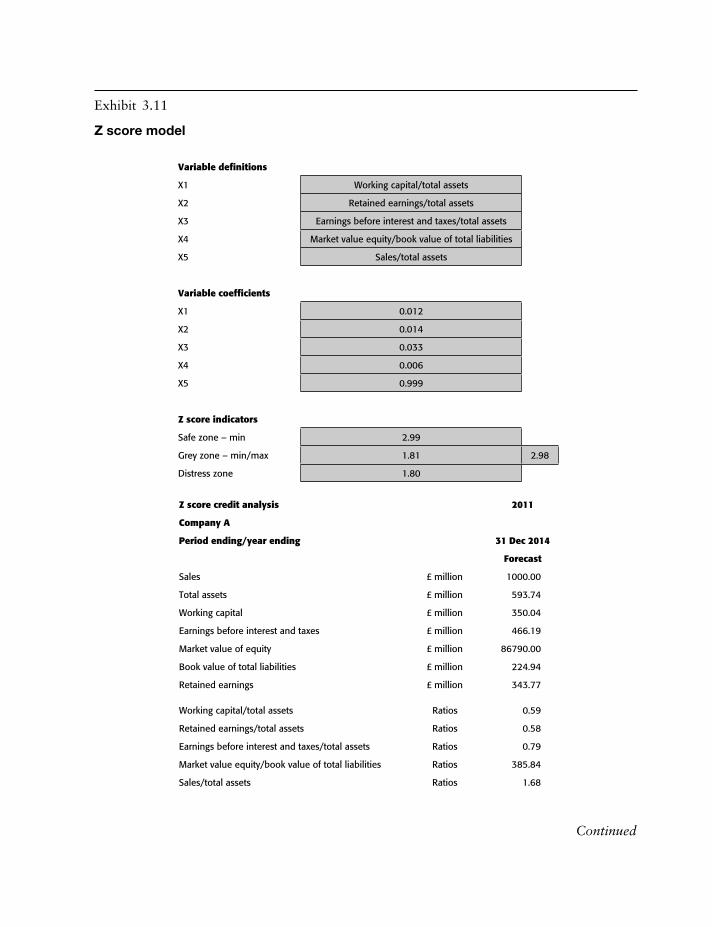
Exhibit 3.11
Z score model
Variable definitions
X1 Working capital/total assets
X2 Retained earnings/total assets
X3 Earnings before interest and taxes/total assets
X4 Market value equity/book value of total liabilities
X5 Sales/total assets
Variable coefficients
X1 0.012
X2 0.014
X3 0.033
X4 0.006
X5 0.999
Z score indicators
Safe zone – min 2.99
Grey zone – min/max 1.81 2.98
Distress zone 1.80
Z score credit analysis 2011
Company A
Period ending/year ending 31 Dec 2014
Forecast
Sales £ million 1000.00
Total assets £ million 593.74
Working capital £ million 350.04
Earnings before interest and taxes £ million 466.19
Market value of equity £ million 86790.00
Book value of total liabilities £ million 224.94
Retained earnings £ million 343.77
Working capital/total assets Ratios 0.59
Retained earnings/total assets Ratios 0.58
Earnings before interest and taxes/total assets Ratios 0.79
Market value equity/book value of total liabilities Ratios 385.84
Sales/total assets Ratios 1.68
Continued

The Strategic Corporate Investments Handbook
138
Working capital/total assets Coefficient 0.012
Retained earnings/total assets Coefficient 0.014
Earnings before interest and taxes/total assets Coefficient 0.033
Market value equity/book value of total liabilities Coefficient 0.006
Sales/total assets Coefficient 0.999
Working capital/total assets Z score 0.01
Retained earnings/total assets Z score 0.01
Earnings before interest and taxes/total assets Z score 0.03
Market value equity/book value of total liabilities Z score 2.32
Sales/total assets Z score 1.68
Overall Z score 4.04
Source: Altman’s Z score
The application of Altman’s Z score model in Exhibit 3.11 takes the latest statistics from the accounting statements, computes the necessary ratios, and multiplies these by the coefficients which are summed in order to calculate the overall Z score. The overall Z score is compared with the Z score indicator levels to inform us of a safety, grey or distressed position for the company.
In practice, there are a number of ratios that one could review in order to calculate credit worthiness – the typical accountant tool kit of profit, capital structure and working capital ratios should never be dismissed – together with a review of the supporting notes for the latest published accounts and a reasonableness review of the corporate future strategy and business plan and projections in order to review risk through sensitivity analysis.
Restructuring and distressed debt
A lot of businesses have been affected by the economic events of post-2008. Consequently, the deals that looked financially viable from a forecast viewpoint at time zero are likely to look less healthy some years later. This often leaves the company with distressed debt that may need reconstructing or refinancing.
If a company has used all the techniques outlined in this book it is highly unlikely that it will find itself in a distressed debt position. A distressed debt position is likely to be either where the debt cannot be serviced by its cash flows either now or in the future and/or the debt facilities are in breach of the lenders’ covenant targets.
We will now turn our attention to Exhibit 3.12 which is a summary of distressed debt.
Exhibit 3.11 continued

Corporate investment decisions
139
Exhibit 3.12
Distressed debt
Summary
Distressed debt
Company cash position
£ million
Min balance –24.9
Year of min balance 31 Dec 2021
Max balance 15.7
Year of max balance 31 Dec 2012
lenders credit ratios Min Target Year of min/max Average
ok Target max
Debt to equity ratio – max 78.6% 80.0% 31 Dec 2011 63.2%
ok Target min
Debt to EBITDA – max 1486.1% 60.00% 31 Dec 2012 1041.0%
ok Target max
Debt to net assets – max 20.2% 90.00% 31 Dec 2011 16.0%
Breach Target min
Interest cover – min –52.7 2.0 31 Dec 2018 –19.0
Breach Target Min
Debt Service cover – min 0.2 1.1 31 Dec 2018 0.3
Source: Author’s own
We can see in Exhibit 3.12 that the debt service cover ratios are below the minimum targets set by the lenders in their covenant tests. There is also insufficient cash flow avail-able to repay or service the debt obligation. We can see this by referencing the cash flow sheet whereby the cash balance would effectively become negative at the end of December 2015. Consequently, there is a need for a restructuring plan in order to rectify this position.
So, if a leveraged buyout has a distressed debt position what could be the likely remedy? There are potentially three possibilities for a company that is experiencing a distressed debt position: (i) to improve the business performance; (ii) to reschedule the debts; or (iii) to make a strategic disposal.
Improve business performance
There are a number of ways that the business performance could be improved. Essentially, we need to look at ways of improving the earnings before interest tax depreciation and
The Strategic Corporate Investments Handbook
140
amortisation (EBITDA). This could be achieved by increasing sales, reducing cost of sales or reducing overheads through a cost reduction program.
In Exhibit 3.13, the company has decided to put together an operational restructuring plan in order to remedy the position. This comprises an improved sales and marketing strategy, which will have the effect of improving sales by growth.
Exhibit 3.13
Improved business performance
Summary
Improved business performance
Company cash position
£ million
Min balance 15.3
Year of min balance 31 Dec 2011
Max balance 115.9
Year of max balance 31 Dec 2021
lenders credit ratios Min Target Year of min/max Average
ok Target max
Debt to equity ratio – max 78.6% 80.0% 31 Dec 2011 63.2%
ok Target min
Debt to EBITDA – max 163.2% 60.00% 31 Dec 2012 85.9%
ok Target max
Debt to net assets – max 20.2% 90.00% 31 Dec 2011 13.2%
ok Target min
Debt service cover – min 2.5 1.1 31 Dec 2013 3.4
Source: Author’s own
The company also has a plan to outsource the products from alternative suppliers in the Far East. Finally, there is a planned cost reduction program which has identified a number of cost savings. We can see the effect of these plans on the financial position of the company in Exhibit 3.13. The operational improvements have the effect of a positive cash balance over the life of the forecast. The debt service cover ratio meets the minimum together with the rest of the lenders’ credit ratios.

Corporate investment decisions
141
Reschedule debts
Exhibit 3.14 shows an example of rescheduling debts. The company has only identified an operational improvement of the different product sourcing strategy. Unfortunately, even with this initiative the company is still left in a position whereby the debt service cover ratio is a minimum of 0.9 which is slightly below the minimum target of 1.1. So, the company has agreed with the bank to extend the repayment terms of its existing senior debt facility from seven to 10 years. It has been agreed that no fee will be payable but of course extra interest will be paid due to the increase in the term of repayment. This has had the desired effect of making the company cash positive and ensuring that all target lenders’ credit ratios are met.
Exhibit 3.14
Reschedule debt
Summary
Reschedule debt
Company cash position
£ million
Min balance 10.8
Year of min balance 31 Dec 2020
Max balance 24.2
Year of max balance 31 Dec 2012
lenders credit ratios Min Target Year of min/max Average
ok Target max
Debt to equity ratio – max 78.6% 80.0% 31 Dec 2011 61.8%
ok Target min
Debt to EBITDA – max 478.6% 60.00% 31 Dec 2012 275.2%
ok Target max
Debt to net assets – max 20.2% 90.00% 31 Dec 2011 19.0%
ok Target min
Debt service cover – min 1.2 1.1 31 Dec 2013 1.4
Source: Author’s own
Strategic disposals
There is an option to make strategic disposals of certain companies or divisions which will raise cash for the possible prepayment of debt thus easing debt service obligations and or achieving a financially viable situation.
The Strategic Corporate Investments Handbook
142
However, this section of the book is not associated with growing a successful company but with looking at the very area of financial failure, reconstruction of the corporation and potential liquidation. This area will help us to understand how to react to any potential financial difficulties that the corporate may encounter.
Let us first look at the types of failure that can occur. Technical insolvency is where a company is considered a failure when it cannot meet its current liabilities. This may be despite the case that its total assets are indeed greater than its total liabilities. There is also legal insolvency when a company cannot pay its debts when considering its assets and liabilities. The potential remedies that are available to the management of a failed corporation form the discussion of the rest of this chapter.
A company should only be liquidated in the event that a business cannot be saved by effecting a reorganisation or reconstruction. When a company is wound up this can be done voluntarily by either the owners or shareholders of the company or by a court.
When undertaking a liquidation there is a certain order of payment for the company’s creditors as follows.
• The professional fees and liquidator’s expenses incurred in the course of the wind up.• The preferential creditors, such as any employees’ wages and salaries, and any taxes due.• The secured creditors, such as a lender’s debt, will have payment made to them from the
assets that were pledged for security purposes.• Any unsecured creditors, such as unpaid suppliers.• Preference shareholders.• Ordinary shareholders.
Exhibit 3.15 shows an example of how a liquidation actually works. The balance sheet of an insolvent company is shown in Exhibit 3.15 and, of course, things look pretty grim given the fact that the company’s financial position shows £20.2 million of debt outstanding, a large overdraft of £4.5 million and no trade debtors that can be collected and converted to cash.
We must remember that the balance sheet in Exhibit 3.15 is stated at historic cost and what is actually realised is in the form of cash receipts in order to pay the claims on the company’s assets. We can see from the balance sheet that we have fixed assets of £20 million and current assets of £1 million. Unfortunately, we have only been able to obtain £18 million on liquidation of company’s assets.
So which parties get the £18 million? Let us assess this in the order of priority outlined above. The liquidation summary in Exhibit 3.16 shows the position of the company and the claims upon its final wind up.
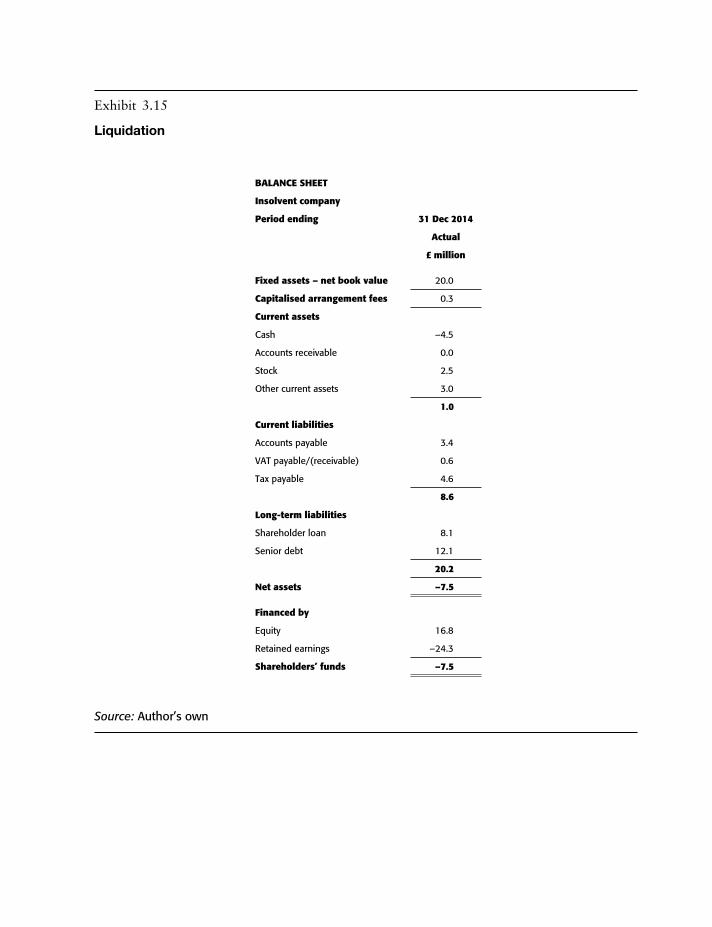
Exhibit 3.15
Liquidation
BAlANCE SHEET
Insolvent company
Period ending 31 Dec 2014
Actual
£ million
Fixed assets – net book value 20.0
Capitalised arrangement fees 0.3
Current assets
Cash –4.5
Accounts receivable 0.0
Stock 2.5
Other current assets 3.0
1.0
Current liabilities
Accounts payable 3.4
VAT payable/(receivable) 0.6
Tax payable 4.6
8.6
long-term liabilities
Shareholder loan 8.1
Senior debt 12.1
20.2
Net assets –7.5
Financed by
Equity 16.8
Retained earnings –24.3
Shareholders’ funds –7.5
Source: Author’s own

The Strategic Corporate Investments Handbook
144
Exhibit 3.16
Liquidation summary
lIquIDATION SuMMARY
Insolvent company
£ million
Resale value of fixed and current assets 18.000
Order of claims Paid unpaid Check
Professional fees for wind up 0.007 0.000
Employees salaries outstanding 1.000 0.000
Corporation tax 4.630 0.000
VAT 0.577 0.000
Secured creditors: senior debt 11.786 0.314 0.000
Unsecured creditors 3.375 0.000
Shareholder loan 8.100 0.000
Ordinary shareholders 16.800 0.000
Total claims 18.000 28.589 0.000
Check 0.000
Reconciliation
£ million
Total claims per balance sheet 45.582
Other claims 1.007
46.589
Claims paid 18.000 38.6%
Unpaid claims 28.589 61.4%
46.589
Source: Author’s own
The liquidation summary shows how the £18 million is raised through the sale of the current and fixed assets. This allocation is in the specific order outlined above. We can see that the professional fees, salaries and taxes are all paid. The majority of the senior debt is paid. However, the majority of the claims are unpaid; part of the senior lenders’ debt and all of the trade creditors or accounts payable are outstanding, and all of the shareholders’ loan and ordinary shareholders’ capital cannot be repaid. You can see that the analysis has been properly reconciled by looking at the claims and allocating them in the correct order. We can actually see what the unpaid claims of £28.589 million are comprised of.
We shall now turn our attention to how we could rehabilitate a potential financially failing company. There may be certain companies that are better at restructuring their financial

Corporate investment decisions
145
position and carrying on business as going concerns. This may be a company that has had a few bad trading years but has good future potential.
Capital reconstruction
There may well be great benefits in exercising a capital reconstruction scheme when a busi-ness should not be allowed to be wound up, because it can be rescued and maintained as a going concern. The definition of a capital reconstruction is whereby the company that has failed is placed in voluntary liquidation and the assets are sold to an alternative company with the same name and same shareholders, but with a stronger financial position.
The example in Exhibit 3.17 considers a company that although it has great future prospects has had a tough recent trading period, which makes realising such potential very difficult indeed. In order to undertake a capital reconstruction scheme it is very important to demonstrate to the creditors that the future plan is better than the liquidation or winding up option. It is necessary to modify the claims to ensure the company’s going concern status. (Please see Exhibits 3.17 to 3.22.)
Exhibit 3.17
General assumptions insolvent company
General input
Insolvent company
£ million
Resale value of fixed and current assets 5.000
Order of claims
Professional fees for wind up 0.033
Employees salaries outstanding 0.900
Corporation tax Per balance sheet
VAT Per balance sheet
Secured creditors: senior debt Per balance sheet
Unsecured creditors Per balance sheet
Ordinary shareholders Per balance sheet
Scheme of reconstruction
New debt issue 7.000
Issue senior debt holder with shares 5.000
Repay unsecured creditors
Balance to increase working capital
Source: Author’s own

The Strategic Corporate Investments Handbook
146
The general assumptions which are made regarding the position of the company is outlined in Exhibit 3.17.
The balance sheet of an insolvent company is shown in Exhibit 3.18 and the company’s financial position shows £8 million of debt outstanding, an overdraft of £0.3 million and no trade debtors that can be collected and converted to cash.
Exhibit 3.18
Balance sheet insolvent company
BAlANCE SHEET
Insolvent company
Period ending 31 Dec 2014
Actual
£ million
Fixed assets – net book value 2.8
Current assets
Cash –0.3
Accounts receivable 1.0
Stock 4.0
Other current assets 14.9
19.6
Current liabilities
Accounts payable 1.5
VAT payable/(receivable) 0.2
Tax payable 0.3
2.0
long-term liabilities
Senior debt 8.0
8.0
Net assets 12.4
Financed by
Equity 15.0
Retained earnings –2.6
Shareholders’ funds 12.4
Source: Author’s own
We must remember that the balance sheet in Exhibit 3.18 is stated at historic cost and what is actually realised is in the form of cash receipt in order to pay the claims on the

Corporate investment decisions
147
company’s assets. We can see from the balance sheet in Exhibit 3.18 that the company has fixed assets of £2.8 million and current assets of £19.6 million. Unfortunately, the company has only been able to obtain £5 million on liquidation of company’s assets.
So, which parties get the £5 million? Let us assess this in the order of priority outlined above.The liquidation summary in Exhibit 3.19 shows the position of the company and its
claims upon its final wind up.
Exhibit 3.19
Liquidation summary 2
lIquIDATION SuMMARY 2
Insolvent company
£ million
Resale value of fixed and current assets 5.000
Order of claims Paid unpaid Check
Professional fees for wind up 0.033 0.000
Employees salaries outstanding 0.900 0.000
Corporation tax 0.300 0.000
VAT 0.200 0.000
Secured creditors: senior debt 3.567 4.433 0.000
Unsecured creditors 1.500 0.000
Ordinary shareholders 15.000 0.000
Total claims 5.000 20.933 0.000
Check 0.000
Reconciliation
£ million
Total claims per balance sheet 25.000
Other claims 0.933
25.933
Claims paid 5.000 19.3%
Unpaid claims 20.933 80.7%
25.933
Source: Author’s own
The liquidation summary shows how the £5 million which is raised through the sale of the current and fixed assets. This allocation is in the specific type of order outlined above. We can see that the professional fees, salaries and taxes are all paid. The majority of the senior debt is paid. However, the majority of the claims are unpaid; part of the senior lenders’ debt and all of the trade creditors or accounts payable are outstanding; and all of
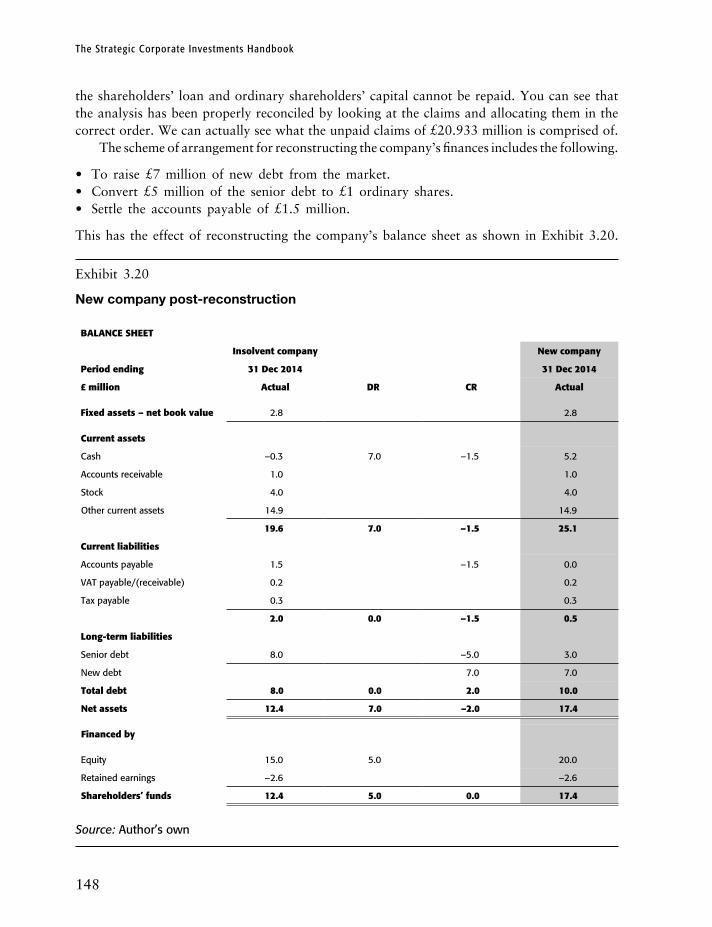
The Strategic Corporate Investments Handbook
148
the shareholders’ loan and ordinary shareholders’ capital cannot be repaid. You can see that the analysis has been properly reconciled by looking at the claims and allocating them in the correct order. We can actually see what the unpaid claims of £20.933 million is comprised of.
The scheme of arrangement for reconstructing the company’s finances includes the following.
• To raise £7 million of new debt from the market.• Convert £5 million of the senior debt to £1 ordinary shares.• Settle the accounts payable of £1.5 million.
This has the effect of reconstructing the company’s balance sheet as shown in Exhibit 3.20.
Exhibit 3.20
New company post-reconstruction
BAlANCE SHEET
Insolvent company New company
Period ending 31 Dec 2014 31 Dec 2014
£ million Actual DR CR Actual
Fixed assets – net book value 2.8 2.8
Current assets
Cash –0.3 7.0 –1.5 5.2
Accounts receivable 1.0 1.0
Stock 4.0 4.0
Other current assets 14.9 14.9
19.6 7.0 –1.5 25.1
Current liabilities
Accounts payable 1.5 –1.5 0.0
VAT payable/(receivable) 0.2 0.2
Tax payable 0.3 0.3
2.0 0.0 –1.5 0.5
long-term liabilities
Senior debt 8.0 –5.0 3.0
New debt 7.0 7.0
Total debt 8.0 0.0 2.0 10.0
Net assets 12.4 7.0 –2.0 17.4
Financed by
Equity 15.0 5.0 20.0
Retained earnings –2.6 –2.6
Shareholders’ funds 12.4 5.0 0.0 17.4
Source: Author’s own
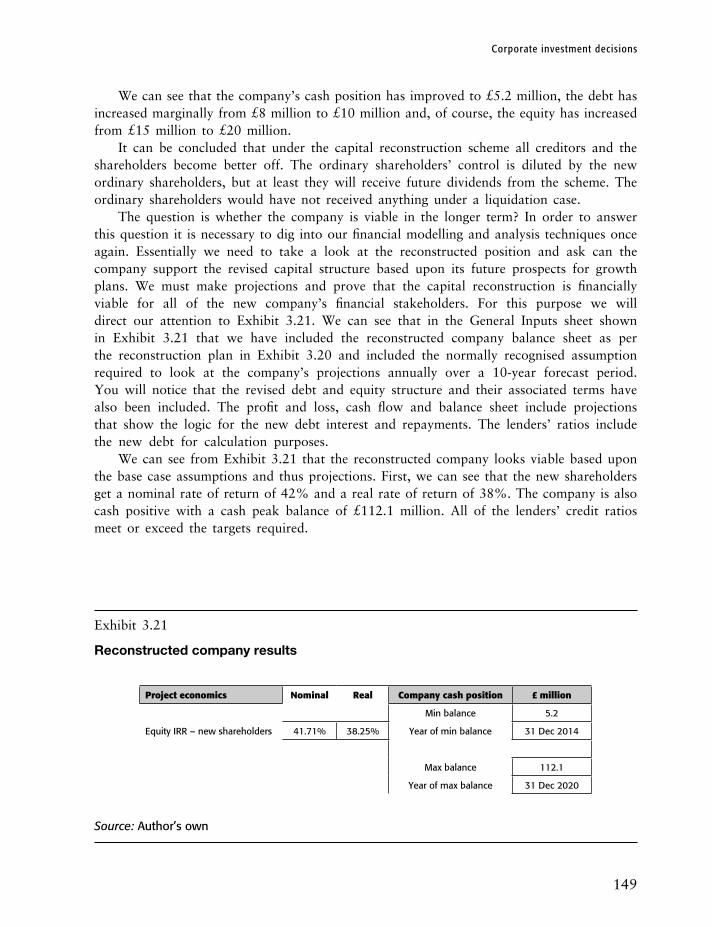
Corporate investment decisions
149
We can see that the company’s cash position has improved to £5.2 million, the debt has increased marginally from £8 million to £10 million and, of course, the equity has increased from £15 million to £20 million.
It can be concluded that under the capital reconstruction scheme all creditors and the shareholders become better off. The ordinary shareholders’ control is diluted by the new ordinary shareholders, but at least they will receive future dividends from the scheme. The ordinary shareholders would have not received anything under a liquidation case.
The question is whether the company is viable in the longer term? In order to answer this question it is necessary to dig into our financial modelling and analysis techniques once again. Essentially we need to take a look at the reconstructed position and ask can the company support the revised capital structure based upon its future prospects for growth plans. We must make projections and prove that the capital reconstruction is financially viable for all of the new company’s financial stakeholders. For this purpose we will direct our attention to Exhibit 3.21. We can see that in the General Inputs sheet shown in Exhibit 3.21 that we have included the reconstructed company balance sheet as per the reconstruction plan in Exhibit 3.20 and included the normally recognised assumption required to look at the company’s projections annually over a 10-year forecast period. You will notice that the revised debt and equity structure and their associated terms have also been included. The profit and loss, cash flow and balance sheet include projections that show the logic for the new debt interest and repayments. The lenders’ ratios include the new debt for calculation purposes.
We can see from Exhibit 3.21 that the reconstructed company looks viable based upon the base case assumptions and thus projections. First, we can see that the new shareholders get a nominal rate of return of 42% and a real rate of return of 38%. The company is also cash positive with a cash peak balance of £112.1 million. All of the lenders’ credit ratios meet or exceed the targets required.
Exhibit 3.21
Reconstructed company results
Project economics Nominal Real Company cash position £ million
Min balance 5.2
Equity IRR – new shareholders 41.71% 38.25% Year of min balance 31 Dec 2014
Max balance 112.1
Year of max balance 31 Dec 2020
Source: Author’s own

Exhibit 3.22
Reconstructed company results
lenders credit ratios Min Target Year of min/max Average
ok Target max
Debt to equity ratio – max 33.3% 80.0% 31 Dec 2014 22.1%
ok Target max
Free cashflow to debt – min 390.3% 60.0% 31 Dec 2012 648.1%
ok Target max
Debt to EBITDA – max 33.3% 60.00% 31 Dec 2011 17.0%
ok Target max
Debt to net assets – max 57.5% 90.00% 31 Dec 2014 19.8%
ok Target min
Interest cover – min 41.2 2.0 31 Dec 2011 97.1
Source: Author’s own
151
Chapter 4
Other areas
Credible business projections
It is important that any financial projections that underpin corporate financial decision making are prepared in a credible manner, as the organisation needs to make an investment decision. There are a number of key areas that are important.
• Clear assumptions – the assumptions which the projections are based upon should be clearly laid out in separate assumptions sheets.
• Transparent logic – this logic should be as easy to interpret as possible and comply with the material logic requirements of the corporate financial decision.
• Compliant – compliance is required with taxation, accounting, legal agreements and preliminary documentation.
When we have the requirements to produce financial projections it is generally accepted that a financial model would be built in Excel. The approach that is recommended in order to achieve the objective of producing credible financial projections is known as financial modelling best practice (FMBP). The purpose of this chapter is not for it to be intended as a substitute for following a detailed financial modelling text. If the reader wants to explore this area in more detail then they should read other Euromoney books on this subject.
Financial modelling best practice
A recommended approach to FMBP is shown in Exhibit 4.1. A structured approach which should ideally be adopted is often referred to as ‘financial modelling best practice’. This is because the financial modelling for corporate finance projects is high risk due to the fact that millions of pounds sterling are involved with a number of complex calculations and arrangements that a structured approach is desired. We recommend that an FMBP approach is applied to all financial modelling projects not just corporate finance projects.

The Strategic Corporate Investments Handbook
152
Exhibit 4.1
Financial modelling best practice
Versioncontrol
Changecontrol
• Purpose • Sensitivities • Timescales
• Key outputs • Functionality • Periodicity
• Specification document • Sponsors buy In
• Excel? • Workbooks? • Modularisation
• Inputs/calcs/outputs • Unique formula
• Simple formula • Check sums
• User and technical • Data book
• Analytical review • Key outputs review• Sensitivities
• Handover session
Scope
Specify
Design
Build
Document
Test
Use
Source: Author’s own
However, in the past the author has often been asked: Isn’t FMBP too rigid? The answer to this is that a balance should ideally be struck given the fact that an organisation is bidding or trying to close a transaction over a reasonably tight timescale. In fact, the vast majority of financial close models are not particularly well designed given this very fact.
Let us walk through Exhibit 4.1 and discuss how FMBP relates to the need to build and rely upon the results to be derived from a bid or financial close model.
In the scoping stage, we will first take a look at stating the purpose of the model. The purpose of this model is to prepare forecasts to provide financial projections of an existing business over a 10-year planning horizon.
In terms of the key output schedules that are required, these would be the profit and loss, cash flow and balance sheet which are usually annually over a 10-year forecast period. Some key outputs need to be shown which address both the equity providers’ and lenders’ needs of this existing business.
Sensitivities (the ability to flex the company’s assumptions and observe the impact upon the results in the base case) should be derived from the company’s risk assessment process. The major business and financial risks should always be defined as sensitivity cases and the impact measured and mitigated accordingly.

Other areas
153
The timescale that you have for your corporate finance modelling project given where you are is critical given the size of the scope or type of resource required. For example, if time is tight you may want to limit the outputs of your model to a bare minimum and ensure that you use an experienced modeller on the project, who is able to close out the work efficiently.
Functionality refers to the need to have special facilities in the model over and above the basic calculations. An example of this would be any required optimisation of perhaps data table functionality.
At the specification stage, it is advisable to prepare a document that considers the purpose of the model, key outputs, material calculations and assumptions as highlighted in the scoping stage above. An example of a specification template that can be completed in order to scope and specify the financial model is shown in Box 4.1.
Continued
Box 4.1Specification template
Specification V1The Financial Model for the
Project Xxxxxxxxxxx Forecasting Purposes
Contents
Objective of the ModelUsers of the ModelOutput Schedules RequiredMaterial CalculationsInput DataFunctionality RequiredAppendices
1 Objective of the modelThe model will be used for 10 financial projections for both shareholders and lender purposes.The objective of the model is to provide 10 years’ financial forecasts on a yearly basis.
• Cash flow<TBA>.• Profit and loss account <TBA>.• Balance sheet <TBA>.• Key ratios<TBA>. Both lenders’ credit ratios and shareholders’ equity IRRs.
Appendix A shows the outputs outlined above.

The Strategic Corporate Investments Handbook
154
Box 4.1 continued
2 Users of the ModelThe model will be owned and used by XXXXXXXX and his team.The model will be made available to <TBA> bank.
Output Schedules RequiredThe output schedule formats are outlined in Appendix A.
3 Material Calculations(a) <specify new products>(b) <specify others>(c) <specify others>(d) <specify others>
4 Input DataThe inputs are as required to be derived from the models outputs and calculations and a financial modeller will define these. More specifically <TBA>.
5 Functionality Required• <user menu bars for navigation> <TBA>• <defined sensitivity cases> <TBA>• <any optimisations> <TBA>• <any other areas> <TBA>
Appendix AOutput Schedules• Cash flow format<TBA>
<attach specimen outputs>• Profit & loss account <TBA>
<attach specimen outputs>• Balance sheet<TBA>
<attach specimen outputs>• Key output summary<TBA>
<attach specimen outputs>
Appendix BInput Schedules
The inputs are as required from the model’s outputs and calculations and ‘author’s own’ will define these where they have not been outlined.

Other areas
155
Moving on to the design stage, it is often important to consider whether Excel is the best platform for this modelling and given the nature of corporate finance bid projects the answer to this point is almost always a ‘yes’ with 99.9% certainty.
Consider how many Excel workbooks are required. Given the author’s knowledge and experience of financial close or bid financial modelling, normally a single Excel workbook will suffice. However, a very important consideration is the model’s structure and layout. We prefer to adopt a modular approach reflecting the sheet names which are labelled with common sense names.
From experience, we have often witnessed financial staff and modellers jump straight into the build stage and indeed many best practice methodologies ignore the other processes or stages associated with FMBP outlined in this book.
However, once you are at your keyboard at your copy of Excel, we recommend that the following simple concepts are adopted. The first principle is to keep a clear separation of inputs, calculations and outputs. More simply put, try to design the model so that it reads like a book from left to right. Where you cannot avoid including calculations with your inputs, please ensure that you protect the calculation cells appropriately. The second principle is to only use 1 unique formula per row. What this means exactly is the logic placed in the first column should be copied across all columns of a timeline. This makes it easier for both you and others to evaluate your formulae. Third, in order to ensure logical accuracy along the way, we recommend as many cross checks and audit checks are placed in the model as possible. Some obvious ones are balance sheets balancing, cash flows equalling the movement in the balance sheet, and net profits equalling the movement in the balance sheet retained earnings, amongst many others.
The author’s final pointer is to try to keep your formula as simple as possible and your labels as clear as possible. However, it is also recognised that it is often difficult to have very simplistic formulae when a financial model builder is trying to gain flexibility in respect of the calculations and assumptions in the financial model. Again, we recommend that a balanced approach is adopted.
Documentation refers to the need to produce user and technical documentation and a data book, which is more fully discussed under ‘Finalising the existing business corporate financial model’.
The testing and the use of the model will also be more fully discussed under ‘Self-testing the model’.
We further recommend both version and change control logs are kept in your model. First, ensure that each model version has a sequentially numbered suffix at the end of the Excel file name, for example, financialmodelV1.xls, and where timing permits log the differences between each model version in the model’s version control sheet (see Exhibit 4.2). Second, you can use the model’s change request log for changes requested or work outstanding and their status (see Exhibit 4.3).

Exhibit 4.2
Version control
Number File name Date Changes/comments Modeller’s name
1
2
3
4
5
6
7
Source: Author’s own
Exhibit 4.3
Change control
Number File name Date Change request details Modeller’s name Status
1
2
3
4
5
6
7
8
9
10
Source: Author’s own
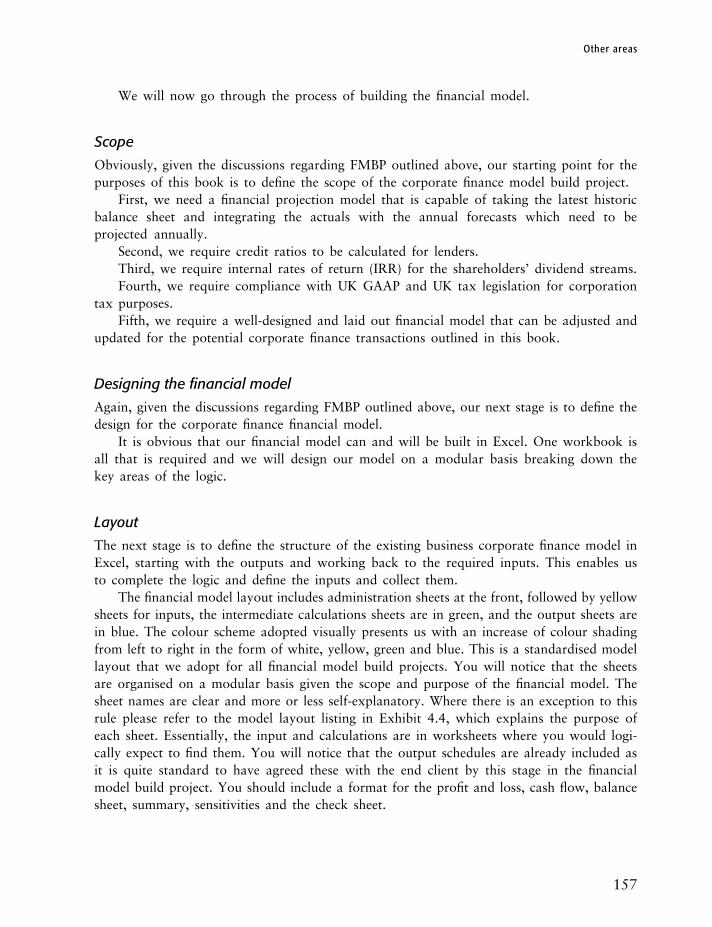
Other areas
157
We will now go through the process of building the financial model.
Scope
Obviously, given the discussions regarding FMBP outlined above, our starting point for the purposes of this book is to define the scope of the corporate finance model build project.
First, we need a financial projection model that is capable of taking the latest historic balance sheet and integrating the actuals with the annual forecasts which need to be projected annually.
Second, we require credit ratios to be calculated for lenders.Third, we require internal rates of return (IRR) for the shareholders’ dividend streams. Fourth, we require compliance with UK GAAP and UK tax legislation for corporation
tax purposes.Fifth, we require a well-designed and laid out financial model that can be adjusted and
updated for the potential corporate finance transactions outlined in this book.
Designing the financial model
Again, given the discussions regarding FMBP outlined above, our next stage is to define the design for the corporate finance financial model.
It is obvious that our financial model can and will be built in Excel. One workbook is all that is required and we will design our model on a modular basis breaking down the key areas of the logic.
Layout
The next stage is to define the structure of the existing business corporate finance model in Excel, starting with the outputs and working back to the required inputs. This enables us to complete the logic and define the inputs and collect them.
The financial model layout includes administration sheets at the front, followed by yellow sheets for inputs, the intermediate calculations sheets are in green, and the output sheets are in blue. The colour scheme adopted visually presents us with an increase of colour shading from left to right in the form of white, yellow, green and blue. This is a standardised model layout that we adopt for all financial model build projects. You will notice that the sheets are organised on a modular basis given the scope and purpose of the financial model. The sheet names are clear and more or less self-explanatory. Where there is an exception to this rule please refer to the model layout listing in Exhibit 4.4, which explains the purpose of each sheet. Essentially, the input and calculations are in worksheets where you would logi-cally expect to find them. You will notice that the output schedules are already included as it is quite standard to have agreed these with the end client by this stage in the financial model build project. You should include a format for the profit and loss, cash flow, balance sheet, summary, sensitivities and the check sheet.
The Strategic Corporate Investments Handbook
158
Exhibit 4.4
Layout
worksheet name Description
Cover This represents the cover with the disclaimer.
Version control This represents the version control log.
Change control This represents the change control log.
General inputs The general inputs for the base case projections.
Sensitivity inputs The sensitivity inputs are entered here.
Sales-costs-accounting This represents the sales, operating costs and accounting.
Financing and working capital This represents the financing and working capital calculations.
Taxation This represents the taxation calculations.
Equity returns and lenders’ ratios This represents the shareholder returns and lenders’ credit ratios calculations.
Sensitivity calcs 1 This represents the holding area for sensitivity calculations.
Sensitivity calcs 2 This represents the holding area for sensitivity calculations.
Sensitivity calcs 3 This represents the holding area for sensitivity calculations.
Sensitivity calcs 4 This represents the holding area for sensitivity calculations.
Sensitivity calcs 5 This represents the holding area for sensitivity calculations.
Profit and loss This represents the profit and loss forecast over the 10-year forecast period.
Cash flow This represents the cash flow over the 10-year forecast period.
Balance Sheet This represents the balance sheet over the 10-year forecast period.
Summary This is a summary sheet for the project.
Sensitivities This is the summary of each of the sensitivity results against the base case results.
Checks This is the check sheet which ensures that the calculations in the model cross check.
Source: Author’s own
Finalising the existing business corporate financial model
We recommend that the workbook is appropriately protected so only the yellow input cells can be updated, and the worksheets and the workbook is protected. This will prevent any corruption to the model.
Sources of error
Given the discussions outlined in this book and the nature of corporate finance financial models there are several potential sources of errors. These can be summarised as follows.
Other areas
159
• Logic error. A logic error arises due to a calculation error in the formula, for example, summing the wrong range.
• Assumption/input error. If an input assumption is not as per the financial case then an error occurs, for example, discount rate should be 12% not 10%!
• Documentation error. The debt repayment profile may not comply with the basis outlined in the relevant legal documentation.
• Data book error. The debt repayment profile may not comply with the basis outlined in the data book.
• Taxation compliance. If the tax treatment for certain expenses is not tax deductible and is subtracted from the taxable profit then there is a tax compliance issue of a sort.
• Accounting compliance. If a certain item has been capitalised but under the relevant accounting treatment, for example, UK GAAP, IFRS, immediate write off is required then we have an accounting compliance issue of a sort.
Self-testing the model
Once the model builder has completed a draft model they should stand back and undertake some self-review. We recommend that the minimum amount of self-review or self-testing should include the following methods.
Top level analytical review
This technique involves reviewing the big picture. It is good for detecting potentially large errors for one model run for the base case or specific sensitivity cases. This is a similar technique to the evaluation of financial statements in a financial audit. The approach may involve the computation of key ratios over the forecast period – look at revenue, cost and financing structures. Where possible you should correlate back to the inputs. Some examples of correlating the inputs with the outputs would be trade debtor assumptions, trade creditor assumptions, interest rate assumptions and any other assumptions in the model that you could relate to the model’s outputs.
Key areas can be graphed. This helps to evaluate the trends and highlight any blips. You should look for any obvious irregularities such as balance sheets not balancing, cash flows for the period not equalling the movement in cash balance for the balance sheet, any negative debt balances and any other basic checks.
We will now turn our attention to a specific example of analytical review techniques applied to the corporate finance model in Exhibit 4.5.

Exhibit 4.5
Analytical review
Balance sheet reconciles? ok reconciles
Cash reconciles? ok reconciles
Opening cash balance
Cash generated during the year per the cash flow
Closing cash balance
Cash balance per the balance sheet
Profit reconciles? ok reconciles
Opening profit per balance sheet
Profit generated during the year
Closing profit balance sheet reperformed
Cash balance per the balance sheet
Sales growth ok reasonable as per assumptions
Gross profit margin ok reasonable as per assumptions
EBITDA margin ok reasonable as per assumptions
EBIT margin ok reasonable as per assumptions
Tax to EBT ok reasonable as per assumptions
Senior debt profile ok reconciles
Opening debt per balance sheet
Debt drawn
Debt repaid
Closing debt balance sheet reperformed
Debt balance per the balance sheet
Shareholder loan profile ok reconciles, but why the negative drawn amount?
Opening debt per balance sheet
Debt drawn
Debt repaid
Closing debt balance sheet reperformed
Debt balance per the balance sheet
Interest – senior debt
Continued
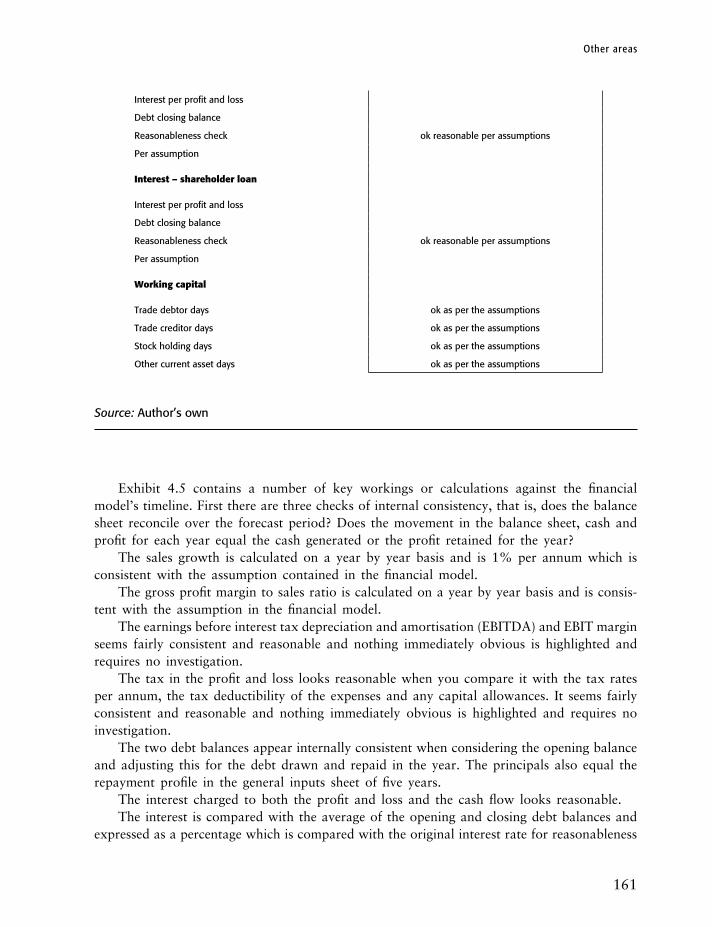
Other areas
161
Interest per profit and loss
Debt closing balance
Reasonableness check ok reasonable per assumptions
Per assumption
Interest – shareholder loan
Interest per profit and loss
Debt closing balance
Reasonableness check ok reasonable per assumptions
Per assumption
working capital
Trade debtor days ok as per the assumptions
Trade creditor days ok as per the assumptions
Stock holding days ok as per the assumptions
Other current asset days ok as per the assumptions
Source: Author’s own
Exhibit 4.5 contains a number of key workings or calculations against the financial model’s timeline. First there are three checks of internal consistency, that is, does the balance sheet reconcile over the forecast period? Does the movement in the balance sheet, cash and profit for each year equal the cash generated or the profit retained for the year?
The sales growth is calculated on a year by year basis and is 1% per annum which is consistent with the assumption contained in the financial model.
The gross profit margin to sales ratio is calculated on a year by year basis and is consis-tent with the assumption in the financial model.
The earnings before interest tax depreciation and amortisation (EBITDA) and EBIT margin seems fairly consistent and reasonable and nothing immediately obvious is highlighted and requires no investigation.
The tax in the profit and loss looks reasonable when you compare it with the tax rates per annum, the tax deductibility of the expenses and any capital allowances. It seems fairly consistent and reasonable and nothing immediately obvious is highlighted and requires no investigation.
The two debt balances appear internally consistent when considering the opening balance and adjusting this for the debt drawn and repaid in the year. The principals also equal the repayment profile in the general inputs sheet of five years.
The interest charged to both the profit and loss and the cash flow looks reasonable.The interest is compared with the average of the opening and closing debt balances and
expressed as a percentage which is compared with the original interest rate for reasonableness
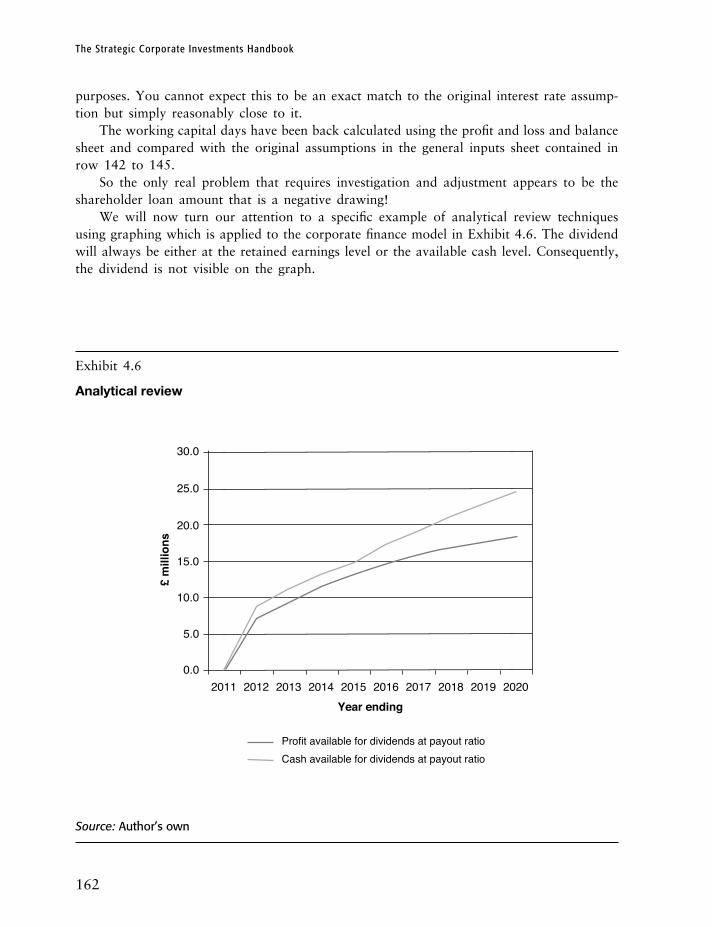
The Strategic Corporate Investments Handbook
162
purposes. You cannot expect this to be an exact match to the original interest rate assump-tion but simply reasonably close to it.
The working capital days have been back calculated using the profit and loss and balance sheet and compared with the original assumptions in the general inputs sheet contained in row 142 to 145.
So the only real problem that requires investigation and adjustment appears to be the shareholder loan amount that is a negative drawing!
We will now turn our attention to a specific example of analytical review techniques using graphing which is applied to the corporate finance model in Exhibit 4.6. The dividend will always be either at the retained earnings level or the available cash level. Consequently, the dividend is not visible on the graph.
Exhibit 4.6
Analytical review
30.0
25.0
20.0
15.0
10.0
5.0
0.02011 2012 2013 2014 2015 2016 2017 2018 2019 2020
Year ending
Profit available for dividends at payout ratioCash available for dividends at payout ratio
Source: Author’s own

Other areas
163
Exhibit 4.6 shows the dividends declared in the profit and loss and paid in the cash flow for each year. The actual profits and cash available for dividends and the payout ratio have been used to ensure that distributable reserves and the cash in the company have been maintained. From Exhibit 4.6 the dividend does not exceed the cash available, thus ringing no alarm bells.
Key output reviewThe key outputs ratios such as credit ratios, IRRs and so on, are likely to produce mate-rial errors where an error exists as they are at the highest level. It is recommended that the results and the logic behind the key outputs are reviewed appropriately.
Flex and sensitivity reviewFlex testing is a valuable technique for finding potentially large errors in a model. It involves the variation of inputs and the observation of the effect on the outputs. It is important to concentrate on key risk areas.
A sensitivity can be evaluated by changing the inputs required for the designated sensi-tivity case and evaluating the results. However, it is better to use a sensitivity comparison to the base case, that is, tracking changes between the outputs and assessing whether the model changes in areas as expected. Both flex testing and sensitivity evaluating should use this approach and should collaborate each sensitivity with a high level analytical evaluation. The final part would be to rank each result in order and assess the relative ranking given your knowledge of the case.
Using the modelFrom the financial model that you have built you have the capability to prepare a financially viable bid from all stakeholder viewpoints. The company will provide adequate returns to its shareholders, sufficient debt service to its lenders and any other material output areas will be considered.
DisclaimersIt is highly recommended that given the multiple sources that can lead to errors in financial models of this nature that liability needs to be waived as appropriate. Box 4.2 outlines a typical disclaimer that should always be placed in a financial model before it is distributed.
Box 4.2Disclaimer
This model has been prepared by Authors Own from data provided by various parties. It has not been audited and recipients should use their own due diligence. No representation, warranty or undertaking (expressed or implied) is made in relation to it. No responsibility is taken or accepted by Authors Own for the accuracy of the model or the assumptions on which it is based and all liability therefore is expressly excluded.
The Strategic Corporate Investments Handbook
164
Sales documents
We will now address the best practice approach for developing two key sales documents that will help raise finance or undertake a transaction from both a corporate finance and project finance basis.
The sales and marketing document typically used for project finance purposes is called a project information memorandum. The sales document used for a corporate finance transac-tion is typically known as an offer memorandum.
Reviewing and auditing financial projections
It is highly likely that you will encounter a financial model being used in order to prepare the forecast for a corporate transaction that your organisation is involved with. Due to the large amounts of capital at risk and the chance of making the wrong decision due to errors arising, it is necessary to provide assurance on either a limited scope basis or a full scope financial model audit opinion basis.
Limited scope financial model reviews
There will be certain circumstances when a limited review of the financial model is necessary. This could be when there is not time for a full audit or indeed a full model audit is not necessary. We often hear people confusing a limited review or a quick look at a financial model as an audit. An audit is more definitive, looking at a much fuller scope and it is important for a reviewer to make this point clear.
A limited scope review can be undertaken by either an individual or a professional company. However, due to its limited nature, it is recommended that an opinion letter is not presented regarding this type of review. It is apparent that the scope will be so limited that it will be difficult to conclude whether the financial model materially meets its objec-tive. Indeed, it is normal practice to simply report a list of findings and discuss these with the model developer based upon the agreed limited scope. A very important caveat to use at the start of the exercise and at the reporting stage is wording such as: ‘You have asked us to undertake a limited review of the financial model, accordingly our work is limited and there may be errors that exist that are beyond the scope of our review.’
Getting a grip on a large and complex financial model is a real challenge, particularly when time is of the essence. When under pressure, the techniques which we will discuss here can swiftly reduce, but not fully eliminate, modelling risk. However, being focused on what is important and being creative with your testing techniques can ensure that the greatest value is obtained from the time spent reviewing the financial model.
Make sure you understand the structure and flow of the financial model through a discussion with the modeller. This can be supplemented by the use of a spreadsheet audit tool, such as Spreadsheet Professional. Agree with the modeller what the key outputs of the model are and whether any areas are low risk or could even be ignored.
Consequently, it is important to reach an agreement on potential risks with the model builder/decision maker before commencing the review.
Other areas
165
It may be that certain components of the model carry a higher risk in terms of making or breaking the deal or indeed the complexity or risk of calculation. Other areas could be low risk or could even be ignored.
It is from such discussions that a risk-based testing plan can be structured. The following outlines the available tools and techniques that potentially could be used
when less time is available or a full financial model audit is not appropriate.
Design review
It is necessary to make a quick assessment of whether the model appears to be fit for purpose and is built to an adequate standard.
A model design review is useful for a quick fit for purpose test and this should be done before addressing any other areas because if the model is poorly designed it will need significant rework – in other words spot the dogs quickly!
The approach that we suggest involves the following tasks, which are intended to provide a basis for comparison to good practice build standards. A spreadsheet auditor tool, such as Spreadsheet Professional, OAK and so on, can help identify certain potential design issues. The first check is the degree of hard coded cells, that is, those which represent mere numerical inputs – obviously, these will also not change when the assumptions are changed. The second check is the degree of separation of inputs, calculations and outputs. The third is the degree of inconsistency in formula copying. The fourth is the degree of embedded assumptions within formulae. It is important to distinguish between constants and embedded assumptions. Constants are required in order to perform the calculations from the input assumptions, for example, dividing annual cash flows by 52 in order to calculate a weekly result. A risk exists with embedded assumptions because they will not be updated as the model’s inputs or the scenarios change. The results from the key design tests can be assigned risk ratings in terms of high, medium or low design risks. A summary risk categorisation can be made regarding the overall design or build quality of the model.
Analytical review
This technique involves reviewing the model’s ‘big picture’. It is good for detecting potentially large errors for one model run, typically the base case, but can be used when reviewing sensitivity cases. Key areas should be graphed because this facilitates interpretation and shows patterns and ‘blips’ not visible from the numbers alone and could indicate errors.
Degree of integration and reconciliation of financial statement forecasts
This issue is important because the failure to properly integrate profit and loss, balance sheet and cash flow is a common error. Financial statement forecasts should follow double entry principles and reconciliation in terms of the cash balance in the balance sheet and cash flow movement over the forecast period from the cash flow. We recommend a walk through review of the financial statement forecasts’ code, checking where the balance sheet cash figure comes from. If it is not from the cash flow be on guard for a fudged balance sheet. Varying the

The Strategic Corporate Investments Handbook
166
model’s input assumptions and checking that the balance sheet still balances and the cash balance reconciles to the cash flow any difference arising from the comparison should be rationalised and investigated as appropriate.
Flex testing and sensitivity review
This is a technique used for reviewing the reasonableness of the model’s sensitivity runs. It is important at this stage to differentiate flex testing from sensitivity testing. Sensitivity testing is where a stated sensitivity is reviewed, for example, a 10% increase in general inflation per annum. However, there are occasions where there is a requirement to test whether the model’s logical integrity is capable of stress testing. This will involve the flexing of the key input drivers in the model and the risk areas which are likely to be varied by the user. Consequently, in the case of flex testing it will not be known what exactly the values of the inputs values are likely to be at the review or testing stage. We recommend the following approach is taken.
• A transparent audit trail needs to be created from the financial model’s inputs to the financial model’s outputs. This will help to remove the black box risk and spot potential errors more easily. This can be achieved by freezing the specific financial models work-sheets in a reference sheet and extracting the variance and percentage variance between the test case and the model’s current results.
• The input assumptions should be varied for each flex or sensitivity case to be tested.• The effect on the calculations and results of each test should be reviewed for reasonable-
ness given the scenario. Here we are looking for reasonable changes where we expect to see them and no changes where we do not expect to see them.
• It is recommended that the variances or percentage variances do not appear as logic given the test case is investigated.
• It is advisable also that the use of comparing the logic movements is collaborated with the analytical review of the financial statements from a high, together with the ranking of the shareholder returns and lenders’ ratios and investigations made where the expected conditions do not hold.
Parallel or shadow modelling
Parallel or shadow modelling is a re-performance technique which can be used either for the model as a whole, which we believe is an audit approach for certain professional companies or for the areas that are perceived as the key risk areas, either due to materiality of an output area or indeed due to the complexity behind the calculation. The following approach is recommended.
• The rebuild of the area under review.• The comparison of the key results derived from the re-performance to the original model,
given the input assumptions are the same.• The differences which arise from the comparison should be rationalised and investigated
as appropriate.

Other areas
167
Macro review
A macro review technique is useful when the model’s key calculations are reliant on macro code. Modellers are increasingly using more complex macros and to a large degree this was due to the introduction of Excel’s increased programmability through Visual Basic for Applications (VBA). We need to differentiate between low and high risk macros. Low risk typically describes a macro or piece of Excel VBA code that is non-complex, relatively small with no program control structure, probably recorded with the objective of undertaking negative key strokes.
At the other end of the spectrum, lies the high risk case which typically describes a piece of Excel VBA code that is complex, relatively large and includes program control structures, for example, if then, do until, and for next.
We are primarily concerned with high risk VBA code that is complex and derives numbers.A good practice approach to reviewing VBA macro code is as follows. The first part
would be to understand the purpose of the VBA routine or macro. Second, you perform a walk through of the code, auditing against the documented purpose.
Third, the code should be annotated at every two or three lines by placing an apostrophe at the end of the relevant line to record your interpretation of the code as appropriate. Where the actual logic differs from the documentation, clearly this will need investigating. And finally, once the intentions and actual operations are understood, test runs should be designed, the macro run and the results reviewed by reference to the test data. This is impor-tant because the review of the macro’s code in isolation may not be completely reliable, and so collaboration with test data provides additional assurance.
Self-testing your corporate finance model exercise
If you have followed this book from the start, you probably have a version of a corporate financial model that you will want to apply some self-tests and checks to and debug any found errors as appropriate.
Please undertake the following self-test plan for your corporate finance model.
∑ Undertake an analytical review of the statement forecasts. ∑ Undertake a key outputs review of the lenders’ credit ratios and shareholders’ returns. ∑ Ensure that each menu bar operates as intended. ∑ Ensure that each check included in the ‘Checks’ module is zero. ∑ Ensure that each of the cross checks built into the blue outputs modules are equal to zero. ∑ Colour code the financial model using a colour coding tool, ensure adequate formula
copying, and inputs are only included in the yellow modules. ∑ Undertake a coding review of key unique formula, looking for any potential problems, for
example, those that form the key outputs or are particularly complex in nature.
Please reference the sections providing guidance on review techniques in other chapters of this book.

The Strategic Corporate Investments Handbook
168
Financial model audits – corporate finance models
Prior to the close of a corporate finance transaction the parties to the project (that is, share-holders and or lenders, as the case may be) may require a full scope financial model audit.
Box 4.3 shows a typical specimen financial model audit opinion letter from a profes-sional services company.
It is important to note that this chapter is based upon the views of the author only and not those of any professional services company.
Continued
Box 4.3Specimen model audit opinion
[Funder(s)] DateAddress Our ref: XXXX Project [Name]StreetCityPostcode
[Sponsor(s)]AddressStreetCityPostcode
Dear SirsFinancial model audit: The project (the ‘Project’)
1 IntroductionThis report (the ‘Report’) is addressed to the funder(s) (the ‘Funder(s)’) and the sponsor(s) (the ‘Sponsor(s)’), (together the ‘Client’, the ‘Addressee’ or ‘you’), and its contents will be solely for your use and may not be disclosed to any other parties except in accordance with the terms of our engagement and as noted in this Report.In accordance with the scope of professional services, as detailed in Appendix A of our engage-ment letter (‘Engagement Letter’) dated [the date], we have completed a review of the Project’s financial model (the ‘Model’) that was prepared using Excel spreadsheets.
1.1 ModelsFollowing initial review of the Model, an updated version reflecting agreed changes to the Model was reviewed. The final version of the Model (the ‘Final Model’) was updated for inputs at financial close (the ‘Financial Close Model’). The Financial Close Model, on which our Report is based, is identified below:
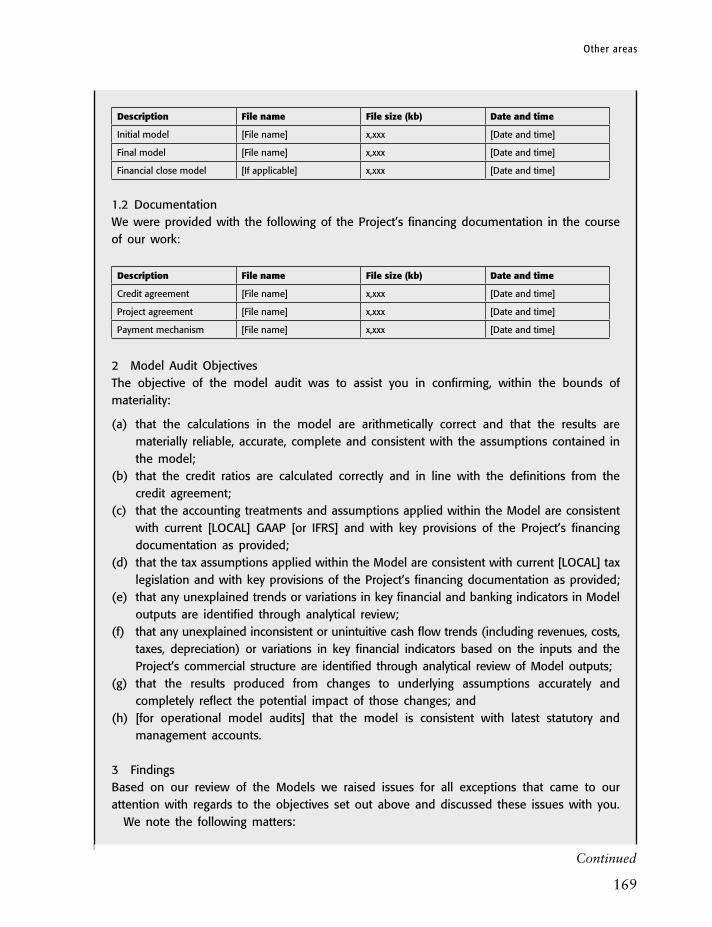
Other areas
169
Description File name File size (kb) Date and time
Initial model [File name] x,xxx [Date and time]
Final model [File name] x,xxx [Date and time]
Financial close model [If applicable] x,xxx [Date and time]
1.2 DocumentationWe were provided with the following of the Project’s financing documentation in the course of our work:
Description File name File size (kb) Date and time
Credit agreement [File name] x,xxx [Date and time]
Project agreement [File name] x,xxx [Date and time]
Payment mechanism [File name] x,xxx [Date and time]
2 Model Audit ObjectivesThe objective of the model audit was to assist you in confirming, within the bounds of materiality:
(a) that the calculations in the model are arithmetically correct and that the results are materially reliable, accurate, complete and consistent with the assumptions contained in the model;
(b) that the credit ratios are calculated correctly and in line with the definitions from the credit agreement;
(c) that the accounting treatments and assumptions applied within the Model are consistent with current [LOCAL] GAAP [or IFRS] and with key provisions of the Project’s financing documentation as provided;
(d) that the tax assumptions applied within the Model are consistent with current [LOCAL] tax legislation and with key provisions of the Project’s financing documentation as provided;
(e) that any unexplained trends or variations in key financial and banking indicators in Model outputs are identified through analytical review;
(f) that any unexplained inconsistent or unintuitive cash flow trends (including revenues, costs, taxes, depreciation) or variations in key financial indicators based on the inputs and the Project’s commercial structure are identified through analytical review of Model outputs;
(g) that the results produced from changes to underlying assumptions accurately and completely reflect the potential impact of those changes; and
(h) [for operational model audits] that the model is consistent with latest statutory and management accounts.
3 FindingsBased on our review of the Models we raised issues for all exceptions that came to our attention with regards to the objectives set out above and discussed these issues with you. We note the following matters:
Continued

The Strategic Corporate Investments Handbook
170
Box 4.3 continued
A typical full scope for a financial model audit includes the wording: ‘that within the bounds of materiality the model meets its objective.’ The objective for a financial close model is for a leveraged buyout typically to produce yearly profit and loss accounts, cash flows and balance sheets, lenders’ ratios and shareholder returns over the life of the forecast. Materiality is a concept
• <matters that require documenting in the report>
A summary of the undocumented assumptions noted and representations received during the review are included in Appendix A. A full list of issues raised during the course of our review is available upon request as an Annex to this report. It should be noted that:
• it is not practicable to test a computer model to an extent whereby it can be guaranteed that all errors have been detected and, accordingly, we can only give assurance on the Model within the bounds of materiality and for defined scenarios;
• our work did not include any work in the nature of a financial audit and we did not verify any of the assets or liabilities of the companies involved in the Project; and
• we make no comment on the validity of the assumptions, and express no opinion as to how closely the results actually achieved will compare with the Model’s projections.
4 ConclusionOn the basis of the work performed [subject to the matters noted in paragraph 3], the model audit objectives referred to in paragraph 2 have been met.
5 DistributionUnless expressly agreed the reports are intended for the exclusive use by you unless specified in the terms of our engagement.
Yours faithfully,
[Signatory]For and on behalf of XXXXXXXXX
Appendix A: undocumented assumptions and representations
We note the following undocumented assumptions and representations received:
• <note undocumented assumptions and representations received>

Other areas
171
adopted in an audit that considers whether the errors inherent will greatly change the decision, that is, where there is a lenders’ credit ratios target of 1.20, does a known error, given that we are calculating a result of 1.18, change the lending decision? In basic terms, a corporate finance model is not perfect but should give materially accurate calculations.
Certain things can be included in the scope of the audit or excluded from the scope of the audit as the case may be.
First, the compliance of the appropriate accounting treatment can be included in or outside the scope.
However, we need to explain why it is important that the adoption of the appropriate accounting treatment may be important to include. The reason is that accounting treatment is what usually drives the taxation and dividend distributions for the company or project.
The specific accounting treatment for a project can be UK GAAP, IFRS or the local accounting treatment depending upon the circumstances.
Obviously, from an equity provider’s point of view the accounting and taxation treatment is important in respect of their IRR. From a lender’s point of view accounting treatment is also important as the lender needs to safeguard against any potential over distribution of dividends and probably ensure that the dividend is only paid after the repayment of their interest and principal. Obviously, the taxation cash flow will impact upon the lender’s ratios.
There is also the consideration of whether the data book is included within the scope of the model audit. This involves the review of the data book into the financial model. The book of assumptions outlines the project’s input and logic assumptions and often the basis for the key outputs. It is recommended that where the data book is included in the scope that it is comprehensively prepared in terms of the assumption and material logic.
The project’s legal agreements can be defined as within the scope of the financial model audit. Here, similar to the data book review, this involves the review of the project’s various agreements, such as the Credit Agreement, the Project Agreement and so on. These are very lengthy documents and it is often recommended that specific sections are included within the scope as necessary or critical parts included in the data book.
We often see a section on undocumented assumptions in an opinion letter. This relates to the assumptions or logic in the financial model that are not included in the data book or legal documentation.
We will assume that most lenders and shareholders will only care that they get an opinion letter to their required scope in respect to their corporate finance project. However, there will be others amongst us who will really want to know how exactly does a financial model auditor form the opinion such as that outlined in Box 4.3? What type of work are they carrying out to get there? Based upon the author’s knowledge and experience of financial model audits, the following type of approach is typically taken.
Scoping
When a professional company receives a financial model from a bank or a sponsor for corporate finance transaction close it will have to go through a scoping exercise. This typi-cally involves a relatively quick inspection of the financial model. The scoping inspection will involve a high level look at the model very similar to a shorter version of an ‘analytical

The Strategic Corporate Investments Handbook
172
review’. A review of the model’s design may also be undertaken which may be similar to the ‘design review’ outlined under ‘Limited scope financial model reviews’. We would also expect that the model auditor runs his spreadsheet audit software (for example, Spreadsheet Professional, OAK) which will help to identify the model’s formula size and complexity, amongst other things. Based upon the financial close model that we have built we will take you through a typical financial model auditor’s scoping exercise with reference to some outputs generated by the Spreadsheet Professional spreadsheet audit added in and the use of the author’s in-house built colour coding tool.
Formula complexity is a key area when considering the size of a model audit task facing a model auditor. It is fairly obvious that the more complex a formula, the longer it will take to understand. The recommended approach for this task is to use a tool, such as Spreadsheet Professional, to provide a listing of the entire financial model’s unique formula on a sheet by sheet basis and make an assessment of the average degree of formula complexity for each worksheet. An example is shown in Exhibit 4.7 of such a formula listing which has been obtained from the Spreadsheet Professional software.
Exhibit 4.7
Formula complexity
Ref Label Calculation Result
B1
Equity returns and lenders ratios
=NOW()
=NOW()
=NOW()
22/03/2011 15:12
C1
Equity returns and lenders ratios
=YEAR(C3)
=YEAR(Period Ending)
=YEAR(31/12/2011)
2011
A2
undefined
=IF(Project_Name="","",Project_Name)
=IF(Project_Name="","",Project_Name)
=IF(Project_Name="","",Project_Name)
Company A
B3
Period ending
=EOMONTH(C3,-12)
=EOMONTH(Period Ending,-12)
=EOMONTH(31/12/2011,-12)
31/12/2010
C3
Period ending
=EOMONTH(Model_Start_Date,11)
=EOMONTH(Model_Start_Date,11)
=EOMONTH(Model_Start_Date,11)
31/12/2011
D3
Period ending
=EOMONTH(C3,12)
=EOMONTH(Period Ending,12)
=EOMONTH(31/12/2011,12)
31/12/2012
A10
undefined
=ꞌBalance Sheetꞌ!A22
=Senior Debt
=Senior Debt
Senior debt
Continued

M10
undefined
=SUM(ꞌBalance Sheetꞌ!B22:L22)-SUM(B10:L10)
=SUM(Senior Debt:Senior Debt)-SUM(undefined:undefined)
=SUM(12.1:0.0)-SUM(12.1:0.0)
0
B13
Senior debt
=’Balance Sheet’!B22
=Senior Debt
=12.1
12.1
M13
Senior debt
=SUM(ꞌBalance Sheetꞌ!B22:L22)-SUM(B13:L13)
=SUM(Senior Debt:Senior Debt)-SUM(Senior Debt:Senior Debt)
=SUM(12.1:0.0)-SUM(12.1:0.0)
0
B14
Equity
=ꞌBalance Sheetꞌ!B28
=Equity
=16.8
16.8
M14
Equity
=SUM(ꞌBalance Sheetꞌ!B28:L28)-SUM(B14:L14)
=SUM(Equity:Equity)-SUM(Equity:Equity)
=SUM(16.8:21.8)-SUM(16.8:21.8)
0
B15
Shareholder loan
=ꞌBalance Sheetꞌ!B21
=Shareholder Loan
=8.1
8.1
B16 Total debt and equity
=SUM(B13:B15)
=SUM(Senior Debt:Shareholder Loan)
=SUM(12.1:8.1)
37
B18
Debt to equity ratio
=IF(ROUND(B10,0)=0,"N/A",B10/B16)
=IF(ROUND(undefined,0)=0,"N/A",undefined/Total Debt & Equity)
=IF(ROUND(12.1,0)=0,"N/A",12.1/37.0)
0.327027027
B19
Debt to equity ratio max
=MAX(B18:L18)
=MAX(Debt to Equity Ratio:Debt to Equity Ratio)
=MAX(32.7%:N/A)
0.327027027
B20
Debt to equity max date
=INDEX($B$3:$L$3,MATCH(Debt_to_Equity_Ratio_Maximum,$B$18:$L$18,0))
=INDEX(Period Ending:Period Ending,MATCH(Debt to Equity Ratio Maximum,Debt to Equity Ratio:Debt to Equity Ratio,0))
=INDEX(31/12/2010:31/12/2020,MATCH(32.7%,32.7%:N/A,0))
31/12/2010
B21
Debt to equity average
=AVERAGE(B18:L18)
=AVERAGE(Debt to Equity Ratio:Debt to Equity Ratio)
=AVERAGE(32.7%:N/A)
0.247994363
C25
undefined
=Cashflow!C13
=undefined
=8.9
8.918432555
M25
undefined
=SUM(Cashflow!C13:L13)-SUM(C25:L25)
=SUM(undefined:undefined)-SUM(undefined:undefined)
=SUM(8.9:23.5)-SUM(8.9:23.5)
0
B26
Free cash flow
=SUM(B24:B25)
=SUM(undefined:undefined)
=SUM(undefined:undefined)
0
C29
Senior debt
=ꞌBalance Sheetꞌ!C22
=Senior Debt
=12.7
12.72138114
Continued

M29
Senior debt
=SUM(ꞌBalance Sheetꞌ!C22:L22)-SUM(C29:L29)
=SUM(Senior Debt:Senior Debt)-SUM(Senior Debt:Senior Debt)
=SUM(12.7:0.0)-SUM(12.7:0.0)
0
B30
Total debt
=SUM(B29:B29)
=SUM(Senior Debt)
=SUM(undefined)
0
B32
Free cash flow to debt ratio
=IF(ROUND(B30,0)=0,"N/A",B26/B30)
=IF(ROUND(Total Debt ,0)=0,"N/A",Free Cash Flow/Total Debt)
=IF(ROUND(0.0,0)=0,"N/A",0.0/0.0)
N/A
B33
Free cash flow to debt ratio min
=MIN(B32:L32)
=MIN(Free Cashflow to Debt Ratio:Free Cashflow to Debt Ratio)
=MIN(N/A:N/A)
0.701058514
B34
Free cash flow to debt ratio min date
=INDEX($B$3:$L$3,MATCH(Free_Cashflow_to_Debt_Ratio_Minimum,$B$32:$L$32,0))
=INDEX(Period Ending:Period Ending,MATCH(Free Cashflow to Debt Ratio Minimum,Free Cashflow to Debt Ratio:Free Cashflow to Debt Ratio,0))
=INDEX(31/12/2010:31/12/2020,MATCH(70.1%,N/A:N/A,0))
31/12/2011
B35
Free cash flow to debt ratio average
=AVERAGE(B32:L32)
=AVERAGE(Free Cashflow to Debt Ratio:Free Cashflow to Debt Ratio)
=AVERAGE(N/A:N/A)
3.638155197
C40
Senior debt
=ꞌBalance Sheetꞌ!C22
=Senior Debt
=12.7
12.72138114
M40
Senior debt
=SUM(ꞌBalance Sheetꞌ!C22:L22)-SUM(C40:L40)
=SUM(Senior Debt:Senior Debt)-SUM(Senior Debt:Senior Debt)
=SUM(12.7:0.0)-SUM(12.7:0.0)
0
C41
Total debt
=SUM(C39:C40)
=SUM(undefined:Senior Debt)
=SUM(undefined:12.7)
12.72138114
C44
EBITDA
=ꞌProfit & Lossꞌ!C10
=EBITDA
=29.5
29.5
M44
EBITDA
=SUM(ꞌProfit & Lossꞌ!C10:L10)-SUM(C44:L44)
=SUM(EBITDA:EBITDA)-SUM(EBITDA:EBITDA)
=SUM(29.5:29.1)-SUM(29.5:29.1)
0
C45
EBITDA
=SUM(C44:C44)
=SUM(EBITDA)
=SUM(29.5)
29.5
C47 Debt to EBITDA ratio
=IF(ROUND(C41,0)=0,"N/A",C41/C45)
=IF(ROUND(Total Debt,0)=0,"N/A",Total Debt/EBITDA)
=IF(ROUND(12.7,0)=0,"N/A",12.7/29.5)
0.431233259
B48 Debt to EBITDA ratio max
=MAX(B47:L47)
=MAX(Debt to EBITDA Ratio:Debt to EBITDA Ratio)
=MAX(undefined:N/A)
0.431233259
Exhibit 4.7 continued
Continued

B49
Debt to EBITDA ratio min date
=INDEX($B$3:$L$3,MATCH(B48,$B$47:$L$47,0))
=INDEX(Period Ending:Period Ending,MATCH(Debt to EBITDA Ratio Maximum,Debt to EBITDA Ratio:Debt to EBITDA Ratio,0))
=INDEX(31/12/2010:31/12/2020,MATCH(43.1%,undefined:N/A,0))
31/12/2011
B50
Debt to EBITDA average
=AVERAGE(B47:L47)
=AVERAGE(Debt to EBITDA Ratio:Debt to EBITDA Ratio)
=AVERAGE(undefined:N/A)
0.269671124
B54
Senior debt
=ꞌBalance Sheetꞌ!B22
=Senior Debt
=12.1
12.1
M54
Senior debt
=SUM(ꞌBalance Sheetꞌ!C22:L22)-SUM(C54:L54)
=SUM(Senior Debt:Senior Debt)-SUM(Senior Debt:Senior Debt)
=SUM(12.7:0.0)-SUM(12.7:0.0)
0
B55
Total debt
=SUM(B53:B54)
=SUM(undefined:Senior Debt)
=SUM(undefined:12.1)
12.1
B58
Net assets
=ꞌBalance Sheetꞌ!B24
=Net Assets
=16.8
16.8
M58
Net assets
=SUM(ꞌBalance Sheetꞌ!C24:L24)-SUM(C58:L58)
=SUM(Net Assets:Net Assets)-SUM(Net Assets:Net Assets)
=SUM(39.4:95.0)-SUM(39.4:95.0)
0
B59
Net assets
=SUM(B58:B58)
=SUM(Net Assets)
=SUM(16.8)
16.8
B61
Debt to net assets ratio
=IF(ROUND(B55,0)=0,"N/A",B55/B59)
=IF(ROUND(Total Debt,0)=0,"N/A",Total Debt/Net Assets)
=IF(ROUND(12.1,0)=0,"N/A",12.1/16.8)
0.720238095
B62
Debt to net assets ratio max
=MAX(B61:L61)
=MAX(Debt to Net Assets Ratio:Debt to Net Assets Ratio)
=MAX(72.0%:N/A)
0.720238095
B63
Debt to net assets ratio max date
=INDEX($B$3:$L$3,MATCH(Debt_to_Net_Assets_Ratio_Maximum,$B$61:$L$61,0))
=INDEX(Period Ending:Period Ending,MATCH(Debt to Net Assets Ratio Maximum,Debt to Net Assets Ratio:Debt to Net Assets Ratio,0))
=INDEX(31/12/2010:31/12/2020,MATCH(72.0%,72.0%:N/A,0))
31/12/2010
B64
Debt to net assets average
=AVERAGE(B61:L61)
=AVERAGE(Debt to Net Assets Ratio:Debt to Net Assets Ratio)
=AVERAGE(72.0%:N/A)
0.277054871
C68
EBIT
=ꞌProfit & Lossꞌ!C13
=EBIT
=26.7
26.68562364
M68
EBIT
=SUM(ꞌProfit & Lossꞌ!C13:L13)-SUM(C68:L68)
=SUM(EBIT:EBIT)-SUM(EBIT:EBIT)
=SUM(26.7:26.3)-SUM(26.7:26.3)
0
Continued

B70
EBIT
=SUM(B68:B69)
=SUM(EBIT:Cash Interest / (Expense))
=SUM(undefined:undefined)
0
C73
Interest – senior debt
=ꞌProfit & Lossꞌ!C16
=Interest - Senior Debt
=0.9
0.945058267
M73
Interest – senior debt
=SUM(ꞌProfit & Lossꞌ!C16:L16)-SUM(C73:L73)
=SUM(Interest - Senior Debt:Interest - Senior Debt)-SUM(Interest - Senior Debt:Interest - Senior Debt)
=SUM(0.9:0.0)-SUM(0.9:0.0)
0
B74
undefined
=SUM(B73:B73)
=SUM(Interest - Senior Debt)
=SUM(undefined)
0
B76
Interest cover ratio
=IF(ROUND(B73,1)=0,"N/A",B70/B74)
=IF(ROUND(Interest - Senior Debt,1)=0,"N/A",EBIT/undefined)
=IF(ROUND(undefined,1)=0,"N/A",0.0/0.0)
N/A
B77
Interest cover ratio min
=MIN(B76:L76)
=MIN(Interest Cover Ratio:Interest Cover Ratio)
=MIN(N/A:N/A)
28.56024364
B78
Interest cover ratio min date
=INDEX($B$3:$L$3,MATCH(Interest_Cover_Ratio_Minimum,$B$76:$L$76,0))
=INDEX(Period Ending:Period Ending,MATCH(Interest Cover Ratio Minimum,Interest Cover Ratio:Interest Cover Ratio,0))
=INDEX(31/12/2010:31/12/2020,MATCH(28.6,N/A:N/A,0))
31/12/2011
B79
Interest cover ratio average
=AVERAGE(B76:L76)
=AVERAGE(Interest Cover Ratio:Interest Cover Ratio)
=AVERAGE(N/A:N/A)
59.12358685
C86
General inflation index
=B86*(1+Inflation_Per_Annum)
=General Inflation Index*(1+Inflation_Per_Annum)
=1.000*(1+Inflation_Per_Annum)
1.025
C88
Equity drawn
=-Cashflow!C19
=-Equity Drawn
=-5.0
-5
M88
Equity drawn
=SUM(Cashflow!C19:L19)+SUM(C88:L88)
=SUM(Equity Drawn:Equity Drawn)+SUM(Equity Drawn:Equity Drawn)
=SUM(5.0:0.0)+SUM(-5.0:0.0)
0
C90
Dividends paid
=-Cashflow!C27
=-Dividends Paid
=-0.0
0
M90
Dividends paid
=SUM(Cashflow!C27:L27)+SUM(C90:L90)
=SUM(Dividends Paid:Dividends Paid)+SUM(Dividends Paid:Dividends Paid)
=SUM(0.0:-18.3)+SUM(0.0:18.3)
0
C92
Subordinated debt total – drawn
=-Cashflow!C17
=-Shareholders Loan Drawn
=--1.2
1.198273573
Exhibit 4.7 continued
Continued

M92
Subordinated debt total – drawn
=SUM(C92:L92)+SUM(Cashflow!C17:L17)
=SUM(Subordinated Debt Total - Drawn:Subordinated Debt Total - Drawn)+SUM(Shareholders Loan Drawn:Shareholders Loan Drawn)
=SUM(1.2:0.0)+SUM(-1.2:0.0)
0
C93
Subordinated debt total – repayment
=-Cashflow!C20
=-Shareholders Loan Principal
=--1.4
1.380345285
M93
Subordinated debt total – repayment
=SUM(Cashflow!C20:L20)+SUM(C93:L93)
=SUM(Shareholders Loan Principal:Shareholders Loan Principal)+SUM(Subordinated Debt Total - Repayment:Subordinated Debt Total - Repayment)
=SUM(-1.4:0.0)+SUM(1.4:0.0)
0
C94
Subordinated debt total – interest
=-Cashflow!C22
=-Shareholders Loan - Interest
=--1.1
1.125129482
M94
Subordinated debt total – interest
=SUM(C94:L94)+SUM(Cashflow!C22:L22)
=SUM(Subordinated Debt Total - Interest:Subordinated Debt Total - Interest)+SUM(Shareholders Loan - Interest:Shareholders Loan - Interest)
=SUM(1.1:0.0)+SUM(-1.1:0.0)
0
C95
Subordinated debt total – fees paid
=-Cashflow!C24
=-Shareholders Loan - Fees
=-0.0
-0.017974104
M95
Subordinated debt total – fees paid
=SUM(C95:L95)+SUM(Cashflow!C24:L24)
=SUM(Subordinated Debt Total - Fees Paid:Subordinated Debt Total - Fees Paid)+SUM(Shareholders Loan - Fees:Shareholders Loan - Fees)
=SUM(0.0:0.0)+SUM(0.0:0.0)
0
C96
Net shareholders loan cash flow
=SUM(C92:C95)
=SUM(Subordinated Debt Total - Drawn:Subordinated Debt Total - Fees Paid)
=SUM(1.2:0.0)
3.685774237
B100
Equity IRR – nominal
=IF(ISERROR(IRR(C100:L100,0.1)),0,IRR(C100:L100,0.1))
=IF(ISERROR(IRR(Equity IRR - Nominal:Equity IRR - Nominal,0.1)),0,IRR(Equity IRR - Nominal:Equity IRR - Nominal,0.1))
=IF(ISERROR(IRR(-5.0:18.3,0.1)),0,IRR(-5.0:18.3,0.1))
1.688836976
C100
Equity IRR – nominal
=C88+C90
=Equity Drawn+Dividends Paid
=-5.0+0.0
-5
B102
Equity IRR – real
=IF(ISERROR(IRR(C102:L102,0.1)),0,IRR(C102:L102,0.1))
=IF(ISERROR(IRR(Equity IRR - Real:Equity IRR - Real,0.1)),0,IRR(Equity IRR - Real:Equity IRR - Real,0.1))
=IF(ISERROR(IRR(-4.9:14.3,0.1)),0,IRR(-4.9:14.3,0.1))
1.623255587
C102
Equity IRR – real
=C100/C86
=Equity IRR - Nominal/General Inflation Index
=-5.0/1.025
-4.87804878
B104
Equity and sub debt IRR – nominal
=IF(ISERROR(IRR(C104:L104,0.1)),0,IRR(C104:L104,0.1))
=IF(ISERROR(IRR(Equity & Sub Debt IRR - Nominal:Equity & Sub Debt IRR - Nominal,0.1)),0,IRR(Equity & Sub Debt IRR - Nominal:Equity & Sub Debt IRR - Nominal,0.1))
=IF(ISERROR(IRR(-1.3:18.3,0.1)),0,IRR(-1.3:18.3,0.1))
7.348401049
Continued

The Strategic Corporate Investments Handbook
178
C104
Equity and sub debt IRR – nominal
=C88+C90+C96
=Equity Drawn +Dividends Paid +Net Shareholders Loan Cashflow
=-5.0+0.0+3.7
-1.314225763
B106
Equity and sub debt IRR – real
=IF(ISERROR(IRR(C106:L106,0.1)),0,IRR(C106:L106,0.1))
=IF(ISERROR(IRR(Equity & Sub Debt IRR - Real:Equity & Sub Debt IRR - Real,0.1)),0,IRR(Equity & Sub Debt IRR - Real:Equity & Sub Debt IRR - Real,0.1))
=IF(ISERROR(IRR(-1.3:14.3,0.1)),0,IRR(-1.3:14.3,0.1))
7.144781512
C106
Equity and sub debt IRR – real
=C104/C86=Equity & Sub Debt IRR - Nominal/General Inflation Index=-1.3/1.025
-1.282171477
Source: Spreadsheet Professional Software
Based upon the type of output in Exhibit 4.7 we can very quickly assess the complexity of each worksheet.
The number of unique formula is a key area when considering the size of a model audit task facing a model auditor. A unique formula can be defined as an Excel formula that holds when copied across the columns and down the rows which have identical logic. In terms of the need to understand the financial model, all other things being equal, the more unique formula a model has the longer it will take to understand. The recommended approach for this task is use a similar tool such as Spreadsheet Professional to provide a count of all the financial model’s unique formula on a sheet by sheet basis (see Exhibit 4.8).
Exhibit 4.8
Unique formula count
Summary statistics
Range analysed A1:M106
Number of numeric inputs 1
Number of formulas 468
Number of unique formulas 80
Unique cells are those that are not copies of the cell to the left or above.
Percentage of unique formulas 17%
Number of labels 98
Potential errors summary
Possible error condition Frequency
No precedents 1
Exhibit 4.7 continued
Continued

Blank cells referenced 3
Forward row reference 8
Forward column reference 2
IF function 10
Numeric rule 18
Complex calculation 9
Date reference 4
Two digit integer reference 1
Protection not enabled
This sheet is not protected. Users can overwrite the contents of any cell even if the cell is locked.
Test notes
Only unique cells have been tested.
Remember to check cells that are a copy of the cells shown on this report.
Individual cells within range references not tested.
No precedents
This formula does not depend on any other cells. Usually this implies that an input has been entered as a combination of values. Potential errors to watch for:
1. Unless the individual values that make up the input are documented then it will be impossible to subsequently understand how the results were derived.
B1
Blank cells referenced
The following calculations reference a blank cell. Potential errors to watch for:
1. An input value has not been entered.
2. The calculation contains an incorrect reference.
3. There may be no error at present but users may subsequently enter values or formulas into the blank cells causing inconsistent results.
B30, B74, B76
Forward row reference
The following calculations refer to a row after the row in which they are situated. Potential errors to watch for:
1. Well written spreadsheets should be read from top to bottom like a book. Forward references often indicate a late additional piece of code which has been inadequately checked.
2. The calculation contains an incorrect reference.
C1, A2, C3, A10, B13:B15, C86
Forward column reference
The calculation refers to a column to the right of the column in which it is situated. Potential errors to watch for:
1. Well written spreadsheets should be read from left to right like a book. Forward references often indicate a late additional piece of code which has been inadequately checked.
2. The calculation contains an incorrect reference.
A2, B3
Continued

The Strategic Corporate Investments Handbook
180
IF function
The following calculations contain an IF statement. Potential errors to watch for:
1. The calculation used is dependent on the input values to the spreadsheet therefore these cells must be checked particularly carefully.
A2, B18, B32, C47, B61, B76, B100, B102, B104, B106
Numeric rule
The following calculations contain a number. This is the most common cause of errors within a spreadsheet. Potential errors to watch for:
1. A number has been added to the calculation as a ‘quick fix’ and not been subsequently removed.
2. A number has been used within the calculation even though it is also input elsewhere on the spreadsheet. Changing the input then has no effect.
3. The number is being used to convert from one set of units to another (000s to millions and so on). This is often performed incorrectly.
B3:D3, B18, B20, B32, B34, C47, B49, B61, B63, B76, B78, C86, B100, B102
B104, B106
Complex calculation
This calculation is particularly complex and therefore likely to contain errors. Potential errors to watch for:
1. Errors can be of all types.
B18, B32, C47, B61, B76, B100, B102, B104, B106
Date reference
This calculation references a date. Potential errors to watch for:
1. This calculation may not work over the year 2000. Check formula.
C1, B3:D3
Two digit integer reference
This calculation references a two digit integer. It may be a date. Potential errors to watch for:
1. If this two digit integer is a date, there is a high probability that the formula may not work past the year 2000.
B18
Source: Spreadsheet Professional Software
You can see from Exhibit 4.8 that although the specific worksheet has 468 formulae, only 80 are unique.
It is also normal to get a listing of the sheets by name so you can collate the scoping on a sheet by sheet basis. The recommended approach for this task is to use a tool, such as Spreadsheet Professional, to provide a sheet listing (see Exhibit 4.9).
Exhibit 4.8 continued

Other areas
181
Exhibit 4.9
Worksheet listing
Filename FinancialCloseModelExample.xls
Filename CorporateFinanceTemplateModelV8.xls
last modified at 22/03/2014 15:10:21
Author DWhittaker
Title
Subject
Comments
Instructions for use
list of sheets
worksheet name Description
Cover
Version control
Change control
user and technical guide
General inputs
Sales – costs – accounting
Financing and working capital
Taxation
Equity returns and lenders’ ratios
Profit and loss
Cash flow
Balance sheet
Summary
Checks
Source: Spreadsheet Professional Software
The auditor would review the size, complexity and general nature of any macros or VBA code included in the financial model. Those of particular interest will be those that drive the numbers and not so much those that change the model’s presentation, unless of course the client has a particular need to place emphasis upon presentational macros.
The auditor will then discuss the scope of the work and the type of opinion ideally required with the lender and or the equity providers.

The Strategic Corporate Investments Handbook
182
Work plan
Based upon the required scope for the financial model audit the auditor will prepare a work plan. The work will reflect the hours required for each activity and the staff allocated to the tasks. The plan and the resources required to deliver this will obviously be tied in to the overall deliverables of the opinion letter.
The recommended approach for preparing a work plan for a financial model audit is shown in Exhibit 4.10.
We can see from Exhibit 4.10 the information drawn out from the scope as required from the discussion with the sponsor or the lenders and the inspection of the financial model provided for scoping purposes that we have been able to work out the number of man hours required to complete the financial model audit task. In this particular case, a fair majority of the 95 man hours are spent on the coding review which has been calculated by taking into account the size and complexity of the financial model. More specifically, we have taken account of the number of unique formulae, the complexity of these and using a number of minutes per unique formula computed the man hours for the coding review. You will also notice that the man hours to complete the other tasks have also been estimated. These include the review of the data book and legal agreements, tax and accounting, sensitivity review and other senior review time. The above plan will typically be used to allocate the grade and specialism to the model audit project given the agreed timescales and for general project management purposes. It will also be used as a basis for setting the fee quote with the client.
Coding review
A coding review is the process of reviewing every unique formula in terms of the underlying logic. You can either use the maps or the colour coding of the model derived by spreadsheet audit software. A section of the financial close model is shown in Exhibit 4.11.
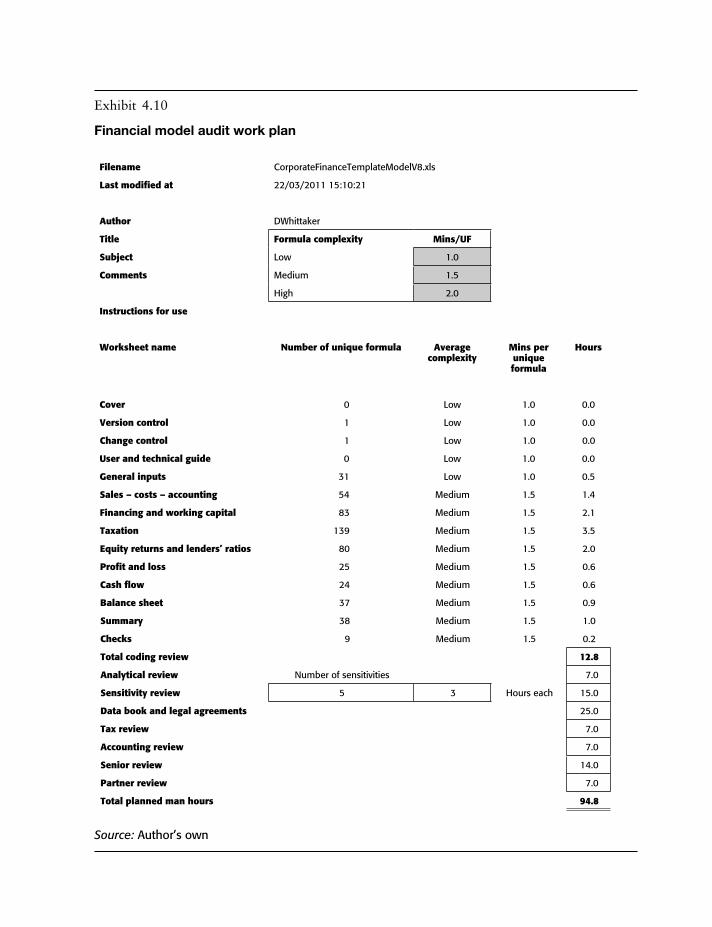
Exhibit 4.10
Financial model audit work plan
Filename CorporateFinanceTemplateModelV8.xls
last modified at 22/03/2011 15:10:21
Author DWhittaker
Title Formula complexity Mins/uF
Subject Low 1.0
Comments Medium 1.5
High 2.0
Instructions for use
worksheet name Number of unique formula Average complexity
Mins per unique formula
Hours
Cover 000 Low 1.0 0.0
Version control 001 Low 1.0 0.0
Change control 001 Low 1.0 0.0
user and technical guide 000 Low 1.0 0.0
General inputs 031 Low 1.0 0.5
Sales – costs – accounting 054 Medium 1.5 1.4
Financing and working capital 083 Medium 1.5 2.1
Taxation 139 Medium 1.5 3.5
Equity returns and lenders’ ratios 080 Medium 1.5 2.0
Profit and loss 025 Medium 1.5 0.6
Cash flow 024 Medium 1.5 0.6
Balance sheet 037 Medium 1.5 0.9
Summary 038 Medium 1.5 1.0
Checks 009 Medium 1.5 0.2
Total coding review 12.8
Analytical review Number of sensitivities 07.0
Sensitivity review 5 3 Hours each 15.0
Data book and legal agreements 25.0
Tax review 07.0
Accounting review 07.0
Senior review 14.0
Partner review 07.0
Total planned man hours 94.8
Source: Author’s own

Exhibit 4.11
Coding review
Equity returns and lenders’ ratios 22/03/2011 15:24 2011
Company A Year ending Year ending
Period ending 31 Dec 2010 31 Dec 2011
Actual Forecast
£ million £ million
lenders’ ratios
Debt to equity ratio
Senior debt 12.1 12.7
Total debt and equity
Senior debt 12.1 12.7
Equity 16.8 21.8
Shareholder loan 8.1 5.5
Total debt and equity 37.0 40.0
Debt to equity ratio 32.7% 31.8%
Debt to equity ratio max 32.7%
Debt to equity max date 31 Dec 2010
Debt to equity average 24.8%
Free cash flow to debt
8.9
Free cash flow 0.0 8.9
Total debt
Senior debt 12.7
Total debt 0.0 12.7
Free cash flow to debt ratio n/a 70.1%
Free cash flow to debt ratio min 70.1%
Free cash flow to debt ratio min date 31 Dec 2011
Free cash flow to debt ratio average 363.8%
Debt to EBITDA
Senior debt 12.7
Total debt 12.7
EBITDA 29.5
EBITDA 29.5
Debt to EBITDA ratio 43.1%
Debt to EBITDA ratio max 43.1%
Debt to EBITDA ratio min date 31 Dec 2011
Debt to EBITDA average 27.0%
Debt to net assets
Continued

Senior debt 12.1 12.7
Total debt 12.1 12.7
Net assets 16.8 39.4
Net assets 16.8 39.4
Debt to net assets ratio 72.0% 32.3%
Debt to net assets ratio max 72.0%
Debt to net assets ratio max date 31 Dec 2010
Debt to net assets average 27.7%
Interest cover
EBIT 26.7
Cash interest/(expense) 0.3
EBIT 0.0 27.0
Interest – senior debt 0.9
0.0 0.9
Interest cover ratio n/a 28.6
Interest cover ratio min 28.6
Interest cover ratio min date 31 Dec 2011
Interest cover ratio average 59.1
Shareholders’ returns
Equity cash flows
General inflation index 1.000 1.025
Equity drawn –5.0
Dividends paid 0.0
Subordinated debt total – drawn 1.2
Subordinated debt total – repayment 1.4
Subordinated debt total – interest 1.1
Subordinated debt total – fees paid 0.0
Net shareholders’ loan cash flow 3.7
Equity returns
Equity IRR – nominal 168.88% –5.0
Equity IRR – real 162.33% –4.9
Equity and sub debt IRR – nominal 734.84% –1.3
Equity and sub debt IRR – real 714.48% –1.3
Bright blue = Light blue = Bright yellow = Light yellow =
Source: Author’s own
The Strategic Corporate Investments Handbook
186
The extract from the financial model in Exhibit 4.11 shows each unique formula in bright blue. Each bright blue formula would have to be inspected. The colour coding key tool used a unique formula as a bright blue cell and copied down or across from the unique formula is a lighter shade of blue. Bright yellow cells are labels and light yellow is an input or hard coded cell. In general, different proprietary tools will have a different colour code key but the principal of the unique formula should remain the same regardless of the tool used.
Analytical review
The process for an analytical review has been outlined under ‘Top level analytical review’. A relatively senior member of the team will undertake the analytical review, possibly making the other members of the team aware of areas that look unreasonable and that may require further attention.
Data book and legal documentation
The process for reviewing the data book or legal documentation into the final model is to cross reference each of the specific documentation sections in terms of where the text can be found in the financial model, that is, Range B4 to C6 Funding Sheet. Where areas of the documentation can be quantified and the financial model does not comply with or is not reflected in the financial model an issue or comment should be logged and raised with the financial modeller.
Tax
A tax specialist from the professional company will review the tax treatment in the model against the treatment for the required model audit. For example, does the corporation tax and value added tax treatment materially comply with UK tax treatment? Comments or issues will be raised by the tax specialist given clear guidance of the nature of the financial model’s calculations outlined to them by a member of the financial model audit team.
Accounting
An accounting specialist from the professional company will review the accounting treat-ment in the model against the treatment for the required model audit. For example, does the accounting treatment materially comply with UK GAAP, IFRS, or local accounting treatment? Comments or issues will be raised by the accounting specialist given clear guidance of the nature of the financial model’s calculations outlined to them by a member of the financial model audit team.
Review comments
Review comments will be provided to the modeller by the financial model audit team.
Other areas
187
Iterations and base case clearance process
The audit team will present the review comments to the financial model builder based upon the current version of the model until the base case comments are cleared.
Sensitivities
It is standard practice that after the clearance of the base case projections that each sensi-tivity case is reviewed on a case by case basis. This will be a similar methodology to that adopted in the sensitivity or flex testing approach outlined under ‘Limited review’, that is, the use of flex testing techniques.
If there are any issues arising from the sensitivity review these will be raised as review comments and the model or the definition of the sensitivity in the data book would even amend the sensitivity logic to reflect the issues and gain overall clearance.
Second senior review
Once the engagement manager is happy that he is ready to sign off the opinion letter, it is normal that a second senior reviewer looks at the review work performed and carries out some further analytical review. It is also critical that he double checks the basis of the lenders’ ratios and shareholders’ returns against the facility agreement or data book as appropriate. Double checking the key outputs is critical given that any error at the highest level can often produce one of the most material sources of error.
Partner sign off
Once the financial model audit team have satisfactorily completed their work and the profes-sional services company can support their opinion, the partner will be able to sign the opinion letter. Of course, an opinion letter can be issued prior to all the review comments being cleared, but the outstanding points will clearly have to be attached as findings or qualifications to an opinion.
Project information memorandum
This is typically a document which is used mostly in syndicated financing of a project which defines the project details and its financing arrangements. In a project finance trans-action a project information memorandum is generally presented by project developers to potential lenders and investors together with a financial model to engage with and deliver key messages to these very important parties within the project. It is often prepared by an advisor or a bank acting in this capacity. They are used for a variety of reasons including the sell down of the initial debt raising. It is vital that your team delivers the critical message to such key potential stakeholders. Ensure that you outline the project clearly, present the key benefits and show that the key risks are understood and where relevant mitigated.

The Strategic Corporate Investments Handbook
188
There are a number of key areas that will make your project information memorandum a great and attractive document.
Well-structured
It is important that you write a clear structure similar to the following guidelines.
• Cover.• Disclaimer.• Table of contents.• Glossary of terms.• Main contents.• Appendices.
Professionally presented and well-written
A professionally presented document is also important. It may be advantageous if this can be presented online (web based) together with user controls over access and the acknowledge-ment of disclaimers. If it is delivered directly to the potential investors by email it is best presented in a pdf file. If the document is presented physically ensure that it is bound and has a glossary and an attractive cover.
It is advisable to use clear and attractive diagrams and illustrations. A consistent font for text purposes is recommended. Always use the spellchecking facility and use a second reviewer as a proofreader and editor for quality assurance purposes. It is best to use a template for preparing the information memorandum rather than using the last one prepared for the previous project as you will risk the chance of referring to a previous project which comes across as careless and unprofessional.
See Appendix 1 for an example of a project information memorandum.
Offering memorandum
This is the disclosure document that provides information for the potential buyers of shares of a business. The information includes the description of the company, the business, the profiles of the directors, the financial statements and forecasts, and so on.
An example of an offer memorandum is summarised in Appendix 2 for the proposed sale of Delta Gaming Group Limited.
The company disposal process
The sale of a company or business is indeed a major transaction for the shareholders, owners and management of a company. The whole process from start to finish usually takes several months. The seller of a business usually hires a corporate finance advisor in order to manage the sale and achieve certain objectives.
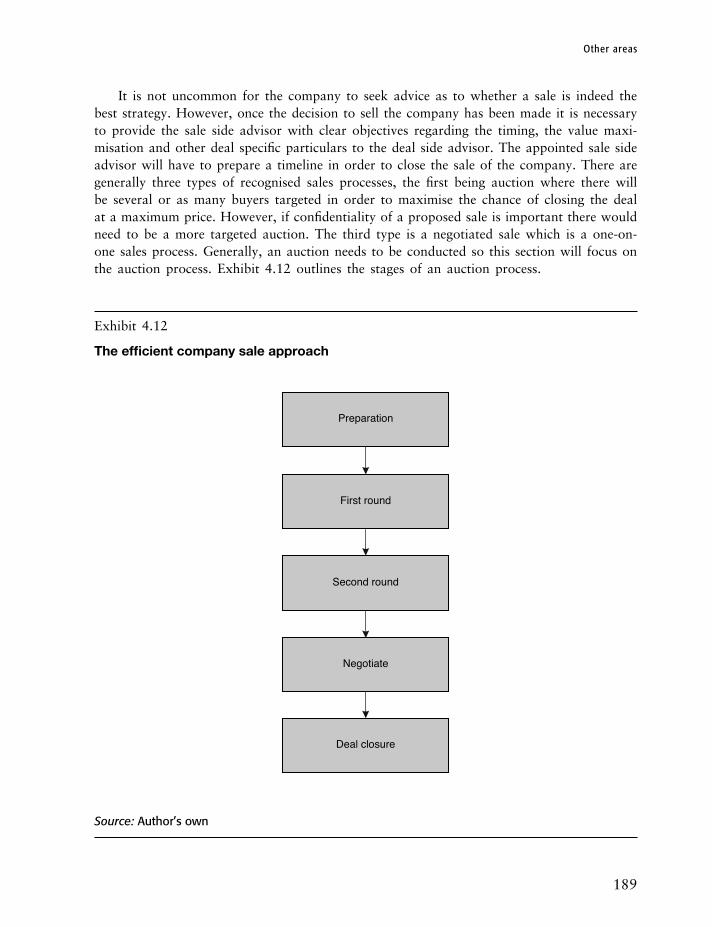
Other areas
189
It is not uncommon for the company to seek advice as to whether a sale is indeed the best strategy. However, once the decision to sell the company has been made it is necessary to provide the sale side advisor with clear objectives regarding the timing, the value maxi-misation and other deal specific particulars to the deal side advisor. The appointed sale side advisor will have to prepare a timeline in order to close the sale of the company. There are generally three types of recognised sales processes, the first being auction where there will be several or as many buyers targeted in order to maximise the chance of closing the deal at a maximum price. However, if confidentiality of a proposed sale is important there would need to be a more targeted auction. The third type is a negotiated sale which is a one-on-one sales process. Generally, an auction needs to be conducted so this section will focus on the auction process. Exhibit 4.12 outlines the stages of an auction process.
Exhibit 4.12
The efficient company sale approach
Preparation
Negotiate
Deal closure
First round
Second round
Source: Author’s own

The Strategic Corporate Investments Handbook
190
Preparation
The first point is to determine with the seller their objectives for the sale of the business, such as how many buyers the seller wants to include. This will be driven by the degree of confidentiality required and the desired speed of sale. If there is to be a high emphasis on such matters a more targeted auction will be necessary. The corporate finance advisor will start to draft a timeline and work plan in order to deliver against the key milestones of the first round, the second round, the negotiations’ stage and the point of deal closure.
A preliminary valuation of the business needs to be undertaken. This will be done using similar techniques as outlined earlier in this book. The financial advisor must obtain a detailed understanding of the business and senior management team’s objectives for sale before the marketing documents can be prepared which will be required for engaging with prospective buyers.
The corporate finance advisor needs to position the company and be able to clearly demonstrate its investment advantages to a prospective advisor. It will allow the financial advisor the opportunity to address certain key questions and concerns of the potential buyers. The financial advisor needs to understand the assumptions underpinning the seller’s actual and forecast financial position.
It may be advantageous at this stage for the corporate finance advised to position a lender in order to offer a finance package to the preferred buyer.
It will be necessary for a list of prospective buyers to be compiled together with the contact details of both the CEO and CFO. The financial advisor is likely to have relation-ships with individuals in the sector. It will be necessary to market the deal to them. Each prospective buyer needs to be evaluated on the basis of the likelihood of being able to finance the valuation price and having the strategic fit for the acquisition.
It will be necessary to prepare the marketing materials in order to engage with prospective buyers and obtain their interest. There are two main documents used, the teaser and the offer memorandum. The documents are provided by the corporate finance advisor with support by the management. The first document that will be presented to prospective buyers will be the teaser which is a brief two page document. The teaser will typically include the transaction background, the company background, key advantages of the target and the contact details of the financial advisor. The offer memorandum is also prepared by the financial advisor with support of the senior management team. This is a much more detailed document as can be seen under ‘Project information memorandum’.
A confidentiality agreement is prepared which represents a legally binding contract between the prospective buyer and the seller. The seller’s legal counsel will typically draft such an agreement. The main clause to be included will be the fact that all the information provided by the seller should be treated as confidential and should only be used in order to make a decision regarding the proposed acquisition transaction.
First roundIt is essential to contact the prospective buyers. This will normally be through a telephone call by the financial advisor backed up by emailing the teaser document and the confiden-tiality agreement.

Other areas
191
The interested prospective buyers will sign the confidentiality agreement which will allow the release of the offer memorandum.
The offer memorandum is distributed to interested prospective buyers who are given several weeks to review this document. There will be an opportunity for the financial advisor to provide further support to the prospective buyers on a case by case basis.
The preliminary bid letter will be distributed some weeks after distributing the offer memorandum. The instructions will include the date for submission of their expression of interest on a non-binding legal basis. The letter will also include the indicative acquisition price, the consideration (that is, cash versus shares), the company’s financing to make the acquisition, how they arrived at the acquisition price and the timeline to complete the deal and perform the necessary due diligence.
It is necessary to set up the data room. This is the knowledge area that will be used by the prospective buyers during the second round of the sale process. A well-structured and populated data room will help facilitate and potentially speed up the prospective buyers’ due diligence process. The financial advisor would need to work closely with the seller’s senior management team in order to structure and populate the data room. The following is a typical data room structure.
• The organisation structure. This is an organogram of the senior team and the reports.• The operations summary. This is a summary of the major contracts with customers and
suppliers.• The financial summary. This should be the audited financial statements over the last 10
years plus the financial projects supported by the financial model.• The supplier summary. This should summarise the top five suppliers together with their
agreements.• The markets, products and services. This should represent the company’s top five customers
or clients together with supporting market sector reports as appropriate.• The intellectual property. It is important that a list of any trade-marks, patents or licences
that the company may have is included. • The property and asset summary. It is important that the assets owned and leased by the
company are clearly summarised.• The environmental issues. If there are any environmental issues that relate to the company,
such as emissions compliance from power plants, these will need to be stated.• The debt position. All outstanding debts should be summarised together with the supporting
lenders’ and credit agreements.• The regulations. If the company is subject to any regulation by a government agency it
should be outlined and the permits shown.
The potential buyers for the second round are selected by reviewing the bidders’ initial expressions of interest which will include an indicative price together with any terms and conditions. It is important for the financial advisor to assess whether bidders actually have the ability to finance and pay for the target and the degree of seriousness of their bid. Once the selection process is completed the short list should be presented to the management team leading the sale of the company.

The Strategic Corporate Investments Handbook
192
Second round
Once the second round of the bidding process has been entered it will be necessary for the financial advisor to conduct further procedures.
First, the management presentations should be prepared. The seller prepares a presenta-tion that provides each prospective buyer with a detailed overview including contents, such as the business definitions, industry structure, the financials including three to five years’ actuals and five to 10 years’ projections, the strategic growth objectives and opportunities.
The management presentation will often support the basis of the potential buyer’s first meeting with the seller’s management team. The financial advisor would often provide the selling management team with a template for them to complete the management presentation and will act as a facilitator and reviewer of the quality of the message that can be obtained from this important document. It is imperative to note that an important part of the poten-tial asset up for sale includes the skills, experience and style of the management team. The potential buyer can get a feel if the target fits with their management.
It is necessary to provide access to the data room. This is where the prospective buyer will spend a lot of time undertaking their due diligence on the target company. The prospec-tive buyer will engage accountants, lawyers and consultants in order to assist them with the task. The prospective buyer will build a business case which outlines the key opportunities, risks and investment attractiveness. The review of the data room will allow the potential buyer to establish what information is outstanding that is required to complete the poten-tial buyer’s business that they ultimately present to their board. Online data rooms allow the prospective buyer to download the details and others may have certain restrictions for viewing status only. It is usual that potential buyers that directly compete with the seller will be restricted from viewing certain information which must remain confidential. The financial advisor will field and respond to further information requests from the prospective buyer in the most appropriate way.
A site visit must be organised, which is a very important part for the prospective buyer for their due diligence. This will take the form of a guided tour of the office facilities and the company’s specific assets. The tour will be led by the senior management team of the seller together with a representation from the financial advisory company.
It is necessary to distribute a final bid letter and the sale agreement to the prospective buyers. The financial advisor will prepare a letter which outlines the requirements for submit-ting the final bid together with the deadline date. The financial bid provided will represent a legally binding offer. The details that will be outlined in the final bid will include the bid price in the required currency and how the consideration will be constituted, that is, cash or shares or a combination of the two. The prospective buyer will often be asked how they will be funding the purchase of the company. They will need to state the outstanding due diligence tasks if any. They will be asked to confirm that they have provided a legally binding offer. The prospective buyer will be asked to confirm that the offer is open for a certain period of time. It will be necessary to add a marked up copy of the draft sales and purchase agreement. The estimated time needs to be added for signing the final copy of the sales or purchase agreement and drawing down the funds to close the purchase of the company. The prospective buyer would be asked to provide the contact details of the executives that will
Other areas
193
handle the bid. The sale and purchase agreement will include the terms and conditions for the sale of the company. The first draft of this very important contract will be prepared by the seller’s lawyer together with the seller’s management. The potential buyer’s lawyers will provide comments on the draft contract and usually as per the bid instruction letter this will be submitted with the bid document.
The final bid documents will be received by the final advisors on behalf of the seller.
Negotiate
Now that the final bids have been received it is necessary to review the final bids. The finan-cial advisor will work with both the management and the lawyers in order to undertake a review of the final bid documents. The financial advisor needs to review the offer price in comparison to the first round bid prices, the target company’s recent financial performance and the valuation placed on the company by the financial advisor. The degree of certainty of the bid will be looked at from a legally binding point of view. The financial advisor needs to select the preferred bidder or a preferred and reserve bidder in order to negotiate the sale agreement.
It is necessary for the financial advisor to negotiate with the preferred bidders in order to try to improve the terms of the final bids with the aim of improving the bid terms including the price and emerging with the winning bidder.
The final agreement and bidder is presented to the target company’s board for approval. However, not all auctions end with a sale of a company.
After the approval by the seller’s board it is necessary to have the purchase sale agree-ment agreed by both parties but not signed.
Deal closure
In order to close the sale of the company it is necessary for the buyer to provide the consid-eration for the purchase of the target through its sources of finance. The timing of the closure can be instantaneous if financed 100% by cash, or several months if funding is required from lenders or additional shareholders. The buyer is advised to start its marketing for its funds as soon as it is sure that the potential acquisition is attractive to them. However, the buyer may arrange temporary bridge financing until the permanent debt and equity finance is available to drawdown. Once the funding has been received and paid to the seller and the sale agreement is signed, the deal is closed.
Internal controls
It is extremely important that strong internal controls are in place in order to protect your business from potential fraud or misappropriation. It is recommended that there is sufficient documentation, segregation of duties, sufficient authorisation and review over all the critical transaction cycles in the company. The critical cycles include internal control over sales, purchases, fixed assets, and wages and salaries.
The Strategic Corporate Investments Handbook
194
It is possible for internal auditors to undertake tests of control or systems based audit tests to obtain audit evidence about the effective operation of the accounting and internal control systems. They will undertake substantive tests or transactions auditing tests to obtain audit evidence to detect any material misstatements in the financial statements. An alternative is to adopt a risk-based auditing approach.
A risk-based audit would involve reviewing the risk management process and considering the main risks of the organisation as a whole. The procedure undertaken would include:
• making enquiries and observations regarding the strength of internal control for the company’s functions and departments;
• inspection of documents evidencing operation of an internal control, for example, whether the transactions have been authorised;
• the examination of evidence of management reviews, for example minutes of management meetings at which financial results are reviewed and corrective action decided on;
• the re-performance of control procedures, for example, review the reconciliation of bank accounts to ensure they were correctly performed by the particular area; and
• the testing of the internal controls operating on specific computerised applications, for example, access controls or program change controls.
We will now discuss how to gain strong internal control over a company’s key cycles.
The sales cycle
The sales transaction cycle would involve gaining control over the order received from the client, that is, a sales order form should be raised by the sales department. There should be evidence that the goods are dispatched to the client by the use of a despatch note from the warehouse. The invoice should be raised by the sales ledger personnel in the accounts department. The payment should then be received into the company’s bank account. Another member of the accounts team should reconcile the receipts to the order forms, despatch notes, sales invoices and the bank account accordingly. So, by undertaking such an internal control procedure regarding the sales cycle, which includes sufficient separation of duty and personnel, a process of checks and balances, and a documented audit trail for this cycle, there would be little chance of any errors or misappropriation.
The purchases cycle
The purchases transaction cycle would involve gaining control over the order placed with the supplier, that is, a purchase order form should be raised by the buying or procurement department. There should be evidence that the goods are received by the company by the use of a goods received note from the warehouse. The invoice should be received by the purchase ledger personnel in the accounts department. The payment should then be made to the supplier’s bank account. Another member of the accounts team should reconcile the payments to the purchase order forms, goods received notes, purchase invoices and the bank account accordingly. So, by undertaking such an internal control procedure regarding
Other areas
195
the purchase cycle, which includes sufficient separation of duty and personnel, a process of checks and balances, and a documented audit trail for this cycle, there would be little chance of any errors or misappropriation.
Payroll
There needs to be a clear separation between the Human Resources Department and the payroll function and its authorisation and payments. First, any persons to be added to the payroll should come from Human Resources with a copy of the contract provided to the payroll administrator in the accounts department. The payroll department will calculate the gross pay, deductions in terms of national insurance, income tax and pensions. The financial controller or finance manager will be responsible for authorising the payments to the employees and the tax authorities accordingly by reviewing the payroll summary prior to the payment run. The payroll costs will be included in the books accordingly.
The stock cycle
There needs to be a stock control system to record the goods received into stock and the goods dispatched from stock. These records should be independently reconciled to the stock balance in the nominal ledger by both the stock records and the goods received and despatch notes. There would also need to be a reconciliation of the stock valuation recorded in the nominal ledger to a physical stock count on an annual basis, that is, at year end.
Bank account and cash
It is essential that each request for payment and receipt is properly authorised. The invoices should support each payment or receipt. The cash book should be prepared and reconciled to the bank statements on a monthly basis accordingly.
The adoption of such strong internal control procedures are likely to provide comfort to external auditors, investors and lenders.
It is important that the company’s internal auditors communicate relevant matters relating to the audit of the financial statements to those charged with running the company, that is, the senior management. The report of findings should be on a timely and clear basis which will allow appropriate action to be made.
Corporate governance
Corporate governance is a process and concept that we feel is essential in order to run an efficient company which makes effective decisions, maximises the returns to its stakeholders and ensures that all assets are safeguarded so that the company can both grow effectively and be sustainable in the long term. It is something that should be applied, although tailored to the particular requirements, to owner managed companies, private equity backed compa-nies and stock exchange listed companies. There are certain areas in this book that support

The Strategic Corporate Investments Handbook
196
much of the processes required to exercise effective corporate governance, such as strategic planning and internal control. During this section, corporate governance is addressed with a particular emphasis on UK listed companies and the associated UK Corporate Governance Code (September 2012) guidelines that have been produced by The Financial Reporting Council. The guidelines are strongly supported by both companies and shareholders and have been widely admired and replicated as a model for best practice corporate governance internationally. So, this section outlines the key areas of the guidelines together with key comments and interpretations where necessary.
The UK Corporate Governance Code is outlined at a summary level below.1
The UK Corporate Governance Code
The purpose of corporate governance is to facilitate effective, entrepreneurial and prudent management that can deliver the long-term success of the company.
The first version of the UK Corporate Governance Code (the Code) was produced in 1992 by the Cadbury Committee. Its paragraph 2.5 is still the classic definition of the context of the Code:
Corporate governance is the system by which companies are directed and controlled. Boards of directors are responsible for the governance of their companies. The share-holders’ role in governance is to appoint the directors and the auditors and to satisfy themselves that an appropriate governance structure is in place. The responsibilities of the board include setting the company’s strategic aims, providing the leadership to put them into effect, supervising the management of the business and reporting to share-holders on their stewardship. The board’s actions are subject to laws, regulations and the shareholders in general meeting.
Interpretation and comment: indeed this is an effective objective, process and structure for the management and control of a listed company. It involves the shareholders, the key stake-holder of a listed company, and communicates and engages with them. However, it would be possible for a corporation which is not listed to produce its own definition and objective of its corporate which would indeed support them in helping to raise financing and optimise the returns and safeguard its assets accordingly.
Corporate governance is, therefore, about what the board of a company does and how it sets the values of the company, and is to be distinguished from the day to day operational management of the company by full-time executives.
The Code is a guide to a number of key components of effective board practice. It is based on the underlying principles of all good governance: accountability, transparency, probity and focus on the sustainable success of an entity over the longer term.
The Code has been enduring, but it is not immutable. Its fitness for purpose in a permanently changing economic and social business environment requires its evaluation at appropriate intervals.
The new Code applies to accounting periods beginning on or after 1 October 2012 and applies to all companies with a Premium Listing of equity shares regardless of whether they are incorporated in the UK or elsewhere.
Other areas
197
Comply or explain
The ‘comply or explain’ approach is the trademark of corporate governance in the UK. It has been in operation since the Code’s beginnings and is the foundation of the Code’s flexibility.
Interpretation and comment: indeed this is a sound basis as flexibility is often required in business in order to the get the best outcome. It is clearly not a set of rigid rules.
The main principles of the Code
Section A: Leadership
Every company should be headed by an effective board which is collectively responsible for the long-term success of the company.
There should be a clear division of responsibilities at the head of the company between the running of the board and the executive responsibility for the running of the company’s business. No one individual should have unfettered powers of decision.
The chairman is responsible for leadership of the board and ensuring its effectiveness on all aspects of its role.
As part of their role as members of a unitary board, non-executive directors should constructively challenge and help develop proposals on strategy.2
Interpretation and comment: this is a structure that promotes effective senior decision making by experiences executives without putting the control in the hands of one individual.
Section B: Effectiveness
The board and its committees should have the appropriate balance of skills, experience, independence and knowledge of the company to enable them to discharge their respective duties and responsibilities effectively.
There should be a formal, rigorous and transparent procedure for the appointment of new directors to the board.
All directors should be able to allocate sufficient time to the company to discharge their responsibilities effectively.
All directors should receive induction on joining the board and should regularly update and refresh their skills and knowledge.
The board should be supplied in a timely manner with information in a form and of a quality appropriate to enable it to discharge its duties.
The board should undertake a formal and rigorous annual evaluation of its own perfor-mance and that of its committees and individual directors.
All directors should be submitted for re-election at regular intervals, subject to continued satisfactory performance.3
Interpretation and comment: this ensures that the board of directors remain effective in their duties. It is important that key management information such as budgets, strategic plans, management accounts, business case proposals, audited accounts and policies and procedures are made available to the board for them to exercise effective and informed decision making. There should be ongoing evaluation of the performance of the board

The Strategic Corporate Investments Handbook
198
on at least an annual basis. The board members should be assessed for re-election by its shareholders at the Annual General Meeting. Furthermore, the best will be obtained from the board members if they continually keep abreast with latest developments and undertake continuous professional development.
Section C: Accountability
The board should present a fair, balanced and understandable assessment of the company’s position and prospects.
The board is responsible for determining the nature and extent of the significant risks it is willing to take in achieving its strategic objectives. The board should maintain sound risk management and internal control systems.
The board should establish formal and transparent arrangements for considering how they should apply the corporate reporting, risk management and internal control principles and for maintaining an appropriate relationship with the company’s auditors.4
Interpretation and comment: this ensures that the company is effectively managing its risks and ensures that there are strong internal controls and auditors to ensure that a true and fair view is reported to the shareholders as far as the audited financial state-ments are concerned.
Section D: Remuneration
Levels of remuneration should be sufficient to attract, retain and motivate directors of the quality required to run the company successfully, but a company should avoid paying more than is necessary for this purpose.
A significant proportion of executive directors’ remuneration should be structured so as to link rewards to corporate and individual performance.
There should be a formal and transparent procedure for developing policy on executive remuneration and for fixing the remuneration packages of individual directors. No director should be involved in deciding his or her own remuneration.5
Interpretation and comment: this ensures that the directors are paid reasonably, but not excessively, together with the motivation and rewards to exceed expectations and grow and manage the company effectively.
Section E: Relations with shareholders
There should be a dialogue with shareholders based on the mutual understanding of objec-tives. The board as a whole has responsibility for ensuring that a satisfactory dialogue with shareholders takes place. The board should use the AGM to communicate with investors and to encourage their participation.6
Interpretation and comment: this ensures that the shareholders are informed about their investment in the company and can participate in and challenge the company’s strategy and objectives.
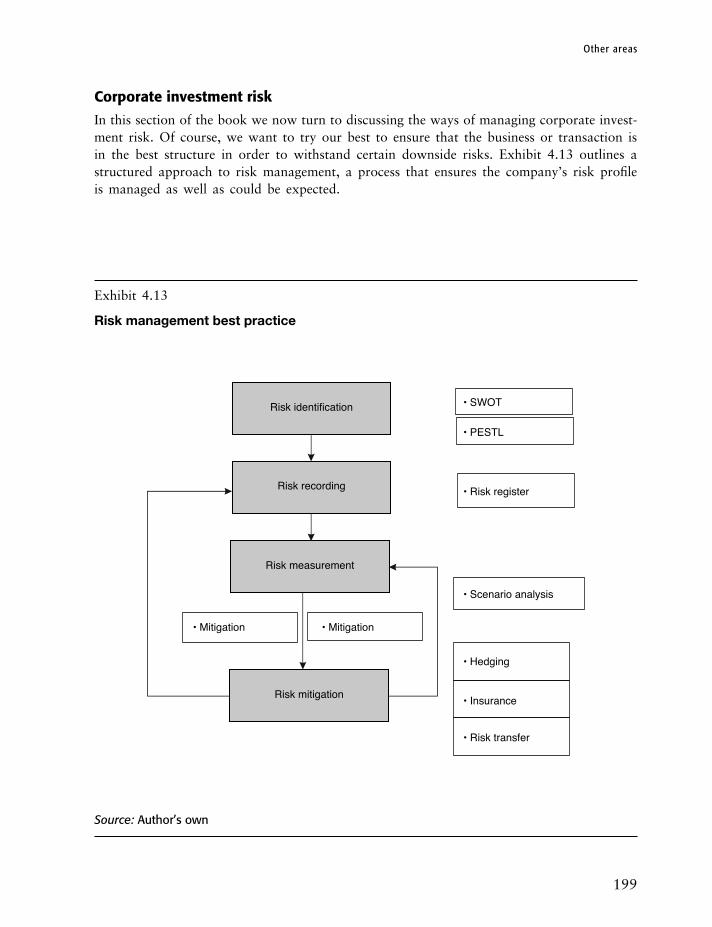
Other areas
199
Corporate investment risk
In this section of the book we now turn to discussing the ways of managing corporate invest-ment risk. Of course, we want to try our best to ensure that the business or transaction is in the best structure in order to withstand certain downside risks. Exhibit 4.13 outlines a structured approach to risk management, a process that ensures the company’s risk profile is managed as well as could be expected.
Exhibit 4.13
Risk management best practice
• SWOT
• PESTL
• Hedging
• Insurance
• Mitigation • Mitigation
Risk identification
Risk recording
Risk measurement
• Risk register
• Scenario analysis
Risk mitigation
• Risk transfer
Source: Author’s own

The Strategic Corporate Investments Handbook
200
First, we must identify the risks that the company or project faces, the risks can be identified through the use of strengths, weaknesses, opportunities and threats (SWOT) and/or political-economic-social-technological-legal (PESTL) techniques. Once the risks are identified they can be recorded in a risk register.
The identified risks can be measured using such techniques as scenario analysis. The risks are measured then can be mitigated by the use of the appropriate risk management technique, such as interest rate risk management, exchange rate risk management, insurance or the transfer of risks to another party better suited to manage them. The mitigated risks can be re-measured using such mitigation techniques and recorded in the risk register.
Examples of risk management techniques
SWOT
SWOT analysis is a critical evaluation of the strengths and weaknesses, opportunities and threats in relation to the internal and environmental variables impacting an organisation in order to evaluate the organisation’s position so that the opportunities and threats can be best addressed supported by knowledge of the strengths and weaknesses.
In summary, strengths and weaknesses are normally variables within the organisation and opportunities and threats are normally outside the organisation.
An ideal way to tackle potential opportunities is to match the organisation’s core strengths or competencies where possible.
Threats can often be avoided by utilising the organisation’s strengths.The organisation’s weaknesses can often be addressed in the form of an opportunity.
The organisation’s weaknesses must be minimised in order to avoid the potential threats.
PESTL
Environmental analysis is a process which is required in order to evaluate and mitigate the external risk factors. Approaches such as PESTL can be used to undertake environmental analysis.
Each of the areas covered by the PESTL approach is addressed as follows.
• Political risk – this can relate to government instability or non-payment of government obligations.• Economic risk – this can relate to interest rate, exchange rate and inflation amongst other
areas.• Social risk – this can relate to social unrest, labour disputes, changes in consumer tastes
and behaviour.• Technological risk – this can relate to the introduction of new technology as a substi-
tute product, for example, Wi-Fi internet connection replacing cable-based technology or e-commerce replacing some retail outlets.
• Legal risk – this can relate to the change in laws affecting the business or project. An example of this is where a change in tax legislation may adversely affect the taxation cash flows for a business.

Other areas
201
Risk register
The risk register shown in Exhibit 4.14 outlines a log that ensures you log and control the risks that are identified for the company or project. The risk register includes the name of the project at the top. Each risk is identified as a separate number together with the name of each risk. There is a field for the further description, that is, details associated with the risk and its likely effect upon the business or project. The category of the risk can be allocated as political, economic, social, technological, financial or legal. Its chance or probability of occurrence is important. There is a field for how we plan to deal with the threat, that is, what our mitigation strategy is – whether we have decided to hedge against the risk, take insurance against the risk, transfer the risk or accept the risk. The next field outlines who is responsible for dealing with the risk. The final field is the status, that is, whether the risk has been identified, measured and mitigated.
Exhibit 4.14
Risk register
RISK REGISTER
PROJECT NAME :
Number Name Description Effect Category Percentage probability
Mitigation strategy Responsibility Status
1
2
3
4
5
6
7
8
9
10
Source: Author’s own
Scenario analysis
Scenario analysis is a business or financial modelling technique that allows us to measure the impact of a quantifiable risk event on the business or project under analysis.
The Strategic Corporate Investments Handbook
202
It is useful at the risk measurement stage after the identification of the risk and at the risk mitigation stage in order to measure the impact of the risk scenario after mitigating the risk event.
A useful way of analysing risk by the use of scenario analysis is through Excel’s scenario manager. Of course, before you can use scenario analysis you will need to ensure that you have built the business or financial model’s base logic along the guidelines of FMBP.
Excel’s scenario manager
Excel’s scenario manager allows us to create multiple scenarios in order to measure risk for a variety of outcomes with ease. In order to set up a scenario in Excel 2013, you simply select the ribbons in the following order: Data, What Ifs, and Scenario Manager.
You select ‘Add’ to enter the scenario name, the cells to change and enter the descrip-tion in the comments box. We recommend that all of the inputs used for your scenario planning are given a logical range name which is similar to the labels of the input variable or the key output.
The advantages of using the scenario manager for risk analysis can be summarised as follows.
• We can run and store a vast number of scenarios with ease that can be seen at any time.• It prompts the financial modeller to define and document the scenario.
The disadvantages of using the scenario manager for risk analysis can be summarised as follows.
• The outputs to run the scenario against must be performed on the same worksheet as the original inputs that need to change. This is not compliant with recognised best practice financial model design standards of keeping a separation between inputs calcu-lations and outputs.
• We cannot see the underlying schedules that support the key outputs, that is, the profit and loss, cash flow and balance sheet forecasts which would be useful to evaluate for reasonableness using analytical evaluate techniques.
Interest rate risk management
Where an organisation has interest bearing assets and liabilities, the changes in interest rate will affect their profitability and cash flows. Interest rate risk relates to the risk of gains or losses arising from changes in the interest rates.
There are a number of situations when a company might be exposed to risk from interest rate movements.
Other areas
203
Fixed versus floating rate debt
Interest rate can either be fixed or variable in nature. Variable interest rates change with movements in the base rate. Change in interest rates may make the type of borrowing chosen the less attractive option dependent upon how it affects the interest rate, that is, fixed or variable. So, we do not want to pay more when interest rates rise if our interest rates are materially variable in nature, conversely we do not want to pay too much when interest rates rise if our interest rates are materially fixed. There are various methods of providing hedges against such interest related events, these are detailed below.
Forward rate agreements
Forward rate agreements are legal agreements normally made between a company and a bank about the interest rate on future debt. They protect the borrower from adverse market interest rate movements.
Forward rate agreements are cash settled with the gain or losses paid on the day the actual loan repayment is made. The gain or loss is calculated on the change in the base rate agreed between the parties. There are a number of advantages associated with forward rate agreements. These provide a hedge for interest rate exposure. They can be specifically tailored to suit the company with requirements in terms of size of the debt, duration of the hedge and its settlement date. An additional advantage is that they are easy to arrange and manage. There are a number of disadvantages associated with forward rate agreements. First, if there are more favourable rates of interest available in the market you cannot take advantage of this. Also, there is a cost or fee for this service and you have to sign a legally binding contract.
Interest rate futures
Interest rate futures can be used to hedge against interest risk. This is a contract which relates to the interest that obliges the buyer to purchase and sell the specified amount of debt which is represented in the contract at a pre-determined price at the expiration of the contract.
The mechanism underlying interest rate futures can be outlined as follows.The borrower sells a promise to make interest payments. The lender or the bank buys
an entitlement to interest receipts. There are advantages associated with interest rate futures. As with forward rate agreements, they are easy to arrange and manage. They are flexible to closing out and settling. There are a number of disadvantages associated with interest rate futures. Again you can take advantage of more favourable rates if they are offered on the market. They are not specifically tailored to the company requirements. Also, as with forward rate agreements, they are legally binding contractually and must be honoured.
Interest rate options
An interest rate option is simply an option to borrow or lend a certain amount of debt for a given period at an interest rate. This option starts on or before a certain date in the
The Strategic Corporate Investments Handbook
204
future, agreed at a specified rate of interest which is known as the exercise price. There are options that can be agreed as caps (a capped interest rate), a collar (a band of interest rates), a floor sets the minimum interest rate. Interest rate options have advantages associated with them, such as the ability to take advantage of favourable rates. The collar option allows us to stay within certain limits. The disadvantages of interest rate options is that the fees set by the bank may be quite costly.
Interest rate swaps
Interest rate swaps are legal agreements where two parties agree to exchange their interest rate positions. An example is where company A swaps its fixed rate debt for company B variable rate debt. This will allow companies with different attitudes to interest rate risk to manage their respective exposures. It will allow access to fixed or variable interest rate markets. The parties are able to potentially forego expensive refinancing costs. However, as with such agreements there will be a fee required by the bank for arrangement.
Exchange rate risk management
Foreign exchange risk or currency risk is the risk of uncertainty of outcome that arises because exchange rates are subject to variability or change. The following sections discuss how we can hedge against this risk.
Forward exchange rates
A forward exchange rate is an exchange rate which is set for currencies to be exchanged at a specific future date. The exchange rate for the currency is agreed in the present, however this is for settlement at an agreed future date. Again there will be a fee charged by the bank for doing this but the certainty may be satisfactory for the company.
Other exchange rate hedging strategies
A further option is to invoice the customer in the local currency. This passes the currency risk to the customer. The company must ensure it operates in such a way that it will be receiving and paying in the same foreign currency. The exchange rate effect of the receipt and payment would be netted off. However, there is likely to be an exposure between the receipts and payments.
A further exchange rate hedge mechanism is the use of money market hedges involving exchanging currencies immediately and using the interest rates of both countries to hedge against movements in exchange rate. The money market hedge mechanism uses the prin-ciples of interest rate parity. An example is where cash can be deposited or loaned from the Eurocurrency markets. Eurocurrency is currency which is borrowed or deposited with a bank outside the currency’s country of origin. Money can be deposited or loaned from the Eurocurrency markets.

Other areas
205
Foreign currency futures are a contract to exchange one currency for another at a certain date in the future at an exchange rate that is fixed at the date of agreement.
Foreign currency options are derivatives that give the company the option to exchange cash in one currency to another currency at an agreed exchange rate at agreed date.
Foreign currency swaps are where both the principal and interest of a loan in one currency are swapped with another party in another country.
Insurance
There are several types of insurance that could be taken against business or project risk events. There are various types of insurance available on the market which would cover a variety of risks, such as construction risk, business continuity, the risk of flooding, fires and so on. It is simply recommended that you investigate whether there is adequate insurance cover for your company’s identified risks at a reasonable premium.
Outlined below is political risk insurance which is a key insurance requirement for emerging market project financing based upon government offtake.
Political risk insurance
It is not usually possible for a sponsor of a project in an emerging market or developing country with a large amount of debt to raise without securing political risk cover from export credit agencies (ECAs) or multilateral agencies. The insurable political risks can be classified as both asset-based risks and operating related risks.
Asset-based risks typically cover:
• selective and discriminatory behaviour by the host government causing a loss of a benefit to a venture without reasonable compensation;
• a loss due to a forced divestment in a foreign enterprise by the investor’s own government or by a foreign government;
• default by a government on an obligation arising from an award of arbitration;• the creation of an embargo or import export of goods from a country which gives rise
to a loss from a previously granted position; and• loss or damage caused by war and political violence.
Operating related risks will typically cover:
• the risk of not being able to convert the local currency;• the non-fulfilment of the contract due to host risks; and• the unfair drawing down of any advance payments as part of the transaction made to
the government.

The Strategic Corporate Investments Handbook
206
Risk transfer
The allocation of risk refers to provisions under a contract which determine which party to a transaction takes the risks of certain events occurring. Risks should typically be taken by the contractual party that is best placed to control that risk.
Risk and return
In business and finance there is a positive relationship between the risk of a corporate invest-ment and the expected return on that investment. A business transaction’s variability in its returns represents the total risk of the transaction. The total risk of the transaction is often said to comprise of non-systematic risk and systematic risk. Non-systematic risk is diver-sifiable. However, systematic risk is non-diversifiable. Systematic risk is caused by external variables or factors, and can also be called market risk. These are such factors as the risk arising from the political environment, the economic environment, and so on. Whilst these risks cannot be diversified away, such risks can often be insured against, hedged against or the risk can often be transferred in a business transaction. However, this is not true for an investor in company shares in a listed company which cannot be controlled.
Non-systematic risks arise due to the performance of the company. So again for corporate investments this can be controlled by the corporate to a high degree. These risks typically involve the risks associated with the business or financial position.
So risk refers to the variation of a variable; in financial terms, cash flows or returns accruing to an investor.
It is critical that an investor involved in a potential business or corporate investment is compensated in the return by the degree of risk perceived in relation to the other classes of investor. We will now turn to the expected risk and return profile outlined in Exhibit 4.15. If you are investing equity in a project as a shareholder, you would expect a return which is greater than the providers of the shareholder loan or senior debt. You would expect a risk premium as being a shareholder you receive your dividends after all other classes of investor in the corporate transaction. At the reverse end of the scale the government bond rate in the particular market can be considered relatively risk free. However, there are certain econo-mies, for example, in emerging markets and developing countries, where we cannot simply classify their government bonds as risk free due to the relative sovereign ratings (typically provided by rating agencies such as Moody’s and Standard & Poor’s) as some countries’ governments have a higher default risk than others. The starting point for the government bond will always have a bearing upon the expected rate of return for a corporate investment of a similar industry in a country with a high sovereign rating due to the risk and return profile relative to the corporate investments market line.
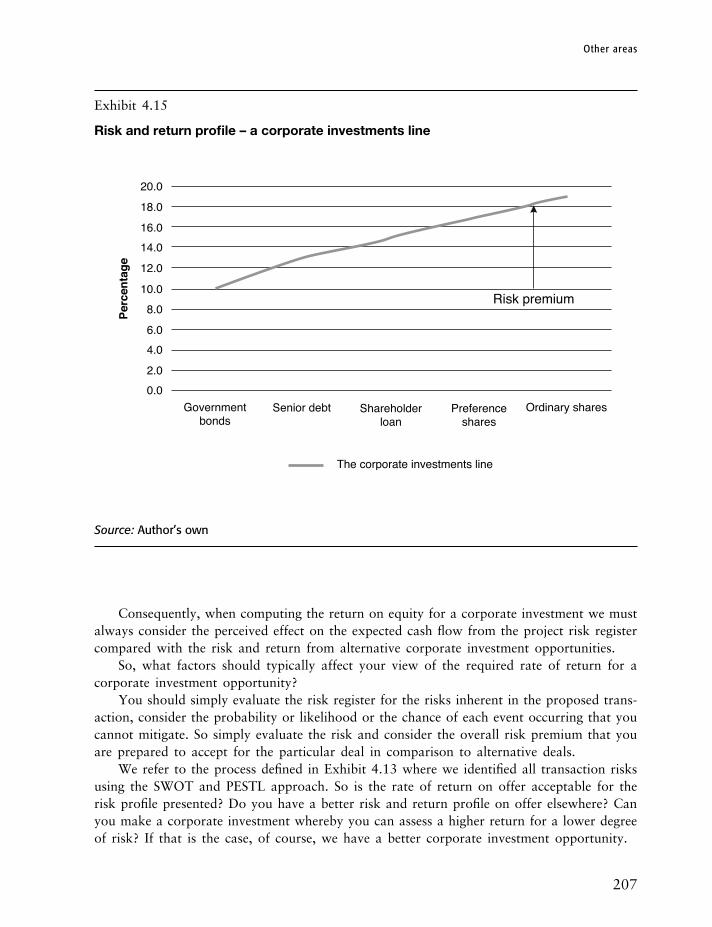
Other areas
207
Exhibit 4.15
Risk and return profile – a corporate investments line
20.0
18.0
16.014.0
12.0
10.08.0
6.04.0
2.0 0.0
Governmentbonds
Senior debt Shareholderloan
Preferenceshares
Ordinary shares
Risk premium
Perc
enta
ge
The corporate investments line
Source: Author’s own
Consequently, when computing the return on equity for a corporate investment we must always consider the perceived effect on the expected cash flow from the project risk register compared with the risk and return from alternative corporate investment opportunities.
So, what factors should typically affect your view of the required rate of return for a corporate investment opportunity?
You should simply evaluate the risk register for the risks inherent in the proposed trans-action, consider the probability or likelihood or the chance of each event occurring that you cannot mitigate. So simply evaluate the risk and consider the overall risk premium that you are prepared to accept for the particular deal in comparison to alternative deals.
We refer to the process defined in Exhibit 4.13 where we identified all transaction risks using the SWOT and PESTL approach. So is the rate of return on offer acceptable for the risk profile presented? Do you have a better risk and return profile on offer elsewhere? Can you make a corporate investment whereby you can assess a higher return for a lower degree of risk? If that is the case, of course, we have a better corporate investment opportunity.
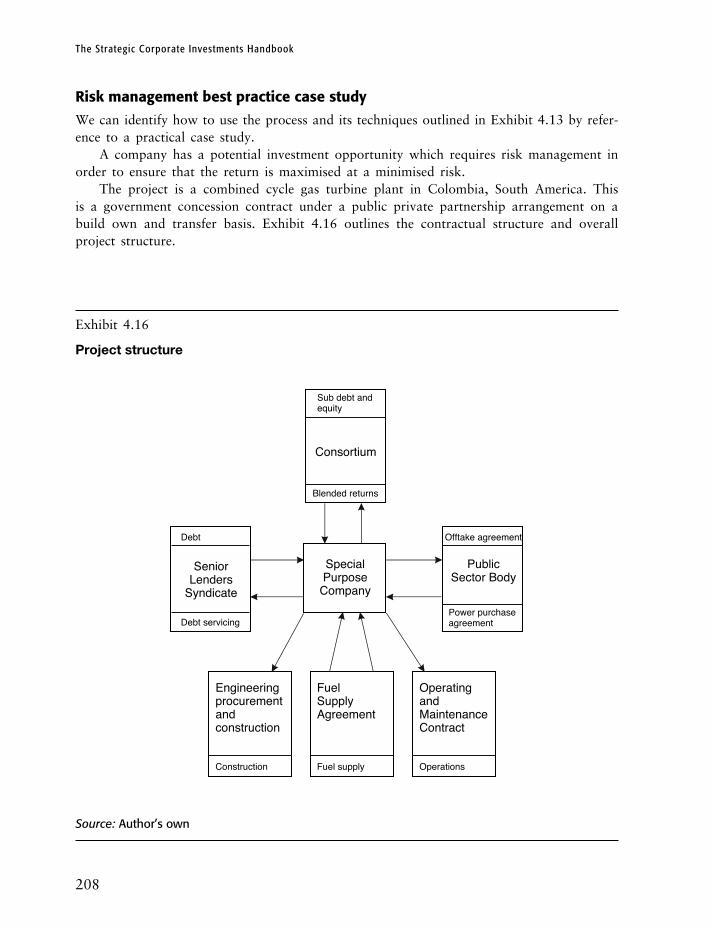
The Strategic Corporate Investments Handbook
208
Risk management best practice case study
We can identify how to use the process and its techniques outlined in Exhibit 4.13 by refer-ence to a practical case study.
A company has a potential investment opportunity which requires risk management in order to ensure that the return is maximised at a minimised risk.
The project is a combined cycle gas turbine plant in Colombia, South America. This is a government concession contract under a public private partnership arrangement on a build own and transfer basis. Exhibit 4.16 outlines the contractual structure and overall project structure.
Exhibit 4.16
Project structure
Sub debt andequity
Consortium
Blended returns
Debt
SeniorLenders
Syndicate
Debt servicing
SpecialPurposeCompany
Offtake agreement
Power purchaseagreement
PublicSector Body
Engineeringprocurementandconstruction
Construction
FuelSupplyAgreement
Fuel supply
OperatingandMaintenanceContract
Operations
Source: Author’s own

Other areas
209
The project is undertaken on a joint venture basis between three consortium partners. Party A undertakes the construction of the power plant through an engineering procurement and construction (EPC) contract, Party B operates and maintains the power plant through an operations and maintenance contract and Party C supplies the fuel for the power plant through a fuel supply agreement. All members of the consortium put in a third of the required equity finance.
The project is undertaken by incorporating a special purpose company (SPC).The government will purchase the electricity generated by the SPC through the power
purchase agreement mechanism.The project will be financed through debt provided by a syndicate of senior lenders and
equity provided by the consortium members.
Risk identification and risk recording
We have undertaken a risk identification process for the project using the PESTL approach together with our knowledge of the proposed transaction. We have compiled a risk identi-fication register accordingly as shown in Exhibit 4.17.
The risk identification register shown in Exhibit 4.17 has logged numerous risk factors. These can be summarised as follows.
• Number 1 relates to the identified construction risk which is possible under any major construction project, labour disputes may arise, a shortage of key components or raw materials, the possibility of engineering or environmental problems.
• Number 2 relates to the identified country risk of dealing with Colombia given that the sovereign has a credit rating under Standard & Poor’s of –BBB. There is a possibility of government default and non-payment of the tariff income under the power purchase agreement (PPA).
• Number 3 relates to the fuel supply risk and the capability and track record of the supplier. There is a possibility of erosion of the equity returns and the debt cover ratios as with most project risks that are identified.
• Number 4 references the technology risk. Is the gas turbine a proven technology source and a supplier of proven capability and financial status?
• Number 5 relates to several risks, such as the risk of fire, explosions, and potential changes in law.
• Number 6 relates to the volatility of the exchange rate given that the tariff will be invoiced in local currency and the debt is likely to be paid in US dollars.
• Number 7 relates to the volatility of the interest rate and the possible erosion of the debt cover ratios and the equity internal rate of return (IRR).
• Number 8 relates to the potential variability in the dispatch and its effect on the debt cover ratios and the equity IRR.
Exhibit 4.18 shows a risk mitigation register.

Exh
ibit
4.1
7
Ris
k id
enti
fica
tio
n
Ris
k re
gist
er
Pro
ject
n
ame
Proj
ect
Col
umbu
Nu
mb
erN
ame
Des
crip
tion
Effe
ctCa
tego
ryP
erce
nta
ge
pro
bab
ilit
yM
itig
atio
n s
trat
egy
Res
pon
sib
ilit
ySt
atu
s
1C
onst
ruct
ion
risk
A co
st o
verr
un o
r a
dela
y in
pro
ject
com
plet
ion
Eros
ion
of e
quity
ret
urns
an
d de
bt c
over
rat
ios
Tech
nolo
gica
l ris
k30
.0Id
entifi
ed
2C
ount
ry r
isk
The
Gov
ernm
ent a
genc
y ha
s a
S&P
ratin
g of
–B
BB
Non
-pay
men
t of
tar
iffO
fftak
e ris
k20
.0Id
entifi
ed
3Fu
el s
uppl
y ris
kSu
ffici
ent f
uel a
nd
capa
bilit
y of
sup
plie
rEr
osio
n of
equ
ity r
etur
ns
and
debt
cov
er r
atio
sFu
el s
uppl
y ris
k20
.0Id
entifi
ed
4Pr
oven
te
chno
logy
ris
k
Is th
e ga
s tu
rbin
e pr
oven
an
d su
pplie
r re
puta
ble
Eros
ion
of e
quity
ret
urns
an
d de
bt c
over
rat
ios
Tech
nica
l ris
k10
.0Id
entifi
ed
5Va
rious
ris
ksVa
rious
ris
ks: fi
res,
ex
plos
ions
, dro
ught
s,
chan
ges
in la
w
Eros
ion
of e
quity
ret
urns
an
d de
bt c
over
rat
ios
Ope
ratin
g ris
k5.
0Id
entifi
ed
6Ex
chan
ge
rate
ris
kVo
latil
ity o
f the
exc
hang
e ra
teEr
osio
n of
equ
ity r
etur
ns
and
debt
cov
er r
atio
sFi
nanc
ial r
isk
5.0
Iden
tified
7In
tere
st r
ate
risk
Vola
tility
of t
he in
tere
st
rate
Eros
ion
of e
quity
ret
urns
an
d de
bt c
over
rat
ios
Fina
ncia
l ris
k5.
0Id
entifi
ed
8D
ispa
tch
risk
Vola
tility
of d
ispa
tch
may
af
fect
ret
urns
Eros
ion
of e
quity
ret
urns
an
d de
bt c
over
rat
ios
Ope
ratin
g ris
k5.
0Id
entifi
ed
9
10
Sour
ce: A
utho
r’s o
wn
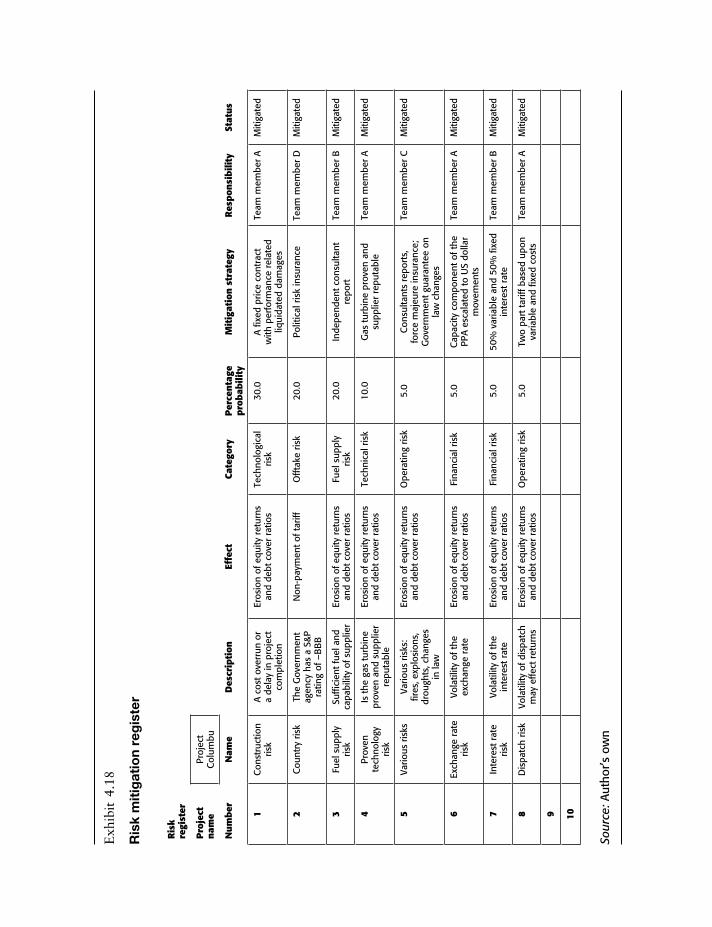
Exh
ibit
4.1
8
Ris
k m
itig
atio
n re
gis
ter
Ris
k re
gist
er
Pro
ject
n
ame
Proj
ect
Col
umbu
Nu
mb
erN
ame
Des
crip
tion
Effe
ctCa
tego
ryP
erce
nta
ge
pro
bab
ilit
yM
itig
atio
n s
trat
egy
Res
pon
sib
ilit
ySt
atu
s
1C
onst
ruct
ion
risk
A co
st o
verr
un o
r a
dela
y in
pro
ject
co
mpl
etio
n
Eros
ion
of e
quity
ret
urns
an
d de
bt c
over
rat
ios
Tech
nolo
gica
l ris
k30
.0A
fixed
pric
e co
ntra
ct
with
per
form
ance
rel
ated
liq
uida
ted
dam
ages
Team
mem
ber
AM
itiga
ted
2C
ount
ry r
isk
The
Gov
ernm
ent
agen
cy h
as a
S&P
ra
ting
of –
BB
B
Non
-pay
men
t of
tar
iffO
fftak
e ris
k20
.0Po
litic
al r
isk
insu
ranc
eTe
am m
embe
r D
Miti
gate
d
3Fu
el s
uppl
y ris
kSu
ffici
ent
fuel
and
ca
pabi
lity
of s
uppl
ier
Eros
ion
of e
quity
ret
urns
an
d de
bt c
over
rat
ios
Fuel
sup
ply
risk
20.0
Inde
pend
ent
cons
ulta
nt
repo
rtTe
am m
embe
r B
Miti
gate
d
4Pr
oven
te
chno
logy
ris
k
Is th
e ga
s tu
rbin
e pr
oven
and
sup
plie
r re
puta
ble
Eros
ion
of e
quity
ret
urns
an
d de
bt c
over
rat
ios
Tech
nica
l ris
k10
.0G
as t
urbi
ne p
rove
n an
d su
pplie
r re
puta
ble
Team
mem
ber
AM
itiga
ted
5Va
rious
ris
ksVa
rious
ris
ks:
fires
, exp
losi
ons,
dr
ough
ts, c
hang
es
in la
w
Eros
ion
of e
quity
ret
urns
an
d de
bt c
over
rat
ios
Ope
ratin
g ris
k5.
0C
onsu
ltant
s re
port
s,
forc
e m
ajeu
re in
sura
nce;
G
over
nmen
t gu
aran
tee
on
law
cha
nges
Team
mem
ber
CM
itiga
ted
6Ex
chan
ge r
ate
risk
Vola
tility
of t
he
exch
ange
rat
eEr
osio
n of
equ
ity r
etur
ns
and
debt
cov
er r
atio
sFi
nanc
ial r
isk
5.0
Cap
acity
com
pone
nt o
f the
PP
A es
cala
ted
to U
S do
llar
mov
emen
ts
Team
mem
ber
AM
itiga
ted
7In
tere
st r
ate
risk
Vola
tility
of t
he
inte
rest
rat
eEr
osio
n of
equ
ity r
etur
ns
and
debt
cov
er r
atio
sFi
nanc
ial r
isk
5.0
50%
var
iabl
e an
d 50
% fi
xed
inte
rest
rat
eTe
am m
embe
r B
Miti
gate
d
8D
ispa
tch
risk
Vola
tility
of d
ispa
tch
may
effe
ct r
etur
nsEr
osio
n of
equ
ity r
etur
ns
and
debt
cov
er r
atio
sO
pera
ting
risk
5.0
Two
part
tar
iff b
ased
upo
n va
riabl
e an
d fix
ed c
osts
Team
mem
ber
AM
itiga
ted
9
10
Sour
ce: A
utho
r’s o
wn

The Strategic Corporate Investments Handbook
212
• Number 1: we need to ensure that the EPC contractor has a proven track record and has a healthy financial position. We need to ensure that the contract is of a fixed price nature with performance related liquidated damages constituting 50% of the contract price.
• Number 2: the country risk needs mitigating by the use of political risk insurance in the event of non-payment of the tariff by the government agency.
• Number 3: the risk of the gas supply has been mitigated by an independent consultant’s report stating that there is enough gas supply, the gas pipeline is capable of supplying it and the contractor is suitable and has a strong financial position.
• Number 4: a consultant’s report has informed us that the technology is proven and the contractor is suitable and has a strong financial position.
• Number 5: the risks of explosions, fires and droughts can be mitigated by both independent consultant’s reports and the necessary insurance. We will assess a necessary government guarantee that the project will not be affected by changes in law particularly taxation areas.
• Number 6: the exchange rate risk will be mitigated by the necessary part of the tariff mechanism. The capacity charge included in the PPA should be linked to changes in the US dollar movements in order to safeguard against the PPA being invoiced in local currency and the debt being payable in US dollars.
• Number 7: the interest rate risk can be mitigated by holding a mix of fixed and variable rate interest rates at 50% each.
• Number 8: the dispatch risk will be mitigated by the use of a two part tariff that pays capacity payments for the plant being available in the event of a non-dispatch event. The capacity payment will cover the fixed operating and maintenance costs, debt servicing, taxation and the return on equity. Note that the variable costs of variable operating and maintenance costs and fuel will be avoidable in the event a non-dispatch event.
Risk measurement
We have undertaken a risk measurement exercise for the project using financial modelling techniques and scenario analysis together with our knowledge of the risks for the proposed transaction. We have computed the results accordingly as shown in Exhibit 4.19.
The results in Exhibit 4.19 show the effect of the base case and the mitigated risk event, that is, the effect of the quantifiable risk and the mitigated action and its effect on the results. The key outputs are the shareholders’ real return on equity and the minimum and average cover ratios as defined for lender purposes. We can see that each case gives a satisfactory risk managed position given that our shareholders’ target real minimum return on equity is 20% real and the minimum annual debt service ratio (ADSCR) is 1.20 minimum.
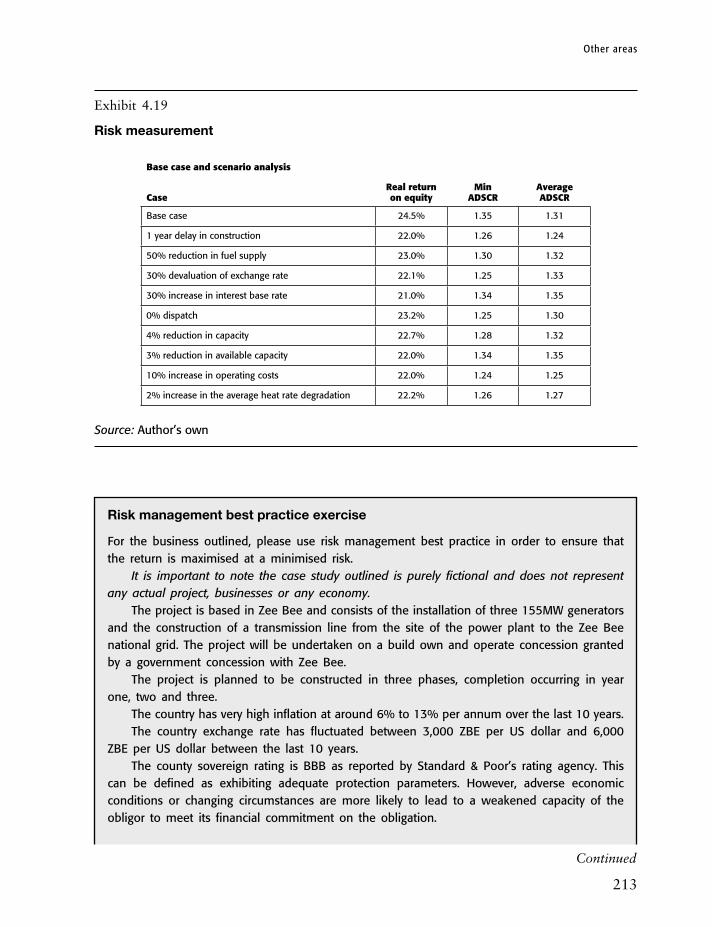
Other areas
213
Exhibit 4.19
Risk measurement
Base case and scenario analysis
CaseReal return on equity
Min ADSCR
Average ADSCR
Base case 24.5% 1.35 1.31
1 year delay in construction 22.0% 1.26 1.24
50% reduction in fuel supply 23.0% 1.30 1.32
30% devaluation of exchange rate 22.1% 1.25 1.33
30% increase in interest base rate 21.0% 1.34 1.35
0% dispatch 23.2% 1.25 1.30
4% reduction in capacity 22.7% 1.28 1.32
3% reduction in available capacity 22.0% 1.34 1.35
10% increase in operating costs 22.0% 1.24 1.25
2% increase in the average heat rate degradation 22.2% 1.26 1.27
Source: Author’s own
Continued
Risk management best practice exercise
For the business outlined, please use risk management best practice in order to ensure that the return is maximised at a minimised risk.
It is important to note the case study outlined is purely fictional and does not represent any actual project, businesses or any economy.
The project is based in Zee Bee and consists of the installation of three 155MW generators and the construction of a transmission line from the site of the power plant to the Zee Bee national grid. The project will be undertaken on a build own and operate concession granted by a government concession with Zee Bee.
The project is planned to be constructed in three phases, completion occurring in year one, two and three.
The country has very high inflation at around 6% to 13% per annum over the last 10 years.The country exchange rate has fluctuated between 3,000 ZBE per US dollar and 6,000
ZBE per US dollar between the last 10 years.The county sovereign rating is BBB as reported by Standard & Poor’s rating agency. This
can be defined as exhibiting adequate protection parameters. However, adverse economic conditions or changing circumstances are more likely to lead to a weakened capacity of the obligor to meet its financial commitment on the obligation.

The Strategic Corporate Investments Handbook
214
A critical evaluation of business plans
It is highly likely that you may be presented with a business plan document by either a company, partner or associate, or a group business which requires independent evaluation. This section of the book addresses the evaluation of the third party business where you have had no control but wish to make an informed investment decision, that is, to invest or not to invest, and even what additional questions should be asked. The following areas would represent an ideal basis for assessment.
• Executive summary – is there an executive summary that is clear, compelling and commu-nicates the overview of the business plan? It should include an overview of each section of the business planning document. The executive summary should be no more than a page or two and should not take any longer than five minutes to read.
• Company summary – is there a company summarisation that outlines the history, its strategic outlook, its mission and objectives and goals for the business?
• Management team – does the management team show adequate experience and track record to successfully run the business? Is there sufficient organisation structure and evidence that the proposed team can work together?
• Products or services – there should be a section that describes the main facets of each of the company’s key product lines or services. The competitive advantage that these have should be clearly outlined. There should a description of their target market segment.
• Market acceptance – how has the market for the products or services been tested? What is the market size and what is the growth of the market? Is there an awareness of the external environment?
• Functional strategy – is there a strategy outlined for operations/production, sales and marketing, finance, human resources and technology (R&D) for the proposal?
• Risk management – has there been a sufficient analysis of the strengths, weaknesses, opportunities and threats? In particular, is there a risk management program to counter the identified risks?
• Credible financial projections – is the business plan supported by credible financial projec-tions? Do the projections represent an income statement, balance sheet and cash flow? Are the assumptions consistent with the strategy outlined for operations/production, sales
Box continued
The PPA, that is, the tariff will be invoiced in local currency, that is, Zee Bee.The debt will be repayable in US dollars because this is raised from the foreign invest-
ment banks.There are currently no laws governing concessions in the host country.The technology is supplied from a medium sized supplier who has deployed the generator
technology on three different projects.Using a risk management best practice approach please identify, record and mitigate
the impact of the above risks. Note that it is not possible to measure the impact as you will obviously require a detailed financial model as a basis for undertaking scenario analysis.

Other areas
215
and marketing, finance, human resources and technology (R&D) included in the text of the business plan? The projects should typically be for three to five years for an ongoing business or over the economic life for say an asset-based business such as a power plant.
• Investment case – is there a clear outline of what role and or investment is expected from the investor and what IRR is forecasted?
It is important that you evaluate the document against the points above. Of course, you should ask for additional information where there is insufficient information. In order to evaluate the quality of this business plan you would need to use an evaluation approach which includes a final figure (see Exhibit 4.20).
Exhibit 4.20
Business plan evaluation
Criteria weight applied Score (1 = Poor; 5 = Excellent)
Evaluated score
Executive summary 15%
Company summary 5%
Management team 5%
Products or services 15%
Market acceptance 15%
Functional strategy 5%
Risk management 10%
Financial projections 20%
Investors’ case 10%
Total
Source: Author’s own
The score for the business plan should be evaluated by completing the score in the third column of Exhibit 4.20 and multiplying the third and fourth column for criteria then adding the fourth column numbers down to get the total evaluation. The maximum score possible is 5. Therefore the evaluation total should be expressed as a percentage of the maximum score possible.
Business case proposals – controls and processes
If we were to discuss business case proposals and transactions and the manner in which they were controlled in a corporate enterprise we would need to start to address the topic of ‘corporate governance’. Corporate governance is the system of rules and processes by which a business is planned and controlled. It covers all aspects of management from plans to internal controls.
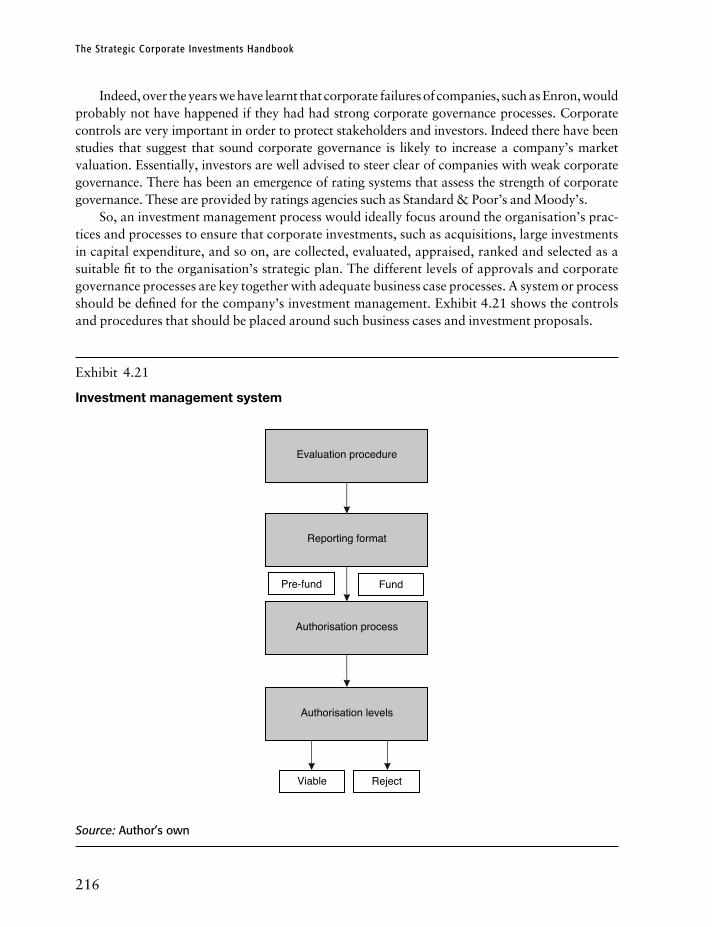
The Strategic Corporate Investments Handbook
216
Indeed, over the years we have learnt that corporate failures of companies, such as Enron, would probably not have happened if they had had strong corporate governance processes. Corporate controls are very important in order to protect stakeholders and investors. Indeed there have been studies that suggest that sound corporate governance is likely to increase a company’s market valuation. Essentially, investors are well advised to steer clear of companies with weak corporate governance. There has been an emergence of rating systems that assess the strength of corporate governance. These are provided by ratings agencies such as Standard & Poor’s and Moody’s.
So, an investment management process would ideally focus around the organisation’s prac-tices and processes to ensure that corporate investments, such as acquisitions, large investments in capital expenditure, and so on, are collected, evaluated, appraised, ranked and selected as a suitable fit to the organisation’s strategic plan. The different levels of approvals and corporate governance processes are key together with adequate business case processes. A system or process should be defined for the company’s investment management. Exhibit 4.21 shows the controls and procedures that should be placed around such business cases and investment proposals.
Exhibit 4.21
Investment management system
Evaluation procedure
Authorisation process
Authorisation levels
Viable Reject
Fund
Reporting format
Pre-fund
Source: Author’s own
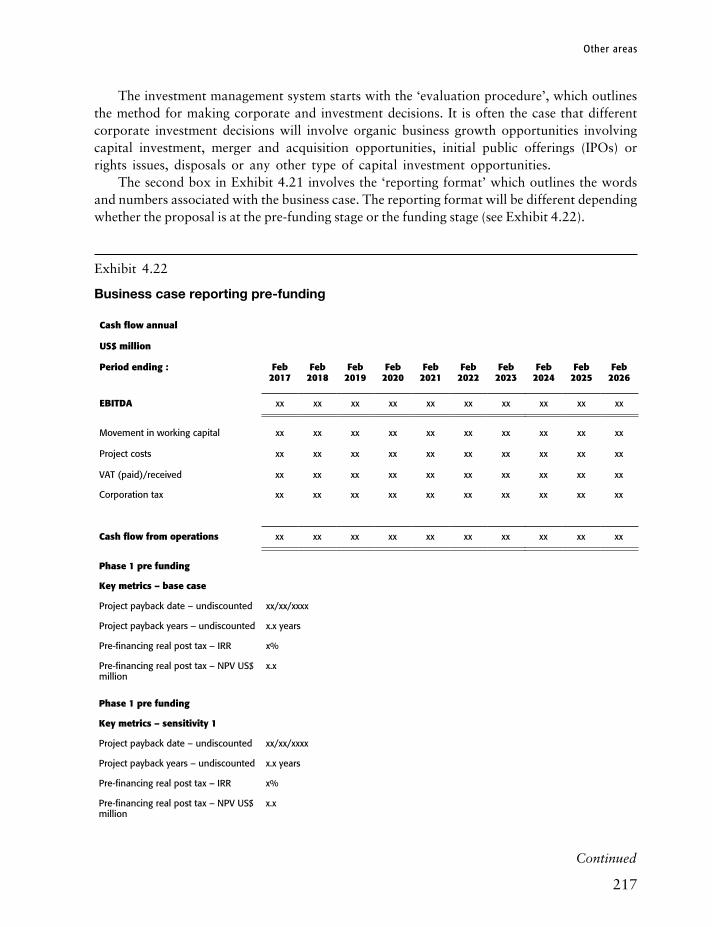
Other areas
217
The investment management system starts with the ‘evaluation procedure’, which outlines the method for making corporate and investment decisions. It is often the case that different corporate investment decisions will involve organic business growth opportunities involving capital investment, merger and acquisition opportunities, initial public offerings (IPOs) or rights issues, disposals or any other type of capital investment opportunities.
The second box in Exhibit 4.21 involves the ‘reporting format’ which outlines the words and numbers associated with the business case. The reporting format will be different depending whether the proposal is at the pre-funding stage or the funding stage (see Exhibit 4.22).
Exhibit 4.22
Business case reporting pre-funding
Cash flow annual
uS$ million
Period ending : Feb 2017
Feb 2018
Feb 2019
Feb 2020
Feb 2021
Feb 2022
Feb 2023
Feb 2024
Feb 2025
Feb 2026
EBITDA xx xx xx xx xx xx xx xx xx xx
Movement in working capital xx xx xx xx xx xx xx xx xx xx
Project costs xx xx xx xx xx xx xx xx xx xx
VAT (paid)/received xx xx xx xx xx xx xx xx xx xx
Corporation tax xx xx xx xx xx xx xx xx xx xx
Cash flow from operations xx xx xx xx xx xx xx xx xx xx
Phase 1 pre funding
Key metrics – base case
Project payback date – undiscounted xx/xx/xxxx
Project payback years – undiscounted x.x years
Pre-financing real post tax – IRR x%
Pre-financing real post tax – NPV US$ million
x.x
Phase 1 pre funding
Key metrics – sensitivity 1
Project payback date – undiscounted xx/xx/xxxx
Project payback years – undiscounted x.x years
Pre-financing real post tax – IRR x%
Pre-financing real post tax – NPV US$ million
x.x
Continued

The Strategic Corporate Investments Handbook
218
Phase 1 pre funding
Key metrics – sensitivity 2
Project payback date – undiscounted xx/xx/xxxx
Project payback years – undiscounted x.x years
Pre-financing real post tax – IRR x%
Pre-financing real post tax – NPV US$ million
x.x
Source: Author’s own
The third box in Exhibit 4.21 involves the ‘authorisation process’. This involves the submission of the proposal form by the manager within the organisation which is evaluated at the appropriate level. The proposal will ultimately be considered an unviable or viable opportunity. If viable the proposal will either progress to phase two (the funding stage) or will be authorised accordingly and the funds agreed.
The fourth box refers to ‘authorisation levels’. All business case proposals should have authorisation or non-approval by an internal officer at different levels of investment required (see Exhibit 4.23).
Exhibit 4.23
Authorisation levels
Board Above £3million
Chief executive officer Above £500,000
Chief financial officer All
Financial controller All
Finance manager All
Business proposer n/a
Source: Author’s own
For an organisation all proposals below the level of £500,000 must be evaluated and authorised by the Finance Manager, Financial Controller, Chief Financial Officer in the order stated. For transactions above £500,000 the opportunity must be evaluated by the
Exhibit 4.22 continued

Other areas
219
Chief Executive, too. For transactions above £3 million the opportunity must be evaluated by the Board, too. So, the higher the amount of capital at risk, more scrutiny must happen in order to mitigate the risk.
1,2,3,4,5,6 UK Corporate Governance Code (September 2012) – The Financial Reporting Council.

220
Chapter 5
Conclusions
This book will ensure that the corporate maximises its opportunities and minimises its risks. All potential opportunities can be screened through the use of appropriate processes and methods, such as desk research, feasibility studies, market research and market testing. The business should have appropriate business case proposal gateways and controls in order to minimise expenditure and maximise the chance of business success. We can use particular routes to the market such as organic growth, strategic partnering/joint ventures, and mergers and acquisitions. The opportunities can be financed in several ways, such as project finance, private equity, corporate finance, initial public offerings, and so on. The marketing mix and the appropriate marketing strategy can be used to finetune the product or service offering.
Once a business transaction has been closed the business should be monitored throughout its lifetime. In order to keep the corporate investment under control it is important to exer-cise periodic management accounting and management reporting, together with financial and non-financial key performance indicators. Incremental capital expenditure should be proposed through the capital budgeting processes and investment appraisals. It is critical that the management of the organisation are fully aware of the key drivers that affect the corporate’s key outputs. Indeed, it is critical for every business to undertake a five to 10-year business plan on a yearly basis, which should include both compelling words and financials.
Indeed, several business failures have happened through not adopting such processes and methods.
Several examples are outlined below where businesses have failed due to a lack of stra-tegic planning and indeed the inability to react to their external business environments and its threats.
One example is a business in the waste management industry that has failed to move from the landfill to the recycling segment quickly enough and allowed its competitors to react more quickly and get a foothold in the new growth market segment.
A further example involves a professional services outsourcing company that after securing one major outsourcing contract decided to expand its resources and expenditure to grow this business before undertaking any desk research, market research, feasibility studies and business planning, resulting in a single contract three years later.
Yet another example is a construction contractor that fails to react to the behaviour of its major client switching from government procurement to a public private partnership approach. The lead time required in closing project finance transactions is typically longer than that required to complete government procurement together with different know-how.
We are sure that you could find numerous more examples in the business world that have either failed financially or lost a high amount of capital through not adopting the techniques and processes outlined in this book. We wish you success in applying this practical guide to your corporate investments.

221
Appendix 1
Project information memorandum
Project ZoroProject information memorandum
Combined cycle gas fired 300MW power plantPocharam India
Equity and senior debt funding requirement
Disclaimer
The views expressed in this Information Memorandum are based on information derived from the project company’s own internal sources and from publicly available sources that have not been independently verified by the project company. No representation, warranty or undertaking, express or implied, is made or given by the project company or any of its officers or employees as to the fairness, accuracy, completeness or reliability of that infor-mation. This Information Memorandum should not be relied upon as a recommendation or forecast by the project company. Any recipient of this Information Memorandum is responsible for conducting their own due diligence and other enquiries as well as making their own credit analysis and their own independent assessment of the information provided herein. Any decision to rely on the information contained in this Information Memorandum is the sole responsibility of the recipient of this document and the project company will not be responsible for any loss incurred by the recipient as a result of any actions taken by them relying on the information herein. All estimates and projections in this Information Memorandum are illustrative only and are based on the assumptions described herein. The project company’s actual results may be materially affected by changes in economic or other circumstances which cannot be foreseen. Nothing in this Information Memorandum is, or should be relied upon as, a promise or representation either as to future results or events or as to the reasonableness of any assumption or view contained herein (whether express or implied). This Information Memorandum contains forward-looking statements regarding future events and the future financial performance of the project company. These forward-looking statements are not guarantees or predictions of future performance, and involve known and unknown risks, uncertainties and other factors, many of which are beyond the control of the project company, and which may cause actual results to differ materially from those expressed in the statements contained in this Information Memorandum.
Appendix 1

222
Appendix 1
Table of contents
Glossary of termsProject backgroundTransaction overviewLocationProject risks and mitigationContact us
Glossary of terms
ADSCR Annual DSCR. (See DSCR.)Availability Availability represents the percentage of the year that the plant is in full
working order.
Base load This is the basic constant level of load required for power plant operations.BTuS This stands for British Thermal Units. It is a unit of energy equal to about 1,055 joules.
Capacity factor The annual capacity factor is the total electricity generated to the maximum limit that it could produce if operating for 24 hours per day and 365 days per year.
Calorific value This is a measure of the amount of energy released from the fuel. This is usually expressed as units of Kcal/kg or MJ/Kg.
Combined cycle gas turbine This is a combination of a gas fired turbine and a steam turbine. This is often a very efficient combination.
Debt service The amount of debt interest and the principal repayments.Debt service reserve account The cash required to be held to service future senior lenders’
debt service obligations.Debt to equity ratio This is the amount of long-term debt expressed to the total debt and
equity for a company.Debt service cover ratio (DSCR) The ratio of cash available for debt service to the actual
debt service.Duration curve This is a graph that shows the demand for energy over time in both hours
of the day and times of the year.
Electricity generation This is the process of generating electrical power from sources of primary energy.
Equity (share/pure) The ownership interest in the SPC in the form of shareholder funds invested by the private sector company (that is, typically 20% to 30% of the total funding required. Interest is not earned on share equity (as opposed to subordinated debt).
Financial close (FC) The point at which all contracts are signed by all parties involved in a project.

Appendix 1
223
Flue gases This is a gas that exists to the atmosphere via a flue, that is, a boiler or steam turbine.
Forced outages The hours whereby the power plant is not operational due to breakdowns rather than a planned maintenance program.
Fossil fuels This is oil, coal and gas that come from the natural fossilisation process over centuries.Funding requirement The amount of long-term funding in terms of debt or equity required
for the construction phase.
Gigawatts A gigawatt is equal to one billion watts.
Interest during construction The amount of interest accrued on funding the construction phase.
Installed capacity Installed capacity represents the maximum power output of a power plant output usually expressed in megawatts (MW) or kilowatts (KW).
Joules This is a measurement of the amount of work done by applying force. One watt per second equals one joule. One kilowatt hour has 3,600 seconds, that is, 60 minutes in an hour and each minute has 60 seconds. 1 kWh equals 3,600 KJ.
Kilowatt A unit of power equal to 1,000 watts.
levelised costs This is a comparative metric that calculates the average cost over the economic useful life of the plant per MWh of electricity.
loan life cover ratio (llCR) The ratio of the NPV of cash available for debt service during the term of the senior debt to the outstanding balance of the senior debt.
Maintenance reserve account The cash required to be held to service future life cycle obligations.
Megawatt A megawatt is equal to 1,000,000 watts.Mega joule This is one million joules.
National grid This is a distribution network for transmitting electricity.Net present value (NPV) The discounted value of a series of future costs, benefits or
payments, that is, the value of future cash flows in today’s money.
Senior debt The major funding component (typically 90% of the funds required for construction, and so on) provided by banks or bonds. It has priority of repayment over other funding sources.
Sensitivity The flexing of key assumptions and evaluating the effect upon key output measures.Special purpose company (SPC) or vehicle (SPV) A company especially established to carry
out the contract, owned by its shareholders, the providers of equity finance for the scheme. Subordinated Debt (or sub-debt) Can be a form of debt that has lower priority for repay-
ment than the senior debt – alternatively called junior debt. (NB: junior debt is not the same as loan stock, but loan stock may be called subordinated debt.)

224
Appendix 1
Steam turbines This is equipment that extracts thermal energy from steam which is used to rotate an output shaft.
Transmission This is the transfer of electrical power from the generating plants to electrical substations to the point close to demand.
Terawatts The terawatt is equal to one trillion watts, that is, 10^12.
watt This is a unit of power named after the Scottish engineer James Watt.
Project background
The project is a combined cycle gas fired 300 MW power plant to be developed on a build own operate basis in a major region of India. The project serves a major city in the region. This region of India has an electricity shortfall of around 50%, that is, the demand for the region is likely to meet 10,000 MW of installed capacity by 2025. Furthermore, statistics from the World Bank show significant population growth for India between now and 2025, see Exhibit A1.1. The world demand for gas is also shown in Exhibit A1.2.
Exhibit A1.1
India population projection (billion)
0.00
0.20
0.40
0.60
0.80
1.00
1.20
Ages 0–14 Ages 15–64 Ages 65+
2010 2025 2040
Source: World Bank

Appendix 1
225
Exhibit A1.2
World growth in gas demand
020406080
100120140160180200
2010 2040
Quadrillion BTUs
Source: EIA
Transaction overview
Introduction
We plan to finance this project on a 70% debt to 30% equity ratio. Consequently we seek both equity investors and providers of debt for this project. The transaction structure is outlined in the next section ‘Project structure’.
Project structure
The proposed project structure is shown in Exhibit A1.3.

226
Appendix 1
Exhibit A1.3
Proposed project structure
Sub debt andequity
Consortium
Blended returns
Debt
SeniorLendersSyndicate
Debt servicing
SpecialPurposeCompany
Offtake agreement
Power purchaseagreement
PublicSector Body
Engineeringprocurementandconstruction
Construction
FacilitiesSupplyAgreement
Fuel supply
OperatingandMaintenanceContract
Operations
Source: Author’s own
The consortium members will provide equity capital to the project company perhaps with a shareholder loan and will receive both dividends and interest (in the case of a shareholder loan). The senior lenders’ syndicate will provide debt capital to the project company and will receive their debt service payments in terms of both interest and principal. The government sector will provide revenue for purchasing the power generated from the project company through the Power Purchase Agreement. A contractor will engineer procure and construct the power plant over 36 months from financial closure. The relevant government body will supply and transport the fuel to the power station site through the fuel supply agreement. The power station will be operated and maintained over the life by an experienced and reliable operating and maintenance contractor.
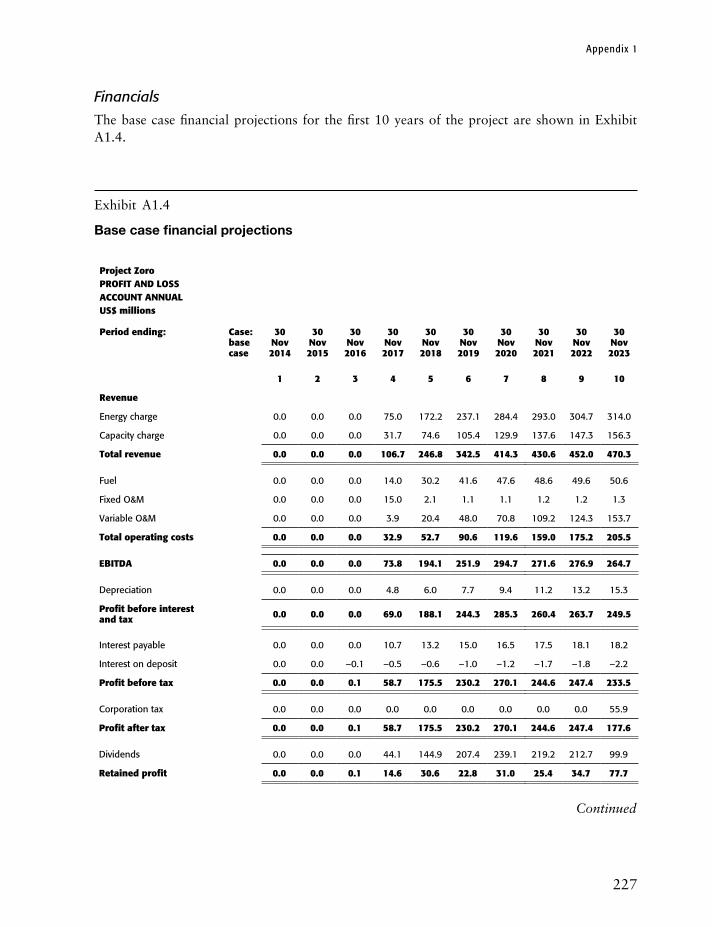
Appendix 1
227
Financials
The base case financial projections for the first 10 years of the project are shown in Exhibit A1.4.
Exhibit A1.4
Base case financial projections
Project ZoroPROFIT AND lOSS ACCOuNT ANNuAluS$ millions
Period ending: Case: base case
30 Nov 2014
30 Nov 2015
30 Nov 2016
30 Nov 2017
30 Nov 2018
30 Nov 2019
30 Nov 2020
30 Nov 2021
30 Nov 2022
30 Nov 2023
1 2 3 4 5 6 7 8 9 10
Revenue
Energy charge 0.0 0.0 0.0 75.0 172.2 237.1 284.4 293.0 304.7 314.0
Capacity charge 0.0 0.0 0.0 31.7 74.6 105.4 129.9 137.6 147.3 156.3
Total revenue 0.0 0.0 0.0 106.7 246.8 342.5 414.3 430.6 452.0 470.3
Fuel 0.0 0.0 0.0 14.0 30.2 41.6 47.6 48.6 49.6 50.6
Fixed O&M 0.0 0.0 0.0 15.0 2.1 1.1 1.1 1.2 1.2 1.3
Variable O&M 0.0 0.0 0.0 3.9 20.4 48.0 70.8 109.2 124.3 153.7
Total operating costs 0.0 0.0 0.0 32.9 52.7 90.6 119.6 159.0 175.2 205.5
EBITDA 0.0 0.0 0.0 73.8 194.1 251.9 294.7 271.6 276.9 264.7
Depreciation 0.0 0.0 0.0 4.8 6.0 7.7 9.4 11.2 13.2 15.3
Profit before interest and tax
0.0 0.0 0.0 69.0 188.1 244.3 285.3 260.4 263.7 249.5
Interest payable 0.0 0.0 0.0 10.7 13.2 15.0 16.5 17.5 18.1 18.2
Interest on deposit 0.0 0.0 –0.1 –0.5 –0.6 –1.0 –1.2 –1.7 –1.8 –2.2
Profit before tax 0.0 0.0 0.1 58.7 175.5 230.2 270.1 244.6 247.4 233.5
Corporation tax 0.0 0.0 0.0 0.0 0.0 0.0 0.0 0.0 0.0 55.9
Profit after tax 0.0 0.0 0.1 58.7 175.5 230.2 270.1 244.6 247.4 177.6
Dividends 0.0 0.0 0.0 44.1 144.9 207.4 239.1 219.2 212.7 99.9
Retained profit 0.0 0.0 0.1 14.6 30.6 22.8 31.0 25.4 34.7 77.7
Continued
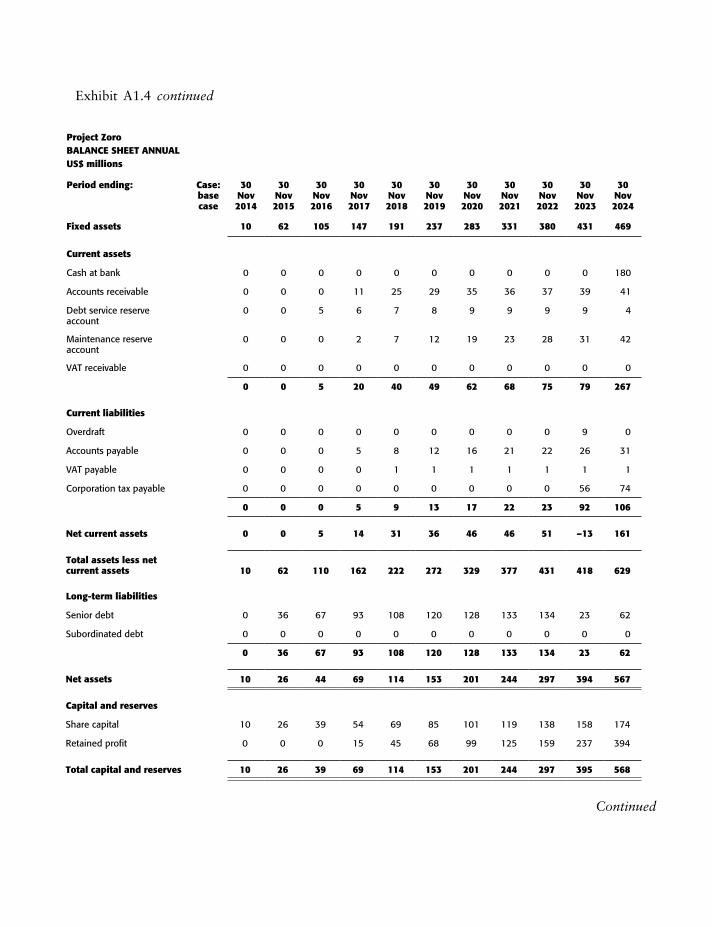
Project ZoroBAlANCE SHEET ANNuAluS$ millions
Period ending: Case: base case
30 Nov 2014
30 Nov 2015
30 Nov 2016
30 Nov 2017
30 Nov 2018
30 Nov 2019
30 Nov 2020
30 Nov 2021
30 Nov 2022
30 Nov 2023
30 Nov 2024
Fixed assets 10 62 105 147 191 237 283 331 380 431 469
Current assets
Cash at bank 0 0 0 0 0 0 0 0 0 0 180
Accounts receivable 0 0 0 11 25 29 35 36 37 39 41
Debt service reserve account
0 0 5 6 7 8 9 9 9 9 4
Maintenance reserve account
0 0 0 2 7 12 19 23 28 31 42
VAT receivable 0 0 0 0 0 0 0 0 0 0 0
0 0 5 20 40 49 62 68 75 79 267
Current liabilities
Overdraft 0 0 0 0 0 0 0 0 0 9 0
Accounts payable 0 0 0 5 8 12 16 21 22 26 31
VAT payable 0 0 0 0 1 1 1 1 1 1 1
Corporation tax payable 0 0 0 0 0 0 0 0 0 56 74
0 0 0 5 9 13 17 22 23 92 106
Net current assets 0 0 5 14 31 36 46 46 51 –13 161
Total assets less net current assets 10 62 110 162 222 272 329 377 431 418 629
long-term liabilities
Senior debt 0 36 67 93 108 120 128 133 134 23 62
Subordinated debt 0 0 0 0 0 0 0 0 0 0 0
0 36 67 93 108 120 128 133 134 23 62
Net assets 10 26 44 69 114 153 201 244 297 394 567
Capital and reserves
Share capital 10 26 39 54 69 85 101 119 138 158 174
Retained profit 0 0 0 15 45 68 99 125 159 237 394
Total capital and reserves 10 26 39 69 114 153 201 244 297 395 568
Exhibit A1.4 continued
Continued
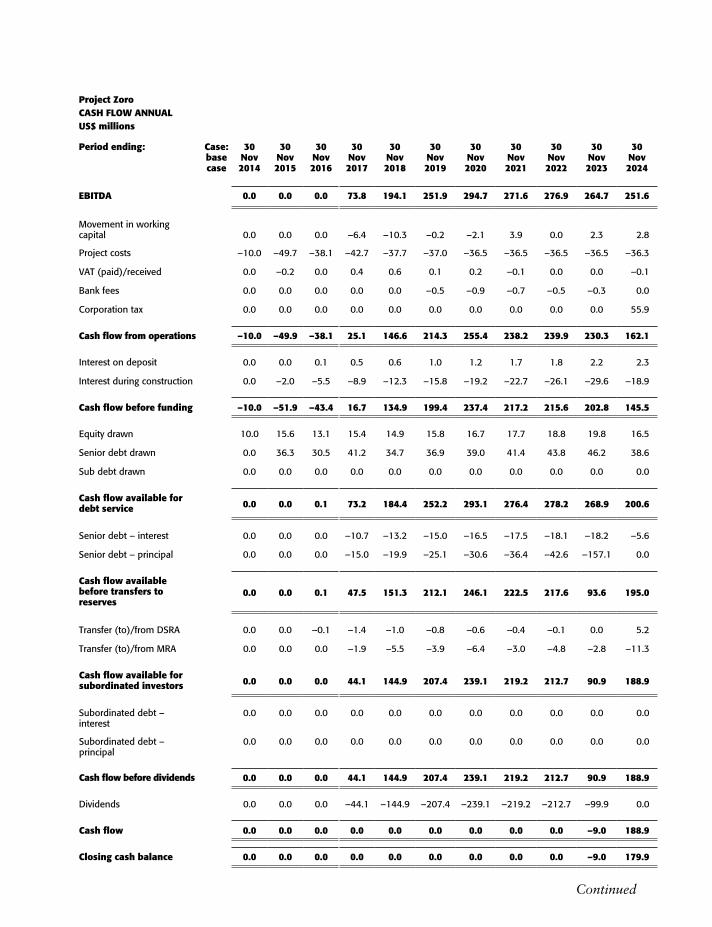
Project ZoroCASH FlOw ANNuAluS$ millions
Period ending: Case: base case
30 Nov 2014
30 Nov 2015
30 Nov 2016
30 Nov 2017
30 Nov 2018
30 Nov 2019
30 Nov 2020
30 Nov 2021
30 Nov 2022
30 Nov 2023
30 Nov 2024
EBITDA 0.0 0.0 0.0 73.8 194.1 251.9 294.7 271.6 276.9 264.7 251.6
Movement in working capital 0.0 0.0 0.0 –6.4 –10.3 –0.2 –2.1 3.9 0.0 2.3 2.8
Project costs –10.0 –49.7 –38.1 –42.7 –37.7 –37.0 –36.5 –36.5 –36.5 –36.5 –36.3
VAT (paid)/received 0.0 –0.2 0.0 0.4 0.6 0.1 0.2 –0.1 0.0 0.0 –0.1
Bank fees 0.0 0.0 0.0 0.0 0.0 –0.5 –0.9 –0.7 –0.5 –0.3 0.0
Corporation tax 0.0 0.0 0.0 0.0 0.0 0.0 0.0 0.0 0.0 0.0 55.9
Cash flow from operations –10.0 –49.9 –38.1 25.1 146.6 214.3 255.4 238.2 239.9 230.3 162.1
Interest on deposit 0.0 0.0 0.1 0.5 0.6 1.0 1.2 1.7 1.8 2.2 2.3
Interest during construction 0.0 –2.0 –5.5 –8.9 –12.3 –15.8 –19.2 –22.7 –26.1 –29.6 –18.9
Cash flow before funding –10.0 –51.9 –43.4 16.7 134.9 199.4 237.4 217.2 215.6 202.8 145.5
Equity drawn 10.0 15.6 13.1 15.4 14.9 15.8 16.7 17.7 18.8 19.8 16.5
Senior debt drawn 0.0 36.3 30.5 41.2 34.7 36.9 39.0 41.4 43.8 46.2 38.6
Sub debt drawn 0.0 0.0 0.0 0.0 0.0 0.0 0.0 0.0 0.0 0.0 0.0
Cash flow available for debt service
0.0 0.0 0.1 73.2 184.4 252.2 293.1 276.4 278.2 268.9 200.6
Senior debt – interest 0.0 0.0 0.0 –10.7 –13.2 –15.0 –16.5 –17.5 –18.1 –18.2 –5.6
Senior debt – principal 0.0 0.0 0.0 –15.0 –19.9 –25.1 –30.6 –36.4 –42.6 –157.1 0.0
Cash flow available before transfers to reserves
0.0 0.0 0.1 47.5 151.3 212.1 246.1 222.5 217.6 93.6 195.0
Transfer (to)/from DSRA 0.0 0.0 –0.1 –1.4 –1.0 –0.8 –0.6 –0.4 –0.1 0.0 5.2
Transfer (to)/from MRA 0.0 0.0 0.0 –1.9 –5.5 –3.9 –6.4 –3.0 –4.8 –2.8 –11.3
Cash flow available for subordinated investors
0.0 0.0 0.0 44.1 144.9 207.4 239.1 219.2 212.7 90.9 188.9
Subordinated debt – interest
0.0 0.0 0.0 0.0 0.0 0.0 0.0 0.0 0.0 0.0 0.0
Subordinated debt – principal
0.0 0.0 0.0 0.0 0.0 0.0 0.0 0.0 0.0 0.0 0.0
Cash flow before dividends 0.0 0.0 0.0 44.1 144.9 207.4 239.1 219.2 212.7 90.9 188.9
Dividends 0.0 0.0 0.0 –44.1 –144.9 –207.4 –239.1 –219.2 –212.7 –99.9 0.0
Cash flow 0.0 0.0 0.0 0.0 0.0 0.0 0.0 0.0 0.0 –9.0 188.9
Closing cash balance 0.0 0.0 0.0 0.0 0.0 0.0 0.0 0.0 0.0 –9.0 179.9
Continued
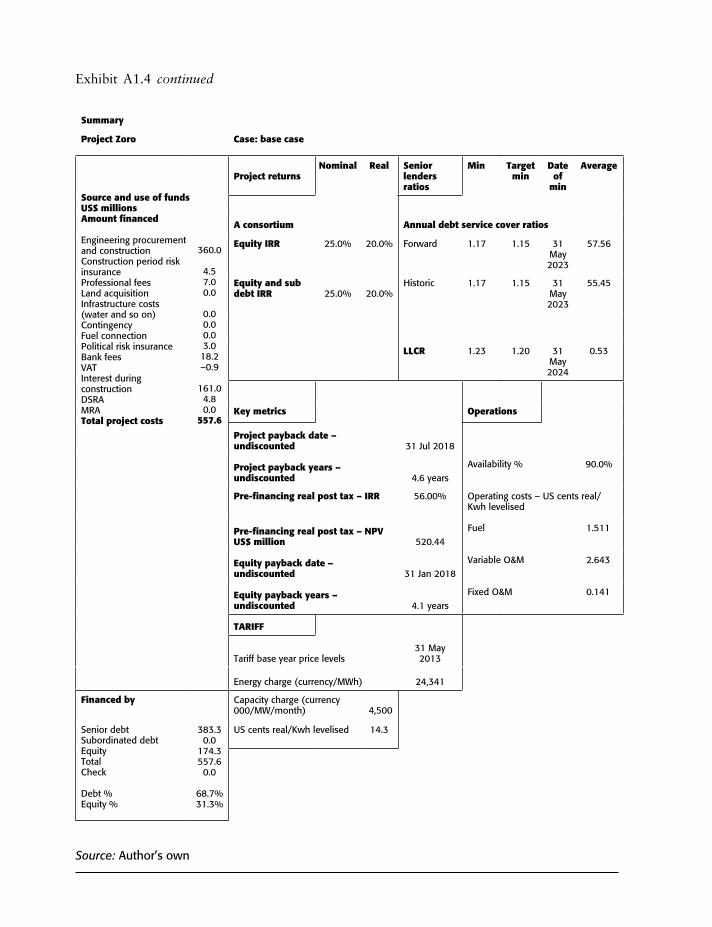
Summary
Project Zoro Case: base case
Source and use of fundsuS$ millions Amount financed Engineering procurement and constructionConstruction period risk insuranceProfessional feesLand acquisitionInfrastructure costs (water and so on)ContingencyFuel connectionPolitical risk insuranceBank feesVATInterest during constructionDSRAMRATotal project costs
Project returns
Nominal Real Senior lenders ratios
Min Target min
Date of
min
Average
360.0
4.57.00.0
0.00.00.03.018.2–0.9
161.04.80.0
557.6
A consortium Annual debt service cover ratios
Equity IRR 25.0% 20.0% Forward 1.17 1.15 31 May 2023
57.56
Equity and sub debt IRR 25.0% 20.0%
Historic 1.17 1.15 31 May 2023
55.45
llCR 1.23 1.20 31 May 2024
0.53
Key metrics Operations
Project payback date – undiscounted 31 Jul 2018
Project payback years – undiscounted 4.6 years
Availability % 90.0%
Pre-financing real post tax – IRR 56.00% Operating costs – US cents real/Kwh levelised
Pre-financing real post tax – NPV uS$ million 520.44
Fuel 1.511
Equity payback date – undiscounted 31 Jan 2018
Variable O&M 2.643
Equity payback years – undiscounted 4.1 years
Fixed O&M
0.141
TARIFF
Tariff base year price levels31 May 2013
Energy charge (currency/MWh) 24,341
Financed by Capacity charge (currency 000/MW/month) 4,500
Senior debtSubordinated debtEquity TotalCheck Debt %Equity %
383.30.0
174.3557.60.0
68.7%31.3%
US cents real/Kwh levelised 14.3
Source: Author’s own
Exhibit A1.4 continued
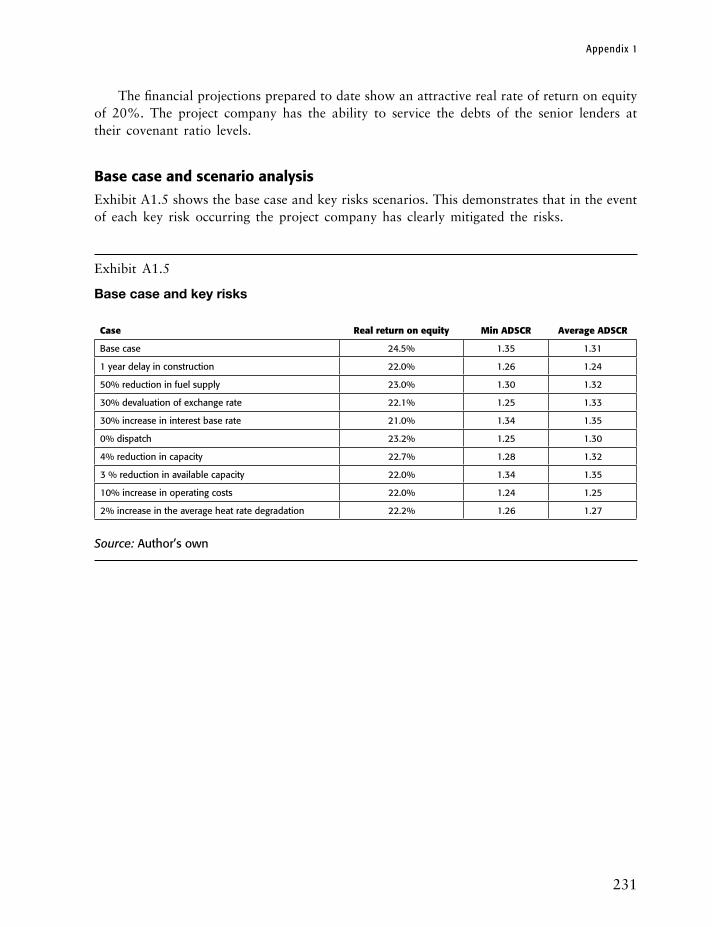
Appendix 1
231
The financial projections prepared to date show an attractive real rate of return on equity of 20%. The project company has the ability to service the debts of the senior lenders at their covenant ratio levels.
Base case and scenario analysis
Exhibit A1.5 shows the base case and key risks scenarios. This demonstrates that in the event of each key risk occurring the project company has clearly mitigated the risks.
Exhibit A1.5
Base case and key risks
Case Real return on equity Min ADSCR Average ADSCR
Base case 24.5% 1.35 1.31
1 year delay in construction 22.0% 1.26 1.24
50% reduction in fuel supply 23.0% 1.30 1.32
30% devaluation of exchange rate 22.1% 1.25 1.33
30% increase in interest base rate 21.0% 1.34 1.35
0% dispatch 23.2% 1.25 1.30
4% reduction in capacity 22.7% 1.28 1.32
3 % reduction in available capacity 22.0% 1.34 1.35
10% increase in operating costs 22.0% 1.24 1.25
2% increase in the average heat rate degradation 22.2% 1.26 1.27
Source: Author’s own

232
Appendix 1
Location
The project is located in Pocharam close to Hyderbad where the power plant benefits from the gas pipeline and the distribution and transmission network in order to deliver the electricity.
Project risks and mitigation
Our risk analysis of this opportunity has revealed a number of key risk areas that we have mitigated as far as possible.
Construction risk
There is always the possibility of cost overruns or indeed construction delays for projects of this kind. Where these factors are due to the controllable events caused by the contractor, the contractor will make liquidated damage payments to the special purpose company (SPC) and indeed the contractor will only be paid against milestone achievements. We are also using a reputable and reliable contractor. Insurance has been arranged which cover force majeure construction risks.
Fuel supply risk
The national petroleum company has been contracted to supply and transport the fuel to the site. The independent gas consultant has confirmed that there is an adequate supply of fuel, and transportation via pipelines will be in place by the time the fuel is required.
Offtake risk
The Power Purchase Agreement is structured on an energy charge and capacity charge basis. The energy charge recovers all the variable costs associated with running the power plant, that is, fuel and variable operating and maintenance expenditure. The capacity charge covers the fixed operating and maintenance, return on equity and debt service. Therefore, if no generation is required the capacity payment will cover the fixed costs and the variable costs can be avoided by not generating electricity.
Technological risk
The gas and steam turbines are supplied by a credible manufacturer with a track record of success around the world. The same specification has been supplied to 15 independent power projects globally.
Operating risk
The operating and maintenance contract has a proven track record and has operated power plants of this size and technology around the world for the last three decades.

Appendix 1
233
Environmental and licensing risk
The project company has received the required licence to generate electricity from the relevant government agency.
Contact us
If you are interested in investing in this opportunity either as an equity investor or a lead arranger of debt financial please feel free to contact us as follows.
John Smith, Managing Director, Lead Partner Consortium.Tel XXXXXX E XXXXX.Fred Brown, Chief Financial Officer, Lead Partner Consortium.Tel XXXXXX E XXXXXX.

234
Appendix 2
Confidential offer memorandum
Cover
Delta Gaming Group LimitedProposed Disposal – Offer Memorandum
Table of contents
Disclaimer and noticeIndustry overviewOverview of the businessOwnership and controlStrategy and business modelProducts and servicesMarket segmentationManagement and employeesFacilities and premisesInformation systemsIntellectual propertyLegal regulatory and environmentalHistorical income statementHistorical balance sheetsHistorical cash flows Historical financial ratiosProjected income statementProjected balance sheetsProjected cash flows Projected financial ratiosAcquisition and transaction information
Disclaimer and notice
The views expressed in this Offer Memorandum are based on information derived from the company’s own internal sources and from publicly available sources that have not been independently verified by the company. No representation, warranty or undertaking, express or implied, is made or given by the company or any of its officers or employees as to the fairness, accuracy, completeness or reliability of that information. This Offer

235
Appendix 2
Memorandum should not be relied upon as a recommendation or forecast by the company. Any recipient of this Offer Memorandum is responsible for conducting their own due diligence and other enquiries as well as making their own credit analysis and their own independent assessment of the information provided herein. Any decision to rely on the information contained in this Offer Memorandum is the sole responsibility of the recipient of this document and the company will not be responsible for any loss incurred by the recipient as a result of any actions taken by them relying on the information herein. All estimates and projections in this Offer Memorandum are illustrative only and are based on the assumptions described herein. The company’s actual results may be materially affected by changes in economic or other circumstances which cannot be foreseen. Nothing in this Offer Memorandum is, or should be relied upon as, a promise or representation either as to future results or events or as to the reasonableness of any assumption or view contained herein (whether express or implied). This Offer Memorandum contains forward-looking statements regarding future events and the future financial performance of the project company. These forward-looking statements are not guarantees or predic-tions of future performance, and involve known and unknown risks, uncertainties and other factors, many of which are beyond the control of the company, and which may cause actual results to differ materially from those expressed in the statements contained in this Offer Memorandum.
Industry overview
The international gaming industry is predicted to grow at an average rate of 5% per annum over the next five years (source: Industry Sector Consultants).
The industry is largely technology driven and governed by legislation regarding gambling and gaming. There are five main players in the international market. Delta Gaming Group Limited has around a 16% share of the total gaming international market.
Overview of the business
The principal business activity of the group is the provision of gaming machines for leisure and gaming markets. The Group’s key strategic focus is the development and provision of server-based gaming systems and server-based gaming digital and networked terminals.
Ownership and control
The business was a management buyout of a division of a multi-national group back in 2005. The group is 20% management owned and 80% private equity owned.
Strategy and business model
The company’s strategy is to grow on a geographical basis by developing regional offices and rollout the technology into the specific distribution channels on a revenue share basis.

236
Appendix 2
Products and services
The group’s products and services are targeted at betting and Street Gaming, Casino and Bingo, Virtual Racing Systems, and leisure. The company has a mix of terminals and gaming systems that are tailored for the international markets and channels of distribution.
Market segmentation
The market can be segmented by geographical region and by distribution channel, that is, betting and Street Gaming, Casino and Bingo, Virtual Racing Systems, and leisure.
Management and employees
The company has an experienced Management Team comprising of a CEO, CFO, CTO, Commercial Director and a Chief Operating Officer. There are 450 employees in 25 countries.
Facilities and premises
The company’s headquarters is in London W5. It has five regional offices for each region (Europe, Asia, Australasia, Middle East and Americas).
Information systems
The company derives a vast amount of information from its gaming machines through the point of sale technology which allows intelligence to be gained regarding customer sales, customer profitability and product profitability throughout the group.
Proprietary technology and intellectual property
The group’s state of the art technology underpinned by continuous research and development.
Legal, regulatory and environmental
The business has the legal, regulatory and environmental threat of the laws regarding gambling and the social responsibilities thereof. Of course, this can vary from country to country.
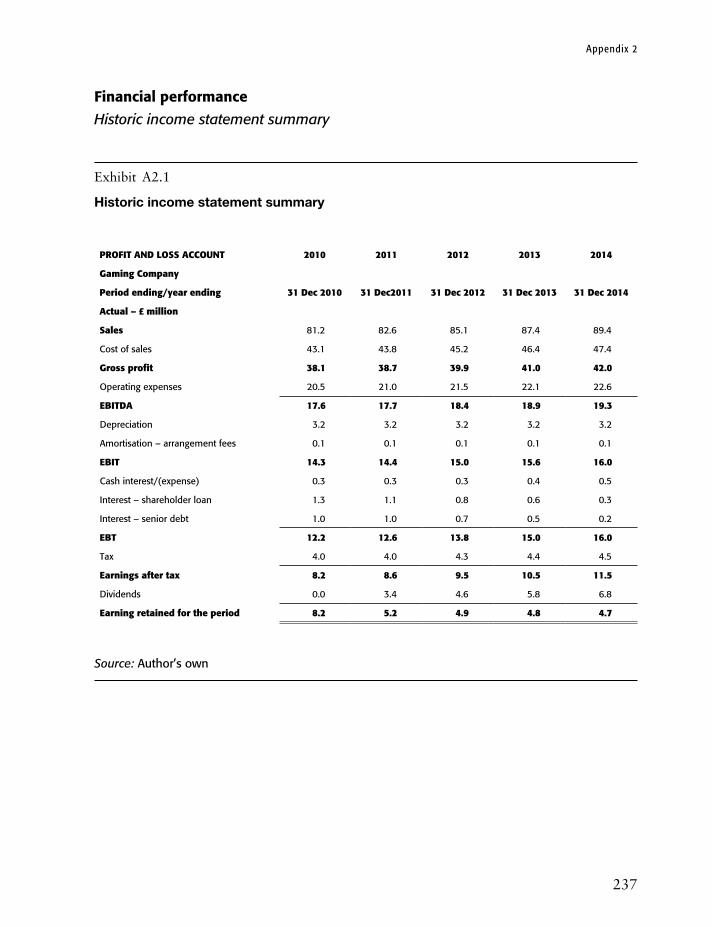
237
Appendix 2
Financial performance
Historic income statement summary
Exhibit A2.1
Historic income statement summary
PROFIT AND lOSS ACCOuNT 2010 2011 2012 2013 2014
Gaming Company
Period ending/year ending 31 Dec 2010 31 Dec2011 31 Dec 2012 31 Dec 2013 31 Dec 2014
Actual – £ million
Sales 81.2 82.6 85.1 87.4 89.4
Cost of sales 43.1 43.8 45.2 46.4 47.4
Gross profit 38.1 38.7 39.9 41.0 42.0
Operating expenses 20.5 21.0 21.5 22.1 22.6
EBITDA 17.6 17.7 18.4 18.9 19.3
Depreciation 3.2 3.2 3.2 3.2 3.2
Amortisation – arrangement fees 0.1 0.1 0.1 0.1 0.1
EBIT 14.3 14.4 15.0 15.6 16.0
Cash interest/(expense) 0.3 0.3 0.3 0.4 0.5
Interest – shareholder loan 1.3 1.1 0.8 0.6 0.3
Interest – senior debt 1.0 1.0 0.7 0.5 0.2
EBT 12.2 12.6 13.8 15.0 16.0
Tax 4.0 4.0 4.3 4.4 4.5
Earnings after tax 8.2 8.6 9.5 10.5 11.5
Dividends 0.0 3.4 4.6 5.8 6.8
Earning retained for the period 8.2 5.2 4.9 4.8 4.7
Source: Author’s own

238
Appendix 2
Historic balance sheet
Exhibit A2.2
Historic balance sheet
BAlANCE SHEET 2010 2011 2012 2013 2014
Gaming Company
Period ending/year ending 31 Dec 2010 31 Dec 2011 31 Dec 2012 31 Dec 2013 31 Dec 2014
Actual – £ million
Fixed assets - net book value 29.1 25.8 22.6 19.4 16.2
Capitalised arrangement fees 0.3 0.2 0.2 0.1 0.0
Current assets
Cash 14.3 17.1 20.0 23.1 27.1
Accounts receivable 6.7 7.2 7.7 8.1 7.8
Stock 3.5 3.8 4.1 4.1 4.4
Other current assets 7.8 7.9 7.7 8.4 8.8
32.3 36.1 39.5 43.7 48.1
Current liabilities
Accounts payable 4.7 4.3 3.5 3.7 4.3
VAT payable/(receivable) 0.9 2.1 3.3 4.6 5.9
Tax payable 4.0 4.0 4.3 4.4 4.5
9.7 10.5 11.1 12.7 14.6
long-term liabilities
Shareholder loan 7.4 5.6 3.7 1.9 0.0
Senior debt 14.6 11.0 7.3 3.7 0.0
22.0 16.5 11.0 5.5 0.0
Net assets 30.0 35.2 40.2 44.9 49.6
Financed by
Equity 21.8 21.8 21.8 21.8 21.8
Retained earnings 8.2 13.4 18.4 23.1 27.8
Shareholders’ funds 30.0 35.2 40.2 44.9 49.6
Source: Author’s own

239
Appendix 2
Historic cash flows
Exhibit A2.3
Historic cash flows
CASH FlOw 2010 2011 2012 2013 2014
Gaming Company
Period ending/year ending 31 Dec 2010
31 Dec 2011
31 Dec 2012
31 Dec 2013
31 Dec 2014
Actual – £ million
EBITDA 17.6 17.7 18.4 18.9 19.3
Movement in working capital (increase/(decrease) in cash flow) –6.6 –1.4 –1.3 –0.9 0.1
Taxes paid –4.6 –4.0 –4.0 –4.3 –4.4
VAT (paid)/received 0.4 1.2 1.2 1.3 1.3
Cash flow from operating activities 6.6 13.5 14.2 15.0 16.3
Capital expenditure –12.3 0.0 0.0 0.0 0.0
–5.7 13.5 14.2 15.0 16.3
Net cash interest income/(expense) 0.3 0.3 0.3 0.4 0.5
Cash flow available for debt service –5.3 13.8 14.6 15.4 16.8
Shareholders’ loan drawn 1.2 0.0 0.0 0.0 0.0
Senior debt drawn 6.2 0.0 0.0 0.0 0.0
Equity drawn 5.0 0.0 0.0 0.0 0.0
Shareholders’ loan principal –1.9 –1.9 –1.9 –1.9 –1.9
Senior debt principal –3.7 –3.7 –3.7 –3.7 –3.7
Shareholders’ loan – interest –1.3 –1.1 –0.8 –0.6 –0.3
Senior debt – interest –1.0 –1.0 –0.7 –0.5 –0.2
Shareholders’ loan – fees 0.0 0.0 0.0 0.0 0.0
Senior debt – fees –0.1 0.0 0.0 0.0 0.0
Cash flow available for shareholders –1.0 6.2 7.5 8.9 10.7
Dividends paid 0.0 –3.4 –4.6 –5.8 –6.8
Change In cash and cash equivalents –1.0 2.8 2.9 3.1 4.0
Opening cash balance 15.3 14.3 17.1 20.0 23.1
Closing cash balance 14.3 17.1 20.0 23.1 27.1
Source: Author’s own

240
Appendix 2
Historic financial ratios
Exhibit A2.4
Historic financial ratios
Key ratios: 31 Dec 2010 31 Dec 2011 31 Dec 2012 31 Dec 2013 31 Dec 2014
Actual
Sales growth 0.0% 1.7% 3.1% 2.7% 2.2%
Gross profit margin 46.9% 46.9% 46.9% 46.9% 46.9%
EBITDA margin 21.6% 21.4% 21.6% 21.6% 21.6%
EBIT margin 17.6% 17.4% 17.7% 17.9% 17.9%
Tax to EBT 88.0% 32.0% 31.0% 29.6% 28.0%
EBITDA growth (%) 0.7 3.7 3.1 2.1
Current ratio 3.3 3.5 3.6 3.4 3.3
Trade debtor days 21 19 15 15 18
Trade creditor days 40 36 28 29 33
Debt to equity (%) 28.1 21.2 14.3 7.2 0.0%
Source: Author’s own
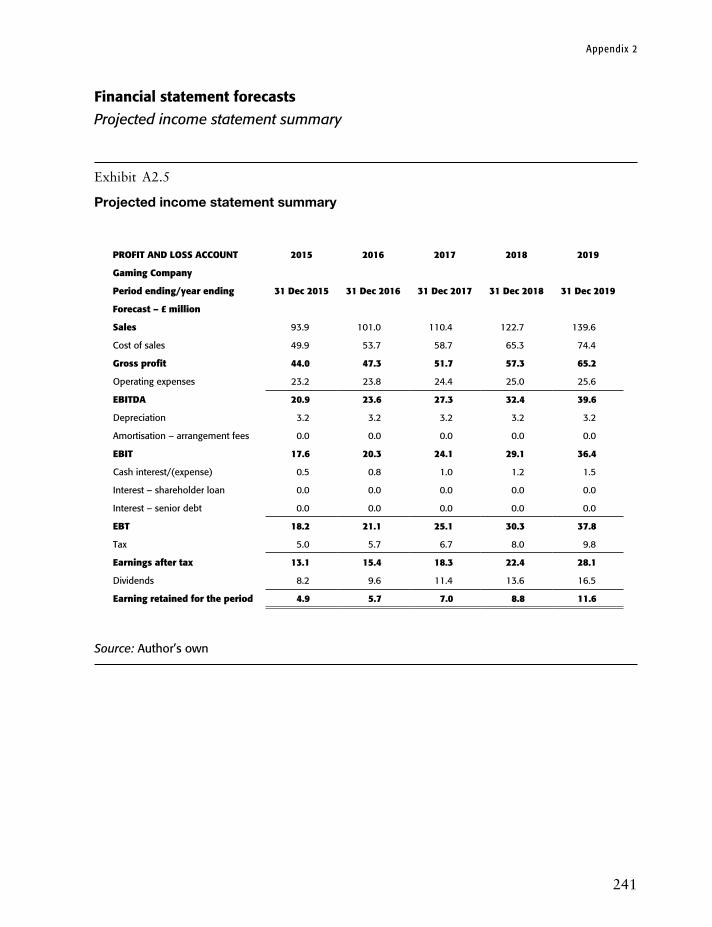
241
Appendix 2
Financial statement forecasts
Projected income statement summary
Exhibit A2.5
Projected income statement summary
PROFIT AND lOSS ACCOuNT 2015 2016 2017 2018 2019
Gaming Company
Period ending/year ending 31 Dec 2015 31 Dec 2016 31 Dec 2017 31 Dec 2018 31 Dec 2019
Forecast – £ million
Sales 93.9 101.0 110.4 122.7 139.6
Cost of sales 49.9 53.7 58.7 65.3 74.4
Gross profit 44.0 47.3 51.7 57.3 65.2
Operating expenses 23.2 23.8 24.4 25.0 25.6
EBITDA 20.9 23.6 27.3 32.4 39.6
Depreciation 3.2 3.2 3.2 3.2 3.2
Amortisation – arrangement fees 0.0 0.0 0.0 0.0 0.0
EBIT 17.6 20.3 24.1 29.1 36.4
Cash interest/(expense) 0.5 0.8 1.0 1.2 1.5
Interest – shareholder loan 0.0 0.0 0.0 0.0 0.0
Interest – senior debt 0.0 0.0 0.0 0.0 0.0
EBT 18.2 21.1 25.1 30.3 37.8
Tax 5.0 5.7 6.7 8.0 9.8
Earnings after tax 13.1 15.4 18.3 22.4 28.1
Dividends 8.2 9.6 11.4 13.6 16.5
Earning retained for the period 4.9 5.7 7.0 8.8 11.6
Source: Author’s own
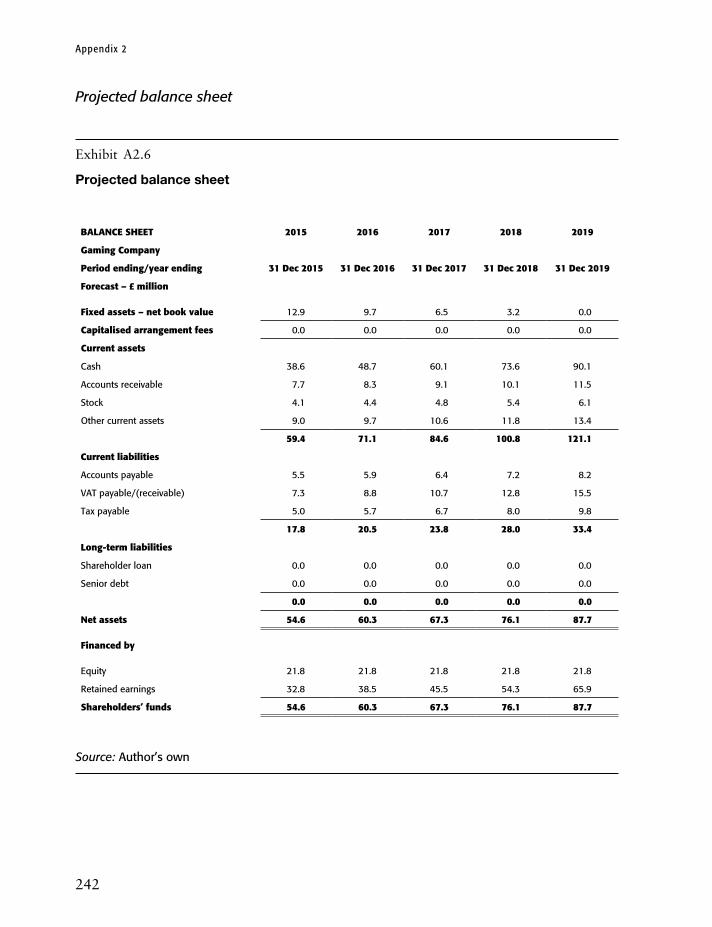
242
Appendix 2
Projected balance sheet
Exhibit A2.6
Projected balance sheet
BAlANCE SHEET 2015 2016 2017 2018 2019
Gaming Company
Period ending/year ending 31 Dec 2015 31 Dec 2016 31 Dec 2017 31 Dec 2018 31 Dec 2019
Forecast – £ million
Fixed assets – net book value 12.9 9.7 6.5 3.2 0.0
Capitalised arrangement fees 0.0 0.0 0.0 0.0 0.0
Current assets
Cash 38.6 48.7 60.1 73.6 90.1
Accounts receivable 7.7 8.3 9.1 10.1 11.5
Stock 4.1 4.4 4.8 5.4 6.1
Other current assets 9.0 9.7 10.6 11.8 13.4
59.4 71.1 84.6 100.8 121.1
Current liabilities
Accounts payable 5.5 5.9 6.4 7.2 8.2
VAT payable/(receivable) 7.3 8.8 10.7 12.8 15.5
Tax payable 5.0 5.7 6.7 8.0 9.8
17.8 20.5 23.8 28.0 33.4
long-term liabilities
Shareholder loan 0.0 0.0 0.0 0.0 0.0
Senior debt 0.0 0.0 0.0 0.0 0.0
0.0 0.0 0.0 0.0 0.0
Net assets 54.6 60.3 67.3 76.1 87.7
Financed by
Equity 21.8 21.8 21.8 21.8 21.8
Retained earnings 32.8 38.5 45.5 54.3 65.9
Shareholders’ funds 54.6 60.3 67.3 76.1 87.7
Source: Author’s own
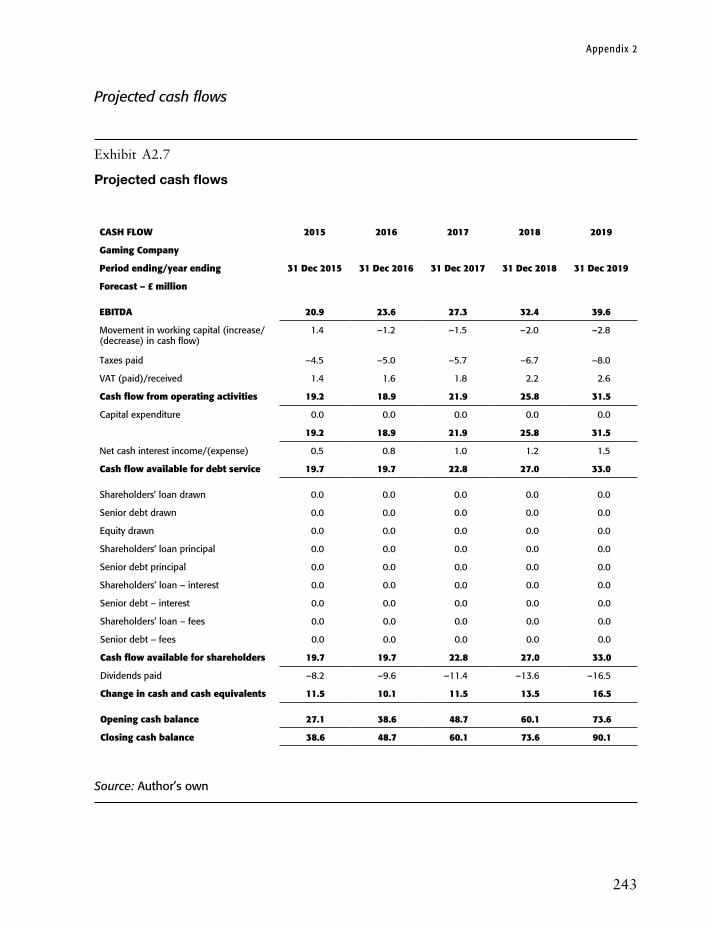
243
Appendix 2
Projected cash flows
Exhibit A2.7
Projected cash flows
CASH FlOw 2015 2016 2017 2018 2019
Gaming Company
Period ending/year ending 31 Dec 2015 31 Dec 2016 31 Dec 2017 31 Dec 2018 31 Dec 2019
Forecast – £ million
EBITDA 20.9 23.6 27.3 32.4 39.6
Movement in working capital (increase/(decrease) in cash flow)
1.4 –1.2 –1.5 –2.0 –2.8
Taxes paid –4.5 –5.0 –5.7 –6.7 –8.0
VAT (paid)/received 1.4 1.6 1.8 2.2 2.6
Cash flow from operating activities 19.2 18.9 21.9 25.8 31.5
Capital expenditure 0.0 0.0 0.0 0.0 0.0
19.2 18.9 21.9 25.8 31.5
Net cash interest income/(expense) 0.5 0.8 1.0 1.2 1.5
Cash flow available for debt service 19.7 19.7 22.8 27.0 33.0
Shareholders’ loan drawn 0.0 0.0 0.0 0.0 0.0
Senior debt drawn 0.0 0.0 0.0 0.0 0.0
Equity drawn 0.0 0.0 0.0 0.0 0.0
Shareholders’ loan principal 0.0 0.0 0.0 0.0 0.0
Senior debt principal 0.0 0.0 0.0 0.0 0.0
Shareholders’ loan – interest 0.0 0.0 0.0 0.0 0.0
Senior debt – interest 0.0 0.0 0.0 0.0 0.0
Shareholders’ loan – fees 0.0 0.0 0.0 0.0 0.0
Senior debt – fees 0.0 0.0 0.0 0.0 0.0
Cash flow available for shareholders 19.7 19.7 22.8 27.0 33.0
Dividends paid –8.2 –9.6 –11.4 –13.6 –16.5
Change in cash and cash equivalents 11.5 10.1 11.5 13.5 16.5
Opening cash balance 27.1 38.6 48.7 60.1 73.6
Closing cash balance 38.6 48.7 60.1 73.6 90.1
Source: Author’s own

244
Appendix 2
Projected financial ratios
Exhibit A2.8
Projected financial ratios
Key ratios: 31 Dec 2015 31 Dec 2016 31 Dec 2017 31 Dec 2018 31 Dec 2019
Forecast
Sales growth 5.1% 7.5% 9.3% 11.1% 13.9%
Gross profit margin 46.9% 46.9% 46.8% 46.8% 46.7%
EBITDA margin 22.2% 23.3% 24.7% 26.4% 28.4%
EBIT margin 18.8% 20.1% 21.8% 23.8% 26.0%
Tax to EBT 27.7% 27.2% 26.8% 26.3% 25.9%
EBITDA growth (%) 7.9 13.0 15.9 18.5 22.3
Current ratio 3.3 3.5 3.6 3.6 3.6
Trade debtor days 21 21 21 21 21
Trade creditor days 40 40 40 40 40
Debt to equity (%) 0.0 0.0 0.0 0.0 0.0
Source: Author’s own
Acquisition and transaction information
The Delta Gaming Group Limited is available for acquisition. The expected purchase price is £155 million. This represents an 8 times EBITDA multiple on the latest full year EBITDA for 2014 of £19.3 million. The consideration will be accepted in the form of cash and or financing.
To express an interest in Delta Gaming Group Limited please contact Delta Gaming Group’s Financial Advisors – Shareholder Value Limited.

245
Appendix 3
Strategic planning case study
Exercise
It is important to note that the figures, illustrations or the case studies used in this book do not represent any past, current or indeed future corporate finance transactions or projects of any kind. The numbers and results contained herein are purely fictional.
The Shiny Shoes Holdings Limited, a player in the UK and European retail shoe business, is currently going through its annual 10-year plan as part of its strategic planning process. The environment analysis has revealed the following results.
Market size/growth
Exhibit A3.1
Market size/growth
Indian retail shoe market revenue uS$ million Actual Actual Actual Actual Actual
Year 2010 2011 2012 2013 2014
Company A 10,436.3 8,172.4 9,529.9 9,495.9 9,623.9
Company B 19,133.3 17,979.3 22,236.5 18,991.8 17,498.0
Company C 28,699.9 30,238.0 27,795.6 27,696.4 31,496.3
Company D 4,348.5 3,269.0 1,588.3 2,374.0 4,374.5
Company E 24,351.5 22,065.6 18,265.7 20,574.5 24,497.1
Total 86,969.5 81,724.3 79,416.0 79,132.7 87,489.8
Source: Author’s own
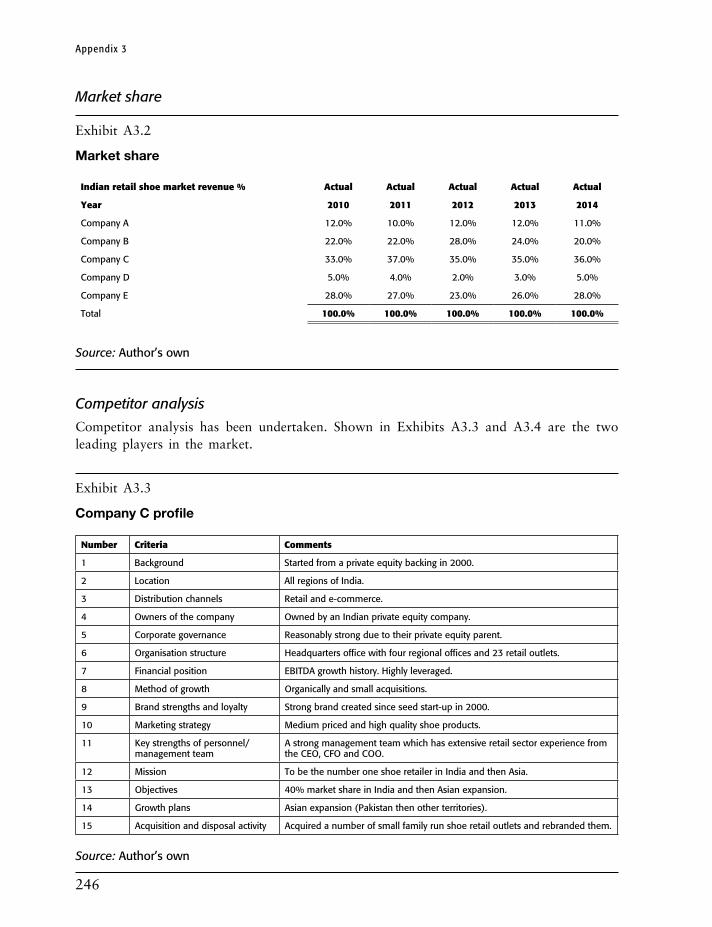
246
Appendix 3
Market share
Exhibit A3.2
Market share
Indian retail shoe market revenue % Actual Actual Actual Actual Actual
Year 2010 2011 2012 2013 2014
Company A 12.0% 10.0% 12.0% 12.0% 11.0%
Company B 22.0% 22.0% 28.0% 24.0% 20.0%
Company C 33.0% 37.0% 35.0% 35.0% 36.0%
Company D 5.0% 4.0% 2.0% 3.0% 5.0%
Company E 28.0% 27.0% 23.0% 26.0% 28.0%
Total 100.0% 100.0% 100.0% 100.0% 100.0%
Source: Author’s own
Competitor analysis
Competitor analysis has been undertaken. Shown in Exhibits A3.3 and A3.4 are the two leading players in the market.
Exhibit A3.3
Company C profile
Number Criteria Comments
1 Background Started from a private equity backing in 2000.
2 Location All regions of India.
3 Distribution channels Retail and e-commerce.
4 Owners of the company Owned by an Indian private equity company.
5 Corporate governance Reasonably strong due to their private equity parent.
6 Organisation structure Headquarters office with four regional offices and 23 retail outlets.
7 Financial position EBITDA growth history. Highly leveraged.
8 Method of growth Organically and small acquisitions.
9 Brand strengths and loyalty Strong brand created since seed start-up in 2000.
10 Marketing strategy Medium priced and high quality shoe products.
11 Key strengths of personnel/management team
A strong management team which has extensive retail sector experience from the CEO, CFO and COO.
12 Mission To be the number one shoe retailer in India and then Asia.
13 Objectives 40% market share in India and then Asian expansion.
14 Growth plans Asian expansion (Pakistan then other territories).
15 Acquisition and disposal activity Acquired a number of small family run shoe retail outlets and rebranded them.
Source: Author’s own
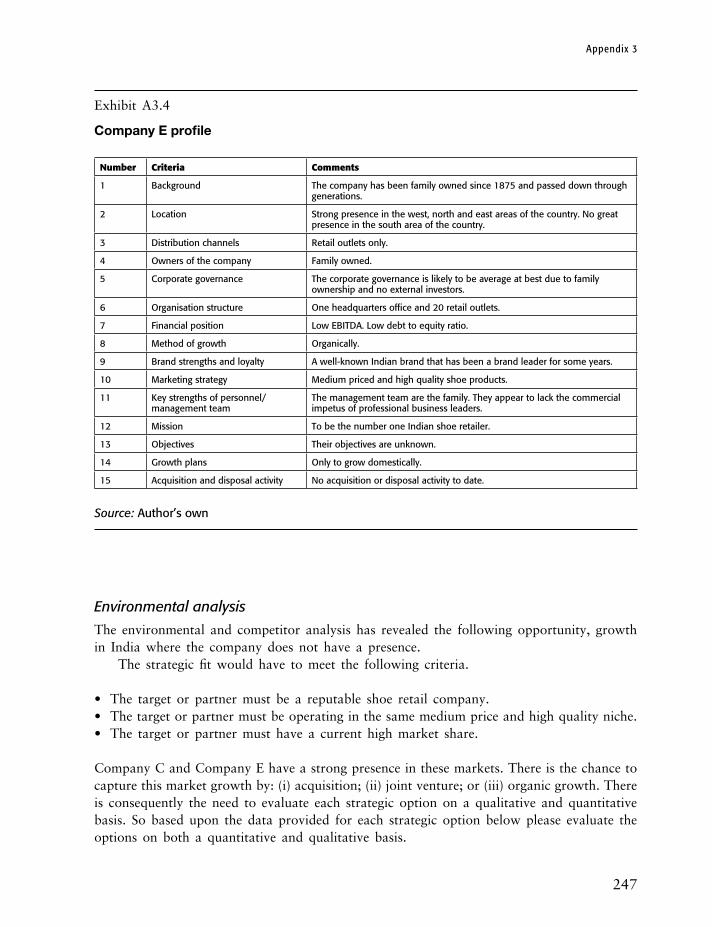
247
Appendix 3
Exhibit A3.4
Company E profile
Number Criteria Comments
1 Background The company has been family owned since 1875 and passed down through generations.
2 Location Strong presence in the west, north and east areas of the country. No great presence in the south area of the country.
3 Distribution channels Retail outlets only.
4 Owners of the company Family owned.
5 Corporate governance The corporate governance is likely to be average at best due to family ownership and no external investors.
6 Organisation structure One headquarters office and 20 retail outlets.
7 Financial position Low EBITDA. Low debt to equity ratio.
8 Method of growth Organically.
9 Brand strengths and loyalty A well-known Indian brand that has been a brand leader for some years.
10 Marketing strategy Medium priced and high quality shoe products.
11 Key strengths of personnel/management team
The management team are the family. They appear to lack the commercial impetus of professional business leaders.
12 Mission To be the number one Indian shoe retailer.
13 Objectives Their objectives are unknown.
14 Growth plans Only to grow domestically.
15 Acquisition and disposal activity No acquisition or disposal activity to date.
Source: Author’s own
Environmental analysis
The environmental and competitor analysis has revealed the following opportunity, growth in India where the company does not have a presence.
The strategic fit would have to meet the following criteria.
• The target or partner must be a reputable shoe retail company. • The target or partner must be operating in the same medium price and high quality niche.• The target or partner must have a current high market share.
Company C and Company E have a strong presence in these markets. There is the chance to capture this market growth by: (i) acquisition; (ii) joint venture; or (iii) organic growth. There is consequently the need to evaluate each strategic option on a qualitative and quantitative basis. So based upon the data provided for each strategic option below please evaluate the options on both a quantitative and qualitative basis.

248
Appendix 3
Financial analysis
The company’s Chief Financial Officer has prepared cash flow forecasts over 10 years for each strategic option.
The company’s weighted average cost of capital (WACC) is 11.8%.
Exhibit A3.5
Organic growth
Organic growth
CASH FlOw ANNuAl
uSD millions
Year 1 2 3 4 5 6 7 8 9 10
Period ending: 30 Nov 2014
30 Nov 2015
30 Nov 2016
30 Nov 2017
30 Nov 2018
30 Nov 2019
30 Nov 2020
30 Nov 2021
30 Nov 2022
30 Nov 2023
Case: base case
EBITDA 1,354 5,251 6,807 11,000 15,944 18,005 20,273 22,765 25,500 28,498
Movement in working capital 204 497 105 349 328 –3 –12 –22 –33 –46
Project costs –7,114 0 0 0 0 0 0 0 0 0
VAT (paid)/received 6 16 6 17 21 9 9 10 11 12
Corporation tax 0 –339 –1,313 –1,702 –2,750 –3,986 –4,501 –5,068 –5,691 –6,375
Cash flow from operations
–5,550 5,425 5,606 9,665 13,542 14,025 15,769 17,685 19,787 22,089
Source: Author’s own

Exhibit A3.6
Joint venture Company C
Joint venture Company C
CASH FlOw ANNuAl
uS$ millions
Year 1 2 3 4 5 6 7 8 9 10
Period ending: 30 Nov 2014
30 Nov 2015
30 Nov 2016
30 Nov 2017
30 Nov 2018
30 Nov 2019
30 Nov 2020
30 Nov 2021
30 Nov 2022
30 Nov 2023
Case: base case
EBITDA 961 1,094 1,277 1,886 2,751 3,127 3,544 4,007 4,520 5,087
Movement in working capital 79 0 2 23 27 –3 –5 –7 –10 –12
Project costs 0 0 0 0 0 0 0 0 0 0
VAT (paid)/received 4 1 1 3 4 2 2 2 2 2
Corporation tax 0 –240 –274 –319 –472 –688 –782 –886 –1,002 –1,130
Cash flow from operations
1,044 855 1,006 1,593 2,310 2,437 2,759 3,116 3,511 3,947
Source: Author’s own
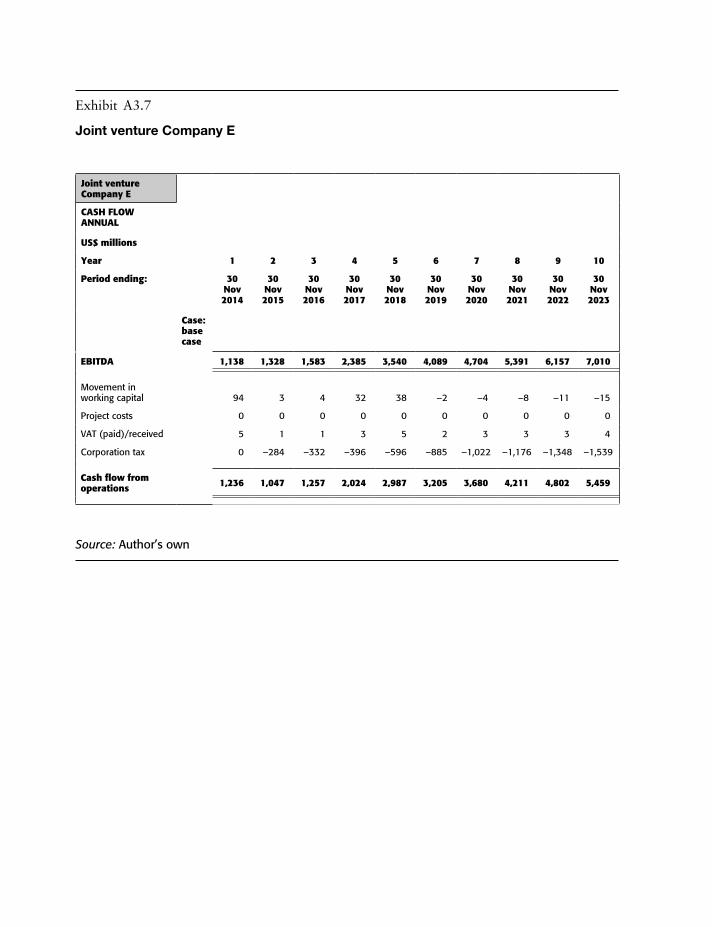
Exhibit A3.7
Joint venture Company E
Joint venture Company E
CASH FlOw ANNuAl
uS$ millions
Year 1 2 3 4 5 6 7 8 9 10
Period ending: 30 Nov 2014
30 Nov 2015
30 Nov 2016
30 Nov 2017
30 Nov 2018
30 Nov 2019
30 Nov 2020
30 Nov 2021
30 Nov 2022
30 Nov 2023
Case: base case
EBITDA 1,138 1,328 1,583 2,385 3,540 4,089 4,704 5,391 6,157 7,010
Movement in working capital 94 3 4 32 38 –2 –4 –8 –11 –15
Project costs 0 0 0 0 0 0 0 0 0 0
VAT (paid)/received 5 1 1 3 5 2 3 3 3 4
Corporation tax 0 –284 –332 –396 –596 –885 –1,022 –1,176 –1,348 –1,539
Cash flow from operations
1,236 1,047 1,257 2,024 2,987 3,205 3,680 4,211 4,802 5,459
Source: Author’s own

Exhibit A3.8
Acquisition Company C
Acquisition Company C
CASH FlOw ANNuAl
uS$ millions
Year 1 2 3 4 5 6 7 8 9 10
Period ending: 30 Nov 2014
30 Nov 2015
30 Nov 2016
30 Nov 2017
30 Nov 2018
30 Nov 2019
30 Nov 2020
30 Nov 2021
30 Nov 2022
30 Nov 2023
Case: base case
EBITDA 3,431 9,259 10,261 14,429 20,067 21,788 23,632 25,605 27,717 29,976
Movement in working capital 178 –607 41 171 232 71 76 81 87 93
Project costs –39,370 0 0 0 0 0 0 0 0 0
VAT (paid)/received –2 24 4 17 23 7 8 8 9 9
Corporation tax 0 –858 –2,315 –2,565 –3,607 –5,017 –5,447 –5,908 –6,401 –6,929
Cash flow from operations
–35,763 7,819 7,991 12,053 16,715 16,850 18,268 19,787 21,411 23,149
Source: Author’s own
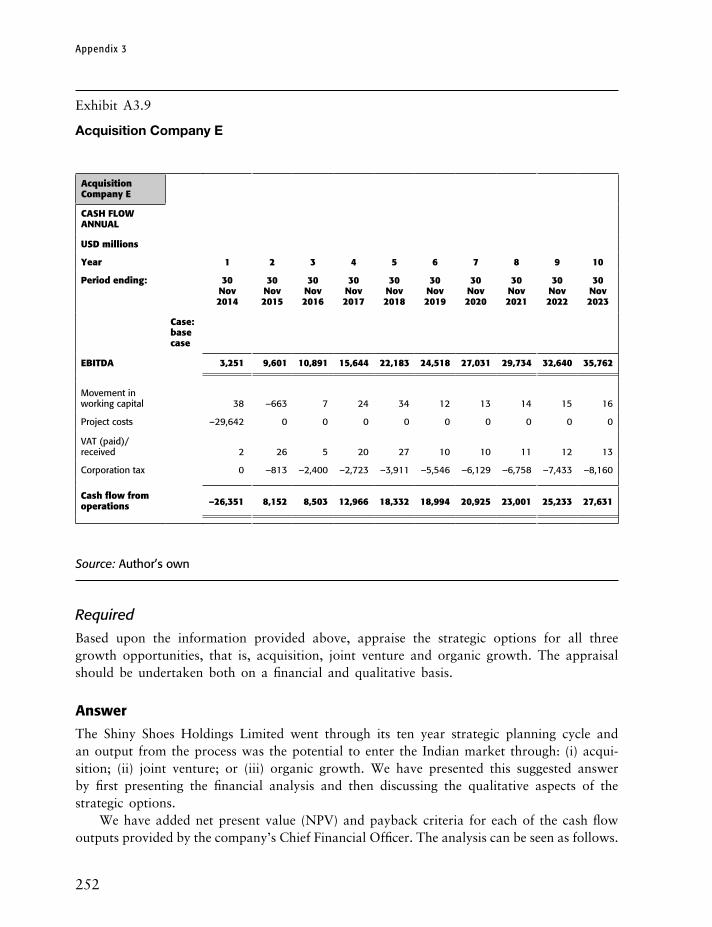
252
Appendix 3
Exhibit A3.9
Acquisition Company E
Acquisition Company E
CASH FlOw ANNuAl
uSD millions
Year 1 2 3 4 5 6 7 8 9 10
Period ending: 30 Nov 2014
30 Nov 2015
30 Nov 2016
30 Nov 2017
30 Nov 2018
30 Nov 2019
30 Nov 2020
30 Nov 2021
30 Nov 2022
30 Nov 2023
Case: base case
EBITDA 3,251 9,601 10,891 15,644 22,183 24,518 27,031 29,734 32,640 35,762
Movement in working capital 38 –663 7 24 34 12 13 14 15 16
Project costs –29,642 0 0 0 0 0 0 0 0 0
VAT (paid)/received 2 26 5 20 27 10 10 11 12 13
Corporation tax 0 –813 –2,400 –2,723 –3,911 –5,546 –6,129 –6,758 –7,433 –8,160
Cash flow from operations
–26,351 8,152 8,503 12,966 18,332 18,994 20,925 23,001 25,233 27,631
Source: Author’s own
Required
Based upon the information provided above, appraise the strategic options for all three growth opportunities, that is, acquisition, joint venture and organic growth. The appraisal should be undertaken both on a financial and qualitative basis.
Answer
The Shiny Shoes Holdings Limited went through its ten year strategic planning cycle and an output from the process was the potential to enter the Indian market through: (i) acqui-sition; (ii) joint venture; or (iii) organic growth. We have presented this suggested answer by first presenting the financial analysis and then discussing the qualitative aspects of the strategic options.
We have added net present value (NPV) and payback criteria for each of the cash flow outputs provided by the company’s Chief Financial Officer. The analysis can be seen as follows.
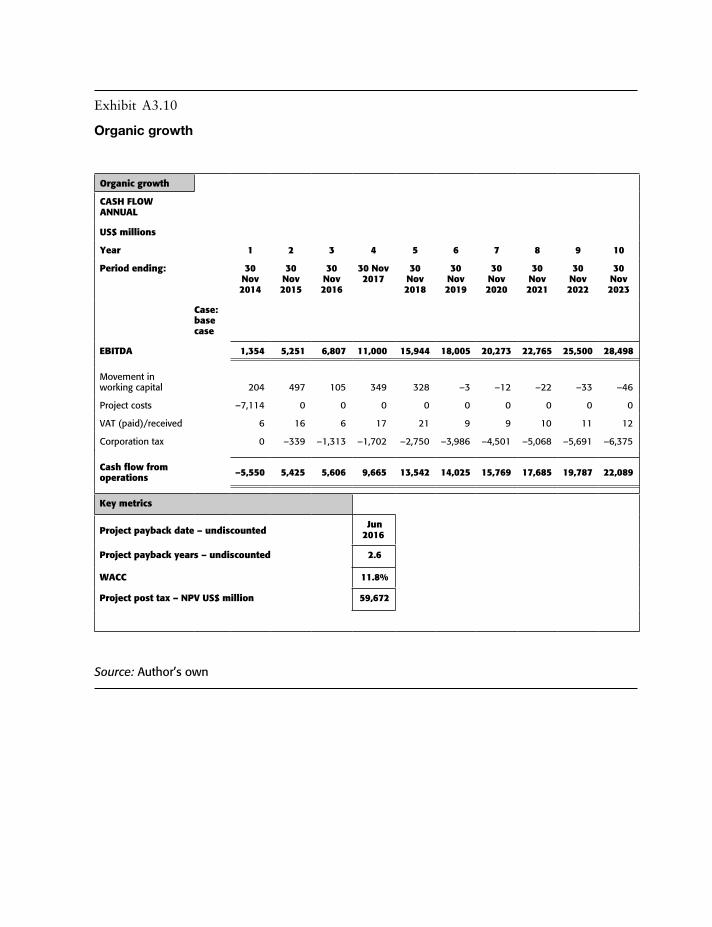
Exhibit A3.10
Organic growth
Organic growth
CASH FlOw ANNuAl
uS$ millions
Year 1 2 3 4 5 6 7 8 9 10
Period ending: 30 Nov 2014
30 Nov 2015
30 Nov 2016
30 Nov 2017
30 Nov 2018
30 Nov 2019
30 Nov 2020
30 Nov 2021
30 Nov 2022
30 Nov 2023
Case: base case
EBITDA 1,354 5,251 6,807 11,000 15,944 18,005 20,273 22,765 25,500 28,498
Movement in working capital 204 497 105 349 328 –3 –12 –22 –33 –46
Project costs –7,114 0 0 0 0 0 0 0 0 0
VAT (paid)/received 6 16 6 17 21 9 9 10 11 12
Corporation tax 0 –339 –1,313 –1,702 –2,750 –3,986 –4,501 –5,068 –5,691 –6,375
Cash flow from operations
–5,550 5,425 5,606 9,665 13,542 14,025 15,769 17,685 19,787 22,089
Key metrics
Project payback date – undiscounted Jun
2016
Project payback years – undiscounted 2.6
wACC 11.8%
Project post tax – NPV uS$ million 59,672
Source: Author’s own
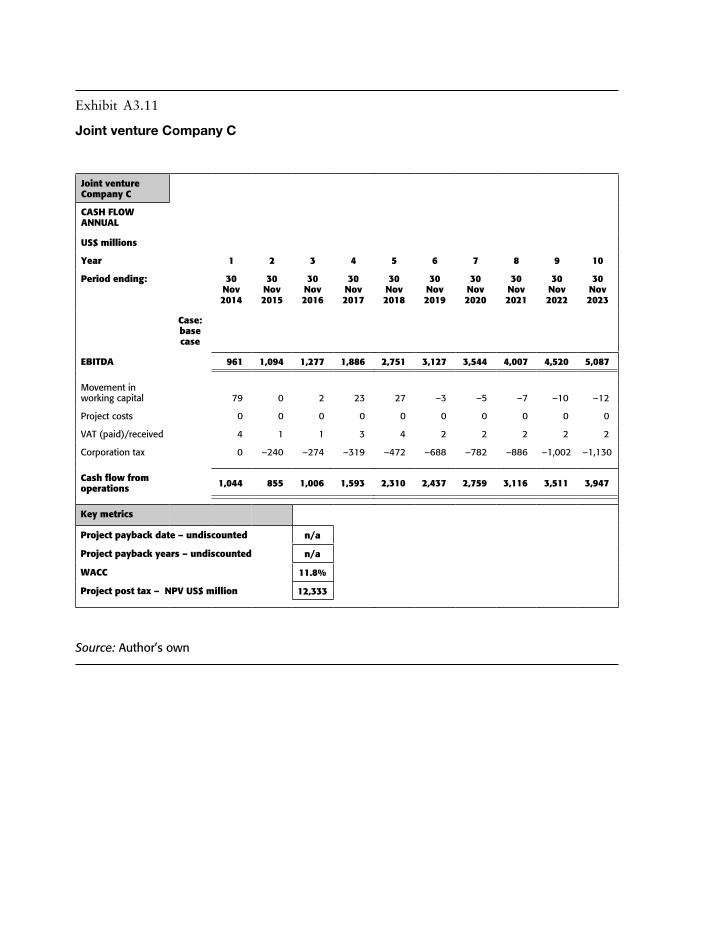
Exhibit A3.11
Joint venture Company C
Joint venture Company C
CASH FlOw ANNuAl
uS$ millions
Year 1 2 3 4 5 6 7 8 9 10
Period ending: 30 Nov 2014
30 Nov 2015
30 Nov 2016
30 Nov 2017
30 Nov 2018
30 Nov 2019
30 Nov 2020
30 Nov 2021
30 Nov 2022
30 Nov 2023
Case: base case
EBITDA 961 1,094 1,277 1,886 2,751 3,127 3,544 4,007 4,520 5,087
Movement in working capital 79 0 2 23 27 –3 –5 –7 –10 –12
Project costs 0 0 0 0 0 0 0 0 0 0
VAT (paid)/received 4 1 1 3 4 2 2 2 2 2
Corporation tax 0 –240 –274 –319 –472 –688 –782 –886 –1,002 –1,130
Cash flow from operations
1,044 855 1,006 1,593 2,310 2,437 2,759 3,116 3,511 3,947
Key metrics
Project payback date – undiscounted n/a
Project payback years – undiscounted n/a
wACC 11.8%
Project post tax – NPV uS$ million 12,333
Source: Author’s own

Exhibit A3.12
Joint venture Company E
Joint venture Company E
CASH FlOw ANNuAl
uS$ millions
Year 1 2 3 4 5 6 7 8 9 10
Period ending: 30 Nov 2014
30 Nov 2015
30 Nov 2016
30 Nov 2017
30 Nov 2018
30 Nov 2019
30 Nov 2020
30 Nov 2021
30 Nov 2022
30 Nov 2023
Case: base case
EBITDA 1,138 1,328 1,583 2,385 3,540 4,089 4,704 5,391 6,157 7,010
Movement in working capital 94 3 4 32 38 –2 –4 –8 –11 –15
Project costs 0 0 0 0 0 0 0 0 0 0
VAT (paid)/received 5 1 1 3 5 2 3 3 3 4
Corporation tax 0 –284 –332 –396 –596 –885 –1,022 –1,176 –1,348 –1,539
Cash flow from operations
1,236 1,047 1,257 2,024 2,987 3,205 3,680 4,211 4,802 5,459
Key metrics
Project payback date – undiscounted n/a
Project payback years – undiscounted n/a
wACC 11.8%
project post tax – NPV uS$ million 16,128
Source: Author’s own

Exhibit A3.13
Acquisition Company C
Acquisition Company C
CASH FlOw ANNuAl
uS$ millions
Year 1 2 3 4 5 6 7 8 9 10
Period ending: 30 Nov 2014
30 Nov 2015
30 Nov 2016
30 Nov 2017
30 Nov 2018
30 Nov 2019
30 Nov 2020
30 Nov 2021
30 Nov 2022
30 Nov 2023
Case: base case
EBITDA 3,431 9,259 10,261 14,429 20,067 21,788 23,632 25,605 27,717 29,976
Movement in working capital 178 –607 41 171 232 71 76 81 87 93
Project costs –39,370 0 0 0 0 0 0 0 0 0
VAT (paid)/received –2 24 4 17 23 7 8 8 9 9
Corporation tax 0 –858 –2,315 –2,565 –3,607 –5,017 –5,447 –5,908 –6,401 –6,929
Cash flow from operations
–35,763 7,819 7,991 12,053 16,715 16,850 18,268 19,787 21,411 23,149
Key metrics
Project payback date – undiscounted Aug 2018
Project payback years – undiscounted 4.8
wACC 11.8%
Project post tax – NPV uS$ million 42,145
Source: Author’s own

257
Appendix 3
Exhibit A3.14
Acquisition Company E
Acquisition Company E
CASH FlOw ANNuAl
uS$ millions
Year 1 2 3 4 5 6 7 8 9 10
Period ending: 30 Nov 2014
30 Nov 2015
30 Nov 2016
30 Nov 2017
30 Nov 2018
30 Nov 2019
30 Nov 2020
30 Nov 2021
30 Nov 2022
30 Nov 2023
Case: base case
EBITDA 3,251 9,601 10,891 15,644 22,183 24,518 27,031 29,734 32,640 35,762
Movement in working capital 38 –663 7 24 34 12 13 14 15 16
Project costs –29,642 0 0 0 0 0 0 0 0 0
VAT (paid)/received 2 26 5 20 27 10 10 11 12 13
Corporation tax 0 –813 –2,400 –2,723 –3,911 –5,546 –6,129 –6,758 –7,433 –8,160
Cash flow from operations
–26,351 8,152 8,503 12,966 18,332 18,994 20,925 23,001 25,233 27,631
Key metrics
Project payback date – undiscounted Oct 2017
Project payback years – undiscounted 3.9
wACC 11.8%
Project post tax – NPV uS$ million 61,205
Source: Author’s own
We have added some payback criteria which includes the undiscounted payback date and time. We have also computed the post-tax NPV for each of the options at the WACC of 11.8% as advised. Based upon a financial standpoint only and looking to maximise the value of the company, we recommend that we consider acquiring Company E. If the acqui-sition of Company E is not possible or not viable at the terms negotiated, organic growth looks a good alternative. A joint venture arrangement between the parties is unlikely to be
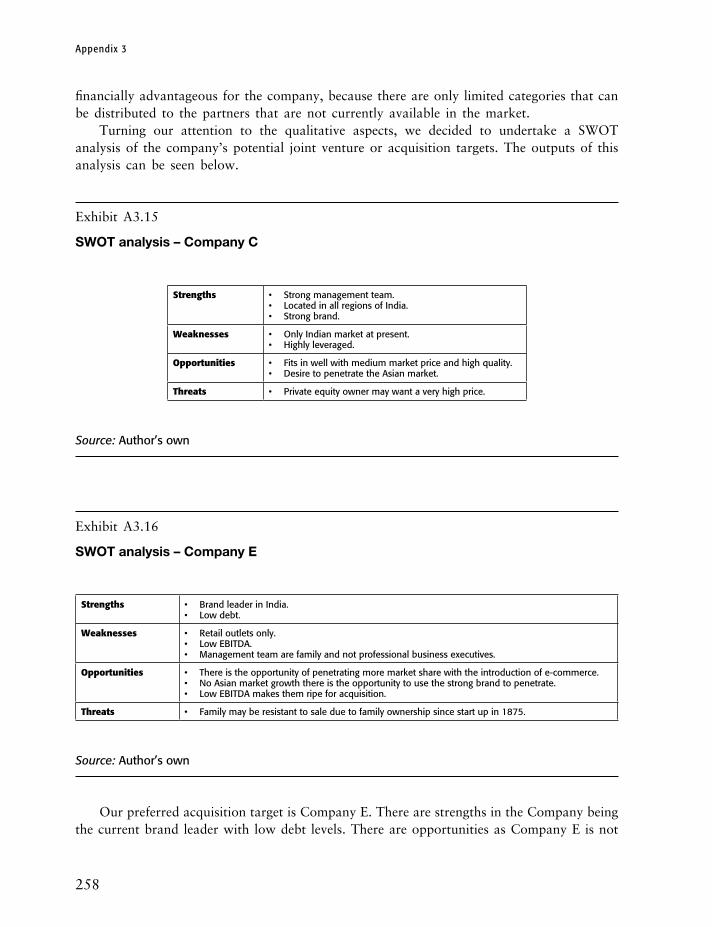
258
Appendix 3
financially advantageous for the company, because there are only limited categories that can be distributed to the partners that are not currently available in the market.
Turning our attention to the qualitative aspects, we decided to undertake a SWOT analysis of the company’s potential joint venture or acquisition targets. The outputs of this analysis can be seen below.
Exhibit A3.15
SWOT analysis – Company C
Strengths • Strong management team.• Located in all regions of India.• Strong brand.
weaknesses • Only Indian market at present.• Highly leveraged.
Opportunities • Fits in well with medium market price and high quality.• Desire to penetrate the Asian market.
Threats • Private equity owner may want a very high price.
Source: Author’s own
Exhibit A3.16
SWOT analysis – Company E
Strengths • Brand leader in India.• Low debt.
weaknesses • Retail outlets only.• Low EBITDA.• Management team are family and not professional business executives.
Opportunities • There is the opportunity of penetrating more market share with the introduction of e-commerce.• No Asian market growth there is the opportunity to use the strong brand to penetrate.• Low EBITDA makes them ripe for acquisition.
Threats • Family may be resistant to sale due to family ownership since start up in 1875.
Source: Author’s own
Our preferred acquisition target is Company E. There are strengths in the Company being the current brand leader with low debt levels. There are opportunities as Company E is not

259
Appendix 3
currently using the e-commerce distribution channel. There is currently a low EBITDA which gives the acquirer the opportunity to improve this by restructuring and cost improvement plans. There is the opportunity to roll the brand out to the rest of the Asian market. It is important to note that the family may be reluctant to accept any offer for sale. It is recom-mended that an offer subject to further due diligence is made to the owners of Company E Limited at US$30 billion. It is important to start planning in parallel the organic growth of the shoe retail rollout into the Indian market as there is a high chance that any offer may be rejected. So the company should start to think about locating and preparing premises, opening retail outlets, establishing a brand, recruiting staff, preparing the business plan and consider how it will finance organic growth into the targeted market.
260
Glossary
Acid test This is a ratio that is often used in corporate finance that expresses current assets less stock or inventory divided by current liabilities. This represents a liquid ratio or quick ratio which assumes that stock takes a while to convert to debtors and then cash and is, therefore, the most illiquid of working capital items.
Admission The admission of the shares to the Premium Listing segment of the Official List and to trading on the stock exchange’s main market for listed securities.
ADSCR Annual DSCR. (See DSCR.)Annual report A report regarding the company’s performance over the last year which is
made available to the company’s shareholders.Acquisition The purchase of one company by another for a certain consideration package.
This consideration package can be made up of cash, shares and debt according to how the parties see fit. The acquirer obviously has a controlling interest over the target company.
Back to back loans This a long-term currency hedging mechanism under which the parties lend to each other matching sums in different currencies on matching terms.
BAFO Best and final offer (bid terminology). Shortlisted bidders refine their invitation to negotiate (ITN) bid submissions.
Balance sheet A financial statement that shows the financial position of a company at a point in time, that is, its assets, liabilities and its net worth.
Basis point This relates to interest rates from lenders, a basis point represents one hundredth part of one percent.
Beta This is the market risk premium that is added to the company’s cost of equity using the linear relationship that is assumed by the capital asset pricing model (CAPM).
Bid costs The upfront costs borne by the process of bidding for business or a contract.Board The board of directors of the company.Bond This is long-term source of financing used for a piece of negotiable money market
paper having a maturity of five years or more.Bullet A source of debt that has a maturity date for the repayment of the principal made
at one defined date in the future.Business plan This is the document that is prepared by the management of the company
perhaps with the support of its business advisors outlining its historic and future perfor-mance. It will detail the company’s history, its competitive position relative to the market, its financial forecasts. It will outline its strategy thus defining its key performance indi-cators that will be used as targets. It should be rolled out to the organisation and used to measure actual performance.
Buy-in management buyout A leveraged buyout, which includes the new management and the organisation’s existing management.
Buyout drivers There are three main drivers underpinning buyout returns; EBITDA, leverage and earnings multiples.
BVCA British Venture Capital Association.
Glossary
261
CAGR This stands for compound annual growth rate. This is the annual average over a period of a year’s business growth.
CAPM The capital asset pricing model measures the relationship between risk and return for a company’s shares. The risk free rate of return is usually the government bond rate. It is essentially a linear relationship that looks at the risk free rate of return plus a premium for risk represented for a beta based upon the shareholders’ expected rate of return.
Capital investment An investment in long-term assets which usually have a life of more than a year, that is, plant and equipment, land and buildings.
Cash flow Cash flow is a very important area of corporate finance as it is effectively a lifeline for business as the cash flow has a major bearing upon the ability to pay and stay liquid and even solvent.
Chinese walls This is a name given to a process adopted in a bank or by a financial advisor that ensures that confidentiality is maintained between the different teams in the same organisation.
Committed capital The total amount of capital currently committed to a fund by all investors.
Commitment fee This is a lender’s fee that is based upon a percentage of the undrawn and committed facility amount.
Convertible A bond, debenture or loan stock which has an option for the lender to exchange it for some other type of alternative investment.
Convertible debt This is where a debt is issued at a variable rate of interest but carries an option to allow conversion to a predetermined fixed rate of interest.
Covenant Lender’s contractual requirements that need to be followed by the borrower. These represent financial ratio levels and perhaps certain cash holdings.
DBFO Design, build, finance and operate: a contract whereby one company undertakes a contract to perform these things for the length of the concession, often 25 or 30 years.
Debt capacity This represents the total amount of debt that a company is able to borrow.Debt service This is the amount of debt interest and the principal repayments.Debt service cover ratio (DSCR) The ratio of cash available for debt service to the actual
debt service.Debt service reserve account The cash required to be held to service future senior lenders’
debt service obligations.Debt to equity ratio This is the amount of long-term debt expressed to the total debt and
equity for a company.Design and build contract A contract where a supplier is responsible for designing and
constructing an asset.Development capital This is when a private equity company invests in a mature business.Diluted earnings per share This is usually a comparative calculation that is made when
other types of instrument can be converted to ordinary shares.Directors The executive directors and the non-executive directors of a company.Discount rate The interest rate used in calculating the net present value (NPV) of expected
future cash flows.Distribution The payment made by a fund to an investor after exiting the investment.
262
Glossary
Divestment This is the opposite of investment. It represents the action of disposing of a company’s asset through sale.
Dividend policy This is where a company considers how much of its profits to distribute to its shareholders in the form of a dividend. It is important to note that the dividend stream has a bearing upon the future valuation of a company’s shares and there may be the mutually exclusive action of retaining the funds and investing in internal business projects that may in turn increase the company’s future earnings and indeed share price.
Drawn down capital The total amount of committed capital which has been actually drawn down from its investors.
Due diligence This is an independent evaluation of a target company on behalf of its potential investors. The scope of such an evaluation includes the appraisal of the busi-ness plan, material financial information and opinions.
Early stage This represents the seed investments and first round of funding for a company.Earnings per share A company’s earnings per share is the profit after tax divided by the
number of ordinary shares in issue.EBITDA This stands for earnings before interest tax depreciation and amortisation. It is a
fairly popular measure in corporate finance as it is the starting point for calculating certain cash flow numbers.
Enterprise value Enterprise value is a valuation measure that reflects the market value of the whole business. Enterprise value is normally valued at market values. Enterprise value can be defined as:
Ordinary shares (equity) at market value Add debt at market value Add preferences shares at market value Less cash.
Equity Equity represents the sum of capital provided to a company by its shareholders plus the retained profits per the company’s balance sheet.
EVCA European Venture Capital Association.Existing share offer size The number of existing shares to be sold pursuant to the offer,
to be set out in the pricing statement.Exit The method by which the shareholders in a portfolio company sell part or all of their
holding. There are numerous methods of exit which are available such as initial public offering, sale to a corporate, secondary leveraged buyouts and recapitalisations.
FCA The Financial Conduct Authority.Financial close The point at which all contracts are signed by all parties involved in a project.Free cash flow Free cash flow is a company’s EBITDA plus working capital movement
adding back depreciation and amortisation and deducting tax and capital expenditure. It is effectively the cash flow before financing.
Fund A private equity fund is an investment vehicle which has been created to raise capital from investors which in turn invest in portfolio companies.
Fundraising This is a process by which the general partner raises funding to create a private
Glossary
263
equity fund. The funds are raised from pensions, companies which become investors or limited partners.
Funding requirement The amount of long-term funding in terms of debt or equity required for the construction phase.
Fund size The total of all funding committed by investors. Future value This represents the value of an investment at a future date based upon a
certain interest rate and the amount invested periodically.
GAAP Generally Accepted Accounting Principles.Gearing This is a measure of the degree of long-term debt to a company’s net assets. It is
used as a potential risk indicator for both shareholders and lenders.General partner A group of partners together with their staff who manage a fund. This
is likely to be a limited liability partnership. Goodwill This represents the amount of value attributed to a business for its brand, employees
and clientele which has built up over time. It also relates to the excess of the purchase price of a business over the net assets of the target company.
Growth capital Funding provided to companies in established markets that need funding to grow.
Hockey stick This is an alternative name given for the typical J curve growth that is seen in private equity forecasts.
IAS International Accounting Standards, for reporting of accounts to enable common stan-dards between countries. The European Union requires all companies listed on a stock exchange in an EU country to comply with IAS.
IFRS International Finance Reporting Standards.Interest cover This is a ratio typically used by lenders for credit analysis purposes. It is a
profit rather than a cash-based ratio that uses the company’s operating profit and divides it by interest payable for the period.
Interest rate floor This represents the interest rate where a payment is made in order to protect against a fall of the interest rate to a minimum level.
Interest rate risk This represents the volatility in interest rates which can be managed through various interest rate risk management mechanisms.
Interest rate swap An interest rate hedging instrument that makes an agreement to swap an interest rate to another fixed or variable rate at a certain date in time.
Interim dividend A dividend that is usually declared and paid half way through a year.Interest cover A measure of the capacity of a corporate to meet its interest obligations.
This is normally expressed by dividing the profit before interest and tax by the interest charge in the profit and loss account.
Interest during construction The amount of interest accrued on funding the construction phase.
Investment capital The total amount of drawn down capital which has actually been invested in companies.
Institutional offer The offer of shares to certain institutional and other investors.
264
Glossary
IPO This is an initial public offering or the first time that a private company has issued shares to the general public. Of course, such shares will be issued on the stock exchange.
IRR This relates to a discounted cash flow technique which finds the discount rate where the net present value equals zero, thus the name: internal rate of return. The IRR is a result that arises from a series of cash flows which can be compared with the weighted average cost of capital (WACC), that is, where the IRR is greater than the WACC then accept as the NPV is likely to add to the company’s valuation.
ISOP Invitation to submit outline proposal (bid terminology).ITN Invitation to negotiate (bid terminology). Discussions and negotiations with co-sponsors,
contractors, banks and advisors to prepare a cohesive and deliverable technical, commer-cial and financing solution.
J curve This is the shape of all private equity funds over time. When the cash flows are plotted on a graph over time on a cumulative basis shows a J shape. This is the nega-tives in early years as the funds are drawn down and the positives as the distributions are made.
KPIs Key performance indicators (performance measures) are objectives which have measur-ability and time scale.
KYI Know your client is a term that relates to the need for a financial advisor to know details of their client’s attitude to risk and return, knowledge and financial standing.
lABV Local asset backed vehicle is a vehicle for managing and investing in public sector property. There are various models depending upon individual requirements, but the essential element of the LABV is the transfer of the public sector property and unused or underused sites to a partnership without relinquishing ownership or control.
lAFO Last and final offer (bid terminology).leverage This is terminology describing the effect of debt on the company or corporate
finance transaction. leveraged buyout (lBO) The acquisition of a company by an investor at a high percentage
debt to equity ratio. This is typically at least 70%. limited partnership This is the legal structure typically used by most private equity vehicles. lIBID An acronym which represents an interest rate which stands for London Inter Bank
Bid Rate. This is the interest rate at which banks bid for funds in the euro market.lIBOR An acronym which represents an interest rate which stands for London Inter Bank
Offer Rate. This is the interest rate at which banks will lend funds to each other at different maturities.
liquidity A measure of a company’s holding of cash or cash equivalents. llCR Loan life cover ratio, the ratio of the NPV of cash available for debt service during
the term of the senior debt to the outstanding balance of the senior debt.
Main market The stock exchange’s main market for listed securities.Maintenance reserve account The cash required to be held to service future life cycle
obligations.
Glossary
265
Merger A business combination of two companies bringing together operations on certain financing terms, that is, share exchanges, debt or cash financing.
Mezzanine debt Sometimes referred to as junior debt. This is a form of debt which has a claim on the assets of a company and ranks for payment only after the senior debt has been paid.
Management buy-in This is when an existing company is acquired by a new management team.
Management buyout This is when a management team acquires the company that they were originally employed by.
Mezzanine debt This is convertible debt which ranks between equity and senior debt in a financial structure for a private equity transaction.
Monitoring This is when the performance of the portfolio company is measured by the private equity company. This would include a member of the private equity investor on the board, regular reporting and meetings.
Multiple This is the basis of valuation for a private equity company.
Net present value (NPV) The discounted value of a series of future costs, benefits or payments, that is, the value of future cash flows in today’s money.
New share offer size The number of new shares to be issued pursuant to the offer, to be set out in the pricing statement for an IPO.
Offering memorandum This is a document issued by a party which has the objective of raising capital from investors.
Offer price The price at which each share is to be issued or sold under the offer.OJEu (Official Journal of the European union) Publication in which new government
projects are announced.Ordinary shares Ordinary shares are effectively shareholders who have voting rights and
are entitled to a dividend in the company. These non-preference shares can either be in private companies or public limited companies.
Over-allotment option The option granted to the stabilising manager by the selling share-holder to purchase, or procure purchasers for additional shares in the case of an IPO (representing up to 15% of the total number of shares that are subject to the offer).
Payback The amount of time it takes to recover the initial capital investment. This can be applied to a portfolio company or a private equity fund as a whole.
Payout ratio This is a ratio that expresses the amount of dividend as a percentage of the profit after interest and tax.
PE ratio The PE ratio or earnings multiple, is the latest closing share price divided by the earnings per share.
PITN Preliminary ITN. (See ITN.)Portfolio company A private limited company in which a fund invests. Pqq Pre-qualification questionnaire – initial qualification round for permission to bid for
the contract (bid terminology). A consortium provides the client with an overview of the sponsors’ and contractors’ experience and contact details.

266
Glossary
Preferred bidder A bidder selected from the shortlist to carry out exclusive negotiations with the buyer.
Private equity This is the investment of funds in a private limited company by an invest-ment company. The private equity company assists with the company’s growth and has a planned exit date.
Private Finance Initiative (PFI) A policy introduced by the UK Government in 1992 to harness private sector management and expertise in the delivery of public services, while reducing the impact on public borrowing for providing these services.
Prospectus The final prospectus approved by the FCA is prepared in accordance with the Prospectus Rules. A document that provides detailed information regarding the company which is used for share and debt issues.
Recapitalisation This is where a company has generated more cash than originally planned. Equity is repaid and additional debt is raised.
Refinancing A refinancing is when old debt is replaced with debt that has more favourable terms, that is, interest rates, repayment terms, and so on.
Revolving credit facility A type of bank credit whereby the borrower can draw and repay within certain predefined limits.
Rights issues A rights issue is a capital raising exercise that involves selling new shares to the company’s existing shareholders. The shares are usually offered in proportion to its existing shareholding percentage.
Risk transfer The passing of risk under contract from one party to another.
Sale and lease back A legal arrangement whereby a corporation agrees to sell an asset to a financial institution and lease it back at agreed terms. It is simply a mechanism of releasing cash flow in order to finance the business and keeping ownership of the asset.
Scrip dividend This is a bonus issue of shares issued to existing shareholders in lieu of a dividend payment.
Secured debt This is debt which is backed with or secured by collateral or assets in order to reduce lending risk. An example in the corporate finance sphere is where a property company uses its existing properties market value for security against potential loan default.
Seed investing This is the preliminary funding used to develop the product or service concept and often used to undertake market research, write a business plan and study feasibility.
Senior debt The major funding component (typically 90% of the funds required for construc-tion, and so on) provided by banks or bonds. It has priority of repayment over other funding sources.
Sensitivity The flexing of key assumptions and evaluating the effect upon key output measures.
Shareholder value The value provided to shareholders in respect of dividend growth, earn-ings and the share price growth.
Special purpose company (SPC) or vehicle (SPV) A company especially established to carry out the contract or business, owned by its shareholders, the providers of equity finance for the scheme.
Glossary
267
Spread This is the amount of interest which is expressed in percentage or basis points terms, over the marker rate which a borrower pays on a variable rate debt facility.
Subordinated debt (or sub-debt) This can be a form of debt that has lower priority for repayment than the senior debt – alternatively called junior debt. (NB: junior debt is not the same as loan stock, but loan stock may be called subordinated debt.)
Swap – interest rate This is an arrangement whereby a company having a liability which carries a fixed rate of interest exchanges it for a variable rate liability for another company.
Systematic risk This is the market risk of a share or investment that cannot be diversified away.
Term sheet A legal agreement that is signed by parties to the borrowing facility setting out the terms of interest, fees repayment periods and so on.
Terminal value A terminal value approach is the present value based upon a point in time of all future cash flows at a growth rate into the future. There are two main methods of the terminal value calculations, that is, EBITDA multiple approach and the perpetuity growth approach.
Treasury bill A short-term government security issued with a maturity not exceeding one year and is considered to represent the market’s risk free rate of return as a government is unlikely not to pay.
Turnaround The buyout of a company which is struggling and possibly even loss making and has a distressed debt position.
uK GAAP The overall body of regulation establishing how company accounts must be prepared in the UK. This includes not only accounting standards, but also UK company law.
underwriting agreement The underwriting agreement entered into between the company, the directors, the selling shareholder and the banks.
uninvested capital This is capital which is available for investment but has not yet been utilised.
unitary payment (monthly fee) The periodic payment, usually monthly, that the public sector agrees to pay for the provision of services by the concession holder (SPC).
upper quartile This is typically used as a measure of vintage year returns in the private equity industry. The upper quartile return sits at a quarter from the top of the highest ranked returns.
Venture capital This is an investor that provides equity capital to start-ups and seed busi-nesses and normally exits at a planned year often by the IPO route.
Vintage year This is the year in which a fund was formed. This is useful for comparison and benchmarking performance.
Vintage year returns This is a return statistic for all the funds formed in a certain vintage year and the returns to date.
wACC The weighted average cost of capital is a method of calculating the required rate of

268
Glossary
return based upon a company’s capital structure and the cost of capital for both debt and equity is weighted in order to find a discount rate for capital investment purposes.
working capital Working capital refers to flow from current assets and current liabilities into cash flow. Stock, debtors and creditors will all be turned into cash flow items during the trading cycle, however, the credit timing attached to each usually varies.
write down This is the need to reduce the stated valuation of a portfolio company. For private equity certain guidelines are mandatory.
write up This is the need to increase the stated valuation of a portfolio company. Under private equity certain guidelines are mandatory.
Yield curve This is the relationship between interest rates and the maturity for funds borrowed or deposited.
Z scores This is concept that was developed by Professor Altman. It is a technique for predicting a potential company failure by using a selection of financial ratios based upon freely available and published statutory accounting information.


Related titles from Euromoney Books
Corporate Finance Modelling and Analysis: A Practical Guide David Whittaker Publication date: December 2011
This book is a practical guide for those wishing to gain further skills and knowledge in the area of financial modelling and analysis for corporate finance transactions and corporate financial decisions. This is a complete corporate finance modelling and analysis reference guide that will really enhance and supplement your financial modelling and analysis skills and add value to corporate decisions at different stages of the corporation’s life cycle. This book covers financial modelling and analysis for acquisitions, mergers, initial public offerings, rights issues, disposals, refinancing, capital structures, dividend policies, working capital management, project finance as a source of funding, private equity as a source of funding. It also includes advice on modelling different debt structures, capital investment appraisals, supplier and partner evaluations, business plans, sale and lease back, lease versus purchase and financial failure and liquidation. It also includes financial modelling best practice, financial model audits and reviews, project management and the use of generic and template financial models, the use of different Excel functions for corporate finance calculations, the use of Excel VBA and the use of Excel risk analysis techniques.
ISBN: 978 1 84374 910 3
Price: £270/$450/3350
Private Equity Financial Modelling and Analysis: A Practical GuideDavid Whittaker Publication date: February 2013
This is a practical guide for those who need to enhance their financial modelling and analysis skills and knowledge in order to add value to private equity backed companies prior to, through the investment period and exit. Using numerous practical examples of Excel financial model extracts and VBA/macro code, the reader will complete financial modelling and analysis exercises that will lead up to the completion of numerous financial modellings and analyses. This practical guide provides an excellent source for self-study which cannot be obtained from training courses and on the job experience alone thus making this book fantastic value for money. The book covers:
Planning, controlling and analysing the fund. Preparing a compelling business plan. Pre investment modelling and analysis.

Leveraged buyouts. Post investment financial and performance management. Distressed debt and the restructuring of LBOs. Maximising value through exit. Excel VBA. Review and audit. Sensitivity analysis.
ISBN: 978 1 78137 092 6
Price: £270/$450/3350
International Corporate GovernanceJoseph C F Lufkin Publication date: January 2004
Compliance issues for corporates and investors have become more complex in an increasingly regulated environment. This book for corporates, investors and their advisers, explores the benefits and costs of key new legislation, new techniques for assessing and tracking corporate performance and the shifts occurring in corporate governance regimes around the world. The book has contributions from leading practitioners, academics, lawyers, bankers, ratings agencies, institutional investors, asset managers and consultants from across the globe. Compliance issues for corporates and investors have become more complex in an increasingly regulated environment where the stakes have been raised considerably. This book considers corporate governance issues facing issuers and investors in the US, Europe, Japan and China, including:
What are the financial and economic impacts of different corporate governance approaches? How should corporates and investors react to corporate governance scandals to best protect their key investments?
What steps should institutional investors take to affect the governance in their key investments? How has Sarbanes-Oxley raised the cost for US companies? What are the issues flowing from the increasing imposition of Anglo–US corporate governance across the globe?
How comprehensive is the EU Action Plan for corporate governance? How are new techniques, from governance ratings to internet message boards affecting governance and shareholder value?
ISBN: 978 1 84374 054 4
Price: £175/$327/3254

Cross-Border Debt Restructurings: Innovative Approaches for Creditors, Corporates and SovereignsEsteban C BuljevichPublication date: July 2005
Workouts are increasingly becoming a global reality and this book brings together 23 senior specialists from across the globe to provide a comprehensive discussion of out-of-court debt restructurings. The unique cohesion of legal, business, financial and accounting experience brought together in this book provides the international workout practitioner with the tools to achieve a comprehensive understanding of the workout process.
Part 1 deals with the basics of debt restructurings and is intended to provide in-depth material (a manual) on the A to Z of workouts for both beginners and well-seasoned practitioners.
Part 2 deals with special topics on restructurings. Part 3 describes the East Asian and Argentine crises experiences and also presents four workout case studies in Central Europe, Latin America, Eastern Europe and East Asia to provide practical examples of the application of all concepts dealt with in the book in actual or theoretical transactions.
ISBN: 978 1 84374 194 7
Price: £175/$327/3254
All of our titles are also available as ebooks – see www.euromoneybooks.com for more details.
How to order: Online: www.euromoneybooks.comEmail: [email protected]: +44 207 779 8999Please quote code 6699 when ordering