the strategist’s curse: a theory of false optimism as a
TRANSCRIPT

1
The Strategist’s Curse:
A Theory of False Optimism as a Cause of War
Daniel Altman
PhD Candidate
Department of Political Science
Massachusetts Institute of Technology
Email: [email protected]
Forthcoming in Security Studies
May 27, 2014
ACKNOWLEDGEMENTS
I would like to thank Ivan Arreguín-Toft, Nathan Black, Nils Hagerdal, Phil Haun, Joyce
Lawrence, Nicholas Miller, Eric Min, Vipin Narang, Ken Oye, Barry Posen, Kai Quek, Molly
Roberts, Jacob Shapiro, Brandon Stewart, Monica Toft, Stephen Van Evera, the anonymous
reviewers, and the editor for their comments and insights. Special thanks to Chad Hazlett and
Jeffrey Friedman. I gratefully acknowledge support from the Stanton Foundation, the Center for
International Security and Cooperation at Stanford University, and the MIT Political Science
Department. All errors are my own.

2
Abstract
This article proposes a new theory of false optimism as a cause of war. Named for its
similarity to the winner’s curse in auctions, this theory explains how and why established
sources misperception (cognitive, psychological, bureaucratic, and organizational)
interact with the selection of one military strategy from a set of alternatives to produce a
surprising amount of additional false optimism. Even if a state’s general perceptions of
how well it will fare in a potential war are not biased towards optimism, this theory
explains why its perceptions of the particular strategy on which it will base its plans for
fighting that war will be systematically biased towards optimism. Simulations and formal
modeling confirm the logic of the theory and suggest that the strategist’s curse can
sharply increase the probability of war due to false optimism.
False optimism has long been thought to rank among the most important causes of war.1
At least one side, and all too often both, commonly expects to fare better from war than it
1 Geoffrey Blainey, The Causes of War (New York: The Free Press, 1988); Robert Jervis,
Perception and Misperception in International Politics (Princeton: Princeton University Press,
1976); Robert Jervis, “War and Misperception,” The Journal of Interdisciplinary History 18
(Spring 1988): 675-700; Dominic D. P. Johnson, Overconfidence and War: the Havoc and Glory
of Positive Illusions (Cambridge: Harvard University Press, 2004); Jack S. Levy, “Misperception
and the Causes of War: Theoretical Linkages and Analytical Problems,” World Politics 36
(October 1983): 76-99; John G. Stoessinger, Why Nations Go to War (New York: St. Martin’s
Press, 1974); Stephen Van Evera, Causes of War: Power and the Roots of Conflict (Ithaca:

3
actually does. Remarking on the puzzling fact that so many states have chosen to start wars only
to then lose them, Geoffrey Blainey famously concluded, “The start of war is – almost by the
definition of war itself – marked by conflicting expectations of what that war will be like…
Whatever causes that contradictory optimism must be classified as a cause of war.”2 If the two
sides could foresee the outcome of a war accurately, why would they not agree to something like
it without enduring the costs of fighting?3 In the tradition of trying to understand the causes of
war by investigating the sources of false optimism, this article proposes a new theory of false
optimism as a cause of war.
Suppose that policymakers perceive the results of going to war with an element of error.
Sometimes they are falsely optimistic, but equally often they are falsely pessimistic. Even
though the perceptions are accurate on average, levels of optimism sufficient to cause war occur
some of the time. Under this condition alone, simply choosing to be more pessimistic would
reduce the accuracy of perceptions, on average. Now suppose also that policymakers choose not
just between war and peace, but also among several potential strategies with which a war could
be fought. This paper shows why the addition of this second, seemingly innocuous condition –
selection among multiple possible military strategies – interacts with the first in a subtle but
powerful way to produce a systematic bias towards false optimism that would not otherwise
Cornell University Press, 1999); Ralph K. White, Nobody Wanted War: Misperception in
Vietnam and Other Wars (Garden City: Anchor Books, 1970).
2 Blainey, The Causes of War, 56.
3 James D. Fearon, “Rationalist Explanations for War,” International Organization 49 (Summer
1995): 379-414.
4
exist. When policymakers consider multiple war strategies as part of deciding between war and
peace, simply being more pessimistic about how well a war would go by an optimal amount can
increase the accuracy of these perceptions, on average. This is true even if underlying
perceptions have no bias towards optimism.
This “strategist’s curse” draws its name from its close relation to the winner’s curse in
auctions and has been identified as a source of false optimism in the field of management.4 The
winner’s curse exists in auctions in which each bidder has only their own imperfect estimate of
the worth of the prize. In this situation, the bidder who happens to most exaggerate the prize’s
value will tend to bid the most, to win the prize, and to regret it afterward. This process, it turns
out, is not so different from strategy selection.
When policymakers pick from multiple way of fighting a potential war, they will
generally be optimistic about some strategies and pessimistic about others. But what happens
next? The underestimated strategies tend to fall out of consideration. Plans and decisions are
based on the “best” available strategy, which is disproportionately likely to be a strategy whose
effectiveness has been exaggerated. It is certainly reasonable to base expectations for a war on
perceptions of what appears to be the most effective strategy, but it is important to ask why that
strategy looks so promising. A strategy is more likely to appear to be the best available because
1) its effectiveness is greater than the alternatives or because 2) its effectiveness has been
4 J. Richard Harrison and James G. March, “Decision Making and Postdecision Surprises,”
Administrative Science Quarterly 29 (March 1984): 26-42; James E Smith and Robert L.
Winkler, “The Optimizer’s Curse: Skepticism and Postdecision Surprise in Decision Analysis.”
Management Science 52 (March 2006): 311-322; Eric Van den Steen, “Rational Overoptimism
(and Other Biases),” American Economic Review 94 (September 2004): 1141-1151.
5
exaggerated more than the alternatives. This second possibility is the linchpin of the strategist’s
curse. It implies that the more a policymaker is falsely optimistic about a strategy, the more
likely that strategy is to be selected. When picking from several strategies, the odds are that at
least one will have its effectiveness exaggerated. As a result, policymaker perceptions need not
be biased towards optimism in general for their perceptions of how well a war would go using
the “best” available strategy to be systematically biased toward optimism.
Due to the strategist’s curse, the number of available strategies emerges as a potent cause
of false optimism and war. All else equal, war is more likely when more strategies are available
because additional strategies increase the chances that at least one strategy will have its
effectiveness exaggerated enough make war with that strategy appear preferable to peace. This
variable has not previously been identified in the literature on misperception and war.
The purpose of this article is to fully develop and explain the strategist’s curse as a theory
of war due to false optimism. Central claims are illustrated with Monte Carlo simulations, but
the priority is presenting the theory in the clearest manner possible. The corresponding formal
model is also provided in the appendix. The formal model and the simulations yield identical
results without relying on each other.5
I begin by reviewing the field’s current understanding of false optimism as a cause of war
and the nature of the winner’s curse in auctions. I then walk through the core logic of the
strategist’s curse and summarize the procedure used in the simulations. Next, I explicitly define
the variables that collectively cause the strategist’s curse, and provide results showing how each
contributes to the level of false optimism and the probability of war. Subsequently, I discuss
5 Replication code will be made available online by the author, including supplementary files for
each “results not shown” claim in the text.

6
what may be the most constraining limitation on the strategist’s curse as a cause of war: the
assumptions about strategy selection among multiple peaceful policy options. I then review two
plausible historical examples of the strategist’s curse: Japan’s decision to attack the United States
in 1941 and the decision of the United States to invade Iraq in 2003. I conclude by underscoring
the central lesson: even if perceptions are, in general, no more prone to optimism than
pessimism, perceptions of the strategy upon which states are basing the decision between war
and peace are likely to be systematically biased towards false optimism.
The Base Rate of War Due to False Optimism
In order to explain the strategist’s curse, it is useful to begin with the standard theory of
war due to false optimism, which I refer to as the “base rate.” The level of false optimism is the
extent to which a state’s perception of how well it will fare in a war exceeds the reality. The
theory of war underlying the base rate is simple: every so often the traditional sources of
misperception combine to produce enough false optimism that the two sides cannot find any war-
avoiding agreement from which both expect to fare better than they would from war.
These traditional sources are the extensive array of biases that afflict strategic
assessments: cognitive, psychological, organizational, bureaucratic, etc. The literature on
psychological and cognitive sources of misperception is extensive.6 For instance, policymakers
6 E.g., Jervis, Perception and Misperception in International Politics; Robert Jervis, Richard Ned
Lebow, Janice Gross Stein, Psychology and Deterrence (Baltimore: The Johns Hopkins
University Press, 1985); Rose McDermott, Political Psychology in International Relations (Ann
Arbor: The University of Michigan Press, 2004); Dominic D. P. Johnson and Dominic Tierney,

7
may repeat the mistakes of past wars by failing to learn from history, or they may over-learn
from history and falsely assume the strategy which worked best then remains equally effective
despite changed circumstances.7 The concept of bounded rationality encapsulates many
individual cognitive limitations on human reasoning that may lead to misperceptions, especially
for complex decisions.8 Similarly, the organizations that analyze foreign policy options can
contribute to misperception. Military autonomy in war planning can lead to the neglect of
critical political repercussions of an otherwise well-conceived war plan.9 Service branches
within militaries may exaggerate the effectiveness of strategies which justify their budget
relative, just as they may mislead policy-makers into devaluing the effectiveness of strategies
“The Rubicon Theory of War: How the Path to Conflict Reaches the Point of No Return,”
International Security 36 (Summer 2011): 7-40.
7 Jervis, “War and Misperception”; Yuen Foong Khong, Analogies at War: Korea, Munich, Dien
Bien Phu, and the Vietnam Decisions of 1965 (Princeton: Princeton University Press, 1992).
8 Jerel A. Rosati, “The Power of Human Cognition in the Study of World Politics,” International
Studies Review 2 (Autumn 2000): 45-75; Herbert A. Simon, “Human Nature in Politics: The
Dialogue of Psychology with Political Science,” The American Political Science Review 79
(June 1985): 293-304; Glenn H. Snyder and Paul Diesing, Conflict among Nations: Bargaining,
Decision-Making, and System Structure in International Crises (Princeton: Princeton University
Press, 1977): 340-418.
9 Barry R. Posen, The Sources of Military Doctrine: France, Britain, and Germany between the
World Wars (Ithaca: Cornell University Press, 1984): 58; Jack S. Levy, “Organizational Routines
and the Causes of War,” International Studies Quarterly 30 (June 1986): 208.

8
which benefit rival services.10
The traditional sources of misperception are not limited to these
categories. Brooks (2008) explains how civil-military relations can exacerbate misperception,
and Snyder (1984) finds an ideological preference for offensive strategies rooted in part in the
historic prestige from rapid offensive victories.11
The base rate of war due to false optimism is
the frequency with which these traditional sources of misperception combine to produce
sufficient false optimism to start a war.
Two types of misperception are thought to be most prone to causing wars: false optimism
about the prospects for victory and false pessimism about other states’ intentions.12
This article
deals with the first of these, and explains how selecting from multiple possible military strategies
exacerbates it.13
The Winner’s Curse
10
Morton H. Halperin and Priscilla Clapp, Bureaucratic Politics and Foreign Policy
(Washington, D.C.: Brookings Institution Press, 2006); Graham Allison and Philip Zelikow,
Essence of Decision: Explaining the Cuban Missile Crisis (New York: Longman, 1999).
11 Risa A. Brooks, Shaping Strategy: The Civil-Military Politics of Strategic Assessment
(Princeton: Princeton University Press 2008); Jack Snyder, The Ideology of the Offensive.
Military Decision Making and the Disasters of 1914 (Ithaca: Cornell University Press 1984).
12 Levy, “Misperception and the Causes of War,” 99; Jervis, “War and Misperception,” 676.
13 The strategist’s curse is, however, consistent with both false optimism due to uncertainty and
false optimism due to false certainty. See Jennifer Mitzen and Randall Schweller, “Knowing the
Unknown Unknowns: Misplaced Certainty and the Onset of War,” Security Studies 20 (January
2011): 2-35.
9
The strategist’s curse is so named because of its close similarity to the winner’s curse in
auctions. The winner’s curse applies most strongly to common-value auctions in which multiple
bidders compete for a prize that is worth the same amount to each. The bidders each have their
own (imperfect) estimate of the worth of the prize. If each bids based on their best estimate of
the prize’s value, the winner will be the one who most exaggerates its worth. The
disappointment these winners will experience gives rise to the name “winner’s curse.”14
The classic example is a scenario in which oil companies bid for mineral rights to a piece
of land. Experts from each company take samples, but depending on the luck of where exactly
these samples are taken, some companies will receive overestimates and others will receive
underestimates. If these valuations are taken at face value, the company with the most false
optimism about the amount of oil will win the bid, and regret it afterward.15
The winner’s curse has been the subject of controversy and interest in economics for the
last forty years. Much of this debate arises because perfectly rational actors would not fall
victim to the winner’s curse. The value of the bid matters only if that bid wins. When a bid
14
John H. Kagel and Dan Levin, Common Value Auctions and the Winner’s Curse (Princeton:
Princeton University Press, 2002); Richard H. Thaler, The Winner’s Curse: Paradoxes and
Anomalies of Economic Life (New York: The Free Press, 1991).
15 E. C. Capen, R. V. Clapp, and W. M. Campbell, “Competitive Bidding in High-Risk
Situations,” Journal of Petroleum Technology (June 1971): 641-653.
10
wins, false optimism is likely present. Therefore, perfectly rational actors would downwardly
adjust their bids in equilibrium, compensating for the winner’s curse.16
Nonetheless, experimental economists have provided convincing empirical support for
the existence of the winner’s curse. Bazerman and Samuelson (1983) find that increasing the
number of bidders and the uncertainty as to the value of the prize exacerbates the winner’s
curse.17
Even experienced and informed bidders fall victim to the winner’s curse.18
Charness
and Levin (2009) conclude that the strongest explanation for the winner’s curse is bounded
rationality, specifically the difficulties many have with contingent reasoning.19
In part because
16
James C. Cox and R. Mark Isaac, “In Search of the Winner’s Curse,” Economic Inquiry 22
(October 1984): 579-592; James L. Smith, “Non-Aggressive Bidding Behavior and the
‘Winner’s Curse,’” Economic Inquiry 19 (July 1981): 380-388.
17 Max H. Bazerman and William F. Samuelson, “I Won the Auction but Don't Want the Prize,”
The Journal of Conflict Resolution 27 (December 1983): 618-634.
18 Colin M. Campbell, John H. Kagel, Dan Levin “The Winner's Curse and Public Information in
Common Value Auctions: Reply,” American Economic Review 89 (March 1999): 325-334; Peter
Foreman and J. Keith Murnigan, “Learning to Avoid the Winner’s Curse,” Organizational
Behavior and Human Decision Processes 67 (August 1996): 170-180; John H. Kagel and Dan
Levin, “The Winner’s Curse and Public Information in Common-Value Auctions.” American
Economic Review 76 (December 1986): 894-920; Barry Lind and Charles R. Plott, “The
Winner's Curse: Experiments with Buyers and with Sellers,” American Economic Review 81
(March 1991): 335-346.
19 Gary Charness and Dan Levin, “The Origin of the Winner’s Curse: A Laboratory Study,”
American Economic Journal: Microeconomics 1, No. 1 (2009): 207-236.

11
states may behave differently from individuals in lab experiments, evidence for the winner’s
curse does not easily translate into evidence for the strategist’s curse, but it does at least suggest
that the failure to intuitively grasp and compensate for this source of optimism may be pervasive.
This phenomenon is more general than bidding in auctions. In statistics, various
techniques address the problem that as the number of hypotheses tested increases, the probability
that at least one meets a level of significance due to chance also increases. If a researcher
focuses on this significant result as if that hypothesis alone had been tested, this researcher will
often attribute statistical significance to random error.20
The methodological problem of
regression to the mean offers another example of this larger phenomenon.21
Selecting one
extreme from a set of items with random error as part of their perceived values results in
systematic bias.
The Strategist’s Curse
This section provides an overview of the logic and effects of the strategist’s curse. Many
of the main points are illustrated graphically, in part with simulation results. I defer an
explanation of the simulation methods to the next section. Some readers may wish to refer to
that section as they read this one, while others should find the remainder of the article
comprehensible if they pass over it.
20
Yosef Hochberg and Ajit C. Tamhane, Multiple Comparison Procedures (New York: John
Wiley & Sons, 1987).
21 Donald T. Campbell and Julian C. Stanley, Experimental and Quasi-Experimental Designs for
Research (Chicago: Rand McNally, 1973): 10-12.

12
Figure 1 about here
Figure 1 helps to illustrate the logic of the strategist’s curse. Suppose, as in Figure 1, that
a state has to choose among four strategies that are actually equally effective. But, the traditional
sources of misperception create an element of error in this state’s perceptions of each of these
strategies, which can be modeled as a normal distribution centered on the true level of
effectiveness.22
The curve in Figure 1 indicates how common each possible perception will be.
The four dots represent the state’s perceptions of each strategy in one hypothetical instance. In
this instance, the state perceives two of its strategies fairly accurately, underestimates another,
and overestimates the fourth. Overall, the state is slightly pessimistic about the four strategies.
However, the state will not see it that way. Instead, the options will appear to consist of
one poor strategy, two moderately effective strategies, and one promising strategy. Naturally
enough, this state will pick the strategy with which it expects to fare best, and therefore this state
will select the strategy whose effectiveness it has most exaggerated. Just as the auctioneer
selects the highest bid, the strategist selects the strategy which appears best. The dotted line
shows the false optimism this induces. Even though false optimism was not more common than
22
The variance of this distribution represents the magnitude of the traditional sources of
misperception. The standard deviation in Figure 1 is .2. Using a normal distribution requires the
assumption that misperception from the traditional sources sometimes takes the form of false
optimism, sometimes false pessimism. This would seem to raise a problem. The literature on
the causes of war features numerous cases of false optimism about the prospects for victory, but
few corresponding cases of false pessimism. However, this disparity is to be expected. False
pessimism cases would tend to result in peace and, consequently, fade into obscurity.

13
false pessimism overall, this state will still be falsely optimistic about the strategy on which it
will base its plans. Selecting the strategy which appears best amounts to selecting on false
optimism.
Figure 2 about here
Figure 2 provides simulation results indicating that the example in Figure 1 is quite
general. It shows the distribution of perceptions for the strategy which appears best in
comparison to the underlying distribution for the state’s perceptions in general. The centered
curve represents the distribution of perceptions one would expect from the traditional sources of
misperception without taking the strategist’s curse into account (as in Figure 1), while the curve
to its right shows the distribution of perceptions created by the strategist’s curse. Figure 2
confirms that with four strategies available, perceptions of the strategy which appears best are
significantly more prone to false optimism than perceptions in general. The average amount of
false optimism created by the strategist’s curse corresponds approximately to the horizontal
distance between the peaks of the curves.23
These results verify that even if in general false optimism is no more common than false
pessimism, perceptions of the strategy which appears best are systematically biased towards
optimism. The right-side region between the two curves represents the extra false optimism
created by the strategist’s curse. The strategist’s curse redistributes this probability density from
the left-side region between the two curves, which falls almost entirely on the pessimism side of
23
I say “approximately” because the distribution for the strategy which appears best has a
rightward skew. Consequently, its mean is slightly greater than its mode (results not shown).

14
the true value. Most instances of false pessimism cease to exist and are replaced with additional
instances of false optimism. Of particular importance is the large proportion of high-level false
optimism generated by the strategist’s curse (the far right of Figure 2), because severe false
optimism is most prone to causing war.
When a state selects the strategy it sees as best, it tends to pick a strategy whose
effectiveness it has exaggerated. As I will examine further, this still occurs when some strategies
are more effective than others. The true best strategy is selected more often than alternative
strategies, but it tends to be selected when its effectiveness is exaggerated. When the
effectiveness of the true best strategy is underestimated, states are more likely to select an
inferior strategy, especially one whose effectiveness has been exaggerated. Nonetheless, the true
best strategy will be perceived accurately and selected in some cases. In others, the state will be
falsely pessimistic about the strategy it adopts. The strategist’s curse does not eliminate these
possibilities, but the central tendency is towards false optimism.
Figure 3 provides simulation results breaking down how well a state with four strategies
will expect to fare in war on average. The four perceptions, one per strategy, are ranked from the
one perceived as best (but not necessarily the actual best) to the one perceived as worst. Unlike
Figures 1 and 2, two of the four strategies now have a true effectiveness of .3, while the other
two remain at .5.
Figure 3 about here
The chart shows that the strategy which appears best is better on average than the
alternatives, but it has also generally been exaggerated more than the alternatives. The gap
15
between the two bars indicating perception and reality for the strategy which appears best is the
average level of false optimism. Figure 3 also suggests that the strategy which initially appears
best, although exaggerated, does have the greatest true effectiveness on average. This implies
that after states downwardly adjust their expectations, they should decide between war and peace
based on that revised estimate of the strategy which initially looked best.24
Although the traditional sources of misperception can suffice to cause war, they interact
with strategy selection to cause war more often. Figure 4 shows difference, illustrating the
strategist’s curse as a magnifying effect on the probability of war over the base rate. The base
rate (as discussed earlier) is the false optimism that would exist from the traditional sources of
misperception alone. It is calculated by neglecting the strategist’s curse and simply giving states
the singular option to go to war or not, with the same underlying distribution of misperceptions.
This is equivalent to only one war strategy being available. To be conservative, this strategy is
always assigned a true effectiveness equal to that of the best available war strategy (.5). Unless
there is no misperception at all, the probability of war due to false optimism is consistently
greater when the strategist’s curse is taken into account. Even towards the left end of Figure 4,
the strategist’s curse rate remains several times the base rate (results not shown).
Figure 4 about here
24
An important exception: it can be optimal to switch to another strategy if there is believed to
be less potential misperception of that strategy than for a set of multiple alternatives that includes
the strategy which appeared best initially. As I will discuss, the choice for peace over war can be
understood in these terms.

16
Although it has yet to be introduced to Political Science, the decision-making pathology
which I label the strategist’s curse has been recognized in the field of management science.
Building on Harrison and March’s (1984) model of “postdecision surprises,” Smith and Winkler
(2006) describe an “optimizer’s curse” that shares the same core logic.25
The strategist’s curse is
the extension of this theory of false optimism to a theory of war. It adapts the theory of false
optimism to better fit the context of International Relations, then builds on that foundation to
explore the extent to which this false optimism translates into war. As I discuss, this relationship
cannot be taken for granted. It requires an additional set of consequential assumptions and
modeling decisions. Even in the field of management, the optimizer’s curse (by whatever name)
has received surprisingly little attention.26
Given the complexity of the decision to go to war and
the strong historical pattern of false optimism on the eve of war, there are compelling reasons to
suspect that the strategist’s curse is particularly salient in the international context.
The Simulations
Like most of the results in this article, Figures 2-4 were generated using Monte Carlo
simulations. In these simulations, there are two actors which, for simplicity’s sake, are assigned
the same characteristics. Each state is assigned a number of strategies; each strategy has a true
level of expected utility that it would produce if a war were fought with it. The general
25
Harrison and March, “Decision Making and Postdecision Surprises”; Smith and Winkler, “The
Optimizer’s Curse.” For similar models, also see Keith C. Brown, “A Note on the Apparent Bias
of Net Revenue Estimates for Capital Investment Project,” Journal of Finance 29 (September
1974): 1215-1216; Van den Steen, “Rational Overoptimism.”
26 Smith and Winkler, “The Optimizer’s Curse,” 311.

17
magnitude of the traditional sources of misperception is also assigned, modeled as the standard
deviation of a normal distribution centered on these true values (as in Figure 1). Some of the
simulations also allow for each state’s misperceptions of its strategies to be related to one
another. This is modeled as covariance in a multivariate normal distribution. In order to produce
comprehensible charts illustrating the effect of each variable in isolation, other parameters are
held constant at assigned but arbitrary values in the results shown. These values are provided
below each figure. Each of these variables will be discussed in more detail over the course of the
article.
Is it reasonable to model perceptions of strategies as separate draws from normal
distributions centered on the true levels of effectiveness for each strategy? It is useful to break
this down into its parts. First, using a probability distribution to model misperception matches
the intuition that misperceptions are ex ante unpredictable errors in perceptions. It accords with
the winner’s curse literature’s treatment of bidders’ misperceptions of the worth of the prize.27
It
is also similar to the treatment of beliefs over the set of possible adversary types in existing
International Relations bargaining and signaling models which incorporate uncertainty.28
Second, it would be a problem to model each perception as an independent draw if these
perceptions are in fact tied together. For instance, an innately optimistic leader might exaggerate
all strategies to a similar extent. Rather than justify separate draws by making an assumption
that perceptions are unrelated, the model instead incorporates this relatedness among the
27
Smith, “Non-Aggressive Bidding Behavior and the ‘Winner’s Curse,’” 380-381.
28 E.g., Alastair Smith and Allan C. Stam, “Bargaining and the Nature of War,” Journal of
Conflict Resolution 48 (2004): 790; Erik Gartzke, “War is in the Error Term,” International
Organization 53 (1999): 579.

18
perceptions of strategies as one of its four core variables. Later sections define this variable and
illustrate the extent to which high relatedness in the perceptions of strategies can reduce false
optimism from the strategist’s curse.
Third, although I model perceptions with a normal distribution for convenience and
simplicity, it is not necessary that this distribution be normal or symmetrical. Aside from
changes in notation, the formal model (see Appendix) and simulations would be the same for
other distributions.
Fourth, the distribution of perceptions also need not center on the true level of
effectiveness. If perceptions are already biased towards optimism before strategy selection, the
strategist’s curse simply adds yet more false optimism. Two downward adjustments would be in
order, one to compensate for the net bias in the traditional sources, and a second for the
strategist’s curse. This flexibility is important, because neither this assumption nor the normality
assumption is likely to be met perfectly in reality. Kahneman and Renshon (2009), for example,
posit a “directionality hypothesis” that the net effect of cognitive biases is hawkish, though their
focus is on overestimating hostility.29
Johnson (2004) argues that evolutionary incentives
created a predisposition for false optimism in human nature, which causes war.30
Nationalism
offers a clear theory of false optimism about war outcomes through self-glorifying myths, but not
29
Daniel Kahneman and Jonathan Renshon, “Hawkish Biases” in American Foreign Policy and
the Politics of Fear: Threat Inflation since 9/11, eds. A. Trevor Thrall and Jane K. Cramer (New
York: Routledge, 2009): 79-96.
30 Johnson, Overconfidence and War. Also see Tali Sharot, “The Optimism Bias,” Current
Biology 21 (2011): 941-945.

19
false pessimism.31
In contrast, the organizational incentives to “worst-case” estimates would
seem to push exclusively towards false pessimism.32
The simulations begin with the states perceiving their strategies imperfectly due to the
traditional sources of misperception. These errors in the perceptions of each strategy are drawn
from the pertinent normal or multivariate normal distributions. This yields a set of perceptions
of the expected utility of war for each strategy, an umbrella term which includes perceptions of
the probability of victory, the benefits of victory, the costs of defeat, and the costs of fighting:
( )
UW Expected Utility of War
PV Probability of Victory
BV Benefits of Victory
CD Costs of Defeat
CF Costs of Fighting
Second, both states pick the strategy which appears best by selecting the maximum from
the set of perceptions. Comparing this to the true expected utility for that strategy yields the level
of false optimism.
31
Stephen Van Evera, “Hypotheses on Nationalism and War,” International Security 18 (Spring
1994): 28.
32 Richard K. Betts, “Analysis, War, and Decision: Why Intelligence Failures Are Inevitable,”
World Politics 31 (October 1978): 73-75.

20
Third, the simulation determines whether the two states’ perceptions of their best
strategies are sufficiently optimistic to overcome the expected utility of peace (UP), always .8 for
each in the results shown. If false optimism about war prospects exceeds the greater true utility
of peace, war results. In a later section, I explore adding uncertainty about the utility of peace.
The simulations assume a specific functional form to the cost-benefit calculation that
leads to war, but results are robust to reasonable alternatives. The assumption is that two states
fight when the total expected utility from war exceeds that from peace.33
The situation leads to
war if and only if:
This functional form for the cost-benefit equation offers a reasonable compromise
between parsimony and plausibility. The two simplest alternatives are 1) war if the expected
utility of war exceeds that of peace for at least one side and 2) war if the expected utilities of war
exceed those of peace for both sides. The problem with the former is that it excludes the
possibility of a war-avoiding coercive bargain.34
The problem with the latter is that one side can
33
The simulations do not output utilities or claim that an optimistic actor always suffers for it.
This is significant in part because recent literature has argued for the advantages of optimism, for
instance that it can improve morale or encourage states to stand firm and thus prevail in crises.
Johnson, Overconfidence and War; Dominic D. P. Johnson and James H. Fowler, “The
Evolution of Overconfidence,” Nature 477 (2011): 317-320.
34 Fearon, “Rationalist Explanations for War.”

21
start a war even if the other side does not wish to do so.35
In contrast, the function form used is
the most parsimonious option that solves both problems. When one state strongly wishes to
avoid war and the other weakly expects to benefit from it, this equation concludes that a war-
avoiding bargain is reached. When one state weakly wishes to avoid war and the other strongly
expects to benefit from it, war ensues. The strategist’s curse multiplier effect over the base rate
increases marginally if only one side must prefer war, and it decreases slightly if both must
prefer war (results not shown). These modest differences do not change the overall
conclusions.36
This procedure is repeated a sufficient number of times that the simulation results
converge to those from the corresponding formal model, with the exact number varying as
needed. The simulations are a simpler and more flexible method of solving that formal model.
These results are theoretical expectations, and should not be treated as empirical evidence.
35
Branislav L. Slantchev and Ahmer Tarar, “Mutual Optimism as a Rationalist Explanation for
War,” American Journal of Political Science 55 (January 2011): 135-148.
36 For simplicity, the simulations assume that the effectiveness of a strategy does not depend on
which strategy is used by the other side. However, this is not a necessary condition, as I explore
with an additional simulation in which misperception surrounds strategy pairs instead of
strategies. Each side has its own perception of how well it will fare in war if it uses a particular
strategy and the adversary uses a particular strategy. If each side has four strategies, each side
must evaluate sixteen strategy pairs. War ensues if the states’ collective optimism about one or
more strategy pairs exceeds the expected utility of peace. The results (not shown) were nearly
identical to the results without this strategic interaction.

22
Explanatory power cannot be deduced, even as it is important to derive the expected explanatory
power of a theory so that it can then be subjected to empirical tests.
The Causes of the Strategist’s Curse
Four variables determine the extent to which the strategist’s curse amplifies the level of
false optimism. These are 1) the number of strategies available, 2) the competitiveness of these
strategies with each other, 3) the relatedness of misperceptions among these strategies, and 4) the
magnitude of the traditional sources of misperception. The level of false optimism is a complex
function of all of these together (see Appendix). However, it is easier to think about this with a
heuristic that combines the first three of these into one main cause: the number of viable
strategies available. A viable strategy is one that is reasonably competitive with the others, and
one which can be misperceived differently from the others.
First, a greater number of available strategies acts as a cause of false optimism and war
because it increases the chances that at least one strategy will have its effectiveness exaggerated
enough for war to appear preferable to peace.37
What qualifies as a strategy? Economists
generally define strategies as alternative courses of action, whereas in military strategy it can be
defined as “the art of distributing and applying military means to fulfill the ends of policy.”38
This definition sees strategy as a theory of victory. The two definitions are closely related, but
37
The logic behind this cause is unrelated to the finding that an overabundance of options can
strain human mental capacities and produce sub-optimal choices. See Sheena S. Iyengar and
Mark R. Lepper, “When Choice is Demotivating: Can One Desire Too Much of a Good Thing?,”
Journal of Personality and Social Psychology 79 (2000): 995-1006.
38 Basil H. Liddell Hart, Strategy. 2
nd Edition. Revised (New York: Meridian Press, 1991): 321.

23
the second is preferable here. When two or more distinct theories of victory call for the same (or
similar) actions, each theory of victory can be misperceived differently. The pertinent typology
of strategies might be context-specific, or it might fit one of the usual molds, e.g., blitzkrieg vs.
attrition,39
offense vs. defense vs. deterrent war-fighting,40
punishment vs. denial,41
or land
power vs. sea power vs. air power. More generally, strategies can be distinguished by
differences in force structure, force employment, force levels, geographic location, or any other
factor important enough to associate a set of actions with a separate theory of victory.
Importantly, the analysis focuses on the perceptions of war strategies, i.e. alternatives ways of
fighting a potential war, and the implications of them for the decision between war and peace.
Perceptions of multiple peace strategies are considered later in this article.
How can one determine the number of strategies available to a state contemplating its
options for fighting a war?42
This question would seem to point to a problem for the theory. If
39
John J. Mearsheimer, Conventional Deterrence (Ithaca: Cornell University Press, 1983).
40 Posen, The Sources of Military Doctrine.
41 Glenn H. Snyder, Deterrence and Defense: Toward a Theory of National Security (Princeton:
Princeton University Press, 1961); Robert Pape, Bombing to Win: Airpower and Coercion in
War (Ithaca: Cornell University Press, 1996).
42 Strategy sets are not strictly exogenous in practice. In some cases, policy planners might
choose to conceal a strategy's existence from a decision-maker in order to influence the decision.
Time constraints might limit the number of options that can be considered, or decision-makers
under great pressure to find a solution might innovate a new strategy that they would otherwise
have neglected. For all these reasons, the number of options presented to (or by) the decision-
maker is not exogenous, and only strategies which receive enough consideration to have the

24
small differences between strategies suffice to distinguish two strategies, then there are always a
great many strategies available. For example, after President Nasser of Egypt nationalized the
Suez Canal in 1956, Britain and France perceived two basic military options: a limited
intervention to take control of the canal or a full occupation of Egypt to remove the continuing
threats posed by Nasser.43
They chose the former. But, within those two options were further
choices. Amphibious assault, airborne assault, or both? Land the invasion forces at Alexandria
or Port Said? Covertly cooperate with Israel? March on Cairo? Occupy it? Most British and
French leaders saw the full occupation option as overly costly, but they underestimated both the
resilience of Nasser’s government to a limited degree of pressure and the diplomatic backlash
following even a limited intervention to secure the canal. In consequence, and in line with the
strategist’s curse, they went to war based on a strategy whose effectiveness they had particularly
exaggerated.44
The result: abandoning the operation and enduring a humiliating withdrawal. So,
how many strategies were available? The number of strategies available to Britain and France
could plausibly be seen as two or as many more depending on how loosely strategy is defined.
potential for selection matter for the strategist’s curse. Nonetheless, a strategy which never
enters a formal option menu in an official document can influence the predicted amount of
optimism. It stands to reason that strategies whose effectiveness levels happen to be particularly
underestimated often never receive more than initial informal consideration. But, if these
strategies had been perceived more favorably, they often would have entered a formal menu of
options and sometimes – with enough optimism – have been selected.
43 Nasser’s rule was seen as threatening the Suez Canal, French rule in Algeria, and the stability
of pro-British Arab monarchies. Keith Kyle, Suez (New York: St. Martin’s Press, 1991).
44 Ibid., 167-179, 233-255.

25
However, loosening the definition of strategy to the point of including strategies with
only minor differences from each other has only a small – and potentially negligible – effect on
the strategist’s curse. The reason: adding these not-so-different strategies has two offsetting
effects within the theory. The increased number of strategies in itself increases the expected
level of false optimism. However, when the additional strategy is similar in most respects to one
or more others, the perceptions and misperceptions of these two strategies will be closely related.
Relatedness among misperceptions of the strategies reduces the strategist’s curse effect (more on
this below). In the Suez example, most of the reasons why a limited intervention would succeed
or fail did not depend on whether the initial invasion was amphibious or included a large
airborne force. There was scant reason to expect the diplomatic repercussions or the effect on
Egyptian domestic politics to change on that basis. Even many of the military considerations
would have been quite similar given the weakness of the Egyptian Army near Port Said.
Because relatedness was so high, distinguishing strategies on this basis would not significantly
change the expected level of false optimism.
At the extreme, dividing one strategy into multiple strategies based on purely trivial
differences would have no effect on either the level of false optimism or the probability of war.
Figures 10 and 11 will show that additional strategies have no impact when the relatedness
among the perceptions of these strategies is 100%. Overall, what matters is that the set of
strategies includes all those different enough (i.e., with relatedness sufficiently below 100%) that
their inclusion can affect the results to a substantively meaningful extent.45
It is important to
45
The definition of “substantively meaningful” can vary with the degree of predictive accuracy
sought for the particular application. More is better, but returns on including additional
strategies diminish rapidly once the main options are taken into account.
26
take all of these strategies into account and to properly incorporate relatedness among the
perceptions of these strategies. Having done so, including further strategies that are closely-
related variants of the main options is unnecessary and will not meaningfully affect the size of
the strategist’s curse.
Second, the competitiveness of the strategies with each other is important because even a
large exaggeration of the effectiveness of a lousy strategy may not make it the strategy perceived
as best. Competitiveness is the difference in the true levels of effectiveness among the strategies.
The pertinent comparison is usually to the true best strategy. Strategies that are extremely
uncompetitive are effectively irrelevant. Because it is a function of the true effectiveness of the
strategies and not the perceived effectiveness, the level of competitiveness is quite difficult to
observe. For instance, the fact that one strategy appears to be much more effective than all
others does not confirm that there is one strategy which is actually so.
Third, the relatedness of the misperceptions of the strategies to each other is a deceptively
important variable. This is modeled as the positive covariance in the misperceptions of these
strategies. As the covariance (relatedness) among the misperceptions increases, the strategist’s
curse effect shrinks. This would happen when there is some source of optimism (or pessimism)
which affects the strategies as a group. For example, a state which overestimates the competence
of its officer corps might exaggerate the effectiveness of all of its military strategies to a similar
extent. In contrast, decision-makers often misperceive a strategy separately from its alternatives
(low relatedness) when they misperceive some aspect of the world that affects one strategy more
than others. Take as an example Germany's strategy in World War I to use a massive flanking
offensive through Belgium to drive France out of the war before Russia could mobilize (the
Schlieffen Plan). More than most other strategies, perceptions of this strategy's effectiveness

27
hinged on perceptions of Britain's commitment to defend Belgian neutrality, Belgium’s
willingness to fight rather than capitulate, the military significance of Russian mobilization, the
feasibility of a decisive first strike on France, etc.46
This conclusion that high relatedness reduces the probability of war is, perhaps,
counterintuitive. High relatedness implies that when a state is falsely optimistic about one
strategy, it is likely to be falsely optimistic about the others. One might think that increasing the
odds of such across-the-board false optimism cases would be particularly dangerous. However,
only the strategy perceived as best matters, so exaggerating even one strategy is sufficient. A
cluster of strategies misperceived similarly (high relatedness) will fall entirely on the pessimism
side some of the time, but widely dispersed perceptions (low relatedness) will almost always
have at least one far on the optimism side. Therefore, low relatedness maximizes the chances of
a perception on the positive extreme.
Finally, as the amount of traditional misperception increases, so too does the amount of
false optimism generated by the strategist’s curse, as befits a multiplier effect. The normal
distribution used to model this is one of net misperception. Given the number of sources of
misperception, it is likely that both optimism and pessimism afflict most perceptions, but to the
extent that these offset each other they remain impotent.
The strategist’s curse also relies on some assumptions about the decision-maker. The
main assumption is that decision-makers evaluate strategies on their own merits. They come to
their best estimate about how well they will fare with each strategy based on past experience and
other relevant information. However, they do not condition their perceptions based on knowing
46
Stephen Van Evera, “The Cult of the Offensive and the Origins of the First World War,”
International Security 9, No. 1 (Summer 1984): 58-107.

28
which strategy is perceived as best. The assumption, in essence, is that decision-makers are
unaware they should make the downward adjustment.47
For perfectly rational actors, the
strategist’s curse would offer a theory explaining the otherwise-puzzling existence of the
downward adjustment. It is also assumed that decision-makers pick the strategy they perceive as
best. Taken with the previous assumption, the overall assumption is of an actor subject to
bounded rationality that is endeavoring to optimize but is not aware of the need to compensate
for the strategist’s curse.
The Pernicious Effect of More Strategies
Due to the strategist’s curse, the number of strategies available emerges as a significant
cause of war. This claim is not present in the current literature on the causes of war. Figures 5-7
shows the effect of increasing the number of strategies on the average perception of the strategy
which appears best, i.e., the perception of how well a war would go.
Figure 5 about here
47
Fey and Ramsay (2007) argue that on the brink of war, rational actors should downwardly
adjust their expectations because the willingness of their adversary to fight reveals that they
likely have fallen victim to false optimism. It can be argued that this first assumption must
extend to assuming this adjustment is also not made. Mark Fey and Kristopher W. Ramsay,
“Mutual Optimism and War,” American Journal of Political Science 51 (October 2007): 738-
754. However, see Slantchev and Tarar, “Mutual Optimism as a Rationalist Explanation for
War.”

29
Figure 5 presents results from the formal model (see Appendix) showing how additional
strategies increase the average level of false optimism. The average level of false optimism is
the gap between the upper line representing the perceived effectiveness what appears as the best
strategy and the lower line representing its actual effectiveness: .5. These results indicate that
the effect of adding strategies is quite strong for low numbers of strategies, but diminishes.
Moving from one to two available strategies suffices to significantly increase the level of false
optimism. The strategist’s curse does require at least two strategies; on average there is no false
optimism if only one is available. This does not mean that there is no false optimism with one
strategy, but rather just that it is no more common than false pessimism.
Figure 6 provides simulation results showing the effect of additional strategies, but unlike
Figure 5 it allows for states to inadvertently select suboptimal strategies. Half of the strategies
now have a true effectiveness of .5, and the other half of .4. The X axis increases in increments
of two because it is composed of strategy pairs containing one of each type. Every so often, one
of the .4 strategies will appear best and be selected.
Figures 6 and 7 about here
Figure 7 presents simulation results confirming that this pernicious effect of the number
of strategies also holds for the probability of war. The effect is non-linear and diminishing. The
lower line indicates the probability of war. This probability is not zero; for this set of parameters
it is approximately 1.7%. As mentioned previously, it is calculated as if states have only one
strategy available (true effectiveness .5), which is the assumption inherent in neglecting the
strategist’s curse. The conclusion to draw from Figure 7 is not that six strategies elevate the

30
probability of war to 17%, but rather that with six viable strategies the strategist’s curse can
sharply increase the probability of war.
What if Some Strategies Are More Effective than Others?
Does the strategist’s curse effect hold up if some of the strategies are considerably more
effective than others? In other words, is it robust to low competitiveness? Figure 8 examines the
marginal effects of different levels of competitiveness on the magnitude of false optimism. One
strategy is set to a true effectiveness of .5, and the other three strategies each have true levels of
effectiveness which vary from 0 to .5 along the X axis.
Figures 8 and 9 about here
Figure 8 reveals that surprisingly low levels of competitiveness still generate
considerable false optimism. However, most of this false optimism occurs from states picking
one of the inferior strategies, and doing worse than the true best. For example, suppose that one
of the three poor strategies happens to be greatly exaggerated, say from .1 to .35, and the true
best strategy is underestimated, say from .5 to .32. If so, the decision-maker would select the
inferior strategy, and receive an effectiveness of .1 instead of the .5 that was attainable.
Increased competitiveness makes selecting inferior strategies less detrimental, but it also makes
their selection more likely. Actual effectiveness initially decreases with increased
competitiveness because the latter dominates, then rises as the former becomes larger.
Figure 9 shows that low competitiveness curbs the probability of war more strongly than
the level of false optimism. This difference exists because false optimism from selecting a
suboptimal strategy is somewhat less prone to causing war. In such cases, the state often expects

31
to fare worse from a war than it actually could with an available strategy. These are less likely to
be cases in which the state expects to fare well enough from a war to choose to start it despite its
costs. Nonetheless, even at low levels of competitiveness, the strategist’s curse can remain an
important cause of war.
What If Misperceptions of the Strategies Are Related?
The results presented so far have set the relatedness (covariance) among misperceptions
to zero, assuming that misperceptions of the strategies are independent of one another. But, what
if these misperceptions are not independent? With the same decision-maker perceiving each
strategy, this concern is far from trivial. Many of the counterarguments to the strategist’s curse
translate to the claim that relatedness is high. For example, one might imagine that a state’s
perception of the distribution of power determines its expectations for all its strategies. When a
state is falsely optimistic about its relative power, it is falsely optimistic about all strategies. This
implies high relatedness among the misperceptions of each strategy, which would reduce the size
of the strategist’s curse effect. So, how much relatedness is needed to negate the strategist’s
curse?
Figures 10 and 11 about here
Figures 10 and 11 present simulation results showing that a surprisingly high level of
relatedness, modeled as covariance, is necessary to render the strategist’s curse irrelevant. It is
clear that increasing relatedness curbs the level of false optimism and the probability of war, but
the strategist’s curse remains substantively important despite high levels of covariance. Figure
10 also reveals a secondary effect: increasing relatedness reduces the frequency with which

32
decision-makers select a suboptimal strategy. In short, the degree of relatedness among
misperceptions is an important determinant of the size of the strategist’s curse, but it seems
unlikely that relatedness will be so high among clearly distinct strategies that it will consistently
eliminate the strategist’s curse.
Peace, Multiple Peace Strategies, and the Strategist’s Curse
The most limiting assumption in translating false optimism from the strategist’s curse
into war lies in how peace is conceived. Is the expected utility of peace a known value, a single
value which can be misperceived, or is there a set of peace strategies which can be misperceived
individually? What about a strategist’s curse effect among multiple peace strategies? Can this
offset the strategist’s curse’s effect on the probability of war?
For simplicity, peace has been treated as if it is a known. Doing so assumes that war
happens when the two sides’ false optimism exceeds a threshold: the expected utility of peace.
Treating peace as a single option which can be misperceived makes little difference. Doing so
slightly increases the probability of war for both the base rate and the strategist’s curse rate
(results not shown).48
The same cannot be said for the existence of multiple peace strategies.
If peace is a set of strategies and each can be misperceived, a strategist’s curse effect can
also exist among the peace strategies. States may, consequently, tend to select a peace strategy
whose effectiveness they have exaggerated, creating a general false optimism about peace. If
48
This happens because the added instances of false pessimism about peace result in a war
strategy seeming to be the best option more often than the added instances of false optimism
about peace result in peace seeming the best option. This result reverses if the probability of war
is greater than .5.

33
states are as falsely optimistic about peace as they are about war, the strategist’s curse would
remain a cause of false optimism without causing war. If the strategist’s curse effect is larger
among the peace strategies, it could even be a force for peace. More generally, intense false
optimism can exist without causing war if and when states are simultaneously falsely optimistic
about both war and peace such that the two offset each other. Whether in peace or in war,
perhaps states are just consistently disappointed?
There are two reasons to expect the strategist’s curse to cause war despite the possibility
of a strategist’s curse effect among peace strategies causing offsetting false optimism about
peace. First, the strategist’s curse still increases the likelihood of war if the general level of
misperception from the traditional sources is greater for war strategies than peace strategies
(results not shown). It seems reasonable to assume that misperception of war strategies is
usually greater than the misperception of peace strategies. The more this is so, the stronger the
strategist’s curse is as a cause of war. Although the traditional sources of misperception would
seem to apply similarly to peace and war strategies, it is likely that the potency of these
traditional sources is magnified by the uncertainty of war. How accurately can a state predict
how well it will fare during and after a war begun with each particular strategy? States in the
midst of a war often find it extraordinarily difficult to evaluate the performance of the strategy
they have been using even after that war is well underway.49
According to Clausewitz, “War is
the province of chance. In no sphere of human activity is such a margin to be left for this
intruder… [It] increases the uncertainty of every circumstance and deranges the course of
49
Scott S. Gartner, Strategic Assessment in War (New Haven: Yale University Press, 1997);
Jeffrey A. Friedman, “Breakthrough Problems and the American Indian Wars,” Paper Presented
at the International Studies Association Annual Conference, San Diego, 2012.

34
events.”50
In comparison, the ramifications of continuing to remain at peace may tend to be
easier to anticipate. Still, this assumption would stand stronger on an empirical foundation, and
it is likely the main limiting factor on the size of the strategist’s curse beyond the variables
themselves. An appropriate question for future research is whether states are as falsely
optimistic about peace as they are about war.
Second, false optimism among peace strategies that offsets the strategist’s curse would
frequently offer nothing more than a temporary reprieve from war. Over time, the true
performance of the exaggerated peace strategy would be revealed. The state might then decide
among its strategies again after discarding the exaggerated peace strategy.
Historical Examples: Pearl Harbor and the Iraq War
The Japanese attack on Pearl Harbor in 1941 and the decision by the United States to
invade Iraq in 2003 offer plausible examples of the strategist’s curse. These examples serve here
only as illustrations, not conclusive evidence.
Japan’s decision to attack the United States is widely regarded as an instance of false
optimism leading to war, in this case war against a country with nearly ten times its military
potential.51
Japan did not expect to march on Washington, but certainly hoped to fare better than
it did. Even after the decision to ally with Germany, Japan confronted a plethora of options for
using force to achieve the aims of economic self-reliance and imperial expansion. In contrast to
50
Carl von Clausewitz, On War. J. J. Graham trans. (Radford: Wilder Publications, 2008): 61.
51 E.g., Jack Snyder, Myths of Empire: Domestic Politics and International Ambition (Ithaca:
Cornell University Press, 1991): 113; Iguchi Takeo, Demystifying Pearl Harbor: A New
Perspective from Japan (Tokyo: International House of Japan, 2010): 62-63.

35
the offensive strategy it selected, Japan’s longstanding military strategy for war with the United
States had been to draw the U.S. fleet into East Asia, where it would be ambushed far from home
using submarines, land and sea-based aircraft, and ultimately the Japanese fleet itself.52
Japanese
war games shortly prior to the war envisioned a campaign of surprise attacks limited to the
Philippines and Southeast Asia, excluding Hawaii.53
Japan also could have focused its efforts on
prevailing on the Chinese front, or the Indian Ocean theater. More daring options were also
available, such as invasions of Hawaii, Australia, or India. Alternatively, Japan could have
designed its war plan to seize its territorial objectives in Southeast Asia while minimizing
American casualties in the hopes of facilitating an eventual political settlement. Japan also
contemplated an invasion of the Soviet Union as Germany’s campaign appeared to be faring
well, both in conjunction with or instead of an attack on the United States.54
Aiding Germany in
knocking the Soviet Union out of the war could have been thought to improve Japan’s chances
against the Western powers in the Pacific War. The multiplicity of potential adversaries
complicates this example, as tends to happen when theory meets reality, but a strategist’s curse
effect remains quite plausible even if limited to the U.S.-Japan dyad. Among all of these
52
H. P. Willmott, The Barrier and the Javelin: Japanese and Allied Strategies, February to June
1942 (Annapolis: Naval Institute Press, 1983).
53 Roberta Wohlstetter, Pearl Harbor: Warning and Decision (Stanford: Stanford University
Press, 1962): 356.
54 Fujiwara Akira, “The Road to Pearl Harbor” in Pearl Harbor Reexamined: Prologue to the
Pacific War, eds. Hilary Conroy and Harry Wray (Honolulu: University of Hawaii Press, 1990):
152; Nicholas Tarling, A Sudden Rampage: The Japanese Occupation of Southeast Asia, 1941-
1945 (Honolulu: University of Hawaii Press, 2001): 69.

36
options, there was a great deal of latitude for one to be misperceived into appearing far more
effective than was actually the case.
Several beliefs conspired to cause Japanese leaders to exaggerate the effectiveness of a
combined surprise attack on the United States, Britain, and the Netherlands. Most important was
the expectation that the United States would eventually accept Japanese control of Southeast
Asia rather than endure the costs of defeating Japan militarily. Others included the belief that
Germany would prevail in Europe, the exaggerated perception of the damage that a surprise
attack on Pearl Harbor would inflict on the U.S. Navy, and the conviction that fighting the
Europeans without fighting the United States was infeasible.55
The gravity of Japan’s miscalculation is puzzling in light of the acuity that characterized
Japan’s operational planning, tactical execution, and even many strategic assessments. Japanese
perceptions of American force levels, deployments, and relative economic potential were largely
accurate.56
Japan’s war plan achieved the element of surprise and resulted in the rapid conquest
of Southeast Asia at minimal cost. There was no across-the-board false optimism afflicting
Japanese perceptions. Japanese leaders’ misperceptions of the strategy they adopted exceeded
their general level of misperception. These leaders chose a strategy whose effectiveness they
had disproportionately exaggerated, in line with the strategist’s curse.
The 2003 Iraq War offers another plausible example of the strategist’s curse. It offers a
clear case of false optimism about war outcomes, in particular the costs that the postwar
insurgency would exact and the obstacles to a stable political order. Whether or not this was a
necessary condition for the war, it was likely at least a contributing factor. Multiple strategies
55
Takeo, Demystifying Pearl Harbor, 68; Wohlstetter, Pearl Harbor, 348.
56 Wohlstetter, Pearl Harbor, 349-352; Akira, “The Road to Pearl Harbor,” 154.

37
were available. The most important distinguishing factor among these was troop levels. The
existing contingency plan for an invasion of Iraq, drafted in 1998, envisioned troop levels of
380,000 to 500,000.57
Although they continued to receive attention and support, these troop
levels were rejected by Secretary of Defense Donald Rumsfeld, who sought a more
transformative strategy making use of technology to reduce force requirements. Proposals often
ranged between 100,000 and 150,000 American ground forces, including the plan ultimately
selected. A third war plan modeled on the Afghanistan victory and making use of only 10,000-
20,000 ground forces, perhaps in conjunction with a popular uprising, also received some
consideration.58
The set of proposed war plans differed not just on troop levels, but also on the
length of pre-war deployments, the need for preparatory airstrikes, and the possibility of a
northern front through Turkey.59
False optimism in the Iraq case appears to stem primarily from
the failure to anticipate the size and nature of the insurgency. If one accepts the conventional
57
Michael R. Gordon and Bernard E. Trainor, Cobra II: The Inside Story of the Invasion and
Occupation of Iraq (New York: Pantheon Books, 2006): 4, 26; Keith L. Shimko, The Iraq Wars
and America’s Military Revolution (New York: Cambridge University Press, 2010): 143-144.
58 Gordon and Trainor, Cobra II, 34; Richard H. Haass, War of Necessity, War of Choice: A
Memoir of Two Iraq Wars (New York: Simon & Schuster, 2009): 255; Thomas E. Ricks, Fiasco:
The American Military Adventure in Iraq (New York: Penguin Books, 2007): 75.
59 Gordon and Trainor, Cobra II; Shimko, The Iraq Wars and America’s Military Revolution,
146; Isaiah Wilson, “America’s Anabasis,” in War in Iraq: Planning and Execution, eds.
Thomas G. Mahnken and Thomas A. Keaney (New York: Routledge, 2007): 15-17.

38
wisdom that higher troop levels are necessary for effective stability operations,60
this belief
resulted in a much greater exaggeration of the quality of options with smaller troop levels,
creating the illusion of a cheap victory. Therefore, the Iraq case offers a plausible instance in
which the effectiveness of one strategy was disproportionately exaggerated relative to another,
and was selected as a result.
Full validation of these or other examples has at least four requirements: 1) a high level
of false optimism about the selected strategy was present, 2) this false optimism contributed to
the start of the war, 3) multiple strategies were available, and 4) the level of false optimism about
the selected strategy was high relative to perceptions of the alternatives. These requirements
pose several challenges. First is the inherent difficulty of establishing the presence or absence of
false optimism.61
Second, motivated bias offers a challenging alternative explanation for chains
of events suggestive of the strategist’s curse like those in the above examples. It is possible that
the minds of decision-makers under enormous pressure to go to war will find a way to
exaggerate the effectiveness of at least one military strategy until they have an option consistent
with their psychological need to go to war.62
If so, strategy selection might effectively follow the
60
U.S. Department of the Army, The U.S. Army/Marine Corps Counterinsurgency Field Manual
(Chicago: University of Chicago Press, 2007); James Quinlivan. “Force Requirements in
Stability Operations,” Parameters 25 (Winter 1995): 59-69. But see Jeffrey A. Friedman,
“Manpower and Counterinsurgency: Empirical Foundations for Theory and Doctrine,” Security
Studies 20 (2011): 556-591.
61 Levy, “Misperception and the Causes of War.”
62 E.g., Richard Ned Lebow, Between Peace and War: The Nature of International Crisis
(Baltimore: Johns Hopkins University Press, 1981).
39
decision to go to war rather than contribute to causing it.63
Third, the final requirement above
poses grave challenges because it necessarily implies a claim about how well the state would
have fared in a war begun with a different strategy. This is a daunting counterfactual.64
Without
it, however, there is no compelling reason to attribute explanatory power to the strategist’s curse
rather than the traditional sources of misperception alone.65
For these reasons, one can claim
only that particular examples are suggestive of the validity of the strategist’s curse.
Conclusion
This article proposes a new theory meant to explain the origins and prevalence of false
optimism as a cause of war. This theory introduces new variables which act as causes of war,
63
I would like to thank an anonymous reviewer for calling my attention to this possibility.
Although motivated bias and the strategist’s curse are probably best viewed as rival explanations
for war with troublesomely similar observable implications, the two could also operate in
conjunction with each other. Suppose that there are strategy-specific constraints on the degree to
which decision-makers can respond to motivated bias by convincing themselves of a strategy’s
effectiveness. If so, it is important to recognize that the strategies which are most susceptible to
exaggeration matter more than the general degree to which decision-makers can fulfill a
psychological need by overestimating a strategy’s effectiveness. In this way, strategy selection
could amplify the effect of motivated bias.
64 Jervis, “War and Misperception,” 681.
65 This may explain why the strategist’s curse has gone unnoticed; absent this evidence, war-
causing false optimism can simply be attributed to the traditional source(s) which caused the
exaggeration of the selected strategy’s effectiveness.

40
most notably the number of strategies available, and shows how strategy selection amplifies the
amount of false optimism from the traditional sources of misperception. Due to the strategist’s
curse, the strategy which appears most attractive is one whose effectiveness is particularly likely
to have been exaggerated. False pessimism may be common, but it will be effectively irrelevant
when states promptly disregard the strategies about which they are pessimistic and instead base
their plans around strategies whose effectiveness they have exaggerated.
A perfectly rational actor would reason as follows when choosing from several distinct
options. Based on everything I know, these are my estimates of how well I would fare in war
with each available strategy. Should I fight a war, I would use this strategy because it appears to
be the best. But, conditional on it seeming to be my best strategy, it is likely that I have
exaggerated its effectiveness. Therefore, I should reduce my expectations of how well I would
fare with that strategy. If war no longer appears preferable to peace, I should choose peace.
The strategist’s curse offers an argument for caution and even pessimism in making the
decision to go to war. Even if misperceptions from cognitive, bureaucratic, and other traditional
sources are no more prone to optimism than to pessimism, the best estimate of what appears to
be the best strategy is systematically biased towards false optimism. A downward adjustment in
expectations about how well this strategy would perform can be justified not by pacifism, but
rather by the pragmatic objective of predicting policy outcomes as accurately as possible in a
complex, error-prone world. This downward adjustment would be particularly salient for so-
called “wars of choice” in which it can tip the scales in favor of peace. Future research is needed
to establish the existence of the strategist’s curse empirically, but the conditions and assumptions
required for the effect are surprisingly minimal. Policymakers charged with the fateful decision

41
between war and peace should pause for a moment to ask themselves whether they are basing
their war plan on a strategy whose effectiveness they happen to have particularly exaggerated.

42
Appendix
This appendix formally derives the average amount of false optimism caused by the
strategist’s curse. I first derive it in a simplified (i.i.d.) case, then relax the identical distributions
condition in an intermediate case, and finally relax the independence condition to derive the full
solution. Solving the model requires numerical integration. Replication code for this numerical
integration will be made available online.
The model first solves for the expected utility of the strategy which appears best, i.e., the
maximum of the set of perceptions. Let (x) denote each possible perception, ( ) the perceived
utility of strategy i, and ( ) the perceived utility of each alternative strategy. The probability
that the perceived utility of any single strategy at any single value will be the maximum of the set
of perceptions is equal to the probability that this strategy takes on that value multiplied by the
probabilities that the perceived values of the alternative strategies fall below that point. If each
of the (k) strategies is independently and identically distributed with the same true effectiveness,
this implies:
( ) ( ) ( )
The probability that any particular potential perception is the max is the sum of the probabilities
that each strategy is the max at that value:
( ) ∑ ( ) ( )
( ) ( ) ( )
In terms of probability density functions ( ( )) and cumulative density functions ( ( )), this is
equivalent to the following, with ( ) the true level of effectiveness and ( ) its variance. I notate
the distributions as if they are normal, but the model easily extends to other distributions.

43
( ) ( ) ( )
This allows the calculation of the expected value of the max:
[ ] ∫ ( ) ( )
The average amount of false optimism is calculated by subtracting the true value ( ) from the
expected value for how well a state will expect to fare with the strategy it perceives as best.
[ ] ∫ ( ) ( )
The intermediate case relaxes the assumptions that the true performance levels and their
distributions are constant among the strategies, but otherwise follows the same logic:
( ) ( )∏ ( )
( ) ∑[ ( )∏ ( )
]
( ) ∑[ ( )∏ (
)
]
The expected value is:
[ ] ∑∫ ( ) ∏ (
)
To arrive at the expected magnitude of the false optimism for a set of parameters, it is
also necessary to calculate the true performance of the strategy that is picked. For each strategy,
this equals its true performance level multiplied by its probability of being picked. The sum of
these is the overall expected value for the actual performance of the picked strategy.

44
[ ] ∑∫ ( ) ∏ (
)
Simplifying the difference between these yields the expression below, which is both the average
amount of false optimism and the size of the adjustment needed to correct it.
[ ] ∑∫ ( ) ( ) ∏ (
)
The full solution below again solves for the perceived value of the strategy which appears
best, taking into account the probability that the strategy takes on that value and the condition
that all other strategies fall below that value. represents the probability density function of
a multivariate normal distribution, which allows for covariance.
[ ] ∑∫ ∫ ∫ ∫ ( )
( )
( )
[
]
As in the intermediate case, the expected value of what the decision-maker actually gets is:
[ ] ∑∫ ∫ ∫ ∫ ( )
The expected value of the amount of false optimism is the difference between these:
[ ] ∑∫ ∫ ∫ ∫ ( ) ( )
45
This is the full solution to the model, in which all four constituent variables of the strategist’s
curse can take on any value that might exist in a real-world situation.

46
Some readers may find it more intuitive to think of the expected utility of war as the probability of victory. The
numerical values are assigned with that heuristic in mind.
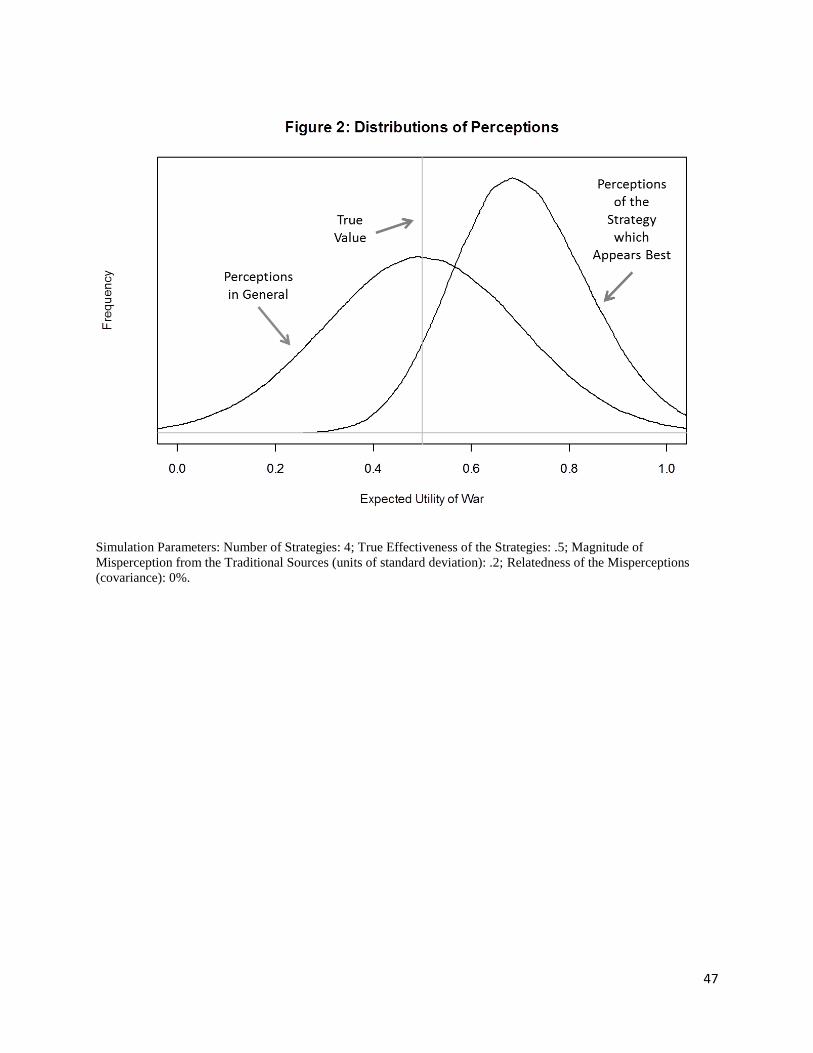
47
Simulation Parameters: Number of Strategies: 4; True Effectiveness of the Strategies: .5; Magnitude of
Misperception from the Traditional Sources (units of standard deviation): .2; Relatedness of the Misperceptions
(covariance): 0%.

48
Simulation Parameters: Number of Strategies: 4; True Effectiveness of the Strategies: .5 (two strategies) and .3 (two
strategies); Magnitude of Misperception from the Traditional Sources (units of standard deviation): .2; Relatedness
of the Misperceptions (covariance): 0%.
Best 2nd Best 3rd Best Worst
Perceived
Actual
Figure 3: Perception vs. Reality
Exp
ecte
d U
tility
of W
ar
0.0
0.1
0.2
0.3
0.4
0.5
0.6
The Strategy Which Appears to Be ___________

49
Simulation Parameters: Two symmetric Actors; Number of Strategies: 4; True Effectiveness of the Strategies: .5
(two strategies) and .4 (two strategies); Magnitude of Misperception from the Traditional Sources (units of standard
deviation): X Axis; Relatedness of the Misperceptions (covariance): 0%; Expected Utility of Peace: .8.

50
Formal Model Parameters: Number of Strategies: X Axis; True Effectiveness of the Strategies: .5; Magnitude of
Misperception from the Traditional Sources (units of standard deviation): .2; Relatedness of the Misperceptions
(covariance): 0%.

51
Simulation Parameters: Two Symmetric Actors; Number of Strategies: X Axis; True Effectiveness of the Strategies:
.5 (half the strategies) and .4 (half the strategies); Magnitude of Misperception from the Traditional Sources (units of
standard deviation): .2; Relatedness of the Misperceptions (covariance): 0%; Expected Utility of Peace: .8.

52
Simulation Parameters: Two Symmetric Actors; Number of Strategies: 4; True Effectiveness of the Strategies: .5
(one strategy) and X Axis (the other three strategies); Magnitude of Misperception from the Traditional Sources
(units of standard deviation): .2; Relatedness of the Misperceptions (covariance): 0%; Expected Utility of Peace: .8.

53
Simulation Parameters: Two Symmetric Actors; Number of Strategies: 4; True Effectiveness of the Strategies: .5
(two strategies) and .4 (two strategies); Magnitude of Misperception from the Traditional Sources (units of standard
deviation): .2; Relatedness of the Misperceptions (covariance): X Axis; Expected Utility of Peace: .8.