the supply chain’s role in making or breaking hospitals ... · pdf filebreaking...
TRANSCRIPT
1Confidential. Property of MedAssets. MedAssets® is a registered trademark of MedAssets, Inc. © 2013 MedAssets, Inc. All rights reserved.
The Supply Chain’s Role in Making or
Breaking Hospitals’ Margins, Competitive
Edge
John H CunninghamSenior Vice President, Client OperationsMedAssets, Inc.
Steve ChyungVice President Supply Chain Management & Real EstateSCL Health System
2
Learning Objectives
By the end of this session, we will be able to:
• Identify leading supply chain principles to strengthen operations as a source of strategic advantage
• Adapt industry models to the unique environment of healthcare supply chain
• Identify the critical business processes within the scope of Procure-to-Pay
• Unlock savings potential by creating controls and a managing framework for Procure-to-Pay
• Calculate opportunity cost from overlooked processes

3
Topics Covered
• Supply Chain Overview and Healthcare to Industry Parallels
• Procure-to-Pay Business Processes
• Maturity Scale
• Collaborative Supply Chain/Procurement Structure (SCL Case Study)
• Automation Technology
• Opportunity Costs

4
Provider Challenges
Narrow view of supply chain management and its importance to overall
performance
Lack of executive support for supply chain
improvement initiatives
Supply chain leaders unsure of how to engage leaders
and demonstrate organizational impact
Marketplace changes creating increased pressure
on revenue
New, better technology (e.g., devices) increase
supply expensePhysician preference driving
up costs
Supplier and physician relationships
Lack of physician interest or engagement in managing
supply cost with the hospital
Rapid introduction of new technology requires
organizational alignment for decision making

5
Supply Chain Overview and Healthcare to Industry Parallels

6
The retail and manufacturing industries are continually improving their supply chain operations as a source of competitive advantage
LaborEffectiveness
Operational Effectiveness
Supply ChainEffectiveness
CapitalEffectiveness
ST
RA
TE
GIC
MA
NA
GE
ME
NT
Demand-drivenScheduling
Team WorkGroups
Incentive SystemsTailoring
Perm-tempOptimization
TQM Kaizen Six Sigma Lean
StrategicSourcing
Procure to Pay Automation
DynamicInventory Demand
Forecasting
Total CostOf Ownership
CapitalLeasing
ResourceSharing
WORLDCLASS
Materials ResourcePlanning Systems

7
Materials ResourcePlanning Systems
In general, the healthcare supply chain has lagged in adoption of supply chain best practices as a means for economic sustainability
Demand-drivenScheduling
Team WorkGroups
Incentive SystemsTailoring
Perm-tempOptimization
TQM Kaizen Six Sigma Lean
Total CostOf Ownership
CapitalLeasing
ResourceSharing
WORLDCLASS
HEALTHCARE
LaborEffectiveness
Operational Effectiveness
Supply ChainEffectiveness
CapitalEffectiveness
ST
RA
TE
GIC
MA
NA
GE
ME
NT
StrategicSourcing
Procure to Pay Automation
DynamicInventory Demand
Forecasting

8
Leading practices from industry, adapted to the unique environment of healthcare can produce effective cost management in healthcare
IndustryLeading Practice
HealthcareAdaptation
Effective CostManagementin Healthcare
• Articulate job requirements clearly and consistently
• Match pay scales to worker demand shifts
• Instill culture of continuous improvement
• Optimize workspace layout for process flow
• Understand Total Cost of Ownership
• Align corporate and supply chain strategy
• Evaluate service and salvage in purchase decision
• Optimize utilization before making investments
• Publish open shifts to preferred audiences first
• Integrate credential management with requisitioning
• Adapt terminology to fit service environment
• Educate staff to think in processes and not activities
• Partner with suppliers to lower cost of goods.
• Engage clinicians in sourcing decisions
• Elevate the Supply Executive within the organization
• Negotiate using pre-approved technology acceptance
• Design facilities and position equipment to optimize throughput
LaborEffectiveness
Operational Effectiveness
Supply ChainEffectiveness
CapitalEffectiveness
ST
RA
TE
GIC
MA
NA
GE
ME
NT

9
Supply Chain Organization Development Curve, Vision, and Strategy

10
Supply Chain Management Organizational Development Curve
Baseline•Transaction Focused
•Inconsistent Compliance
Conventional•Price Focused•Total cost•System Policies
Advanced•System Integration•Data Quality•Mature Supplier Relationships
Leading•C-level •Market Influence•Risk sharing
Val
ue
Maturity
Improving Supply Chain Management Capabilities Delivers Greater Value To The Business

11
Vision and Strategy – Create an Integrated Supply Chain
Centralized control of supply chain process with self service deployment
– Centralized contract management – Standardized processes and methods
• Custom Catalogue• Database maintenance
– Self service electronic purchase requisition/order, receipt and custom reporting
The alignment of trading partner incentives – 100% price accuracy guarantee– Non contested return policy– Vendor owned and managed inventory – Electronic order/credit to payment management– Co-management of the procurement database – Evaluated receipt settlement
A decision support system that will “self-regulate”
– Fulfillment and Inventory– Receipt and payments – Customer service and quality assurance center– Audits and dashboards

12
Strategy Development
OrganizationalDeployment
Business Process Improvement
Technology Enhancement(Data, Applications, Technology)
Evaluate and Improve
Pay
Obtain
Source and Request
Core SC Processes:
Focus on Four Key Levers that Impact Performance

13
Total Operating Expenses FY03
Drugs, Supplies & Consumables:$72 Million
Other Controllable Non-Labor: $28 Million
Total Supply Chain Expense:
$100M+ per year
MEDICAL CENTER OPERATING EXPENSES FY03------------------ Cost % of TotalPhysician Salaries $62,323,155 13%Staff Salaries $190,034,612 38%Employee Benefits $50,677,769 10%Medical Surgical Supplies $44,195,763 9%Pharmaceuticals & Drugs $21,744,736 5%Administrative Supplies $5,605,782 2%Administrative Other $1,628,112 1%Purchased Services $11,851,388 7%Utilities $2,278,152 1%Facility Costs (excl Depreciation) $10,721,934 3%Other Controllable Expenses $1,894,609 0%Depreciation $16,648,162 3%Insurance $21,345,499 4%Charges (To)/From PSU -$7,215,404 -1%Intracompany Funds $48,523 0%Other Non-Controllable Expenses $20,447,609 4%
Total Expenses $454,230,401 100%
Begin by Capturing the Total Supply Chain Spend

Purchased Services is a significant spend category and largely untapped
Often the “forgotten”
categories (in healthcare) but with just as much
opportunity for financial, quality and service benefits
Hardware
Software
Support
Outsourced
Services
Consulting
Services
Contract
Labor
Temp Labor
Grounds
Maintenance
Services
Auditing
Services
Travel
Vehicles
Vehicle
Maintenance
SaaS
Solutions
Design
Services
General
Contractors
Architect
Services
Building
Supplies
Marketing
Materials
Office
Supplies
Office
Equipment
Equipment
Maintenance
Furniture
Flooring
Forms/Labels
Third Party
Printers
Duplication
Services
Banking
Relationships
Insurance
HR Benefits
Payroll
Services
Chemicals
Distribution
Services
Records
Storage
Telecom
MRO
Etc Etc Etc

15
Procure-to-Pay Business Processes

16
Central WarehouseCentral
Distribution
The healthcare supply chain value stream is dynamic and complex
Patient
NursingFloor
MMIS
Purchasing
Supplier Tier 3
Supplier Tier 2
Distributor
OR Specials
Supplier Tier 1
ER
Pharmacy
Central/Sterile
OR
Physician’s Office
SchedulingWell Patient

17
The purchasing workflow has many touch points
Nurse
Requisition
SourcingDecision
GenerateOrderManufacturer
HealthcareProvider
4-way match
Invoice ERP
Approval
Payment
Distribution
Supplies
Storeroom

18
Collaborative Supply Chain / Procurement Structure

19
Organizational Structure Change Provides Additional Collaboration Opportunities
Reorganizing and adding departments outside the traditional Supply Chain organization like Accounts Payable, Travel, Process & System Performance and Stewardship has allowed for a more collaborative environment, breaking down silos.
SVP, Supply Chain Management and Real
Estate
Real EstateAnalyst
VP, FacilitiesDevelopment
Director,Capital & Services
Category Management
Director, Clinical Category
Management
Director, Supply Chain Operations
Director, Process & System
Performance
Manager, Accounts Payable
& Travel
ExecutiveAssistant
Supply Chain Organizational Structure
20
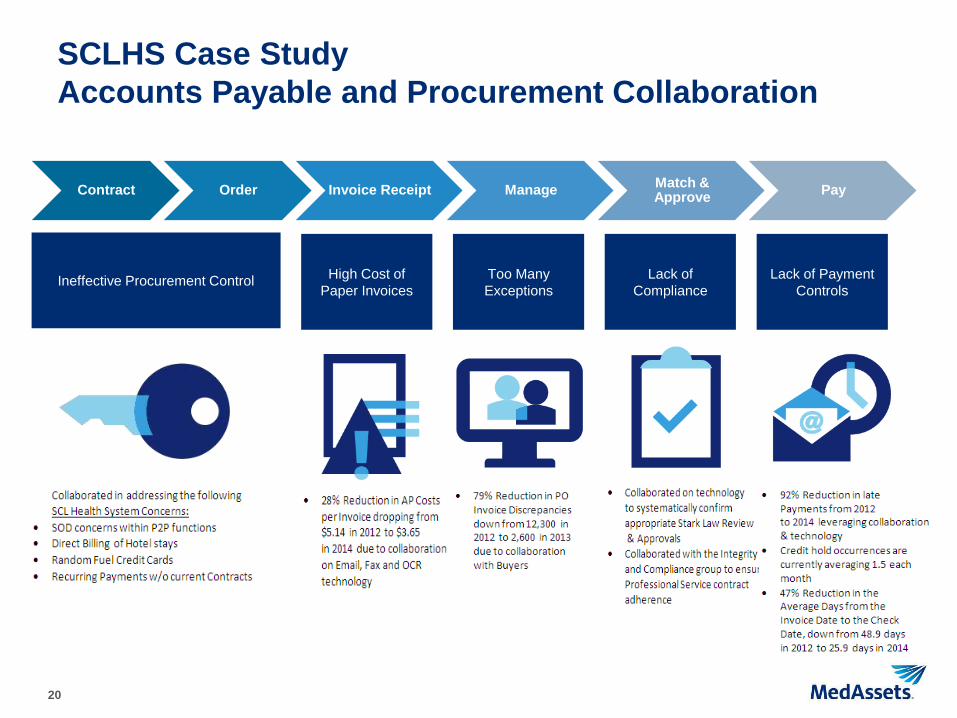
SCLHS Case StudyAccounts Payable and Procurement Collaboration
Contract Order Invoice Receipt Manage Match & Approve Pay
Ineffective Procurement Control High Cost of Paper Invoices
Too Many Exceptions
Lack of Compliance
Lack of Payment Controls
21
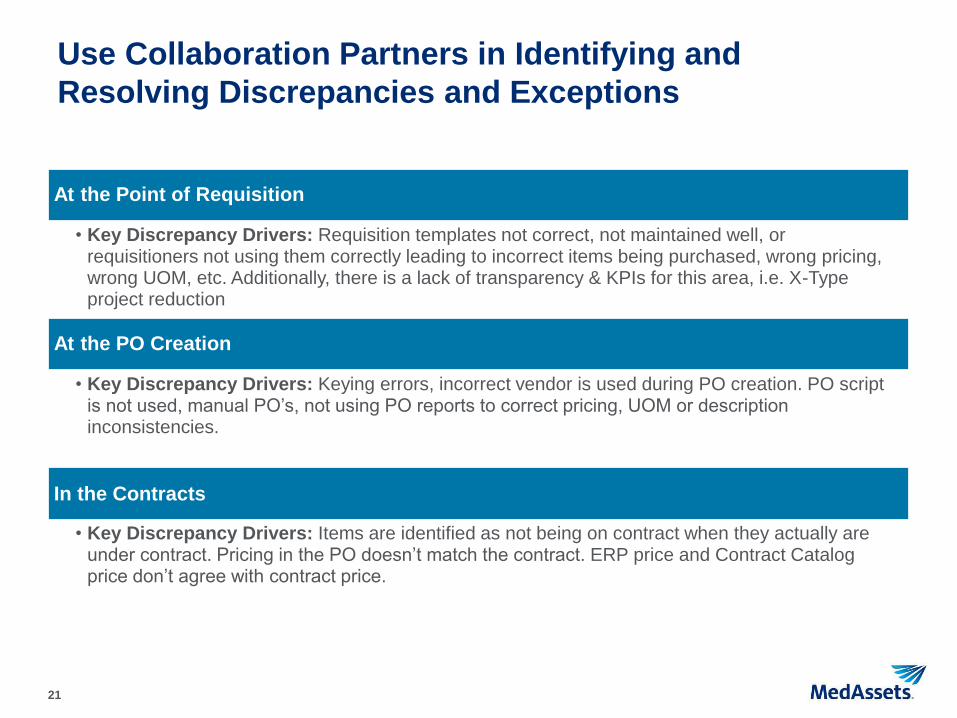
Use Collaboration Partners in Identifying and Resolving Discrepancies and Exceptions
At the Point of Requisition
• Key Discrepancy Drivers: Requisition templates not correct, not maintained well, or requisitioners not using them correctly leading to incorrect items being purchased, wrong pricing, wrong UOM, etc. Additionally, there is a lack of transparency & KPIs for this area, i.e. X-Type project reduction
At the PO Creation
• Key Discrepancy Drivers: Keying errors, incorrect vendor is used during PO creation. PO script is not used, manual PO’s, not using PO reports to correct pricing, UOM or description inconsistencies.
In the Contracts
• Key Discrepancy Drivers: Items are identified as not being on contract when they actually are under contract. Pricing in the PO doesn’t match the contract. ERP price and Contract Catalog price don’t agree with contract price.

22
Use Collaboration Partners in Identifying and Resolving Discrepancies and Exceptions
In the Vendor Master
• Key Discrepancy Drivers: Vendor consolidations that are not communicated or are not completed in a timely or correct manner. Wrong vendor record associated with an item.
In the Item Master
• Key Discrepancy Drivers: Vendor discrepancies. Poor descriptions, incorrect UOMs or manufacturer codes. Too many additions being communicated directly by the sites. A lack of standard abbreviations. Multiple item masters due to consolidations. A lack of good interfaces back from other cath lab and perioperative systems.
In the Invoices
• Key Discrepancy Drivers: Items being invoiced are not on the PO. Invoices provided are missing or have incorrect information on them. No PO # listed for PO invoices. Credit / rebills and chargeback issues.

23
Use Collaboration Partners in Identifying and Resolving Discrepancies and Exceptions
In the EDI Electronic Confirmation
• Key Discrepancy Drivers: On-boarding process isn’t clean and well tested. Recycled invoice #’s. PO lines not valid. Items with unique characters cause EDI failures. Dispute process doesn’t allow enough time to process correctly.
In the Uploads
• Key Discrepancy Drivers: Bad data in the upload. IC12 doesn’t have the correct vendor. Vendor is not set up in the Item Master correctly.

24
Procure-to-Pay System Level Progress Metrics
96% Reduction in Backlogged invoices
27 pp Reduction in Checks issued
7 pp Increase in POs issued

25
Procure-to-Pay System Level Progress Metrics
79% Reduction in Invoice Discrepancies
72% Reduction in Past Due Invoiceswith (Cost Exceptions)
25% FTE Reduction since 2012

26
Top 10 Things that should be considered during Procure-to-Pay Collaboration
1. Focus on the 80:20 Rule to address large vendor issues first. SCL focused on O&M, Cardinal and J&J in a collaborative manner to reconcile statements, doing root cause discrepancy research, analyzing outstanding amounts due and follow-up with regular communications to a larger team for the resolution of complex issues.
2. Need to establish a good baseline and measure the metrics that you want to improve. AP and SC gathered benchmarks of what other companies were measuring to understand the best-in-class and the averages for similar companies regarding P2P processes.
3. Find some early wins and communicate them. AP & SC communicated some early wins following the successful conversion of Exempla Associates to WebNow, the Non-PO Approval Hierarchy transition, the gains in ACH Direct Deposit enrollments and the automation available for vendors regarding emailing and faxing of invoices

27
4. Perform Root Cause Analysis to address issues. SCL identified vendors with repetitive and recurring issues and worked directly with these vendors and our GPO to address areas that kept repeating.
5. Enforce compliance to the Policies and Procedures. SC and AP collaborated with other departments on policy and procedure changes to guide the appropriate Care site and System office behaviors in support of the desired P2P initiatives. An example: The changes in how SCL reviews and approves requests for payment from contracted Professional Services.
6. Manage supplier performance. SCL AP and SC initiated a robust Vendor Add process, requiring each step of the process to be met prior to a vendor being added to the SCL Vendor Master.
7. Collaborate on creative solutions to support the needs of the business. AP and SC are collaborating creative solutions for SCL associates and our vendors, examples include: P-Card options, Debit Card for CME expenses, SPS and CCR Rebate opportunities, capturing Discount Opportunities during Contract negotiations etc.
Top 10 Things that should be considered during Procure-to-Pay Collaboration (cont.)

28
Top 10 Things that should be considered during Procure-to-Pay Collaboration (cont.)
8. Collaborate on end-to-end compliance areas to minimize the risks to the company. AP and SC collaborated to address segregation of duties (SOD) issues and are partnering to establish Internal Controls for the procedures that we leverage daily to pay our vendors and associates through the P2P processes.
9. Collaborate to review and implement new P2P technology. SCL has all stakeholders at the table to review proposed P2P changes and to make sure that moving forward makes sense for the company as a whole.
10. Collaborate to provide internal controls and remove bad processes within the company. SC, AP and often other departments are asked partner in changing or removing bad practices and addressing process gaps. SCL departments have used these opportunities to brainstorm and implement better alternatives and minimize risks to the organization.

29
Maturity Scale

30
5% Best in Class
Technology
ProcessPeople
•CULTURE: Highly reactive transactional based•AUTOMATION: None, 100% of PO’s phone or faxed
•STAFF: Clerical, spends 75% of time managing transaction exceptions•ANALYTICS: None
Reactive
•Highly reactive transaction based culture (“I need a PO”) •Transactions 100% paper based (e.g. req., PO, invoice) and processed by clerical personnel•Majority of time (>50%) managing transaction exceptions and discrepancies•No analytics or reporting. Spend data often requested from supplier
Functional
Best in Class
•CULTURE: Focus on short-term fixes and solutions to keep up with day-to-day•AUTOMATION None, 100% of PO’s phone or faxed
•STAFF: Clerical, spends 65% of time managing transaction exceptions•ANALYTICS: Limited to canned reports available from ERP & financial system
Developing
•CULTURE: Keeping up with day-to-day. Standards & processes loosely defined •AUTOMATION Limited, 40% of PO’s sent EDI, eReq in use but not widely adopted•STAFF: Administrative, spends 55% of time managing transaction exceptions•ANALYTICS: Ad-hoc reports from ERP & financial systems manipulated using Excel
Hospitals who operate “best in class” procurement operations can reduce their supply-chain costs by 5-15%1
95
% o
f al
l Pu
rch
asin
g D
ep
ts.
Most hospitals don’t make the investment needed in people, process and technology to attain “best in class” procurement operations
1Gartner: Supply Chain Consultants and Outsourcing Providers for Healthcare Delivery Organizations – July, 2011
•CULTURE : Supply-chain viewed as strategic value add. Defined standards & processes•AUTOMATION: High, 90% of PO’s sourced from eReq. 80%+ of all PO’s sent via•STAFF: Professional personnel focusing on high-value strategic tasks •ANALYTICS: Routine analytics with savings opportunities & key performance indicators
Companies who operate best in class procurement operations are among the most profitable in their industry

31
Nurse
Requisition
SourcingDecision
GenerateOrderManufacturer
HealthcareProvider
4-way match
Invoice ERP
Approval
Payment
Distribution
Supplies
Storeroom
If not managed, cost drivers within the procurement process can make a significant financial impact
Manual Invoice
Off- Contract Spend
Manual Ordering
Manual Reqs
Managing Discrepancies
Outdated Item Master
Prompt Pay Discounts
Check Runs

32
Opportunity Costs

33
Procure-to-Pay Solutions – Readiness Assessment
Functions ValueTypical
HospitalLeadingPractice
Self Assessment
Opportunity Y/N
Potential Savings
Using Electronic Purchasing
Automates POs 20% of PO’s EDI55% of PO’s
EDI$3/PO
Managing the Item Master
Improves data integrity
30% of item file contains
inaccuracies
< 5% of item file contains inaccuracies
$7.61 per inaccurate item file record
Using Electronic Requisitioning
Contract compliance and
operational efficiencyefficiency
55% contract compliance
85% contract compliance
3% per $ moved to contract
Centralizing Purchasing
Automates POsfor non-EDI suppliers
Improves price accuracy
35% of contracted PO
lines
85% of contracted PO
lines
$8/discrepant PO Line
Leveraging Payment Exchange
Automates payment
20% of supplier payments automated
55% of supplier
payments automated
$6.50/payment plus 1% rebate
Leveraging Invoice Management
Automates invoicing
1 AP clerk for every $17M
spend
1 AP clerk for every $64M
spend
73% reduction of AP labor ($49.2k/FTE)

34
Summary

35
Summary
• Leading supply chain principles to strengthen operations as a source of strategic advantage
• Industry models to adapt to the unique environment of healthcare supply chain
• Procure-to-Pay savings opportunities are often less visible than supply price
• Purchasing workflow has many potential breaking points
• Procurement operations maturity scale
• Collaborative procurement structure, metrics and considerations
• The use of technology to automate

36
Thank you for attending the webinar today.For more information on building a strategic supply chain for a competitive advantage, please contact MedAssets today at [email protected] or call 888.883.6332