the sydney symphony a presentation by rachel hadfield director of finance
DESCRIPTION
The Sydney Symphony A presentation by Rachel Hadfield Director of Finance. Director of Finance Job Overview. Director of Finance Job Overview. Financial Management Business Analysis Financial Reporting (internal and external) Budget Preparation Risk Management - PowerPoint PPT PresentationTRANSCRIPT

The Sydney SymphonyA presentation by Rachel HadfieldDirector of Finance

Director of Finance
Job Overview

Director of Finance Job Overview
• Financial Management– Business Analysis– Financial Reporting (internal and external)– Budget Preparation
• Risk Management– Development of Company Calendar– Board Secretariat– Board Governance– Internal Audit– Records Management– Risk Identification and Accountability– Legal Liaison

Director of Finance Job Overview (cont.)
• People– Pay, Employee Records – Human Resources
• Recruitment• Induction• Training• Performance Management Systems
– Enterprise Bargaining– Consultative Committee Liaison
• IT– Systems Development– Network Integrity– Admin Staff Skills– Productivity Improvements
• Office Management– Maintain Productive Office Environment

Business Services Team
Director of Finance
Management Accountant
Business Analyst (PT)
Business Services Assistant
IT Manager HR Manager

Sydney Symphony
Context

SSO established as part of the ABC, only 24 players Start of annual concert seasons State and Local Government agree to establish an orchestra in Sydney Eugene Goossens appointed first Chief Conductor "Sydney must have an Opera House" - Goossens chooses Bennelong Point Sir Charles Mackerras appointed first Australian Chief Conductor Mary Vallentine appointed Managing Director Stuart Challender appointed Chief Conductor Edo do Waart appointed as Chief Conductor and Artistic Director Federal Government increased player numbers (104) and salaries SSO corporatised with Federal Government support $2.5M 'Creative Nation' funding provided to SSO Nugent report requests orchestras to build up reserves Administration Staff reduced by 20% Libby Christie appointed Managing Director Gianluigi Gelmetti starts as Chief Conductor and Artistic Director
1932
1936
1946
1947
1948
1982
1986
1987
1993
1994
1995
1997
1999
2002
2003
2004
Evolution

Australia's Flagship Orchestra
• Sydney Symphony is Australia's flagship orchestra:
– Largest audience reach– Longest history– Largest government funding– Largest subscriber base– Largest revenue– Largest administration team– Home town is Australia's largest city– Home venue is Australia's premier venue – Sydney Opera House
• The Sydney Symphony concert experience can be perceived as elitist. Marketing efforts, outreach programs and free events are attempting to break down this perception

Australia's Flagship Orchestra (cont.)
0 10 20 30 40 50 60 70
AustralianChamber
MelbourneSymphony
Sydney Symphony
San FranciscoSymphony
Boston Symphony
USD $M - 2002
Government Funding v Revenue
0 500 1000 1500 2000 2500 3000
Melbourne Symphony
CBSO
Detroit Symphony
Sydney Symphony
Vienna Philharmonic
Opera Australia
Berlin Philharmonic
London Symphony
Chicago Symphony
Boston Symphony
Number of Press Mentions in 2003
Share of Voice
0 200 400 600 800 1000 1200 1400 1600
MelbourneSymphony
Sydney Symphony
Boston Symphony
Audience Seats Filled ('000)
Paid v Unpaid Audience Reach
-10 40 90 140 190 240 290
Australian Chamber
London Symphony
Melbourne Symphony
Sydney Symphony
San Francisco Symphony
Boston Symphony
USD $M - 2002
Equity v Liabilities

2003
Financial Results

2003 Financial Overview
• Net Surplus of $593k• Net concert result exceeded budget by $566k (and 2002 by $843k)
despite various obstacles throughout the year (eg Agerich cancellation) • Significant savings in operating expenditure particularly in marketing• Corporate sponsorship target not met• Orchestra costs were under budget due to the number of vacancies• Admin Expenses variance due to impact of Fixed Asset Review
2003 2003 Variance 2002 VarianceActual Budget to Budget Actual to Prior Year$'000 $'000 $'000
Operating Revenue 10,504 10,484 0% 8,760 17%Operating Expenses (6,641) (7,189) -8% (5,740) 14%Net Concert Result 3,862 3,296 17% 3,019 22%
Net Development 1,973 2,238 -12% 1,703 14%Funding 10,717 10,712 0% 10,492 2%Interest Income 517 450 15% 458 11%Other Income 251 189 33% 306 -22%Orchestral Expenses (10,173) (10,502) -3% (9,453) 7%Administration Expenses (6,554) (5,977) 10% (6,507) 1%
Net Surplus/ (Deficit) 593 407 46% 19 97%

Noteworthy Results - Income
• Ticket Sales– +17% growth in ticket sales on 2002– Increased reliance on the single ticket market, which represented 52% of sales in 2003 (46% in 2002)
• Development– +14% growth on 2002– +$615k in corporate sponsorships
• Commercial Work– Incredible success achieved with net contribution of $689k, +11% of budget
• Funding– + 1.871%, relates to a loss in real terms of $194,331
• Interest– Increased interest income in line with the cash surplus generated in the year and
interest rate rises
Split of 2003 Income
Subscriptions
Single Tickets
Orchestra Hire
Funding
Development
Interest
Other

Noteworthy Results - Costs
• Marketing– +3% increase in efficiency with $4.39 in single ticket income
generated for each dollar of performance marketing spent
• Orchestral Salaries– +14.8% increase for all musicians– Savings resulted however from the number of vacancies
• Fixed Asset Review– Long overdue audit completed of Company assets with $441k
impact on Administration expenses for the year

24.9 22.7 23.5
0
10
20
30
'03 '02 '01
2003 Reversed A Decreasing Trend In Profitability
Profit($m)
Revenue($m)
Expenses($m)
0.6
0.0
0.4
0
1
2
'03 '02 '0124.3 22.7 23.1
0
10
20
30
'03 '02 '01

Increasing Orchestral Salaries….
Operating Loss(excluding government funding)
($m)
Employees($m)
Artists($m)
Revenue(excluding government funding)
($m)
Expenses($m)
Admin($m)
10.7 11.1 10.7
05
1015
2003 2002 2001
13.5 11.6 12.4
01020
2003 2002 2001
23.122.724.3
01020
2003 2002 2001
13.4 13.1 12.8
05
1015
2003 2002 2001
3.9 3.4 3.6
05
1015
2003 2002 2001
2.0 1.7 2.1
05
1015
2003 2002 2001
Increasing orchestral salaries
Depreciation($m)
0.5 0.2 0.205
1015
2003 2002 2001
Once off depreciation expense

Have Been Matched By IncreasedTicket Sales And Commercial Revenue
Operating Loss(i.e. excluding government funding)
($m)
Ticket Sales($m)
Sponsors/Donations
Revenue(excluding government funding)
($m)
Expenses($m)
Other
10.7 11.1 10.7
05
1015
2003 2002 2001
8.78.29.6
0
5
10
2003 2002 2001
2.3 1.9 2.7
0
5
10
2003 2002 2001
1.7 1.4 1.00
5
10
2003 2002 2001
2003 growth driven by increased ticket sales
Mostly an increase in orchestral hire revenue
13.5 11.6 12.4
01020
2003 2002 2001
23.122.724.3
01020
2003 2002 2001

Business Analysis
Metrics

“The Dashboard”Marketing Metrics Development Income
2003Historical Marketing Metrics Actual Budget Actual Budget Actual Gross Corporate Sponsorship:% Paid Occupancy 81.30% 80.13% 74.93% 74.06% 73.08% Cash Inkind Total
Contracted 1,246,285 53,750 1,300,035 Average Ticket Price $47.01 $46.68 $62.52 $62.59 $48.41 Confirmed 110,000 Average Yield $18.20 $17.46 $14.70 $14.67 $13.50 Expected Renewal 50,000 (Net concert result/ paid attendees)Efficiency of campaign $3.60 $3.55 $4.60 $4.44 $4.39 Unsecured 222,468 (Single ticket income:$1 Marketing spent) 1,682,503
Donation and Special Event IncomePaid Seats Comps Perf # Paid Seats Comps Perf #
Self-present 21,842 1,736 14 34,362 4,130 22 Co-production attendees - - - 8,629 - 4 Orchestra hire attendees - - - 6,900 - 4 Free attendees - - - 70,000 - 1
Future Marketing Metrics (as at 5 April 2004)
Commercial Balance Sheet Overview and Cost per Call
Balance Sheet Overview 2004 2003Analysis of Commercial Income Call Usage YTD Year end
Cash 12,068,186 13,997,974 Other assets 1,590,772 1,170,659
Liabilities (9,416,053) (11,111,369)
Net Assets 4,242,906 4,057,264
Share Capital 250,002 250,002 Reserves 3,992,904 3,807,262
Total Shareholder's Equity 4,242,906 4,057,264
Target Reserves (20% of 2003A expenses) 4,850,587 4,850,587 Shortfall 607,681 793,323
Cost per Call
The Sydney Symphony is increasingly analysing the return per orchestral call on programs. In the management account format orchestral costs are not allocated to a program in the same way that funding revenue is not allocated. Instead management review the return on orchestral call usage.To put this metric into context it is important to understand the cost of one orchestral call.
The pie chart on the right includes an additional $70k net stretch target for the yearWith the available calls as demonstrated in the pie chart on the right the stretch target for the year of $800k is 2004 Budgetachievable. Total Orchestral Costs 10,750,015$ Current events in the pipeline amount to $755k compared to a budget of $730k Number of Orchestral Calls Available 293.5
Cost per Orchestral Call $ 36,627
March YTD
March Year to date
$410,657
$319,343
16.7
32.41
April Performances
Sales to achieve budget with x days remaining of the campaign
0
100
200
300
Katie Noonan (2 days) Magic Flute (10 days) DIS02 (15 days) MTM2 (23 days)
$'000
Sold Sales to achieve budget Budget exceeded
Net Donations and Special Events
0
50000
100000
150000
200000
250000
Jan Feb Mar Apr May Jun Jul Aug Sep Oct Nov Dec
Month
Net income $'s
Actual 2004
Budget 2004
Actual 2003
Split of Commercial Income
Actual Year
to Date Result
Stretch
Net Income to be
secured
Expected Net Income
from
Confirmed
Co-pros
Contracted
Net Income
Outer ring income
Inner ring calls
Earned
Unearned

Cost per Full Orchestral Call• Musicians work in 2-hour time slots – a call• Depending on their position in the orchestra a musician has a max
call count of between 260 and 300 calls per annum• Management have little ability to work the musicians beyond this
(exception being commercial work)• Some instruments will never reach their call ceiling• The strings however reach their call ceiling and thus represent the
key limiting factor• Therefore a full orchestral call represents a full string count of 16 1st
violins, 14 2nd violins, 12 violas, 10 cellos and 8 double basses• A program that requires instrumentation of 8:7:6:5:4 represents 0.5
of an orchestral call• Understanding the contribution per orchestral call of a program is
crucial in determining the profitability of various audience segments

Series Analysis
METRICS
2002 2003 2004
Incremental profit 84,346 115,149 110,053
Average Single Ticket Price $50.63 $53.73 $60.72price increase 6.13% 13.01%
Average Subscription Ticket Price $45.75 $49.44 $53.34price increase 8.07% 7.88%
Total Average Ticket Price $47.54 $51.02 $55.71
price increase 7.31% 9.21%Subscriptions vs Single tickets $'s 62% 60% 64%Occupancy 77% 82% 77%Number of FOC - 76.25 69.30 Average number of FOC per performance - 2.12 1.93 Contribution per FOC - $54,365.22 $57,170.32Net Contribution Percentage 42.7% 52.7% 50.0%
Number of Programs 14 14 14Number of Performances 36 36 36Performances per Program 2.6 2.6 2.6Single tix income per $ marketing spent $4.79 $4.91 $3.29
MASTERS & VEUVE SERIES
(80,000)(60,000)(40,000)(20,000)
020,00040,00060,00080,000
100,000120,000
2002 2003 2004
SINGLE TICKETS
SUBSCRIPTIONS
MARKETING
PRODUCTION
ARTISTS
METRICS
2002 2003 2004
Incremental profit 14,332 17,929 14,934
Average Single Ticket Price $50.80 $54.66 $63.43price increase 7.59% 16.04%
Average Subscription Ticket Price $50.25 $48.26 $52.28price increase (3.97%) 8.33%
Total Average Ticket Price $50.61 $52.75 $60.32price increase 4.23% 14.36%
Subscriptions vs Single tickets $'s 27% 26% 21%Occupancy 70% 65% 66%
Number of FOC - 22.57 30.25 Average number of FOC per performance - 2.26 2.52 Contribution per FOC - $7,943.91 $5,924.77Net Contribution Percentage 17.9% 20.1% 15.0%Number of Programs 5 5 5Number of Performances 8 10 12Performances per Program 1.6 2.0 2.4
Single tix income per $ marketing spent $5.58 $3.14 $4.17
MORGAN STANLEY MUSIC SERIES
-100000
-50000
0
50000
100000
150000
2002 2003 2004
SINGLE TICKETS
SUBSCRIPTIONS
MARKETING
PRODUCTION
ARTISTS

What’s Next?

'Sydney Sound'
Create a distinctive 'Sydney Sound' that is internationally recognised and respected
1 Wider Audience Feels 'Sense Of
Occasion'
Create a sense of occasion that resonates with wider audiences and is delivered through innovative packaging and production
2
Broad Relationships
Develop broader relationships to separate funding from ticket sales
3
Engaged People
Attract, develop and engage all of our people to deliver success
4
Whilst making sure we remain financially secure and meet our educational and artistic obligations to the governmentWhilst making sure we remain financially secure and meet our educational and artistic obligations to the government
Four Emerging Themes for Strategy 2004 - 2007
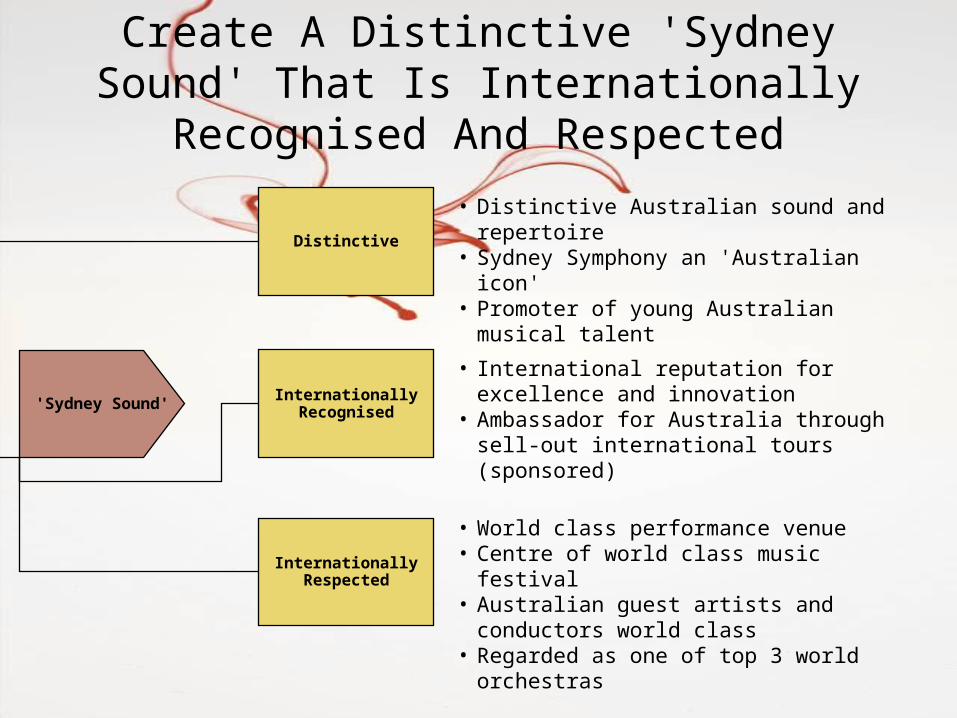
Create A Distinctive 'Sydney Sound' That Is Internationally Recognised And Respected
'Sydney Sound'
Distinctive
Internationally Recognised
Internationally Respected
• World class performance venue• Centre of world class music festival• Australian guest artists and conductors world
class• Regarded as one of top 3 world orchestras
• International reputation for excellence and innovation
• Ambassador for Australia through sell-out international tours (sponsored)
• Distinctive Australian sound and repertoire• Sydney Symphony an 'Australian icon'• Promoter of young Australian musical talent

Wider Audience Feels 'Sense Of
Occasion'
• Innovative use of electronic media to reach wider audience• Younger average age of subscribers & audience• International exposure through tours, recording and
multimedia• Range of affordable tickets• Expanded schools involvement• Range of venues across NSW, Australia and international
Accessible To Wider Audience
Wide Range Of Products
• Full-time education program with Sinfonia• Vibrant contemporary music program and chamber series• Quality and innovation of repertoire with good balance of
core, commercial and popular
Distinctive
• Well-recognised 'signature' events• Buying SSO ticket a cherished event• Every performance a major experience for the audience
• High client ticket demand and increasing subscriber numbers
• 'Orchestral musician' highly desirable career in Australia• Classical music as popular art form for the masses• GG as well known as Nicole Kidman in Australia• 'Part of the city's fabric'
Emotional Attachment
Create A Sense Of Occasion That Resonates With Wider Audiences
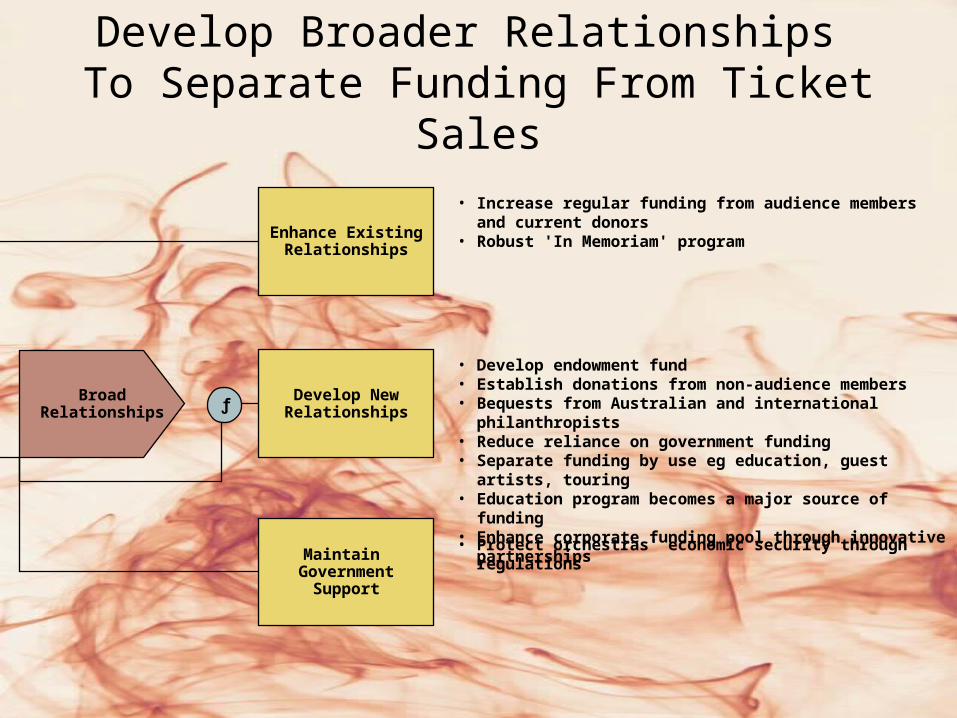
Develop Broader Relationships To Separate Funding From Ticket Sales
Broad Relationships
Enhance Existing Relationships
Develop New Relationships
Maintain Government
Support
ƒ
• Protect orchestras' economic security through regulations
• Develop endowment fund• Establish donations from non-audience members• Bequests from Australian and international philanthropists• Reduce reliance on government funding• Separate funding by use eg education, guest artists, touring• Education program becomes a major source of funding• Enhance corporate funding pool through innovative
partnerships
• Increase regular funding from audience members and current donors
• Robust 'In Memoriam' program

Attract, Develop And Engage All Of Our People To Deliver Success
Engaged People
Culture Of Excellence,
Innovation And Cooperation
Recognise Demands And
Provide Support
Provide Feedback And Development
• Recognition of achievement and effort• Opportunities for professional development of
musicians and admin staff• Peer support for development needs
• Flexibility of working environment
• Working together towards common goal• Recognition and appreciation of differing roles

Whilst Remaining Financially Secure And Meeting Our Educational And Artistic Obligations
To The GovernmentFinancial Security
• Reserves = 20% Opex• Government support
maintained• Sydney Symphony benefits
from significant relationships• Sydney Symphony continues
to offer imaginative and new opportunities for supporters
• Competitive employment conditions for musicians and admin staff
Educational Obligations
• Education programme must be retained
Artistic Obligations
• Retain Opera House as main venue
• No change to 'programme led recovery' strategy
• No change in numbers of players
• Maintain existing subscriber base
• Continue to attract world class conductors and soloists
• Maintain regional touring Key Questions:• Is Marketing Success sustainable?
- Existing growth has depended on pushing staff and supplier limits- Existing advertising costs are low due to successful bargaining, however, this
could fluctuate widely with economic factors
• Is there future growth in Commercial Events?- Key success factor is ability to be able to roster them

Questions