the synergy of science & statistics - statcon.de · the synergy of science & statistics...
TRANSCRIPT

© 2012 PRISM Training & Consultancy Ltd
The Synergy of Science & Statistics Helping Science Reach Its Full Potential
4th European DoE User Meeting 27th June 2012
Dr. Paul Nelson Technical Director, PRISM TC

© 2012 PRISM Training & Consultancy Ltd
Aim
Voice of the Customer
Project Manager
Analytical Scientist
Engineer
Operator
Scientist
Statistician Quality Engineer
© 2012 PRISM Training & Consultancy Ltd
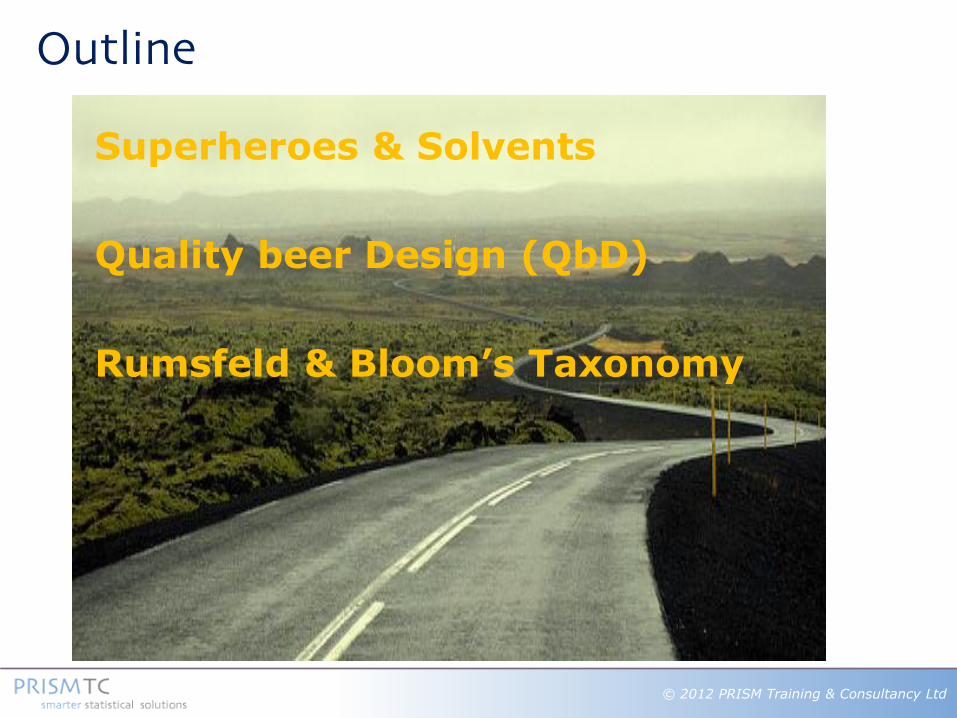
Outline
Superheroes & Solvents
Quality beer Design (QbD)
Rumsfeld & Bloom’s Taxonomy

© 2012 PRISM Training & Consultancy Ltd
Partnership
“These are the right data,
but not necessarily in the right order !”
& Lots of Data ≠ Information
Design & Data
HP Team, Technology & Process
© 2012 PRISM Training & Consultancy Ltd
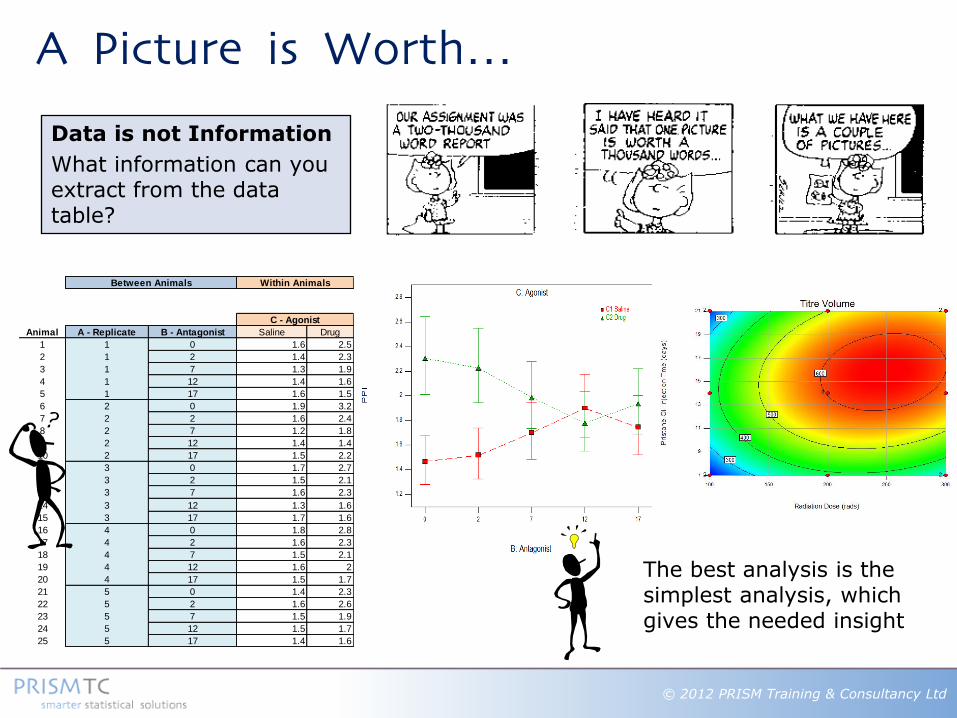
Animal A - Replicate B - Antagonist Saline Drug
1 1 0 1.6 2.5
2 1 2 1.4 2.3
3 1 7 1.3 1.9
4 1 12 1.4 1.6
5 1 17 1.6 1.5
6 2 0 1.9 3.2
7 2 2 1.6 2.4
8 2 7 1.2 1.8
9 2 12 1.4 1.4
10 2 17 1.5 2.2
11 3 0 1.7 2.7
12 3 2 1.5 2.1
13 3 7 1.6 2.3
14 3 12 1.3 1.6
15 3 17 1.7 1.6
16 4 0 1.8 2.8
17 4 2 1.6 2.3
18 4 7 1.5 2.1
19 4 12 1.6 2
20 4 17 1.5 1.7
21 5 0 1.4 2.3
22 5 2 1.6 2.6
23 5 7 1.5 1.9
24 5 12 1.5 1.7
25 5 17 1.4 1.6
Between Animals Within Animals
C - Agonist
A Picture is Worth…
Data is not Information
What information can you extract from the data table?
The best analysis is the simplest analysis, which gives the needed insight


© 2012 PRISM Training & Consultancy Ltd
Spiderman
Storm
Dr Octopus
Green Goblin
Venom
Mysterio
The Beast
Professor X
Mr Fantastic
The Thing
The Human Torch
Dr Doom
Silver Surfer
Dr Strange
Electra
Invisible Woman
Blade
Captain America
Iron Man
Thor
Hawkeye
Black Panther
Black Widow
Ghost Rider
Juggernaut
Nick Fury
Iceman
Magneto
Kingpin
Apocalypse
Superhero Soccer ‘Superhero HPT’

© 2012 PRISM Training & Consultancy Ltd
Data is not Information:
What information can you extract from the data table?
Convert Tables to Plots Human pattern recognition can now identify patterns
‘Superhero HPT’
Superhero Soccer
Superhero Map Navigational Aid

© 2012 PRISM Training & Consultancy Ltd
Obsnum Enviro Solvent Type mp bp dielectric dipole refind ET30 density logp watersol
01 Hi 1-Butanol Alcohol -88.6 117.7 17.51 5.8 1.3993 0.6 0.8098 0.88 0.125
02 Hi 1-Propanol Alcohol -126.2 97.15 20.45 5.5 1.3856 0.62 0.804 0.25 1.126
03 Hi 2-Propanol Alcohol -88 82.2 19.92 5.5 1.3772 0.55 0.786 0.05 1.117
04 Hi 2-Butanol Alcohol -114.7 99.5 16.56 5.5 1.3971 0.51 0.808 0.61 0.176
05 Un 2-Methoxyethanol Alcohol -85.1 124.6 16.93 6.8 1.4021 0.67 0.965 -0.77 1.103
06 Un 2-Pentanol Alcohol -73 119 13.71 5.5 1.4064 0.49 0.81 1.19 -0.612
07 Un 3-Methyl-1-butanol Alcohol -117.2 130.5 15.19 6.1 1.4072 0.57 0.8092 1.22 -0.518
08 Un Benzyl alcohol Alcohol -15.3 205.45 13.1 5.5 1.5404 0.61 1.042 1.1 -0.992
09 Un Cyclohexanol Alcohol 25.25 161.1 15 6.2 1.4648 0.5 0.9642 1.23 -0.755
10 Hi Diethylene glycol Alcohol -7.8 245.7 31.69 7.7 1.4475 0.71 1.109 -1.51
11 Hi Ethanol Alcohol -114.5 78.3 24.55 5.8 1.3614 0.65 0.785 -0.31 1.231
12 Hi Methanol Alcohol -97.7 64.5 32.66 5.5 1.3284 0.76 0.7914 -0.77 1.393
13 Un Triethylene glycol Alcohol -4.3 288 23.69 10 1.4558 0.7 1.125 -1.33 0.852
14 Un Water Alcohol 0 100 78.3 5.9 1.333 1 0.9282 -1.38 1.774
15 Lo Cyclohexane Alkanes 6.7 80.7 2.02 0 1.4262 0.01 0.778 3.44 -3.069
16 Lo Hexane Alkanes -95.3 68.7 1.88 0 1.3749 0.01 0.66 3.98 -3.359
17 Un n -Pentane Alkanes -129.7 36.1 1.84 0 1.3575 0.01 0.6262 3.39 -3.129
18 Me Toluene Aromatic -95 110.6 2.38 1 1.4969 0.1 0.867 2.73 -1.747
19 Un Fluorobenzene Aromatic -42.2 84.7 5.42 4.9 1.4684 0.19 1.023 2.27 -1.797
20 Un Piperidine Basics -10.5 106.7 5.8 4 1.4525 0.15 0.861 0.85
21 Me Pyridine Basics -41.55 115.25 12.91 7.9 1.5102 0.3 0.982 0.65 1.094
22 Un Quinoline Basics -14.85 237.1 8.95 7.3 1.6273 0.27 1.093 2.03
23 Un Tributylamine Basics -70 214 2.6 1.4291 0.04 0.7771 4.56 -3.116
24 Me Triethylamine Basics -114.7 88.9 2.42 2.9 1.401 0.04 0.7275 1.45 0.224
25 Un 1,2-Dichloroethane Chlorinated -35.7 83.5 10.7 6.1 1.4448 0.33 1.235 1.48 -1.092
26 Un Chlorobenzene Chlorinated -45.6 131.7 5.62 5.4 1.5248 0.19 1.106 2.84 -2.45
27 Un Chloroform Chlorinated -63.15 61.2 4.81 3.8 1.4459 0.26 1.48 1.97 -1.246
28 Hi Dichloromethane Chlorinated -94.9 39.6 8.93 5.2 1.4242 0.31 1.33 1.25 -0.699
29 Un cis -Decalin Chlorinated -43 195.8 2.2 0 1.481 0.02 0.8965 5.08 -5.192
30 Me Ethyl acetate Esters -83.55 77.1 6.02 6.1 1.3724 0.23 0.9 0.73 -0.041
Solvent Selection: PCA As with the Superheroes dataset, a Principal Components Analysis can be used to reduce the dimensionality of a Solvents dataset to 3 variables:
PC1 PC2 PC3
0.1223 -0.5478 -0.6731
0.1827 -0.8059 -0.5273
0.1851 -0.7619 -0.5236
0.0581 -0.6724 -0.4907
0.3826 -0.5166 -0.3058
0.0007 -0.4303 -0.6485
0.0307 -0.5392 -0.677
0.1896 0.3877 -0.5335
0.1832 0.1877 -0.5797
0.7403 0.1097 -0.7094
0.2561 -0.9099 -0.5457
0.364 -1 -0.6148
0.7405 0.2679 -0.8199
0.7641 -0.607 -0.7912
-0.786 -0.037 -0.4575
-0.9843 -0.5399 -0.6614
-1 -0.8077 -0.5534
-0.6333 -0.1214 -0.1017
-0.2796 -0.0101 0.1906
-0.1993 -0.0826 -0.2721
0.2088 -0.0589 0.0965
0.1088 0.8027 -0.2521
-0.7581 0.0722 -1
-0.488 -0.6761 -0.2877
0.0259 -0.0138 0.4528
-0.2875 0.3084 0.1775
-0.1808 -0.0036 1
-0.0476 -0.3065 0.9004
-0.9387 0.4213 -0.7062
-0.1067 -0.5805 -0.0167
PCA
45 Solvents: 9 characteristics:
• mp – melting point
• bp – boiling point
• dielec – dieletric constant
• dipole – dipole moment
• refind – refractive index
• ET30 – empirical polarity parameter
• density
• logp – log octanol-water partition coefficient (lipophilicity)
• watersol – water solubility

© 2012 PRISM Training & Consultancy Ltd
Solvent Selection: Create Candidate List The Historical Data tool can be used to load the Principal Component scores into Design Expert.
Once the PC scores have been pasted into the software, a Candidate List can easily be created:

© 2012 PRISM Training & Consultancy Ltd
Solvent Selection: Optimal Design Design Expert’s Optimal design tool can be used to fit the required model.
To ensure the design only uses our available solvents, we use the Candidate List we created earlier.
For example, we might want to investigate Yield, Impurity and Starting Material. We’ll choose to run 15 reactions to fit a quadratic model.

© 2012 PRISM Training & Consultancy Ltd
Solvent Selection: Review Design We allow the software to select the best solvents to optimally cover our design space:
Full dataset (45 Solvents)
Optimal selection of solvents

© 2012 PRISM Training & Consultancy Ltd
Solvent Selection: Analyse Responses After running the reactions, we use Design Expert to analyse the responses and find predicted optimal PC scores.
Overlay of Design Points, colour-coded by Yield

© 2012 PRISM Training & Consultancy Ltd
Solvent Selection: Find Optimal Solvents We then use our own PCA 3D Visualiser tool to find the closest solvents to the predicted optimal PC scores.
The PCA 3D Visualiser is preloaded with the Solvents and Superheroes datasets, but you can also import and visualise any PCA dataset of your choice! It is available free of charge here
© 2012 PRISM Training & Consultancy Ltd
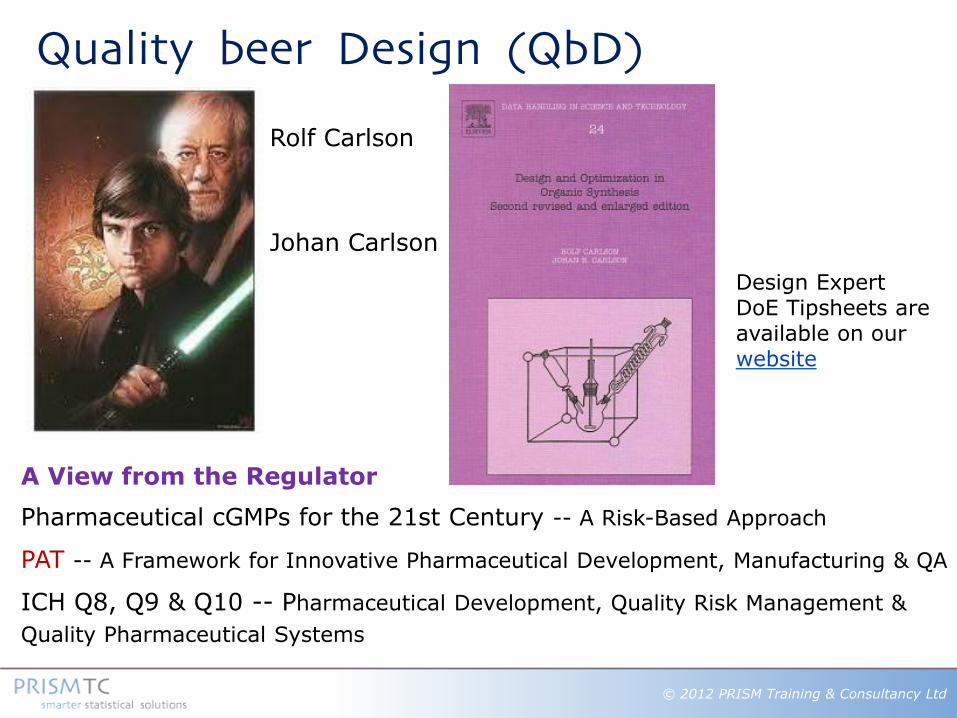
Quality beer Design (QbD)
Pharmaceutical cGMPs for the 21st Century -- A Risk-Based Approach
PAT -- A Framework for Innovative Pharmaceutical Development, Manufacturing & QA
ICH Q8, Q9 & Q10 -- Pharmaceutical Development, Quality Risk Management &
Quality Pharmaceutical Systems
A View from the Regulator
Rolf Carlson
Johan Carlson
Design Expert DoE Tipsheets are available on our website

© 2012 PRISM Training & Consultancy Ltd
Experimental Space Understanding
Screen Optimise Scope
Temp Sto
ichio
metr
y
Select
Solvent
Substr
ate
Reaction Space
Robust/Verify
Quality beer Design (QbD) Design Space Confidence
Fit for Purpose work packages

© 2012 PRISM Training & Consultancy Ltd
6 ºC ± 0.5 (SD = 1/6)
Quality Risk Assessment via simulation in case further adjustments needed to the Control Strategy
Addition Rates
Reaction Time 2.1 eq ±0.1 (SD = 0.2/6)
Quality beer Design (QbD)
6.65 vol ±0.2 (SD = 0.4/6)
2.9 vol ± 0.1 (SD = 0.2/6)

© 2012 PRISM Training & Consultancy Ltd
Quality beer Design (QbD) Quality Risk Assessment via simulation in case further adjustments needed to the Control Strategy
60
HighLow
Z.Bench = 6.17
100.3599.9099.4599.0098.5598.1097.65
LSL
Actual (overall) capability is what the customer experiences.
spec limits.
percentage of parts from the process that are outside the
-- The defect rate is 0.00%, which estimates the
Conclusions
Upper Spec *
Target *
Lower Spec 97.5
Customer Requirements
Mean 99.487
Standard deviation 0.32195
Actual (overall) capability
Pp *
Ppk 2.06
Z.Bench 6.17
% Out of spec 0.00
PPM (DPMO) 0
Process Characterization
Actual (overall) Capability
Are the data above the limit?
Comments
Capability Analysis for Product Yield %
Summary Report
How capable is the process?

© 2012 PRISM Training & Consultancy Ltd
Fit for Purpose?
Define
Measure & Analyse
Control
Improve
Quality beer Design (QbD) Biphasic alcohol-mediated gaseous
entrapment system

© 2012 PRISM Training & Consultancy Ltd
Method
Pour beer (330ml), into a
500ml plastic container
Dispense Time 30sec
Glass Angle 45 degrees
Pour Height 60mm
Temperature Ambient
Operator Novice
Beer Supplier Stella
Result
Head of foam = 34mm
Target
Head of foam = 15-25mm
Quality beer Design (QbD) No alcohol was consumed during the execution of these experiments

© 2012 PRISM Training & Consultancy Ltd
Quality beer Design (QbD)
Professional
Glass Angle: 45º – 90º
Pour Height: 0 – 60 mm
Irregularly Shaped
Region
(45, 10)
(75, 60)
(90, 30)
Two vertices which simply won’t work!

© 2012 PRISM Training & Consultancy Ltd
Rumsfeld & Bloom’s Taxonomy
“There are known knowns; there are things we know that we know.
There are known unknowns; that is to say there are things that, we now know we don't know.
But there are also unknown unknowns – there are things we do not know, we don't know.” United States Secretary of Defence, Donald Rumsfeld February 12, 2002

© 2012 PRISM Training & Consultancy Ltd
There are Known Knowns...
One Way Mean 1, 1
Treatment 10, 9
(Error) 50, 40

© 2012 PRISM Training & Consultancy Ltd
There are Known Unknowns...
Two Way Mean 1, 1
Treatment 10, 9
(Box) 5, 4
(Error)=Tmt x Box 50, 36

© 2012 PRISM Training & Consultancy Ltd
Three Way Mean 1, 1
(Box) 5, 4
Antag. 5, 4
Agonist 2, 1
(Error)=V x F x B 50, 16
(B x Ag) 10, 4
(B x An) 25, 16
An x Ag 10, 4
But there are also Unknown Knowns...

© 2012 PRISM Training & Consultancy Ltd
Split Plot Mean 1, 1
(Box) 5, 4
Antag. 5, 4
Agonist 2, 1
(Error)=V x F x B 50, 16
(B x Ag) 10, 4
(B x An) 25, 16
An x Ag 10, 4
But there are also Unknown Unknowns...

© 2012 PRISM Training & Consultancy Ltd
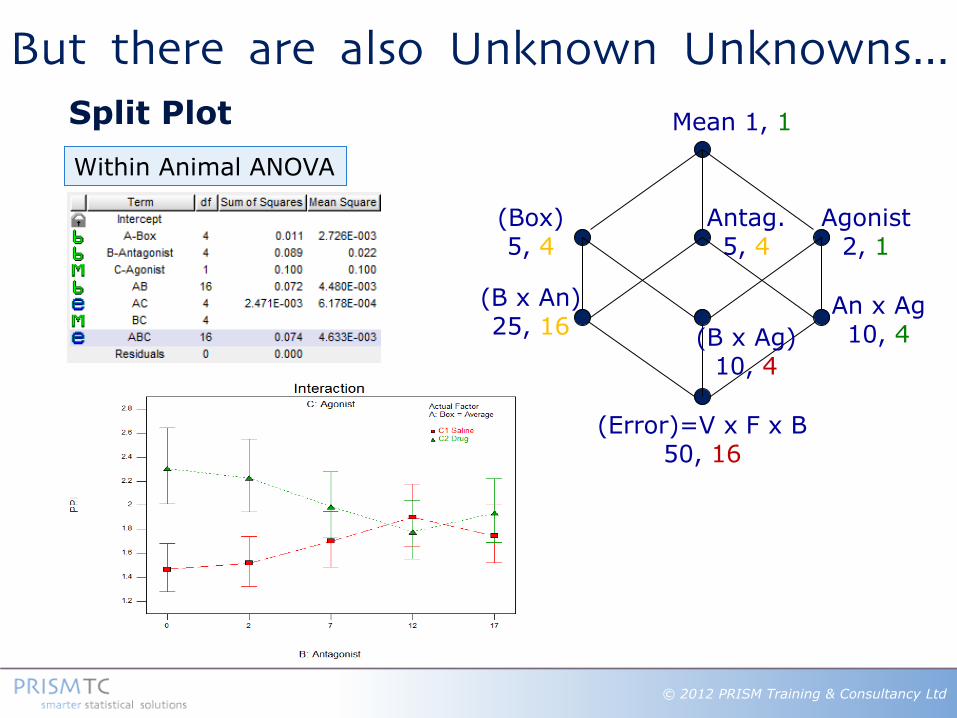
Split Plot
Between Animal ANOVA
Mean 1, 1
(Box) 5, 4
Antag. 5, 4
Agonist 2, 1
(Error)=V x F x B 50, 16
(B x Ag) 10, 4
(B x An) 25, 16
An x Ag 10, 4
But there are also Unknown Unknowns...
© 2012 PRISM Training & Consultancy Ltd
Split Plot
Within Animal ANOVA
Mean 1, 1
(Box) 5, 4
Antag. 5, 4
Agonist 2, 1
(Error)=V x F x B 50, 16
(B x Ag) 10, 4
(B x An) 25, 16
An x Ag 10, 4
But there are also Unknown Unknowns...

© 2012 PRISM Training & Consultancy Ltd
Unconscious
Conscious
Incompetent Competent
Consciousness
The 4 stages of competence
Bloom’s Taxonomy
© 2012 PRISM Training & Consultancy Ltd
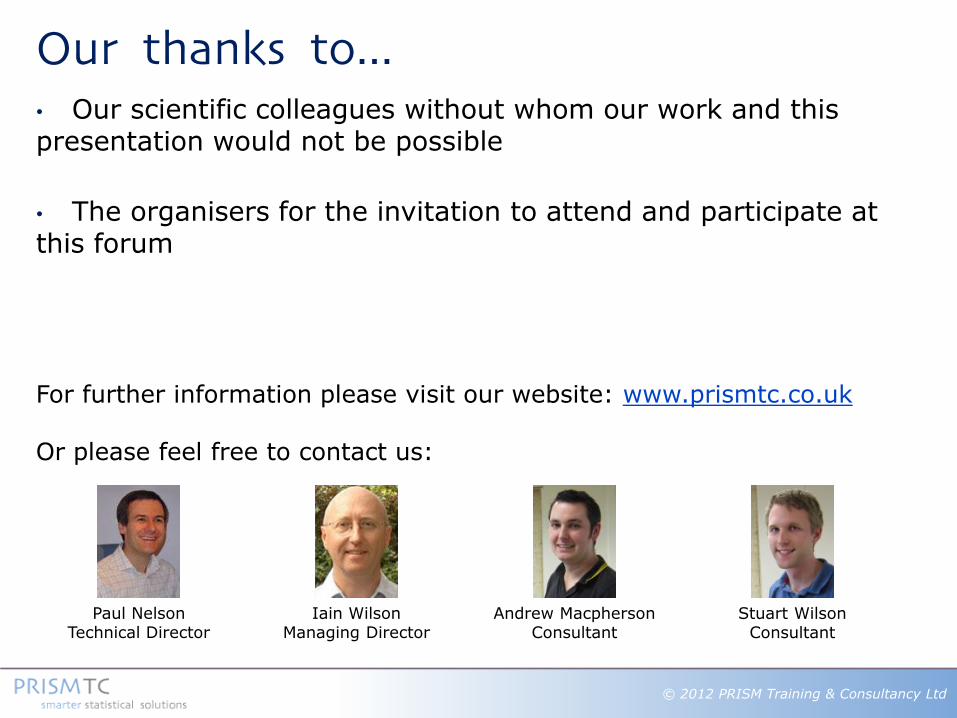
• Our scientific colleagues without whom our work and this presentation would not be possible
• The organisers for the invitation to attend and participate at this forum
Our thanks to...
For further information please visit our website: www.prismtc.co.uk Or please feel free to contact us:
Paul Nelson Technical Director
Iain Wilson Managing Director
Andrew Macpherson Consultant
Stuart Wilson Consultant