the timeliness of uk private company financial reporting: regulatory
TRANSCRIPT

School of Economics, Finance and Management University of Bristol 8 Woodland Road Bristol BS8 1TN United Kingdom
THE TIMELINESS OF UK PRIVATE
COMPANY FINANCIAL REPORTING: REGULATORY AND ECONOMIC
INFLUENCES
Mark A. Clatworthy and Michael J. Peel
Accounting and Finance Discussion Paper 16 / 3
16 March 2016

Electronic copy available at: http://ssrn.com/abstract=2433962
The Timeliness of UK Private Company Financial Reporting: Regulatory and Economic
Influences
Mark A. Clatworthy†
Department of Accounting and Finance
School of Economics, Finance and Management
University of Bristol
8 Woodland Road
Bristol
BS8 1TN
UK
Michael J. Peel
Cardiff Business School
Cardiff University
Aberconway Building
Colum Drive
Cardiff
CF10 3EU
UK
†Address for correspondence: Mark Clatworthy, Department of Accounting and Finance, School of Economics,
Finance and Management, University of Bristol, Bristol, BS8 1TN, UK, Tel. +44(0)117 33 10914, E-mail:
We are grateful to Joachim Gassen, Katherine Schipper, seminar participants at the University of Bath, University of
Edinburgh, HEC Paris, KU Leuven, the University of Warwick, Queen’s University Belfast, the London School of
Economics, the X Spanish Workshop in Empirical Research in Financial Accounting and the Financial Reporting
and Business Communication, BAFA and EAA annual conferences for helpful comments on earlier versions of this
paper. We also thank Natasha Stone for excellent research assistance.
Electronic copy available at: http://ssrn.com/abstract=2433962
The Timeliness of UK Private Company Financial Reporting: Regulatory and Economic
Influences
Abstract
This paper investigates the effects of both regulation and economic demand on the timeliness of UK
private companies’ accounting information. We study companies’ response to a one-month shortening of
the statutory filing deadline and hypothesise that companies using accounting to communicate financial
information to outside capital providers will be timelier in filing their accounts and less affected by the
regulatory change than firms preparing accounts for tax and compliance purposes. Our results indicate that
companies producing accounting information for reporting to outside investors publish their accounts
significantly more quickly than those filing for compliance/tax reasons, though the change in regulation
significantly affects both types of companies. We find a reduction in the average filing time, though the
proportion of firms filing late increases after the regulatory change. In addition to incurring financial and
non-financial penalties, filing after the statutory limit has important economic consequences because our
results show that firms filing late have significantly lower credit ratings. We conclude that both regulatory
and fundamental factors are important in private company financial reporting and that the two are
sometimes interdependent.
The Timeliness of UK Private Company Financial Reporting: Regulatory and Economic
Influences
1. Introduction
This paper provides new evidence on the timeliness with which UK private companies publish their
annual financial statements and examines the influence of regulation and fundamental economic factors on
accounting.1 Timeliness is a central qualitative characteristic of accounting and is a fundamental element
of the relevance of financial reporting information. We study an important regulatory change where the
UK Companies Act shortened from 10 to 9 months the time permitted for private firms to file their
accounts. We examine the impact of regulation on companies where accounting information is produced
for financial reporting to outsiders compared with companies where financial statements are prepared for
tax/regulatory compliance purposes. As well as representing an assessment of the impact of an important
specific change in the UK legislation, our study aims to address the important question of the relative roles
of regulation and fundamental economic demand for information from outsiders in influencing corporate
financial reporting (Ball, 2008).
Although prior research documents that private companies have lower accounting quality compared
with their public counterparts due to a lack of demand for information (e.g. Ball and Shivakumar, 2005;
Burgstahler et al., 2006; Hope et al., 2013), it is unlikely that demand and incentives for financial
reporting in the private corporate sector are universally low. We argue that private companies’ accounting
data is not likely to be uniformly uninformative. Many public companies start life as private and even if
they remain private, they often need to attract significant levels of outside capital (e.g. Brav, 2009). Where
capital is raised externally, it is likely that accounting information will be useful for reducing information
asymmetries between private firms and their investors. The timelier the publication of such information,
the higher is its utility to external users (Feltham, 1972). For example, several studies show that outsiders
rely on the financial statements of private firms for debt contracting purposes (Peek et al., 2010; Niskanen
and Niskanen, 2004) and for the provision of trade credit (Collis et al., 2004). In a recent survey, Collis et
al. (2013) find that the timing with which small UK private firms file their accounts is an important
1 Note that our focus is on financial reporting timeliness and not on timely loss recognition as in Basu (1997) and
Ball and Shivakumar (2005). There may be areas where these two constructs are related because the same forces that
create a demand for timely loss recognition may be responsible for timely filing of the accounts containing this
information. The focus of our study is on when companies publish their accounting information, regardless of
whether this incorporates good or bad news.
2
consideration for trade creditors. Furthermore, private firms have been found to voluntarily employ
external auditors where agency costs are high and/or when they plan to raise outside finance (Collis et al.,
2004; Dedman et al., 2014). Accordingly, accounting transparency significantly enhances private
companies’ likelihood of attracting external capital and private firms appointing auditors face fewer
financing constraints (Hope et al., 2011).
Notwithstanding these findings, regulation is an important feature of the accounting environment,
even in circumstances where demand for accounting information is strong (Leuz, 2011).2 Moreover, rather
than to serve the demand from providers of external capital, private companies may prepare financial
statements largely for corporate taxation purposes (Garrod et al., 2008; Szczesny and Valentincic, 2013).
If this holds, the relevance of information for financial reporting to outside investors (such as banks, trade
creditors and shareholders) is limited (Ball and Shivakumar, 2005). We contend, therefore, that companies
using accounting for financial reporting purposes will publish their financial statements more quickly and
will be less affected by regulatory filing stipulations than those preparing accounts predominantly for tax
purposes and/or to comply with regulatory deadlines resulting from limited liability status.
We analyse reporting timeliness for a sample of 31,147 small UK private independent companies
surrounding the shortening of the filing deadline by one month and employ two proxies for the economic
demand for accounting information for external reporting purposes. First, we identify companies that opt
to have their accounts audited (all firms in our sample are exempt from mandatory audit). Auditors’
independent verification of financial reporting information enhances its credibility - either directly through
the audit process (Clatworthy and Peel, 2013), or via signaling (Chi et al., 2013, Hope et al., 2011). Even
though an audit should, ceteris paribus, increase the reporting lag (the number of days it takes companies
to publish their accounts after their year end), we expect audited firms to file more quickly to meet the
demand for higher quality information from external providers of finance that has manifested itself in the
voluntary appointment of an auditor.
Second, we examine whether companies have a non-zero deferred tax liability recorded in their
balance sheet. This measure is used to capture the extent of the alignment between the financial reporting
and tax roles of the information companies prepare. Where there is a perfect alignment between tax and
financial reporting, the balance on the deferred tax account is zero by definition. If there is a misalignment
2 Though see Hirshleifer (1971) for examples of conditions where information has no social value.

3
(disclosure of liability for deferred tax), we hypothesise that firms will have stronger incentives to publish
their accounts on a timelier basis to meet external demand for informative financial reporting information.
We study the effects of regulation and the demand for accounting information on: (i) financial
reporting lags; (ii) the likelihood of firms filing accounts after the statutory deadline under two reporting
regimes; and (iii) the annual change in reporting lags. Due to the lower general demand for private
companies’ accounting information found in previous research, we expect that the effects of the regulation
on reporting behaviour will be substantive. For companies with stronger economic demand for accounting
information, we hypothesise that they will publish their accounts more quickly, will be less likely to
publish their accounts after the statutory deadline, and will be less likely to change their reporting lags in
response to the shortening of the statutory deadline. Finally, in order to study the economic consequences
of timeliness, we investigate whether reporting lags and late filing influence credit ratings. Because prior
research shows that creditors are concerned about the timely availability of accounting information for
their decisions (Collis et al., 2013), we expect credit rating agencies to incorporate this information when
supplying ratings for private companies.
We find that regulation exerts a significant influence over when UK private companies publish their
accounts. The one month reduction in the reporting deadline affects reporting timeliness for a substantial
proportion of companies, resulting in a mean reduction in the filing time of around one week. However,
the reduction is particularly pronounced for firms identified as being most at risk of filing late based on
their reporting lags prior to the regulatory change. Moreover, the new filing regime also led to a
significant increase in the proportion of firms filing late. We find that companies producing accounting for
financial reporting purposes (those with audited accounts auditor and/or with lower tax alignment) exhibit
significantly shorter reporting lags and are less likely to file their accounts late. However, on average,
there is no evidence to support our hypotheses that these companies will be less affected by the regulatory
change.
Our results are robust to the use of a number of different estimation methods, including robust
(Huber) regression, median (least absolute deviation) regression, count (median) regression and matching
estimators. Overall we conclude that regulatory influence over private companies’ accounting reporting
practices is strong, though accounting still fulfils an important economic role for some private companies,
as reflected in timelier publication of their accounts. We also find that late filing impacts adversely on
4
credit scores, indicating that failing to meet regulatory reporting requirements can result in economic
consequences in addition to the financial penalties imposed by the legislation.
Our paper makes a number of important contributions. First, it provides valuable evidence on the
effects of regulatory and capital market influences in an environment where demand for accounting
information is reported to be low compared to public companies (Ball and Shivakumar, 2005; Burgstahler
et al., 2006; Hope et al., 2013). This evidence helps inform the debate about the influence of regulation
versus the market over accounting (Ball, 2008). Second, we conduct the first comprehensive study of UK
private company financial reporting timeliness. Very little is known about accounting in this sector, yet
private firms constitute a major share of the UK’s production capacity (Brav, 2009). As Hopwood (2000)
notes, private company financial reporting can often differ significantly from public quoted companies’
reporting due to differences in sources of capital and availability of alternative sources of information. In
contrast to public quoted firms, where filing times are relatively short and compliance levels are around
100% (e.g. Owusu-Ansah, 2000; Leventis and Weetman, 2004), there is significant variation in reporting
lags for private firms. For instance, the shortest statutory limit for publication is nine months, yet we find
that a non-trivial proportion (around 10%) of private firms file after the deadline and incur statutory
penalties. Third, our finding that late filing is associated with lower credit is ratings is important,
demonstrating that delay in filing accounts also has direct economic consequences for firms in the private
corporate sector. Hence, as well as being of regulatory and academic interest, our findings are also
important to the owners of, and professional advisors to, private companies.
The next section outlines the UK private company regulatory regime, discusses relevant prior
literature and sets out our research questions and hypotheses. Section 3 describes our data and methods,
while our empirical results are presented in Section 4. The paper concludes in Section 5 with a discussion
of our findings, limitations and suggestions for further research.
2. Regulatory background, prior literature and hypotheses
Since the 1978 Fourth EEC Directive, all limited companies of European member states have been
required to produce annual accounts and file them at a central registry for public inspection. In the UK the
repository is Companies House (CH) which is also responsible for regulatory compliance (including late
filing) under the Companies Act. All UK companies are required to file their accounts at CH, at which
5
stage they are available for inspection (i.e., are published for anyone to view online). The current legal
requirements are contained in the 2006 Companies Act, which represented a major overhaul of UK
company law by updating its 1985 predecessor. The main feature of interest to our study is that the
deadline for filing accounts was shortened from 10 to 9 months for private companies with financial years
beginning on or after 6th April 2008.3
The UK regulation creates strong incentives for companies to publish their annual accounts before
the statutory deadline by imposing material financial penalties for accounts delivered late. For example,
under the new 9 month reporting regime, a maximum penalty of £1,500 is levied for accounts filed more
than 6 months late and these penalties are doubled in cases where the accounts are filed late in two
consecutive years. Directors responsible for late filing may be prosecuted and subject to a maximum fine
of £5,000, together with a daily £500 fine for continuing non-compliance. They may also be disqualified
from being a director, or action may be taken against them by their company, where they fail to adhere to
legislation relating to the filing and content of company accounts4 (Green and Santilale, 2009). The
regulations and penalties for late filings are consistent with financial reporting timeliness being viewed (at
least by regulators) as an important characteristic in the functioning of private and public capital markets.
It has long been recognised that accounting information should be timely for it to have utility for
financial decision makers. The second Concepts Statement of the US Financial Accounting Standards
Board (FASB, 1980) includes timeliness as one of the three components of primary decision-specific
quality and relevance. It states (para. 56) that ‘If information is not available when it is needed or
becomes available only so long after the reported events that it has no value for future action, it lacks
relevance and is of little or no use.’ In the UK, as pointed out by Davies et al. (1999, p. 86), the Corporate
Report of the then Accounting Standards Steering Committee stated that, in order to fulfil their primary
objective and be useful, corporate reports should be ‘relevant, understandable, reliable, complete, timely
and comparable’.5
3 The new regulation also shortened the reporting deadline for public companies from 7 to 6 months.
4 Late filing may of course lead to a loss of reputation and may be a signal of financial distress, potentially affecting
credit ratings (see Section 5.6). In particular, every UK company has an electronic record at CH which can be easily
accessed at no cost using the CH website. Each record gives the date of the company’s accounting year-end and the
maximum permitted filing date to comply with the statutory deadline. If a company fails to file on time, CH indicates
that the accounts are overdue on the company’s record, which is then available for public viewing. 5 Although timeliness is perceived as important, it is not an overriding objective of financial reporting due to the
potential trade-off between the timeliness of information and its quality (FASB, 1980; Suphap, 2004). .
6
Despite its importance, there have been relatively few systematic theoretical analyses of corporate
financial reporting timeliness.6 Feltham (1972) demonstrated that an information system having a shorter
reporting delay than another is more informative, as long as both systems ultimately report the same
information. The latter condition is of course crucial, since it implies that the reliability of information is
constant irrespective of its timeliness. Furthermore, there may be a cost-benefit trade-off in the production
of timely information. As Feltham (1972, p. 111) points out, ‘Decreases in delay often require additional
personnel and equipment, or more expensive equipment. Costs tend to increase as delay is decreased and
the objective of obtaining information “as quickly as possible” loses its desirability. The value of
decreasing delay and cost of decreasing delay must be balanced’. Our research design and hypotheses are
formulated to examine questions relating to the forces acting on firms to incur the incremental costs
involved in producing timely accounting information and, in particular, whether firms are induced to bear
these costs in response to regulatory or demand for the information from outside providers of capital.
2.2 Regulatory Influences
Leuz (2010) provides a number of reasons why regulation of corporate financial reporting can be
beneficial, including the production of economy-wide cost savings such as enhanced comparability and
reduced contracting costs. Leuz (2010) and Leuz and Wysocki (2008) also stress that agency problems,
such as the consumption of private benefits by corporate insiders, can lead to social costs because other
firms may be limited in their ability to exploit opportunities. Hence, mandating disclosure can help reduce
these costs, partially through increasing transparency and making consumption of private benefits harder.
In this context, imposing maximum permitted delays in publication of accounts can aid outsiders to assess
the extent of this problem and to exercise control rights at the appropriate time. Continued delay may
cause information to have zero utility for decision making (Bromwich, 1992)7 and untimely information
disclosure may result in misallocation of capital where outside equity investors and creditors face adverse
6 During the preparation of this paper, we became aware of an independent working paper (unavailable online), by
Luypaert et al. (2013), which investigates the factors associated with the delay with which Belgian small firms file
their accounts; however, Luypaert et al. (2013) do not examine the impact of regulatory changes, book/tax alignment,
not do they test the hypotheses formulated in this study or examine credit ratings. 7 Though Bromwich (1992) also points out that timeliness is not always deemed an ‘absolute’ characteristic from an
information economics perspective. This only occurs where a decision conditioned upon early access to information
yields greater welfare to the decision-maker than late access.
7
selection and moral hazard problems (Leventis and Weetman, 2004). In the UK, the mandatory (and
timely) disclosure of accounting information is perceived to be the price of limited liability.
In reducing the late filing deadline by one month, the Regulatory Impact Assessment (RIA, 2007, p.
35) stated that the reduction was ‘in order to reflect improvements in technology and the increased rate at
which information becomes out of date’. Given the costs and penalties associated with late filing described
above, we expect regulatory filing limits to substantially influence the filing behaviour of private firms.
Our first hypothesis is therefore:
H1: Financial reporting timeliness will be affected by regulatory filing deadlines
2.3 The influence of economic demand for accounting information
2.3.1 Voluntary auditor appointments
The primary theoretical argument for economic demand affecting financial reporting timeliness is that
accounting information helps to resolve information asymmetries between companies and their investors
(e.g. Beyer et al., 2010). Private companies are, by their very nature, less widely held than public ones,
with a large proportion of their finance being in the form of debt and short term credit facilities (e.g. Brav,
2009, Collis et al., 2013). Even though it is sometimes argued that private firms may face few (or no)
agency problems (e.g. Szczesny and Valentincic, 2013), Peek et al. (2010) find that lenders and creditors
rely on financial statement data for contracting and to assess the status of their claims (see also Leftwich,
1983). Collis (2008) also reports survey evidence showing that UK private companies regard banks and
creditors as among the most important recipients of their financial statements. Hence, even for private
firms, where ownership and control is often not separate, timely reporting may be important to outside
creditors, because like timely loss recognition, it can influence the speed with which contingent control
rights are exercised8 (Ball and Shivakumar, 2005).
If the demand for accounting information from outside investors is strong, then we expect
regulatory deadlines to have less influence over reporting timeliness. For example, private companies’
financial reporting data are used by banks both for ex ante lending decisions and for monitoring firms’
performance ex post (Brav, 2009; Collis, 2008). In the latter circumstances, it is likely that a 10 month
8 This is particularly important, given that contractual terms written on accounting information cause control to shift
from managers to lenders in order to limit actions such as dividend payouts and further borrowing (Armstrong et al.,
2010).
8
filing delay (which is within the regulatory deadline for the first year of our study) will be unsatisfactory
to lenders, so that the firms’ accounting system will be more responsive to investors’ needs, rather than
being determined by statutory deadlines.
We measure firms’ reliance on accounting for financial reporting to investors using two measures.
The first is whether the company voluntarily appointed an auditor. As shown by Collis et al. (2004) and
Dedman et al. (2014), UK firms are more likely to employ an external auditor when agency problems are
more pronounced, and when they are seeking outside finance. Evidence from the US (Allee and Yohn,
2009), also demonstrates that small private firms who voluntarily appoint auditors are less likely to be
denied loan capital and those that do are charged a lower interest rate on debt compared to their unaudited
counterparts (Blackwell et al., 1998).9
None of the companies in our sample are required to appoint an external auditor, so their
commitment to improving the reliability of their accounting information via appointing an auditor is likely
to reflect an economic role for financial reporting (e.g. Van Tendeloo and Vanstraelen, 2008). Although
companies may also choose to appoint an auditor to deal with increased organizational complexity (Abdel-
Khalik, 1993), we expect higher quality (audited) accounting information voluntarily produced to meet
external economic demand for credible information (Hope et al., 2011) to be published quicker. We also
expect the reporting lags of firms having voluntary audits to be less affected by the regulatory change than
their unaudited counterparts. Specifically, firms that have gone to the trouble and cost of appointing
auditors to produce higher quality, credible information (Hope et al., 2011, Chi et al. 2013) are expected to
publish more quickly irrespective of the regulatory regime in place. Our hypotheses are therefore:
H2a: Companies with audited accounts will file more quickly than firms with unaudited accounts
H2b: The timeliness of reporting of companies with audited accounts will be less affected by the reduction
in the statutory filing deadline than unaudited companies
In our empirical analysis, it is important to note that hypothesis H2a is conservative because ceteris
paribus, additional time is required to conduct an audit. For instance, assume that audited firms report x
days quicker than unaudited firms on average. If the mean duration of an audit is y days, then the
difference in timeliness is truly (x + y) days.
9 Note that we are not able to use firms’ reliance on outside capital as a direct measure of the demand for financial
statement information because debt is the main source of outside capital for UK private firms (Brav, 2009) and the
debt (leverage) ratio also captures firm risk and liquidity, which are commonly found to be negatively associated
with timeliness (e.g. Impink et al., 2012).
9
2.3.2 Financial reporting versus tax orientation
Our second proxy for the use of accounting for financial reporting is whether or not the company has a
a non-zero deferred tax liability recorded in its balance sheet. This measure is designed to capture the
degree of alignment between financial reporting and taxation. If a private firm is not using its accounting
for financial reporting, taxation is the most likely alternative (Ball and Shivakumar, 2005, Garrod et al.,
2008, Szczesny and Valentincic, 2013). In particular, Szczesny and Valentincic (2013) find that German
private companies’ accounting is driven by tax considerations, and that (as is the case in the UK) firms
have longer to submit accounting information for tax purposes than for filing accounts.
The deferred tax balance disclosed in a company’s balance sheet measures the extent of the
alignment between accounting and tax (inversely) because where companies are using accounting for tax
compliance rather than for external reporting purposes, tax and financial accounting should be identical
and hence the deferred taxation balance will be zero. One of the most common reasons for differences
between accounting and taxation figures is the presence of accelerated capital allowances where
companies have higher depreciation charges allowable for tax, usually provided as an incentive by
governments to invest (e.g. Polito, 2009). Although suitable for tax purposes, such depreciation policies
are likely to be inconvenient for financial reporting because they do not represent the ‘true’ degree of asset
utilization. If companies are using accounting for financial reporting, deferred tax accounting requires, as
part of the accruals process, a provision to be created that recognizes the additional tax to be paid on the
asset in the future.10
Where there is low external demand for accounting from investors, an inappropriate depreciation
policy is less consequential, so companies can allow their accounts to be driven by tax considerations and
are therefore more likely to have a zero deferred tax balance. We therefore treat firms with a non-zero
deferred tax balance as having an accounting system designed for financial reporting rather than for tax
and compliance purposes. Compared with firms using accounting for compliance (tax/regulatory)
purposes, our expectation is that companies preparing accounts for external reporting purposes will be
timelier in publishing their accounts. As for audited companies, we also expect the reporting lags of firms
reporting for financial reporting purposes to be less effected by the regulatory filing change than those
10
In addition, by reducing the amount of profit available for distribution, this policy is beneficial to creditors because
it restricts a firm’s ability to pay dividends (Polito, 2009).
10
filing for compliance/tax reasons. UK companies must file their tax returns within 12 months of their
account year ends, which is 2 (3) months longer than that permitted for filing their accounts under the old
(new) filing regimes. Ceteris paribus, firms preparing accounts for tax purposes are thus more likely to be
to be influenced by regulatory compliance than firms which have reporting incentives to communicate
economic information to external parties on a timelier basis. This leads to the following hypotheses:
H3a: Companies with financial reporting orientation will file more quickly than companies with tax
orientation
H3b: The timeliness of reporting for companies with reporting orientation will be less affected by the
reduction in the statutory reporting filing deadline than companies with tax orientation
3. Data and sample
3.1 Data sources
The data sources for our study are the Bureau Van Dijk (BvDEP) Financial Analysis Made Easy (FAME)
April 2010 and April 2011discs, which contain data for the population of UK private firms (Brav, 2009, p.
272). We require both discs because FAME only records many important variables at a single point in
time (including reporting dates, audit status and ownership and board of directors information). Collecting
data at two points in time allows us to examine companies’ reporting behaviour surrounding the change in
the statutory deadline, which came into force for companies with financial years beginning on or after 6th
April 2008. We obtained our sample of companies filing under the old (10 month) regime from the 2010
disc and then matched this sample to its counterpart in the 2011 disc to retrieve data on reporting
timeliness under the new (9 month) regime. Hence our pooled sample comprises the same firms filing
their accounts under both regimes.
Our initial sample frame is all active (i.e., not failed or dormant) independent small UK private
companies on FAME with total assets above £1,000 and with financial reporting timeliness data (i.e. both
a filing date at CH and a financial year end date) for a full period, with data for year ends on or after 6th
April 2009 (new regime) together with data for the preceding year (old regime). Data are therefore
collected for each company reporting in the year immediately before and after the regulatory reduction in
the maximum permissible filing time from 10 to 9 months.
11
We removed newly incorporated firms from the sample, because they are subject to different
reporting requirements in their first reporting year.11 Independent companies (i.e., those not held as a
subsidiary) were selected to avoid the potential confounding influence of the parent.12
We focus on small
companies as statutorily defined,13
because only these firms are eligible to opt out of an audit. Definitions
and labels for the variables used in our empirical study are provided in Table 1.
Insert Table 1 about here
We employ two primary measures of timeliness in our models: (i) the number of days between a
company’s year end and the date it files its annual accounts at CH (REPLAG) and (ii) a binary measure
capturing whether a company filed its accounts after the statutory deadline (LATE).14
We impose a
minimum value of REPLAG of 7 days (i.e., accounts are filed at least a week after the year end) and a
maximum of one year after the statutory deadline to mitigate the influence of outliers and potential FAME
scanning errors (e.g. Brav, 2009). These criteria result in a total sample of 31,147 companies with full data
(including disclosed sales and profit figures15
) for both the final year of the old (10 month) filing regime
and the first year of the new (9 month) regime (i.e. a total sample of 62,294 firm years).
Our main experimental variables are NEWREG, which is a binary variable taking the value of 1 for
observations after the introduction of the 9 month regime, and zero otherwise; AUDIT, which indicates
whether or not a firm has voluntarily appointed an auditor in both periods16 and FINREP, which measures
11
For example, under the 1985 Act, companies have a maximum of 22 months from the date of incorporation to file
their first set of accounts. 12
For example, the shorter reporting lag of a listed parent may influence the behaviour of its subsidiary. 13 Under the 1985 (2006) Companies Acts, private firms need not appoint auditors if their turnover does not exceed
£5.6m (£6.5m) and their total assets does not exceed £2.8m (£3.26m). Companies are therefore only included in the
sample if they meet these criteria both for filings under the old (1985 Act) and new (2006 Act) reporting regimes. In
addition, some finance/insurance companies, including those dealing in banking, insurance or money-lending
services, are required to have audits even when their assets and turnover do not exceed the preceding limits. Such
firms were also excluded from our sample. 14
Determining whether a company is late is complicated by a simultaneous change in the rules under the new Act. Under the 1985 Act, if a company had a year end of (for example) 28
th February, its deadline is 28
th December, not
31st December. Under the new Act, the same company would have a deadline of 30th November, not 28th November.
We take account of these changes in our measurement of LATE to ensure accuracy to the specific day. 15
Note that, in common with prior studies (Dedman and Kausar, 2012; Dedman et al. 2014), because we require
profit data to construct important control variables, we focus on all those private independent small firms on FAME
which disclosed balance sheet and profit data. As with extant studies, a limitation of our research is that the findings
do not generalise to small companies filing modified (abbreviated) accounts with no profit or sales disclosure. 16
For AUDIT and FINREP we require that firms are audited and disclosed deferred tax in both periods, respectively.
12
the degree of book/tax alignment, where 1 denotes companies with a non-zero deferred tax balance in both
periods, zero otherwise.17
Insert Table 2 about here
3.2 Descriptive statistics
Table 2 presents descriptive statistics for REPLAG and LATE for the full sample, together with subsample
analysis for AUDIT and FINREP under both old and new reporting filing regimes. For the whole sample,
the average REPLAG is 229 days (i.e., on average, our sample companies report just under 8 months after
their year end), with a median of 256 days (Panel A). Audited firms are significantly more timely (at the
0.01 level) in filing accounts than unaudited firms, with mean lags of 219 and 229 days for audited and
unaudited companies respectively. The median values for audited (unaudited) companies of 232 (257) also
differ significantly at p < 0.01. Similarly, the mean (median) reporting lags for firms using accounting for
financial reporting purposes (FINREP) at 224 (248) days are significantly shorter (at p < 0.01) than those
filing for tax/compliance purposes at 229 (257) days.
Panel B of Table 2 reveals that the effects of the regulatory change were significant in shortening
reporting lags, with the mean (median) values of REPLAG falling by around 7 (14) days after the
introduction of the new regime from 232 (261) days to 225 (254) days - the differences being statistically
significant at the 0.05 (0.01) level. However, as shown by ∆REPLAG, there is no evidence that audited
firms (AUDIT) or those reporting deferred tax (FINREP) are less affected than their counterparts without
these attributes by the regulatory change, indicating that although these groups differ in cross section, the
responses of firms (∆REPLAG) to the shortening of the permitted reporting lag from 10 to 9 months
appears relatively stable across all firms in our sample. Hence the descriptive statistics in Table 2 provide
initial support for H1, H2a and H3a, though not for H2b and H3b.
Panel C of Table 2 provides descriptive data on our other measure of timeliness, namely the
proportion of companies filing their accounts within the 10 and 9 month filing deadlines (LATE). In
contrast to studies of listed companies, where up to 100% are reported as filing within regulatory limits
(e.g. Leventis and Weetman, 2004), across both regimes, 9.8% of firms filed late and incurred penalties. In
17
In order to check that we were capturing this variable reliably, we hand collected scanned accounts for a random
sample of 200 companies from CH for FINREP = 1 and 200 companies for FINREP =0 and checked the deferred tax
balances in our data set with those in the actual accounts. Our data corresponded entirely with the original
documents.
13
contrast to the reporting lag, which decreased on average after the regime change, the proportion of firms
filing late increased significantly,18 from just under 8% to 11.6% (i.e., an increase in the proportion of
companies filing late according to the statutory limit of 46%). Hence, though in general the reduction in
the filing deadline appears to have resulted in improved reporting timeliness (REPLAG), many more firms
failed to meet the new shorter filing deadline. Cross-sectional differences are again evident conditional on
our experimental variables. Both audited firms (AUDIT) and those using accounts for financial reporting
(FINREP) are significantly less likely (at the 0.01 level) to file late under either regime.
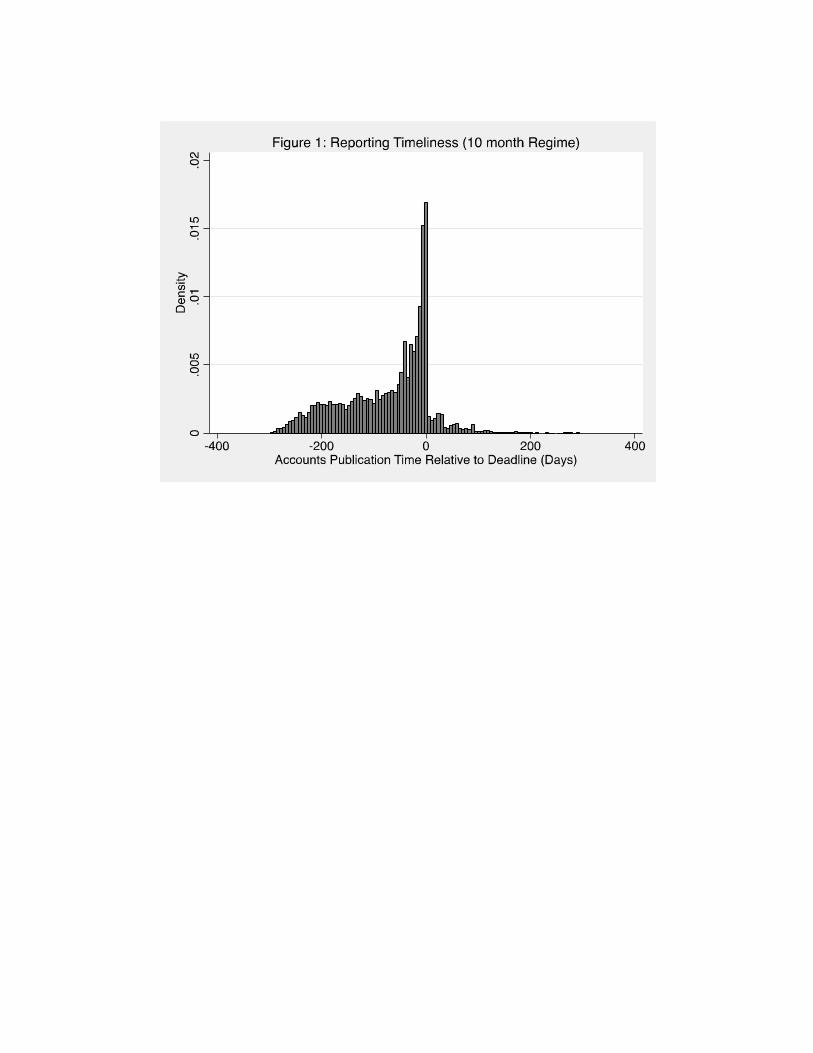
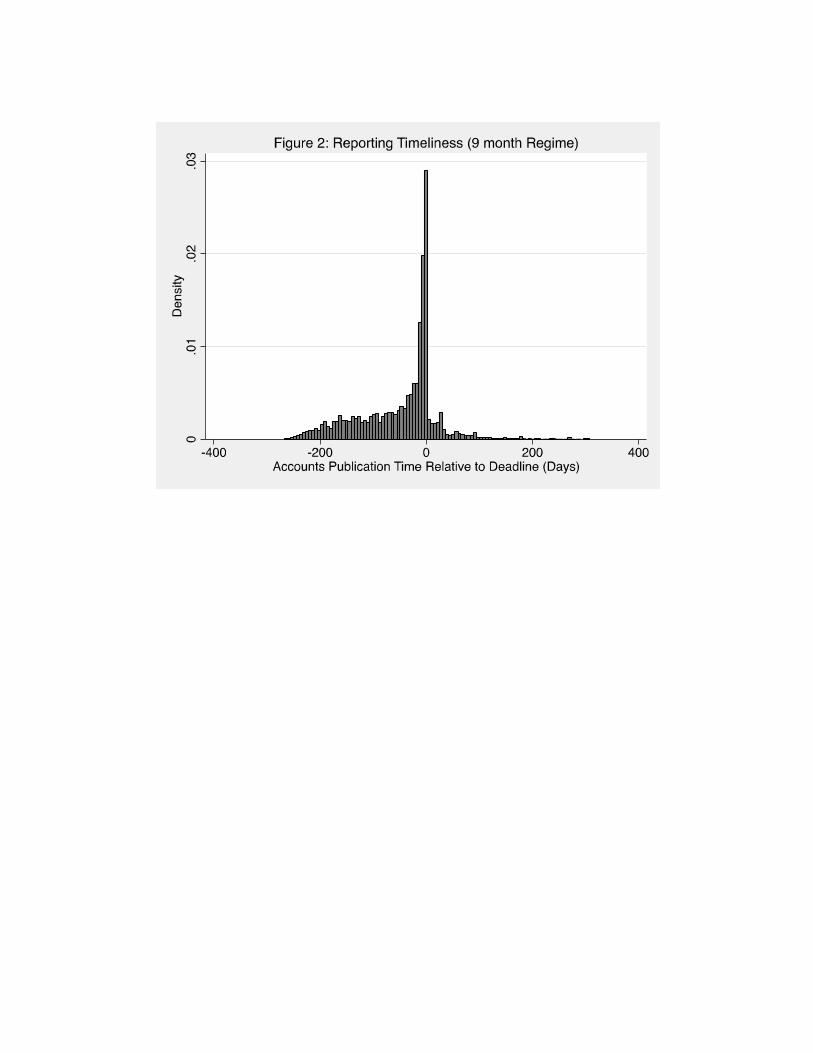
Though the descriptive statistics provide useful summary information, they conceal interesting
patterns in reporting behaviour. Further informative analysis of the distributions (histograms) of reporting
lags is provided in the graphical representations shown in Figures 1-3. Figures 1 and 2 report histograms
of reporting timeliness (in days) relative to the late filing deadlines before and after the regulatory change
respectively (note that this distribution is the days relative to the filing deadline, rather than the number of
days elapsed since the year end, as measured by REPLAG). For both the old and new regimes, Figures 1
and 2 reveal a clear discontinuity around the statutory deadline, with a relatively large proportion of
companies filing shortly before the deadline. These figures clearly illustrate the importance of regulation
in influencing private company reporting timeliness. The difference in distributions evident in Figures 1
and 2 also illuminates the impact of the regulatory change. In response to the shortening of the deadline by
one month, close inspection reveals that, relative to the distribution pre regulation (Figure 1), Figure 2
shows there is a marked increase in the density of reporting in the days approaching the deadline, together
with a more pronounced spike immediately before the deadline.
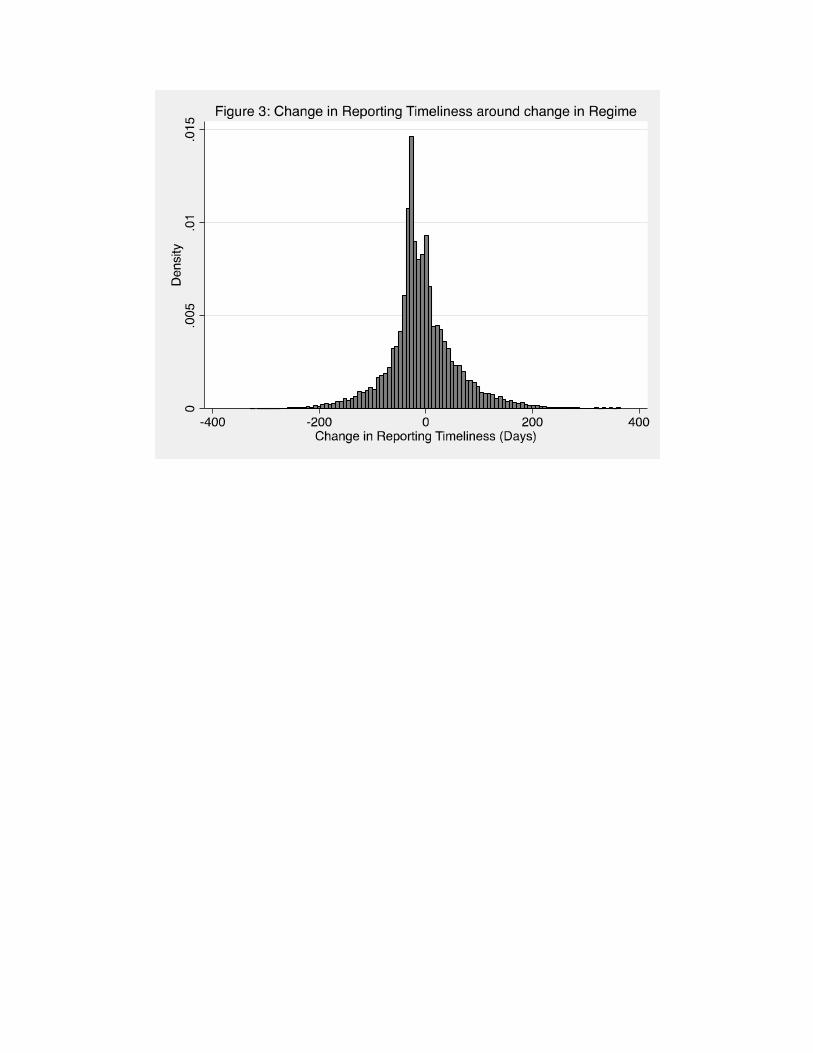
Figure 3 shows the distribution of the annual difference (i.e. the annual change) in reporting lags
(∆REPLAG, Table 1) surrounding the regulatory change. Whilst it appears broadly normal, there is a
pronounced ‘spike’ at around –30 days, consistent with a significant proportion of companies changing
their timeliness in response to the shortening of the filing deadline by one month. In summary, the
cumulative evidence in Figures 1-3 is highly supportive of significant and influential regulatory effects on
private companies’ reporting behaviour. We now turn to our main analyses to examine multivariate
statistical evidence from our data on financial reporting timeliness.
18
In private correspondence, Companies House stated that they write to companies as the deadline approaches
warning that financial penalties will be imposed for late filing and that a criminal offence may be committed.
14
Figures 1, 2 and 3 about here
4. Empirical model and correlations
4.1 Empirical model
Our full pooled model (estimated for both years) is specified as follows:
TIMELINESS =a0 +b1NEWREG+ b2AUDIT +b3FINREP +b4AUDIT * FINREP+ b5NEW * AUDIT +
b6NEW * FINREP+b7NEW * AUDIT * FINREP+ bkCONTROLS+ek=8
K
å (1)
We estimate a number of versions of this model in our analysis. In our main analysis, TIMELINESS is
measured by the number of days from the year end (REPLAG); however, we also examine the effect of
our experimental variables in different models, with TIMELINESS measured in binary form to denote late
filing (LATE), and as the annual change in REPLAG (ΔREPLAG). Control variables for the latter are also
expressed in change (Δ) form.
Our models are mostly estimated in pooled form - for observations pre (time t–1) and post (time t0)
the regulatory change (NEWREG) - but we also report cross-section specifications with lagged variables.
In particular, to investigate the ‘risk’ and potential persistence of late filings, in specification for LATEt0
we include its lagged value (LATEt–1), together with a variable labeled RISK30t-1 (Table 1), which
indicates whether companies filed their accounts in the 30 day period before the deadline under the old
regime (that is, companies publishing their accounts between 9 and 10 months after their year end). A
priori, we expect these firms to be the most likely to be at risk of filing late in the following year (LATEt0)
under the new 9-month filing regime.
We control for firm size (SIZE) with the natural log of total assets and include a profit margin
variable (RETSAL), defined as the proportion of profit before tax to sales. Impink et al. (2012, p. 237)
report that an important cause of reporting delays is corporate financial distress, measured by firm
leverage19
and a loss-making indicator variable. We therefore include firm leverage (LEV) 20
, calculated as
the proportion of liabilities to total assets, and whether (=1) or not (=0) the company is loss-making
(LOSS), together with a liquidity (LIQ) ratio (current assets to current liabilities), which is expected to be
19
For LEV, an alternative conjecture is that, to the extent that debt is an important source of external finance to
private firms, higher gearing may be associated with incentives for timelier reporting (Owusu-Ansah, 2000).
Empirically, however, prior research shows that leverage acts more as a proxy for distress and tends to be negatively
related to timeliness. 20
Following a large number of previous studies (e.g., Dedman and Kausar, 2012), RETSAL, LEV and LIQ are
winsorized at the 0.01 level to alleviate the influence of outliers.

15
negatively related to REPLAG. We use the number of standard industrial classification codes the firm
operates, in addition to its primary SIC code (NOSIC), to control for firm complexity (Impink et al., 2012).
We also include the logarithm of firm age in years (AGE) to control for cumulative experience in
preparing accounts and/or the maturity (efficiency) of accounting systems (Doyle et al., 2007) and,
because firms with larger boards may have more resources available for the production of accounting
information, we include the logarithm of the number of directors (NODIR) as well.
Higher dispersion in corporate ownership implies higher potential for agency conflicts (Jensen and
Meckling, 1976). Although private firms are more closely held than their public counterparts, conflicts
between individual shareholders may be greater (Hope et al., 2011) leading to pressure for more timely
production of accounting information to alleviate potential information asymmetries. To allow for this, we
use the number of firm shareholders (NOSHARE), expressed in log form (see Brav, 2009). We expect
NOSHARE to be negatively related to REPLAG. Finally, our models include eight standard industry
dummy variables21
(unreported for brevity) to control for any systematic variability in producing
accounting information due to industry differentials.
Insert Table 3 about here
4.2 Correlations
Table 3 reports Pearson’s correlation coefficients for the variables in our models for all observations
(62,294). Consistent with expectations, REPLAG is negatively and significantly correlated with AUDIT
and FINREP and with the intersection between these variables (FINREP*AUD). The correlation between
FINREP and AUDIT is positive and statistically significant, and both AUDIT and FINREP are positively
and significantly associated with SIZE and AGE; however, only AUDIT is positively associated with the
number of firm shareholders (NOSH). A multivariate analysis of the correlations between the variables in
Equation 1 revealed that the highest variance inflation factor was 2.39, suggesting that multicollinearity
should not pose serious problem in our regression models (Firth, 1997).
Insert Table 4 about here
5. Multivariate results
5.1 REPLAG regression analysis
Table 4 presents the results of our primary models using REPLAG as the dependent variable. For all
21
Based on primary SIC codes, 8 dummy variables are employed for agriculture, construction, mining, utilities,
manufacturing, retail/wholesale, finance and service sectors.
16
models the estimated coefficients for the control variables are stable, are all statistically significant and
exhibit their expected signs. They show that larger (SIZE), younger (AGE), more complex (ADDNUM)
companies with lower liquidity (LIQ) and profitability (RETSAL) - particularly those making a loss
(LOSS) - are less timely. More highly geared (LEV) firms with fewer directors (NODIR) and more
concentrated ownership (NOSH) also take longer to publish their accounts. The finding that larger private
firms have longer reporting lags (probably reflecting higher complexity) stands in contrast to prior studies
of quoted companies. In addition, the positive and significant coefficient estimates for LEV are consistent
with the financial distress explanation and supporting empirical evidence for quoted markets (Impink et al.
2012), rather than capturing incentives to report more quickly to debt-holders (Owusu-Ansah, 2000).
To test hypotheses H1 H2a and H3a, Models 1-4 report OLS estimates (with firm-clustered standard
errors) for our experimental variables NEWREG, AUDIT and FINREP individually (Models 1-3), with
Model 4 showing their combined influence. The results provide evidence (at p < 0.01) that the new
reporting regime (NEWREG) resulted in a significant reduction in the average filing time by around 1
week and that both AUDIT and FINREP are significantly associated (at p <0.01) with timelier financial
reporting. The coefficients in Model 4 indicate that, on average, firms with these characteristics filed
accounts around 7 days quicker when compared with unaudited firms and those with high tax alignment.
The results therefore provide strong support for hypotheses H1, H2a and H3a. 22
Model 5 provides OLS estimates for our full specification (Equation 1), including the interaction
variables for testing hypotheses H2b and H3b. The coefficients for NEWREG, AUDIT and FINREP
remain similar (as do their significance levels), though the combined influence of the latter two variables
(FINREP*AUD) is greater, with companies with both attributes filing significantly (14 days) faster. In
testing hypotheses H2b and H3b, relative to the coefficient of NEWREG, the coefficients of NEW*AUD,
NEW*FINREP and NEW*AUD *FINREP indicate whether the economic demand for the information
militates against the regulation effects reducing reporting lags. If these firms are in equilibrium in terms of
their accounts filing times, the coefficients for the interaction terms (AUDIT, NEW*FINREP and
NEW*AUDIT*FINREP) should offset that for NEWREG. Hence we expect positive and significant
coefficients for these interaction variables to support our hypotheses. However the estimates for these
22
We also estimated Model 4 with the natural log of REPLAG as the dependent variable. We obtained virtually
identical inferences to those reported, with all variables being highly significant (at p < 0.01).

17
variables in Model 5 provide no evidence in support of hypotheses H2b and H3b, as all three coefficients
are statistically insignificant.
Given the distribution of REPLAG shown in Figures 1 and 2, we also estimate our full model
(shown in Models 6-8) using Huber robust M-estimator regression, quantile (median) regression and
quantile count (median) regression.23 As described by Clatworthy and Peel (2007, p.182), the Huber
robust M-estimator (RREG) employs reweighted least squares. Weights are iteratively assigned on the
basis of the size of scaled model residuals, with larger residuals assigned lower weights (influence).
Quantile median regression (QREG), which extends OLS analysis to provide conditional median
parameters is robust to skewness, outliers and non-normal errors24
(Koenker and Hallock, 2001, Greene,
2006). Conditional mean count regression is formulated to account for the distribution of non-negative
count (in our case, number of days) dependent variables (Greene, 2006). We employ Machado and Santos-
Silva’s (2005) generalisation of the negative binomial (count) conditional mean regression estimator, to
estimate conditional median count parameters (QCOUNT).
As Models 6-8 reveal, hypotheses H1, H2a and H3a remain fully supported, though the effects are
more pronounced, with the RREG results indicating quicker filing times of 11.0, 11.3 and 7.3 days
associated with NEWREG, AUDIT and FINREP respectively. Results for the count median estimator
(Model 8, QCOUNT) are similar to those for the median (QREG) estimates in Model 7. Relative to the
median of REPLAG, the QCOUNT coefficients of NEWREG, AUDIT and FINREP imply25
a reduction in
filing times of 3.6% (9 days), 6.4% (17 days), and 3.7% (9 days) respectively. However, as shown in
Models 6-8, like the OLS estimates, the robust regression results do not support H2a and H2b.
In summary, the results in Table 4 provide strong evidence that the regulatory change had a
significant impact on improving the timeliness of private companies’ financial reporting26
and reduced
both mean and median reporting lags (H1). Similarly, H2a and H2b are strongly supported in all empirical
23
For models estimated using robust regression, the R2 is computed using the rregfit extension by Ender and Chen at
the UCLA statistics consulting group available at http://www.ats.ucla.edu/stat/stata/faq/rregr2.htm. 24
Unlike OLS, which minimises the sum of the squares of the residuals, the quantile median - also known as Least
Absolute Deviation (LAD) regression - minimises the sum of absolute residuals. 25
Calculated as 100(ecoefficient
-1), where e is the exponential constant. 26
As a final robustness test, we re-estimated Model 4 employing the wild bootstrap method to calculate coefficient
standard errors and associated significance levels of the variables (see Clatworthy et al., 2007 for a discussion of the
method). As stressed by Clatworthy et al. (2007, p. 3), when estimating OLS models, the wild bootstrap is robust
both to heteroskedasticity and non-normality. Inferences (employing 10,000 sample draws) for parameters and
significance levels of all the explanatory variables are identical to those reported in Model 4.
18
specifications, with median (typical firm) estimates for AUDIT and FINREP being more substantive than
their mean counterparts. In contrast, for NEW*AUDIT and NEW*FINREP the empirical evidence does not
support H2b or H3b. A potential explanation for this is that audited firms and those that disclose tax
liabilities for reporting purposes are motivated to maintain their shorter reporting lag differential after the
regulatory change as a (continuing) signalling device that they are ‘higher quality’ companies.
Finally, although it is not unusual for accounting studies to report low explanatory power for similar
model specifications,27
the model R2s (4-5%) are relatively low.
28 Given the range of, and motivation for,
the explanatory variables described above, and that most of the explanatory (and all of the control)
variables are statistically significant determinants of REPLAG, this implies substantial random variation in
REPLAG and/or that reporting timeliness is heavily driven by regulatory deadlines for all private
companies. We examine this latter explanation in more detail below (in Tables 6 and 7).
Insert Table 5 about here
5.2 Propensity score matching analysis
The descriptive data and regression findings provide significant evidence that firms hypothesised to be
associated with stronger economic demand for their accounting information are timelier in filing their
accounts. Unlike NEWREG, which is exogenous, it is important to allow for non-random selection on
observable characteristics into the AUDIT and FINREP categories. Although multivariate regression
models aim to control for such differences, they impose strict linear assumptions. Propensity score
matching is a semi-parametric estimator which, unlike parametric regression models, requires no model
assumptions; nor does it require functional form assumptions regarding the relationship between the
outcome variable and the explanatory variables. We therefore present PSM estimates of the effect of
AUDIT and FINREP on REPLAG in Table 5 as a robustness test of our previous regression estimates.
The first stage requires estimation, pre and post the regulatory change, of separate logit models for
AUDIT and FINREP, which include the control variables in Equation 1. The estimated probability of
selection (propensity scores) generated by these models is then used as the basis for matching. Based on
propensity scores, we use two matching approaches using the psmatch2 code written for Stata by Leuven
27
For instance, in examining the determinants of the levels of dependent variables over time (as opposed to
differences), Linck et al. (2013) report (p. 2135) models for the determinants of levels of external debt, with R2s
varying between 0.012 and 0.030, despite a number of significant explanatory variables. 28
Though Luypaert et al. (2013) report a similar level of explanatory power of 0.023 in their negative binomial
(count) model.
19
and Sianesi (2003): kernel matching (KM) and local linear matching (LLM). These methods weight the
outcomes of the control group with reference to the distance between propensity scores of treatment and
control observations, thereby using information on all observations in estimating weighted (matched)
treatment effects (see Heckman et al., 1998 for a full discussion). KM and LLM are similar, other than the
latter accounts for potential asymmetric distributions of propensity scores, such that LLM circumvents the
potential boundary bias problem associated with kernel estimators (Todd, 1999, p. 8).
The results are highly congruent with our previous findings, with the KM and LLM matching
estimates being similar and highly significant (p 0.01) in all cases. As shown in Panel A of Table 5, pre-
regulation, the KM (LLM) mean difference estimates for AUDIT show that audited firms published their
accounts 7.1 (6.4) days quicker that unaudited ones, with the post- regulation differences being 7.9 (7.8)
days. For FINREP (Panel B), the findings are similar. The KM (LLM) matching estimates indicate that,
pre-regulation, firms with low book-tax alignment filed their accounts 6.6 (7.7) days quicker than their
counterparts with high book-tax alignment, with post-regulation matching estimates of 7.1 (7.9) days
respectively. These matching results are estimated free from the functional form assumptions of linear
regression models, and confirm the robustness of our prior findings.
5.3 Analysis of changes in reporting timeliness
In order to conduct further tests of the effects of the regulatory change and economic demand on financial
reporting timeliness, Table 6 presents results for difference models with the change in reporting lags
(ΔREPLAG) regressed on the changes in variables in Table 1. AGE is omitted, as by construction the
difference is a constant of 1 year, as is NOSIC which does not change for our sample either. Difference
models often exhibit much lower explanatory power than those expressed in levels - especially as changes
in relationships may be nonlinear and complex – and this is the case in Model 1, where control variables
alone explain very little variation in ΔREPLAG (R2 =0.00 to two decimal places). Although the model is
statistically significant (F-statistic: 4.25, p= 0.01), only ΔSIZE and ΔLOSS have statistically significant
coefficients, with the former perhaps explained by faster growing companies filing more quickly29
29
To test whether our previous results are influenced by this finding, we re-estimated Model 4 in Table 4 for the post
regulation data, and included ΔSIZE as an additional explanatory variable. The parameter estimates and significant
levels are very similar to those reported, with none of inferences affected, and with ΔSIZE being statistically
insignificant (p > 0.05).
20
(signalling) and those moving into a loss situation taking longer to file their accounts (e.g. Impink et al.,
2012). Noteworthy, is that the constant term for Model 1 (–6.8 days), is highly congruent with our finding
for Model 4 in Table 4 that the regulatory change resulted in an average improvement in timeliness of
around 7 days. Model 2 provides further evidence relating to H2b and H3b with the inclusion of AUDIT
and FINREP. Consistent with our prior findings, their coefficients are statistically insignificant (rather
than being positive and significant as hypothesised), leading to a rejection of H2b and H3b.30
Insert Table 6 about here
Model 3 includes the regulatory variable, RISK30t-1. As described above, this variable captures
companies that file in the month preceding the deadline in the year before the regulatory change, and that
are therefore at risk (given the one month reduction the deadline) of filing their accounts late in the
following period. The impact of RISK30t-1 is substantial, with its coefficient implying a mean reporting lag
reduction amounting to 41 days. This confirms that the impact of the regulatory change was not uniformly
distributed over REPLAGt-1. In particular, when the likelihood of filing close to the previous 10 month
deadline is included, Model 3 shows that the mean ΔREPLAG captured in the constant term is positive
(6.7 days). Model 4 reports similar estimates and inferences for the full specification. These findings are
also confirmed with the robust Huber (RREG) and quantile median (QREG) estimates reported in Models
5 and 6 respectively, though the coefficient estimates for RISK30t-1 are smaller, suggesting mean (median)
reductions of 32.5 (31.8) days. As described above, the effect of RISK30t-1 is also reflected in the distinct
spike in the distribution of ΔREPLAG shown in Figure 3.
Overall, the results in Table 6 show that there is a high degree of persistence in REPLAG, that the
regulatory change is the main driver of changes in reporting lags, with most of the variation captured by
RISK30t-1, and that the negative coefficients attracted by AUDIT and FINREP are again inconsistent with
our hypotheses H2b and H3b.
5.4 Late filing regression analysis
As Feltham (1972) observes, the optimal reporting time requires consideration of both the value of timely
information (i.e., the benefits arising from timely provision) and the costs of preparing the information
more quickly (which usually requires additional resources). As discussed above, the regulatory regime
30
We re-estimated Models 2 and 4 employing the wild bootstrap method with 10,000 sample draws (see note 26
above). The significance levels of the variables remained unchanged.
21
involves significant financial penalties and the risk of non-financial ones for directors for late filing.
When combined with loss of reputation, these may have highly deleterious effects, including on credit
ratings. We therefore conduct logistic regression analyses to investigate the factors associated with the
likelihood of firms filing late (coded as unity in the dependent variable). In Table 7, we report both logit
coefficients, and associated odds ratios (OR), calculated as the exponential of the coefficient values.
Insert Table 7 about here
Model 1 shows late filing estimates for the full specification. Other than for FINREP*AUD, which
exhibits its expected sign but is statistically insignificant, in terms of the coefficient signs and levels of
significance, the findings are similar to those for REPLAG in Table 4. Specifically, companies with
stronger economic demand for their information are less likely to be late (defined with reference to the
statutory limit) publishing their accounting information. Even though our results above show that average
reporting lags reduced post the change in the filing deadline, the estimates for NEWREG reveal that the
likelihood of filing late is 62% higher after the regulatory change. Importantly, with reference to the
estimates in Model 1 in Table 7, FINREP and AUD have significant negative coefficients, with their odds
ratios showing that companies with a low book/tax alignment are around 28% (1-0.72) less likely to file
late, with the likelihood of audited firms being 29% lower - or equivalently, unaudited firms are 41% more
likely to file late than their unaudited counterparts (1/0.71)).
Models 2-4 report estimates for late filing in the year after the regulatory change (LATE) as the
dependent variable to examine the persistence of late filing via the inclusion of RISK30t-1 and LATEt-1 as
additional variables. Models 2 and 3 report their individual effects, with Model 4 revealing their combined
influence. Models 2 and 3 show that the odds ratios associated with RISK30t-1 and LATEt-1 imply the
likelihood of filing late increase by 55% and 622% respectably.31
As shown in Model 4, their combined
influence is even more pronounced, with the odds ratios indicating that, after controlling for the fact that
firms who filed late in the preceding period (LATEt-1) are over 10 times more likely to file late in the
current period, those filing in the month preceding the deadline in previous year (RISK30t-1) are 2.88 times
more likely to file late post the reduction in the filing deadline. However, relative to Models 1-3, the
magnitude of the coefficients for FINREP and AUD in Model 4 fall, with the significance of the latter also
declining to p = 0.155.
31
Note, the impact of LATEt-1 is likely to have been amplified by the reduction in the filing deadline.
22
In summary, the logit estimates in Table 7 show that companies hypothesised to have stronger
economic demand for their accounting information (AUDIT and FINREP) are less likely to file their
accounts late (i.e., after the statutory deadline). Moreover, the reduction in the permitted filing time
(NEWREG) led to a substantial increase in late filing. Our results highlight the importance and persistence
of prior reporting status, with companies filing late in the preceding period (before regulatory change), and
those identified at being at risk of filing late in the next period (RISK30t-1), being substantially more likely
to file late in the following period (post regulatory change). These results are not inconsistent with our
previous findings (in Tables 4 and 6). Taken together, they suggest that, though mean and median
reporting lags reduced significant post regulation, and particularly for those firms in the RISK30t-1
category, late filing is persistent - and that a significant proportion of firms designated by RISK30t-1 did
not change their behaviour sufficiently to satisfy the shorter regulatory deadline.
5.5 Reporting timeliness and credit ratings
As discussed above, private firms rely heavily on debt financing (Brav, 2009), so credit ratings are
potentially highly important because of their influence over the cost of debt. Prior studies of UK corporate
failure (including for private companies) indicate that annual financial reporting timeliness is negatively
associated with corporate failure (e.g., Beynon and Peel, 2011). This is consistent with advice given to UK
private firms by credit ratings and accountancy companies (e.g. Experian, 2013; Kilsby & Williams LLP,
2011), together with guidance provided by the UK filing regulatory authority, Companies House, that late
filing of accounts may result in inferior credit ratings (CH, 2009, p.7). This section examines whether this
is the case with reference to the credit ratings assigned to our sample of companies.
Insert Table 8 about here
Credit ratings for all FAME companies are provided by CRIF Decision Solutions Limited. It
supplies ratings defined on a five point ordinal scale, together with the following explanations: Secure:
‘Failure is very unusual and normally occurs only as a result of exceptional changes within the company
or its market’; Stable: ‘Here again, company failure is a rare occurrence and will only come about if there
are major company or marketplace changes’; Normal: ‘This sector contains many companies that do not
fail, but some that do’; Caution: ‘Here, as the name suggests, there is a significant risk of company
failure’; and High Risk: ‘Companies in the High Risk sector may have difficulties in continuing trading
23
unless significant remedial action is undertaken, there is support from a parent company, or special
circumstances apply’. As well as being available to creditors and analysts on FAME, the same credit
ratings can also be purchased from Jordans Limited, a major UK business information and credit rating
provider, which also prepares CH information for FAME. In our empirical analyses, we use an ordinal
credit rating (coded 5= High Risk to 1= Secure) and whether (=1) or not (=0) a company is rated as High
Risk as dependent variables in ordinal logit and logit models respectively.
A well as REPLAG and LATE being included in alternative specifications, all models incorporate
the following control variables: RETSAL, LIQ and LEV, together with AUDIT (see Lennox and Pittman,
2011 and Dedman and Kausar, 2012).32
Prior UK corporate failure studies report that, as well as failure
rates varying by industry, smaller and younger firms (particularly those aged below 10 years) are more
likely to fail (Hudson, 1987, Beynon and Peel, 2001, Altman et al., 2010). In consequence, we include a
dummy variable denoting whether a firm is below 10 years of age (YOUNG), as well as SIZE and industry
dummies. We also control for macroeconomic influences (Lennox and Pittman, 2011) with NEWREG
acting as a binary period variable.
Table 8 reports ordinal (Models 1 and 2) and logit (Model 3) estimates for the credit ratings
previously described. All control variables (untabulated for brevity), exhibit their expected signs and are
statistically significant (p < 0.01 in all cases) in all models.33 Model 1 shows the parameter estimates for
REPLAG. Its coefficient is highly significant (p < 0.01) and positive, indicating longer reporting lags are
significantly associated with worse credit ratings - moving from a better (ordinal) rating to an inferior one.
However, its magnitude is relatively small, with its odds ratio implying that, on average, each additional
10 day increase in reporting lags is associated with a 1% increase in the likelihood of obtaining a worse
credit rating. This is in contrast to Model 2 which includes LATE, rather than REPLAG. Its coefficient is
again positive and highly significant (p < 0.01), with the odds ratio suggesting that firms filing late are
around 26% more likely to obtain a worse credit rating than their counterparts filing on time, after
controlling for other factors associated with credit ratings. This strongly suggests that timeliness has a
32
We also included LOSS as an additional control variable in all models reported in Table 8. Due to collinearity, the
sign on RETSAL changed, though remained significant. We therefore omitted LOSS. Including both LOSS and
RETSAL did not alter our inferences for models 1-3. 33
Specifically, smaller, younger and unaudited companies with high gearing and lower liquidity and profit margins
are significantly more likely to obtain poorer credit ratings.

24
non-linear effect on credit ratings and that credit ratings incorporate late filing (binary) information, rather
than timeliness as reflected in reporting lags (REPLAG).
Model 3 provides further evidence regarding this point and shows the effect of late filing on the
probability of obtaining a High Risk credit rating. The logit estimates reveal that firms filing late are twice
as likely as companies filing on time to be rated in the highest risk category (with the coefficient on LATE
being significant at p < 0.01). It is possible, therefore, that late filing may be penalized more severely (at
least for the credit ratings under consideration), where firms, notwithstanding late filing, display a higher
degree of failure proneness. In summary, these results are important in that they confirm professional and
regulatory advice discussed above that late filing is likely to result in inferior credit ratings and therefore
have important direct economic consequences, as well regulatory ones. They also demonstrate that the
regulation has important economic consequences for companies since firms missing the statutory deadline
suffer significantly in terms of their credit ratings and hence in their cost of debt.
6. Conclusions
Given that the vast majority of companies are private, and that in most countries their asset values exceed
those of their public counterparts (Brav, 2009), firms in private ownership are receiving increasing
attention in the accounting literature. To date, however, very little is known about the timeliness of
financial reporting in this sector. As emphasised over decades by the conceptual frameworks of major
standard setters, timeliness is an intrinsic characteristic of financial reporting and an essential element of
information relevance. It is perceived as being essential to facilitate informed decision-making by
stakeholders, not least by regulators. Our research design examines a regulatory change which
substantially reduced the permitted filing deadline before penalties are incurred. Employing a large sample
of small UK private independent firms, our empirical findings provide new insights into the relative
impact of regulatory and economic influences on reporting timeliness. Our analyses control for important
firm characteristics and our findings are robust to the use of various methods, including Huber, quantile
median, count median and matching estimators.
Extant research reports that private firms use accounting for tax and compliance purposes more than
for financial reporting to outsiders. If this is the case, we would expect that the timing of accounts’
publication will be driven by regulatory compliance, rather than by economic demand for the information
25
from outside capital providers. However, we contend that the demand for, and incentives associated with,
financial reporting in the private corporate sector are not homogenous. We examine the relative impact of
regulation and firm-specific reporting characteristics which are expected to be associated with economic
demand for accounting information, and hence with timelier publication of accounts. Our analysis is
aimed at contributing not just to the literature on reporting timeliness, but also to the wider literature on
the influence of regulation and market demand on the properties of accounting (Ball, 2008).
Consistent with the literature demonstrating that there is lower economic demand for accounting
information for private firms (Ball and Shivakumar, 2005; Burgstahler et al., 2006; Hope et al., 2013), our
results show that regulation (and changes in regulation) is a primary driver of reporting (and changes in
reporting) behaviour. Both univariate and multivariate analyses indicate that reporting lags are highly
responsive to the statutory deadline, suggesting that the penalties represent a significant sanction and/or
that companies appreciate that untimely filing has a deleterious effect on the users of their accounts (e.g.
Collis et al., 2013). Importantly, although the regulatory change resulted in a significant reduction in
reporting lags, particularly for those firms identified as being at risk of filing late after the regulatory
change, it also led (at least in the short run) to a substantial increase in the proportion of firms filing late
and attracting penalties. Furthermore, with reference to previous reporting lags, prior late filing was found
to be the principal determinant of current late filing, with firms classified at risk of filing late in the
previous period (within one month of the deadline) also found to be substantially more prone to file late in
the following period; this despite displaying the largest mean and median reductions in reporting lags in
response to the shortening of the filing deadline.
While we document that regulation has a pivotal role, we also find significant evidence that firms
which are hypothesized to produce accounts for financial reporting rather than for tax/compliance
purposes are significantly more timely in filing their accounts. Using a range of statistical methods, the
analyses provided strong empirical support for our hypotheses that firms with economic incentives for
financial reporting are timelier in publishing their accounts. The results indicate that audited companies
(notwithstanding the extra time required to conduct an audit), and those with a low book/tax alignment,
had lower mean and median reporting lags and were significantly less like to file late. The latter is
consistent with companies recognising that, as well as incurring statutory penalties, late filing may have a
negative impact on their reputation with investors, creditors and credit rating agencies. However, no
26
support was found for our hypothesis that the change in reporting lags of these companies should be less
affected by the reduction in the filing deadline, since (as opposed to regulatory compliance) their reporting
behaviour is driven by economic fundamentals. Our results reveal that there was no significant change in
the reporting lag differential of these firms before and after the regulatory change, perhaps in consequence
of them signalling to the market that they are higher quality firms by maintaining their (timelier reporting)
differential post the reduction in the filing deadline.
Finally, we provide new evidence indicating that late filing firms obtain significantly worse credit
ratings. This is an important finding and demonstrates that, as well as incurring statutory penalties, late
filing private companies may suffer direct economic costs via inferior firm credit ratings leading to a
higher cost of debt. As well as examining hypotheses relating to important accounting concepts/issues,
our results may be of interest to regulators wishing to assess the impact of the new legislation on the
reporting behaviour of private companies. Our findings regarding credit ratings are also likely to be of
interest to private companies and their advisors.
Inevitably our research has limitations. Although our empirical analyses demonstrate that timeliness
improved surrounding the regulatory change, we are unable to derive the costs incurred by companies in
responding to the reduction in the filing deadline. We conjecture, however, that because the changes in
reporting lags appear to be driven by a subset of firms filing close to the original 10 month deadline,
reducing the deadline to 9 months need not have involved substantial adjustment costs, though it did result
in a significantly higher proportion of firms filing late. Finally, relative to their public counterparts, the
collection of data for private companies is sometimes costly. A considerable investment was required to
obtain cross sectional data for two periods to collect appropriate variables due to the fact that FAME only
records key data at one point in time. Nonetheless it would be interesting to extend the current study to
investigate adjustments in reporting lags in more detail, particularly whether the effects of the shortening
of the deadline on the increase in late filings persist, or dissipate as firms further adjust to the new regime.

27
References
Abdel-Khalik, A.R., 1993. Why Do Private Companies Demand Auditing? A case for organizational loss of
control. Journal of Accounting, Auditing & Finance, 8(1), 31-52.
Allee, K. and Yohn, T., 2009. The demand for financial statements in an unregulated environment: an
examination of the production and use of financial statements by privately held small businesses. The
Accounting Review, 84 (1), 1-25.
Altman, E., Wilson, N. and Sabato, G., 2010. The value of non-financial information in SME risk
management. Journal of Credit Risk, 6(2), 1-33.
Ball, R., 2008. What is the actual economic role of financial reporting? Accounting Horizons, 22(4), 427-
432.
Ball, R. and Shivakumar, L., 2005. Earnings quality in UK private firms: Comparative loss recognition
timeliness. Journal of Accounting and Economics, 39, 83-128.
Beynon, M. and Peel, M., 2001. Variable precision rough set theory and data discretisation: An application
to corporate failure prediction. Omega, 29 (6), 561- 576.
BIS, 2007. Regulatory Impact Assessment: Companies Act 2006. London: Department for Business,
Innovation and Skills.
Blackwell, D., Noland, T. and Winters, D., 1998. The value of auditor assurance: evidence from loan
pricing. Journal of Accounting Research. 36 (1), 57–70.
Brav, O., 2009. Access to capital, capital structure, and the funding of the firm. Journal of Finance, LXIV,
263-308.
Bromwich, M., 1992. Financial Information and Capital Markets. London: Pitman Publishing.
Burgstahler, D., Hail, L. and Leuz, C., 2006. The importance of reporting incentives: Earnings management
in European private and public firms. The Accounting Review 81(5), 983-1016.
CH 2010. Late Filing Penalties, Guidance Booklet Version 2.2, Companies House, UK
CH 2013. Directors and Secretaries: GBA1, Companies House, Available from:
http://www.companieshouse.gov.uk/about/pdf/gba1.pdf [Accessed 5 January 2013].
Chen, F., Hope, O.-K., Li, Q., Wang, X., 2011. Financial reporting quality and investment efficiency of
private firms in emerging markets. The Accounting Review 86(4), 1255-1288.
Chi, W., Dhaliwal, D.S., Li, O. Z. and Lin, T.-H. 2010. Voluntary reporting incentives and reporting
quality: evidence from a reporting regime change for private firms in Taiwan. Contemporary
Accounting Research, 30(4), 1462-1489.
Clatworthy, M. and M.J. Peel, M., 2007. The effect of corporate status on external audit fees: Evidence
from the U.K. Journal of Business Finance and Accounting 34 (2), 169-201.
Clatworthy, M. A., Peel, D. and Pope, P. 2007. Evaluating the properties of analysts' forecast: A bootstrap
approach. British Accounting Review, 39(1), 3-15.
Collis, J., Jarvis, R., Skerratt, L., 2004. The demand for the audit in small companies in the UK. Accounting
and Business Research 34(2), 87-100.

28
Collis, J., 2008. Directors’ Views on Accounting and Auditing Requirements for SMEs. Report for UK
Department for Business and Enterprise and Regulatory Reform.
Collis, J., 2012. Determinants of voluntary audit and voluntary full accounts in micro- and non-micro small
companies in the UK. Accounting and Business Research. 42(4), 441-468.
Collis, J., Jarvis, R. and Page, M., 2013. SMEs, Financial Reporting and Trade Credit: An International
Study, London: ACCA.
Davies, M., Paterson, R and Wilson, A., 1999. UK GAAP. London: Tolley.
Dedman, E. and Kausar, A., 2012. The impact of voluntary audit on credit ratings: evidence from UK
private firms. Accounting and Business Research, 42 (4), 397–418.
Dedman, E., Kausar, A. and Lennox, C., 2014. The demand for audit in private firms: Recent large sample
evidence from the UK. European Accounting Review European, Early (online), 14 Mar 2013.
Doyle, J., Ge, W., McVay, S., 2007. Determinants of weaknesses in internal control over financial
reporting. Journal of Accounting & Economics 44 (1), 193-223.
DTI, 1995. Accounting Simplifications: A Consultative Document, May, 95/669. London: Department of
Trade and Industry.
DTI, 2005. Company Law Reform, Department of Trade and Industry Cm 6456, HMSO. London:
Department of Trade and Industry.
Eisenberg, T., Sundren, S. and Wells, M., 1998. Larger board size and decreasing firm value in small firms.
Journal of Financial Economics 48, 35-54.
EU, 2007, On a Simplified Business Environment for Companies in the Areas of Company Law, Accounting
and Auditing, Brussels: Commission of the European Communities, COM 394.
Experian, 2013. 7 Steps to a heavenly commercial credit score. Online, Available from:
http://www.experian.co.uk/about-us/index.html [Accessed 5 January 2013].
FASB, 1980. Statement of Financial Accounting Concepts No. 2: Qualitative Characteristics of Accounting
Information. Connecticut: Financial Accounting Standards Board.
Feltham, G., 1972. Information Evaluation, American Accounting Association monograph.
Fields, T., Lys, T. and Vincent, L., 2001. Empirical research on accounting choice. Journal of Accounting
and Economics, 31, 255–307.
Firth, M., 1997. The provision of non-audit services and the pricing of audit fees. Journal of Business
Finance & Accounting, 24 (3), 511–525.
Garrod, N., Kosi, U and Valentincic, A., 2008. Asset write-offs in the absence of agency problems. Journal
of Business Finance & Accounting, 35(3&4), 307-330.
Green, G. and Santilale, D., 2009. Statutory accounts: get them in on time. Practical Law Company
Magazine, 23 February.
Greene, W., 2003. Econometric Analysis, 5th
Ed. New Jersey: Prentice Hall.
Hirshleifer, J. 1971. The private and social value of information and the reward to inventive activity.
American Economic Review, 61(4), 561-574.

29
Hope, O., Thomas, W. and Vyas, D. (2011), ‘Financial credibility, ownership, and financing constraints in
private firms’, Journal of International Business Studies, 42 (7), pp. 935-57.
Hope, O., Thomas, W. and Vyas, D., 2013. Financial reporting quality of US private and public firms. The
Accounting Review 88(5), 1715-1742.
Hudson, J., 1987. The age, regional and industrial structure of company liquidations. Journal of Business
Finance &Accounting. 14(2), 199–213.
ICAEW, 2006. Review of How Accountants Support the Needs of Small and Medium-Sized Companies and
their Stakeholders, London: Institute of Chartered Accountants in England and Wales.
Impink, J., Lubberink, M., van Praag, B. and Veenman, D., 2012. Did accelerated filing requirements and
SOX Section 404 affect the timeliness of 10-K filings? Review of Accounting Studies, 17, 227-253.
Jensen M. and Meckling, W., 1976. Theory of the firm: Managerial behaviour, agency costs and capital
structure. Journal of Financial Economics, 3 (4), 305-360.
Kilsby & Williams LLP, 2011. Late filing companies feel the credit crunch. Online, Available from:
http://www.kilsbywilliams.com/accounts-news.php?id=36 [Accessed 5 January 2013].
Koenker, R. and Hallock, K.J., 2001. Quantile regression. Journal of Economic Perspectives, 15 (4), 143–
156.
Lee, H, Mande, V. and Son, M., 2008. A Comparison of reporting lags of multinational and domestic firms’
Journal of International Financial Management and Accounting, 19(1), 28-56.
Leftwich, R., 1983. Accounting information in private markets: evidence from private lending agreements.
The Accounting Review 58(1), 23-42.
Lennox, C., Pittman, J., 2011. Voluntary audits versus mandatory audits. The Accounting Review, 86(5),
1655-1678.
Leuz, C., 2010. Different approaches to corporate reporting regulation: how jurisdictions differ and why’
Accounting and Business Research, 40(3), 229-256.
Leuz, C. and Wysocki, P., 2008. Economic consequences of financial reporting and disclosure regulation: a
review and suggestions for future research. Working paper, University of Chicago and MIT Sloan
School of Management.
Leventis, S. and Weetman, P., 2004. Timeliness of financial reporting: Applicability of disclosure theories
in an emerging capital market. Accounting and Business Research, 34(1), 43-56.
Linck, J., Netter, J. and Shu, T., 2013. Can managers use discretionary accruals to ease financial
constraints? Evidence from discretionary accruals prior to investment. The Accounting Review, 88
(6), 2117-2143.
Luypaert, M., Van Canaghem, T. and Van Uytbergen, S. 2013. Delay in filing the financial statements: An
empirical analysis among small firms. Unpublished working paper, KU Leuven.
Machado, J. and Santos-Silva, J. 2005. Quantiles for counts. Journal of the American Statistical
Association, 100(472), 1226-1237.
Owusu-Ansah, S., 2000. Timeliness of corporate financial reporting in emerging capital markets: empirical
evidence from the Zimbabwe stock exchange. Accounting and Business Research, 30(3), 241-254.

30
Peek, E., Cuijpers, R. and Buijink, W., 2010. Creditors’ and shareholders’ reporting demands in public
versus private firms: Evidence from Europe. Contemporary Accounting Research, Spring, 49-91.
Polito, V., 2009. Measuring the effective tax burden in the real world. Fiscal Studies, 30(2), 247-278.
Press, E. and Weintrop, J., 1990. Accounting-based constraints in public and private debt agreements, their
association with leverage and impact on accounting choice. Journal of Accounting and Economics,
12, 65–95.
RIA, 2007. Companies Act 2007: Regulatory Impact Assessment. London: HMSO.
Szcsesny, A. and Valentincic, A., 2013. Asset write-offs in private firms – The case of German SMEs.
Journal of Business Finance & Accounting 40(3&4), 285-317.
Suphap, W., 2004. Getting it right versus getting it quick: The quality-timeliness trade-off in corporate
disclosure. Columbia Business Law Review, 661-689.
Todd, P. ,1999. A Practical Guide to Implementing Matching Estimators’, Mimeo, Available from:
http://www.citeulike.org/user/tkravitz/author/Todd:P [Accessed 28 November 2013].
Van Tendeloo, B. and Vanstraelen, A., 2008.Earnings management and audit quality in Europe: Evidence
from the private client segment market. European Accounting Review, 17(3), 447-469.
Verbeek, M., 2004. A Guide to Modern Econometrics. Chichester: John Wiley & Sons.
Winkelmann, R. and Zimmermann, K. 1995. Recent developments in count data modelling: theory and application. Journal of Economic Surveys, 9(1), 1–24.
Yermack, D., 1996. Higher market valuation of companies with a small board of directors. Journal of
Financial Economics, 40, 185-211.
Zeileis, A., Kleiber, C. and Jackman, S., 2008. Regression models for count data in R. Journal of Statistical
Software, 27(8), 1–25.
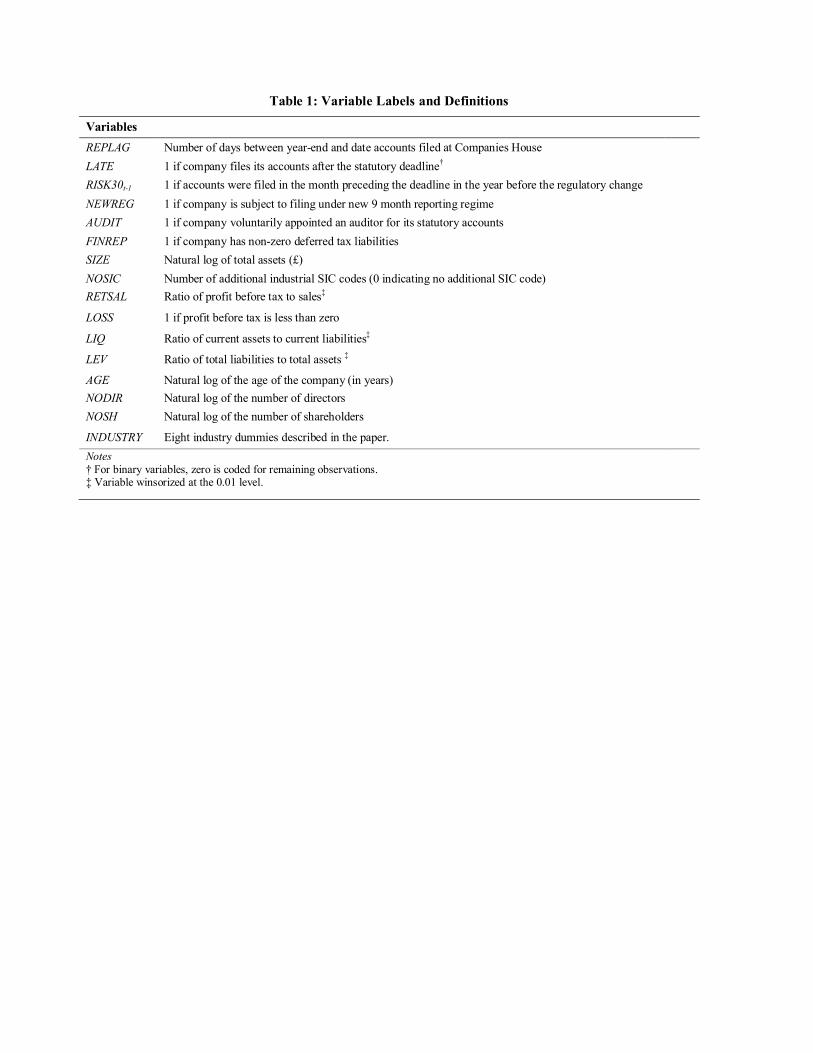
Table 1: Variable Labels and Definitions
Variables
REPLAG Number of days between year-end and date accounts filed at Companies House
LATE 1 if company files its accounts after the statutory deadline†
RISK30t-1 1 if accounts were filed in the month preceding the deadline in the year before the regulatory change
NEWREG 1 if company is subject to filing under new 9 month reporting regime
AUDIT 1 if company voluntarily appointed an auditor for its statutory accounts
FINREP 1 if company has non-zero deferred tax liabilities
SIZE Natural log of total assets (£)
NOSIC
RETSAL
Number of additional industrial SIC codes (0 indicating no additional SIC code)
Ratio of profit before tax to sales‡
LOSS 1 if profit before tax is less than zero
LIQ Ratio of current assets to current liabilities‡
LEV Ratio of total liabilities to total assets ‡
AGE
NODIR
NOSH
Natural log of the age of the company (in years)
Natural log of the number of directors
Natural log of the number of shareholders
INDUSTRY Eight industry dummies described in the paper.
Notes
† For binary variables, zero is coded for remaining observations. ‡ Variable winsorized at the 0.01 level.
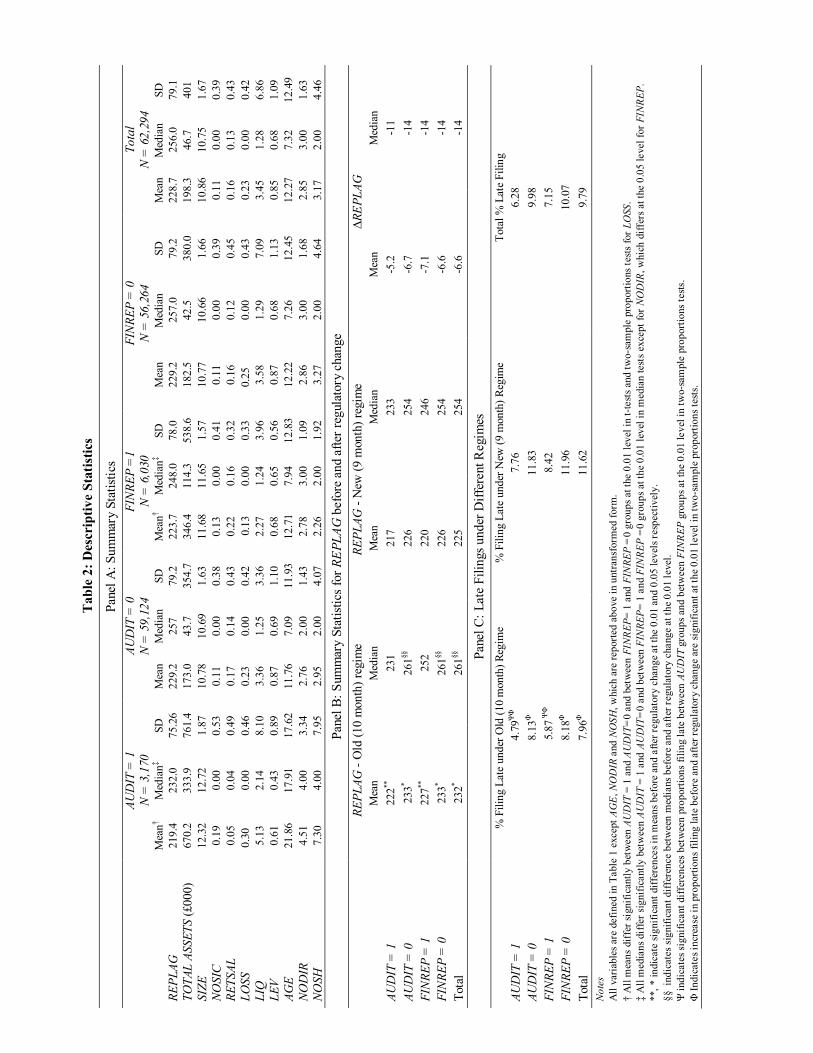
Ta
ble
2:
Des
crip
tiv
e S
tati
stic
s
Pan
el A
: S
um
mar
y S
tati
stic
s
A
UD
IT =
1
N =
3,1
70
AU
DIT
= 0
N
= 5
9,124
FIN
RE
P =1
N
= 6
,030
FIN
RE
P =
0
N =
56,2
64
Tota
l
N =
62,2
94
M
ean
†
Med
ian
‡
SD
M
ean
M
edia
n
SD
M
ean
†
Med
ian
‡
SD
M
ean
M
edia
n
SD
M
ean
M
edia
n
SD
RE
PL
AG
2
19
.4
23
2.0
7
5.2
6
22
9.2
2
57
79
.2
22
3.7
2
48
.0
78
.0
22
9.2
2
57
.0
79
.2
22
8.7
2
56
.0
79
.1
TO
TA
L A
SS
ET
S (
£0
00
) 6
70
.2
33
3.9
7
61
.4
17
3.0
4
3.7
3
54
.7
34
6.4
1
14
.3
53
8.6
1
82.5
4
2.5
3
80
.0
19
8.3
4
6.7
4
01
SIZ
E
12
.32
1
2.7
2
1.8
7
10
.78
1
0.6
9
1.6
3
11
.68
1
1.6
5
1.5
7
10
.77
10
.66
1.6
6
10
.86
10
.75
1.6
7
NO
SIC
0
.19
0.0
0
0.5
3
0.1
1
0.0
0
0.3
8
0.1
3
0.0
0
0.4
1
0.1
1
0.0
0
0.3
9
0.1
1
0.0
0
0.3
9
RE
TSA
L
0.0
5
0.0
4
0.4
9
0.1
7
0.1
4
0.4
3
0.2
2
0.1
6
0.3
2
0.1
6
0.1
2
0.4
5
0.1
6
0.1
3
0.4
3
LO
SS
0
.30
0
.00
0.4
6
0.2
3
0
.00
0.4
2
0
.13
0.0
0
0.3
3
0.2
5
0.0
0
0.4
3
0.2
3
0.0
0
0.4
2
LIQ
5
.13
2.1
4
8.1
0
3.3
6
1.2
5
3.3
6
2.2
7
1.2
4
3.9
6
3.5
8
1.2
9
7.0
9
3.4
5
1.2
8
6.8
6
LE
V
0.6
1
0.4
3
0.8
9
0.8
7
0.6
9
1.1
0
0.6
8
0.6
5
0.5
6
0.8
7
0.6
8
1.1
3
0.8
5
0.6
8
1.0
9
AG
E
21
.86
1
7.9
1
17
.62
11
.76
7
.09
11
.93
12
.71
7
.94
1
2.8
3
12
.22
7.2
6
12
.45
12
.27
7.3
2
12
.49
NO
DIR
4
.51
4.0
0
3.3
4
2.7
6
2.0
0
1.4
3
2.7
8
3.0
0
1.0
9
2.8
6
3.0
0
1.6
8
2.8
5
3.0
0
1.6
3
NO
SH
7
.30
4.0
0
7.9
5
2.9
5
2.0
0
4.0
7
2.2
6
2.0
0
1.9
2
3.2
7
2.0
0
4.6
4
3.1
7
2.0
0
4.4
6
Pan
el B
: S
um
mar
y S
tati
stic
s fo
r R
EP
LA
G b
efore
an
d a
fter
reg
ulat
ory
chan
ge
R
EP
LA
G -
Old
(1
0 m
onth
) re
gim
e R
EP
LA
G -
New
(9 m
onth
) re
gim
e ∆
RE
PL
AG
M
ean
M
edia
n
Mea
n
Med
ian
M
ean
M
edia
n
AU
DIT
= 1
2
22
**
23
1
21
7
23
3
-5.2
-1
1
AU
DIT
= 0
2
33
*
26
1§§
22
6
25
4
-6.7
-1
4
FIN
RE
P =
1
22
7**
25
2
22
0
24
6
-7.1
-1
4
FIN
RE
P =
0
23
3*
26
1§§
22
6
25
4
-6.6
-1
4
Tot
al
23
2*
26
1§§
22
5
25
4
-6.6
-1
4
Pan
el C
: L
ate
Fil
ings
un
der
Dif
fere
nt
Reg
imes
%
Fil
ing L
ate
un
der
Old
(1
0 m
on
th)
Reg
ime
% F
ilin
g L
ate
un
der
New
(9 m
on
th)
Reg
ime
Tota
l %
Lat
e F
ilin
g
AU
DIT
= 1
4.7
9Ψ
Φ
7.7
6
6.2
8
AU
DIT
= 0
8
.13
Φ
11
.83
9
.98
FIN
RE
P =
1
5
.87
ΨΦ
8.4
2
7.1
5
FIN
RE
P =
0
8.1
8Φ
11
.96
1
0.0
7
Tot
al
7.9
6Φ
11
.62
9
.79
No
tes
All
vari
able
s are
defi
ned
in
Table
1 e
xcept
AG
E,
NO
DIR
and
NO
SH
, w
hic
h a
re r
ep
ort
ed
ab
ove i
n u
ntr
an
sform
ed
form
.
† A
ll m
ean
s dif
fer
signif
icantl
y b
etw
een
AU
DIT
= 1
an
d A
UD
IT=
0 a
nd
bet
ween
FIN
RE
P=
1 a
nd
FIN
RE
P =
0 g
rou
ps
at
the 0
.01
lev
el i
n t
-test
s and
tw
o-s
am
ple
pro
port
ions
test
s fo
r LO
SS
.
‡ A
ll m
edia
ns
dif
fer
sig
nif
icantl
y b
etw
een
AU
DIT
= 1
and
AU
DIT
=0
and
bet
ween
FIN
RE
P=
1 a
nd F
INR
EP
=0
gro
up
s at
the
0.0
1 l
evel
in
media
n t
est
s ex
cept
for
NO
DIR
, w
hic
h d
iffe
rs a
t th
e 0
.05
level
for
FIN
RE
P.
**,
* i
ndic
ate
sig
nif
icant
dif
fere
nce
s in
mea
ns
befo
re a
nd
aft
er
regu
lato
ry c
han
ge a
t th
e 0
.01
an
d 0
.05
lev
els
resp
ect
ivel
y.
§§
in
dic
ate
s si
gnif
ican
t dif
fere
nce b
etw
een
med
ians
befo
re a
nd a
fter
regu
lato
ry c
hang
e a
t th
e 0
.01
lev
el.
Ψ i
nd
icate
s si
gnif
icant
dif
fere
nces
bet
wee
n p
rop
ort
ion
s fi
lin
g l
ate
bet
ween
AU
DIT
gro
up
s an
d b
etw
een F
INR
EP
gro
up
s at
the 0
.01 l
ev
el i
n t
wo-s
am
ple
pro
port
ions
test
s.
Φ I
ndic
ate
s in
crea
se i
n p
rop
ort
ion
s fi
ling
late
befo
re a
nd
aft
er r
egu
lato
ry c
han
ge a
re s
ignif
icant
at
the 0
.01
level
in t
wo
-sam
ple
pro
port
ion
s te
sts.
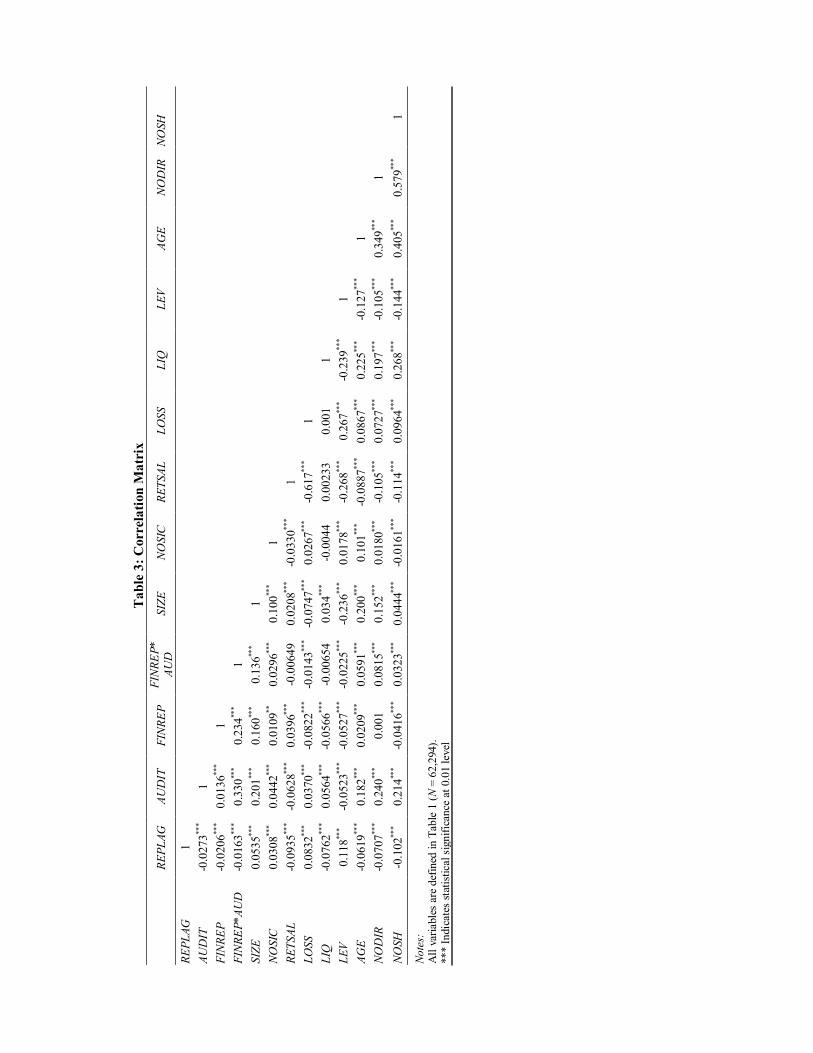
Ta
ble
3:
Corr
ela
tion
Ma
trix
RE
PL
AG
A
UD
IT
FIN
RE
P
FIN
RE
P*
A
UD
SIZ
E
NO
SIC
R
ET
SA
L
LO
SS
LIQ
L
EV
A
GE
NO
DIR
NO
SH
RE
PL
AG
1
AU
DIT
-0
.0273
**
*
1
F
INR
EP
-0
.0206
**
*
0.0
136
**
*
1
FIN
RE
P*A
UD
-0
.0163
**
*
0.3
30
**
*
0.2
34
**
*
1
SIZ
E
0.0
535
**
*
0.2
01
**
*
0.1
60
**
*
0.1
36
**
*
1
NO
SIC
0.0
308
**
*
0.0
442
**
*
0.0
109
**
0.0
296
**
*
0.1
00
**
*
1
R
ET
SA
L
-0.0
935
**
*
-0.0
628
**
*
0.0
396*
**
-0.0
0649
0.0
208*
**
-0.0
330
**
* 1
LO
SS
0.0
832
**
*
0.0
370
**
*
-0.0
822
**
*
-0.0
143
**
* -0
.0747
**
*
0.0
267
**
*
-0.6
17
**
*
1
L
IQ
-0.0
762
**
*
0.0
564
**
*
-0.0
566
**
*
-0.0
0654
0.0
34
**
*
-0.0
044
0.0
0233
0.0
01
1
LE
V
0.1
18
**
*
-0.0
523
**
*
-0.0
527
**
*
-0.0
225
**
* -0
.236
**
* 0.0
178
**
*
-0.2
68
**
*
0.2
67
**
*
-0.2
39
**
*
1
A
GE
-0
.0619
**
*
0.1
82
**
*
0.0
209*
**
0.0
591
**
*
0.2
00
**
*
0.1
01
**
* -0
.0887
**
*
0.0
867
**
*
0.2
25
**
*
-0.1
27
**
*
1
NO
DIR
-0
.0707
**
*
0.2
40
**
*
0.0
01
0.0
815
**
*
0.1
52
**
*
0.0
180
**
*
-0.1
05
**
*
0.0
727
**
*
0.1
97
**
*
-0.1
05
**
*
0.3
49
**
*
1
NO
SH
-0
.102
**
*
0.2
14
**
*
-0.0
416
**
*
0.0
323
**
*
0.0
444*
**
-0.0
161
**
* -0
.114
**
*
0.0
964
**
*
0.2
68
**
*
-0.1
44
**
*
0.4
05
**
*
0.5
79
**
*
1
Note
s:
All
var
iable
s ar
e d
efin
ed i
n T
able
1 (
N =
62
,294).
*** I
ndic
ates
sta
tist
ical
sig
nif
ican
ce a
t 0.0
1 l
evel
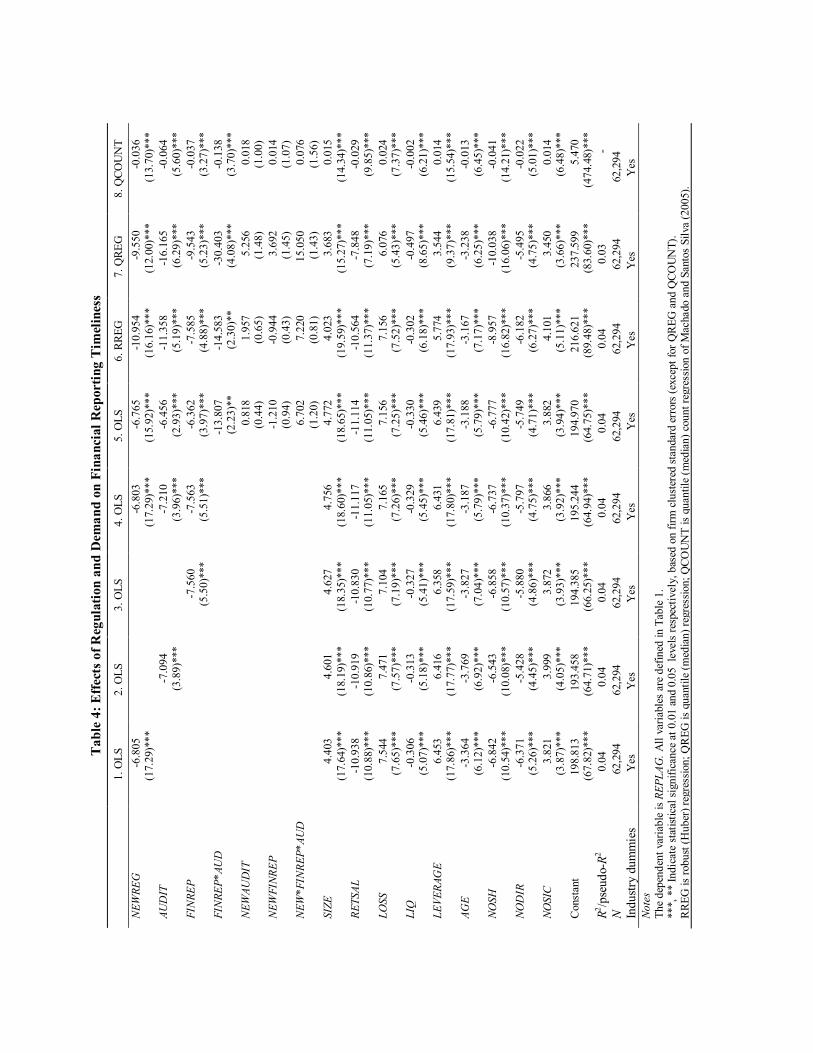
Ta
ble
4:
Eff
ects
of
Reg
ula
tion
an
d D
ema
nd
on
Fin
an
cial
Rep
ort
ing
Tim
elin
ess
1
. O
LS
2
. O
LS
3
. O
LS
4
. O
LS
5
. O
LS
6
. R
RE
G
7. Q
RE
G
8. Q
CO
UN
T
NE
WR
EG
-6
.80
5
-6.8
03
-6.7
65
-10
.95
4
-9.5
50
-0.0
36
(1
7.2
9)*
**
(17.2
9)*
**
(1
5.9
2)*
**
(1
6.1
6)*
**
(1
2.0
0)*
**
(1
3.7
0)*
**
AU
DIT
-7.0
94
-7
.21
0
-6.4
56
-11
.35
8
-16
.16
5
-0.0
64
(3.8
9)*
**
(3
.96
)***
(2
.93
)***
(5
.19
)***
(6
.29
)***
(5
.60
)***
FIN
RE
P
-7.5
60
-7.5
63
-6.3
62
-7.5
85
-9.5
43
-0.0
37
(5
.50
)***
(5
.51
)***
(3
.97
)***
(4
.88
)***
(5
.23
)***
(3
.27
)***
FIN
RE
P*
AU
D
-13
.80
7
-14
.58
3
-30
.40
3
-0.1
38
(2
.23
)**
(2.3
0)*
* (4
.08
)***
(3
.70
)***
NE
WA
UD
IT
0.8
18
1.9
57
5.2
56
0.0
18
(0
.44
) (0
.65
) (1
.48
) (1
.00
)
NE
WF
INR
EP
-1
.21
0
-0.9
44
3.6
92
0.0
14
(0
.94
) (0
.43
) (1
.45
) (1
.07
)
NE
W*F
INR
EP
*A
UD
6
.702
7.2
20
15
.05
0
0.0
76
(1
.20
) (0
.81
) (1
.43
) (1
.56
)
SIZ
E
4.4
03
4.6
01
4.6
27
4.7
56
4.7
72
4.0
23
3.6
83
0.0
15
(1
7.6
4)*
**
(18.1
9)*
**
(18.3
5)*
**
(1
8.6
0)*
**
(1
8.6
5)*
**
(1
9.5
9)*
**
(1
5.2
7)*
**
(1
4.3
4)*
**
RE
TSA
L
-10
.93
8
-10
.91
9
-10
.83
0
-11
.11
7
-11
.11
4
-10
.56
4
-7.8
48
-0.0
29
(1
0.8
8)*
**
(10.8
6)*
**
(10.7
7)*
**
(1
1.0
5)*
**
(1
1.0
5)*
**
(1
1.3
7)*
**
(7
.19
)***
(9
.85
)***
LO
SS
7.5
44
7.4
71
7.1
04
7.1
65
7.1
56
7.1
56
6.0
76
0.0
24
(7
.65
)***
(7.5
7)*
**
(7.1
9)*
**
(7
.26
)***
(7
.25
)***
(7
.52
)***
(5
.43
)***
(7
.37
)***
LIQ
-0
.30
6
-0.3
13
-0.3
27
-0.3
29
-0.3
30
-0.3
02
-0.4
97
-0.0
02
(5
.07
)***
(5.1
8)*
**
(5.4
1)*
**
(5
.45
)***
(5
.46
)***
(6
.18
)***
(8
.65
)***
(6
.21
)***
LE
VE
RA
GE
6
.453
6.4
16
6.3
58
6.4
31
6.4
39
5.7
74
3.5
44
0.0
14
(1
7.8
6)*
**
(17.7
7)*
**
(17.5
9)*
**
(1
7.8
0)*
**
(1
7.8
1)*
**
(1
7.9
3)*
**
(9
.37
)***
(1
5.5
4)*
**
AG
E
-3.3
64
-3.7
69
-3.8
27
-3.1
87
-3.1
88
-3.1
67
-3.2
38
-0.0
13
(6
.12
)***
(6.9
2)*
**
(7.0
4)*
**
(5
.79
)***
(5
.79
)***
(7
.17
)***
(6
.25
)***
(6
.45
)***
NO
SH
-6
.84
2
-6.5
43
-6.8
58
-6.7
37
-6.7
77
-8.9
57
-10
.03
8
-0.0
41
(1
0.5
4)*
**
(10.0
8)*
**
(10.5
7)*
**
(1
0.3
7)*
**
(1
0.4
2)*
**
(1
6.8
2)*
**
(1
6.0
6)*
**
(1
4.2
1)*
**
NO
DIR
-6
.37
1
-5.4
28
-5.8
80
-5.7
97
-5.7
49
-6.1
82
-5.4
95
-0.0
22
(5
.26
)***
(4.4
5)*
**
(4.8
6)*
**
(4
.75
)***
(4
.71
)***
(6
.27
)***
(4
.75
)***
(5
.01
)***
NO
SIC
3
.821
3.9
99
3.8
72
3.8
66
3.8
82
4.1
01
3.4
50
0.0
14
(3
.87
)***
(4.0
5)*
**
(3.9
3)*
**
(3
.92
)***
(3
.94
)***
(5
.11
)***
(3
.66
)***
(6
.48
)***
Const
ant
19
8.8
13
19
3.4
58
19
4.3
85
19
5.2
44
19
4.9
70
21
6.6
21
23
7.5
99
5.4
70
(6
7.8
2)*
**
(64.7
1)*
**
(66.2
5)*
**
(6
4.9
4)*
**
(6
4.7
5)*
**
(8
9.4
8)*
**
(8
3.6
0)*
**
(4
74.4
8)*
**
R2/p
seu
do-
R2
0.0
4
0.0
4
0.0
4
0.0
4
0.0
4
0.0
4
0.0
3
-
N
62
,29
4
6
2,2
94
6
2,2
94
6
2,2
94
6
2,2
94
6
2,2
94
6
2,2
94
62
,29
4
Ind
ust
ry d
um
mie
s
Y
es
Y
es
Y
es
Y
es
Yes
Y
es
Y
es
Yes
Note
s
The
dep
end
ent
vari
able
is
RE
PL
AG
. A
ll v
aria
ble
s ar
e d
efin
ed i
n T
able
1.
***,
**
Ind
icat
e st
atis
tica
l si
gn
ific
ance
at
0.0
1 a
nd 0
.05
leve
ls r
espec
tivel
y,
bas
ed o
n f
irm
clu
ster
ed s
tan
dar
d e
rrors
(ex
cep
t fo
r Q
RE
G a
nd
QC
OU
NT
).
RR
EG
is
rob
ust
(H
ub
er)
regre
ssio
n;
QR
EG
is
qu
anti
le (
med
ian
) re
gre
ssio
n;
QC
OU
NT
is
qu
anti
le (
med
ian
) co
un
t re
gre
ssio
n o
f M
achado a
nd
San
tos
Sil
va (
20
05).
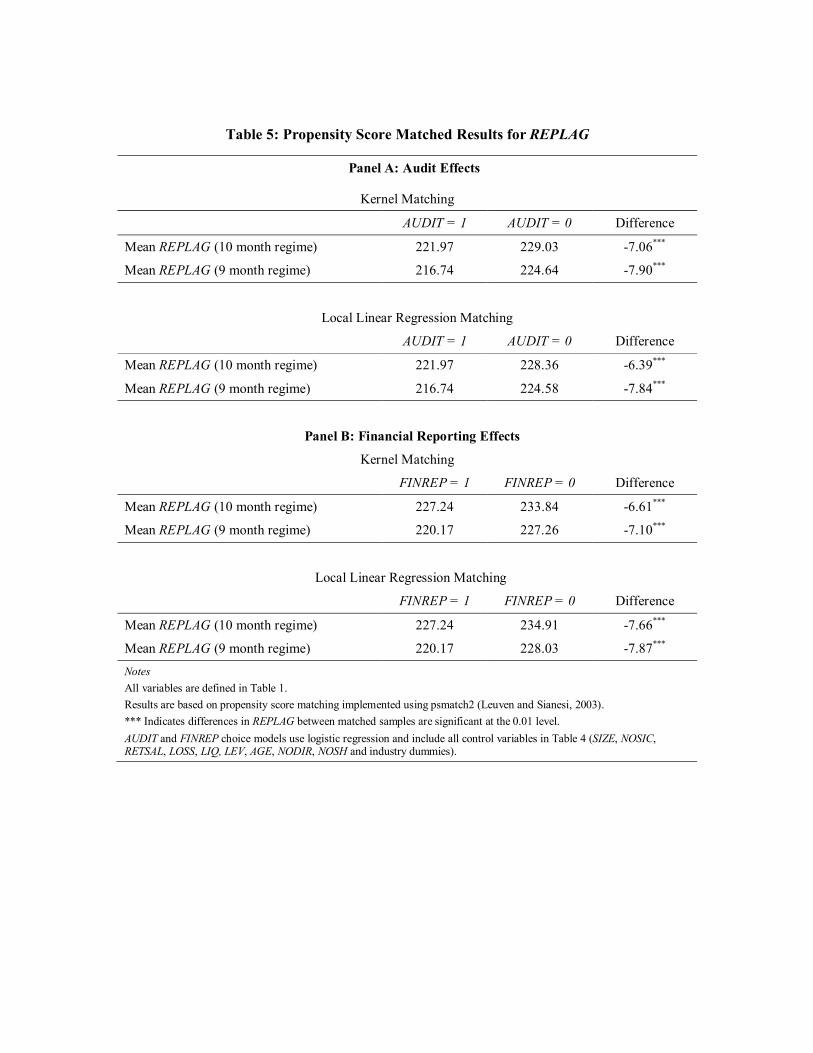
Table 5: Propensity Score Matched Results for REPLAG
Panel A: Audit Effects
Kernel Matching
AUDIT = 1 AUDIT = 0 Difference
Mean REPLAG (10 month regime) 221.97 229.03 -7.06***
Mean REPLAG (9 month regime) 216.74 224.64 -7.90***
Local Linear Regression Matching
AUDIT = 1 AUDIT = 0 Difference
Mean REPLAG (10 month regime) 221.97 228.36 -6.39***
Mean REPLAG (9 month regime) 216.74 224.58 -7.84***
Panel B: Financial Reporting Effects
Kernel Matching
FINREP = 1 FINREP = 0 Difference
Mean REPLAG (10 month regime) 227.24 233.84 -6.61***
Mean REPLAG (9 month regime) 220.17 227.26 -7.10***
Local Linear Regression Matching
FINREP = 1 FINREP = 0 Difference
Mean REPLAG (10 month regime) 227.24 234.91 -7.66***
Mean REPLAG (9 month regime) 220.17 228.03 -7.87***
Notes
All variables are defined in Table 1.
Results are based on propensity score matching implemented using psmatch2 (Leuven and Sianesi, 2003).
*** Indicates differences in REPLAG between matched samples are significant at the 0.01 level.
AUDIT and FINREP choice models use logistic regression and include all control variables in Table 4 (SIZE, NOSIC, RETSAL, LOSS, LIQ, LEV, AGE, NODIR, NOSH and industry dummies).
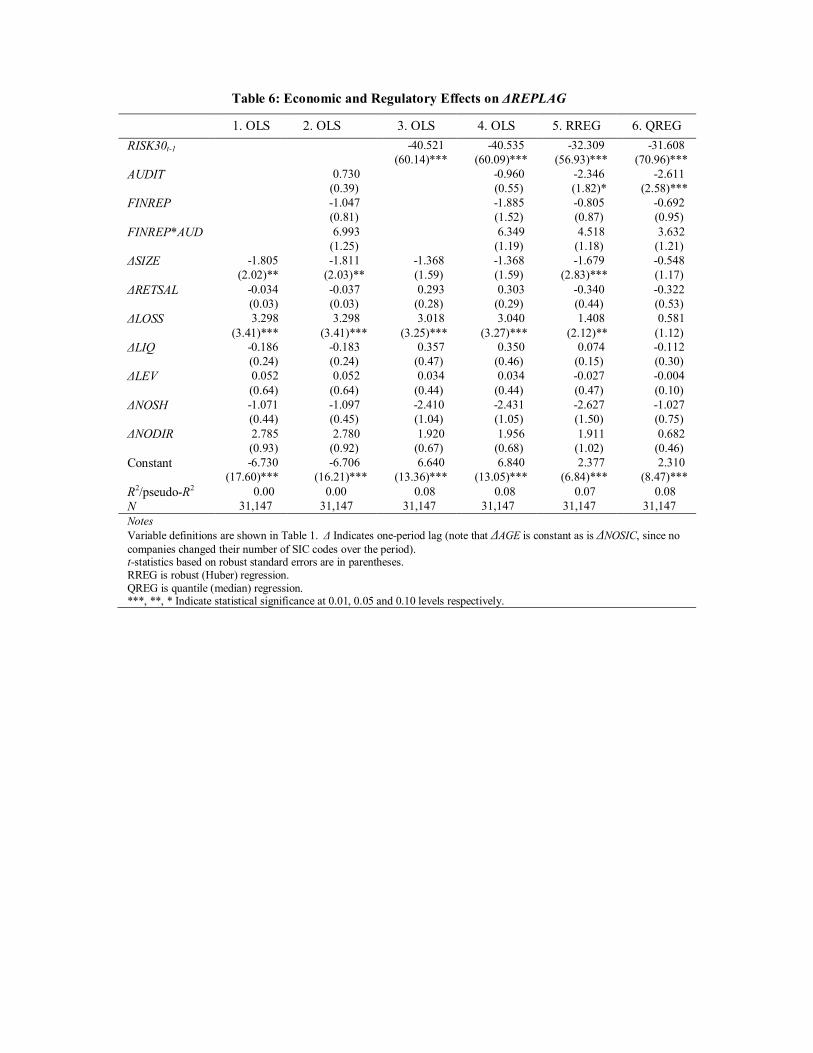
Table 6: Economic and Regulatory Effects on ΔREPLAG
1. OLS 2. OLS 3. OLS 4. OLS 5. RREG 6. QREG
RISK30t-1 -40.521 -40.535 -32.309 -31.608
(60.14)*** (60.09)*** (56.93)*** (70.96)***
AUDIT 0.730 -0.960 -2.346 -2.611
(0.39) (0.55) (1.82)* (2.58)***
FINREP -1.047 -1.885 -0.805 -0.692
(0.81) (1.52) (0.87) (0.95)
FINREP*AUD 6.993 6.349 4.518 3.632
(1.25) (1.19) (1.18) (1.21)
ΔSIZE -1.805 -1.811 -1.368 -1.368 -1.679 -0.548
(2.02)** (2.03)** (1.59) (1.59) (2.83)*** (1.17)
ΔRETSAL -0.034 -0.037 0.293 0.303 -0.340 -0.322
(0.03) (0.03) (0.28) (0.29) (0.44) (0.53)
ΔLOSS 3.298 3.298 3.018 3.040 1.408 0.581
(3.41)*** (3.41)*** (3.25)*** (3.27)*** (2.12)** (1.12)
ΔLIQ -0.186 -0.183 0.357 0.350 0.074 -0.112
(0.24) (0.24) (0.47) (0.46) (0.15) (0.30)
ΔLEV 0.052 0.052 0.034 0.034 -0.027 -0.004
(0.64) (0.64) (0.44) (0.44) (0.47) (0.10)
ΔNOSH -1.071 -1.097 -2.410 -2.431 -2.627 -1.027
(0.44) (0.45) (1.04) (1.05) (1.50) (0.75)
ΔNODIR 2.785 2.780 1.920 1.956 1.911 0.682
(0.93) (0.92) (0.67) (0.68) (1.02) (0.46)
Constant -6.730 -6.706 6.640 6.840 2.377 2.310
(17.60)*** (16.21)*** (13.36)*** (13.05)*** (6.84)*** (8.47)***
R2/pseudo-R2 0.00 0.00 0.08 0.08 0.07 0.08
N 31,147 31,147 31,147 31,147 31,147 31,147
Notes
Variable definitions are shown in Table 1. Δ Indicates one-period lag (note that ΔAGE is constant as is ΔNOSIC, since no
companies changed their number of SIC codes over the period). t-statistics based on robust standard errors are in parentheses.
RREG is robust (Huber) regression.
QREG is quantile (median) regression. ***, **, * Indicate statistical significance at 0.01, 0.05 and 0.10 levels respectively.
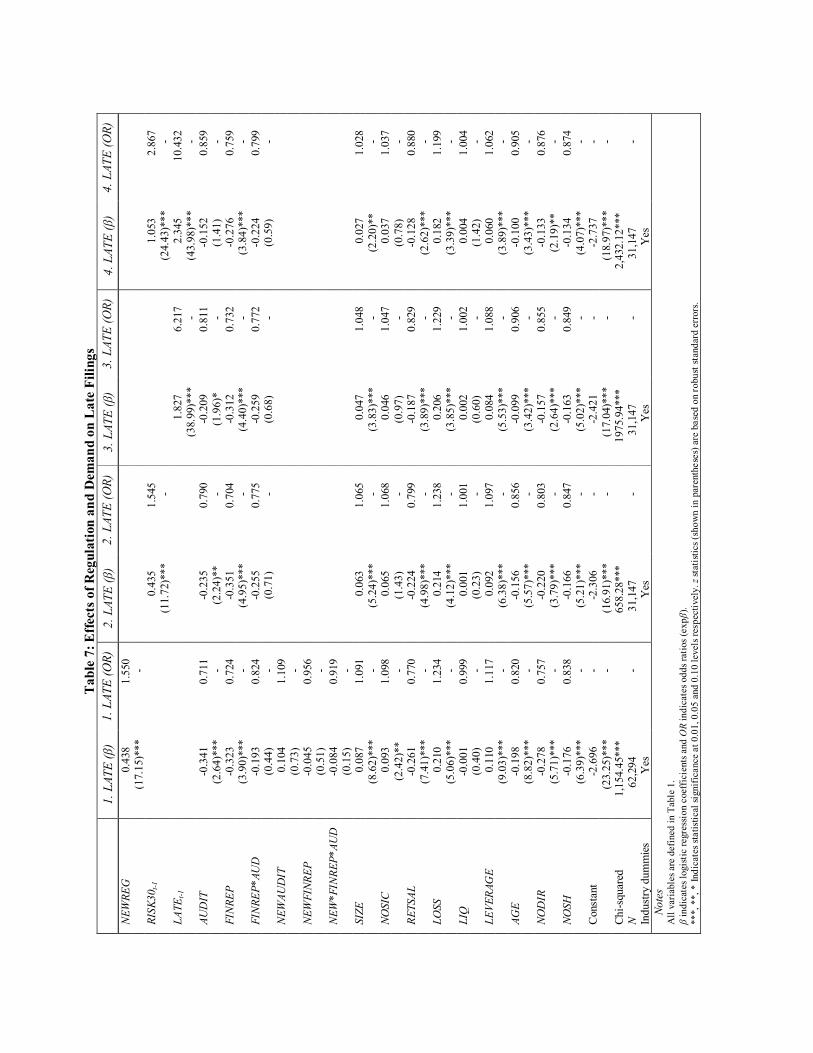
Ta
ble
7:
Eff
ects
of
Reg
ula
tion
an
d D
ema
nd
on
La
te F
ilin
gs
1
. L
AT
E (
) 1
. L
AT
E (O
R)
2.
LA
TE
(
) 2.
LA
TE
(O
R)
3.
LA
TE
()
3.
LA
TE
(O
R)
4.
LA
TE
(
) 4.
LA
TE
(O
R)
NE
WR
EG
0
.438
1.5
50
(1
7.1
5)*
**
-
RIS
K3
0t-1
0.4
35
1.5
45
1
.053
2.8
67
(1
1.7
2)*
**
-
(24.4
3)*
**
-
LA
TE
t-1
1.8
27
6.2
17
2
.345
10
.43
2
(3
8.9
9)*
**
-
(43.9
8)*
**
- A
UD
IT
-0.3
41
0.7
11
-0.2
35
0.7
90
-0
.20
9
0.8
11
-0
.15
2
0.8
59
(2
.64
)***
-
(2.2
4)*
* -
(1.9
6)*
-
(1.4
1)
-
FIN
RE
P
-0.3
23
0.7
24
-0.3
51
0.7
04
-0
.31
2
0.7
32
-0
.27
6
0.7
59
(3
.90
)***
-
(4.9
5)*
**
-
(4.4
0)*
**
-
(3.8
4)*
**
-
FIN
RE
P*
AU
D
-0.1
93
0.8
24
-0.2
55
0.7
75
-0
.25
9
0.7
72
-0
.22
4
0.7
99
(0
.44
) -
(0.7
1)
- (0
.68
) -
(0.5
9)
-
NE
WA
UD
IT
0.1
04
1.1
09
(0
.73
) -
NE
WF
INR
EP
-0
.04
5
0.9
56
(0
.51
) -
NE
W*F
INR
EP
*A
UD
-0
.08
4
0.9
19
(0
.15
) -
SIZ
E
0.0
87
1.0
91
0.0
63
1.0
65
0
.047
1.0
48
0
.027
1.0
28
(8
.62
)***
-
(5.2
4)*
**
-
(3.8
3)*
**
-
(2.2
0)*
*
- NO
SIC
0
.093
1.0
98
0.0
65
1.0
68
0
.046
1.0
47
0
.037
1.0
37
(2
.42
)**
- (1
.43
) -
(0.9
7)
- (0
.78
) -
RE
TSA
L
-0.2
61
0.7
70
-0.2
24
0.7
99
-0
.18
7
0.8
29
-0
.12
8
0.8
80
(7
.41
)***
-
(4.9
8)*
**
-
(3.8
9)*
**
-
(2.6
2)*
**
-
LO
SS
0.2
10
1.2
34
0.2
14
1.2
38
0
.206
1.2
29
0
.182
1.1
99
(5
.06
)***
-
(4.1
2)*
**
-
(3.8
5)*
**
-
(3.3
9)*
**
-
LIQ
-0
.00
1
0.9
99
0.0
01
1.0
01
0
.002
1.0
02
0
.004
1.0
04
(0
.40
) -
(0.2
3)
- (0
.60
) -
(1.4
2)
-
LE
VE
RA
GE
0
.110
1.1
17
0.0
92
1.0
97
0
.084
1.0
88
0
.060
1.0
62
(9
.03
)***
-
(6.3
8)*
**
-
(5.5
3)*
**
-
(3.8
9)*
**
-
AG
E
-0.1
98
0.8
20
-0.1
56
0.8
56
-0
.09
9
0.9
06
-0
.10
0
0.9
05
(8
.82
)***
-
(5.5
7)*
**
-
(3.4
2)*
**
-
(3.4
3)*
**
-
NO
DIR
-0
.27
8
0.7
57
-0.2
20
0.8
03
-0
.15
7
0.8
55
-0
.13
3
0.8
76
(5
.71
)***
-
(3.7
9)*
**
-
(2.6
4)*
**
-
(2.1
9)*
*
-
NO
SH
-0
.17
6
0.8
38
-0.1
66
0.8
47
-0
.16
3
0.8
49
-0
.13
4
0.8
74
(6
.39
)***
-
(5.2
1)*
**
-
(5.0
2)*
**
-
(4.0
7)*
**
-
Const
ant
-2.6
96
- -2
.30
6
- -2
.42
1
- -2
.73
7
-
(2
3.2
5)*
**
-
(16.9
1)*
**
-
(17.0
4)*
**
-
(18.9
7)*
**
- C
hi-
squar
ed
1
,15
4.4
5***
65
8.2
8***
19
75.9
4***
2,4
32
.12
***
N
62
,29
4
- 3
1,1
47
- 3
1,1
47
- 3
1,1
47
- In
dust
ry d
um
mie
s Y
es
Y
es
Y
es
Y
es
Note
s A
ll v
aria
ble
s ar
e d
efin
ed i
n T
able
1.
i
nd
icat
es l
ogis
tic
regre
ssio
n c
oef
fici
ents
and
OR
in
dic
ates
od
ds
rati
os
(ex
p
).
**
*,
**,
* I
nd
icat
es s
tati
stic
al s
ignif
icance
at
0.0
1, 0
.05
and
0.1
0 l
evel
s re
spec
tivel
y. z
stat
isti
cs (
sho
wn
in
par
enth
ese
s) a
re b
ase
d o
n r
obu
st s
tand
ard
err
ors
.
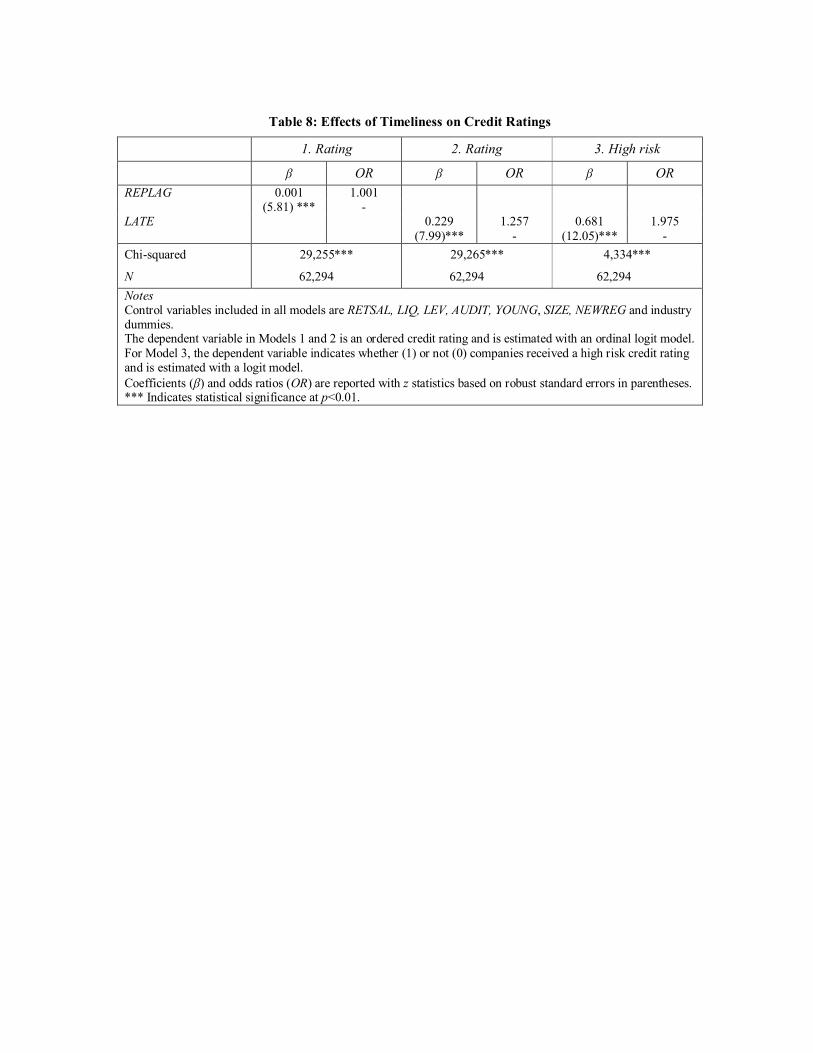
Table 8: Effects of Timeliness on Credit Ratings
1. Rating 2. Rating 3. High risk
OR OR OR
REPLAG 0.001 1.001 (5.81) *** - LATE 0.229 1.257 0.681 1.975
(7.99)*** - (12.05)*** -
Chi-squared 29,255*** 29,265*** 4,334***
N 62,294 62,294 62,294
Notes Control variables included in all models are RETSAL, LIQ, LEV, AUDIT, YOUNG, SIZE, NEWREG and industry dummies. The dependent variable in Models 1 and 2 is an ordered credit rating and is estimated with an ordinal logit model.
For Model 3, the dependent variable indicates whether (1) or not (0) companies received a high risk credit rating and is estimated with a logit model.
Coefficients () and odds ratios (OR) are reported with z statistics based on robust standard errors in parentheses. *** Indicates statistical significance at p<0.01.