the underground economy in the late 1990s: evading taxes, or evading competition?
TRANSCRIPT

World Development Vol. 37, No. 10, pp. 1600–1611, 2009� 2009 Elsevier Ltd. All rights reserved
0305-750X/$ - see front matter
www.elsevier.com/locate/worlddevdoi:10.1016/j.worlddev.2009.03.001
The Underground Economy in the Late 1990s: Evading Taxes,
or Evading Competition?
LILIANE KARLINGER *
University of Vienna, Vienna, Austria
Summary. — This paper studies the driving forces behind the considerable expansion of the underground economy during the late 1990s.I propose a novel explanation for this phenomenon: the sharp increase in market competition worldwide, which reduces prices and prof-its and drives firms into the shadow economy. Empirical evidence from a panel covering 45 countries from 1995 to 2000 shows thatincreased competition is indeed correlated with an expansion of the underground economy. The effect is strongest in low-tax, high-cor-ruption countries that do not provide the public services which make it worthwhile for firms to remain official despite growingcompetitive pressure.� 2009 Elsevier Ltd. All rights reserved.
Key words — shadow economy, competition, corruption, OECD, Asia, Eastern Europe
* I am indebted to Massimo Motta, Frank Vella, Andrea Ichino, Pascal
Courty, Pedro Pita Barros, Oriana Bandiera, Patrick Rey, and two anony-
mous referees for valuable comments and suggestions. I have also benefited
from the comments of Joe Harrington, Jesus Crespo Cuaresma, Sofronis
Clerides, Giancarlo Corsetti, Gerd Muehlheusser, Thomas Rønde, and
Jochen Schanz. The usual disclaimer applies. Final revision accepted: March18, 2009.
1. INTRODUCTION
When the Austrian government changed the rules by whichpublic building contracts were assigned, what they had inmind was to intensify competition among construction firms,which would lead to lower prices and hence a better allocationof tax money. Under the new rules, local authorities wereforced to put each and every construction project out to ten-der, and to assign the contract to the lowest-price bid. This re-form was meant to create a level playing field for competitionin the construction industry, breaking with a long tradition ofdiscrimination against certain firms (and in favor of others) inthe assignment of building contracts. What nobody had ex-pected, however, was the dramatic surge in shadow economicactivity in the Austrian construction industry following theintroduction of the new rules and regulations. In a somewhatapologetic newspaper interview, the head of the Austrian Fed-eral Guild of the Construction Industry, Mr. Johannes Laho-fer, explained this development as a direct consequence of theintensified competition for public building contracts. 1
This paper endeavors to apply the causalities suggested bythis anecdote to the shadow economy at a much larger scale,in order to help explain the striking growth of the under-ground sectors all over the world that occurred in the late1990s. While none of the common measures of the phenome-non is immune to criticism, 2 there is evidence that the shadoweconomy was on the rise almost everywhere and in particularin the developing world. For instance, in Thailand, where theinformal sector has traditionally been pervasive, Schneider(2005) estimates that the shadow economy (as a share of offi-cial GDP) grew from 43% in 1990 to a staggering 52% in 2000.But even Indonesia, which is at the lower end of the distribu-tion, saw its shadow economy rise from 15% to almost 20%over the same decade, a growth rate of more than 30% in just10 years. The phenomenon is not confined to developing coun-tries: to give another example, South Korea, certainly amongthe most industrialized in the region, experienced an increasein its shadow economy from an already high 22% in 1990 toa stunning 27% in 2000.
Of course, the concept of ‘‘shadow economy” can mean dif-ferent things, and hence can have different causes, dependingon the country we consider. In less industrialized countries,
1600
weak administrative capacities imply that a considerable partof economic activity remains unrecorded, giving rise to whatis commonly called the ‘‘informal sector.” By contrast, in mostOECD countries, firms will deliberately conceal (part of) theirtransactions from public authorities to avoid the payment oftaxes and social security contributions, and to avoid compli-ance with certain legal standards, for example, labor marketregulations and trade licenses (see Friedman, Johnson, Kauf-mann, & Zoido-Lobaton, 2000; Johnson, Kaufmann, & Zoi-do-Lobaton, 1998; Lemieux, Fortin, & Frechette, 1994;Schneider & Enste, 2000). In either case, the term ‘‘shadoweconomy” as used in this paper represents those economicactivities which remain unrecorded although they should beincluded in the National Income Accounts.
As I will show, the movements in any of the conventionalexplanatory factors listed above can only partially explainthe considerable expansion of the shadow economy. For in-stance, Brazil’s marginal income tax rate increased by only2.5% during 1995–2000 (placing Brazil at the very low endof the distribution, with most countries seeing 2-digit increasesin their income tax rates over the same period), and othertypes of taxes (corporate and VAT) were even falling; labormarket regulations remained largely unchanged, and payrolltaxes were even cut slightly; yet Brazil’s shadow economy fol-lowed the general trend, increasing from 32% in 1990 to al-most 40% by 2000.
Now, it is well-known that the 1990s were characterized by asharp increase in market competition worldwide, which was aconsequence of reduced trade barriers, market liberalizationprograms, and improved communication and transportation(Gupta & Choudhry, 1997). This paper asks the questionwhether this increase in competitive pressure can help us ex-plain the expansion of the underground economy.

THE UNDERGROUND ECONOMY IN THE LATE 1990S: EVADING TAXES, OR EVADING COMPETITION? 1601
2. THE LINK BETWEEN MARKET COMPETITIONAND THE SHADOW ECONOMY
(a) Literature review
The theoretic literature on this question is very scarce. Somereaders may be reminded of Shleifer’s (2004) argument thatcompetition may promote unethical behavior (e.g., child laborand corruption). He highlights the trade-off between cost sav-ings afforded by the unethical behavior and the firm owner’sprivate disutility of behaving unethically, and finds that an in-crease in competition tilts this trade-off in favor of unethicalbehavior. But unlike the types of behavior studied by Shleifer(2004), shadow economic activity might not even be classifiedas ‘‘unethical” by many people. 3
One of the earliest empirical studies on the shadow economyusing firm-level data is Levenson and Maloney (1998). Theyassume that informal firms in developing countries havedynamics similar to firms in industrial countries: entrepreneurshave unobserved, differing cost structures that determine theirlong-run size and survival structures that they can only dis-cover by going into business. Informality is thought of as adecision to participate in societal institutions. Access to mech-anisms that ensure property rights, pool risk, or enforce con-tracts become more important as a firm grows, and theentrepreneur will be willing to pay for them through ‘‘taxes”in a way that was not the case as a small firm. Using detailedobservations from Mexico, Levenson and Maloney find theirview consistent with patterns of formality and growth ofmicrofirms: Informal firms tend to remain small and have highrates of mortality, and lower productivity—without recourseto government-induced distortions in labor or product mar-kets. Further, the framework predicts that firms whose coststructures dictate that they should expand will make the tran-sition to formality as they grow.
Lamanna and Gonzalez (2007) use data for 6,466 manufac-turing firms in the official sector located in 14 countries in La-tin America, and they show that those formal firms which areaffected by head-to-head competition with informal firms lar-gely resemble them. They are small, credit-constrained, under-utilize their productive capacity, serve smaller customers, andare in markets with low entry costs. This paper also studies theimpact of country characteristics (such as business regulationand tax enforcement) on the percentage of formal firms ad-versely affected by informal competition.
Dabla-Norris, Gradstein, and Inchauste (2008) use firm-le-vel data from the World Business Environment Survey toidentify the determinants of informality. They find that thequality of the legal framework is crucially important in deter-mining the size of the informal sector, whereas the significanceof taxes, regulations, and financial constraints is reduced in thecontext of a well-functioning legal system. Again, being smalland financially constrained is positively correlated with thepropensity to go informal.
A paper that is very closely related to my work is Goldbergand Pavcnik (2003). They study one particular form of inten-sified competition—the reduction of trade barriers—in twodeveloping countries, namely Brazil and Colombia. Whilethere is no evidence of a relationship between trade policyand the informal sector in Brazil, they do find evidence of sucha relationship in Colombia, but only for the period preceding amajor labor market reform that increased the flexibility of theColombian labor market.
Another paper that is closely related to my analysis is Eilatand Zinnes (2002), who provide a comprehensive cross-coun-try study of the shadow economies in 25 transition countries
for 1990–97. First, they construct a new measure of the sizeof the underground economy, which is then correlated to alarge number of socio-economic indicators. 4 They then dis-cuss how the shadow economy affects the speed of economictransition and economic growth. They find hysteresis suggest-ing that, once established, the shadow economy is hard to re-move. Finally, they discuss the impact of the shadow economyon three dimensions of competition, namely market structure,ownership, and market conduct. In the very specific context oftransition economies, their notion of ‘‘shadow economy”seems to imply a ‘‘deviation from competition” (see p.1245f); in other words, the shadow economy is per se anticom-petitive, while competitiveness is attributed exclusively to theofficial sector. This notion of competition differs clearly fromthe one used in my work, where the degree of competitivenesscomes prior to the firm’s decision of whether to operate in theofficial or underground economy. Specifically, it refers tothe ability to charge above-marginal-cost prices (in either ofthe two sectors), affecting profitability in both sectors alike(although in an asymmetric way).
(b) The contribution of this paper
This paper builds on the theoretical model developed inKarlinger (2008). In this model, the individual firm can freelychoose whether to enter the official or the underground sector,and the intensity of competition in the industry (assumed to bethe same across the two sectors, official and underground) iscaptured by a single parameter that measures the degree ofproduct differentiation (the source of market power, i.e., theability to price above marginal costs). A tax authority moni-tors the industry and imposes fines on those undergroundfirms that it detects.
A firm which operates in the underground economy can buyits inputs, in particular labor, at a lower price (because itavoids payroll taxes, disregards safety and health standards,etc.), thereby reducing its variable cost relative to a firm inthe official economy. The underground firm can pass on itssavings to consumers, which will reduce market prices, andas a result its competitors’ profits fall. Thus, the official firmis put at a competitive disadvantage, and may have to choosebetween operating underground as well or going out of busi-ness. The fiercer is competition, the higher the pressure to passon cost savings to consumers, and the fewer firms will be ableto survive in the official sector. This result provides the foun-dation for the first hypothesis to be tested in the present paper:
Hypothesis 1. The fiercer is competition, the more likely areunderground activities to spread in the economy.
Now, recall that the nature of the underground economy indeveloping countries is likely to differ from that in industrial-ized countries. Thus, the impact of competition on the inci-dence of shadow economic activities could also depend onother country characteristics. As Posner (1996) pointed out,using formal market institutions, though costly in terms oftax liabilities, allows to resort to state-guided legal enforce-ment mechanisms in situations where opportunistic behaviorand breach of contract have to be considered likely, for exam-ple, when contracting with total strangers, or if transactionsare non-simultaneous and long term (see also Dabla-Norriset al. (2008) on this point). This insight leads us to our nexthypothesis:
Hypothesis 2. Corrupt countries with low government reve-nue are not able to provide the kind of public services that

1602 WORLD DEVELOPMENT
could induce firms to move to the official sector and pay thetaxes that are needed to fund such services. Such countries aretherefore more vulnerable to a competition shock thancountries offering high-quality (though expensive) publicinstitutions that keep firms in the official sector even ifcompetition increases.
These two hypotheses will be tested on a panel of 45 coun-tries covering the period from 1995 to 2000. The panel coversall major OECD countries as well as a number of developingcountries, mainly from Latin America and Asia. Data on thesize of the underground economy were obtained from Schnei-der (2005) as well as own calculations. The remaining datawere drawn from several World Bank sources and from theGlobal Competitiveness Report.
The first main finding of this cross-country analysis is thatmore intense competition is indeed correlated with an expan-sion of the underground economy: A one-standard-deviationincrease in the competition variable is associated with anexpansion of the underground economy (as share of officialGDP) of 13 percentage points, or 80% of the standard devia-tion of the latter. I also find a significant impact of per-capitaGDP and the income tax rate, while labor market regulation,entry barriers, and other tax rates, in particular the payroll taxrate, appear to be of much less importance than one wouldgenerally assume.
The second main finding of my empirical analysis is that theimpact of competition on the size of the underground econ-omy is weaker in countries where tax rates are high and cor-ruption is low. Countries with high government revenue andlow corruption are the ones that can offer high-quality publicenforcement services which make it worthwhile for firms toopt for the official economy even when competitive pressureincreases. In fact, when splitting our sample into the OECDand developing subsamples, we see that competition has ahuge impact on the shadow economy in the latter, but notin the former. Although all income-country groups in the sam-ple experienced a similar increase in the intensity of competi-tion during the late 1990s, the strong link betweencompetition and an expansion of the shadow economy is onlypresent in the developing countries and in Asia.
The paper proceeds as follows: Section 3 describes the dataused in this study. Given that every possible measure of theunderground economy is susceptible to criticism, I performmy analysis for two different measures. The first measure isbased on Schneider (2005), and results are presented in Section4. The second measure is based on the so-called modified elec-tricity method, where I use own calculations giving rise to alarger sample (along the time dimension) allowing for an in-depth analysis, presented in Section 5. Section 6 concludes.
3. DESCRIPTION OF THE DATA
The analysis is based on a panel that covers 45 countries(OECD, transition and developing countries) for the years1995–2000. 5 The underlying data were drawn from severalsources: Schneider’s (2005) estimates of the undergroundeconomy as percentage of official GDP; the World Bank’sWorld Development Indicators, Doing Business and Labor Reg-ulation databases; and the Global Competitiveness Report(GCR), which is published annually by the World EconomicForum. The World Bank data sources are discussed in moredetail below. The measures of most variables contained inthe Global Competitiveness Report are based on the resultsof the Executive Opinion Survey, which asks some 4,000 top
and middle managers in the surveyed countries for a personalassessment of the variables of interest. 6 Each respondent as-signed an integer from 1 to 7 to each of the questions con-tained in the survey, and the Global Competitiveness Reportreports the average response for each variable and country.
(a) The dependent variable
The two measures for the size of the underground economyused in the following deserve some more discussion. Of course,the very nature of the subject matter makes it difficult to quan-tify it. The data series in Schneider (2005) are based on the so-called ‘‘Dynamic Multiple Indicators, Multiple Causes”(DYMIMIC) approach, while the second measure of theunderground economy is obtained from own calculationsbased on the so-called ‘‘physical input” method (or Kauf-mann–Kaliberda method) in its modified version by Eilatand Zinnes (2002).
(i) DYMIMIC approachIn DYMIMIC models, the variable in question (here: the
size of the underground economy) is treated as an unobserv-able ‘‘latent” variable, and observable variables that are antic-ipated to be causal in nature, or reflections (indicators) of thelatent variable, are used to estimate a structural model byMLE. Models of this type are popular, for example, in thesociology literature, but have also found applications in eco-nomics (see, for instance, Engle, Lilien, and Watson (1985)).
In Schneider’s (2005) application of this method, the choiceof causal variables is partly driven by data availability. Forthe developing and transition countries, he uses as causal vari-ables: the share of direct and indirect taxation in GDP as thetwo tax burden variables; burden of state regulation or stateinterference (share of public administrative employment in to-tal employment), unemployment quota and GDP per capita astwo causal variables for the status of the ‘‘official” economy. Asindicator variables he uses employment (as a percentage of thepopulation between 18 and 64), the annual rate of GDPgrowth, and the annual rate of growth of local currency per ca-pita. For the OECD countries, he uses two additional causalvariables: tax morale (an index) and the burden of social secu-rity payments as a percentage of GDP, and an additional indi-cator variable: the average working time per week.
Now, a MIMIC model identifies only an index, not the levelof the latent variable of interest. Therefore, the index obtainedfrom the MIMIC estimations has to be converted into a level.In order to calculate absolute values of the size of the shadoweconomies, Schneider (2005) used the available estimates froma series of other studies using the currency demand approach(originated in Cagan (1958)) in combination with theDYMIMIC approach for Australia, Austria, Germany, Hun-gary, Italy, India, Peru, Russia, and the United States, calcu-lating from these values the absolute values of the shadoweconomy for all other countries.
Unfortunately, the estimates provided by Schneider (2005)are only available for 3 of the six periods covered by theGCR (namely 1995, 1998, and 2000), and for the year 1998,this data set only covers 21 OECD countries of the full setof 45 countries. Moreover, the method is subject to a numberof theoretical concerns: First of all, the collection of causalvariables and indicator variables used to construct the shadowestimates is inevitably somewhat ad hoc; there is no way to testwhether the latent variable is actually well identified. Second,to calibrate the index into absolute levels, we need base yearvalues that are in some way obtained ‘‘independently,” andit is not clear where to find such figures (in fact, the figures

THE UNDERGROUND ECONOMY IN THE LATE 1990S: EVADING TAXES, OR EVADING COMPETITION? 1603
used by Schneider (2005) are again based on either the cur-rency demand approach, or yet another DYMIMIC proce-dure). Third, the model also includes an (official) GDP term,implying that there is a stable relationship (constant acrosstime and countries) between these two variables; however, Ei-lat and Zinnes (2002) found that movements in official incomeper capita can lead to either pro-cyclical or counter-cyclicalmovements in the shadow, casting some doubt on the specifi-cation used by Schneider (2005). Finally, if we believe theDYMIMIC model of Schneider (2005) to be indeed correctlyspecified, then we cannot ‘‘ex-post” add other causal variablesfor the shadow economy; however, highlighting the impor-tance of one such variable, namely competition, is the verygoal of this paper.
Therefore, I will use the DYMIMIC estimates only as sug-gestive evidence for the role of competition in determiningthe size of the underground economy. However, the main re-sults will be obtained using a second measure for the under-ground economy, based on a quite different method, the so-called Modified Total Electricity approach.
(ii) The Modified Total Electricity (MTE) approachTo measure overall (official and unofficial) economic activ-
ity, Kaufmann and Kaliberda (1996) assume that electricityconsumption is the single best physical indicator of overalleconomic activity. With an electricity-output elasticity closeto one, the difference between the growth of official GDPand the growth of electricity consumption can be attributedto the growth of the shadow economy.
However, this approach does not control for other economicforces that may affect the electricity elasticity both acrosscountries and over time, such as: (i) changes in productionand energy efficiency, (ii) changes in economic structure (pro-duction shifting to more or less electricity-intensive sectors),and (iii) the pattern of household energy consumption. Duringthe period under examination, a number of Asian and LatinAmerican countries in the sample (Indonesia, Chile, Brazil,and Peru) were engaged in massive electrification programsbringing access to electricity to households that previouslyhad no access. Other countries in these subsamples, such asArgentina, Brazil, Colombia, Peru, India, Thailand, Malaysia,China, Philippines, and Indonesia, were undergoing privatiza-tion programs which changed the electricity production anddistribution system (see Jamasb, 2006). These policies arelikely to have contributed to electricity consumption in thesecountries growing faster than GDP. At the same time, somegovernments, in particular European, have been quite activein inducing a more efficient use of electricity, which may partlyexplain the underproportional growth of electricity consump-tion relative to GDP growth in the OECD subsample. In anattempt to correct for some of the faults of the total electricitymethod, Eilat and Zinnes (2002) have developed a ‘‘modified’’total electricity (MTE) approach. This method accounts forchanges in electricity prices and output composition, and thenrelates the residual, unexplained changes in electricity use tochanges in the shadow economy.
I apply the four-step procedure of Eilat and Zinnes (2002) asfollows:
(1) I first use electricity consumption data obtained fromthe World Bank’s World Development Indicators (WDIs)to calculate the annual percentage change in per capita elec-tricity consumption for each country over the yearst = 1995, . . ., 2000 (DElect).(2) To control for additional factors besides changes intotal economic activity that could explain changes in elec-tricity use, I regress DElect against the following variables:
the percentage change in electricity prices (DEPt) to capturedemand changes following price dynamics, the percentage-point change of industry share of GDP (DIndGDPt) to cap-ture changes in the structure of output, and the percentage-point change of the share of government sector in GDP(DGovtGDPt) to capture changes in efficiency in electricityuse from privatization and modernization. Data for elec-tricity prices were obtained from the International EnergyAgency (IEA), 7 the industry share of GDP from the WorldBank’s WDI, and the data on the share of government sec-tor in GDP from the Penn World Tables.
The regression estimation yields (t-statistics in parentheses):
DElect ¼ 0:028ð10:77Þ
þ 0:042ð2:18Þ
�DEP t þ 0:005ð2:40Þ
�DIndGDP t
� 0:006ð�1:83Þ
�DGovtGDP t:
We see that electricity prices and industry share of GDP aresignificant at the 5% level, while the share of government inGDP is significant at the 10% level. The adjusted R2 is 0.06.
I then remove (i.e., filter out) the influence of these factorsby creating the following ‘‘residual” variable:
DElecresidt ¼ DElect � 0:042� DEP t � 0:005� DIndGDP t
þ 0:006� DGovtGDP t:
The variable DElecresid represents the residual change in elec-tricity use that could not be accounted for by other factors, asproxied by our three variables (or in other words the estimatedchange in electricity use if the other factors were to stay con-stant).
(3) To compute the predicted percentage changes in TEA(DTEAt) we multiply the DElecresid values by an outputelasticity of electricity of 1. Then, let TEA95t denote totaleconomic activity relative to 1995 (TEAt/TEA95), wherethe base year index is of course equal to 100. Then, weobtain recursively:
TEA95t ¼ TEA95t�1 � ð1þ DElecresidt Þ
(4) Using a series of official GDP relative to its 1995 value(GDP95t) from the World Bank’s WDI and base year fig-ures for the shadow size in 1995 relative to official GDP(MTE1995) from Schneider (2005), we can calculate the sha-dow economy size in the later years as:
MTEt ¼ ðTEA95t=GDP95tÞ � ð1þMTE1995Þ � 100� 100
After eliminating negative values, 8 the correlation betweenthis measure and the Schneider estimates is 0.74.
(iii) The regressorsThe choice of regressors used in this analysis is driven by our
hypothesis that increased competition leads to an expansion ofthe underground economy. To test this hypothesis, we need ameasure of competition, as well as controls for the commonexplanatory factors used in the literature (see Schneider andEnste, 2000).
The key variable we are interested in is the intensity of com-petition between firms, in the sense that firms see each other asclose rivals for consumer patronage. Following Ades and DiTella (1999), I use a survey measure for competition, basedon the question whether ‘‘Competition in local markets is in-tense and market shares fluctuate constantly (1 = strongly dis-agree, 7 = strongly agree).” 9
Several measures are available for the intensity of labor reg-ulation: I will focus on the Employment Laws Index from theWorld Bank’s Labor Regulation database. This index reflects
1604 WORLD DEVELOPMENT
a comprehensive assessment of the legal provisions prevailingin each country in January 2002. It takes values from 0 to 3,with higher values consistent with more regulation. As a sup-plementary measure, I will also use the GCR’s Flexibility In-dex, which is derived from survey responses to the questionwhether ‘‘working hours can be easily adjusted (1 = stronglydisagree, 7 = strongly agree).” Unlike the Employment LawsIndex, this measure is available for all 6 years covered byour panel. 10
Similarly, there are two possible measures for entry barriers:the cost of starting a new business is directly measured as per-centage of per-capita GNI in the World Bank’s Doing Businessdatabase for the year 2003, while the GCR provides responseaverages on whether ‘‘Starting a new business is generally easy(1 = strongly disagree, 7 = strongly agree)” for each of the 6years of interest.
A measure for corruption will be included for the followingreasons: First of all, corruption is likely to undermine theenforcement of tax legislation (Bull & Newell, 2003), therebyfavoring underground economic activity, and second, the find-ings of Johnson et al. (1998) suggest that corruption is animportant control variable in itself. The corruption questionincluded in the GCR asks whether ‘‘Irregular, additional pay-ments connected with import and export permits, business li-censes, exchange controls, tax assessments, police protection,or loan applications are very rare (1 = strongly disagree,7 = strongly agree).” 11
Finally, I will control for per-capita GDP (in logs) as well asthe income tax rate, corporate tax rate, and VAT rates.
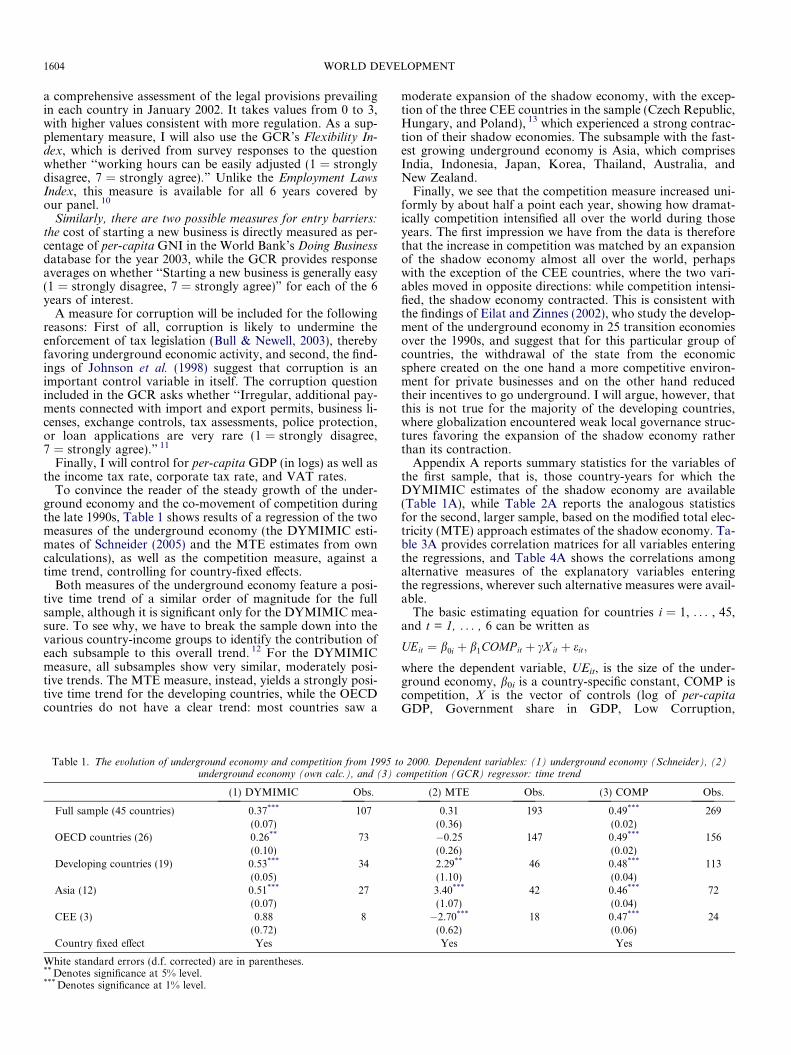
To convince the reader of the steady growth of the under-ground economy and the co-movement of competition duringthe late 1990s, Table 1 shows results of a regression of the twomeasures of the underground economy (the DYMIMIC esti-mates of Schneider (2005) and the MTE estimates from owncalculations), as well as the competition measure, against atime trend, controlling for country-fixed effects.
Both measures of the underground economy feature a posi-tive time trend of a similar order of magnitude for the fullsample, although it is significant only for the DYMIMIC mea-sure. To see why, we have to break the sample down into thevarious country-income groups to identify the contribution ofeach subsample to this overall trend. 12 For the DYMIMICmeasure, all subsamples show very similar, moderately posi-tive trends. The MTE measure, instead, yields a strongly posi-tive time trend for the developing countries, while the OECDcountries do not have a clear trend: most countries saw a
Table 1. The evolution of underground economy and competition from 1995 tunderground economy (own calc.), and (3) c
(1) DYMIMIC Obs.
Full sample (45 countries) 0.37*** 107(0.07)
OECD countries (26) 0.26** 73(0.10)
Developing countries (19) 0.53*** 34(0.05)
Asia (12) 0.51*** 27(0.07)
CEE (3) 0.88 8(0.72)
Country fixed effect Yes
White standard errors (d.f. corrected) are in parentheses.** Denotes significance at 5% level.*** Denotes significance at 1% level.
moderate expansion of the shadow economy, with the excep-tion of the three CEE countries in the sample (Czech Republic,Hungary, and Poland), 13 which experienced a strong contrac-tion of their shadow economies. The subsample with the fast-est growing underground economy is Asia, which comprisesIndia, Indonesia, Japan, Korea, Thailand, Australia, andNew Zealand.
Finally, we see that the competition measure increased uni-formly by about half a point each year, showing how dramat-ically competition intensified all over the world during thoseyears. The first impression we have from the data is thereforethat the increase in competition was matched by an expansionof the shadow economy almost all over the world, perhapswith the exception of the CEE countries, where the two vari-ables moved in opposite directions: while competition intensi-fied, the shadow economy contracted. This is consistent withthe findings of Eilat and Zinnes (2002), who study the develop-ment of the underground economy in 25 transition economiesover the 1990s, and suggest that for this particular group ofcountries, the withdrawal of the state from the economicsphere created on the one hand a more competitive environ-ment for private businesses and on the other hand reducedtheir incentives to go underground. I will argue, however, thatthis is not true for the majority of the developing countries,where globalization encountered weak local governance struc-tures favoring the expansion of the shadow economy ratherthan its contraction.
Appendix A reports summary statistics for the variables ofthe first sample, that is, those country-years for which theDYMIMIC estimates of the shadow economy are available(Table 1A), while Table 2A reports the analogous statisticsfor the second, larger sample, based on the modified total elec-tricity (MTE) approach estimates of the shadow economy. Ta-ble 3A provides correlation matrices for all variables enteringthe regressions, and Table 4A shows the correlations amongalternative measures of the explanatory variables enteringthe regressions, wherever such alternative measures were avail-able.
The basic estimating equation for countries i = 1, . . . , 45,and t = 1, . . . , 6 can be written as
UEit ¼ b0i þ b1COMP it þ cX it þ eit;
where the dependent variable, UEit, is the size of the under-ground economy, b0i is a country-specific constant, COMP iscompetition, X is the vector of controls (log of per-capitaGDP, Government share in GDP, Low Corruption,
o 2000. Dependent variables: (1) underground economy (Schneider), (2)ompetition (GCR) regressor: time trend
(2) MTE Obs. (3) COMP Obs.
0.31 193 0.49*** 269(0.36) (0.02)�0.25 147 0.49*** 156(0.26) (0.02)2.29** 46 0.48*** 113(1.10) (0.04)3.40*** 42 0.46*** 72(1.07) (0.04)�2.70*** 18 0.47*** 24
(0.62) (0.06)Yes Yes
THE UNDERGROUND ECONOMY IN THE LATE 1990S: EVADING TAXES, OR EVADING COMPETITION? 1605
Employment Laws Index, Payroll/Income/Corporate/VAT taxrate, Cost of Start-up), and ei is the error term. We are particu-larly interested in determining the size of b1 which represents theelasticity of the size of the shadow economy with respect tointensity of competition.
Recall that we hypothesized that as competition intensifies,the underground economy will expand (Hypothesis 1). Thus,we would expect the competition variable to have a positivesign in our regressions. As for the other variables, theoryand previous studies suggest the following signs: GDP growthis ambiguous (but likely negative), low corruption negative, ri-gid labor regulations positive (flexibility negative), tax ratespositive, cost of start-ups positive (ease of entry negative),and the government share in GDP negative.
4. REGRESSION RESULTS FOR SAMPLE 1
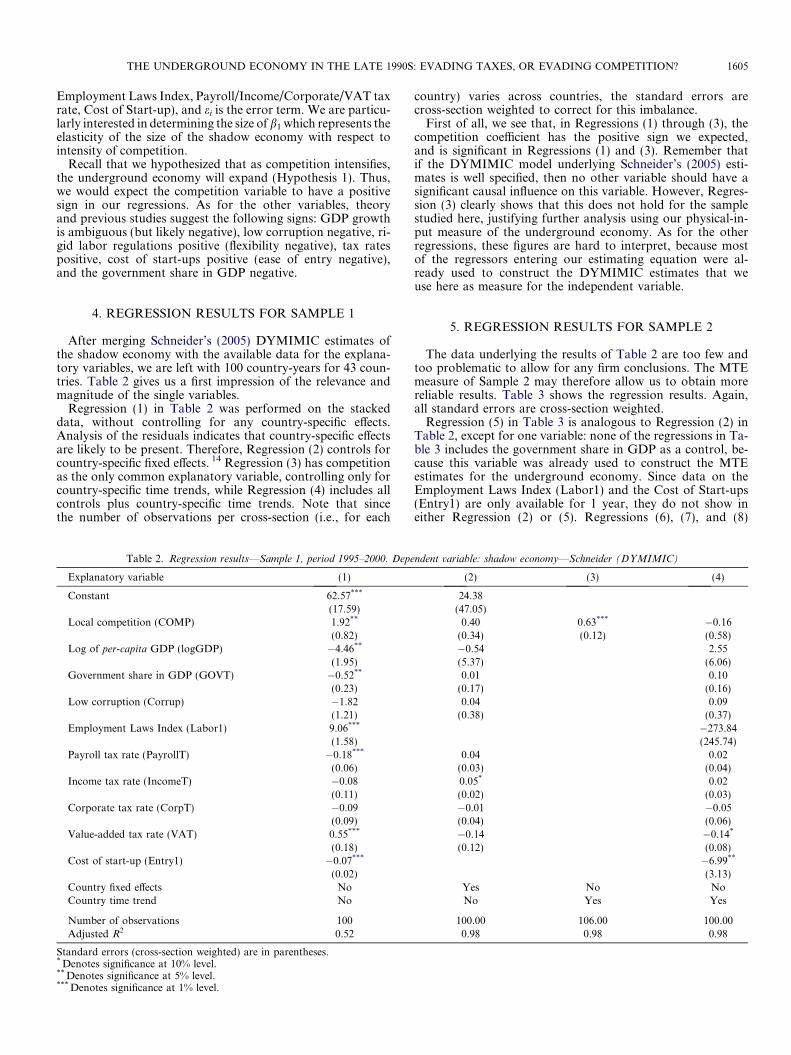
After merging Schneider’s (2005) DYMIMIC estimates ofthe shadow economy with the available data for the explana-tory variables, we are left with 100 country-years for 43 coun-tries. Table 2 gives us a first impression of the relevance andmagnitude of the single variables.
Regression (1) in Table 2 was performed on the stackeddata, without controlling for any country-specific effects.Analysis of the residuals indicates that country-specific effectsare likely to be present. Therefore, Regression (2) controls forcountry-specific fixed effects. 14 Regression (3) has competitionas the only common explanatory variable, controlling only forcountry-specific time trends, while Regression (4) includes allcontrols plus country-specific time trends. Note that sincethe number of observations per cross-section (i.e., for each
Table 2. Regression results—Sample 1, period 1995–2000. Depe
Explanatory variable (1)
Constant 62.57***
(17.59)Local competition (COMP) 1.92**
(0.82)Log of per-capita GDP (logGDP) �4.46**
(1.95)Government share in GDP (GOVT) �0.52**
(0.23)Low corruption (Corrup) �1.82
(1.21)Employment Laws Index (Labor1) 9.06***
(1.58)Payroll tax rate (PayrollT) �0.18***
(0.06)Income tax rate (IncomeT) �0.08
(0.11)Corporate tax rate (CorpT) �0.09
(0.09)Value-added tax rate (VAT) 0.55***
(0.18)Cost of start-up (Entry1) �0.07***
(0.02)Country fixed effects NoCountry time trend No
Number of observations 100Adjusted R2 0.52
Standard errors (cross-section weighted) are in parentheses.* Denotes significance at 10% level.** Denotes significance at 5% level.*** Denotes significance at 1% level.
country) varies across countries, the standard errors arecross-section weighted to correct for this imbalance.
First of all, we see that, in Regressions (1) through (3), thecompetition coefficient has the positive sign we expected,and is significant in Regressions (1) and (3). Remember thatif the DYMIMIC model underlying Schneider’s (2005) esti-mates is well specified, then no other variable should have asignificant causal influence on this variable. However, Regres-sion (3) clearly shows that this does not hold for the samplestudied here, justifying further analysis using our physical-in-put measure of the underground economy. As for the otherregressions, these figures are hard to interpret, because mostof the regressors entering our estimating equation were al-ready used to construct the DYMIMIC estimates that weuse here as measure for the independent variable.
5. REGRESSION RESULTS FOR SAMPLE 2
The data underlying the results of Table 2 are too few andtoo problematic to allow for any firm conclusions. The MTEmeasure of Sample 2 may therefore allow us to obtain morereliable results. Table 3 shows the regression results. Again,all standard errors are cross-section weighted.
Regression (5) in Table 3 is analogous to Regression (2) inTable 2, except for one variable: none of the regressions in Ta-ble 3 includes the government share in GDP as a control, be-cause this variable was already used to construct the MTEestimates for the underground economy. Since data on theEmployment Laws Index (Labor1) and the Cost of Start-ups(Entry1) are only available for 1 year, they do not show ineither Regression (2) or (5). Regressions (6), (7), and (8)
ndent variable: shadow economy—Schneider (DYMIMIC)
(2) (3) (4)
24.38(47.05)
0.40 0.63*** �0.16(0.34) (0.12) (0.58)�0.54 2.55(5.37) (6.06)0.01 0.10
(0.17) (0.16)0.04 0.09
(0.38) (0.37)�273.84(245.74)
0.04 0.02(0.03) (0.04)0.05* 0.02(0.02) (0.03)�0.01 �0.05(0.04) (0.06)�0.14 �0.14*
(0.12) (0.08)�6.99**
(3.13)Yes No NoNo Yes Yes
100.00 106.00 100.000.98 0.98 0.98

Table 3. Regression results—Sample 2, period 1995–2000, full sample. Dependent variable: shadow economy—own calculations (MTE)
Explanatory variable (5) OLS (6) OLS (7) OLSa (8) 2SLSb
Constant 932.93*** 965.12*** 914.47*** 634.98(127.08) (125.55) (129.98) (615.63)
Local competition (COMP) 2.60*** 2.69*** 2.03*** 5.56**
(0.84) (0.83) (0.76) (2.38)Log of per-capita GDP (logGDP) �100.69*** �103.30*** �99.00*** �73.69*
(13.94) (13.67) (14.30) (44.4)Low corruption (Corrup) 0.18 �0.46 2.64** �9.05
(0.91) (1.19) (1.06) (5.53)Flexibility Index (Labor2) �2.48* �0.57 �7.90*
(1.28) (1.40) (4.05)Payroll tax rate (PayrollT) �0.11 �0.16* �0.12 �4.28
(0.08) (0.09) (0.07) (3.28)Income tax rate (IncomeT) 0.26*** 0.26*** 0.24*** 0.30***
(0.06) (0.06) (0.05) (0.09)Corporate tax rate (CorpT) 0.18* 0.17* 0.17* 2.54
(0.10) (0.10) (0.09) (1.79)Value-added tax rate (VAT) �0.05 �0.07 �0.03 8.22
(0.21) (0.20) (0.26) (12.28)New business (Entry2) 1.37* �0.47 5.44
(0.73) (0.77) (3.95)Country fixed effects Yes Yes Yes Yes
Number of observations 178 178 146 150Adjusted R2 0.89 0.89 0.93 0.88
Standard errors (cross-section weighted) are in parentheses.* Denotes significance at 10% level.** Denotes significance at 5% level.*** Denotes significance at 1% level.a Tax rates are lagged by 1 year.b Tax rates are instrumented by the corresponding tax rate of a randomly assigned neighboring country.
1606 WORLD DEVELOPMENT
include the alternative (time-varying) Flexibility Index (La-bor2) and Ease-of-Entry (Entry2).
(a) Controlling for the endogeneity of taxes
Regressions (7) and (8) deserve further explanation. It hasbeen argued that a country’s tax rates may to some extent beendogenous to its shadow economy (see Johnson et al.,1998): If government tries to stabilize tax revenue by raisingtax rates whenever the shadow economy expands and the taxbase shrinks, then the causality between tax rates and theunderground economy would be reversed, and the coefficientestimates of Regressions (5) and (6) would be inconsistent.
Regressions (7) and (8) account for this possible simultane-ity bias: In Regression (7), I use the one-period lagged taxrates instead of the contemporaneous tax rates. This proce-dure allows us to capture possible time lags in the adjustmentof the size of the underground economy to changes in the taxrates. At the same time, the lagged tax rates are likely exoge-nous to the underground economy in period t (this would betantamount to saying that governments raise tax rates in antic-ipation of an increase in the shadow economy), so that we canexclude reverse causality here.
In Regression (8), I use a two-stage procedure, instrumentingfor country i’s tax rates by the contemporaneous tax rates ofone randomly assigned neighboring country j. The data indi-cate that tax rates tend to be closely correlated across neighbor-ing countries. The identifying assumption is that a country’stax rates will not change in response to an expansion of theunderground economy in any of its neighboring countries.The adjusted R2’s of the first-stage regressions range from0.53 to 0.96, thus giving no indication for weak instruments.
Note that the Durbin-Wu-Hausman test does not reject thenull hypothesis of consistent estimation of both Regressions(5) and (6) (the F-statistic is 0.36 and 0.61, respectively), sothat the tax rates in our sample might not be endogenous. Still,we may think of our 2SLS procedure as a kind of robustnesstest.
Let us now turn to the results presented in Table 3. Mostimportantly, the coefficient on competition is highly significantand has the predicted positive sign under all four specifica-tions. In terms of Regression (8), a one-standard-deviation in-crease in the competition variable is associated with anexpansion of the underground economy (as share of officialGDP) of 13 percentage points, or 80% of the standard devia-tion of the latter.
Note that the Flexibility Index is significant in Regressions(6) and (8) and has the expected negative sign: A one-stan-dard-deviation increase in the Flexibility Index is associatedwith a drop in the size of the underground economy (as shareof official GDP) of 31 percentage points, or 193% of the stan-dard deviation of the latter. Per-capita GDP is highly signifi-cant as well: Not surprisingly, the underground sector movescounter-cyclically. The corruption measure is significant onlyin Regression (7). Among the tax rates, only the income taxrate is consistently significant under all four specifications,while the corporate tax rate loses significance once we instru-ment for the tax rates.
Regression (8) is robust to dropping one country at a time,with coefficients on the competition variable remaining of thesame order of magnitude and significance level. Likewise, theresults are robust to including year dummies. Thus, the resultsdo not appear to be driven by outliers along the cross-sectionor time dimension.

THE UNDERGROUND ECONOMY IN THE LATE 1990S: EVADING TAXES, OR EVADING COMPETITION? 1607
(b) The impact of country characteristics
Recall that there are compelling reasons to expect that theimpact of competition on the incidence of shadow economicactivities could also depend on other country characteristics.As Posner (1996) pointed out, using formal market institu-tions, though costly in terms of tax liabilities, allows to re-sort to state-guided legal enforcement mechanisms insituations where opportunistic behavior and breach ofcontract have to be considered likely, for example, whencontracting with total strangers, or if transactions are non-simultaneous and long term. This insight led us to our nexthypothesis:
Hypothesis 2. Corrupt countries with low government reve-nue are not able to provide the kind of public services thatcould induce firms to move to the official sector and pay thetaxes that are needed to fund such services. Such countries aretherefore more vulnerable to a competition shock than
Table 4. Interaction between competition and country characteristics, Sample 2,(MTE
Explanatory variable (9) (10)
Constant 951.87*** 912.06(119.83) (120.5
Local competition (COMP) 4.15 5.24*
(4.04) (1.74COMP � logGDP �0.16
(0.39)COMP � Corrup �0.57
(0.27COMP � Labor1
COMP � PayrollT
COMP � IncomeT
COMP � CorpT
COMP � VAT
COMP � Entry1
Log of per-capita GDP (logGDP) �101.77*** �98.10(13.02) (13.0
Low corruption (Corrup) �0.47 1.74(1.21) (1.43
Flexibility Index (Labor2) �2.45* �2.3(1.27) (1.24
Payroll tax rate (PayrollT) �0.16* �0.19(0.09) (0.09
Income tax rate (IncomeT) 0.26*** 0.26*
(0.06) (0.06Corporate tax rate (CorpT) 0.16* 0.12
(0.09) (0.09Value-added tax rate (VAT) �0.09 �0.1
(0.21) (0.22New business (Entry2) 1.35* 1.14
(0.72) (0.71Country fixed effects Yes Yes
Number of observations 178 178Adjusted R2 0.89 0.89
Standard errors (cross-section weighted) are in parentheses.* Denotes significance at 10% level.** Denotes significance at 5% level.*** Denotes significance at 1% level.
countries offering high-quality (though expensive) publicinstitutions that keep firms in the official sector even ifcompetition increases.
The second main result of my empirical analysis confirmsthis conjecture. Table 4 shows the regression results wheninteraction terms are included in the OLS specification ofRegression (6).
Competition does not seem to have a differential impact incountries where labor markets are more regulated (Regression(11)) or where entry is more difficult (Regression (13)). Thefirst of these two results suggests that we cannot generalizethe findings of Goldberg and Pavcnik (2003), who argue thatthe relationship between trade policy and the informal sectorin Colombia only existed for the period preceding a major la-bor market reform that increased the flexibility of the Colom-bian labor market. In other words, liberalizing the labormarket does not in general neutralize the effects of competitionon the shadow economy.
period 1995–2000. Dependent variable: shadow economy—own calculations)
(11) (12) (13)
*** 967.13*** 819.85*** 947.14***
6) (126.66) (119.67) (124.66)** 3.73* 9.42*** 5.19**
) (1.89) (2.96) (2.03)
**
)�0.29(0.49)
0.02(0.03)�0.06*
(0.04)�0.10(0.07)�0.17**
(0.08)�0.57(0.38)
*** �103.89*** �90.41*** �101.84***
8) (13.81) (12.76) (13.55)�0.60 �0.32 �0.99
) (1.23) (1.24) (1.32)1* �1.16 �2.72** �2.46*
) (2.78) (1.28) (1.25)** �0.16* �0.28* �0.17*
) (0.09) (0.17) (0.09)** 0.27*** 0.55*** 0.27***
) (0.06) (0.20) (0.06)0.16* 0.58* 0.14
) (0.10) (0.34) (0.09)8 �0.10 0.65 �0.16) (0.21) (0.45) (0.22)
1.37* 1.15* 3.57**
) (0.74) (0.69) (1.79)Yes Yes Yes
178 178 1780.89 0.89 0.89

Table 5. Regression results—Sample 2, period 1995–2000, various subsamples. Dependent variable: shadow economy—own calculations (MTE)
Explanatory variable OECD LDCs Asia CEE
Constant �265.27 1004.67 235.14 3765.25**
(603.68) (934.70) (852.78) (207.41)Local competition (COMP) 2.40 12.20*** 11.81*** 16.77**
(2.26) (2.93) (3.20) (0.87)Log of per-capita GDP (logGDP) 6.86 �131.14 �33.91 169.78**
(41.66) (80.64) (74.93) (11.70)Low corruption (Corrup) �5.44 �13.58 �6.17 �76.11**
(5.19) (8.28) (6.68) (3.68)Flexibility Index (Labor2) �2.93 �23.96*** �16.76** �72.23**
(3.41) (4.72) (6.01) (3.34)Payroll tax rate (PayrollT)a �2.31 �5.39 �6.48 �55.98**
(3.23) (3.26) (4.56) (2.48)Income tax rate (IncomeT)a 0.10 0.18 0.50*** �0.03
(0.09) (0.21) (0.14) (0.01)Corporate tax rate (CorpT)a 1.95 11.69** 8.08** 9.53**
(1.52) (4.50) (3.06) (0.63)Value-added tax rate (VAT)a 14.64 �8.53 �11.23 9.47
(10.86) (17.57) (19.23) (3.91)New business (Entry2) 0.59 11.56*** 11.53** 61.00**
(3.65) (3.81) (5.29) (2.69)Country fixed effects Yes Yes Yes Yes
Number of observations 116 34 33 13Adjusted R2 0.86 0.94 0.96 0.99
Standard errors (cross-section weighted) are in parentheses.** Denotes significance at 5% level.*** Denotes significance at 1% level.a Tax rates are instrumented by the corresponding tax rate of a randomly assigned neighboring country.
1608 WORLD DEVELOPMENT
The remaining regressions in Table 4 show that the effect ofcompetition on the size of the underground economy is signif-icantly weaker when corruption is low (Regression (10)), andwhen the tax rates are high (Regression 12). 15 The interpreta-tion to give to this result is that countries with high tax ratesand low corruption can offer high-quality public serviceswhich make it worthwhile for firms to opt for the official econ-omy even when competitive pressure grows. Moreover, suchcountries can afford stronger tax enforcement agencies, dis-couraging firms to go underground even as competition in-creases.
This may also explain why the expansion of the under-ground sector was not as strong in the OECD and CEE coun-tries as it was in Asia and the developing world, even thoughall four subsamples experienced a similar increase in the inten-sity of competition during the late 1990s (see Table 1). Tounderstand the differences in the dynamics of the undergroundeconomy for these country-income groups, the 2SLS proce-dure of Regression (8) was applied to each of these subsamplesseparately. The results are presented in Table 5.
We see that the less developed countries and Asia followsimilar patterns, which are very different from those of theOECD countries and the CEE countries. To begin with, thecompetition variable, along with labor market flexibility andease of entry, appear to be the driving forces behind the devel-opment of the shadow economy both in the less industrializedcountries and in Asia. The corporate tax rate seems to have animportant influence as well. Instead, for the OECD countries,none of our explanatory variables comes out significant,although this is the largest of the four subsamples, so that pau-city of the data cannot account for this result.
As for the CEE subsample, almost all regressors turn outsignificant, and we also find the competition variable pointingin the same direction as in the other subsamples. In other
words, even though the bivariate correlation between compe-tition and shadow economy is negative for this subsample(see Table 1), once we control for the other variables this rela-tionship turns positive. Interestingly, the GDP variable is nowsignificantly positive as well (while it is negative for all otherincome-country groups), confirming the results of Eilat andZinnes (2002) who found that in some CEE countries the sha-dow economy moves pro-cyclically rather than counter-cycli-cally.
Overall, these findings lend support to our claim that the im-pact of competition on the shadow economy varied substan-tially across the countries in our sample: while highlyindustrialized countries hardly felt the effects on their shadoweconomies, the developing world and Asia reacted to thegrowing competitive pressure with an expansion of their sha-dow economies.
6. CONCLUSION
The purpose of this paper is to explain the striking growth ofthe underground economy all over the world during the late1990s. I propose a novel rationale for this expansion of theshadow economy: the intensity of market competition amongfirms. The empirical analysis presented here was performed ona panel that covers 45 countries (OECD, transition and devel-oping countries) from 1995 to 2000. The regression resultsshow that tax rates, labor market regulation, and law enforce-ment are not the only forces behind the emergence of theunderground economy. I find evidence for my first hypothesis,namely that the growing incidence of shadow-economic activ-ity is indeed correlated with an increase in the intensity ofcompetition during this period. The interpretation I offer forthis result is that fierce competition squeezes profit margins;

THE UNDERGROUND ECONOMY IN THE LATE 1990S: EVADING TAXES, OR EVADING COMPETITION? 1609
firms will be more likely to pass on cost savings to consumers,and where operating underground yields such marginal costsavings, firms in the official sector will see their profits fall,so that they will have to decide between going out of business,or going underground as well.
The second main finding of my empirical analysis is that theimpact of competition on the size of the underground econ-omy is weaker in countries where tax rates are high and cor-ruption is low: countries with high government revenue andlow corruption are the ones that can offer high-quality publicenforcement services which make it worthwhile for firms toopt for the official economy even when competitive pressureincreases. In fact, when splitting our sample into the OECDand developing subsamples, we see that competition has ahuge impact on the shadow economy in the latter, but notin the former. Although all income-country groups in the sam-
ple experienced a similar increase in the intensity of competi-tion during the late 1990s, the strong link betweencompetition and an expansion of the shadow economy is onlypresent in the developing countries and in Asia.
We can draw several policy conclusions from these results:First of all, liberalizing product markets may come at the costof an expanding underground economy. This effect is morelikely to be felt in poor, corrupt countries with low tax reve-nue. Moreover, we saw that liberalizing the labor market inlockstep with product markets does not in general neutralizethe effects of competition on the shadow economy. Thus, aforward-looking government, in particular in less industrial-ized countries, should anticipate this side-effect and make surethe liberalization is accompanied by an improvement inadministrative capacities allowing for more rigorous lawenforcement.
NOTES
1. See article in national newspaper ‘‘Kurier” of October 4, 2004.
2. See Schneider and Enste (2000) for a critical discussion of the differentmeasurement methods.
3. See Alm and Torgler (2006) and Torgler and Schneider (2007), oncross-country differences in tax morale.
4. I will explain their method in more detail when I use it to construct myown measures of the underground economy.
5. The countries are: Argentina, Australia, Austria, Belgium, Brazil,Canada, Chile, China, Colombia, Czech Republic, Denmark, Finland,France, Germany, Greece, Hong Kong, Hungary, India, Indonesia,Ireland, Israel, Italy, Japan, Korea (Rep.), Malaysia, Mexico, Nether-lands, New Zealand, Norway, Peru, Philippines, Poland, Portugal,Russian Federation, Singapore, Slovak Republic, South Africa, Spain,Sweden, Switzerland, Thailand, Turkey, United Kingdom, United States,and Venezuela.
6. Note that questions contained in firms entering the GCR Survey aremost likely official firms. I assume that their managers’ assessment of thecompetitiveness of their industry is not systematically different from theassessment that (fully) underground firms would have. The work byLamanna and Gonzalez (2007) lends some empirical support to thisassumption.
7. Unfortunately, price data were only available for 34 of the 45countries in the DYMIMIC sample, reducing the MTE sample accord-ingly.
8. Such values can arise computationally if the base year value wasalready low and the country’s official GDP grew much faster than itselectricity consumption, but they are of course meaningless.
9. Alternative measures are share of imports in GDP (WB WDI) and theeffectiveness of antitrust policies (GCR). Table 4A reports the correlationsbetween these measures.
10. Table 4A in Appendix A provides correlations between these twomeasures as well as a third alternative measure, namely the Employment
Laws Index of the World Bank’s Doing Business data base (which wasconstructed in a similar manner as the index of the same name in theLabor Regulation data base, and refers to January 2003).
11. Alternative measures are provided by the World Bank’s Governance
Indicators database (Perceptions of Corruption and Rule of Law) and byTransparency International (Corruption Perceptions Index)—see Table 4Ain Appendix A.
12. Note that the four subsamples are partially overlapping. Forinstance, Indonesia is part of the developing countries subsample andthe Asia subsample. Likewise, the CEE countries are all part of the OECDsample as well.
13. The Czech Republic and Hungary joined the OECD in 1996, whilePoland followed in 1997.
14. Recall that the main measures for labor regulation and start-up cost(Labor1 and Entry1) are only available for one year, so they do not showwhen including country-fixed effects.
15. The Wald test rejects the null hypothesis that all four tax interactionterms in Regression (12) have zero coefficients at the 5% level. When thetax interaction terms are included one by one, the income and VATinteraction terms are significant at 5%, while the Payroll tax and corporatetax interaction terms are not significant.
REFERENCES
Ades, A., & Di Tella, R. (1999). Rents, competition, and corruption.American Economic Review, 89(4), 982–993.
Alm, J., & Torgler, B. (2006). Culture differences and tax morale in theUnited States and in Europe. Journal of Economic Psychology, 27(2),224–246.
Bull, M. J., & Newell, J. L. (Eds.) (2003). Corruption in contemporarypolitics. Basingstoke: Palgrave Macmillan.
Cagan, P. (1958). The demand for currency relative to the total moneysupply. Journal of Political Economy, 66(4), 303–328.
Dabla-Norris, E., Gradstein, M., & Inchauste, G. (2008). What causesfirms to hide output? The determinants of informality. Journal ofDevelopment Economics, 85(1), 1–27.
Eilat, Y., & Zinnes, C. (2002). The shadow economy in transition countries:Friend or foe? A policy perspective. World Development, 30(7), 1233–1254.

1610 WORLD DEVELOPMENT
Engle, R. F., Lilien, D. M., & Watson, M. (1985). A dynamic model ofhousing price determination. Journal of Econometrics, 28(3),307–326.
Friedman, E., Johnson, S., Kaufmann, D., & Zoido-Lobaton, P. (2000).Dodging the grabbing hand: The determinants of unofficial activity in69 countries. Journal of Public Economics, 76(3), 459–493.
Goldberg, P. K., & Pavcnik, N. (2003). The response of the informalsector to trade liberalization. Journal of Development Economics, 72(2),63–96.
Gupta, S. D., & Choudhry, N. K. (1997). Dynamics of globalization anddevelopment: An introduction. In S. D. Gupta (Ed.), Dynamics ofglobalization and development. Boston/Dordrecht/ London: KluwerAcademic Publishers.
Jamasb, T. (2006). Between the state and market: Electricity sector reformin developing countries. Utilities Policy, 14(1), 14–30.
Johnson, S., Kaufmann, D., & Zoido-Lobaton, P. (1998). Regulatorydiscretion and the unofficial economy. American Economic Review,88(2), 387–392.
Karlinger, L. (2008). Globalizing tax evasion: How competition affects thesize of the underground economy. University of Vienna working paperno. 0801, May 2008.
Kaufmann, D., & Kaliberda, A. (1996). Integrating the unofficialeconomy into the dynamics of post socialist economies: A frame-work of analyses and evidence. In B. Kaminski (Ed.), Economictransition in the newly independent states. Armonk, NY: M.E. SharpePress.
Table 1A. Summary statistics—Sample 1
Obs.
Shadow economy— DYMIMIC 100Local competition (COMP) 100Log of per-capita GDP (logGDP) 100Low corruption (Corrup) 100
Labor regulation:1. Employment Laws Index (Labor1) 1002. Flexibility Index (Labor2) 100
Payroll tax rate (PayrollT) 100Income tax rate (IncomeT) 100Corporate tax rate (CorpT) 100Value-added tax rate (VAT) 100
Ease of entry:1. Cost of start-up (Entry1) 1002. New business (Entry2) 100
Government share in GDP (GOVT) 100
Table 2A. Summary statistics—Sample 2 (modified total
Obs.
Shadow economy—own calc. (MTE) 178Local competition (COMP) 178Log of per-capita GDP (logGDP) 178Low corruption (Corrup) 178
Labor regulation:1. Employment Laws Index (Labor1) 1782. Flexibility Index (Labor2) 178
Payroll tax rate (PayrollT) 178Income tax rate (IncomeT) 178Corporate tax rate (CorpT) 178Value-added tax rate (VAT) 178
Ease of entry:1. Cost of start-up (Entry1) 1782. New business (Entry2) 178
Government share in GDP (GOVT) 178
Lamanna, F., & Gonzalez, A. S. (2007). Who fears competition frominformal firms? Evidence from Latin America. World Bank PolicyResearch working paper no. 4316.
Lemieux, T., Fortin, B., & Frechette, P. (1994). The effect of taxes on laborsupply in the underground economy. American Economic Review,84(1), 231–254.
Levenson, A. R., & Maloney, W. F. (1998). The informal sector, firmdynamics, and institutional participation. World Bank Policy Researchworking paper no. 1988, September 1998.
Posner, E. A. (1996). The regulation of groups: The influence of legal andnonlegal sanctions on collective action. University of Chicago LawReview, 63, 133–197.
Schneider, F., & Enste, D. H. (2000). Shadow economies: Size, causes,and consequences. Journal of Economic Literature, 38(1), 77–114.
Schneider, F. (2005). Shadow economies around the world: What do wereally know?. European Journal of Political Economy, 21(3), 598–642.
Shleifer, A. (2004). Does competition destroy ethical behavior?. AmericanEconomic Review, 94(2), 414–418.
Torgler, B., & Schneider, F. (2007). What shapes attitudes toward payingtaxes? Evidence from multicultural European countries. Social ScienceQuarterly, 88(2), 443–470.
.
APPENDIX A
See Tables 1A–4A.
(Schneider’s estimates) for 1995–2000
Stacked data
Mean Std. dev. Min. Max.
21.54 10.64 7.80 59.404.38 1.34 1.66 6.509.31 1.19 5.94 10.714.83 1.57 1.37 6.91
1.51 0.45 0.81 2.353.49 0.77 2.10 5.1727.20 16.01 0.00 61.0031.57 13.95 0.00 60.0031.91 6.62 15.00 55.0015.79 6.63 0.00 31.00
19.94 40.98 0.40 269.003.90 1.27 1.54 6.4018.47 5.83 5.36 36.30
electricity approach, own calculations) for 1995–2000
Stacked data
Mean Std. dev. Min. Max.
20.59 15.64 0.00 86.424.51 1.15 1.66 6.509.29 1.13 5.94 10.714.88 1.41 1.55 6.91
1.55 0.43 0.81 2.353.60 0.81 2.00 5.5529.47 16.74 0.00 65.0032.08 13.09 0.00 60.0032.87 6.48 6.78 55.0016.24 5.83 0.00 25.00
20.76 49.43 0.40 269.004.35 1.14 1.54 6.4318.74 5.95 8.68 37.43

Table 3A. Correlations among regression variables, entire sample of 45 countries covering 1995–2000
DYMIMIC MTE logGDP Corrup Labor1 Labor2 PayrollT IncomeT CorpT VAT Entry1 Entry2 COMP GOVT
DYMIMIC 1.00 0.74 �0.56 �0.49 0.53 �0.12 0.04 �0.26 �0.24 0.13 0.13 �0.27 �0.20 0.14MTE 1.00 �0.36 �0.46 0.38 �0.18 �0.21 �0.11 �0.13 �0.18 0.29 �0.17 �0.16 �0.05logGDP 1.00 0.76 �0.42 0.02 �0.03 0.30 0.04 0.03 �0.53 0.35 0.27 �0.46Corrup 1.00 �0.51 0.24 �0.16 0.40 �0.04 0.01 �0.42 0.64 0.56 �0.25Labor1 1.00 �0.34 0.42 �0.02 0.07 0.26 0.10 �0.38 �0.19 0.25Labor2 1.00 �0.45 �0.15 �0.24 �0.40 0.03 0.49 0.21 �0.28PayrollT 1.00 0.22 0.21 0.55 �0.22 �0.26 0.01 0.42IncomeT 1.00 0.06 0.35 �0.20 0.15 0.45 0.13CorpT 1.00 0.10 �0.02 �0.20 �0.07 0.18VAT 1.00 �0.22 �0.17 �0.04 0.55Entry1 1.00 �0.09 �0.14 0.09Entry2 1.00 0.47 �0.25COMP 1.00 �0.11GOVT 1.00
Table 4A. Correlations among alternative measures for selected regression variables
COMP Imports Corruption TI Corruption WB Corrup Labor1 Labor2
Antitrust 0.61 0.05COMP 0.09Rule of Law 0.94 0.97 0.87Corruption TI 0.96 0.86Corruption WB 0.89Employment Laws 0.89 �0.40
THE UNDERGROUND ECONOMY IN THE LATE 1990S: EVADING TAXES, OR EVADING COMPETITION? 1611
Available online at www.sciencedirect.com