the united states climate reference network (uscrn)
TRANSCRIPT

Compiled byNOAA/NESDIS
National Climatic Data CenterOctober 2008
Annual ReportFiscal Year 2008
The United StatesClimate Reference Network
(USCRN)

i
i
Assistant Administrator for Satellite & Data Information ServicesMary E. Kicza
Director, National Climatic Data CenterThomas R. Karl
Compiled on behalf of NOAA/NESDIS by:
National Climatic Data Center (NCDC) 151 Patton Avenue
Asheville, NC 28801
Sharon Leduc, Deputy Director, NCDC e-mail: [email protected]
Howard J. Diamond, USCRN Program Manager e-mail: [email protected]
Michael A. Palecki, USCRN Science Project Manager e-mail: [email protected]
Report will be posted on the USCRN Website at:
<http://www.ncdc.noaa.gov/oa/climate/uscrn/>
Many Thanks to the USCRN Team Members for Their Invaluable Assistance in Aiding in the Preparation of this Report:
Bruce Baker Debra Braun
David Easterling Mark Hall
Jay Lawrimore Marjorie McGuirk
Tilden Meyers
ii
Preface
Long-term, high-accuracy, stable environmental observations are essential to define the state of the global integrated Earth system, its history, and its future variability and change. Observations for climate include: (1) operational weather observations, when appropriate care has been exercised to establish high accuracy; (2) limited-duration observations collected as part of research investigations to elucidate chemical, dynamical, biological, or radiative processes that contribute to maintaining climate patterns or to their variability; (3) high accuracy, high precision observations to document decadal-to-centennial changes; and (4) observations of climate proxies, collected to extend the instrumental climate record to remote regions and back in time to provide information on climate change at millennial and longer time scales.
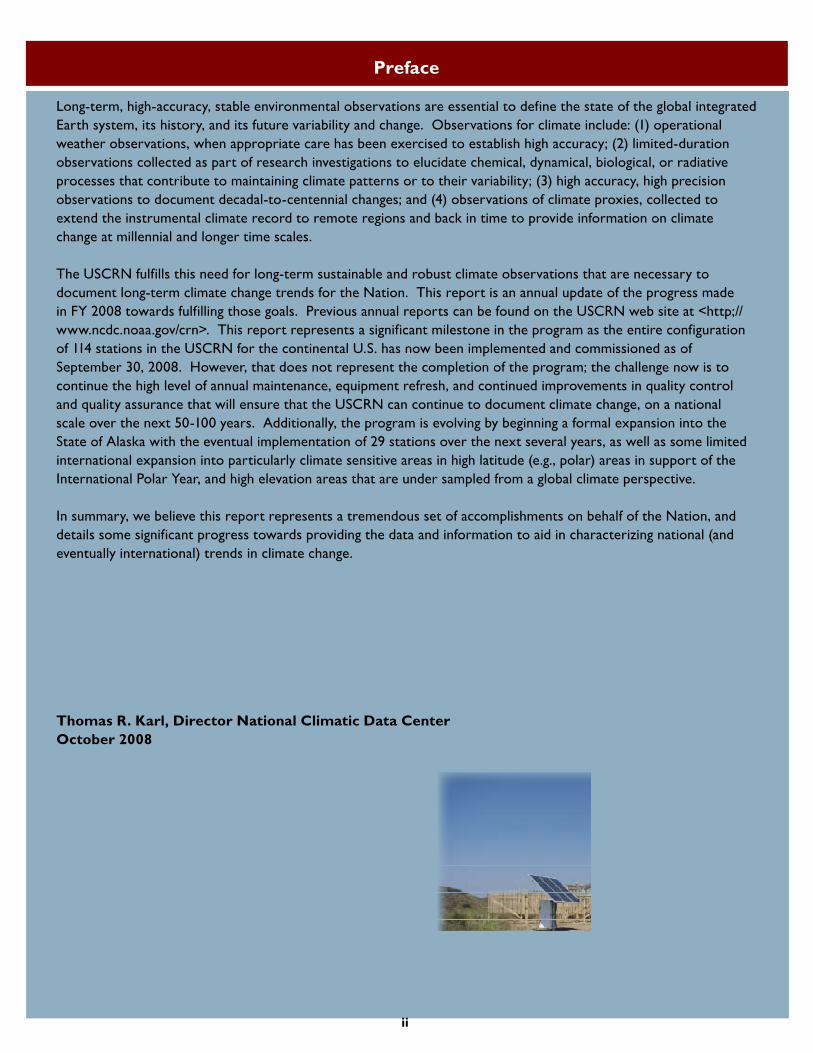
The USCRN fulfills this need for long-term sustainable and robust climate observations that are necessary to document long-term climate change trends for the Nation. This report is an annual update of the progress made in FY 2008 towards fulfilling those goals. Previous annual reports can be found on the USCRN web site at <http;//www.ncdc.noaa.gov/crn>. This report represents a significant milestone in the program as the entire configuration of 114 stations in the USCRN for the continental U.S. has now been implemented and commissioned as of September 30, 2008. However, that does not represent the completion of the program; the challenge now is to continue the high level of annual maintenance, equipment refresh, and continued improvements in quality control and quality assurance that will ensure that the USCRN can continue to document climate change, on a national scale over the next 50-100 years. Additionally, the program is evolving by beginning a formal expansion into the State of Alaska with the eventual implementation of 29 stations over the next several years, as well as some limited international expansion into particularly climate sensitive areas in high latitude (e.g., polar) areas in support of the International Polar Year, and high elevation areas that are under sampled from a global climate perspective.
In summary, we believe this report represents a tremendous set of accomplishments on behalf of the Nation, and details some significant progress towards providing the data and information to aid in characterizing national (and eventually international) trends in climate change.
Thomas R. Karl, Director National Climatic Data CenterOctober 2008

iii
1. Introduction ....................................................................................................................................1
2. Program Base ..................................................................................................................................1
2.1 Program Capability ....................................................................................................................1
2.2 Program Purpose ......................................................................................................................1
2.3 Program Requirement Drivers ...................................................................................................1
2.3.1 Legislative .......................................................................................................................1
2.3.2 Executive/International/Programmatic .............................................................................1
2.4 Program Objectives and Characteristics .....................................................................................2
2.4.1 Capabilities Required ........................................................................................................3
3. Program-Level Performance Measures ............................................................................................4
3.1 FY 2001-2007: Achievements: Milestones & Performance Measures ........................................4
3.2 FY 2008 Achievements: Milestones & Performance Measures .................................................4
3.3 FY 2008 Performance Measures: Climate Uncertainty .............................................................4
3.4 FY 2008 Performance Measures: Data Ingest ...........................................................................4
4. FY 2008 Installations and Surveys ..................................................................................................4
4.1 USCRN Begins Installations in Alaska .......................................................................................5
4.2 Breadth of USCRN Station Partnership Network .......................................................................5
5. FY 2008 USCRN Sensor Testing and Science Studies ......................................................................6
5.1 Triple Configuration for the Primary Sensors and Power Aspirations for the
Temperature Sensors ................................................................................................................6
5.2 Precipitation Gauge and Windshield Testing .............................................................................7
5.3 Soil Moisture and Soil Temperature Sensor Testing and Deployment Plans ................................8
5.4 New-Generation Sensor Testing and Testbeds ..........................................................................9
5.5 International Deployment by WMO for Testing ........................................................................10
5.6 Research Papers and Abstracts in FY 2008 ...............................................................................11
6. FY 2008 International Cooperation ................................................................................................11
6.1 The Canadian Climate Partnership and Technology Exchanges..................................................11
6.2 The Global Climate Observing System (GCOS) and the USCRN ...............................................12
7. Understanding USCRN Station Data ...............................................................................................12
7.1 Operation and Monitoring During an Active Hurricane Season .................................................13
7.2 Defining the Ranges of Parameter records: The Present USCRN Records
and Ranges ..............................................................................................................................14
8. USCRN Documentation Access: Selected Internet Addresses by Topics .........................................14
9. FY 2000-2008 Summary ................................................................................................................16
10. FY 2009 Planned Activities and Goals ...........................................................................................16
Acronyms ...........................................................................................................................................17
Listing of USCRN Data Tables
Table 1 – USCRN Reduction in Climate Uncertainty ............................................................................4
Table 2 – USCRN Data Receipt Rates ..................................................................................................5
Table 3 – USCRN Temperature Records ..............................................................................................15
Table 4 – USCRN Maximum and Minimum Duration Records .............................................................15
Table 5 – USCRN Precipitation Records ..............................................................................................15
TABLE OF CONTENT

1
INTRODuCTION
This is the sixth annual report for NOAA’s United States Climate Reference Network (USCRN). The primary focus of this report is on the FY 2008 USCRN development and implementation activities. Initial projections of activities planned for FY 2009 are included. FY 2000-FY 2003 USCRN activities were reported in the USCRN FY 2003 Annual Report, and FY 2004, FY 2005, FY 2006, and FY 2007 activities in the USCRN FY 2004, FY 2005, FY 2006, and FY 2007 Annual Reports, respectively.
This report includes reviews of the USCRN, performance measures, and stations installed; research progress and plans; instrument testing and forthcoming new instrumentation deployments; partnership activities at multiple levels; data completeness and data availability via the Internet; and information about NOAA’s Global Climate Observing Systems (GCOS) international activities and plans, as well as information about the planned implementations of the USCRN in Alaska and installation of soil moisture (SM)/soil temperature (ST) and relative humidity (RH) sensors throughout the USCRN. Finally, documentation is included detailing the completion of the deployment phase of the 114 USCRN site configuration for the lower 48 states, or continental United States (CONUS), as of the end of FY 2008.
2. PROGRAM BASE
The required program capability, purpose, and requirement drivers for the USCRN are detailed below:
2.1 Program Capability The USCRN Program adheres to NOAA’s strategy of “Monitor and Observe”: “We will invest in high-quality, long-term climate observations and will encourage other national and international investments to provide a comprehensive observing system in support of climate assessments and forecasts.” (NOAA Strategic Plan; available at <http://www.ppi.noaa.gov/PPI_Capabilities/spo.html>)
2.2 Program Purpose The USCRN Program will provide the United States with a climate monitoring and climate change network that meets national commitments to monitor and document climate change for the CONUS. The USCRN Program will complete deployment of 114 operational stations in the continental United States by the end of FY 2008 to achieve the target performance measures (Section 3.3). The overall program purpose is to:
Ensure that future changes and variations in primary measurements at specific locations can be monitored without the need for unexplained adjustments and corrections to the data. Primary measurements at each site will include air temperature and precipitation, supplemented with other measurements such as wind speed, solar radiation, and infrared radiation. The network will provide adequate spatial coverage to monitor the annual and decadal-to-centennial temperature and precipitation trends for the CONUS. Fundamental to this goal is the requirement to establish a network that 50 years from now will answer the specific question: “How has the climate of the United States changed over the past 50 years?” The program adheres as closely as possible in both spirit and scientific-technological exactness to ten GCOS Climate Monitoring Principles1. These have been adopted by the National Research Council (NRC) of the National Academy of Sciences (NAS), as well as the U.S. Climate Change Science Program (CCSP), as defining principles for climate monitoring stations and long-term climate monitoring networks.
2.3 Program Requirement Drivers 2.3.1 LegisLative: Federal Data Quality Legislation (Act) (Public Law 106-•554 Section 515): Section 515 is known as the Data Quality Act—government must assure the quality of the information disseminated.
Commerce and Trade-15 USC 313: “establish and •record the climate conditions of the United States.”
Global Change Research Act of 1990 requires an early •and continuing commitment to “global measurements, establishing worldwide observations, and related data and information systems”
44 USC 31 PL 81-754 Federal Records Act of 1950: •provides for Agency Records Center and in 1951 the National Weather Records Center established an Agency for U.S. weather and climate records [the National Climatic Data Center (NCDC)] with responsibilities of archiving and servicing.
33 USC 883b, Agent Agreement: “… authorize activities •of processing and publishing data…”
15 USC CH29 PL 95-357 National Climate Program Act: •authorizing “…. Global data collection monitoring and analysis…”; “…management and active dissemination of climatological data…”; and “… increase international cooperation … monitoring, analysis and data dissemination”
2.3.2 executive/internationaL/Programmatic Earth Observation Summit [and Group on Earth •
1 See <http://www.wmo.int/pages/prog/gcos/documents/GCOS_Climate_Monitoring_Principles.pdf>

2
Observation (GEO) Working Group]: The Summit Declaration reaffirmed the need for timely, quality, long-term global information as a basis for sound decision making and called for filling data gaps. The Summit Declaration also affirmed the need for “producing calibrated data sets in useful formats from multiple sensors and venues”.
CCSP Strategic Plan: The plan has articulated a number •of goals, including (1) “complete required atmosphere and ocean observation elements needed for a physical climate observing system”—this includes the USCRN as an underpinning for providing the highest quality benchmark data for enabling the determination of transfer functions with other U.S. meteorological networks, such as the Automated Surface Observing System (ASOS), Surface Radiation (SURFRAD), and Cooperative Observation (COOP); (2) “…easily accessible information about the data holdings, including quality assessments, supporting ancillary data, and guidance and aid for locating and obtaining data”; and (3)“[p]reservation of all data needed for long-term global change research. For each and every global change data parameter, there should be at least one explicitly designated archive.”
GCOS Second Adequacy Report: Concerning data •accessibility and quality, “[t]here are many observations of the climate system already being taken today. The report notes many times where there are issues with respect to the limited accessibility to much of the data and problems with its quality. Addressing these issues would have an immediate and positive impact on the ability of the current global observing system for climate to meet the needs of the Parties.” More pointedly, the report states “Notwithstanding the use being made of current information and improvements made in the past few years, the IPCC has recently reported…that additional and sustained climate observations are required to improve the ability to detect, attribute, and understand climate change and to project future climate changes…Without urgent action … the Parties will lack the information necessary to plan for and manage their response to climate change.”
World Climate Data and Monitoring Programme •(WCDMP) Guidelines on Climate Observation Networks and Systems (WCDMP No. 52) and Guidelines on Climate Metadata and Homogenization (WCDMP No. 53): These World Meteorological Organization (WMO) documents identify the “best practices” for climatological observations, data collection, metadata, and archival activities. These documents bring all WMO members to similar standards using the Ten Primary Climate Principles referred to in Section 2.2 as a base. These standards are a base for USCRN implementation, and are assiduously applied by the NOAA USCRN Team; thus, USCRN stations and their instrumentation suites are qualified as “Principal Climate Observations Stations” and “Reference Climate Stations.”
NOAA Annual Guidance Memorandum: It is necessary •to “Take the Pulse of the Planet” by contributing to the Integrated Global Observing System through development of a “comprehensive, NOAA-wide data collection, quality control, storage, and retrieval program.” In support of this goal of an Integrated Global Observing System, several bi-lateral agreements have been agreed upon and are in effect: the U.S/Canada Weather-Climate Memorandum of Understanding; the GCOS initiative to stimulate USCRN-like initiatives in Latin America and other regions; and the Smithsonian Tropical Research Institute (STRI)/NCDC Memorandum of Understanding.
U.S. Climate Change Research Initiative: The goal is to •improve global observing systems, including those being built by/in developing countries, and to improve general access to global observations. The Administration position was outlined in a speech by President George W. Bush in June 2001, enjoining the climate community to provide decision makers with more precise, less controversial climate data and trend analyses than any previously possible such that public policy decisions of great gravity can be made with the highest possible confidence. The philosophical-technological base of the USCRN is derived from the GCOS Climate Monitoring Principles as initially formulated with and reviewed by the government and academic climate communities in 1999 and as now endorsed by the WMO as Guiding Principles for the design and operations of climate stations, and as recommended for the fielding, operations, and maintenance for long-term national and international surface climate monitoring networks.
G8 Endorsement: The 2008 G8 Summit held in Japan •in May 2008 issued a statement on Environment and Climate Change, endorsing the type of work that the USCRN is working towards accomplishing. The following excerpt from the 2008 G8 Declaration on Environment and Climate Change, paragraph 31, summarizes this endorsement quite well:
“We note the opportunity to promote research on complementary technological approaches which may contribute towards maintaining a stable climate. To respond to the growing demand for Earth observation data, we will accelerate efforts within the Global Earth Observation System of Systems (GEOSS), which builds on the work of UN specialized agencies and programs, in priority areas, inter alia, climate change and water resources management, by strengthening observation, prediction and data sharing. We also support capacity building for developing countries in earth observations and promote interoperability and linkage with other partners.”
2.4. Program Objectives and Characteristics The USCRN Program objectives are to develop, acquire, install, and operate the premier environmental climate

3
monitoring network in the United States. The USCRN provides stable surface temperature and precipitation observations that are accurate and representative of local environmental conditions. Station site location is particu-larly important because the environmental conditions around each station site must not ever be affected by encroachment of urban expansion or by other conditions that create a changing environment. Accurate climate representativeness and long-term maintenance at each USCRN station location are essential requirements for a climate monitoring network.
As required by the climate science community and codified by the NAS-NRC, WMO, and NOAA’s NCDC USCRN Functional Requirements Document, the USCRN, as a primary climate monitoring network, has the following attributes:
triple configuration sensors for temperature and precipi-a. tation (see Section 5.1);a very high percentage of data ingest over various periods b. (e.g., minimum of 98% of all possible observations for a given year must be archived at NOAA’s national archive, NCDC) to satisfy requirements for climate science;stringent siting standards and an objective, quantitative c. assessment, which is annually verified and maintained for the long-term for each site as an essential part of the overall metadata pertaining to each site and station;rigorous periodic maintenance and calibration program d. with thorough documentation, which is systematically collected and archived at least once per year;an organized archive of complete metadata for all USCRN e. sensors, sites, and data characteristics, which must be long-term and well maintained at the national archive;overlapping observations to develop statistical transfer f. functions and full metadata for systematic, periodic technology refreshes, which must be maintained for both intra- and inter-network comparisons;strict Configuration Management (CM) for systemati-g. cally documenting network change(s), maintaining stan-dards, and ensuring that requirements growth does not impinge upon the primary purpose of the network for climate monitoring, which will be accomplished through thorough, updated CM documentation to ensure full implementation of sound scientific data stewardship principles;maintenance of a continuous data analysis and data quality h. component for continuous monitoring of both network data and metadata;emphasis on the network’s primary purpose of satisfying i. the climate science community’s requirements;activities that must be implemented to satisfy all stan-j. dards, with consistency in change management for a period of a century or more; andcapabilities for community, user, and need evolution, yet k.
remains focused upon and loyal to the constancy and maintenance of the long-term GCOS Climate Monitor-ing Principles.
When possible, USCRN stations have been co-located with or near existing meteorological observation sites such as those of the NCDC-designated Historical Climatology Network (HCN) at National Weather Service (NWS) COOP sites and affiliated HCN Modernization (HCN-M) sites, the Canadian Reference Climate System (RCS) Network, the Bureau of Land Management-Forest Service Remote Automated Weather Stations (RAWS), the NOAA SURFRAD, the University of New Hampshire’s AIRMAP stations, and various state mesonet stations (e.g., Alabama, Kentucky, Oregon, and Washington).
USCRN field stations are designed to operate without planned, daily human obligation, and to continue operations under extreme environmental conditions. NCDC provides data ingest, quality control monitoring, data processing, archiving, and user access capabilities to both the climate research community and the general public. USCRN field system technology has proven to be highly reliable, precise, robust, and maintainable so that it collects, formats, processes, and communicates measurements of environmental parameters to NOAA’s national archive at NCDC, the central data management and processing facility. The tables in Section 3 detail the high rate of data availability across the network.
After the initial four years of development and field operations, the first 40 USCRN stations deployed were verified as having sufficient spatial distribution, reliability, and stability to provide the planned science information value. NOAA commissioned the network in January 2004. Since its inception, incremental station improvements have been and will continue to be made under strict CM control. By the end of FY 2008, the network consisted of 114 homogeneous and commissioned stations in 42 States in the CONUS.
2.4.1 caPabiLities required The required capabilities of the USCRN are the following:
provision of land-based reference stations and stan-a. dard land surface observing stations for tiered NOAA ground observing systems such as NOAA’s COOP and ASOS networks;
coverage of sufficient temporal and spatial resolution to b. monitor national spatial scales for physical phenomena and to determine with the highest confidence trends of significant socio-economic and scientific importance;
measurements of key variables adhering to the NRC and c. GCOS Climate Monitoring Principles. The two primary
4
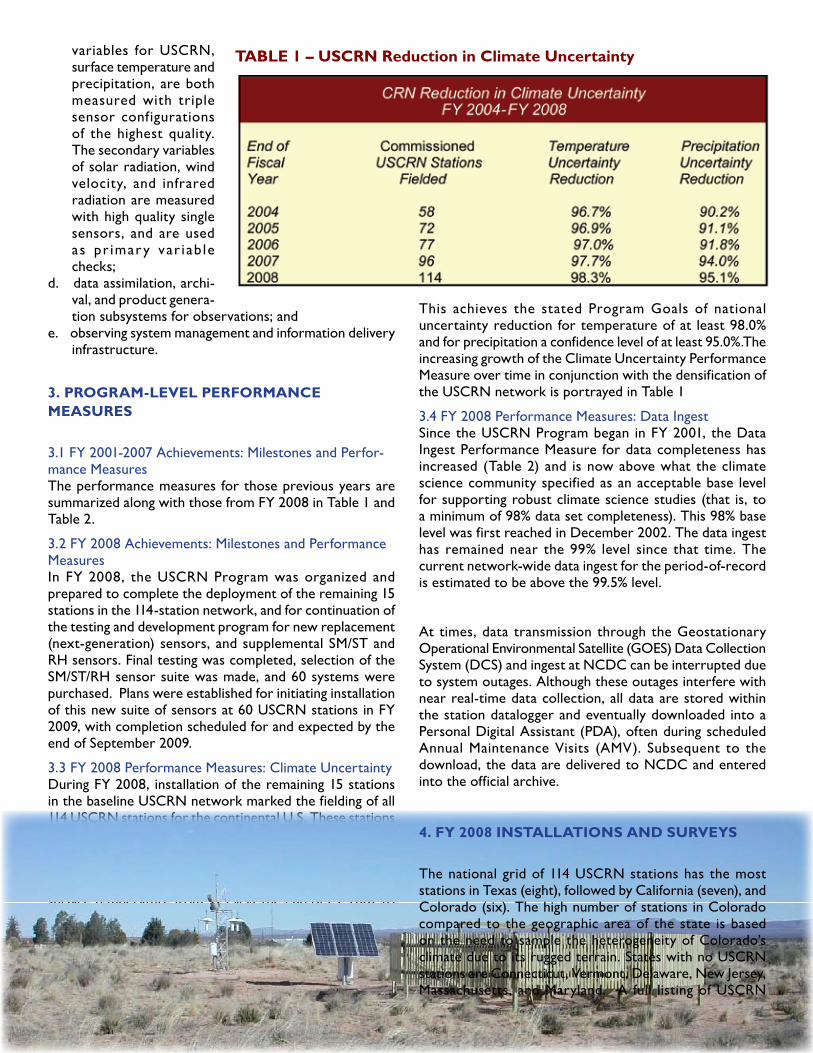
variables for USCRN, surface temperature and precipitation, are both measured with triple sensor configurations of the highest quality. The secondary variables of solar radiation, wind velocity, and infrared radiation are measured with high quality single sensors, and are used as pr imar y var i ab le checks;
data assimilation, archi-d. val, and product genera-tion subsystems for observations; and
observing system management and information delivery e. infrastructure.
3. PROGRAM-LEvEL PERfORMANCE MEASuRES
3.1 FY 2001-2007 Achievements: Milestones and Perfor-mance MeasuresThe performance measures for those previous years are summarized along with those from FY 2008 in Table 1 and Table 2.
3.2 FY 2008 Achievements: Milestones and Performance MeasuresIn FY 2008, the USCRN Program was organized and prepared to complete the deployment of the remaining 15 stations in the 114-station network, and for continuation of the testing and development program for new replacement (next-generation) sensors, and supplemental SM/ST and RH sensors. Final testing was completed, selection of the SM/ST/RH sensor suite was made, and 60 systems were purchased. Plans were established for initiating installation of this new suite of sensors at 60 USCRN stations in FY 2009, with completion scheduled for and expected by the end of September 2009.
3.3 FY 2008 Performance Measures: Climate UncertaintyDuring FY 2008, installation of the remaining 15 stations in the baseline USCRN network marked the fielding of all 114 USCRN stations for the continental U.S. These stations were subsequently commissioned along with three stations installed in the latter months of FY 2007. The deployment and commissioning of the full network increased the National Performance Measure (PM) in the CONUS for surface temperature from 97.7% at the end of FY 2007 to 98.3% at the end of FY 2008. Likewise the National PM for precipitation increased from 94.0% at the end of FY 2007 to 95.1% at the end of FY 2008. The lower confidence of the precipitation PM compared to the temperature PM is due to the greater temporal and spatial resolution needed to estimate the national precipitation total with confidence.
This achieves the stated Program Goals of national uncertainty reduction for temperature of at least 98.0% and for precipitation a confidence level of at least 95.0%.The increasing growth of the Climate Uncertainty Performance Measure over time in conjunction with the densification of the USCRN network is portrayed in Table 1
3.4 FY 2008 Performance Measures: Data IngestSince the USCRN Program began in FY 2001, the Data Ingest Performance Measure for data completeness has increased (Table 2) and is now above what the climate science community specified as an acceptable base level for supporting robust climate science studies (that is, to a minimum of 98% data set completeness). This 98% base level was first reached in December 2002. The data ingest has remained near the 99% level since that time. The current network-wide data ingest for the period-of-record is estimated to be above the 99.5% level.
At times, data transmission through the Geostationary Operational Environmental Satellite (GOES) Data Collection System (DCS) and ingest at NCDC can be interrupted due to system outages. Although these outages interfere with near real-time data collection, all data are stored within the station datalogger and eventually downloaded into a Personal Digital Assistant (PDA), often during scheduled Annual Maintenance Visits (AMV). Subsequent to the download, the data are delivered to NCDC and entered into the official archive.
4. fY 2008 INSTALLATIONS AND SuRvEYS
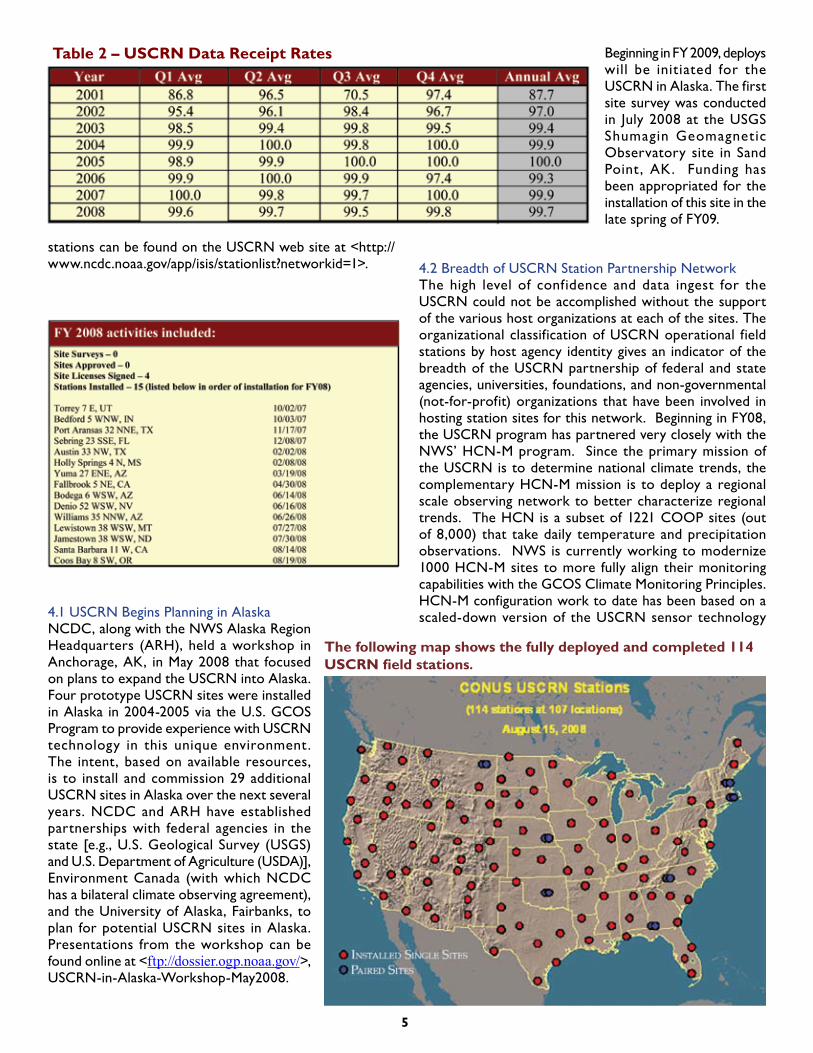
The national grid of 114 USCRN stations has the most stations in Texas (eight), followed by California (seven), and Colorado (six). The high number of stations in Colorado compared to the geographic area of the state is based on the need to sample the heterogeneity of Colorado’s climate due to its rugged terrain. States with no USCRN stations are Connecticut, Vermont, Delaware, New Jersey, Massachusetts, and Maryland. A full listing of USCRN
TABLE 1 – uSCRN Reduction in Climate uncertainty
5
stations can be found on the USCRN web site at <http://www.ncdc.noaa.gov/app/isis/stationlist?networkid=1>.
4.1 USCRN Begins Planning in AlaskaNCDC, along with the NWS Alaska Region Headquarters (ARH), held a workshop in Anchorage, AK, in May 2008 that focused on plans to expand the USCRN into Alaska. Four prototype USCRN sites were installed in Alaska in 2004-2005 via the U.S. GCOS Program to provide experience with USCRN technology in this unique environment. The intent, based on available resources, is to install and commission 29 additional USCRN sites in Alaska over the next several years. NCDC and ARH have established partnerships with federal agencies in the state [e.g., U.S. Geological Survey (USGS) and U.S. Department of Agriculture (USDA)], Environment Canada (with which NCDC has a bilateral climate observing agreement), and the University of Alaska, Fairbanks, to plan for potential USCRN sites in Alaska. Presentations from the workshop can be found online at <ftp://dossier.ogp.noaa.gov/>, USCRN-in-Alaska-Workshop-May2008.
Beginning in FY 2009, deploys will be initiated for the USCRN in Alaska. The first site survey was conducted in July 2008 at the USGS Shumagin Geomagnetic Observatory site in Sand Point , AK. Funding has been appropriated for the installation of this site in the late spring of FY09.
4.2 Breadth of USCRN Station Partnership Network The high level of confidence and data ingest for the USCRN could not be accomplished without the support of the various host organizations at each of the sites. The organizational classification of USCRN operational field stations by host agency identity gives an indicator of the breadth of the USCRN partnership of federal and state agencies, universities, foundations, and non-governmental (not-for-profit) organizations that have been involved in hosting station sites for this network. Beginning in FY08, the USCRN program has partnered very closely with the NWS’ HCN-M program. Since the primary mission of the USCRN is to determine national climate trends, the complementary HCN-M mission is to deploy a regional scale observing network to better characterize regional trends. The HCN is a subset of 1221 COOP sites (out of 8,000) that take daily temperature and precipitation observations. NWS is currently working to modernize 1000 HCN-M sites to more fully align their monitoring capabilities with the GCOS Climate Monitoring Principles. HCN-M configuration work to date has been based on a scaled-down version of the USCRN sensor technology
Table 2 – uSCRN Data Receipt Rates
The following map shows the fully deployed and completed 114 USCRN field stations.

6
suite; experience with a network of 17 HCN-M prototype sites in Alabama begun in 2006 has been a starting point for cooperative work between the two programs that will continue. In addition, a pilot program involving the installation of 152 HCN-M sites in the Southwest U.S. was begun in 2008. This work involves considerable collaboration with the USCRN program as it leverages off of lessons learned and successes realized over the past SIX years of experience with implementing USCRN.
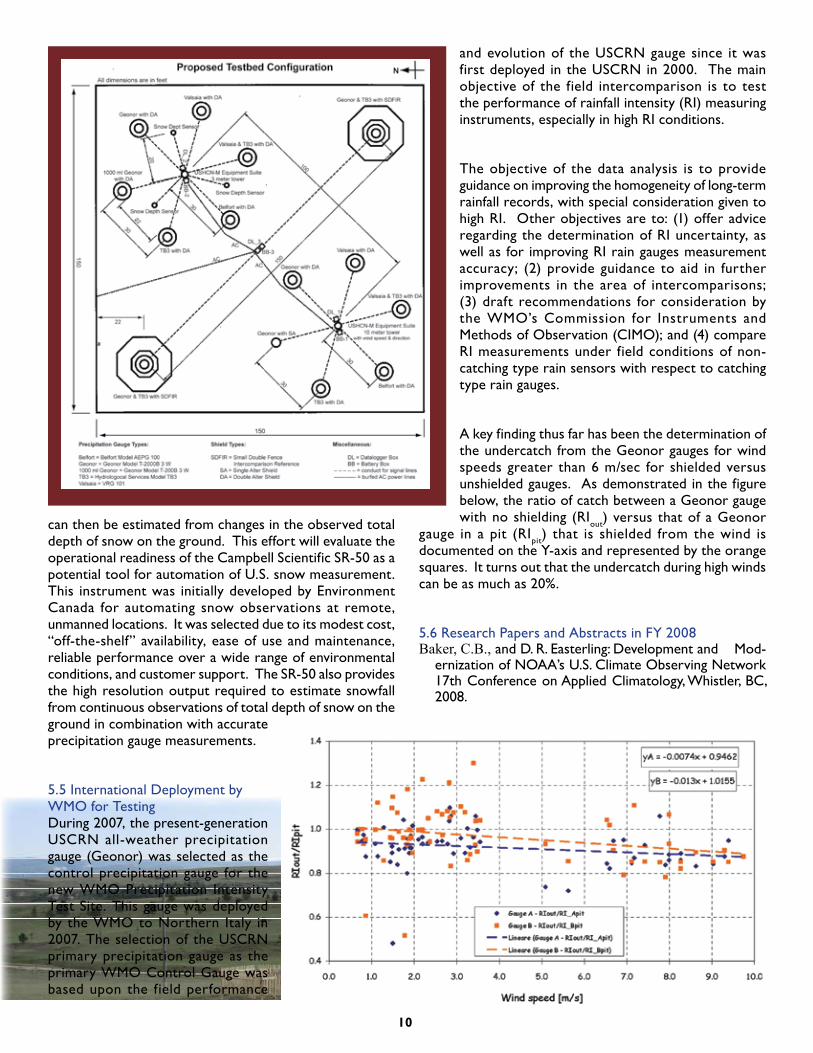
5. fY 2008 uSCRN SENSOR TESTING AND SCIENCE STuDIES
Two USCRN stations, which are precipitation test beds located in Sterling, VA and Johnstown, PA, continue to provide long-term, engineering performance, and reference base data on the frequency of occurrence of false precipitation events, particularly those that provide confidence data on the performance of the CRN Geonor and its large wind fence, which is a small double-fence intercomparison reference (SDFIR) under dif ferent environmental conditions. In addition, the USCRN program has test sites at NOAA’s Atmospheric Turbulence and Diffusion Division (ATDD) in Oak Ridge, TN, for testing datalogger software and engineering modifications; the National Center for Atmospheric Research in Boulder, CO, where a new precipitation testbed was established in 2008; and bilateral co-located sites at the USGS Earth Resources Observation and Science (EROS) Data Center in Sioux Falls, SD, as well as at Environment Canada’s testing facility in Egbert, Ontario, where reference climate station testing takes place involving both U.S. and Canadian scientists.
5.1 Triple Configuration for the Primary Sensors and Power-Aspiration for the Temperature SensorsThe issue of using a triple configuration of sensors for the temperature and precipitation measurements has been addressed in previous annual reports. This apparent overkill
in primary parameter sensing was designed in response to the climate science requirement to have both accuracy and completeness in the climate record. Algorithms can identify the “most likely” temperature and the “most likely” precipitation amount given the availability of three independent measurements. With two sensors alone, if there is variance or discrepancy between the two, it is more difficult to determine which instrument might be reading correctly and which might be reading incorrectly. The third sensor added to modern long-term climate monitoring stations, assuming that it too is properly calibrated and maintained, allows for the rapid and precise identification of which of the other two sensors is reading incorrectly (or correctly).
A question has been raised numerous times concerning why the USCRN temperature radiation shields are power aspirated instead of utilizing natural aspiration. For high-confidence climate measurements, natural aspiration is insufficient in providing measurements that are either accurate or of sufficient confidence as to provide unbiased measurements of the temperature of the near-surface atmosphere. The atmosphere inside a non-aspirated shield or container is known to be an inaccurate representation of the atmosphere outside of the shield; the same is true of the temperature inside a traditional naturally-aspirated shield, tube, or shelter such as a Stevenson Screen or Cotton Region Shelter.
Even with the triple-walled radiation shield that is used on USCRN stations, when a powered fan at the top of one of these shields fails and stops ingesting air from the outside atmosphere, drifts or departures of the measurements occur inside the temperature sensor shield with the failed fan as compared to the measurements of temperature inside the other two temperature sensor shields with operating fans.
A failed fan and temperature deviation might not be detected without three independent measurements of temperature. For example, after Fan #2 failed at Stovepipe Wells in Death Valley, CA, the temperature readings in the #2 shield rose as much as 2.2°C higher than the ventilated readings in the other two shields. This departure occurred despite ambient wind speeds of 5 to 12 mph, and prior to sunset, the temperature readings in the #2 shield dropped to a cooler reading than the other two sensors in the working fan ventilated shields. By sunrise, the temperature readings in the shield with the failed fan were as much as 0.6°C cooler than those reported from the working fan ventilated shields. A similar incident of a single fan failure at the Newton, MS USCRN station on July 20, 2006, a hot and humid environment, resulted in temperature departures of a similar magnitude to Stovepipe Wells, but without a large swing from day to night.
HCN-M Grid Points: Black DotsCurrent HCN sites: Red Crosses

7
5.2 Precipitation Gauge and Windshield TestingThe gauge and shield combination that is implemented by the USCRN network is providing unprecedented accuracy in precipitation measurements. Three individual wires provide three separate measurements of the precipitation in one gauge, protecting against operational anomalies and loss of information that may occur when only one measurement is available. In side-by-side comparisons at the Sterling, VA test facility with 375 liquid precipitation events, the two Geonor/SDFIRs agree within 1%. In addition, there have been 105 solid precipitation events and both systems agree within 1% as noted in the following TWO figures.
The accurate measurement of precipitation is very difficult. When the precipitation is in solid form (snow), measurement difficulties are compounded. Wind causes
most of the errors in precipitation measurements. As wind speed increases, precipitation measurement errors increase, especially for snow. Shields reduce wind measurement errors by directing wind flow around and under the gauge, thereby reducing turbulence over the top of the gauge. Shields may also reduce relative wind speed in the general area of the gauge.
Location and microclimate around the gauge also help to determine the quality of precipitation data from that location. The gauge location should be relatively flat, representative of the overall area, and free of isolated, unusual obstructions that could cause any impacts on the microclimate of the gauge location (buildings, shrubbery, etc.). Gauge locations, such as on roof tops and similar locations, should be avoided because of increased wind speeds in such locations.
It is apparent that in locations where most precipitation is liquid, gauge type and shield type are less important. However, as climate conditions become harsher, such as at Johnstown (i.e., more wind and solid precipitation), gauge
type and shield type become more important for obtaining correct precipitation data. Increased wind protection is necessary when a large percentage of precipitation is solid.
In general, the Operational Test of various precipitation sensors, conducted from November 2003 through March 2008, has shown and reinforced the following:
The Geonor gauge functions as well as, or •better, than other gauges in the test array [tipping buckets (TB), Ott, and Vaisala].
Weighing gauges such as the Geonor and •Ott function better in harsh climates than TB gauges.
Gauge shields (Alter, Tretyakov, and ASOS) reduce •wind-caused measurement errors, with the Double Alter (DA) providing the most protection for single shield configurations.
DA shields do not provide as much protection as the •Double Fence Intercomparison Reference (DFIR) or Small Double Fence Intercomparison Reference (SDFIR) setup combined with the Alter or Tretyakov.
With regard to specific test objectives:
Wetness Sensor: The wetness sensor has proved to be a viable tool in determining when precipitation occurs and, more importantly, when false reports occur. The false report evaluation/algorithm, as described in Section 7, corrects raw data to eliminate false reports. During this study, false reports from the Geonor gauge have been about 1.3% of total precipitation.

8
Vaisala Gauge: The Vaisala gauge has performed well during this test. It appears to be reliable and consistent. Overall statistics indicate that, in general, it measures approximately the same as a Geonor gauge. A Vaisala gauge inside a DA shield undercatches the Geonor by 4%, while a Vaisala inside a SDFIR/Alter overcatches it by 11%. Unfortunately, both Vaisala gauges were at Sterling where little solid precipitation falls. Also, the Vaisala inside the SDFIR/Alter had only several months of data, so the large overcatch may not be representative of long term performance.
Comparison of Shields: Single shields, Alter and Tretyakov, are superior to the ASOS shield. Double shields (DFIR and SDFIR combined with the Alter or Tretyakov) provide the most protection for precipitation gauges. DA shields do not provide as much protection as do the DFIR/SDFIR combined with the Alter or Tretyakov shield.
Event Summary: For liquid precipitation events, as they have been defined here, all gauge-shield combinations used in this test provide acceptable results. The value added by installing SDFIR or DFIR shielding appears to be marginal at best. For high wind events, there is a tendency at Johnstown for the Geonor/Alter combination to undercatch the Ott/Tretyakov combination. However, with only eight samples, this tendency may not be valid. For snow and mixed events, the effectiveness and value of the Alter/SDFIR or Tretyakov/(S)DFIR combination shielding is readily apparent.
5.3 Soil Moisture and Soil Temperature Sensor Testing and Deployment PlansEvaluation of SM, ST, and RH sensors is also under evaluation at NOAA’s ATDD. A test station at the ATDD facility has been fitted with ~50 SM/ST sensors for fitness and parameter precision testing. This testing was hampered in 2007 by the extreme drought conditions that year throughout the southeastern United States. Despite this lack of natural cooperation, sufficient data were gathered from the sensor arrays in the experimental array at Oak Ridge that there were discussions with the Program Manager of the National Integrated Drought and Information System (NIDIS) about beginning possible inclusion of these drought-critical sensors at USCRN stations across the United States during FY2008. It is readily apparent that there is a critical national need for SM/ST data to be incorporated into the joint NOAA/USDA Weekly National Drought Monitor and the Monthly North American Drought Monitor product generated by Canada, Mexico, and the United States. This deployment, when completed, will provide a national-level first look at SM/ST conditions as portrayed below. Extension of this SM/ST monitoring capability to Canadian Reference Climate System stations and two proposed CRN stations in Mexico are recommended, and must await future program evolution.
This enhancement to the network should be useful to climate forecasting and modeling, reservoir management, irrigation scheduling, and crop yield forecasting and contribute to independent verification, validation, and calibration of satellite based sensors and measurements. The proposed configuration of number and placement of soil moisture/soil temperature sensors includes multiple sensors at five different soil levels. Sensor redundancy will be ensured at the critical upper levels where plant response and soil moisture conditions often change with the greatest magnitude and in the shortest amount of time.
The five levels and sensor counts at each level are specified below:
3 sensor suites at a depth of 5 cm
3 sensor suites at a depth of 10 cm
2 sensor suites at a depth of 20 cm
1 sensor suite at a depth of 50 cm
1 sensor suite at a depth of 100 cm
Soil moisture, like many other soil measurements, is subject to an inherent natural variability that can only be assessed by replicate sampling for in situ measurement systems (in order to quantify parameter uncertainty, particularly in a soil column). The above depth configuration of the sensors optimizes the ability to characterize and quantify the variability in the most variable upper layers.
Multiple sensor configurations help to ensure continuity of measurements for a particular depth, especially if a particular sensor fails. This use of multiple sensors also potentially decreases network maintenance cost, as a site can continue reporting observations until a failed sensor is replaced during a scheduled maintenance visit.
This configuration will improve our ability to calculate the water budget at these sites because the upper layers are most variable and the uncertainty can be accurately quantified with the multiple measurements at the same level. This quantification of measurement uncertainty will be invaluable for remote sensing and modeling applications.
Research has begun using these multiple sensor measurements to develop methods for routinely examining the matrix of the primary water budget variables of soil moisture, soil temperature, relative humidity, and precipitation. Once those relationships are better quantified, the development of quality control procedures for the soil moisture and soil temperature variables will be initiated.

9
The USCRN team has asked the United States Drought Portal (USDP) team to coordinate with partners to provide a list of priority soil moisture and temperature-related products to be developed during and following implementation of the new sensors. A brief summary of the top five priorities provided from a subset of NIDIS participants follows. These priorities are in addition to ensuring that post-processed daily and hourly USCRN soil moisture data are available.
Maps of soil moisture, soil temperature, and anomalies •are needed. These fields should be available in point and interpolated form, and on timescales (day, week, two weeks, month, 12 months) consistent with the those used by NOAA’s Climate Prediction Center (CPC) for monitoring and predicting soil moisture. These products can then be used to provide consistent monitoring to that provided by CPC as well as verification of soil moisture model output from CPC and the University of Washington’s Land Data Assimilation System (LDAS).
In addition to verification of LDAS estimates of soil •moisture, USCRN soil moisture data should be available to CPC and the LDAS community for incorporation into models. The exact nature of the inputs will be determined in conjunction with requisite partners.
With the inclusion of soil moisture, soil temperature, and •relative humidity, USCRN takes all the measurements necessary to compute estimates of latent and sensible heat flux and to create a surface energy budget. These high-quality measurements will prove invaluable to the numerous partners.
An enhanced USCRN should be used to determine the •change and variability in the timing of snowmelt runoff, particularly in the western U.S., which relies on the runoff for most of its water supply. Changes in the timing of spring runoff are critical to efficient reservoir operations and a stable water supply. Determining the changes in spring runoff will also prove invaluable in describing climate change.
In order to provide a more complete look at U.S. soil •moisture, the USCRN data should be merged with partner data that use the same sensor packages or when differences in sensor packages can be quantified. Combining USCRN soil moisture data with USDA’s Soil Climate Analysis Network (SCAN) data and possibly with other networks around the U.S. (e.g., Oklahoma Mesonet) will allow a sub-national look at variability and provide the ability to enhance regional and local products.
Planning is currently underway to conduct a science workshop at ATDD in mid-FY09 to ensure that techniques
for installing and implementing the SM/ST sensors are well vetted with the appropriate members of the scientific community. The workshop will bring in all interested players as well as information users to produce an inventory of available soil moisture and temperature observations and soil model output, and to begin addressing integration of these resources. While this is not a specific product to be developed by the USCRN group, it is an activity that is recommended for NIDIS to take in the near future. Beginning in FY 2008, the first NIDIS funding for purchasing soil moisture and temperature and relative humidity sensors was received. The current plans call for these sensors to be installed at 60 USCRN sites by the end of FY 2009.
5.4 New-Generation Sensor Testing and TestbedsThe USCRN program is also evaluating a new precipitation gauge as a possible future replacement for the Geonor precipitation gauge. This will be a multi-year comparison test. In order to maintain site climate integrity, the USCRN testbed site in Sterling, VA was closed during calendar year 2008 because Dulles Airport is expanding into that general NOAA testing area. As a result, the USCRN testbed is being relocated to the National Center for Atmospheric Research’s (NCAR) Marshall test facility in Boulder, CO. The performance of precipitation measurement systems during high wind/snow conditions will be the primary focus in this location. Below is the layout of the testbed at NCAR’s Marshall Facility.
The testbed includes the deployment of duplicate measurement configurations for a few new precipitation gauges and the higher capacity Geonor precipitation gauge. These configurations are being tested to support USCRN, USCRN in Alaska, and the NWS’ HCN-M program. Two new candidate gauges are the Vaisala VRG101 and the Belfort AWPAG 1000. The Belfort gauge has a triple configuration for the transducers. The GEONOR/TB3 with the SDFIR will be used as the baseline for all precipitation events and transfer functions will be developed for the candidate gauges.
Snow depth sensors are being installed in support of the HCN-M program. The system was designed in collaboration with both Environment Canada and Snow Sensor Study participants during the summer 2006 season, and included three Campbell Scientific SR-50® sensors oriented 120° from one another and a temperature probe centered in the plot. A study will address signal processing, snowfall algorithm development, and optimal installation
Previous studies have shown that ultrasonic technology shows excellent potential for measuring snow. Snowfall, the accumulation of new snow in a specified amount of time,
10
can then be estimated from changes in the observed total depth of snow on the ground. This effort will evaluate the operational readiness of the Campbell Scientific SR-50 as a potential tool for automation of U.S. snow measurement. This instrument was initially developed by Environment Canada for automating snow observations at remote, unmanned locations. It was selected due to its modest cost, “off-the-shelf” availability, ease of use and maintenance, reliable performance over a wide range of environmental conditions, and customer support. The SR-50 also provides the high resolution output required to estimate snowfall from continuous observations of total depth of snow on the ground in combination with accurate precipitation gauge measurements.
5.5 International Deployment by WMO for TestingDuring 2007, the present-generation USCRN all-weather precipitation gauge (Geonor) was selected as the control precipitation gauge for the new WMO Precipitation Intensity Test Site. This gauge was deployed by the WMO to Northern Italy in 2007. The selection of the USCRN primary precipitation gauge as the primary WMO Control Gauge was based upon the field performance
and evolution of the USCRN gauge since it was first deployed in the USCRN in 2000. The main objective of the field intercomparison is to test the performance of rainfall intensity (RI) measuring instruments, especially in high RI conditions.
The objective of the data analysis is to provide guidance on improving the homogeneity of long-term rainfall records, with special consideration given to high RI. Other objectives are to: (1) offer advice regarding the determination of RI uncertainty, as well as for improving RI rain gauges measurement accuracy; (2) provide guidance to aid in further improvements in the area of intercomparisons; (3) draft recommendations for consideration by the WMO’s Commission for Instruments and Methods of Observation (CIMO); and (4) compare RI measurements under field conditions of non-catching type rain sensors with respect to catching type rain gauges.
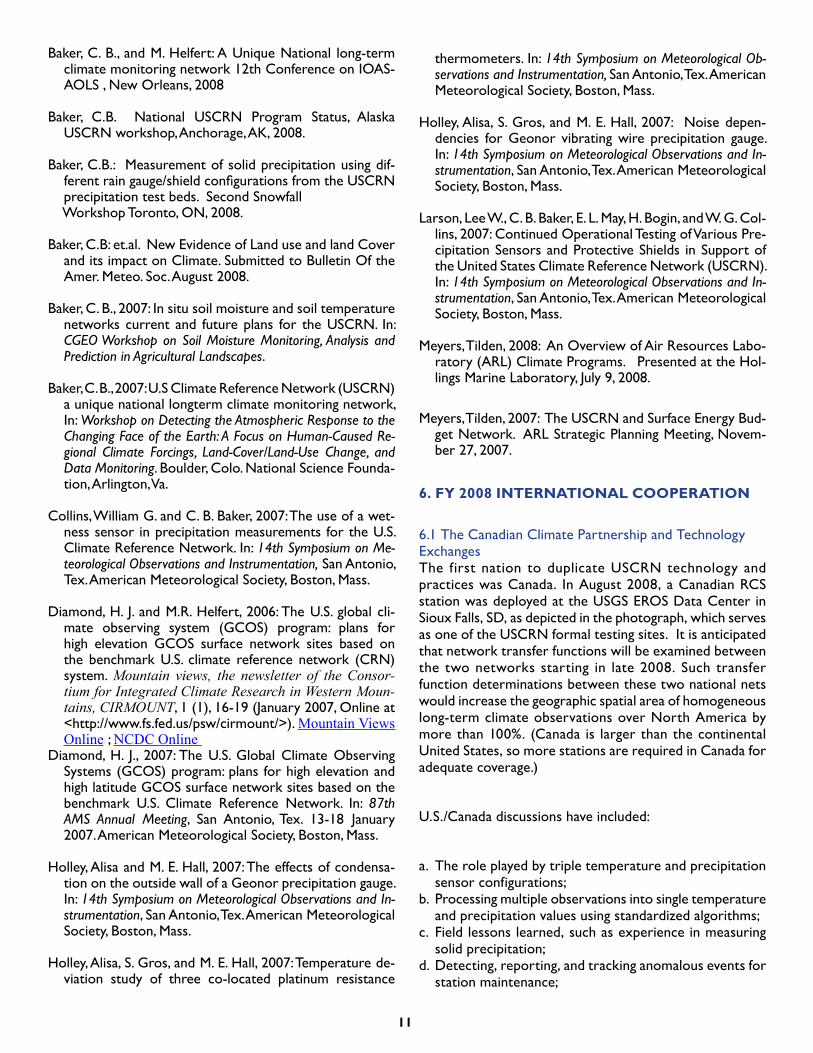
A key finding thus far has been the determination of the undercatch from the Geonor gauges for wind speeds greater than 6 m/sec for shielded versus unshielded gauges. As demonstrated in the figure below, the ratio of catch between a Geonor gauge with no shielding (RIout) versus that of a Geonor
gauge in a pit (RIpit) that is shielded from the wind is documented on the Y-axis and represented by the orange squares. It turns out that the undercatch during high winds can be as much as 20%.
5.6 Research Papers and Abstracts in FY 2008Baker, C.B., and D. R. Easterling: Development and Mod-
ernization of NOAA’s U.S. Climate Observing Network 17th Conference on Applied Climatology, Whistler, BC, 2008.
11
Baker, C. B., and M. Helfert: A Unique National long-term climate monitoring network 12th Conference on IOAS-AOLS , New Orleans, 2008
Baker, C.B. National USCRN Program Status, Alaska USCRN workshop, Anchorage, AK, 2008.
Baker, C.B.: Measurement of solid precipitation using dif-ferentraingauge/shieldconfigurationsfromtheUSCRNprecipitation test beds. Second Snowfall
Workshop Toronto, ON, 2008.
Baker, C.B: et.al. New Evidence of Land use and land Cover and its impact on Climate. Submitted to Bulletin Of the Amer. Meteo. Soc. August 2008.
Baker, C. B., 2007: In situ soil moisture and soil temperature networks current and future plans for the USCRN. In: CGEO Workshop on Soil Moisture Monitoring, Analysis and Prediction in Agricultural Landscapes.
Baker, C. B., 2007: U.S Climate Reference Network (USCRN) a unique national longterm climate monitoring network, In: Workshop on Detecting the Atmospheric Response to the Changing Face of the Earth: A Focus on Human-Caused Re-gional Climate Forcings, Land-Cover/Land-Use Change, and Data Monitoring. Boulder, Colo. National Science Founda-tion, Arlington, Va.
Collins, William G. and C. B. Baker, 2007: The use of a wet-ness sensor in precipitation measurements for the U.S. Climate Reference Network. In: 14th Symposium on Me-teorological Observations and Instrumentation, San Antonio, Tex. American Meteorological Society, Boston, Mass.
Diamond, H. J. and M.R. Helfert, 2006: The U.S. global cli-mate observing system (GCOS) program: plans for high elevation GCOS surface network sites based on the benchmark U.S. climate reference network (CRN) system. Mountain views, the newsletter of the Consor-tium for Integrated Climate Research in Western Moun-tains, CIRMOUNT, 1 (1), 16-19 (January 2007, Online at <http://www.fs.fed.us/psw/cirmount/>). Mountain Views Online ; NCDC Online
Diamond, H. J., 2007: The U.S. Global Climate Observing Systems (GCOS) program: plans for high elevation and high latitude GCOS surface network sites based on the benchmark U.S. Climate Reference Network. In: 87th AMS Annual Meeting, San Antonio, Tex. 13-18 January 2007. American Meteorological Society, Boston, Mass.
Holley, Alisa and M. E. Hall, 2007: The effects of condensa-tion on the outside wall of a Geonor precipitation gauge. In: 14th Symposium on Meteorological Observations and In-strumentation, San Antonio, Tex. American Meteorological Society, Boston, Mass.
Holley, Alisa, S. Gros, and M. E. Hall, 2007: Temperature de-viation study of three co-located platinum resistance
thermometers. In: 14th Symposium on Meteorological Ob-servations and Instrumentation, San Antonio, Tex. American Meteorological Society, Boston, Mass.
Holley, Alisa, S. Gros, and M. E. Hall, 2007: Noise depen-dencies for Geonor vibrating wire precipitation gauge. In: 14th Symposium on Meteorological Observations and In-strumentation, San Antonio, Tex. American Meteorological Society, Boston, Mass.
Larson, Lee W., C. B. Baker, E. L. May, H. Bogin, and W. G. Col-lins, 2007: Continued Operational Testing of Various Pre-cipitation Sensors and Protective Shields in Support of the United States Climate Reference Network (USCRN). In: 14th Symposium on Meteorological Observations and In-strumentation, San Antonio, Tex. American Meteorological Society, Boston, Mass.
Meyers, Tilden, 2008: An Overview of Air Resources Labo-ratory (ARL) Climate Programs. Presented at the Hol-lings Marine Laboratory, July 9, 2008.
Meyers, Tilden, 2007: The USCRN and Surface Energy Bud-get Network. ARL Strategic Planning Meeting, Novem-ber 27, 2007.
6. fY 2008 INTERNATIONAL COOPERATION
6.1 The Canadian Climate Partnership and Technology ExchangesThe first nation to duplicate USCRN technology and practices was Canada. In August 2008, a Canadian RCS station was deployed at the USGS EROS Data Center in Sioux Falls, SD, as depicted in the photograph, which serves as one of the USCRN formal testing sites. It is anticipated that network transfer functions will be examined between the two networks starting in late 2008. Such transfer function determinations between these two national nets would increase the geographic spatial area of homogeneous long-term climate observations over North America by more than 100%. (Canada is larger than the continental United States, so more stations are required in Canada for adequate coverage.)
U.S./Canada discussions have included:
The role played by triple temperature and precipitation a. sensor configurations; Processing multiple observations into single temperature b. and precipitation values using standardized algorithms;Field lessons learned, such as experience in measuring c. solid precipitation;Detecting, reporting, and tracking anomalous events for d. station maintenance;

12
Installation, maintenance, and inspection protocols;e. Using the Internet to disseminate data and documenta-f. tion; andQuality control procedures.g.
Currently, the Canadian RCS has deployed the triple configuration at ~102 sites and is in the beginning stages of implementing the USCRN precipitation algorithm.
6.2 THE GLOBAL CLIMATE OBSERvING SYSTEM PROGRAM (GCOS) AND THE uSCRN
In addition to United States–Canada activities, USCRN stations have been selected for deployment in various environments on other continents where assistance in modernization is desired. Towards this end, two USCRN-technology stations outside the CONUS were conf igured to be GCOS-USCRN test stations (high-elevation and high precipitation environment stations). These two stat ions were deployed to two extreme Hawaiian environments as prototypes for possible future deployments in the Andes and in high-precipitation environments. Planning has continued on fielding a USCRN station configuration at the Russian Arctic climate station in Tiksi as part of the overall U.S./Russia climate bilateral agreement; currently, installation in Tiksi is planned for the August/September 2009 timeframe.
In 2008, NCDC entered into a formal Memorandum of Understanding (MOU) with the Smithsonian Tropical Research Institute which, based on available funding, would allow the two agencies to collaborate in installing and maintaining up to 20 sites at STRI tropical research areas around the globe (see figure below) over the next 10 years. At a minimum, the USCRN program is investigating some preliminary site survey work for a possible initial installation of a USCRN station at the STRI site at the Luquillo Experimental Forest station in Puerto Rico.
7. uSCRN STATION DATA
Historical meteorological and climatological observations are often compromised
by non-standard equipment, incomplete records, poor sensor exposure or poor siting, observer discontinuities, and other related issues. The impact of these issues concerning historical data provenance, continuity, and general quality becomes more serious over time. Tremendous strides have been made in improving the utility of these historical data through the development of sophisticated statistical approaches for the homogenization of time series. However, a far better pathway for detecting future climate change is the establishment of an observation network that avoids these pitfalls through its design and maintenance.
These issues have been addressed in the design and fielding of the USCRN, and the foundation has been established towards generating high-confidence climate attributions from this network. With completion of the deployment
Network of 20 STRI Global Observation Sites

13
phase and the collection of more than 8 years of data at some stations, we are reaching the point of being able to derive meaningful climate insights from this network. While a ten-year period-of-record is recommended for conservative applications of USCRN to the study of climate change at the national level, efforts will be made in FY 2009 to begin to link these new and relatively brief records to longstanding homogenized climate records for purposes of climate monitoring. USCRN stations are already serving as robust and stable platforms for monitoring extreme events. The inclusion of battery backup and in some cases solar panels has enabled USCRN stations to continue operating during severe weather conditions
7.1 Operations and Monitoring During an Active Hur-ricane SeasonThe 2008 North Atlantic hurricane season was a good test of the durability of the USCRN network and its ability to operate under extreme weather conditions. Five named storms made landfall along the Gulf Coast and one raked the Carolina coast between late July and the middle of September. The most wide-reaching and destructive were Tropical Storm Fay and Hurricanes Gustav and Ike. USCRN stations in the path of these storms continued to collect observations during and after the storm while stations in other networks were disabled by high winds and power outages. In so doing, the USCRN network
provides a complete and high quality record of storm total and high intensity rainfall.
Tropical Storm Fay tracked slowly from west to east across central Florida before turning west on a path that dumped heavy rains from central and northern Florida to southern Georgia and Alabama. The remnants of Fay eventually moved northeast from Mississippi to the mid-Atlantic, bringing moderate to heavy rainfall along and east of the Appalachians. The map below shows the track and storm total rainfall amounts, along with the maximum amount that fell within a 5-minute period during the event. The maximum 5-minute totals (e.g., 0.51 inches in southwestern Georgia and 0.48 inches in southern Florida) were less than 2-year return period totals. This was indicative of an event that did not bring torrential downpours, but rather an extended period of moderate and heavy rainfall leading to very high total accumulations.
Hurricane Gustav made landfall as a Category 2 hurricane along the southeastern Louisiana coast on 1 September, bringing heavy rain and high winds from Louisiana to southern Missouri before its remnants continued northward into Michigan and eventually Canada. Totals of 9 to almost 12 inches fell in southern and northern Louisiana with a 5-minute rainfall maximum of almost 0.4 inches of rain falling along the track of the hurricane in southern Louisiana. While stations in other networks Rainfall from Tropical Storm fay
at CRN Station
Rainfall from Hurricane Gustavat CRN Stations
14
were knocked out by the storm, the sturdy design of the USCRN stations and battery backup ensured these stations continued to operate before, during, and after the passage of this Category 2 hurricane.
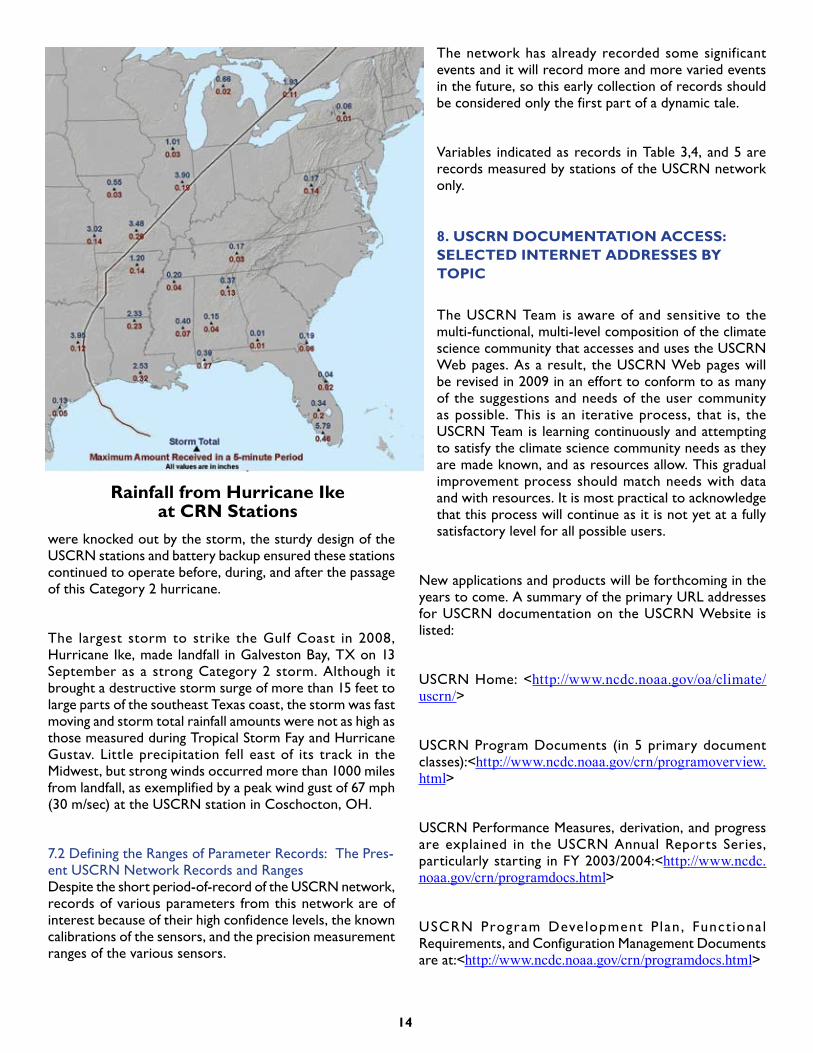
The largest storm to strike the Gulf Coast in 2008, Hurricane Ike, made landfall in Galveston Bay, TX on 13 September as a strong Category 2 storm. Although it brought a destructive storm surge of more than 15 feet to large parts of the southeast Texas coast, the storm was fast moving and storm total rainfall amounts were not as high as those measured during Tropical Storm Fay and Hurricane Gustav. Little precipitation fell east of its track in the Midwest, but strong winds occurred more than 1000 miles from landfall, as exemplified by a peak wind gust of 67 mph (30 m/sec) at the USCRN station in Coschocton, OH.
7.2 Defining the Ranges of Parameter Records: The Pres-ent USCRN Network Records and RangesDespite the short period-of-record of the USCRN network, records of various parameters from this network are of interest because of their high confidence levels, the known calibrations of the sensors, and the precision measurement ranges of the various sensors.
The network has already recorded some significant events and it will record more and more varied events in the future, so this early collection of records should be considered only the first part of a dynamic tale.
Variables indicated as records in Table 3,4, and 5 are records measured by stations of the USCRN network only.
8. uSCRN DOCuMENTATION ACCESS: SELECTED INTERNET ADDRESSES BY TOPIC
The USCRN Team is aware of and sensitive to the multi-functional, multi-level composition of the climate science community that accesses and uses the USCRN Web pages. As a result, the USCRN Web pages will be revised in 2009 in an effort to conform to as many of the suggestions and needs of the user community as possible. This is an iterative process, that is, the USCRN Team is learning continuously and attempting to satisfy the climate science community needs as they are made known, and as resources allow. This gradual improvement process should match needs with data and with resources. It is most practical to acknowledge that this process will continue as it is not yet at a fully satisfactory level for all possible users.
New applications and products will be forthcoming in the years to come. A summary of the primary URL addresses for USCRN documentation on the USCRN Website is listed:
USCRN Home: <http://www.ncdc.noaa.gov/oa/climate/uscrn/>
USCRN Program Documents (in 5 primary document classes):<http://www.ncdc.noaa.gov/crn/programoverview.html>
USCRN Performance Measures, derivation, and progress are explained in the USCRN Annual Reports Series, particularly starting in FY 2003/2004:<http://www.ncdc.noaa.gov/crn/programdocs.html>
USCRN Program Development Plan , Funct ional Requirements, and Configuration Management Documents are at:<http://www.ncdc.noaa.gov/crn/programdocs.html>
Rainfall from Hurricane Ikeat CRN Stations

15
USCRN annual reports can be found at:<http://www.ncdc.noaa.gov/crn/programdocs.html>
USCRN Site Informat ion Handbook and Stat ion Commissioning Plan are at:<http://www.ncdc.noaa.gov/crn/programdocs.html>
USCRN Field Maintenance Plan (also in the Configuration Management Series):<http://www.ncdc.noaa.gov/crn/programdocs.html>
CRN detailed documentation on metadata, data processing, instrument monitoring, data documentation, and station installation/maintenance can also be found at <http://www.ncdc.noaa.gov/crn/docs.html>.
The USCRN site data website is under constant revision with new additions as new sites are added and as new metadata is received and posted. The USCRN active maintenance page, which is referenced at this site, has restricted access as some information in that area involves active maintenance, housekeeping, and monitoring. Information on the other areas is, however, available here <http://www.ncdc.noaa.gov/crn/sites.html>.
Detailed data and documentation about USCRN site hardware,
s e n s o r s , a n d calibration hardware can be found at <http://www.ncdc.n o a a . g o v / c r n /instrdoc>.
T h e U S C R N science pages were n o t v i g o r o u s l y developed during the Deployment Phase o f t he U SCRN . As the period-of-record of stations is now approaching scientifically useful lengths, this page is
of a priority for community inputs and exchanges as well as for internal exchanges and postings. The information is available at <http://www.ncdc.noaa.gov/crn/instrdoc>.
Table 3. uSCRN Temperature records (°f)
Table 4. uSCRN Maximum and Minimum Temperature Durations (Days)
Note: The Quinault 2007 water year record is 52.10” greater than the 37-year mean water year total of 132.69” from the Ranger Station site one mile to the SSW. The greatest water year record total for the Quinault area is 186.22” set during the 1972 water year (Oct 1, 1971 – September 30, 1972).
Table 5. uSCRN Precipitation records (inches) (November 2000 - September 2008)
16
The most direct way to access the data from the USCRN stations is to go directly to <http://www.ncdc.noaa.gov/crn/hourly>.
USCRN data and their metadata are also available from a number of sources:
All elements and metadata:
NCDC Customer Services (NCDC.Orders@
noaa.gov>)
USCRN Monitoring website <http://www.
ncdc.
noaa.gov/oa/climate/uscrn/>
Hourly temperature, precipitation, solar radiation,
surface temperature:
USCRN ftp site (historical and near-real
time)
<ftp://ftp.ncdc.noaa.gov/pub/data/uscrn/
products/hourly01>
9. fY 2000-2008 SuMMARY
The USCRN has achieved or exceeded the initial goals and performance measures that were developed at the program’s inception. The FY 2006 budget hiatus is viewed as an anomaly. Although the FY 2006 budget situation resulted in a deployment phase that stretched into FY 2008, the integrity of the USCRN network and of its data remains at the highest level of any atmospheric monitoring network in the Nation.
Stations have been established on schedule and maintained with reliability. The USCRN is already starting to provide the United States with a first-class climate and environmental monitoring network that meets national needs as well as international commitments to monitor and document climate change.
Local Climatological Data (LCD) reports are baseline climatological reports used for the past century. As of September 2006, LCD reports have been released for USCRN stations. This LCD report series further enhances the usefulness and transferability of USCRN data to other networks. The USCRN fills an important land-based gap in U.S. climate data. These data are needed as part of a larger and more comprehensive Earth observation system being developed by more than 34 countries.
10. fY 2009 PLANNED ACTIvITIES AND GOALS
Research and engineering development activities envisioned for FY 2009 focus and resources include:
Transfer Function determinations for other networks. a. The first priority will be to complete the determina-tion of transfer functions between the USCRN and NOAA’s Cooperative Network. Other networks being considered for transfer function determinations in the future include ASOS, HCN-M, and insofar as possible, such non-NOAA networks including the Bureau of Land Management-Forest Service RAWS, the USDA National Resources Conservation Service (NRCS) SCAN, the USDA/NRCS Snowpack Telemetry (SNOTEL) System, and selected state mesonets.Derivation of pseudo-normals once transfer functions b. are established. This is being approached with great care and critical review through the first releases of USCRN LCDs, noted above. Development of long time series for each USCRN site c. based on the pseudo-normals techniques. This will facili-tate the use of USCRN data in climate monitoring and research and will eventually lead to replacing the existing 75 GCOS Surface Network (GSN) sites in the U.S. with USCRN stations.Exercising the capability and fitness of combinations of d. USCRN sensors by providing ground truth points for NOAA, National Aeronautics and Space Administration (NASA), and European Union satellite systems.Testing of the selected relative humidity and soil mois-e. ture/soil temperature sensor arrays for installation at all USCRN stations. As with the now-completed deploy-ment of wetness sensors to all USCRN field stations in FY 2005 and FY 2006 (an activity completed in FY 2006) and now pro forma for all new USCRN deploys, this test-ing will proceed apace starting during FY 2009.Testing of Iridium or similar communications for harsh f. environments and two-way communication capabilities. The lessons of Hurricane Katrina (August 2005) strongly indicate that a two-way capability is essential for station tending when extreme weather events are present.Deeper study of Health of the Network and Data Ingest g. Percentages in order to identify seasonal biases, com-ponent failure patterns (Mean Time Between Failures [MTBF] statistics), and identify stations that lag in their performance and/or precision of measurement.Coordinate with Canada on the development of transfer h. functions and future common LCD product generation between the Canadian RCS and the USCRN for snow depth measurements.Develop international ties on global standards and i. commonalities in the climate-quality measurement of precipitation and temperature throughout the WMO community.
17
ACRONYMS AND ABBREvIATIONS
AMV Annual Maintenance VisitASOS Automated Surface Observing SystemATDD Atmospheric Turbulence and Diffusion Division°C Degree CelsiusCCSP Climate Change Science ProgramCIMO Commission for Instruments an Methods of ObservationCM Configuration ManagementCONUS Continental United StatesCOOP Cooperative ObservationCPC Climate Prediction CenterDA Double AlterDCS Data Collection SystemDFIR Double Fence Intercomparison ReferenceEROS Earth Resources Observation Systems°F Degree FahrenheitGCOS Global Climate Observing SystemGEO Group on Earth Observations GEOSS Global Earth Observation System of SystemsGOES Geostationary Operational Environmental SatelliteHCN-M Historical Climatology Network ModernizationIPCC Intergovernmental Panel on Climate ChangeLCD Local Climatological DataLDAS Land Data Assimilation SystemMOU Memorandum of UnderstandingMTBF Mean Time Between FailuresNAS National Academy of SciencesNASA National Aeronautics and Space AdministrationNCDC National Climatic Data CenterNIDIS National Integrated Drought Information SystemNOAA National Oceanic and Atmospheric AdministrationNRC National Research CouncilNRCS National Resources Conservation ServiceNWS National Weather ServicePDA Personal Digital AssistantPM Performance MeasureRAWS Remote Automated Weather StationRCS Canadian Reference Climate System RH Relative Humidity
RI Rainfall IntensitySCAN USDA/NRCS Soil Climate Analysis Network SDFIR Small Double Fence Intercomparison ReferenceSNOTEL USDA/NRCS Snowpack Telemetry SystemSM Soil MoistureST Soil TemperatureSTRI Smithsonian Tropical Research InstituteSURFRAD NOAA Surface Radiation Budget NetworkTB Tipping BucketUSCRN United States Climate Reference NetworkUSDA U.S. Department of AgricultureUSDP U.S. Drought PortalUSGS U.S. Geological SurveyWCDMP World Climate Data and Monitoring ProgramWMO World Meteorological Organization

18
19
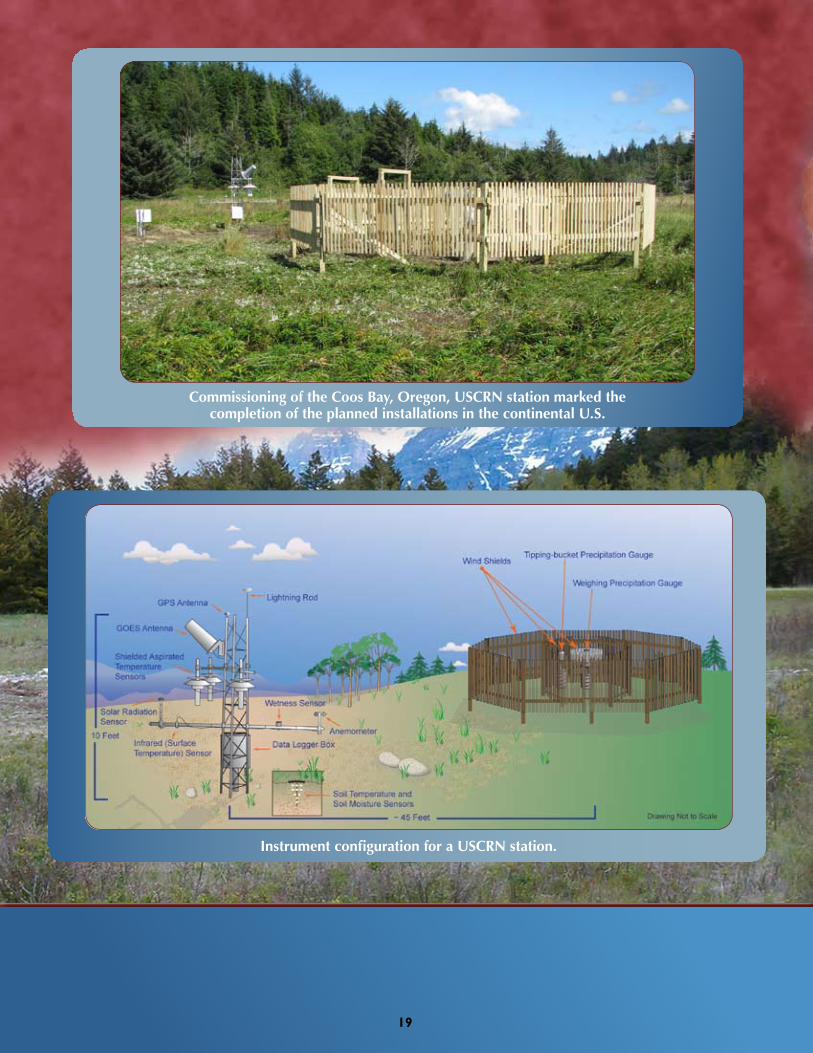
Instrument configuration for a USCRN station.
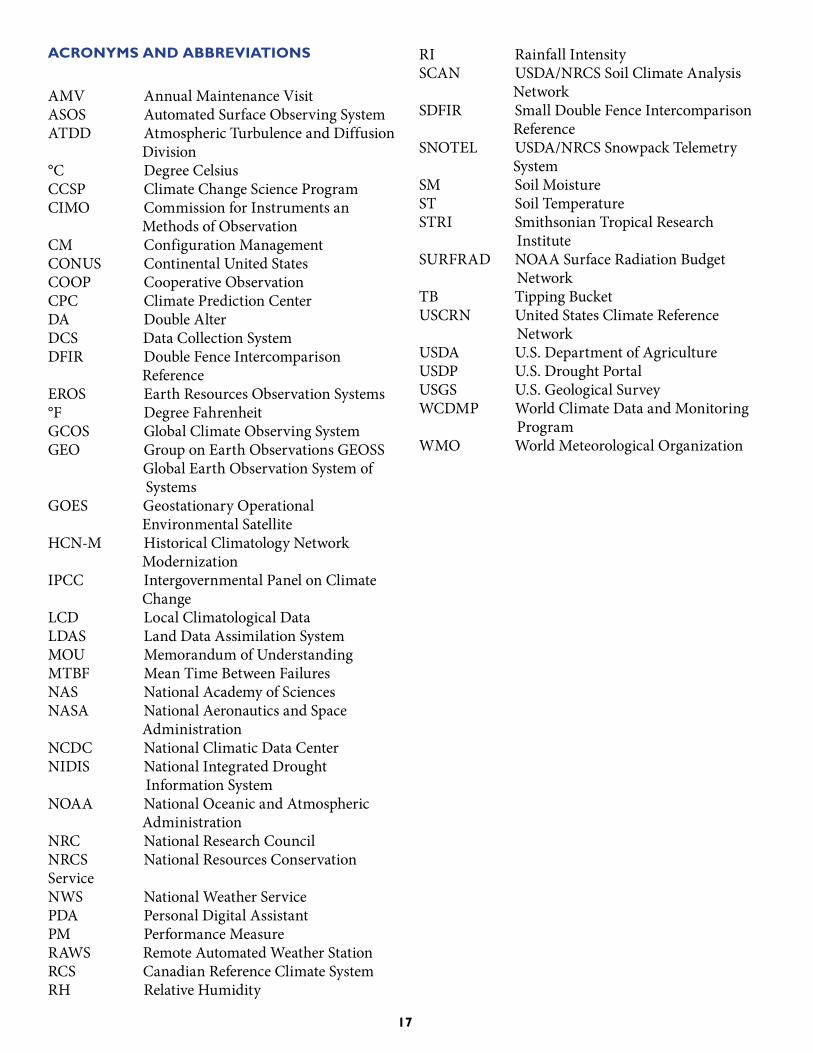
Commissioning of the Coos Bay, Oregon, USCRN station marked the completion of the planned installations in the continental U.S.