the us tight oil revolution in a global perspective · 2013, output reaching 10.65 million b/d in...
TRANSCRIPT

September 2013
OXFORD ENERGY COMMENT Bassam Fattouh and Amrita Sen
The US Tight Oil Revolution in a Global Perspective

September 2013: The US Tight Oil Revolution in a Global Perspective
2
1. Introduction
The US tight oil revolution has been touted by many analysts as a game changer with potential wide
and lasting implications on global oil market dynamics. Indeed, the size of the US supply shock has
been nothing short of phenomenal, with both 2011 and 2012 seeing one million b/d of year-on-year
growth in total liquids production with a similar growth expected for this year – a feat previously
achieved in the 2000s by the former Soviet Union (FSU). But the US tight oil revolution has not just
been a significant positive shock, it was the main contributing factor to the shift in market sentiment
towards a resource abundance mindset – compared to one of scarcity just a few years before. In a
recent article, Paul Stevens warns that ‘the world might be drifting into an oil price shock’, describing
the current situation as ‘very reminiscent of the period 1981–86 which culminated in the dramatic 1986
oil price collapse’.1 In its ‘Energy Outlook 2030’, BP argues that in the face of rising unconventional oil
from North America:
OPEC members will cut production over the current decade; spare capacity exceeds 6 Mb/d
by 2015, the highest since the late 1980s [and faced with this challenge] OPEC cohesion is a
key oil market uncertainty, especially in the current decade.2
Citi considers:
the growing continental surplus of hydrocarbons points to North America effectively
becoming the new Middle East by the next decade3
while the IEA claims that:
the supply shock created by a surge in North American oil production will be as
transformative to the market over the next five years as was the rise of Chinese demand over
the last 15.4
Some predict that the ripple effects of the North American revolution may even transform the
geopolitical landscape of energy with:
some producer countries … those suffering most acutely from the resource curse may see
their leadership come under heightened pressure for economic and political reform, as
revenues gradually diminish, raising the risk of creating new failed states in the process [and
as a result] importing countries may seek new terms of engagement with new suppliers, re-
drawing the map of the international system in the process. 5
Historically, the industry has had a very poor record in predicting oil prices and fundamental shifts in
the market and this time is no different. Not only did most industry and oil market analysts fail to predict
the scale of the tight oil revolution in the first place, but now that the pendulum has swung in the
1 Paul Stevens, ‘The world might be drifting into an oil price shock’, Financial Times, 25 July 2013.
2 BP, ‘Energy Outlook 2030’, January 2013.
3 Edward L. Morse, ‘Energy 2020: North America, the New Middle East?’, Citi GPS: Global Perspectives & Solutions, March
2012.
4 IEA, ‘Medium-Term Oil Market Report (MTOMR)’, May 2013.
5 ‘Energy 2020: Independence Day’, Citi GPS: Global Perspectives & Solutions, February 2013.

The contents of this paper are the author’s sole responsibility. They do not necessarily represent the views of the
Oxford Institute for Energy Studies or any of its Members.
3
opposite direction, expectations regarding the impact of the tight oil revolution on global supply
dynamics and international prices appear overhyped. However, contrary to the general view in the
market that the abundance of tight oil would create a supply glut in crude or refined products and
cause a sharp drop in oil prices, neither has really materialized. Many of the predictions concerning the
impact of US tight oil on market dynamics have, so far, proved to be off the mark. While the tight oil
revolution had a localized impact on US crude prices over the last two years – as seen in the
temporary dislocation of WTI and the huge discounts of regional grades – this has not sent
shockwaves into international prices or retail prices and is currently being reversed. In the last three
years, the quarterly average Brent price has exceeded the $100 per barrel mark for 11 successive
quarters, with prices currently trading above $110 (see Figure 1); the price of gasoline at pumps in the
USA has stayed around $3.5 per gallon throughout the year (not far from the high levels of 2008 – see
Figure 2); OPEC production is at a record level of above 30 million b/d; and spare capacity has fallen
recently to just around 1.5 per cent of global oil demand (levels last seen in 2008). This raises a key
question: how can the oil market be undergoing a revolution without this revolution being felt on global
oil prices and global oil supplies?
Fig. 1: Quarterly Brent prices, $/barrel Fig. 2: US retail gasoline prices, $/gallon
Source: Bloomberg, Energy Aspects Source: EIA, Energy Aspects
0
20
40
60
80
100
120
140
Q1 11 Q3 11 Q1 12 Q3 12 Q1 13 Q3 13
1.5
2.0
2.5
3.0
3.5
4.0
4.5
Jan Mar May Jul Sep Nov
2013 2012 2011
2010 2009 2008
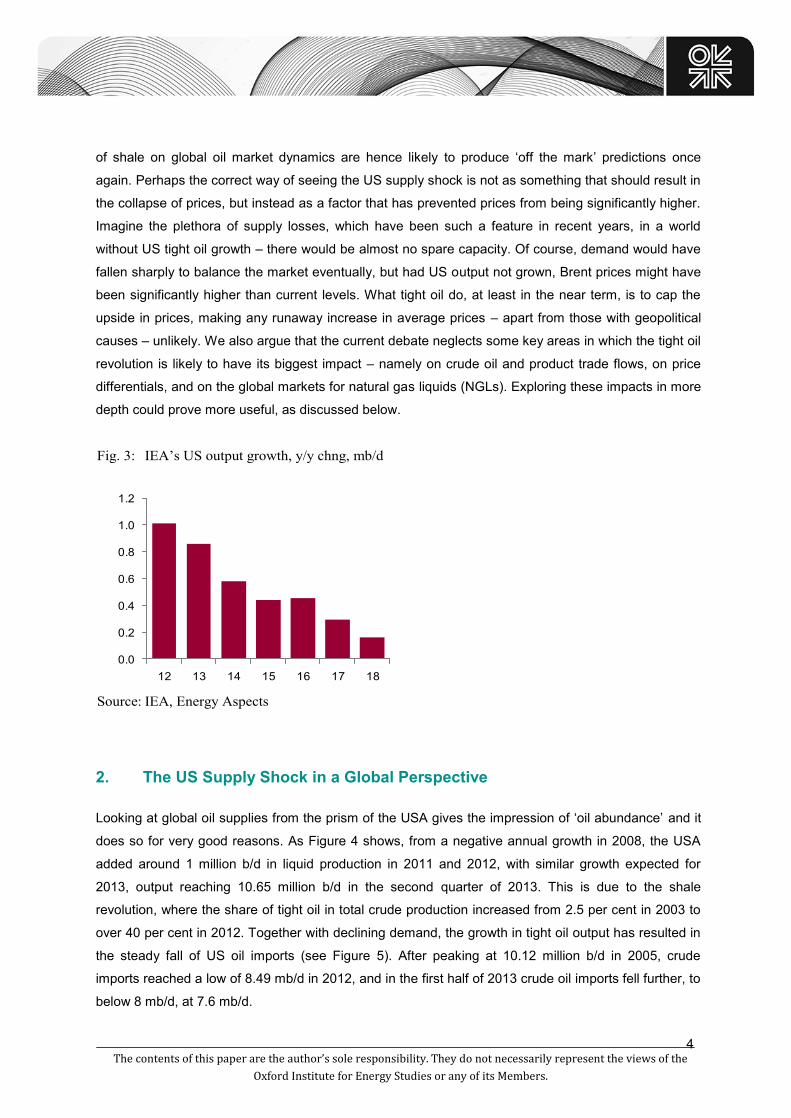
One may argue that the impact of shale oil on prices and on oil market dynamics is yet to be felt, as
some of the underlying forces still need time to unfold. However, we find such an argument
unconvincing. Even by the most optimistic accounts, the year-on-year growth in US oil shale is likely to
reach its peak this year, with growth expected to slow down in the next few years (see Figure 3). If,
during the last three years, the large positive US supply shock failed to cause sharp price falls, why
would a rise in US supply now bring about falling prices over the next few years? To understand this
scenario, it is important to set out clearly under what conditions oil prices are likely to ‘collapse’ and to
show how important the growth of US shale oil is to this story.
In this paper, we argue that there are some fundamental weaknesses and flaws in the analysis
underlying the ‘oil price-collapsing’ scenario and ‘hyped expectations’; current projections of the impact
The contents of this paper are the author’s sole responsibility. They do not necessarily represent the views of the
Oxford Institute for Energy Studies or any of its Members.
4
of shale on global oil market dynamics are hence likely to produce ‘off the mark’ predictions once
again. Perhaps the correct way of seeing the US supply shock is not as something that should result in
the collapse of prices, but instead as a factor that has prevented prices from being significantly higher.
Imagine the plethora of supply losses, which have been such a feature in recent years, in a world
without US tight oil growth – there would be almost no spare capacity. Of course, demand would have
fallen sharply to balance the market eventually, but had US output not grown, Brent prices might have
been significantly higher than current levels. What tight oil do, at least in the near term, is to cap the
upside in prices, making any runaway increase in average prices – apart from those with geopolitical
causes – unlikely. We also argue that the current debate neglects some key areas in which the tight oil
revolution is likely to have its biggest impact – namely on crude oil and product trade flows, on price
differentials, and on the global markets for natural gas liquids (NGLs). Exploring these impacts in more
depth could prove more useful, as discussed below.
Fig. 3: IEA’s US output growth, y/y chng, mb/d
Source: IEA, Energy Aspects
0.0
0.2
0.4
0.6
0.8
1.0
1.2
12 13 14 15 16 17 18
2. The US Supply Shock in a Global Perspective
Looking at global oil supplies from the prism of the USA gives the impression of ‘oil abundance’ and it
does so for very good reasons. As Figure 4 shows, from a negative annual growth in 2008, the USA
added around 1 million b/d in liquid production in 2011 and 2012, with similar growth expected for
2013, output reaching 10.65 million b/d in the second quarter of 2013. This is due to the shale
revolution, where the share of tight oil in total crude production increased from 2.5 per cent in 2003 to
over 40 per cent in 2012. Together with declining demand, the growth in tight oil output has resulted in
the steady fall of US oil imports (see Figure 5). After peaking at 10.12 million b/d in 2005, crude
imports reached a low of 8.49 mb/d in 2012, and in the first half of 2013 crude oil imports fell further, to
below 8 mb/d, at 7.6 mb/d.

The contents of this paper are the author’s sole responsibility. They do not necessarily represent the views of the
Oxford Institute for Energy Studies or any of its Members.
5
Fig. 4: US crude +NGLs output, y/y change, mb/d Fig. 5: US crude oil imports, mb/d
Source: EIA, Energy Aspects Source: EIA, Energy Aspects
(0.4)
0.0
0.4
0.8
1.2
03 05 07 09 11 H1 13
Crude
NGL
7
8
9
10
11
03 04 05 06 07 08 09 10 11 12 13
Despite this robust performance, a US-centric view of oil markets often results in a distorted picture of
the global oil market. There have always been enough moving parts able to offset or reinforce oil
supply shocks in the oil market, and putting the US positive shock in a global perspective makes this
point very clear. In the last three years, US oil supply growth has been offset by losses elsewhere. In
2011, it was almost entirely offset by declines in other non-OPEC countries (see Figure 6), particularly
the North Sea and the FSU, compounded by the loss of significant Libyan barrels for over five months.
Geopolitical and unplanned outages in the Middle East, particularly Iran and then Libya and Iraq,
added to the supply problems (see Figure 7), resulting in large losses from the market for a prolonged
period of time. As a result of these losses, the growth in US tight oil production has not itself been
sufficient to balance the market and OPEC (particularly Saudi Arabia) has had to ramp up production
to fill the gap. Saudi Arabia’s output was at record levels of above 10 million b/d in August 2013, after
having fallen to low levels in December 2012. It is true that some of these moving parts (such as
outages due to geopolitical shocks or accidents) are difficult to predict, but to assign a zero probability
for their occurrence and to assume a smooth supply curve is rather simplistic and unrealistic, given the
eventful history of the oil market.

The contents of this paper are the author’s sole responsibility. They do not necessarily represent the views of the
Oxford Institute for Energy Studies or any of its Members.
6
Fig. 6: Non-OPEC oil production, y/y chng, mb/d Fig. 7: OPEC oil output ex Saudi Arabia, mb/d
Source: EIA, Energy Aspects
Source: Energy Aspects
(0.8)
(0.4)
0.0
0.4
0.8
1.2
1.6
00 02 04 06 08 10 12
RoW US
19.5
20.0
20.5
21.0
21.5
22.0
22.5
04 05 06 07 08 09 10 11 12 13
This suggests that the impact of the US tight oil revolution should not be analysed in isolation, as it is
only one of the many (and not necessarily the most important) factors affecting global price outcomes.
In order to alter supply dynamics in a significant way, either US supply growth would have to
accelerate from current levels while supply shortfalls outside the USA were reversed, or a new source
of supply should emerge such that spare capacity rose to levels that started to affect cohesion within
OPEC. Regarding the first factor, it is important to recognize that the nature of tight oil wells is very
different from conventional ones. For example, the natural decline rate of a tight oil well is high, in most
cases between 50 and 70 per cent per annum, producing a severe fall in output in a field unless further
hydraulic fracturing is carried out and new wells are brought online. In addition, funding the upfront
capital costs to hold acreage, to add infrastructure such as roads and gathering pipeline networks, to
do the science required to delineate sweet spots/completion and to drive growth, together with the high
running costs of hydraulic fracturing processes, make the total variable cost far more expensive. The
US shale industry spends close to $100 billion per annum in funding such activity, which translates into
a hefty break-even price requirement for the industry as a whole. The high costs are also evident in the
soaring debt levels of US independent producers, which have managed to grow production solely by
fuelling debt. Given these characteristics, a key question remains as to whether the momentum in US
tight oil production growth can continue unperturbed, even in an environment of high oil prices.
Regarding the remaining non-OPEC supply: countries that formerly held great promise, such as Brazil,
Kazakhstan, Azerbaijan, and even Canada, have all failed to live up to their initial expectations due to
a combination of high decline rates, high costs, and infrastructural bottlenecks. The prospects of these
countries do not suggest that a dramatic turnaround, capable of creating a supply glut, is likely in the
near future.

The contents of this paper are the author’s sole responsibility. They do not necessarily represent the views of the
Oxford Institute for Energy Studies or any of its Members.
7
This is why Iraq is key to the low oil price story, not only because the expected rapid increase from
Iraqi production would constitute a major source of squeeze for a key producer such as Saudi Arabia,
but also because Iraq is a low-cost producer with massive underground reserves which could therefore
affect cohesion within OPEC. The squeeze from a low-cost producer should be treated differently from
a high-cost one, as the production of a low-cost producer is likely to be less responsive to price
movements and could generate huge rents even in a relatively low-price environment. This is in
contrast to a high-cost producer such as the USA, which has a highly elastic supply curve with supply
being more responsive both to upward or downward price movements. One of the key features of the
1986 oil price crisis, which contributed to the collapse of the oil price as well as the OPEC administered
pricing system, was the sharp increase in non-OPEC supply from multiple sources such as the FSU,
Mexico, and the North Sea, together with the break-up of OPEC cohesion. It is in this context that Iraq
is important. Currently, there is a widespread belief that a large-scale entry by Iraq would affect
cohesion within OPEC (and perhaps even initiate a price war), undermining the ability of the
organization to defend prices when market fundamentals are weak. The competition between Saudi
Arabia and Iraq in setting their official selling prices (OSPs) earlier this year, and the clear signals that
‘Iraq will never cut production’ to abide by quotas are both indications of what might yet be to come.
Another important premise underlying the low oil price scenario is the concept of demand destruction.
Key factors which ‘culminated in the dramatic 1986 oil price collapse’ were the US recession and the
substitution for oil in the power sector, which resulted in a dramatic reduction in oil demand. Between
1979 and 1985, OECD oil demand fell by more than 6.5 million b/d. To recreate a similar story to that
of 1986, it is thus important to have a demand destruction element in the scenario. Therefore, we are
reminded that:
… high prices will also lead to oil demand destruction. In particular the impact will be felt in
the Middle East, India and China 6
It is often argued that these high oil prices are inevitable given the growing needs of oil producers for
higher revenues at times when their output is falling.
While further substitution for oil in the power sector is limited, the shale gas revolution has offered real
opportunities for substitution of gas in the transport sector. For instance, Philip Verleger predicts that:
… the low price of natural gas is going to drive oil from the market. Oil in the US is going to
have a ‘Kodak Moment’7
However, up until now, and despite nearly five years of very low US natural gas prices, there have
been very few signs of widespread substitution from oil to natural gas in the transportation sector. No
doubt companies are spending billions in R&D in attempts take advantage of the wide price differential
6 Paul Steven, ‘The world might be drifting into an oil price shock’, Financial Times, 25 July 2013.
7 Cited in Steve LeVine, ‘A disruption for China, and the rise of small nations’, Foreign Policy, 24 April 2012.

The contents of this paper are the author’s sole responsibility. They do not necessarily represent the views of the
Oxford Institute for Energy Studies or any of its Members.
8
between the two fuels and some companies, such as Fedex, have been switching to natural gas-fired
trucks. But numbers remain extremely small. Equally, it is worth noting that in non-OECD countries like
India and China, natural gas prices remain oil-linked and thus offer little price advantage. For these
countries, environmental reasons have been an important driver for the switch into gas-fired vehicles,
but despite significant volumes of public transport switching to CNG, there has been little dent in oil
demand growth. In other words, large-scale substitution to gas remains unlikely till 2020.
Of course, there are very divergent views about the prospects for US and Iraqi output and the extent of
demand destruction; issues that are beyond the scope of this short note. The key point is that while the
US oil supply shock is a crucial factor affecting global price outcomes, it is by no means the only
determinant. In other words, the idea that one factor in the market could move us to a new price path is
simplistic, even if this factor originates in the USA. For the coming years to be significantly different
from the past three years, and for global oil prices to find a new low norm, there would have to be a
perfect storm of: sustained weak oil demand growth due to a fragile macroeconomic backdrop,
demand destruction, and/or large substitution of gas in the transport sector, a sustained increase in US
production growth, a sharp improvement in non-OPEC supplies outside the USA, a sharp increase in
Iraqi production, and a breakdown in OPEC cohesion. The low-price scenario also implicitly assumes
that some key producers, such as Saudi Arabia, will not behave strategically and alter their investment
and expansion plans amidst a large degree of market and regulatory uncertainty.
To what extent is this perfect storm likely to play out? Given that there are many moving parts in the oil
market, several scenarios can play out, with the ‘1986’ or ‘low oil price’ scenario not being the most
probable one. Market conditions in the last few years indicate that different dynamics operate where
demand growth continues to grow at a steady rate, non-OPEC supply outside the USA continues to
disappoint, key producers persistently suffer from outages and delays, and OPEC cohesion remains
quite strong as most of its members continue to produce close to their maximum capacity. However, in
the unlikely event that the perfect storm does materialize, it would be very difficult, if not almost
impossible, to construct a case that oil prices would still remain buoyant. But if oil prices decline, tight
oil production will be put at risk, given their relatively high cost of production as we discussed above.
But this creates an internal inconsistency in the very argument, put forward by many in the market, that
tight oil growth would lead us to an era of cheap oil, because if prices fell much below $80 on a
sustainable basis, it would not be profitable to produce from these resources. After all, the primary
reason for the growth in tight oil output is that oil prices stayed high and around $100 for a prolonged
period of time.
The contents of this paper are the author’s sole responsibility. They do not necessarily represent the views of the
Oxford Institute for Energy Studies or any of its Members.
9
3. Beyond the US supply shock
It is not that the growth of tight oil has had no impact on either global supplies or the US domestic
crude balance – clearly it has. As discussed above, without the growth of tight oil, the supply–demand
balance of the oil market would be entirely out of whack and oil prices significantly higher. But the US
tight oil revolution should not just be thought of a positive supply shock shifting the supply curve
rightwards, which has been partly offset by supply shocks in other parts of the world. The impact of the
US supply shock goes beyond these direct effects: it has resulted in a shift in perception from scarcity
to abundance, affecting long-term prices and the shape of the forward curve, raising hopes of energy
independence; but more relevant for this short note is that it has changed crude oil and petroleum
product trade flows.
A more apt way of analysing the primary impact of tight oil and their continuing impact on global
markets is through their impact on trade flows, and hence on price differentials – an impact of the tight
oil revolution which has not been analysed in depth so far. The impact on price differentials works
through various channels, both through crude and product flows, and cuts across time spreads, inter-
crude spreads, and inter-grade spreads. Growing domestic production has meant that refineries in the
USA have made changes in order to accommodate the increase and this, together with a drop in
domestic demand, has resulted in the pullback in US crude imports. Not surprisingly, light crudes have
borne the brunt of that adjustment, with producers such as Nigeria (see Figure 8) and Algeria the worst
affected. For instance, without supply outages, Nigeria is finding it increasingly difficult to clear its
programme without discounting its crude significantly. As a result, Nigerian price differentials have
come under pressure, with any strength being largely derived from the plethora of supply outages
rather than an increase in demand. Weakening Nigerian differentials have had a direct impact on the
Brent structure as well, as they can yield the most attractive margins for refineries in the Atlantic basin,
making the refineries switch away from Brent. This, in turn, can pressurize Brent spreads, due to
reduced appetite from European refineries.
This change in the dynamics of trade flows also has implications for inter-crude spreads, particularly
Brent–Dubai differentials. As Figure 9 shows, West African grades are increasingly popular in Asia.
Asian countries usually take their highest volumes of crude from the Middle East, but increasingly
Atlantic Basin crudes are making their way east. As European demand remains weak for the
foreseeable future, this trend of higher flows from West Africa to Asia is likely to persist. This has
implications for Brent–Dubai, as an Asian pull of West African barrels can serve to widen the
differential by lowering demand for Middle East crude at the same time as reducing availability of
African crude in Europe. Of course, stronger Asian demand is unlikely to boost demand for West
African crude entirely at the expense of Middle Eastern grades, but West African grades are
increasingly likely to become the marginal barrel determining the Brent–Dubai spread.

The contents of this paper are the author’s sole responsibility. They do not necessarily represent the views of the
Oxford Institute for Energy Studies or any of its Members.
10
Fig. 8: Nigerian exports to the USA, mb/d Fig. 9: West African exports to Asia, mb/d
Source: EIA, Energy Aspects Source: Energy Aspects
0.2
0.4
0.6
0.8
1.0
1.2
1.4
03 04 05 06 07 08 09 10 11 12 13
0.7
0.9
1.1
1.3
1.5
1.7
1.9
2.1
06 07 08 09 10 11 12 13
The diversion in trade flows has also significant implications for Middle Eastern producers. Since the
decline in the West’s appetite for oil and the burgeoning growth in the East, Middle Eastern producers
have turned towards Asia in order to secure stable long-term importers for their crude. Moreover, the
growing economies of Asia were largely at the mercy of Middle Eastern suppliers through most of the
last decade, given declining regional production and the lack of alternative import outlets. Today,
however, cheaper West African barrels, helped by extremely low freight rates, are proving to be
attractive in Asia at a time when other crude exporters – such as Russia, Mexico, and Venezuela – are
also trying to move away from Western markets and capture the main growth market of Asia. As tight
oil production grows, exporters to the USA – namely Venezuela, Mexico, Nigeria, among others – will
increasingly look East to find buyers for their crude. Once the Panama Canal expands, this trend will
intensify further. Thus, Middle Eastern producers may have to revisit some of their marketing and
pricing strategies with regards to Asia if they want to continue keeping their market share in the region.
Another mechanism through which tight oil have had, and will continue to have, a profound impact is
on light–heavy differentials and on light-ends in general, which in turn have impacted term structures
for the crude curves. This works through two separate avenues. On the one hand, the surge in light
tight oil with a significant percentage consisting of super lights (50 API+) comes at a time when
refineries in the US Gulf Coast and Midwest, together with others around the world, have invested
billions in new upgrading capacity with the expectation that the share of extra-heavy oil will grow,
mostly due to the development of oil sands and extra-heavy oil projects in Canada, Brazil, and
Venezuela. Today, the marginal barrel of crude oil has become extremely light; this has starved the
cokers of heavy crude oil and thereby narrowed light–heavy differentials. This has been evident in
price action this year, with heavier crudes such as Urals and Angolan grades outperforming lighter
grades such as Saharan and Nigerian.
The contents of this paper are the author’s sole responsibility. They do not necessarily represent the views of the
Oxford Institute for Energy Studies or any of its Members.
11
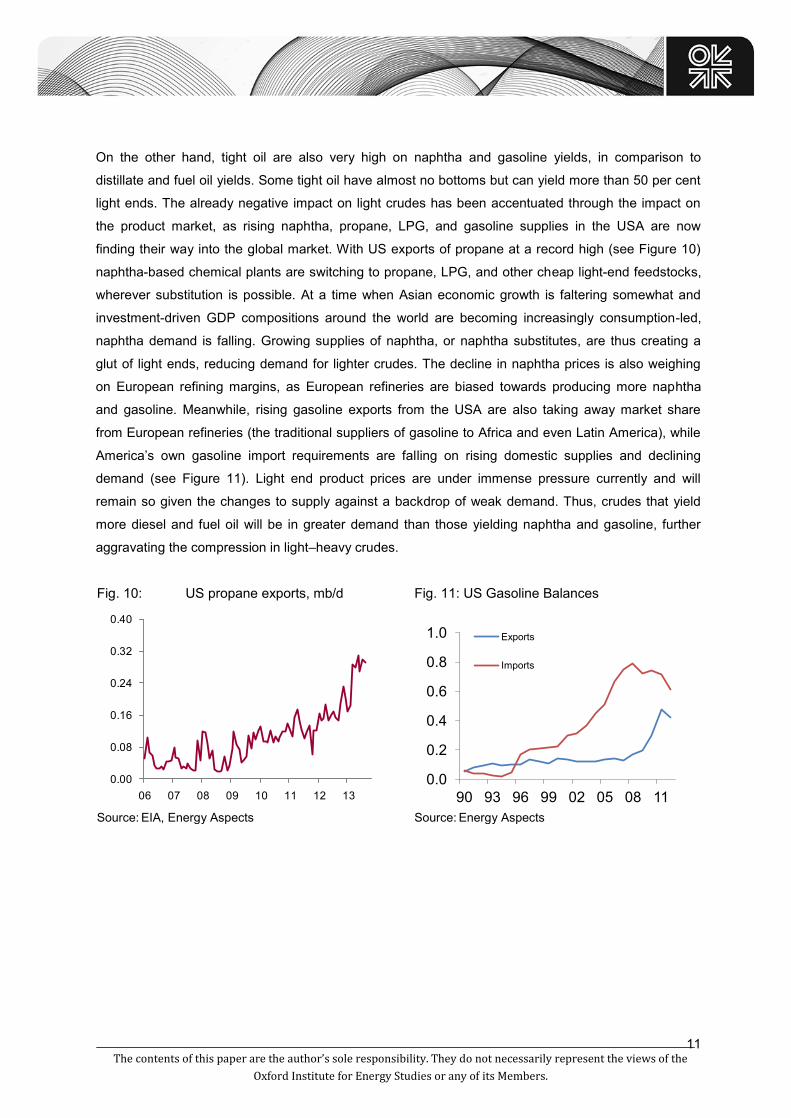
On the other hand, tight oil are also very high on naphtha and gasoline yields, in comparison to
distillate and fuel oil yields. Some tight oil have almost no bottoms but can yield more than 50 per cent
light ends. The already negative impact on light crudes has been accentuated through the impact on
the product market, as rising naphtha, propane, LPG, and gasoline supplies in the USA are now
finding their way into the global market. With US exports of propane at a record high (see Figure 10)
naphtha-based chemical plants are switching to propane, LPG, and other cheap light-end feedstocks,
wherever substitution is possible. At a time when Asian economic growth is faltering somewhat and
investment-driven GDP compositions around the world are becoming increasingly consumption-led,
naphtha demand is falling. Growing supplies of naphtha, or naphtha substitutes, are thus creating a
glut of light ends, reducing demand for lighter crudes. The decline in naphtha prices is also weighing
on European refining margins, as European refineries are biased towards producing more naphtha
and gasoline. Meanwhile, rising gasoline exports from the USA are also taking away market share
from European refineries (the traditional suppliers of gasoline to Africa and even Latin America), while
America’s own gasoline import requirements are falling on rising domestic supplies and declining
demand (see Figure 11). Light end product prices are under immense pressure currently and will
remain so given the changes to supply against a backdrop of weak demand. Thus, crudes that yield
more diesel and fuel oil will be in greater demand than those yielding naphtha and gasoline, further
aggravating the compression in light–heavy crudes.
Fig. 10: US propane exports, mb/d Fig. 11: US Gasoline Balances
Source: EIA, Energy Aspects Source: Energy Aspects
0.00
0.08
0.16
0.24
0.32
0.40
06 07 08 09 10 11 12 13
0.0
0.2
0.4
0.6
0.8
1.0
90 93 96 99 02 05 08 11
Exports
Imports

The contents of this paper are the author’s sole responsibility. They do not necessarily represent the views of the
Oxford Institute for Energy Studies or any of its Members.
12
4. Conclusion
The growth of tight oil in the USA has had a profound impact on oil market dynamics. But contrary to
popular belief, the true impact on the oil market goes beyond the simple shifting of the entire oil supply
curve, which has been the main focus of market observers. As we have argued above, for the US
supply shock to have a big impact on global prices, it has to operate in unison with other factors. And
even in the unlikely event that the perfect storm gathers momentum and oil prices fall, this will then
pose a serious risk for US supplies themselves. In other words, a perfect storm of demand destruction,
abundant supplies, and low prices is inconsistent with a scenario in which US production will continue
to grow at a rapid pace. Beyond these shifts in demand and supply curves, a key impact of the US
tight oil revolution has been on changing the dynamics of trade flows and their impact on various types
of spreads. In this short note, we have highlighted this neglected aspect of the current debate.
Finally, it is worth asking the following question: if this positive supply shock had occurred outside the
USA, would we have seen similar types of predictions and hyped expectations? The answer is perhaps
no. What is special in the USA (in addition to the fact that it is the largest oil importer and consumer), is
that all the debates surrounding oil are entangled with the legacy of energy independence. For
instance, Robin West describes the shale oil revolution as:
the energy equivalent of the Berlin Wall coming down. Just as the trauma of the Cold War
ended in Berlin, so the trauma of the 1973 oil embargo is ending now8
The prospects of oil independence give the debate a whole new flavour, where objective analysis is
mixed with emotions and aspirations, with the ultimate effect that some of the potential impacts of the
shale revolution on global oil markets are amplified while other risks are underestimated, with the risk
that hyped expectations can send the wrong signals, affecting investment decisions and clouding the
judgments of policy makers all over the world.
8 Cited in David Ignatius, ‘An Economic Boom Ahead?’, Washington Post, 4 May 2012.