the use of rtk gps in blast optimization - fig...
TRANSCRIPT

TS 1C – CORS-RTK I Francis Mensah The Use of RTK GPS in Blast Optimization FIG Working Week 2009 Surveyors Key Role in Accelerated Development Eilat, Israel, 3-8 May 2009
1/17
The Use of RTK GPS in Blast Optimization
Francis MENSAH, Ghana
ABSTRACT Planimetric control positioning and detail pickups using the Real Time Kinematics (RTK) Global positioning System (GPS) is emerging as one of the fastest, reliable and more accurate method of surveying in surface mining. This paper seeks to highlight how the RTK GPS from Trimble is being employed at Gold Fields Ghana Limited, Tarkwa Mine to provide accurate drill depth and drill pattern design. The usage, problems, processing and efficiency of this system in a mining environment is also explored. It also looks at the level of accuracies provided by this system. Before the introduction of RTK GPS into the blasting process, the current blast fragmentation was resulting in sub-optimal feed size to crushers on the Mine and an unfriendly floor conditions resulting in excessive sheeting of digging floor to prevent tyre damage. It was decided to use RTK GPS to improve the fragmentation through accurate drill depth and design pattern in order to achieve a constant throughput to the north heap leach crusher of 1500 t/hr, a 5% increase in pit loading efficiency and a 50% decrease in rock breaker hours, equipment damage costs and in-pit sheeting costs respectively. This paper is intended to take the reader through the application of RTK GPS in accurate drill depth and drill pattern which have resulted in a 10% reduction in loading times, of which half has been attributed to improved fragmentation, as well as a substantial increase in blasted stocks whiles rock breaker hours have also decreased resulting in substantial financial gains to the company.
TS 1C – CORS-RTK I Francis Mensah The Use of RTK GPS in Blast Optimization FIG Working Week 2009 Surveyors Key Role in Accelerated Development Eilat, Israel, 3-8 May 2009
2/17
The Use of RTK GPS in Blast Optimization
Francis MENSAH, Ghana 1 INTRODUCTION The primary objectives of the blast optimization are to maximize crusher throughput and minimize loading and cycle times. The greatest influence on both can be realized through improved fragmentation of the blasted ore and waste within the pit and good floor conditions. The measure of the effect of the size distribution of the blasted material was done via: - Analysis of pictures taken in the pit after the blast and from a camera newly installed
facing the bowl of the north crusher. This was done with software acquired from Split Engineering
- Monitoring of the rock breaker hours - Continuous monitoring of loading and cycle times for all the mine’s excavators and trucks
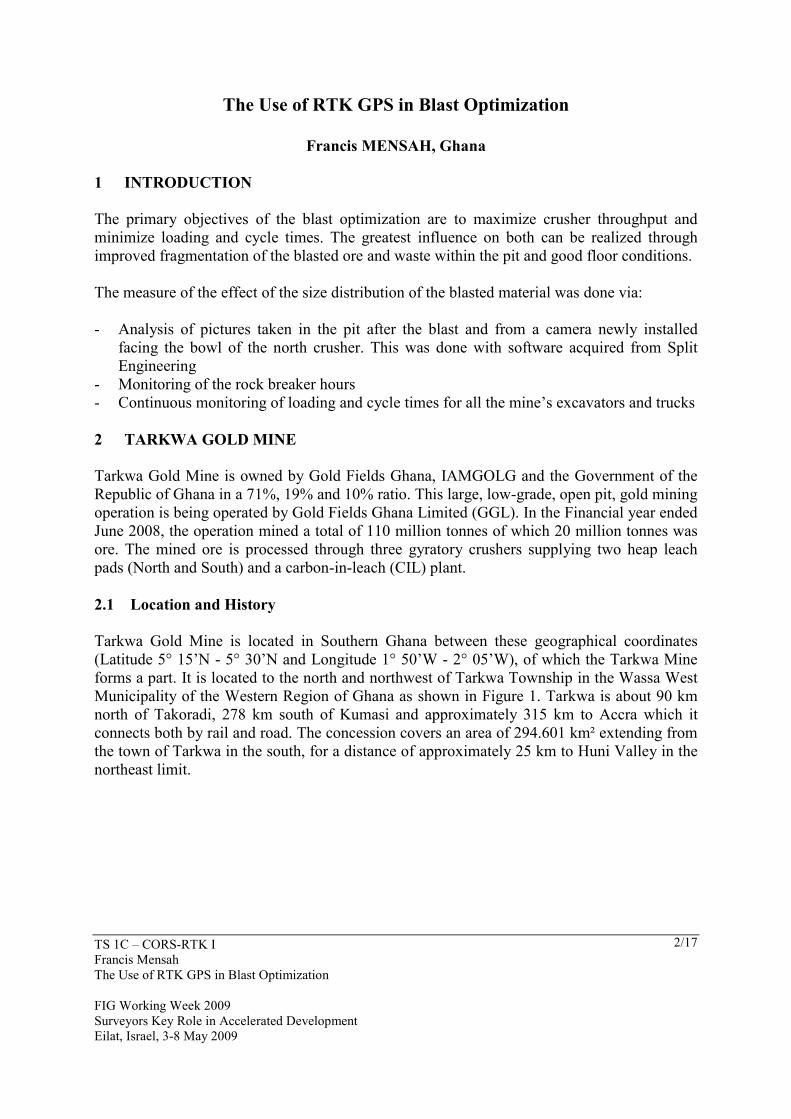
2 TARKWA GOLD MINE Tarkwa Gold Mine is owned by Gold Fields Ghana, IAMGOLG and the Government of the Republic of Ghana in a 71%, 19% and 10% ratio. This large, low-grade, open pit, gold mining operation is being operated by Gold Fields Ghana Limited (GGL). In the Financial year ended June 2008, the operation mined a total of 110 million tonnes of which 20 million tonnes was ore. The mined ore is processed through three gyratory crushers supplying two heap leach pads (North and South) and a carbon-in-leach (CIL) plant. 2.1 Location and History Tarkwa Gold Mine is located in Southern Ghana between these geographical coordinates (Latitude 5° 15’N - 5° 30’N and Longitude 1° 50’W - 2° 05’W), of which the Tarkwa Mine forms a part. It is located to the north and northwest of Tarkwa Township in the Wassa West Municipality of the Western Region of Ghana as shown in Figure 1. Tarkwa is about 90 km north of Takoradi, 278 km south of Kumasi and approximately 315 km to Accra which it connects both by rail and road. The concession covers an area of 294.601 km² extending from the town of Tarkwa in the south, for a distance of approximately 25 km to Huni Valley in the northeast limit.
TS 1C – CORS-RTK I Francis Mensah The Use of RTK GPS in Blast Optimization FIG Working Week 2009 Surveyors Key Role in Accelerated Development Eilat, Israel, 3-8 May 2009
3/17
Figure 1: Map of Africa and Ghana with Location of Tarkwa in circle Gold mining has played a central role in the social, political and economic life of Ghana and its people for more than 500 years. The Tarkwa region, which has always been at the centre of gold mining, has over the years seen good and bad times and the highlights can be summarized as follows: - 1700, Alluvial gold mining started in the Tarkwa region - 1750, The Wassa syndicate was formed as the first organized mining company - 1850, Amalgamated Banket Areas (ABA) was formed as a gold mining company - 1935, ABA took over the Tarkwa Gold Mine and associated properties and commenced
formal underground mining - 1961, The Sate Gold Mining Company (SGMC) nationalized all properties in the region,
and created Tarkwa Goldfields Limited - July 1993, Gold Fields Ghana Limited acquired Tarkwa Goldfields Limited under the
Ghana Government divestiture programme and continued the underground mining till August 1999
- Open cast and heap leach operations began in 1998 alongside the underground mining and have seen various stages of expansion. GFGL is committed to restoring this region to its former gold mining status in a safe and environmentally responsible manner (Mensah, 2007)
2.2 Mine Geology The producing section of the concession is in two ridges which extend over a strike length of 12km and are perpendicular to each other. The gold bearing reefs of the area are called conglomerate and are found in the lower part of the Tarkwaian System as follows: - Breccia Reef (Quartzite and Grit) - Middle Reef or West Reef (13 - 38 mm pebbles, economic gold) - Sub-basal Reef (50 - 80 mm pebbles), (Mensah, 2007).

TS 1C – CORS-RTK I Francis Mensah The Use of RTK GPS in Blast Optimization FIG Working Week 2009 Surveyors Key Role in Accelerated Development Eilat, Israel, 3-8 May 2009
4/17
The general description of the geology of the area indicates that the Tarkwa Lease is located on the Main Shield within the Ashanti Belt, a north-east to south-west trending Synclinorium (A basin shaped fold). This belt of early Proterozoic sediments consists of deformed rudaceous, arenaceous and argillaceous rocks (groups of detrital sedimentary rocks) of the Tarkwaian Series. The Tarkwaian Series is underlain by the Birimian System, which primarily comprises of metavolcanics and metasediments. Due to the alternance of reef / waste layers within the ore body, selective mining is practiced at Tarkwa. This allows the mine to achieve planned grades by separating the ore from waste in a way that minimizes dilution and minimizes ore loss. 2.3 Mining The load and haul and drill rig fleets at the time of the project are highlighted in Table 1. Table 1 Haulage and Drilling fleets at Tarkwa Mine Machine Type Quantity Liebherr 984 Excavators 4 Liebherr 994_200 Excavators 4 Liebherr 9250 Excavators 1 Liebherr 994B Excavators 2 Liebherr 994B Face Shovel 1 O&K RH120 Excavator 3 Caterpillar 785C Trucks 44 Tamrock Pantera 1500 Drill Rigs 22 Truck allocation (dispatching) is performed by Modular Mining Dispatch Fleet Management System. Currently, Tarkwa Gold Mine produces an average of 9 million tons of broken rock per month, of this total, 7.3 million tons are waste stripping and the remaining 1.7 million tons are gold bearing ore, which is recovered by means of selective mining. Of the 1.7 million tons of ore, 1.2 million tons are directed to the two Heap Leach (HL) plants at an average grade of 1.3 g/t, and 485 000 tons are directed to the Carbon in Leach (CIL) plant at about 1.6 g/t, for gold recovery, some of these material is stock piled. 2.4 Processing Averagely, 1.4 million tons of Heap Leach ore and 410,000 tons of CIL/Mill ore are crushed on a monthly basis. Primary crushing reduces the bulk ore to a fragment size of about 100mm, from where the CIL material goes straight to the mill. The HL material goes through secondary and tertiary crushers to reduce the fragment size to an average of 8 to 12 mm, before it gets routed on a series of conveyors to the agglomeration plants.

TS 1C – CORS-RTK I Francis Mensah The Use of RTK GPS in Blast Optimization FIG Working Week 2009 Surveyors Key Role in Accelerated Development Eilat, Israel, 3-8 May 2009
5/17
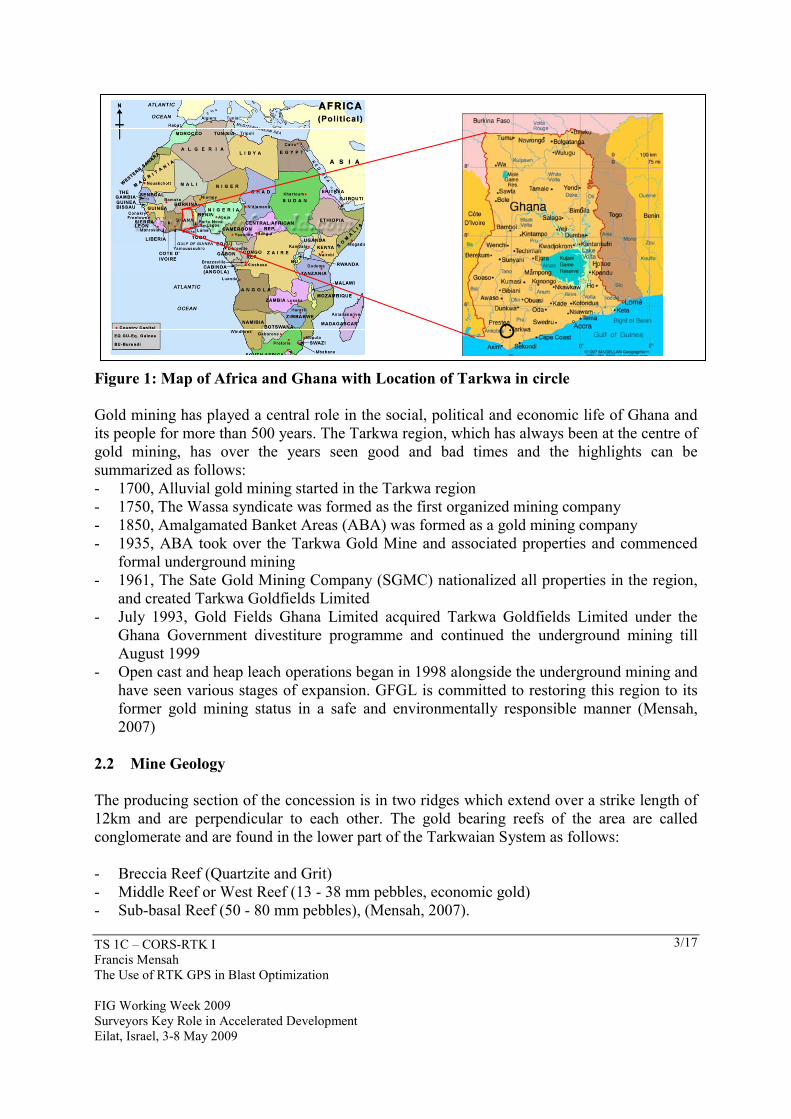
2.4.1 Heap Leach The crushed ore is conveyed to the agglomeration plant, where it is mixed with about 5kg of cement for every ton of ore. The agglomerated ore now follows a conveyed route to the leach pads where it is routed to the top of the pads by a series of step–like conveyors. The leach pads are equipped with an integrated irrigation system, which sprays cyanide onto the pads. The cyanide filters down through the porous gold bearing ore and absorbs the gold to produce a “pregnant” solution. The pregnant solution is contained at the base of the pads and then routed along a series of channels and drainage pipes to the respective ADR plants. During the final recovery process, the gold in the pregnant solution is adsorbed onto activated carbon. It is then stripped from the carbon with a caustic soda/cyanide solution at elevated temperatures and then precipitated out of this solution by using zinc. The gold is hereafter recovered on a filter press, calsined and smelted (See Fig. 2). Fig. 2 Heap Leach Flow diagram Tarkwa Gold Mine currently produces an average of 1.1 to 1.3 tons of gold per month, through the Heap Leach plants. 2.4.2 Carbon in Leach Tarkwa Gold Mine currently produces an average of 630kg’s of gold on a monthly basis, through the CIL process (See Fig. 3).
TS 1C – CORS-RTK I Francis Mensah The Use of RTK GPS in Blast Optimization FIG Working Week 2009 Surveyors Key Role in Accelerated Development Eilat, Israel, 3-8 May 2009
6/17
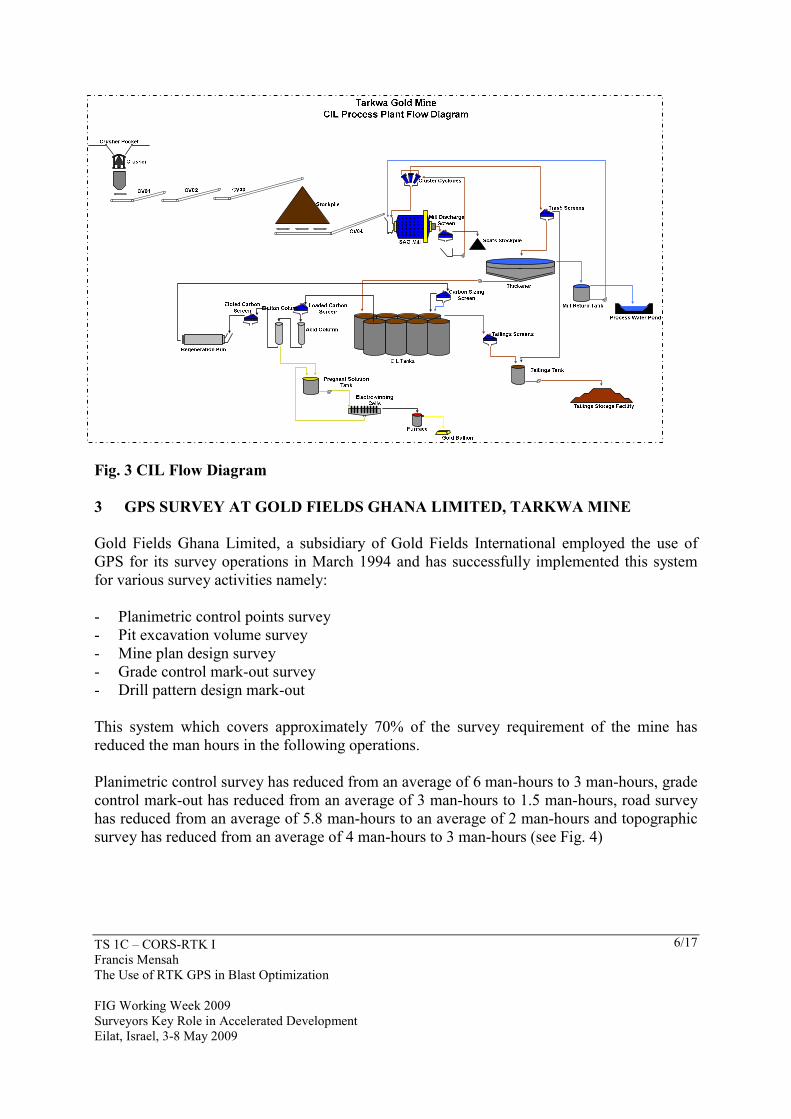
Fig. 3 CIL Flow Diagram 3 GPS SURVEY AT GOLD FIELDS GHANA LIMITED, TARKWA MINE Gold Fields Ghana Limited, a subsidiary of Gold Fields International employed the use of GPS for its survey operations in March 1994 and has successfully implemented this system for various survey activities namely: - Planimetric control points survey - Pit excavation volume survey - Mine plan design survey - Grade control mark-out survey - Drill pattern design mark-out This system which covers approximately 70% of the survey requirement of the mine has reduced the man hours in the following operations. Planimetric control survey has reduced from an average of 6 man-hours to 3 man-hours, grade control mark-out has reduced from an average of 3 man-hours to 1.5 man-hours, road survey has reduced from an average of 5.8 man-hours to an average of 2 man-hours and topographic survey has reduced from an average of 4 man-hours to 3 man-hours (see Fig. 4)

TS 1C – CORS-RTK I Francis Mensah The Use of RTK GPS in Blast Optimization FIG Working Week 2009 Surveyors Key Role in Accelerated Development Eilat, Israel, 3-8 May 2009
7/17
Figure 3: Fig. 4 RTK/Total Station Man-hour’s Comparison 3.1 Real time Kinematics Survey (RTK) RTK survey was introduced to Gold Fields Ghana Limited, Tarkwa mine in December 2004 to augment the fleet of Total Stations being used on the mine. RTK surveys are GPS Kinematics surveys with a communication link between the base receiver and the rover receiver in order to compute the relative position of the rover receiver with respect to the base receiver in real time (Gatti et al, 1995). The GPS base station is located on a known station and takes measurements from satellites in view and then broadcasts them along with its known position to the rover receiver. The rover on the other hand collects measurements from the satellite in view and then processes them with the base station data to determine its location relative to the base station. Data processing is instant in the field as it is being logged, providing immediate centimeter-level results in the form of coordinates from the Trimble Controller (Duncan and Mensah, 2007). 3.1.1 Setting the RTK GPS Base Station at GGL The RTK GPS survey system at Tarkwa is made up of one R 5700 Trimble unit as the main base, one R 5800 mobile base and ten R 5800 receivers. A calibration survey was performed on 8 known coordinates to establish the known point for the base. 3.1.2 Calibration Procedure A Trimble Reference Station programme was used to start the base running. The GPS site calibration process established the relationship between the WGS-84 positions determined by

TS 1C – CORS-RTK I Francis Mensah The Use of RTK GPS in Blast Optimization FIG Working Week 2009 Surveyors Key Role in Accelerated Development Eilat, Israel, 3-8 May 2009
8/17
GPS observations and the local coordinates defined by a local map grid with elevations above sea level. The calibration process carried out comprised a datum transformation to convert the WGS-84 Latitude, Longitude, and Ellipsoidal height relative to the local ellipsoid used in the country. The three-parameter method (Translation Tx = -159.506m, translation Ty = 262.531m and translation Tz = 221.791m) was adopted for the GGL set up. The following parameters were entered into the Trimble Geomatics Office software as required by TerraSync, (2005) Zone – United Kingdom; Site – Ghana National Grid War Office; Projection – Molodensky; and Reference Ellipsoid – WGS-84. The known coordinate of the main base station on WGS-84, Ghana National Grid and GGL Grid was generated and tabulated. The calibration process requires observing a minimum of 4 satellites to ensure reliable Root Mean Square (RMS) values to obtain an acceptable Positional Dilution of Precision (PDOP). The result of the calibration is enumerated in Table 2 below with RMS values of less than ±0.005 m and PDOP of less than 2.1 m for minimum distance of 1.5 km to 5.4 km from the base station. Table 2 Calibration Results of Baselines From-To # of
Satellites RMS (m)
Slope Distance (m)
Horizontal Precision (m)
Vertical Precision (m)
PDOP (m)
Base-PT6 7 0.005 3481.582 0.010 0.016 1.305 Base-PT9 7 0.004 2418.006 0.010 0.017 1.652 Base-PS3 6 0.004 1835.020 0.007 0.017 2.096 Base-TEB1 7 0.003 2927.499 0.006 0.012 1.888 Base-GFID13 10 0.006 5296.384 0.010 0.017 1.524 Base-AKE5 7 0.003 1468.594 0.006 0.011 2.395 Base-AKE3 10 0.005 1957.357 0.007 0.012 1.124 Base-KOT3 10 0.006 4412.562 0.007 0,012 1.135 3.1.3 Accuracy Test on RTK GPS Positions Periodic accuracy test is being conducted on the system to ascertain its reliability and one of such exercise is tabulated in Table 3 below: Six control points were established at different locations and monitored at different times of the day when satellites availability differs significantly. The survey was performed using a 2m Rover mounting pole with a bubble making the operation susceptible to higher human error of leveling which was intentionally done to check the accuracies in horizontal and vertical measurements. My exercise proved its objectives with higher accuracy in vertical than horizontal. The overall error margins were less than 10cm in both axes which is an indication of good quality RTK operation.

TS 1C – CORS-RTK I Francis Mensah The Use of RTK GPS in Blast Optimization FIG Working Week 2009 Surveyors Key Role in Accelerated Development Eilat, Israel, 3-8 May 2009
9/17
Table 3 Accuracy Test on RTK GPS BASE DATA
STATION EASTING NORTHING ELEVATION DATE MK1 9983.53 11241.00 212.65 MK2 9866.60 11513.59 211.97 MK3 9813.33 11826.45 208.25 CW1 9235.97 9783.92 187.59 CW2 9130.80 9748.52 186.01
CW3 9006.13 9678.89 188.41
31/12/2008
ROVING DATA
STATION EASTING NORTHING ELEVATION DATE dE dN dZ
MISCLOSE VECTOR
MK1 9983.65 11240.97 212.65 -0.01 0.03 0.00 0.03 MK2 9866.49 11513.49 211.98 0.01 0.09 -0.01 0.09 MK3 9813.25 11826.55 208.24 0.08 0.00 0.01 0.08 CW1 9236.02 9783.82 187.62 -0.05 -0.01 -0.03 0.05 CW2 9130.75 9748.39 186.03 0.05 0.03 -0.02 0.06 CW3 9006.22 9678.84 188.41
3/1/2009
0.00 0.05 0.00 0.05
MK1 9983.53 11241.01 212.64 0.01 -0.01 0.01 0.01 MK2 9866.54 11513.47 211.98 0.05 0.02 -0.01 0.06 MK3 9813.31 11826.45 208.24 0.02 0.00 0.01 0.02 CW1 9236.00 9783.97 187.60 -0.03 -0.05 0.00 0.06 CW2 9130.71 9748.52 186.02 0.09 0.00 -0.01 0.09 CW3 9006.15 9678.90 188.40
4/1/2009
-0.02 -0.01 0.00 0.02
MK1 9983.51 11241.03 212.65 0.02 -0.03 0.00 0.04 MK2 9866.55 11513.46 211.98 0.04 0.02 -0.01 0.05 MK3 9813.21 11826.43 208.25 0.02 0.02 0.00 0.03 CW1 9236.01 9783.96 187.59 -0.03 -0.04 0.00 0.05 CW2 9130.81 9748.49 186.04 -0.01 0.03 -0.03 0.03 CW3 9006.13 9678.90 188.42
5/1/2009
-0.01 0.00 -0.01 0.01
MK1 9983.57 11241.09 212.63 -0.03 -0.01 0.02 0.04 MK2 9866.56 11513.44 212.00 0.04 0.04 -0.03 0.06 MK3 9813.24 11826.39 208.24 -0.01 0.06 0.01 0.06 CW1 9236.00 9783.96 187.60 -0.02 -0.04 -0.01 0.04 CW2 9130.81 9748.48 186.02 -0.01 0.04 -0.02 0.04 CW3 9006.16 9678.89 188.39
6/1/2009
-0.03 0.00 0.01 0.03

TS 1C – CORS-RTK I Francis Mensah The Use of RTK GPS in Blast Optimization FIG Working Week 2009 Surveyors Key Role in Accelerated Development Eilat, Israel, 3-8 May 2009
10/17
4 DATA ACQUISITION, PROCESSING AND TRANSFER 4.1 Data Acquisition Data required for the survey work is normally produced by the drill and blast engineer after a series of consultations with the planning engineer, geologist and the pit superintendent. The blast pattern for a particular pit is designed based on the orientation of the ore body, the road network and other geological factors. The design pattern which is generated based on the spacing and burden comes out in a format as shown in Fig. 5 below. The size of a pattern block within which the design holes are located, depends on the area available and the number of holes to be blasted which also depends on the proximity of the blast to sensitive installations such as high tension lines, magazines, fuel bay and residential locations. Fig. 5 Blast Pattern Block Design

TS 1C – CORS-RTK I Francis Mensah The Use of RTK GPS in Blast Optimization FIG Working Week 2009 Surveyors Key Role in Accelerated Development Eilat, Israel, 3-8 May 2009
11/17
Pattern Points
Fig. 6 Blast Pattern holes These points as in Fig. 6 are transferred onto the ground for drillers to drill and this aspect is where the use of RTK GPS is essential. 4.2 Data Transfer The design points which are most of the time in Surpac string format are converted into comma separated values (CSV) before they are loaded into the Trimble Survey Controller (TSC) via Trimble Geomatics Office software. These points are always in the coordinate format (Easting, Nothing, Elevation and Code) which is the preferred format in place at GGL. The stored data is transferred onto the field after that particular block has been marked out. The process of surveying is to open a file, copy the calibration information (transformation parameters in GGL coordinate format) onto the created file and enter the required parameters for surveying. Select survey from the main menu, then RTK, start survey will enable the rover to search for the base station and when it is found will prompt the surveyor that a link has been established. After establishing a link with the base, stakeout is selected from the main menu which then directs the user to the map of the points to be transferred onto the ground. When a point is selected, an arrow indicating the direction and distance to locate the selected point appears on the screen which if followed carefully enables the surveyor to locate the exact position of the required point. After locating the point, the surveyor must measure to be able to determine the depth of hole to be drilled. This procedure continues until all the points within a block are demarcated with drilling depth written on the ground against the holes. 4.3 Data Processing The data stored on the TSC is down loaded through Trimble Geomatics Office software and converted into a comma separated value format and finally imported into Surpac software. In

TS 1C – CORS-RTK I Francis Mensah The Use of RTK GPS in Blast Optimization FIG Working Week 2009 Surveyors Key Role in Accelerated Development Eilat, Israel, 3-8 May 2009
12/17
Surpac, a plotting menu is open and all the required entities are set up with special attention on the depth of holes to be drilled. This is done by creating an entity in the point operations graphics while the elevation (Z) field is selected to be shown against each point marker. The position of each drill rig is shown on the plan by means of a flag which are positioned on the plan on specific lines (See Fig. 7). For safety reasons drill rigs are positioned leaving two lines in between one another.
Fig. 7 Plan of Drill Pattern showing positions of Drill Rigs These plans are distributed to the drillers who then drill according to the depth indicated on the plans. Each drilling shift has two dippers (assistants) who check the depth of each hole and recall for re-drill when short holes are identified during check measurement. With this system accurate drill depth are achieved for efficient blasting and therefore good fragmentation. 5 BENEFITS ACHIEVED The benefits achieved from the RTK GPS implementation include: - Improved blast to design boundaries - Good fragmentation - Good truck loading times - Low rock breaker hours

TS 1C – CORS-RTK I Francis Mensah The Use of RTK GPS in Blast Optimization FIG Working Week 2009 Surveyors Key Role in Accelerated Development Eilat, Israel, 3-8 May 2009
13/17
5.1 Improved Blast to design boundaries 5.2 Good Fragmentation Fig. 8 % Blasted to design Evolution With reference to the bar chart in Fig. 8 above, it could be observed that there was sharp increase in blast to design boundaries from August 2007 when the project was implemented and a well followed block design in bottom right corner. 5.2 Good Fragmentation The average rock size passing 750 mm for a period of six months was as referenced on Table 4 below for various Pits (Amiel, 2008). Table 4 Rock size passing 750mm PIT % SIZE PEPE 99.0 TEBEREBIE 99.4 KOTTRAVERCHY 99.5 AKONTANSI UNDERLAP 100.0 AKONTANSI RIDGE 95.5

TS 1C – CORS-RTK I Francis Mensah The Use of RTK GPS in Blast Optimization FIG Working Week 2009 Surveyors Key Role in Accelerated Development Eilat, Israel, 3-8 May 2009
14/17
A camera and the software allowing the interpretation of the in-pit pictures in terms of fragmentation was acquired and regular pictures were taken for analyses (See Fig. 8). Fig. 9 Fragmentation of 98.5% passing 750 mm (Amiel, 2008) 5.3 Good Loading Times As a result of good fragmentation, Excavator loading time reduced significantly resulting in increase production. A statistical analysis of Excavator loading time can be found in Fig. 10. Efficient loading times results in higher tonnage haulage Fig. 10 Excavator Loading Time (Anon, 2008)

TS 1C – CORS-RTK I Francis Mensah The Use of RTK GPS in Blast Optimization FIG Working Week 2009 Surveyors Key Role in Accelerated Development Eilat, Israel, 3-8 May 2009
15/17
5.4 Low Rock Breaker Hours With reference to Fig. 11 it is evident that the implementation of the RTK system in July 2007 in controlling drill depth has seen progressive decline in rock breaker hours from 225 hours in July 2007to 130 hours in January 2008. Fig. 11, Average Rock Breaker Hours per month 6 COST BENEFITS The cost analysis in Table 5 below illustrates the benefits accrued from the implementation of the system: Table 5 Cost benefits Analysis
Benefits Jan-08 Feb-08 Mar-08 Apr-08 Additional gold revenue Reduced equip damages Reduced R/Breaker hrs Explosives savings
1,106,947.91 50,000.00 8,450.26 0.00
1,012,933.72 50,000.00 9,756.04 4,623.09
1,610,617.34 50,000.00 -10,164.41 31,111.00
2,363,474.46 50,000.00 -10,222.39 76,898.23
Cost Drilling flags 750.00 750.00 750.00 750.00 Tulip 0.00 3,715.00 25,000.00 46,127.50 Net Profit 1,164,648.17 1,072,847.85 1,655,813.93 2,433,272.80

TS 1C – CORS-RTK I Francis Mensah The Use of RTK GPS in Blast Optimization FIG Working Week 2009 Surveyors Key Role in Accelerated Development Eilat, Israel, 3-8 May 2009
16/17
7 CONCLUSIONS The efficient usage of RTK GPS is highly cost effective as it is less labor intensive. Its usage in managing drilling depth on the mine has really increased blasted stock, improved explosive usage, reduced pit floor toes as well as reduced significantly floor sheeting. The system has boosted tonnage throughput to the crushers and reduced rock-breaker hours to almost 50%. Truck loading time after the implementation has improved resulting in high tonnage records over the months to the satisfaction of management. As a result of good fragmentation, equipment damage which hitherto was nothing good to write home has reduced overwhelmingly. REFERENCES Amiel A. (2008), “Blast Fragmentation Optimization at Tarkwa Gold Mine, Using Six
Sigmagies” Unpublished Six Sigma Report, Tarkwa Gold Mine, pp. 1-25. Anon, (2008). “Mine Management Reporting System” Gold Fields \Ghana Limited, Tarkwa,
Ghana. Duncan E. E., and Mensah, F. (2007). “Real Time Kinematics GPS in Open Pit Survey – A
Case Study at Gold Fields Ghana Limited, Tarkwa, Ghana”, Ghana Mining Journal, pp 1-7.
Gatti M., Pellegrinelli, A. and Russo, P. (19995), “Un Contributo alla Studio Sperimientale del Sistema. GPS Real Time Kinematic Survey-On the Fly”, Bollettino della SIFET, n.3, pp. 107-116.
TerraSync, (2005). Reference Manual, Trimble Navigation Limited, Mapping and GIS Business, Area 7401 Church Ranch, Blvd Westminster, pp. 1-3.
BIOGRAPHICAL NOTES
Francis Mensah Holds an MPhil Degree in Mining Engineering from the University of Mines & Technology, Tarkwa and a Diploma in Mine Surveying from the University of Science & Technology, School of Mines, Tarkwa, Ghana. He is the Chief Surveyor at Gold Fields Ghana Limited, Tarkwa, Ghana. He has 17 years of field experience in surveying, of which 2 years was achieved underground, 6 years as exploration surveyor and 9 years as open pit chief surveyor. He worked with Tarkwa Goldfields as underground surveyor, Gold Fields Ghana Limited as a Surveyor, Senior Surveyor and Chief Surveyor, Mutual Resources and Birim Goldfields as a Chief Surveyor. He is currently a member of the Ghana Institution of Surveyors (GhIS), a consultant to Volta Resources an Exploration company both in Ghana and Bukina Faso. He was at the XXIII International FIG Congress (Germany 2006) and also presented a paper.

TS 1C – CORS-RTK I Francis Mensah The Use of RTK GPS in Blast Optimization FIG Working Week 2009 Surveyors Key Role in Accelerated Development Eilat, Israel, 3-8 May 2009
17/17
CONTACTS Francis Mensah Department of Mining Engineering Gold Fields Ghana Limited Tarkwa Mine Post Office Box 26 Tarkwa Ghana. Tel: +233 244618125 Fax: +233 36221359 Email: [email protected]