the use of usage michael j. kurtz harvard-smithsonian center for astrophysics
TRANSCRIPT

The Use of Usage
Michael J. KurtzHarvard-Smithsonian
Center for Astrophysics
Collaborators
• Johan Bollen• Edwin Henneken• Alberto Accomazzi
• http://www.cfa.harvard.edu/~kurtz/PSP.pptx

Literatureall in arXiv
• 2013 Kurtz & Henneken, “Finding and Recommending Scholarly Articles” in Bibliometrics and Beyond, MIT Press
• 2010 Kurtz & Bollen, “Usage Bibliometrics” Ann Rev Information Science & Tech
• 2005 Kurtz et al. “Bibliometric Properties of Article Readership Information” J. Am Soc Information Science & Tech


http://dx.doi.org/10.1787/603233448430.
Four Types of Readers
• Researchers (=authors?)• Practitioners• Students• General Public
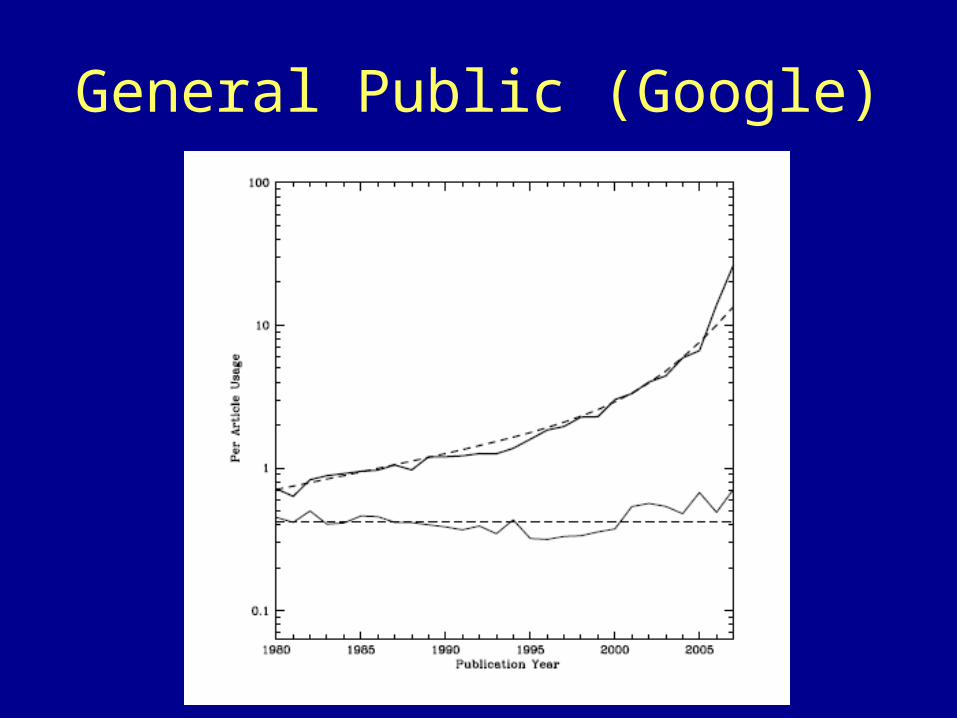
General Public (Google)

Students (Google Scholar)

Co-Usage
• Recommendations– What are people like me reading– What are people who read this also reading
• Queries– Sort by most downloaded– Sort by filtered downloads


Scholarly Articles Are Different
Scholarly Articles are MUCH denser than films
• Netflix ~ 25,000 films• ADS ~ 10,000,000 articles– 172,000 contain the word “cosmology”– >12,000 in 2012
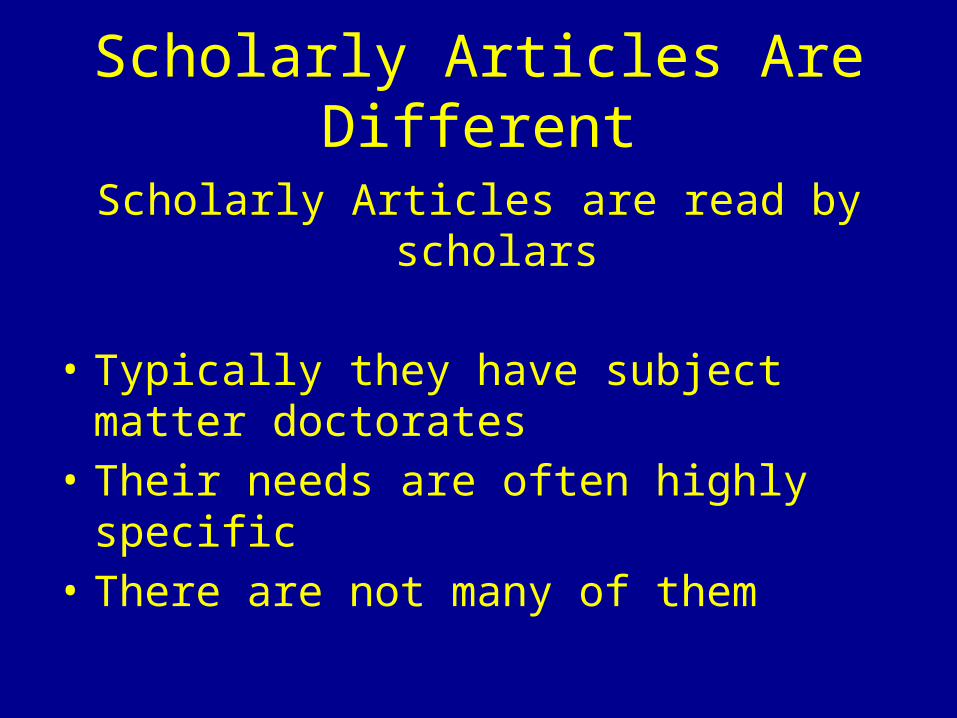
Scholarly Articles Are Different
Scholarly Articles are read by scholars
• Typically they have subject matter doctorates• Their needs are often highly specific• There are not many of them
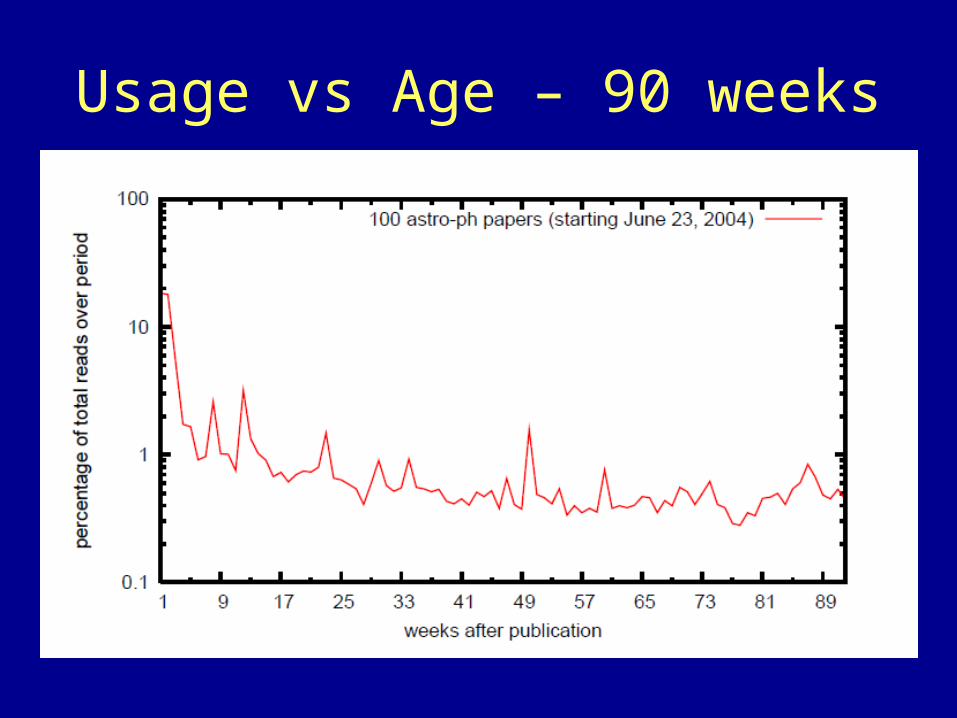
Usage vs Age – 90 weeks

Aggregation
• Articles• Readers• Enhance Signal to Noise• Engineering Issues– What are you trying to achieve– Who are you doing this for– How fast must it be


What Can Be Measured
• The Interconnectedness of Science• Fields of Study• Countries• Journals• Organizations• People• Instruments• Articles

Usage map• 200M usage events• 2006 usage only• JCR journals (+-
7600)
Red, orange= psych, cognGreen = phys, chemOlive = material scienceBlue = biologyPurple = pharma
Bollen et al, 2009a

Networks - ADS

Weak Lensing (84) AGN Spectra (101)
Comparing Sub-Fields

Measuring Countries
• Authors are from countries, reads as a function of author’s country has yet to be studied
• Readers are from countries, their activities allow one to measure the Scientific Wealth of Nations

ADS use vs per capita GDP

Astronomy is representative
ADS predicts average of Cites+articles better than cites predicts articles

Measuring Changes
Measuring Journals
• Beyond the Impact Factor• Reads vs Cites differences will be important
here• The New York Times would have a low Impact
Factor

Standard Usage Measures
• COUNTER• David Nicholas, Ian Rowland & collaborators• University College, London• CIBER-Research

Bollen et al, 2009b

Measuring Departments
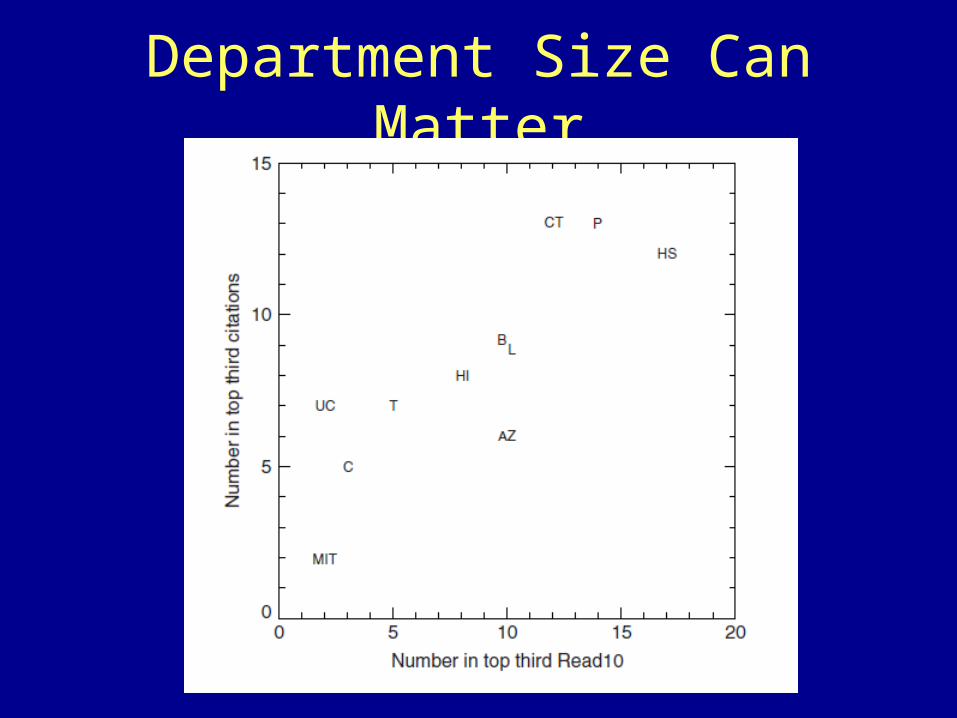
Department Size Can Matter

Berkeley Princeton

Measuring Individuals
• The number of times one’s articles are read is a valid measure of one’s scientific impact, similar to citation counts
• Use has different properties than cites, together they form a two dimensional view of productivity
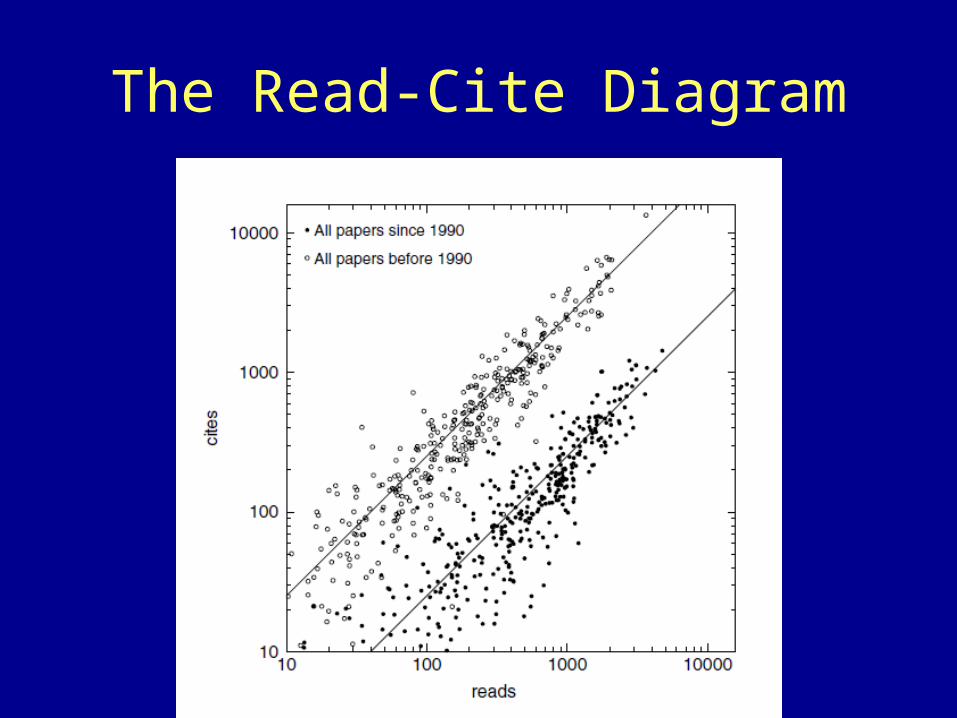
The Read-Cite Diagram

Professional Astronomers

2 dimensional productivity model

Different productivities - histories

Productivity vs Age - Cites

Productivity vs Age - Reads

Reads and Cites History for M. Kurtz

Papers, Reads, and Cites for Hectospec

Papers, Read, Cites for NAG5-4445

Reads, Cites for 1998PASP..110..934K

Final Thoughts
• Much remains to be done– Implement “best” methods– Develop standard data
• Problems abound– Privacy– Open Access
– Who exactly is reading this paper?– Why do I care? (not money)
