the virginia creeper trail: an analysis of use, economic impacts, visitor characteristics, and...
TRANSCRIPT

The Virginia Creeper Trail: An Analysis of Use, Economic Impacts,
Visitor Characteristics, and Preferences
J.M. Bowker USDA Forest Service
John C. Bergstrom & Joshua GillUniversity of Georgia
Abingdon, VA April 28, 2004

Partners Virginia Creeper Club Creeper Cabins Virginia Trails Virginia Dept Conservation & Recreation Virginia Dept Forestry National Park Service University of Georgia, Dept Ag & Applied Econ USDA Forest Service, Region 8 & SRS Numerous Volunteers

Major Objectives
Measure Annual Trail UseEstimate Local Economic ImpactsDescribe Trail UsersExamine User Attitudes / Preferences
Trail AttributesManagement / PolicyBenefits

Trail Use

Stratified Random SamplingTrail ExitsSeason
Winter 02-03 / Summer 03
Day typeSat / Sun, Fri, Hol / Weekday
Exit typeHigh / Low
Time of day summerMorning / Afternoon / Evening

Winter Counts Total cells 1629 = 9 (26 + 60 + 95) Cells sampled 77 = 4.7 percent Lots of 0’s Dec – Feb Sat ave = 217 Sun / Fri / Hol ave = 177 Weekday ave = 77Winter Visits = 23, 614 +/- 2,985

Summer Counts Total cells 4968 Cells sampled 107 = 2 percent Very few 0’s and higher missings Abingdon Sat ave = 1181 Sun / Fri / Hol ave = 676 Weekday ave = 358Summer Visits = 106,558 +/- 7,282

Annual Visits
Total = 130,172Range 119,905 to 140,439

Survey Instruments Screener Survey N= 1430
Systematic random sample
Detailed Survey N= 1036Systematic random sampleLocal Nonlocal A & B

Survey Hierarchy
Total Detailed Surveys = 1036
ScreenerTotal-1430Winter-681
Summer-749
LocalTotal-431
Winter-250Summer-181
Nonlocal ATotal-168Winter-75
Summer-93
Nonlocal BTotal-437Winter-91
Summer-346

Screener Survey Content
Local vs Nonlocal Group size Activity Race Gender Willingness to be surveyed

Detailed Survey Content Trip characteristics Spending characteristics Travel time and distance to site Trail issues and benefits Area features Household demographics Annual usage Primary purpose

Visit Breakdown
Screener Survey
47 percent Washington & GraysonLocal visits = 61,503 53 percent NonlocalsNonlocal visits = 66,669

Nonlocal Visits to Trips
Detailed SurveyPrimary purposeDay use vs overnightTrail visits per trip to area

Nonlocal Visits to Trips Visits PP Day Use 40,034
PP Ovr Nite 10,305
NP Day Use 9,473
NP Ovr Nite 8,857
66,669
Person-trips
33,642
5,725
7,578
3,918
50,864


Expenditures by Locals and Nonlocals
Grayson and Washington Counties
Local Resident Expenditures Per Person Per Day Trip (example: $10 average)
Nonlocal Resident Expenditures Per Person Per Day Trip (example: $17 average)

Gross Economic Value and Expenditures
$17.00
$30.00
$0.00
$5.00
$10.00
$15.00
$20.00
$25.00
$30.00
$35.00
$40.00
$45.00
$50.00
Gross Economic Value
Net Value (Net WTP)
Expenditures

Regional Economic Impact AnalysisBasic steps:
Estimate Use Estimate recreation expenditures per person
per trip by nonlocals for major expenditure categories
Define Local Impact Region Allocate Local Impact Region expenditures to
economic sectors in the Local Impact Region Use IMPLAN model to estimate output, jobs
and income in the Local Impact Region supported by nonlocal resident expenditures.

Overview of IMPLANImpact Modeling for PLANning
Computer-based, input-output economic model Designed for regional economic impact analysis Developed by the U.S.D.A. Forest Service Provides comprehensive, science-based system for
estimating economic impacts of natural resource related projects
Since 1979, it has been used in a multitude of private and public sector applications to estimate the economic impacts of natural resource related and non-natural resource related projects on regional economies

Overview of IMPLAN IMPLAN has two major components: Nationwide database describing county-level
economic activity and a computer model for constructing regional input-output models and estimating economic impacts from changes in economic activity.
The model is based on input-output accounting and analysis procedures used by the U.S. Bureau of Economic Analysis and recommended by the United Nations

Nonlocal Spending & Impacts
Detailed Survey NLBGroup expenditures whole tripGroup expenditures Washington & GraysonSpending party sizePer-person trip expenditures
IMPLAN ModelEconomic Impacts per 1,000 person-trips

Whole trip 25 miles VCT VCT person/trp
Priv. Lodg 14.69 0.00 0.00
Pub. Lodg 0.09 0.00 0.00
Food In 38.13 21.29 6.37
Food Out 6.49 2.65 0.79
Prim. Trans. 18.68 11.42 3.39
Other Tran. 0.06 0.06 0.02
Bike Rent 12.98 11.68 3.50
Shuttle 10.51 9.17 2.75
Use Fees 0.14 0.14 0.42
Other 1.42 0.89 0.27
Total 103.19 57.30 17.16
Primary Purpose Day User Exp ProfileAve Spending Party Size = 3.34

Primary Purpose Overnight Exp ProfileAve Spending Party Size = 4.5
Whole trip 25 miles VCT VCT person/trp
Priv. Lodg 211.86 126.95 28.21
Pub. Lodg 29.30 22.29 4.95
Food In 137.02 99.71 22.16
Food Out 40.02 28.23 6.27
Prim. Trans. 61.50 36.32 8.07
Other Tran. 1.90 1.85 0.41
Bike Rent 18.44 17.28 3.84
Shuttle 20.96 19.26 4.28
Use Fees 0.00 0.00 0.00
Other 18.32 17.57 4.39
Total 539.32 369.46 82.10

Non-primary Purpose Day Use Exp ProfileAve Spending Party Size = 4.3 Time Share = .193
Whole trip 25 miles VCT VCT person/trp
Priv. Lodg 165.13 0.00 0.00
Pub. Lodg 31.18 0.00 0.00
Food In 154.18 51.00 3.51
Food Out 23.63 5.90 0.10
Prim. Trans. 82.18 59.00 3.98
Other Tran. 72.72 0.00 0.00
Bike Rent 47.13 47.13 2.66
Shuttle 3.09 3.09 0.14
Use Fees 0.18 0.00 0.00
Other 100.95 54.81 0.70
Total 680.37 161.93 11.11

Non-primary Purpose Overnight Exp ProfileAve Spending Party Size = 3.40 Time Share = .04
Whole trip 25 miles VCT VCT person/trpPriv. Lodg 175.53 125.17 1.74
Pub. Lodg 47.89 46.19 0.20
Food In 120.51 97.32 1.31
Food Out 28.19 17.23 0.13
Prim. Trans. 100.51 44.73 0.56
Other Tran. 29.19 6.80 0.01
Bike Rent 17.59 17.25 0.35
Shuttle 9.03 8.50 0.15
Use 1.06 0.00 0.00
Other 3.93 3.40 0.10
Total 533.43 366.59 4.55

Nonlocal Expenditures per Person-trip by User Type
PPDU- $ 31 total $ 17 in local areaPPON- $ 120 total $ 82 in local areaNPDU- $ VCT share $ 11 in local areaNPON- $ VCT share $ 4 in local area
*These numbers have been trimmed for outliers

Creeper Impacts
Economic Impact Indicators
Economic Impacts Per 1,000 Person Trips
Primary Primary Non Prim Non Prim
Day Use Overnight Day Use Overnight
Output $23,606 $114,398 $14,968 $6,411
Employment 0.4 2.1 0.2 0.1
Total Income $10,270 $45,944 $6,014 $3,200
Economic Impacts Per 1,000 Person Trips of VCT Use in Grayson & Washington Counties, VA, 2003 dollars

Nonlocal Economic ImpactsCombined Local Economic Impacts of Nonlocal VCT Use
Grayson & Washington Counties, VA, 2003 dollars
Economic Impact Indicators
Total Economic Impact
Output $1,600,000
Employment 30
Total Income $670,000

Distribution of Creeper Output Impacts
40%
20%
7%
6%
6%
4%
4%
3%9% 1%
Accomodation and FoodServicesEntertainment and Recreation
Retail Trade
Wholesale Trade,Transportationand WarehousingGovernment
Finance, Insurance, Real Estate
Manufacturing, Construction,UtilitiesHealth and Social Services
Other Services
Agriculture, Forestry and Mining

VCT Users

VCT User Demographics
Locals NonlocalsHousehold size 2.6 2.9College education % 60 66 Respondent age 47 47Full-time employ % 58 77House Income $1000 59 80.5Gender % Male 61 65Race % White 99 99

VCT Market
Nonlocal travel one-way miles
Ave 260.5
Max 2747
Nonlocal nights per trip Ave 2.95
Max 73
Nonlocal spending party Ave 3.79
Max 45

Primary Activities
Locals % Nonlocals %Walking 52 Biking 74
Biking 26 Walking 20
Jogging 13 Jogging 2

On Trail Time & Distance
Locals NonlocalsTime on Trail 80 min 176 min
Distance Traveled 5.5 mi 16.7 mi

Group Size & Trips
Locals NonlocalsGroup Size
ave 1.9 3.6max 30 45
Trips per year ave 141 6 max 606 300
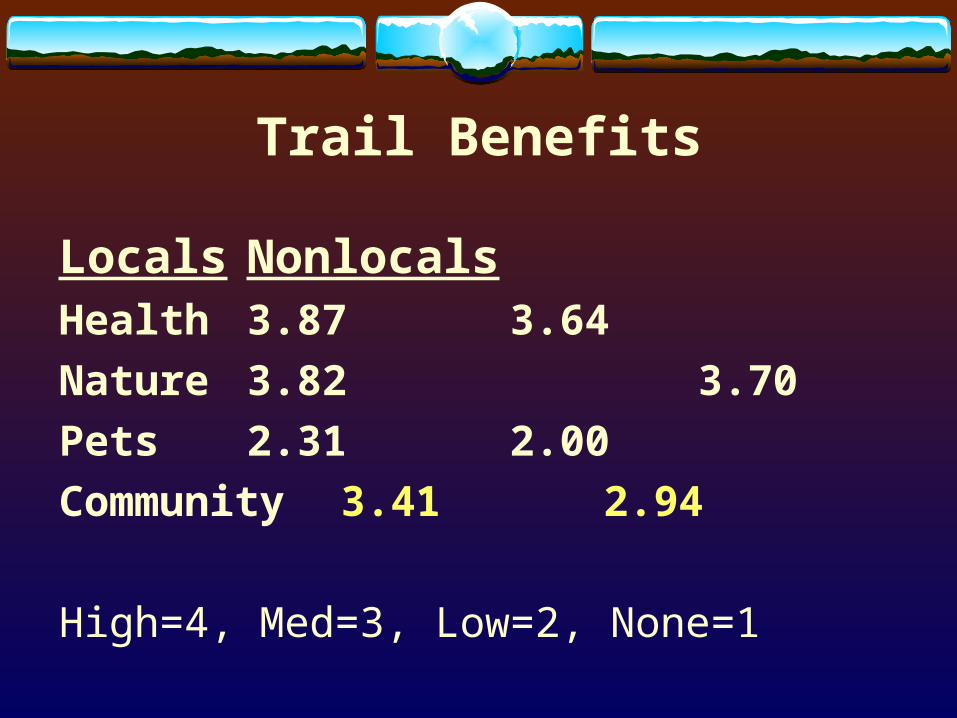
Trail Benefits
Locals NonlocalsHealth 3.87 3.64
Nature 3.82 3.70
Pets 2.31 2.00
Community 3.41 2.94
High=4, Med=3, Low=2, None=1

Trail Attributesfor Locals
Importance Condition
Safety 3.75 3.42
Scenery 3.83 3.67
Surface 3.59 3.19
Structure 3.72 3.40
High=4, Med=3, Low=2, None=1

Trail Attributesfor Nonlocals
Importance Condition
Safety 3.79 3.54
Scenery 3.86 3.76
Surface 3.51 3.44
Structure 3.55 3.60
High=4, Med=3, Low=2, None=1

Policy Questions Locals
NonlocalsMaintenance attract visitors 99 99User fee for maintenance 32 60Local taxes for maintenance 89 71Volunteers for maintenance 61 62Crowding affects trips neg. 40 33Paving trail 6.5 13
percent ‘strongly agree’ or ‘agree’

Management Issues
Locals NonlocalsAll Disabled All Disabled
Electric golf carts 3 44 <1 14Gas golf carts 1 12 <1 12Motorized bicycles 3 12 2 9Horse carts 11 9 12 10ATV’s 1 2 1 2
percent ‘strongly agree’ or ‘agree’ type of use
is allowed on VCT

Some Conclusions

Trail UseOver 130,000 visits annuallyOver 50,000 nonlocal person-tripsMajority of nonlocals are day usersPrimary purpose over nighters
15% of primary purpose nonlocal trips 11% of all nonlocal trips
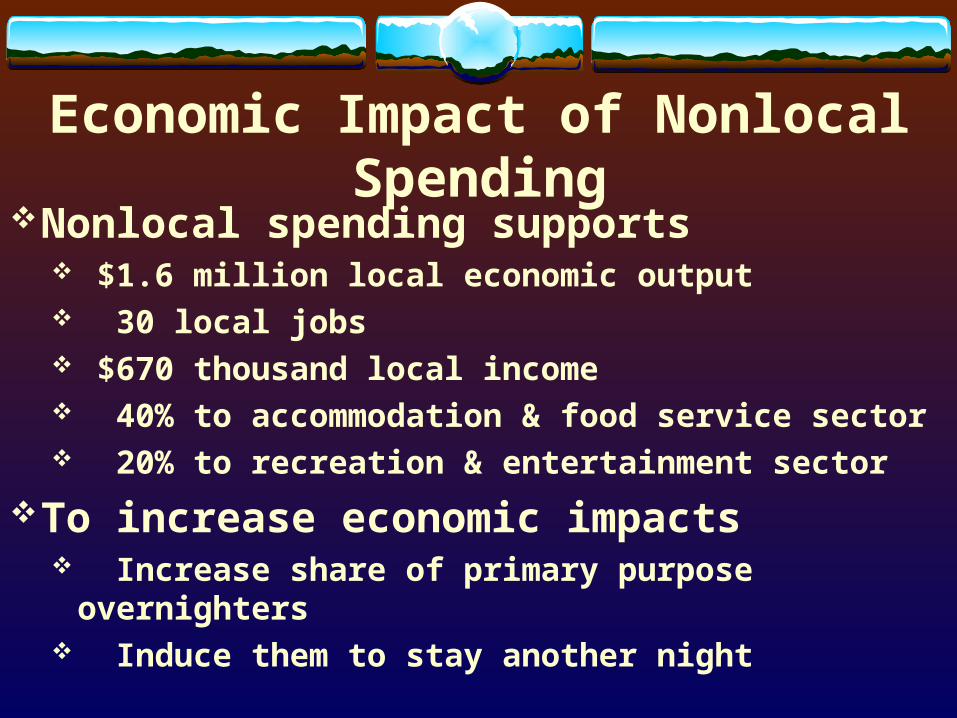
Economic Impact of Nonlocal SpendingNonlocal spending supports
$1.6 million local economic output 30 local jobs $670 thousand local income 40% to accommodation & food service sector 20% to recreation & entertainment sector
To increase economic impacts Increase share of primary purpose overnighters Induce them to stay another night
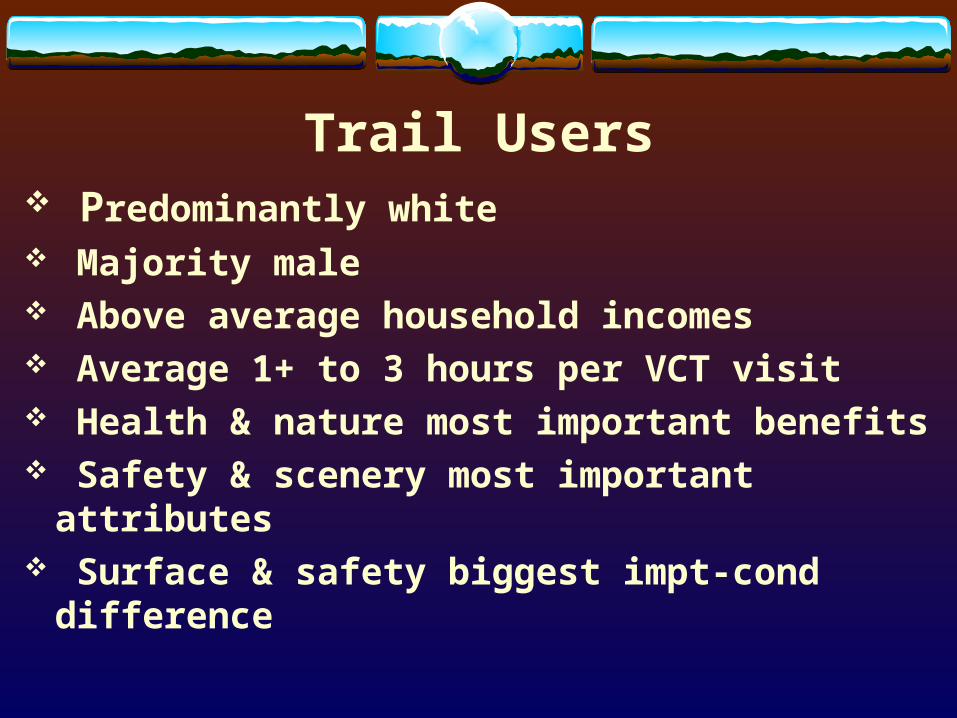
Trail Users Predominantly white Majority male Above average household incomes Average 1+ to 3 hours per VCT visit Health & nature most important benefits Safety & scenery most important attributes Surface & safety biggest impt-cond difference

Trail Users Maintenance important to attract visitors Locals favor taxes to fund maintenance Locals don’t support user fees Nonlocals support taxes, fees, volunteers Alternative uses of VCT have very low support But… Locals support elect golf carts for
disabled Don’t even think about paving the VCT

Stay tuned for the estimated economic benefits of taking a trip to the VCT
