the water holding capacity of the earth’s atmosphere is governed by the clausius-clapeyron (cc)...
TRANSCRIPT
The water holding capacity of the Earth’s atmosphere is governed by the Clausius-Clapeyron (CC) Law which states that there is approximately a 7% increase in atmospheric water vapor per degree rise in temperature. It has been an ongoing debate in the scientific community whether or not global rainfall should be increasing at the CC rate as a result of global warming. In a recent paper, Lau and Wu (2011) address the above question by examining oceanic rainfall distribution ranked by rain rates, using TMI (microwave) and PR (radar) rainfall data from the Tropical Rainfall Measuring Mission (TRMM) for the period 1998-2009. The geographic locations of light, moderate, and heavy rains (Fig.1), defined by the bottom 5% (B5), the inter-quartile range (I25) and the top 10% (T10), indicate that moderate and heavy rains are confined to SST warmer than 27o C. The joint probability distributions with cloud top temperature and radar-echo-top height (Fig. 2) show that B5 rain is primarily associated with warm, low cloud, I25 with mixed-phase precipitation, middle to high clouds, and T10 with high clouds and ice-phase precipitation. Both TMI and PR (Fig. 3) show that heavy rains (>50-70 percentile) have a super-CC sensitivity with extreme heavy rains (top 5%) exhibiting 80-90% increase per degree rise in SST. In contrast, light and moderate rains which account for 30-50% of the tropical rainfall amount show a reverse CC sensitivity, with 5-10% reduction per degree rise. The differences are related to changes in large-scale dynamics and tropical convection.
Earth Science_Atmospheres
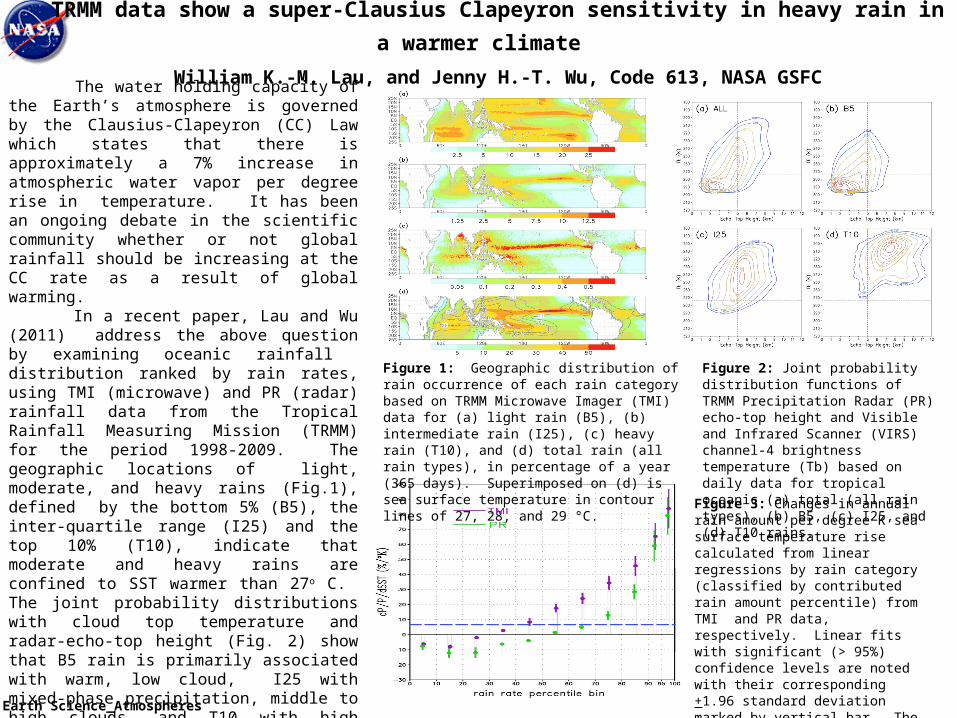
Figure 1: Geographic distribution of rain occurrence of each rain category based on TRMM Microwave Imager (TMI) data for (a) light rain (B5), (b) intermediate rain (I25), (c) heavy rain (T10), and (d) total rain (all rain types), in percentage of a year (365 days). Superimposed on (d) is sea surface temperature in contour lines of 27, 28, and 29 °C.
Figure 2: Joint probability distribution functions of TRMM Precipitation Radar (PR) echo-top height and Visible and Infrared Scanner (VIRS) channel-4 brightness temperature (Tb) based on daily data for tropical oceanic (a) total (all rain types), (b) B5, (c) I25, and (d) T10 rains.
Figure 3: Changes in annual rain amount per degree K sea surface temperature rise calculated from linear regressions by rain category (classified by contributed rain amount percentile) from TMI and PR data, respectively. Linear fits with significant (> 95%) confidence levels are noted with their corresponding +1.96 standard deviation marked by vertical bar. The 7% CC sensitivity is indicated by the blue dashed line.
TRMM data show a super-Clausius Clapeyron sensitivity in heavy rain in a warmer climate
William K.-M. Lau, and Jenny H.-T. Wu, Code 613, NASA GSFC

Name: William K.-M. Lau, NASA/GSFC, Code 610 E-mail: [email protected] Phone: 301-614-6332
References:Lau, K.-M., and H.-T. Wu , 2011: Climatology and changes in tropical oceanic rainfall characteristics inferred from Tropical Rainfall Measuring Mission (TRMM) data (1998–2009), Journal of Geophysical Research, 116, D17111, doi:10.1029/2011JD015827.Lau, K. M., and H. T. Wu, 2007: Trends in tropical rainfall characteristic, 1979-2003. International Journal of Climatology, 27, 979-988, doi:10.1002/joc.1454.
Data Sources: TRMM Science Data and Information System; The Hadley Center monthly SST.
Technical Description of Figures:Figure 1: Light (bottom 5%, B5) rain events dominate the rain occurrence and are found over the large expanses of tropical and subtropical oceans. Intermediate (25th to 75th percentile, I25) rain events occur mostly over the warm pool regions and account for the major rain amount contribution. The tight spatial gradient for heavy rain (top 10%, T10) is consistent with the close connection between organized deep convection and large-scale dynamics, in addition to the control of warm pool.Figure 2: Light rain events are associated with low and warm cloud tops. Intermediate rain dominate the rain occurrence and are found over the large expanses of tropical and subtropical oceans. Intermediate rain is contributed by a wide range of middle and mixed-phase rain. The top 10% heavy rain occupies a regime of cold cloud tops and elevated echo top heights, predominantly associated with deep convection and ice phase ice phase precipitation. Figure 3: This image shows the sensitivity of the rate of change in rain amount of different rain types to the change in tropical mean SST. Based on their contributed rain amount, the daily rain events for the period from 1998 through 2009 have been separated into 11 categories (with bin 1 being the lightest rain, and bin 11, the heaviest). The percentage change of rain amount of different rain types (bins) to SST changes (dP/P/dSST), or rainfall sensitivity is then computed based on linear regression of the slope of the changes as a function of SST for each rain bin. Both TMI (in purple) and PR (in green) analyses indicate positive rainfall sensitivity for moderate-heavy to very-heavy rain (the last 6 bins), and negative sensitivity for light-to-moderate rain (the first 3 bins). Except for the transition zone around the 20–40 percentile rainrate (bins 3 and 4) for TMI and 30–60 percentile (bins 4–6) for PR, all calculated rainfall sensitivities are significant to the 95% confidence levels. Note that rain amount of the most extreme rain events (bin 11, top 5% in contributed rain amount) is nearly double (80 to 90 % increase) per degree SST increase.
Scientific significance: This research represents a best effort approach to use a variety of TRMM products to study climate change. Results show that even a chronological trend in total rainfall is absent in the relatively short term TRMM data record (12 years), useful information regarding possible changes in rainfall characteristics with respect to sea surface temperature (SST) may be inferred from TRMM data. We find that rainfall sensitivity to tropical mean SST is strongly dependent on rain types. Heavy rains are highly sensitive to temperature, with 80-90% increase per degree rise in SST, while light and moderate rains show negative sensitivity with 5-10% reduction per degree SST rise. Many climate scientists believe that precipitation is governed by the same theoretical Clausius Clapeyron (CC) relationship for water vapor and temperature, implying that there is approximately a 7% increase in precipitation per degree rise in temperature. However, our results indicate that because of large-scale dynamics feedback for different types of rainfall, the CC relationship is not an appropriate constraint for precipitation changes in a warmer climate.
Relevance for future science and relationship to Decadal Survey: This research would serve as a benchmark for future extended analyses into the Global Precipitation Measurement (GPM) mission timeframe. The GPM mission will further expand the rainfall products to a global domain with improved sampling and detection for mid-latitude rain systems, including solid precipitation.
Earth Science_Atmospheres