thecb strategic plan for the fiscal years 2007-11 period
TRANSCRIPT
AGENCY STRATEGIC PLAN
For the Fiscal Years 2007-2011 Period
By
The Texas Higher Education Coordinating Board
Submitted June 23, 2006
Texas Higher Education Coordinating Board P.O. Box 12788
Austin, TX 78711 (512) 427-6101
http://www.thecb.state.tx.us
Texas Higher Education Coordinating Board 2007-2011 Agency Strategic Plan
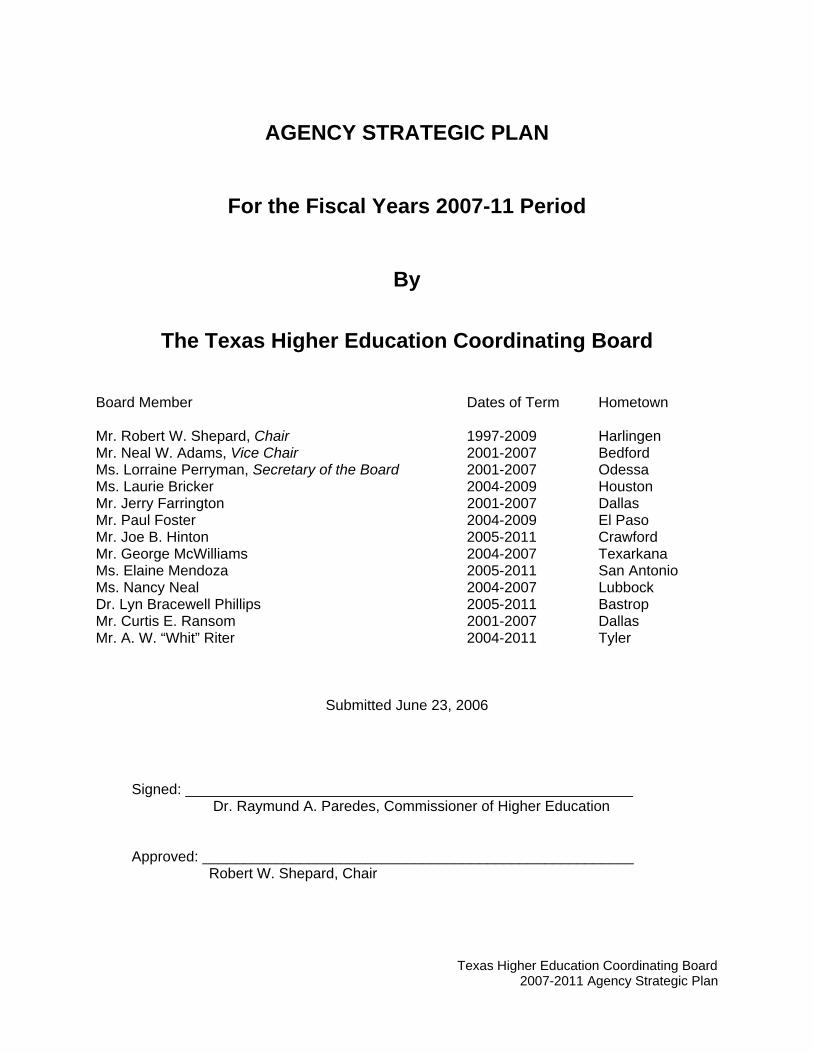
AGENCY STRATEGIC PLAN
For the Fiscal Years 2007-11 Period
By
The Texas Higher Education Coordinating Board
Board Member Dates of Term Hometown Mr. Robert W. Shepard, Chair 1997-2009 Harlingen Mr. Neal W. Adams, Vice Chair 2001-2007 Bedford Ms. Lorraine Perryman, Secretary of the Board 2001-2007 Odessa Ms. Laurie Bricker 2004-2009 Houston Mr. Jerry Farrington 2001-2007 Dallas Mr. Paul Foster 2004-2009 El Paso Mr. Joe B. Hinton 2005-2011 Crawford Mr. George McWilliams 2004-2007 Texarkana Ms. Elaine Mendoza 2005-2011 San Antonio Ms. Nancy Neal 2004-2007 Lubbock Dr. Lyn Bracewell Phillips 2005-2011 Bastrop Mr. Curtis E. Ransom 2001-2007 Dallas Mr. A. W. “Whit” Riter 2004-2011 Tyler
Submitted June 23, 2006
Signed: _______________________________________________________ Dr. Raymund A. Paredes, Commissioner of Higher Education Approved: _____________________________________________________ Robert W. Shepard, Chair

Texas Higher Education Coordinating Board 2007-2011 Agency Strategic Plan
Texas Higher Education Coordinating Board 2007-2011 Agency Strategic Plan
Table of Contents STATEWIDE STATEMENTS OF PURPOSE............................................... 1 Vision of Texas State Government .............................................. 1 Mission of Texas State Government ............................................ 2 Philosophy of Texas State Government ....................................... 2 Statewide Priority Goal for Higher Education ............................... 3 State-Level Benchmarks for Higher Education............................. 3 AGENCY STATEMENTS OF PURPOSE..................................................... 9 Mission of the Coordinating Board ............................................... 9 Philosophy of the Coordinating Board.......................................... 9 AGENCY STATEMENT OF DIRECTION..................................................... 10
A Vision for Texas Higher Education: Closing the Gaps........................ 10 Supporting the Vision: The Texas Higher Education Coordinating Board......................................................... 11 Major Statutory Responsibilities ................................................... 12 Legislative Activities and Trends .................................................. 13 Legislative Impact on Participation and Success ......................... 14 Legislative Impact on Excellence and Research .......................... 17
External/Internal Assessment ................................................................ 19 The Challenges Ahead................................................................. 19 Partners in Creating a College-Going Culture .............................. 19 Achieving Closing the Gaps Goals: Opportunities and Threats.... 21 Other Opportunities and Threats to the Coordinating Board’s Success ............................................................. 39 AGENCY STATEMENTS OF IMPACT Objectives and Outcome Measures, Strategies and
Output, Efficiency, and Explanatory Measures ............... 43
Appendices Appendix A Agency Planning Process ............................................ A-1 Appendix B Organizational Chart .................................................... B-1 Appendix C Five-Year Projections for Outcomes ............................ C-1 Appendix D Performance Measure Definitions................................ D-1 Appendix E Workforce Plan............................................................. E-1 Appendix F Survey of Organizational Excellence Results and Utilization Plans....................................................... F-1 Appendix G Workforce Development System Strategic Plan .......... G-1 Appendix H Historically Underutilized Business Plan ...................... H-1 Appendix I Current Year Activities ................................................. I-1 Appendix J Closing the Gaps by 2015 ............................................ J-1
1 Texas Higher Education Coordinating Board 2007-2011 Agency Strategic Plan
STATEWIDE STATEMENTS OF PURPOSE
Required elements and presentation format instructions for the Texas Higher Education Coordinating Board’s Strategic Plan are provided in Pathway to Prosperity: The Statewide Strategic Planning Elements for Texas State Government from the Legislative Budget Board and the Governor’s Office of Budget, Planning and Policy each biennium. Required state agency strategic plans cover a five-year period that begins approximately two months after submission. The internal process used at the Coordinating Board for developing its Strategic Plan is provided in Appendix A. The Texas Higher Education Coordinating Board also engages in planning outside of this strategic planning process, such as through the development, adoption, and implementation of Closing the Gaps by 2015, the state’s higher education plan, and other efforts. This section of the Coordinating Board’s Strategic Plan begins with the vision, mission and philosophy1 of statewide government as provided by the Governor’s Office. This section concludes with a table providing linkages to Closing the Gaps goals and strategies, state benchmarks for higher education, and agency strategies. Vision of Texas State Government Priority goals for Texans:
• Assuring open access to an educational system that not only guarantees the basic core knowledge necessary for citizenship, but also emphasizes excellence and accountability in all academic and intellectual undertakings;
• Creating and retaining job opportunities and building a stronger economy that will
lead to more prosperity for our people, and a stable source of funding for core priorities;
• Protecting and preserving the health, safety and well-being of our citizens by
ensuring healthcare is accessible and affordable, and our neighborhoods and communities are safe from those who intend us harm; and
• Providing disciplined, principled government that invests public funds wisely and
efficiently. 1 The vision, mission and philosophy of Texas state government are provided in Pathway to Prosperity: The Statewide Strategic Planning Elements for Texas State Government.

2 Texas Higher Education Coordinating Board 2007-2011 Agency Strategic Plan
Mission of Texas State Government Texas state government must be limited, efficient, and completely accountable. It should foster opportunity and economic prosperity, focus on critical priorities, and support the creation of strong family environments for our children. The stewards of the public trust must be men and women who administer state government in a fair, just, and responsible manner. To honor the public trust, state officials must seek new and innovative ways to meet state government priorities in a fiscally responsible manner. Aim high . . .we are not here to achieve inconsequential things! Philosophy of Texas State Government The task before all state public servants is to govern in a manner worthy of this great state. We are a great enterprise, and as an enterprise we will promote the following core principles:
• First and foremost, Texas matters most. This is the overarching, guiding principle by which we will make decisions. Our state, and its future, is more important than party, politics, or individual recognition.
• Government should be limited in size and mission, but it must be highly effective in performing the tasks it undertakes.
• Decisions affecting individual Texans, in most instances, are best made by those individuals, their families, and the local government closest to their communities.
• Competition is the greatest incentive for achievement and excellence. It inspires ingenuity and requires individuals to set their sights high. Just as competition inspires excellence, a sense of personal responsibility drives individual citizens to do more for their future and the future of those they love.
• Public administration must be open and honest, pursuing the high road rather than the expedient course. We must be accountable to taxpayers for our actions.
• State government has a responsibility to safeguard taxpayer dollars by eliminating waste and abuse, and providing efficient and honest government.
Finally, state government should be humble, recognizing that all its power and authority is granted to it by the people of Texas, and those who make decisions wielding the power of the state should exercise their authority cautiously and fairly.
3 Texas Higher Education Coordinating Board 2007-2011 Agency Strategic Plan
Statewide Priority Goal for Higher Education To prepare individuals for a changing economy and workforce by:
• providing an affordable, accessible, and quality system of higher education; and
• furthering the development and application of knowledge through teaching, research, and commercialization.
State-Level Benchmarks for Higher Education State-level priorities have been defined in Pathway to Prosperity: The Statewide Strategic Planning Elements for Texas State Government. Operational definitions of measures associated with the state-level priorities are provided in Appendix D. Sources of data that are used (or derived) to serve as output measures are described with agency goals and objectives in a separate section of this document. Projected outcomes for 2007-2011 are provided in Appendix C. The state-level benchmarks for higher education include:
• Percent of recent high school graduates enrolled in a Texas public college or university
• Percent of first-time, full-time freshmen returning after one academic year • Percent of first-time, full-time freshmen who graduate within four years • Percent of first-time, full-time freshmen who graduate within six years • Percent of two-year college students who transfer to four-year institutions • Percent of two-year transfer students who graduate from four-year institutions • Percent decrease in number of students requiring developmental education • Percent of population age 24 and older with vocational/technical certificates as
highest level of educational attainment • Percent of population age 24 and older with two-year college degree as highest
level of educational attainment • Percent of population age 24 and older with four-year college degree as highest
level of educational attainment • Number of baccalaureate graduates in science, technology, engineering, and
mathematics • Percent of M.D. graduates remaining in Texas for residency • Percent of nursing graduates employed or enrolled in nursing graduate programs
in Texas • Texas public colleges’ and universities’ cost per student as a percentage of the
national average • Percent change in average tuition over past biennium • Number of students receiving grants from the TEXAS grants programs • Percent of total federal research and development expenditures received by
Texas institutions of higher education
4 Texas Higher Education Coordinating Board 2007-2011 Agency Strategic Plan
• Percent increase in research and development expenditures in emerging technologies over previous biennium
• Number of patents obtained in emerging technologies • Number of patents obtained by institutions of higher education that are
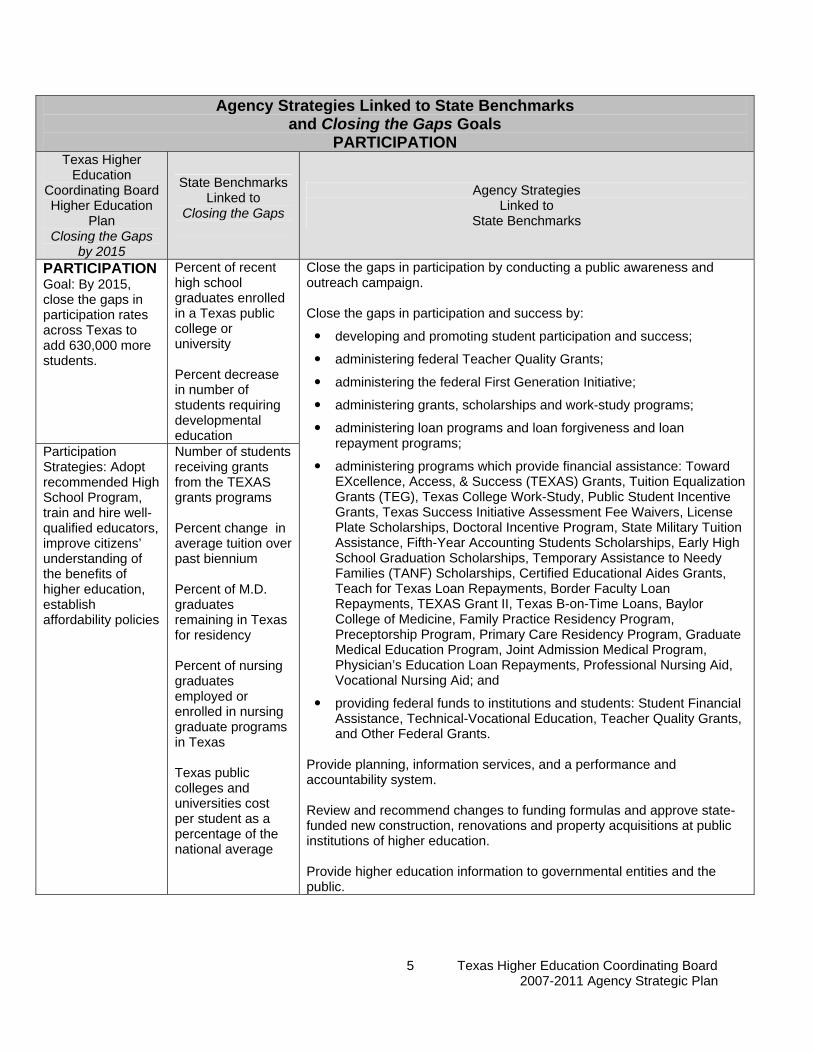
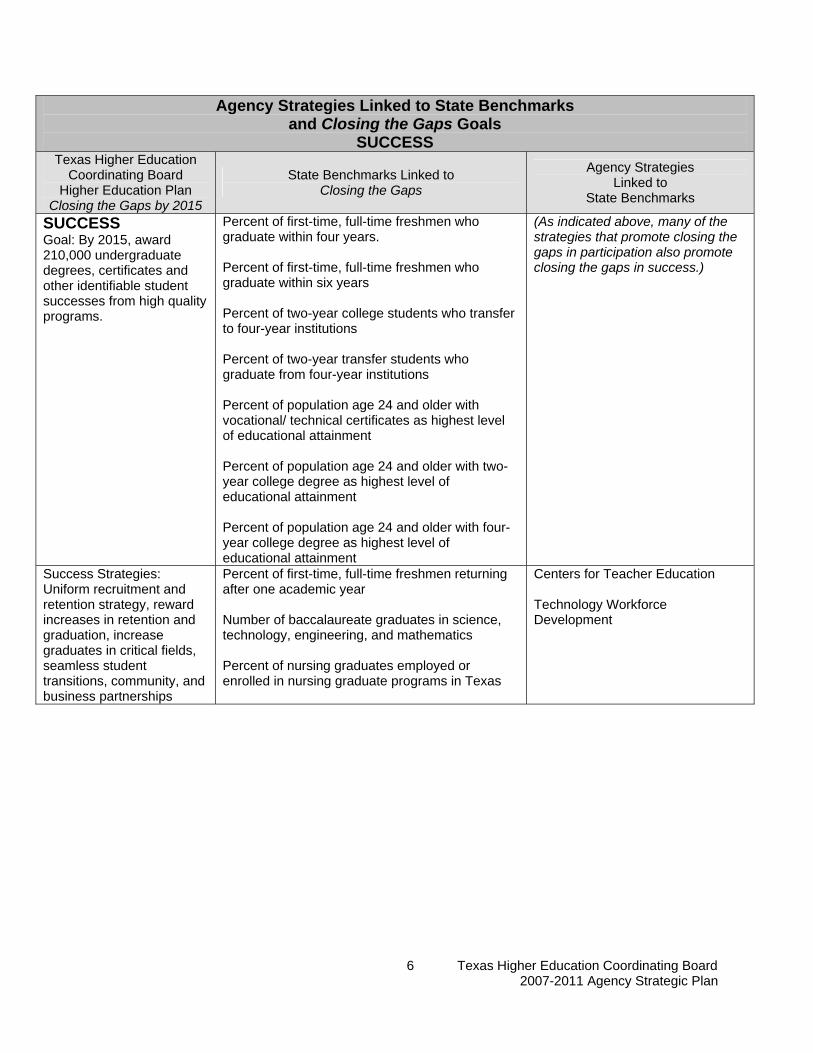
commercialized. These benchmark elements have evolved over time to reflect public policy emphases. Accordingly, these priorities may require information for which no current means of collecting supporting data exist. In such cases, the best available proxies must be found until directly applicable data can be generated. The following table aligns the state-level benchmarks identified above with agency strategies and the goals of Closing the Gaps by 2015, the state’s higher education plan (Appendix J). These agency strategies are provided in context with agency objectives and performance measures in the Agency Statement of Impact section of this document (immediately prior to the first appendix).
5 Texas Higher Education Coordinating Board 2007-2011 Agency Strategic Plan
Agency Strategies Linked to State Benchmarks and Closing the Gaps Goals
PARTICIPATION Texas Higher
Education Coordinating Board Higher Education
Plan Closing the Gaps
by 2015
State Benchmarks Linked to
Closing the Gaps
Agency Strategies Linked to
State Benchmarks
PARTICIPATION Goal: By 2015, close the gaps in participation rates across Texas to add 630,000 more students.
Percent of recent high school graduates enrolled in a Texas public college or university Percent decrease in number of students requiring developmental education
Participation Strategies: Adopt recommended High School Program, train and hire well-qualified educators, improve citizens’ understanding of the benefits of higher education, establish affordability policies
Number of students receiving grants from the TEXAS grants programs Percent change in average tuition over past biennium Percent of M.D. graduates remaining in Texas for residency Percent of nursing graduates employed or enrolled in nursing graduate programs in Texas Texas public colleges and universities cost per student as a percentage of the national average
Close the gaps in participation by conducting a public awareness and outreach campaign. Close the gaps in participation and success by: developing and promoting student participation and success; administering federal Teacher Quality Grants; administering the federal First Generation Initiative; administering grants, scholarships and work-study programs; administering loan programs and loan forgiveness and loan
repayment programs; administering programs which provide financial assistance: Toward
EXcellence, Access, & Success (TEXAS) Grants, Tuition Equalization Grants (TEG), Texas College Work-Study, Public Student Incentive Grants, Texas Success Initiative Assessment Fee Waivers, License Plate Scholarships, Doctoral Incentive Program, State Military Tuition Assistance, Fifth-Year Accounting Students Scholarships, Early High School Graduation Scholarships, Temporary Assistance to Needy Families (TANF) Scholarships, Certified Educational Aides Grants, Teach for Texas Loan Repayments, Border Faculty Loan Repayments, TEXAS Grant II, Texas B-on-Time Loans, Baylor College of Medicine, Family Practice Residency Program, Preceptorship Program, Primary Care Residency Program, Graduate Medical Education Program, Joint Admission Medical Program, Physician’s Education Loan Repayments, Professional Nursing Aid, Vocational Nursing Aid; and
providing federal funds to institutions and students: Student Financial
Assistance, Technical-Vocational Education, Teacher Quality Grants, and Other Federal Grants.
Provide planning, information services, and a performance and accountability system. Review and recommend changes to funding formulas and approve state-funded new construction, renovations and property acquisitions at public institutions of higher education. Provide higher education information to governmental entities and the public.
6 Texas Higher Education Coordinating Board 2007-2011 Agency Strategic Plan
Agency Strategies Linked to State Benchmarks and Closing the Gaps Goals
SUCCESS Texas Higher Education
Coordinating Board Higher Education Plan
Closing the Gaps by 2015
State Benchmarks Linked to Closing the Gaps
Agency Strategies Linked to
State Benchmarks
SUCCESS Goal: By 2015, award 210,000 undergraduate degrees, certificates and other identifiable student successes from high quality programs.
Percent of first-time, full-time freshmen who graduate within four years. Percent of first-time, full-time freshmen who graduate within six years Percent of two-year college students who transfer to four-year institutions Percent of two-year transfer students who graduate from four-year institutions Percent of population age 24 and older with vocational/ technical certificates as highest level of educational attainment Percent of population age 24 and older with two-year college degree as highest level of educational attainment Percent of population age 24 and older with four-year college degree as highest level of educational attainment
(As indicated above, many of the strategies that promote closing the gaps in participation also promote closing the gaps in success.)
Success Strategies: Uniform recruitment and retention strategy, reward increases in retention and graduation, increase graduates in critical fields, seamless student transitions, community, and business partnerships
Percent of first-time, full-time freshmen returning after one academic year Number of baccalaureate graduates in science, technology, engineering, and mathematics Percent of nursing graduates employed or enrolled in nursing graduate programs in Texas
Centers for Teacher Education Technology Workforce Development
7 Texas Higher Education Coordinating Board 2007-2011 Agency Strategic Plan
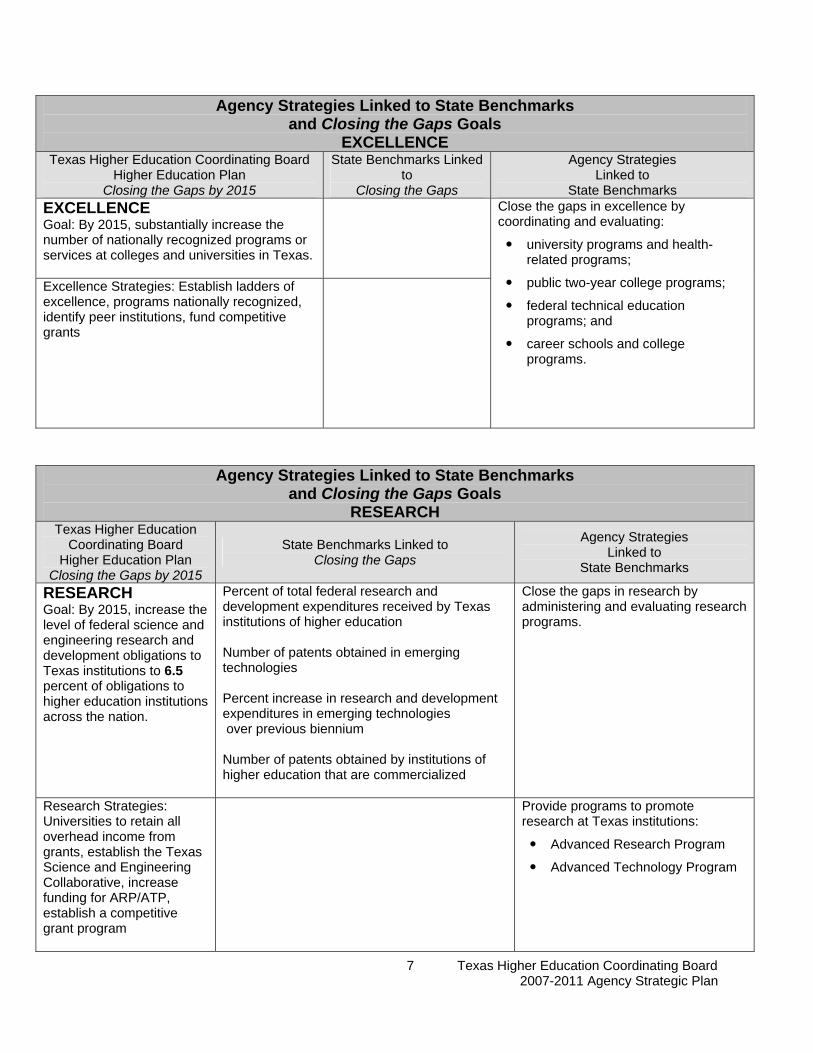
Agency Strategies Linked to State Benchmarks and Closing the Gaps Goals
EXCELLENCE Texas Higher Education Coordinating Board
Higher Education Plan Closing the Gaps by 2015
State Benchmarks Linked to
Closing the Gaps
Agency Strategies Linked to
State Benchmarks EXCELLENCE Goal: By 2015, substantially increase the number of nationally recognized programs or services at colleges and universities in Texas.
Excellence Strategies: Establish ladders of excellence, programs nationally recognized, identify peer institutions, fund competitive grants
Close the gaps in excellence by coordinating and evaluating: university programs and health-
related programs; public two-year college programs; federal technical education
programs; and career schools and college
programs.
Agency Strategies Linked to State Benchmarks and Closing the Gaps Goals
RESEARCH Texas Higher Education
Coordinating Board Higher Education Plan
Closing the Gaps by 2015
State Benchmarks Linked to Closing the Gaps
Agency Strategies Linked to
State Benchmarks
RESEARCH Goal: By 2015, increase the level of federal science and engineering research and development obligations to Texas institutions to 6.5 percent of obligations to higher education institutions across the nation.
Percent of total federal research and development expenditures received by Texas institutions of higher education Number of patents obtained in emerging technologies Percent increase in research and development expenditures in emerging technologies over previous biennium Number of patents obtained by institutions of higher education that are commercialized
Close the gaps in research by administering and evaluating research programs.
Research Strategies: Universities to retain all overhead income from grants, establish the Texas Science and Engineering Collaborative, increase funding for ARP/ATP, establish a competitive grant program
Provide programs to promote research at Texas institutions: Advanced Research Program Advanced Technology Program
8 Texas Higher Education Coordinating Board 2007-2011 Agency Strategic Plan
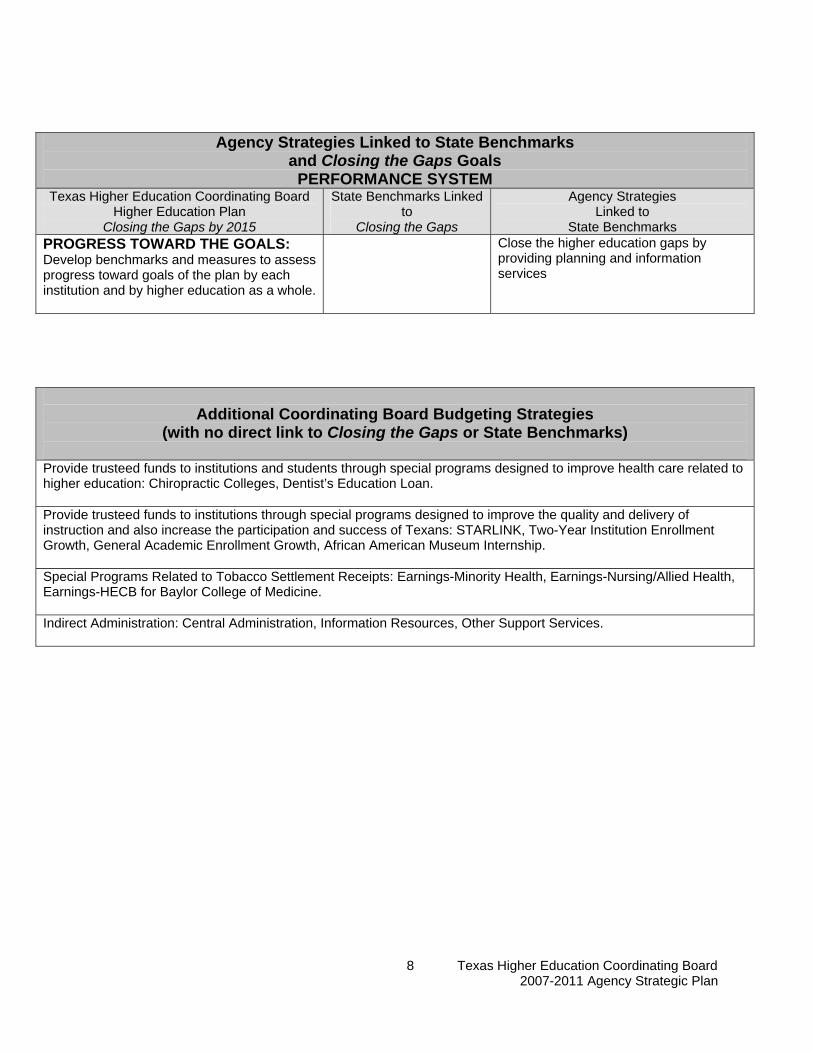
Agency Strategies Linked to State Benchmarks and Closing the Gaps Goals
PERFORMANCE SYSTEM Texas Higher Education Coordinating Board
Higher Education Plan Closing the Gaps by 2015
State Benchmarks Linked to
Closing the Gaps
Agency Strategies Linked to
State Benchmarks PROGRESS TOWARD THE GOALS: Develop benchmarks and measures to assess progress toward goals of the plan by each institution and by higher education as a whole.
Close the higher education gaps by providing planning and information services
Additional Coordinating Board Budgeting Strategies
(with no direct link to Closing the Gaps or State Benchmarks)
Provide trusteed funds to institutions and students through special programs designed to improve health care related to higher education: Chiropractic Colleges, Dentist’s Education Loan. Provide trusteed funds to institutions through special programs designed to improve the quality and delivery of instruction and also increase the participation and success of Texans: STARLINK, Two-Year Institution Enrollment Growth, General Academic Enrollment Growth, African American Museum Internship. Special Programs Related to Tobacco Settlement Receipts: Earnings-Minority Health, Earnings-Nursing/Allied Health, Earnings-HECB for Baylor College of Medicine. Indirect Administration: Central Administration, Information Resources, Other Support Services.
9 Texas Higher Education Coordinating Board 2007-2011 Agency Strategic Plan
AGENCY STATEMENTS OF PURPOSE The Agency Strategic Plan Instructions define an agency’s mission as “the reason for an agency’s existence” and the agency’s philosophy as “the expression of core values and principles for the conduct of the agency in carrying out its mission.” This section provides the current mission and philosophy of the Coordinating Board.2 Mission of the Coordinating Board The Texas Higher Education Coordinating Board’s mission is to work with the Legislature, Governor, governing boards, higher education institutions and other entities to help Texas meet the goals of the state’s higher education plan, Closing the Gaps by 2015, and thereby provide the people of Texas the widest access to higher education of the highest quality in the most efficient manner. Philosophy of the Coordinating Board The Texas Higher Education Coordinating Board will promote access to quality higher education across the state with the conviction that access without quality is mediocrity and that quality without access is unacceptable. The Board will be open, ethical, responsive, and committed to public service. The Board will approach its work with a sense of purpose and responsibility to the people of Texas and is committed to the best use of public monies. The Coordinating Board will engage in actions that add value to Texas and to higher education. The agency will avoid efforts that do not add value or that are duplicated by other entities.
2 As published in the Agency Strategic Plan for the Fiscal Years 2005-2009 by Texas Higher Education Coordinating Board, June 2005.

10 Texas Higher Education Coordinating Board 2007-2011 Agency Strategic Plan
Agency Statement of Direction
A Vision for Texas Higher Education: Closing the Gaps
Every Texan educated to the level necessary to achieve his or her dreams; no one is left behind, and each can pursue higher education; colleges and universities focus on the recruitment and success of students while defining their own paths to excellence; education is of high quality throughout; and all levels of education, the business community, and the public are constant partners in recruiting and preparing students and faculty who will meet the state’s workforce and research needs.
Source: Closing the Gaps, by 2015: The Texas Higher Education Plan, 2000. Education has never been more important for the future of Texas and its people, no matter where they live. People with more education tend to earn much higher incomes, help build and sustain strong communities and economies, have a higher quality of life, and are better prepared to contribute to an increasingly global society. And yet, despite promising efforts, Texas remains far behind many other states in education outcomes, and educational gaps continue to exist among its people and regions. Clearly, Texas must close these gaps to ensure a brighter future for all the people of the state. Texas is projected to experience substantial population growth (see map), yet higher education enrollment may not keep the state’s college-going rate at current levels. If this trend materializes, workforce educational levels will be insufficient to attract and retain the businesses and industries that offer the best jobs. The state’s total annual household income will drop, perhaps by as much as an estimated $60 billion annually by 2040. The need for social and government services would grow as tax revenue falls, and inadequate support for a vibrant economy would reduce the quality of life for all Texans. To prevent that undesirable outcome, higher education participation and success rates for all Texans will have to rise more rapidly than ever to avoid a decline in educational levels. In response, Texas higher education is answering this challenge with a plan, called Closing the Gaps by 2015. Closing the Gaps lays out four goals: to close the gaps – both within the state and
11 Texas Higher Education Coordinating Board 2007-2011 Agency Strategic Plan
between Texas and other states – in student participation, student success, excellence, and research.
Since Closing the Gaps’ adoption by the Coordinating Board in 2000, the plan has been widely accepted and supported across the state. Sustained and diligent efforts to promote and support the plan are needed continually to ensure its success – especially as personnel changes occur in leadership and other key positions in the higher education community.
Closing the Gaps is a dynamic plan. The participation and success goals were revised in October 2005 to reflect revised population figures released by the Texas State Data Center. The research goal was changed to focus on improvement relative to other states.
The Revised Closing the Gaps’ four goals are:
• Close the Gaps in Participation – By 2015, close the gaps in participation rates across Texas to add 630,000 more students.
• Close the Gaps in Success – By 2015, award 210,000 undergraduate degrees, certificates and other identifiable student successes from high quality programs.
• Close the Gaps in Excellence – By 2015, substantially increase the number of nationally recognized programs or services at colleges and universities in Texas.
• Close the Gaps in Research – By 2015, increase the level of federal science and engineering research and development obligations to Texas institutions to 6.5 percent of obligations to higher education institutions across the nation.
Supporting the Vision: The Texas Higher Education Coordinating Board Created by the Texas Legislature in 1965 to ensure quality and efficiency in public higher education, the Texas Higher Education Coordinating Board works closely with the state’s higher education institutions, public education entities, businesses, community groups, and others to achieve the goals of Closing the Gaps. The Board is currently comprised of 13 members from all geographic regions of the state who are appointed to overlapping six-year terms by the Governor and confirmed by the Texas Senate. Membership will be reduced to nine appointees by the end of Fiscal Year 2007, as required by the 78th Legislature. The Board meets quarterly in Austin. Board members appoint a Commissioner of Higher Education as the chief executive officer for the agency, which has 299.9 authorized full-time (FTE) positions, plus an additional 30 that are federally funded. The Commissioner acts as the state’s chief expert on higher education, making recommendations and carrying out higher education initiatives on behalf of the Board.
12 Texas Higher Education Coordinating Board 2007-2011 Agency Strategic Plan
Achievement of the Closing the Gaps’ goals is the agency’s central mission. To better support that mission, the agency was reorganized in early 2005 into two units that mirror the elements of Closing the Gaps: Participation and Success, and Academic Excellence and Research. (The agency’s organizational chart is provided in Appendix B.) The Participation and Success Unit consists of two divisions: Outreach and Success, and Student Services. The Academic Excellence and Research Unit consists of two divisions: Planning and Accountability, and Academic Affairs and Research. The Coordinating Board also actively monitors and encourages institutional progress toward the goals of Closing the Gaps and other significant performance measures through its Higher Education Accountability System. The Accountability System, first developed in 2004 through a Governor’s Executive Order, includes targeted levels of performance for institutional groups. This system, described below in the Peer and Benchmark Systems section, tracks institutions’ progress toward improvement and efficiency. Major Statutory Responsibilities Most of the Coordinating Board’s statutory authority is found in Title 3, Chapter 61 of the Texas Education Code (TEC). TEC 61.002(a) directs the Coordinating Board to “provide leadership and coordination for the Texas higher education system, institutions, and governing boards, to the end that the State of Texas may achieve excellence for college education of its youth through the efficient and effective utilization and concentration of all available resources and the elimination of costly duplication in program offerings, faculties, and physical plants.”
To meet these broad obligations to all of the people of Texas, the Board’s wide range of statutory duties include:
• Develop and update the state’s higher education plan, Closing the Gaps by 2015. • Review and recommend changes in formulas for allocating legislative
appropriations to higher education institutions. • Approve institutions’ requests for new academic programs to meet academic
needs, ensure quality, and eliminate unnecessary duplication. • Approve and monitor postsecondary technical/vocational educational programs
and adult vocational education offerings.
• Administer Carl Perkins federal grant funds for the purpose of improving workforce education, including inter-agency initiatives for cooperative administration of Tech-Prep and School-to-Work programs.
13 Texas Higher Education Coordinating Board 2007-2011 Agency Strategic Plan
• Collect, analyze, and report higher education data, undertake studies and develop recommendations for improving higher education.
• Report to the Legislature on policy issues and legislatively mandated issues. • Approve new construction, renovations, and property acquisitions funded with
state money at public institutions of higher education. • Prescribe changes in the roles and missions of public higher education
institutions. • Administer the state’s student financial aid programs, including the Toward
EXcellence, Access, & Success (TEXAS) Grant Program, the Texas B-On-Time Student Loan Program, and the Hinson-Hazlewood College Student Loan Program.
• Administer the Texas Success Initiative (TSI) to help ensure that new college
students have the reading, writing, and math skills they need to do college-level work.
• Administer state-funded competitive grants to Texas college and university
researchers for projects expected to enhance economic development in the state.
• Approve degree programs at career colleges and regulate unaccredited private
postsecondary institutions. These and other duties and responsibilities affect the state's public higher education community, which include students, faculty, administrators, and others at 35 universities, 50 community college districts, three state colleges, one technical college system, and nine health-related institutions. Texas also has a thriving private and independent higher education sector – including 37 independent senior colleges and universities, two junior colleges, one independent medical school, and 43 degree-granting private career colleges. The contributions of independent institutions are incorporated into Closing the Gaps. Legislative Activities and Trends Since Closing the Gaps by 2015 was adopted by the Coordinating Board in 2000, the Texas Legislature has passed a considerable amount of legislation to support it. The Legislature is aware of the importance of progress toward the plan’s goals, and of the financial commitment needed to achieve those goals. Closing the Gaps-related initiatives approved in earlier legislative sessions include
14 Texas Higher Education Coordinating Board 2007-2011 Agency Strategic Plan
funding the College for Texans public awareness and motivational campaign, the establishment of new financial aid programs for students, and a requirement that all students in public high schools be automatically enrolled in the college-preparatory Recommended High School Program. In spite of limited state resources, the 79th Texas Legislature increased total appropriations for higher education to $18 billion, up from $15.2 billion for the 2004-05 biennium. Lawmakers’ continued support for Closing the Gaps goals was evidenced by legislation to:
• Improve participation by creating and funding additional financial aid
programs, while holding students more accountable for the aid received; • Focus attention and funding on critically needed academic programs, such as
nursing; • Encourage students to successfully and expeditiously complete academic
programs by allowing institutions to charge more for excess hours and to give rebates for minimal hours taken; and
• Resume funding of the Advanced Research Program.
Much of this legislation delegates new duties and responsibilities to the Coordinating Board, continuing a long-term trend of assigning new activities to the Board and its staff with each regular legislative session. A detailed report of these and other legislative initiatives, including related Coordinating Board responsibilities, follows. Legislative Impact on Participation and Success Legislators recognized the state’s changing demographics and the need to bring more students into higher education to meet participation and success goals. As a result, the state’s five main financial aid programs were appropriated $657 million, a $172 million or 35 percent increase over the previous biennium. The Legislature also sought to improve college participation and success by expanding P-16 initiatives that support Texas students as they prepare for college and improving higher education efficiencies through incentives to reduce time-to-degree. Financial Aid
Funding for the TEXAS Grant Program was increased about $8 million to $331.7 million. Changes applicable to new TEXAS Grant recipients include:
• Eligibility for students enrolled in four-year degree programs ends on the 5th anniversary of the students’ initial awards, and
15 Texas Higher Education Coordinating Board 2007-2011 Agency Strategic Plan
• Students have to meet their institutions’ academic progress requirements at the end of their first year in the program, and thereafter complete a minimum of 24 hours per year with an overall grade point average of 2.5 on a 4.0 scale to continue their eligibility.
The Texas B-On-Time (BOT) Loan Program was appropriated about $20 million, which represents the amount of tuition set-aside required of the institutions under tuition deregulation legislation. The Coordinating Board anticipates leveraging the tuition set-aside into $100 million in funds from the Hinson-Hazlewood College Student Loan Program to support this program. Loans may be forgiven if the number of hours a student has completed when graduating with a bachelor's degree does not exceed the student’s degree program requirements by more than six hours, with some exceptions. Tuition Equalization Grants, available to qualified students at independent institutions, received an additional $71 million, increasing the biennial funding to $212 million. Eligibility for Tuition Equalization Grants to new recipients was changed in ways similar to the TEXAS Grant program. Also, students at independent institutions will not be eligible for TEXAS Grant after the fall 2005 semester. Those who currently receive both grants have limitations on the award amounts.
Texas Education Opportunity Grant is the new name of TEXAS Grant II, a change made to eliminate confusion with the TEXAS Grant program (described above). Academic progress requirements of the program are now equal those originally set for the TEXAS Grant program, and new provisions for continuing eligibility under hardship circumstances were added. The Texas College Work-Study (TCWS) Program was modified to allow general academic teaching institutions to use a portion of their TCWS funds to employ third-and fourth-year undergraduate students as mentors for undergraduate students who are on academic probation and funding was increased. Installment plan legislation allows institutions to apply a student’s financial aid toward the total amount of tuition and fees due and then to release the balance to the student. And finally, the Coordinating Board must to develop a comprehensive financial aid training program for public school counselors, employees of student financial aid offices, members of community-based organizations, and others.
P-16 Initiatives
The Higher Education Assistance Program requires the Coordinating Board to provide information to prospective students from high schools with college-going rates in the lowest 10 percent of all public high schools. Students will receive
16 Texas Higher Education Coordinating Board 2007-2011 Agency Strategic Plan
information and assistance with the admissions and application process and financial aid information. This expands a previous pilot program. The similar Higher Education Enrollment Assistance Program directs funding to students in three areas of the state with low college-going rates. Additional areas of the state may be included if funds are available.
Application for higher education was eased by requiring the creation of an electronic freshman Texas Common Application to be accepted at all public higher education institutions, with optional common paper applications for public two-year institutions. General academic teaching institutions already have a common application that prospective students are encouraged to complete online.
An Early College Education Program was established to 1) provide students at risk of dropping out of school or those who wish to accelerate completion of high school to complete the high school curriculum and up to two years of college credit within four or five years depending on the length of the program; 2) require articulation agreements between high schools and institutions of higher education to address curriculum design, instructional elements, calendar, courses, financial aid eligibility, enrollment and attendance, grading policies, and TAKS assessment. The recent Third Called Session of the 79th Legislature approved important measures that will strengthen the ties between public education and higher education. Those measures include: • Requiring school districts to implement programs which allow students to
earn the equivalent of at least 12 semester credit hours of college credit in high school, through the College Credit Program. Higher education institutions must assist school districts to develop and implement the programs, if requested.
• Requiring TEA to create a high school end-of-course assessment
instrument that might be used to determine the appropriate higher education placement for a student in a course of the same subject.
• Establishing vertical teams of faculty from public education and higher
education to develop college-readiness standards and to determine whether the high school curriculum adequately prepares students to meet college-readiness standards
• Adding a measure of student progress toward preparation for
postsecondary success to the TEA School District indicator system.
17 Texas Higher Education Coordinating Board 2007-2011 Agency Strategic Plan
• Mandating that the P-16 Council prepare a College Readiness and Success Strategic Action Plan to be approved by the Commissioner of Education and the Coordinating Board.
• Calling for the Coordinating Board to develop summer higher education
bridge programs in math, science, and English; and incentive programs that implement research-based, innovative developmental education initiatives.
Higher Education Efficiencies
Semester credit hours (SCH) required for the baccalaureate degree are limited to the minimum required by the Southern Association of Colleges and Schools (SACS), unless the institution determines that there is a compelling academic reason for requiring more hours. Institutions are permitted to charge higher tuition for repeated or excessive undergraduate hours (those in excess of 30 SCH beyond that required for a degree program).
Coordinating Board delegates are responsible for establishing a pilot program to encourage students to graduate in a timely manner using a contract with incentives between the institution and student.
Students graduating on time receive a tuition rebate if they graduate within four years for a four-year degree and within three hours of the SCH required for their degree. General academic institutions must provide students on-line progress reports which compare the courses taken and credit received to the courses required for degrees.
The Coordinating Board will implement a entry-level, lower-division academic course redesign project with a summary report to be prepared by 2011.
Legislative Impact on Excellence and Research To support Closing the Gaps goals in excellence and research, the Legislature passed bills to help allay critical field shortages in nursing and teaching, and adopted laws that encourage research and technology growth in critical Science, Technology, Engineering, and Mathematic (STEM) fields.
18 Texas Higher Education Coordinating Board 2007-2011 Agency Strategic Plan
Targeted Critical Fields Legislation to address the nursing shortage promotes innovation in nursing education through the regionalization of common administrative and instructional functions, interdisciplinary instruction, pooled or shared faculty, and new clinical instruction models to maximize use of existing resources and faculty. In addition, the Appropriations Act trustees to the Coordinating Board funds to increase nursing program graduates, timely graduation, and master's and doctoral programs graduates who become nursing program faculty. The Appropriations Act also directs the P-16 Council to oversee the implementation of the strategic plan to increase the number of certified teachers in Texas. The P-16 Council is co-chaired by the Commissioner of Education and the Commissioner of Higher Education, who each are allowed to appoint up to three additional members. The Executive Director of the Texas Workforce Commission is a member, and another member represents the Department of Rehabilitative Services. Research and Technology
Significantly, the Legislature appropriated $8 million for the Advanced Research Program (ARP). The ARP provides competitive, peer-reviewed grants for the scientific and engineering research projects of Texas higher education institutions’ faculty. It also provides state-of the-art research opportunities for students and helps attract and retain the best faculty. The Governor’s Office was approved to administer the Texas Emerging Technology Fund for research and development activities involving emerging technology industries. The fund will expedite innovation and commercialization, as well as increase higher education’s applied technology research capabilities.
19 Texas Higher Education Coordinating Board 2007-2011 Agency Strategic Plan
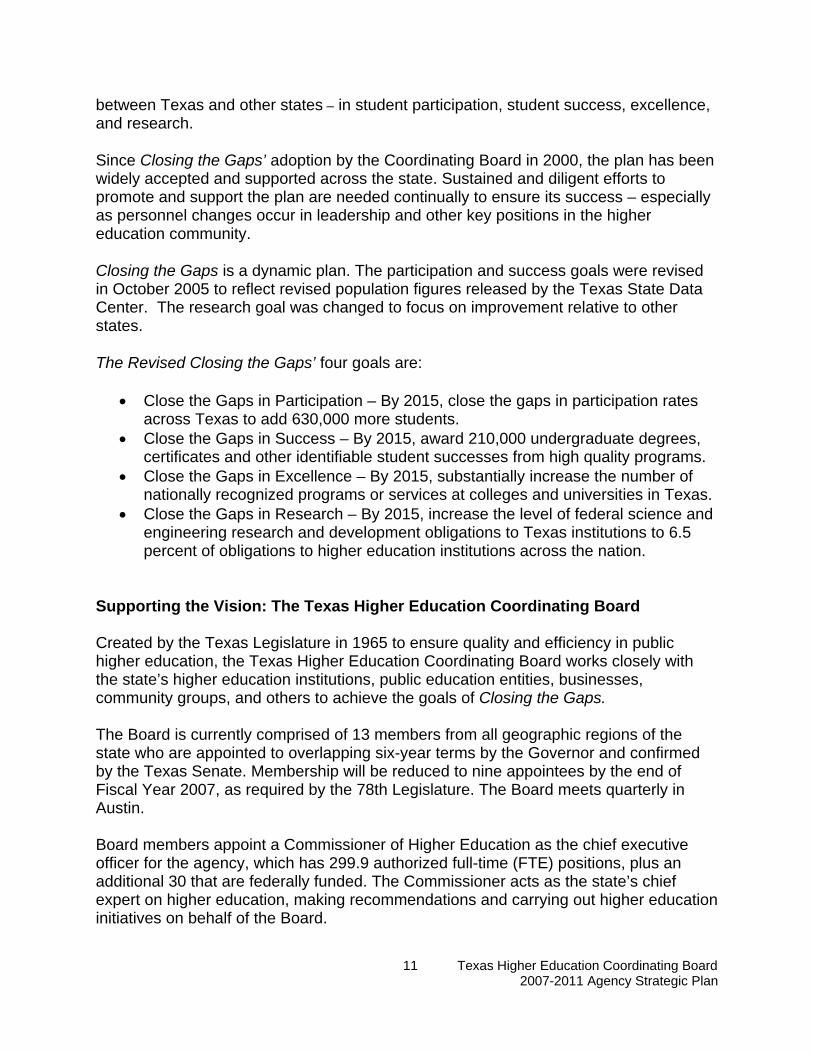
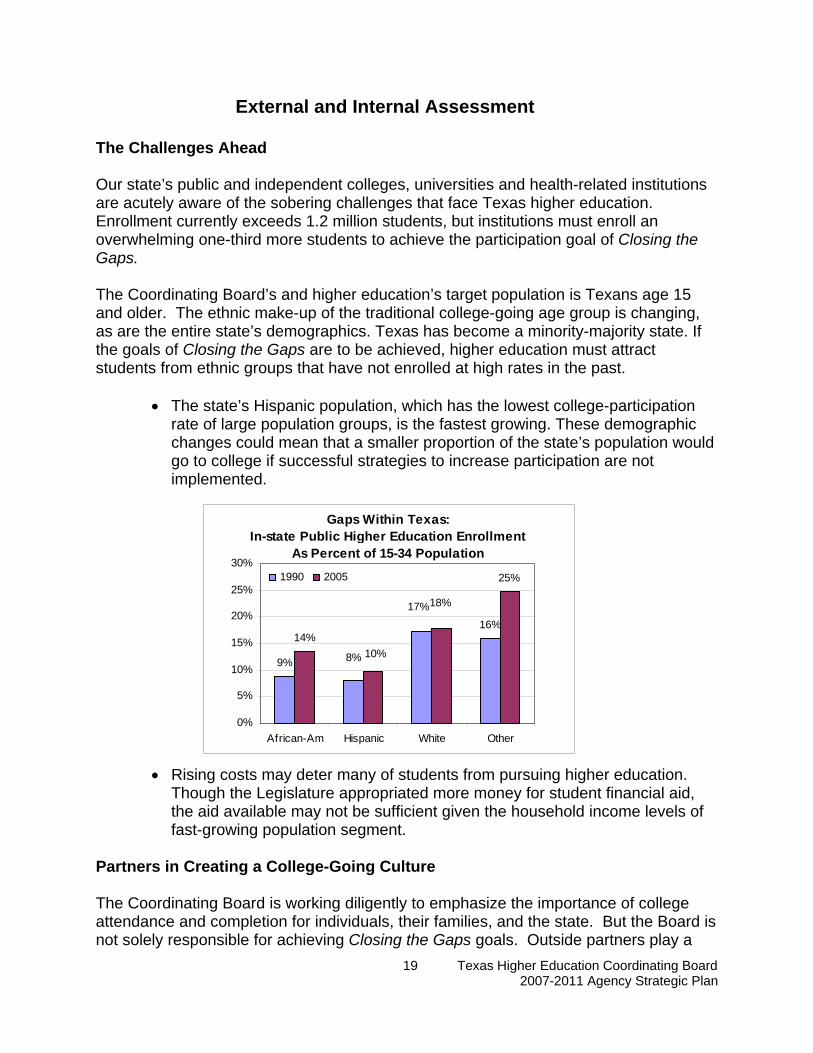
Gaps Within Texas:In-state Public Higher Education Enrollment
As Percent of 15-34 Population
9%
16%14%
25%
8%
17%
10%
18%
0%
5%
10%
15%
20%
25%
30%
African-Am Hispanic White Other
1990 2005
External and Internal Assessment The Challenges Ahead Our state’s public and independent colleges, universities and health-related institutions are acutely aware of the sobering challenges that face Texas higher education. Enrollment currently exceeds 1.2 million students, but institutions must enroll an overwhelming one-third more students to achieve the participation goal of Closing the Gaps.
The Coordinating Board’s and higher education’s target population is Texans age 15 and older. The ethnic make-up of the traditional college-going age group is changing, as are the entire state’s demographics. Texas has become a minority-majority state. If the goals of Closing the Gaps are to be achieved, higher education must attract students from ethnic groups that have not enrolled at high rates in the past.
• The state’s Hispanic population, which has the lowest college-participation rate of large population groups, is the fastest growing. These demographic changes could mean that a smaller proportion of the state’s population would go to college if successful strategies to increase participation are not implemented.
• Rising costs may deter many of students from pursuing higher education.
Though the Legislature appropriated more money for student financial aid, the aid available may not be sufficient given the household income levels of fast-growing population segment.
Partners in Creating a College-Going Culture The Coordinating Board is working diligently to emphasize the importance of college attendance and completion for individuals, their families, and the state. But the Board is not solely responsible for achieving Closing the Gaps goals. Outside partners play a
20 Texas Higher Education Coordinating Board 2007-2011 Agency Strategic Plan
critical role in creating a culture that supports students’ college aspirations. Critical participants include public education, institutions of higher education, and interested citizens in the business and volunteer communities. Public Education The public education system is vital for reaching higher education goals. By laying a strong foundation for future learning and instilling an interest in the further pursuit of knowledge, public schools play a critical role in preparing students for higher education. Actions by the 79th Legislature, Third Called Session, have reinforced this alliance.
• Together with public education, the Coordinating Board and higher education
institutions must work to improve the rigor of the senior year in high school and to align high school exit and college-readiness standards. Public education and higher education must work together to improve the college readiness of marginally prepared students and to increase the placement of well-prepared students in dual credit and advanced placement courses. One component of the new P-16 College Readiness and Success Strategic Action Plan is designed to decrease the number of students enrolling in developmental coursework in college.
In addition, TEA is to develop high school end-of-course assessment instruments may be used to determine the appropriate postsecondary placement of students in courses in the same subject.
• The Recommended High School Program, adopted in 1998, was a step in the
right direction for ensuring that high school graduates are college-ready, but even more rigorous requirements were needed to improve students’ prospects for college success. The 79th Legislature, Third Called Session, has called for the curriculum requirements for the recommended and advanced high school programs to include four courses in each subject of the foundation curriculum (English language arts, mathematics, science, and social studies) beginning with students who enter the ninth grade in AY 2007.
• The Coordinating Board and the Texas Education Agency now have the force of
legislation behind their efforts to create vertical teams for college readiness by discipline composed of university and community college faculty, along with high school, middle and elementary school teachers. Working together to ensure rigor throughout the educational pipeline, these teams can foster informed, effective professional development at all levels and strive to develop innovative pedagogical strategies to address the needs and interests of the increasingly diverse group of students who attend Texas’ educational institutions. The teams will also recommend standards and expectations of college readiness and evaluate the adequacy of current high school curriculum requirements to prepare students for college.
21 Texas Higher Education Coordinating Board 2007-2011 Agency Strategic Plan
• Go Centers have been established in 200 high schools and other locations around the state to offer academic counseling and financial aid information to prospective students.
Higher Education Institutions To expand access and improve success, our colleges and universities must reinvent much of what they do to achieve greater educational effectiveness and greater cost efficiency. While higher education requires adequate resources to fund projected growth, colleges and universities must devise ways to use state funding at commensurately higher levels of efficiency. Among the techniques being explored to improve efficiency are:
• Redesign large enrollment, introductory courses using information technology to reduce instructional costs.
• Improve use of facilities especially on weeknights, Fridays, weekends, and
during summer months.
• Expand work-study programs, which are cost effective because funding is shared by the employer and the state. These programs constitute only a tiny fraction of state financial aid even though work-study students tend to perform better academically than those on other types of financial aid.
Community Partners Achieving the goals of Closing the Gaps is predicated on the establishment of an active network of supportive community partners including local and regional P-16 Councils that can tailor educational strategies to area-specific needs and interests. The Coordinating Board has organized regional “conversations” where local leaders can exchange ideas and work together to develop a regional work plan to sustain and improve the participation and success of their students. Achieving Closing the Gaps Goals: Opportunities and Threats After the first five years of Closing the Gaps, Texas has made some progress in improving higher education participation, success, excellence, and research; however, on key indicators, Texas has not made nearly enough progress. The opportunities that will help and threats that will hinder achievement of Closing the Gaps goals during the 2007-2011 timeframe of this plan are presented below. The Coordinating Board planning process is provided in Appendix A.
22 Texas Higher Education Coordinating Board 2007-2011 Agency Strategic Plan
Closing the Gaps: Participation and Success The first two Closing the Gaps goals – directed at recruiting, retaining, and graduating more students – share many of the same opportunities and threats. This analysis looks at them together.
Goal 1: By 2015, close the gaps in participation rates across Texas to add 630,000 more students. Approximately 5.0 percent of the state’s population enrolled in higher education in 2000, compared to a national average of 5.9 percent. To raise the state’s participation rate to 5.7 percent – comparable to the participation rate today in some other large states – Texas will have to enroll 630,000 more students (above fall 2000 enrollment figures) in 2015. Goal 2: Close the Gaps in Success – By 2015, award 210,000 undergraduate degrees, certificates and other identifiable student successes from high quality programs. In addition to enrolling more students in college, Texas must also ensure the success of those students in college. Enrolling 630,000 more students annually suggests a proportionately similar increase in success rates – meaning at least a 80 percent increase in the number of degrees and certificates awarded and other indicators of success in college. A Closing the Gaps target calls for increasing the number of students earning bachelor’s degrees, associate’s degrees, and certificates from 116,000 in 2000 to 210,000 annually by 2015.
With its new organization and the urgency of making massive changes needed to achieve Closing the Gaps, the Coordinating Board is reexamining all agency activities and responsibilities to weigh their relevance to the plan. In all its endeavors, the Board is using its data resources to help explain and evaluate educational trends. The items in the opportunities and threats section appear as discrete listings; in reality, they are overlapping parts that affect the participation and success goals in four broad categories: student preparation, recruitment and retention, completion, and support services. Opportunities Related to Participation and Success Student Preparation The Recommended High School Program is now the standard (or “default”) curriculum for Texas public high school students. This more rigorous curriculum is designed tot improve the preparation of high school students for college and increase the number of students entering higher education. Although the first students who fall under this law have not yet graduated, the effects of the Recommended High School Curriculum are already seen in the number of Texas
23 Texas Higher Education Coordinating Board 2007-2011 Agency Strategic Plan
public high school students taking algebra. The percent of algebra takers grew from 80 percent of all 1997 high school graduates to 90 percent of all 2004 graduates. College enrollment data shows that in 1997 a total of 88 percent of high school graduates who immediately enrolled in college had taken algebra. By 2004, the comparable figure was slightly over 93 percent. Following action by the 79th Legislature in its Third Called Session, the Recommended Program must include four courses in each subject of the foundation curriculum (English language arts, mathematics, science, and social studies) for students who are ninth graders in fall 2007. Public School Coordination and Achieving College Readiness. The P-16 Council serves as a forum for the Commissioner of Higher Education, the Commissioner of Education, the Executive Director of the Texas Workforce Commission, and the Commissioner of the Department of Rehabilitative Services to meet regularly and discuss issues of common concern. In particular, the Commissioner of Higher Education and the Commissioner of Education have strengthened their cooperative efforts in working with state and national policymakers, public school and higher education leaders, and various business and educational organizations across Texas. The Commissioner of Education and the Commissioner of Higher Education are developing a plan for a new system of college-readiness indicators for every high school. This plan was supported by the Texas Legislature with passage of legislation during a special session on public school finance to support college-readiness standards. These college-readiness indicators will specify the knowledge and skills students need be successful in entry-level college credit courses. The first objective is to establish statewide college readiness standards by November 2006. Beyond completion of the standards, the action plan includes the following proposed objectives:
1. Review and alignment of K-12 curricula based on the Texas Essential Knowledge and Skills (TEKS) with the standards;
2. Review and alignment of the higher education developmental education courses
and core curricula with the standards; 3. Provision of greater access of high school students to advanced academic
programs while in public schools; 4. Development of plans and activities by local and regional P-16 Councils to create
a college-going culture; 5. Development of pre-service and in-service opportunities for educators to assure
that college-readiness standards are met and exceeded;
24 Texas Higher Education Coordinating Board 2007-2011 Agency Strategic Plan
6. Researching and determination of appropriate methodologies to assess student college readiness; and
7. Creation of a sound accountability system for college readiness in public
education and for persistence and timely graduation in higher education. Implicit in objectives 1 through 3 above is the expectation that faculty from K-12 and higher education will work together in vertical teams to ensure that the curricula in the major disciplines of English/Language Arts, mathematics, science, and social studies are aligned with the Coordinating Board-adopted college readiness standards. This will require work by local and regional P-16 Councils to bring together appropriate faculty workgroups from elementary schools, middle schools, high schools, two-year colleges, and universities within their respective regions to develop curricula based on Texas' college readiness standards. With the vertical alignment of K-12 TEKS-based curricula, developmental education courses, and "gateway" college credit courses in these disciplines, Texas students will be assured of successful participation in higher education. The objective of the college readiness plan is to have all Texas high school students "college ready" by 2012. Teacher Quality Professional Development Program emphasizes P-16 partnerships to provide professional development for teachers in core academic subject areas in high-need school districts. The Texas Education Agency and the Coordinating Board are required to develop a joint plan for awarding these grants. The TEA-THECB Requests For Proposals (RFPs) have focused on assisting mathematics and science teachers in grades 6-12 to become “highly qualified” as defined in the federal No Child Left Behind Act. It is expected that on-going joint Teacher Quality RFPs from TEA and THECB will continue with similar proposals. Another opportunity to increase the number of certified teachers is to expand the educational aide exemption program to independent institutions. This program, which covers tuition and some fees for education aides who enroll in college to become certified Texas teachers, has proven to be very success in public institutions and would undoubtedly be equally successful in independent institutions. Recruitment and Retention Strategic Plan for Creating a College-Going Culture is a statewide initiative to ensure students and parents understand the benefits of a college education and the steps necessary to prepare academically and financially for it. Originally implemented as the College for Texans campaign, the initiative is designed to increase successful student participation in higher education by an additional 430,000 Texas students over the 200,000 who enroll between 2000 and 2005. In July 2005, the Coordinating Board adopted a strategic plan focused on the Dallas-Fort Worth Metroplex, Gulf Coast area, and South Texas regions which are projected to
25 Texas Higher Education Coordinating Board 2007-2011 Agency Strategic Plan
have the highest population growth in the coming years. The purpose of this plan is to create and sustain a college-going culture in Texas that prepares all students for the academic rigor and discipline needed to enter and successfully participate in a college or university. The four strategies to accomplish this strategic mission and to further the original goals of the statewide public awareness and motivational campaign are:
• Educational Partnerships – Create/strengthen strong ongoing partnerships between local school districts and institutions of higher education;
• Community Involvement – Create, develop, and sustain a strong commitment to
a college-going culture within local communities; • Statewide Initiatives – Build strong relationships among state agencies and
statewide organizations to create support for the mission; and • Marketing and Evaluation – Market and evaluate outreach activities and
initiatives with respect to educational partnerships, community involvement, and statewide initiatives.
While the Coordinating Board will coordinate the activities and initiatives of this college-going strategic plan, its success is based on the decentralization of its activities and the capacity of local and regional P-16 Councils. Texas colleges and universities, public schools, business and industry, and local community-based organizations must strengthen their partnership activities to make certain that students and families understand the importance of a college education and receive the support needed for success in college. To implement the college-going strategic plan, the Coordinating Board has placed full-time P-16 field specialists in each of the three targeted areas with the responsibility of working with local constituencies to establish or strengthen local and regional P-16 Councils. In addition to the work of local and regional P-16 Councils, the Coordinating Board is working with state policymakers and other state agencies, especially TEA, to develop state policies that support local efforts to create a college-going culture from birth to high school and into adulthood. Much of that work is centered around a joint TEA-Coordinating Board plan to ensure students are college-ready. College-readiness standards will be adopted by the Coordinating Board and the Commissioner of Education in mid-2007, with alignment of curriculum along the P-16 educational pipeline at the local level. Through local and regional P-16 Councils, public school and college and university educators will work together to design English, math, science, and social studies curricula that are appropriately aligned to ensure all students who enter higher education will be successful. Introducing New Programs as Pilot Projects. Several pilot projects directly related to the strategies supporting the participation and success goals have been introduced. In one project, medical and dental school applicants who were denied professional school admission were contacted with the suggestion that they consider a career in teaching mathematics and science. In another pilot project, the Coordinating Board partnered
26 Texas Higher Education Coordinating Board 2007-2011 Agency Strategic Plan
with the Houston Community College System (HCCS) to identify HCCS students who transferred to public universities in Texas and subsequently qualified for associate’s degrees through courses completed at the university. The Uniform Recruitment and Retention Strategy calls for each institution to set enrollment and graduation goals that reflect its area’s population or the state depending on its primary service area. This requirement originally impacted only undergraduate programs, but was extended to include graduate, medical, and dental programs by the 79th Texas Legislature. The strategy’s purpose is to make higher education enrollment and graduation mirror the population of Texas. Beginning 2006, the Closing the Gaps by 2015 annual report will be linked to the Uniform Recruitment and Retention Strategy to give the Texas Legislature and other stakeholders a better understanding of the minority under-representation issue in Texas. During 2006-07, Coordinating Board staff will be refocusing its work with the institutions to ensure appropriate academic support from the institutions is in place to more aggressively address the goals of Closing the Gaps by 2015. This is to ensure institutions are appropriately engaging faculty and institutional academic leaders in all aspects of recruitment and retention of students from under-represented populations. Improvement of Developmental Education Success Rates is vital to keeping students in higher education and to achieving the Closing the Gaps success goal of awarding 210,000 undergraduate degrees and certificates from high-quality programs. Texas public institutions are expected to develop individualized programs to ensure the success of students. Additionally, the agency's efforts to improve developmental education success rates are part of a coordinated effort to meet the success goals of Closing the Gaps by 2015. The Coordinating Board is engaged in activities aimed at improving the quality of developmental education and the success of underprepared students. The Commissioner's November 2005 Summit, Ensuring Academic Excellence: Developing Strategies of Success Campus by Campus, served as a call to action for Texas’ education stakeholders. Over 400 chancellors, provosts, presidents, and other educational leaders from across Texas participated in the policy discussions. The Summit spurred many institutions to undertake new initiatives to promote college readiness and to improve the quality of developmental education programs. Only two months following the Summit, 12 colleges and universities had initiated new Summit-related projects designed to ensure academic excellence, to improve student preparedness and success, and to strengthen P-16 partnerships. The agency continues to promote these activities by supporting local initiatives, sharing new data analysis, professional developmental activities with developmental educators, and conducting regional forums. In concert, the Coordinating Board is engaged in the efforts of the P-16 Council's Subcommittee on Developmental Education to investigate the essential challenges of developmental education efforts across the state and formulate recommended state
27 Texas Higher Education Coordinating Board 2007-2011 Agency Strategic Plan
policy and initiatives to improve developmental education practice. In addition to this policy research, developmental education accountability measures are being added to the Higher Education Accountability System. The Board is also actively pursuing supplemental funding sources to promote quality developmental education demonstration projects and to provide advanced educational opportunities for developmental educators. TEA and the Coordinating Board are now required to adopt a college-readiness and success strategic plan designed to decrease the number of students enrolling in developmental coursework in college. Completion and Success Time-to-Degree. General academic teaching institutions are required to report to their governing boards on the length of time it took undergraduates to complete degrees and on institutional efforts to promote timely graduation. To assist with undergraduate time-to-degree reports, the Coordinating Board traced every student who earned a baccalaureate degree at a public general academic institution in FY 2004 back for 10 years (FY 1995-FY 2004). Their semester credit hours attempted and their fall and spring semesters attendance were recorded. The graduates were classified into broad fields based on their majors. The number of graduates by field, the average number of undergraduate credit hours attempted, and the average number of fall and spring semesters attended were calculated for each institution’s graduates. In a related effort, The University of Texas System has focused on time-to-degree as a measure that will be used to evaluate institutions’ presidents. The importance placed on this measure will ensure that institutional decisions on curricula and course availability will assist timely graduation. Tracking of Graduates. The Coordinating Board annually monitors the placements of community college graduates using the Automated Student and Adult Learner Follow-Up Systems (ASALFS) and manual follow-up for unlocated graduates. ASALFS is a component of the Texas Workforce Investment Council’s (TWIC) Strategic Plan. The Coordinating Board matches records of graduates with wage records received from the Texas Workforce Commission (TWC). A graduate is considered “placed” if he or she is employed (has a wage record), is pursuing further education, or has entered the military. To supplement the matched records, the Coordinating Board asks institutions to follow up on graduates who could not be found through the electronic matching of records. The placement rate for program graduates is calculated for a three-year period beginning one year after the student has graduated. The minimum standard for placement in Texas is 90 percent. Programs that have been approved for less than three years are exempt from the placement standard until three years of data becomes available.
28 Texas Higher Education Coordinating Board 2007-2011 Agency Strategic Plan
Support Services Information Access Initiative provides stakeholders in education with ready access to data from the Coordinating Board, the Texas Education Agency (TEA), and the State Board for Educator Certification for research, planning, and decision-making. Integrated databases, composed of historical to present data collections, support ad hoc query and reporting functions, allow for research including comparative and longitudinal analyses (by institution and statewide), and facilitate end-user access to formatted parameterized reports. The Information Access Initiative was initially proposed by the Coordinating Board with the goal to follow the progress of graduates from Texas public high schools through college graduation. The expanded scope, which now includes data from Pre-K through college graduation, resulted from legislative support for an active information partnership among the three participating agencies. The ongoing partnership between the agencies means data will extend from public colleges and universities down to Pre-K rather than to only high school graduates. A website known as the Texas Public Education Information Resource (TPEIR) is the face of the initiative and is the most comprehensive P-16 information system currently online in the United States. The public availability of this resource is vital to better understand student participation and success trends from pre-kindergarten through college. No other programs or projects in the state offer the potential benefits of this data sharing and analysis initiative. Development of other data resources and access is ongoing. The Texas workforce data, now shared with the Coordinating Board, were included in the follow-up of baccalaureate graduates for the Higher Education Accountability System. New data collections have been added: enrollment and graduation data from Texas career schools began in 2004. Online query capabilities are being expanded, with plans to include “drill-down” options and geographic presentations of data. The Coordinating Board intends to establish the Texas Higher Education Research Center that will produce comprehensive and objective analyses of critical higher education issues to help higher education officials, public education officials, community and business leaders, and legislators and other elected leaders make the most informed decisions for achieving the goals of Closing the Gaps by 2015. The Center will focus on converting research into policy. During the recent called legislative session, legislation authorized education research centers to conduct research on the impact of state and federal education programs, the performance of educator preparation programs, and best practices of school districts in classroom instruction, bilingual education, special language programs, and business practices. The state’s policymakers have been asking for a more comprehensive strategic approach to planning for higher education in Texas. Texas has no systematic and clearly objective process for strategic analysis of higher education issues as they relate specifically to our state – an effort focused on forward-thinking research and
29 Texas Higher Education Coordinating Board 2007-2011 Agency Strategic Plan
“connecting the dots” to inform policies that take the state’s education system where it must go. The Center would provide the capability for that strategic planning. The Priority Plan to Strengthen Education at Prairie View A&M University (PVAMU) and at Texas Southern University (TSU) is a six-year initiative to enhance and strengthen education by improving retention and graduation rates; adding unique, high-quality academic programs; and improving facilities, systems, and infrastructure necessary to deliver top quality educational services. The Priority Plan includes an implementation schedule, benchmarks for success, and cost estimates. The Legislature has appropriated $74.4 million to PVAMU and $68.8 million to TSU over the past three sessions. At the completion of the plan, the federal Office for Civil Rights (OCR) will determine if Texas has fulfilled its obligation under the Texas Commitment.3
Prairie View A&M University and Texas Southern University are required to work with the Coordinating Board and other parties to accomplish the goals of the Priority Plan and report their progress semiannually. The Coordinating Board is responsible for assisting the institutions as they implement the plan and must report progress to the OCR annually. Successful implementation of the Priority Plan is one of the targets identified in Closing the Gaps. Threats Related to Participation and Success Not surprisingly, most of the threats to improving higher education participation and success are economic. This is somewhat ironic because not achieving higher education participation rates has equally threatening economic consequences. As mentioned earlier in this document, the state’s total annual household income could drop by an estimated $60 billion annually by 2040 if the education level by underrepresented ethnic groups remains unchanged. Higher Education Affordability. The cost of attending college (tuition, fees, books, room and board, transportation) exceeded the financial resources available to Texas students by $1.2 billion in Fiscal Year 2004. The projected increases in the proportion of college-age students from groups that are often financially needy and steadily rising tuition and fees suggest that the difference between financial resources and the cost of attending college will continue to grow for the state’s students. Texas must eliminate or substantially reduce this discrepancy to meet the student participation and success goals of Closing the Gaps. The state must work to minimize tuition and fee increases, substantially increase financial aid, or do both.
• Tuition and fees. Closing the Gaps recognizes the need to maintain affordability in Texas higher education. Affordability depends on several factors, including the cost of tuition and fees and the amount of financial aid that is available to
3 The legal framework for addressing Office for Civil Rights concerns regarding Title VI of the Civil Rights Act of 1964.
30 Texas Higher Education Coordinating Board 2007-2011 Agency Strategic Plan
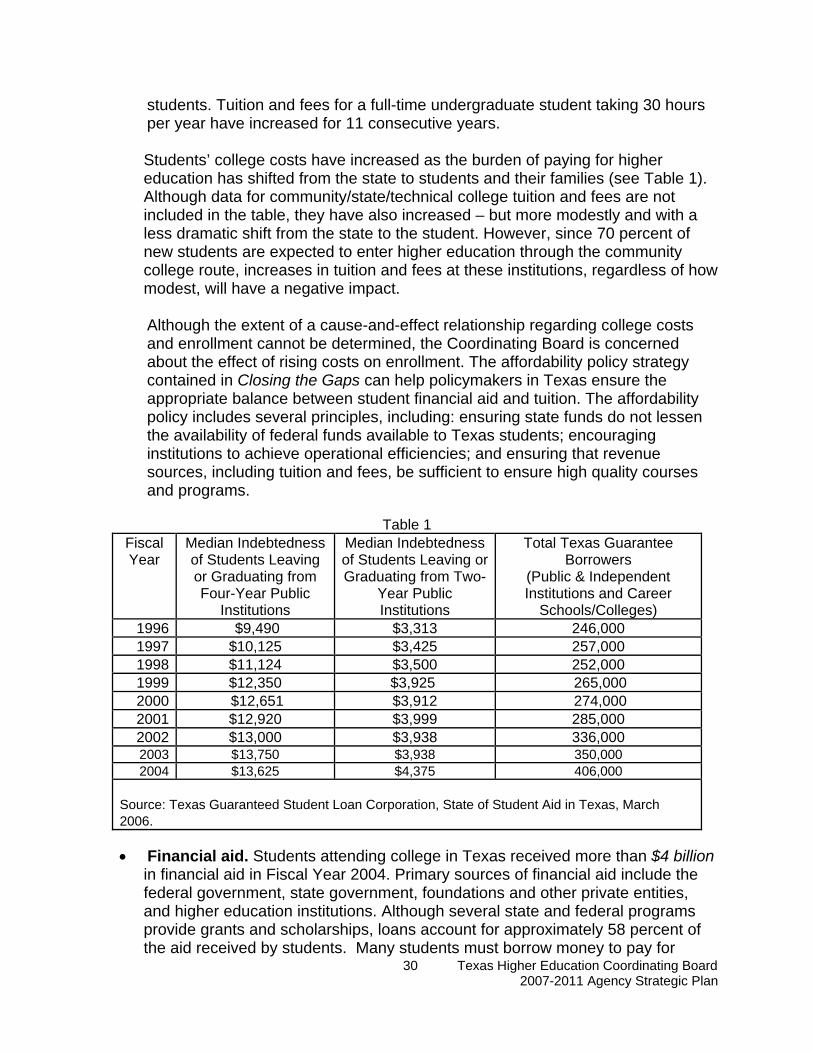
students. Tuition and fees for a full-time undergraduate student taking 30 hours per year have increased for 11 consecutive years. Students’ college costs have increased as the burden of paying for higher education has shifted from the state to students and their families (see Table 1). Although data for community/state/technical college tuition and fees are not included in the table, they have also increased – but more modestly and with a less dramatic shift from the state to the student. However, since 70 percent of new students are expected to enter higher education through the community college route, increases in tuition and fees at these institutions, regardless of how modest, will have a negative impact. Although the extent of a cause-and-effect relationship regarding college costs and enrollment cannot be determined, the Coordinating Board is concerned about the effect of rising costs on enrollment. The affordability policy strategy contained in Closing the Gaps can help policymakers in Texas ensure the appropriate balance between student financial aid and tuition. The affordability policy includes several principles, including: ensuring state funds do not lessen the availability of federal funds available to Texas students; encouraging institutions to achieve operational efficiencies; and ensuring that revenue sources, including tuition and fees, be sufficient to ensure high quality courses and programs.
Table 1
Fiscal Year
Median Indebtedness of Students Leaving or Graduating from Four-Year Public
Institutions
Median Indebtedness of Students Leaving or Graduating from Two-
Year Public Institutions
Total Texas Guarantee Borrowers
(Public & Independent Institutions and Career
Schools/Colleges) 1996 $9,490 $3,313 246,000 1997 $10,125 $3,425 257,000 1998 $11,124 $3,500 252,000 1999 $12,350 $3,925 265,000 2000 $12,651 $3,912 274,000 2001 $12,920 $3,999 285,000 2002 $13,000 $3,938 336,000 2003 $13,750 $3,938 350,000 2004 $13,625 $4,375 406,000
Source: Texas Guaranteed Student Loan Corporation, State of Student Aid in Texas, March 2006.
• Financial aid. Students attending college in Texas received more than $4 billion
in financial aid in Fiscal Year 2004. Primary sources of financial aid include the federal government, state government, foundations and other private entities, and higher education institutions. Although several state and federal programs provide grants and scholarships, loans account for approximately 58 percent of the aid received by students. Many students must borrow money to pay for
31 Texas Higher Education Coordinating Board 2007-2011 Agency Strategic Plan
higher education, leaving them with substantial debt as they leave college. Student debt burdens, particularly at the state’s public institutions, have risen substantially, as demonstrated above. Federal financial aid. Federal grant programs, including Pell Grants, Supplemental Educational Opportunity Grants, Leveraging Educational Assistance Grants, and Special Leveraging Educational Assistance Grants, provided $886.5 million – 59.6 percent of the gift aid (grants and scholarships) provided students in Texas in Fiscal Year 2004, or about 75 percent of all aid. State financial aid. The TEXAS Grant program, created in 1999, offers additional grants to academically prepared and financially needy Texas students. Recipients must have completed the Recommended or Distinguished High School Program (college-preparatory courses) in high school. Funds awarded through the program significantly increased from $20 million in Fiscal Year 2000 to $164 million in Fiscal Year 2003, but dropped to $157 million in Fiscal Year 2004. Approximately 60,048 students benefited from the program in Fiscal Year 2005. Funding for the program rose slightly to $332 million for the 2006-2007 biennium. The state’s Hinson-Hazlewood College Student Loan Program, also administered by the Coordinating Board, provides approximately $50 million in loans to approximately 8,000 students annually. The program, vital to the state because it ensures a continuing, stable source of financial aid for students, is funded through the sale of general obligation bonds authorized by the Texas Legislature and subsequently approved by Texas voters. Additionally, the Hinson-Hazlewood College Student Loan Program will have provided over $60 million in funding for Texas B-On-Time Loans to students by the end of FY 2006 and will provide an additional $60 million for B-On-Time loans to students in FY 2007. B-On-Time loans are forgiven for students who graduate “on time” with at least a 3.0 GPA; otherwise, they are loans that must be repaid but no interest is charged on the loans.
Community College Tax Bases. Community colleges are expected to enroll the majority of new students that will help the state meet its Closing the Gaps goals, placing a financial and capacity strain on most community college districts. Many community college districts might not have large enough tax bases to adequately support their enrollment growth. The state does not fund community colleges or building construction or maintenance. In 2004, only 30 of the state’s 50 community college districts would meet a statutory provision requiring a taxable property evaluation of at least $2.5 billion for the creation of a new community college district. Creation and Expansion of Higher Education Institutions. The Coordinating Board pursues its mission of coordinating the Texas higher education system through efficient and effective utilization of all available resources, including the elimination of costly duplication in program offerings, faculties, and physical plants. In 2003, the 78th Legislature authorized the expansion of Texas A&M University-Texarkana, the
32 Texas Higher Education Coordinating Board 2007-2011 Agency Strategic Plan
establishment of three System Centers (Texas A&M University-Kingsville System Center-San Antonio, the University of North Texas System Center at Dallas, and Tarleton State University System Center-Central Texas) as independent universities when they achieve specified full-time student enrollments. As he signed these bills into law, the Governor issued a statement expressing his concern that, to improve the quality of Texas higher education institutions, there must be firm accountability regarding the education which students and taxpayers can expect. He emphasized that any further increase in the number of institutions would dilute the resources which the state provides to higher education to an unacceptable level. Despite the Governor’s remarks, during the 2005 legislative session, the number of full-time-student equivalents (FTSE) required for Tarleton State University System Center-Central Texas to become a university was reduced from 2,500 FTSE to 1,000 FTSE. Texas A&M University-Kingsville System Center-San Antonio FTSE were similarly lowered if the entity receives tuition revenue bonds for construction of a facility. Carl D. Perkins Act Funding. Under the Bush Administration’s proposed budget for FY 2007-2008, programs funded through the federal Carl D. Perkins program would be eliminated. Although the same proposal was made for the 2004-2007 fiscal years, Congress continued to support Perkins Act funding. Elimination of Perkins funding would eliminate approximately $34 million in basic grants to the two-year colleges for improvement of workforce programs and support of students in these programs, approximately $8.4 million that the Coordinating Board administers for the development of Tech Prep programs to create formal linkages between secondary and postsecondary programs, and approximately $3 million that is awarded in competitive state leadership grants to the colleges. In addition, the Coordinating Board would lose approximately $1.2 million in related administrative funds. While the Bush Administration is supporting other legislation, such as the Jobs for the 21st Century Act, Texas might face a net loss in federal funding for Perkins-type activities in the state. While federal funds are directed through the Department of Labor and the Texas Workforce Commission, they are for short-term job training while Perkins funds through the Department of Education are directed to long-term workforce education like that which leads to associate’s degrees. Gender and Ethnic Imbalances. Closing the Gaps acknowledges the differences in college-going rates of different ethnic and racial groups in Texas. The participation rate for African-Americans has improved from 4.5 percent to 5.4 percent between 2000 and 2005, however the rate for Hispanics continues to lag. Their attendance did increase as a percentage of the estimated population, but only from 3.6 percent to 3.9 percent. With Hispanic population expected to increase by half in the next ten years, the Closing the Gaps targets for Hispanic participation will be increasingly difficult to achieve.
33 Texas Higher Education Coordinating Board 2007-2011 Agency Strategic Plan
Another troubling imbalance concerns the higher education participation of males. Males account for about half of all high school seniors, yet they account for only 45 percent of university undergraduates and 41 percent of community and technical college enrollees. The representation of African-American males is even lower 36 percent of African-American students in Texas public higher education. Hispanic males comprise 41 percent of their ethnic group’s enrollments. Underprepared Students. Efforts to improve delivery and results of developmental education programs, discussed earlier in this report, should not disguise the issue of student preparation. Higher education will continue to experience an economic drain and a hindrance to the delivery of quality offerings if students entering institutions are not adequately prepared to do college level work. Underprepared students are less likely than prepared students to complete degrees and certificates. As measured by indicators like time-to-degree and graduation rates, Texas institutions do not compare well with their peers in other states. To meet Closing the Gaps goals, Texas institutions must do a better job of remediating, retaining and advancing students to successful completions. The P-16 Schism. Just as there are opportunities related to the interaction of public education and higher education, the commissioners, and schools and institutions, there are difficulties caused by the organization and governance of education in Texas. As with any large scale enterprise, successful completion of the mission to education the citizens of Texas requires that all affected agencies and institutions acknowledge they must work together and value the contributions of all their educational partners. These partnerships are easier to talk about than to implement. The 79th Legislature in its Third Called Session recognized the need for public education and higher education to work more closely together by passing legislation that requires joint undertakings related to curriculum, calendars, assessment, and standards. Closing the Gaps: Excellence
Goal 3: Close the Gaps in Excellence – By 2015, substantially increase the number of nationally recognized programs or services at colleges and universities in Texas. The need for every institution to develop its greatest potential within its mission is a key Closing the Gaps concept for ensuring that higher education programs and services are provided in every part of the state. All institutions – of every level and type – contribute to the state’s economic, social, and cultural prosperity, and their contributions must be recognized and enhanced.
34 Texas Higher Education Coordinating Board 2007-2011 Agency Strategic Plan
Opportunities Related to Excellence
Peers and Benchmarks System. Texas has a variety of institutions with different missions to serve the different needs of the state’s population. These different missions must be recognized as institutions are held accountable for their performance in pursuit of closing the gaps in excellence. In fall 2005 and spring 2006, Coordinating Board staff met with peer groups of public universities that share similar characteristics, such as service to a population of students with similar needs. The peer groups chose at least two out-of-state group peers and two to three additional institution-specific out-of-state peers. The groups will work to identify best practices that will be most helpful in achieving the goals of Closing the Gaps. A procedure for grouping public two-year community colleges is being devised in coordination with the Texas Association of Community Colleges. In future meetings, the community college groups will identify methodologies for achieving Closing the Gaps targets.
Service as an Information Resource. The Coordinating Board is increasingly involved in statewide planning issues, as illustrated through the creation of Closing the Gaps, evaluation of the need for new professional schools, and collaboration with public schools on a more seamless education system in the state. The Board also takes seriously its role and responsibilities for providing accurate and reliable information and its service as a state resource for data and analyses of higher education issues. The Board has developed a regional plan that provides information and guidance to policymakers on current higher education services in each region and ideas on future needs. The plan is updated in the fall of even numbered years. As this and other planning efforts – such as Closing the Gaps – are developed, implemented, and evaluated, he Coordinating Board anticipates that the Legislature will continue its history of assigning an increasing number of duties and responsibilities to the agency.
Excellence Begins with Faculty. Highly qualified, talented faculty are the foundation of excellence. As part of its review of proposals for new degree programs, the Coordinating Board encourages institutions to employ appropriately educated, high-quality faculty. Additionally, funding formulas could be revised to reward institutions for hiring excellent faculty and offering outstanding degree programs. Texas should review its faculty salaries to ensure that the state becomes competitive in the national market for the best faculty.
Promote Statewide Excellence. Each public institution identified for the Coordinating Board areas in which national recognition has been achieved. To further recognize these and other exemplary contributions to one or more Closing the Gaps goals, the Coordinating Board established the Texas Higher Education Star Award in 2001. Each year, a maximum of 12 awards are made to institutions, organizations, groups, or individuals. In the first five years of the competition, 425 applications produced 73 finalists, from which 30 Star Awards recipients have been selected. The winners from 2005, the most recent competition, are listed in the table below.
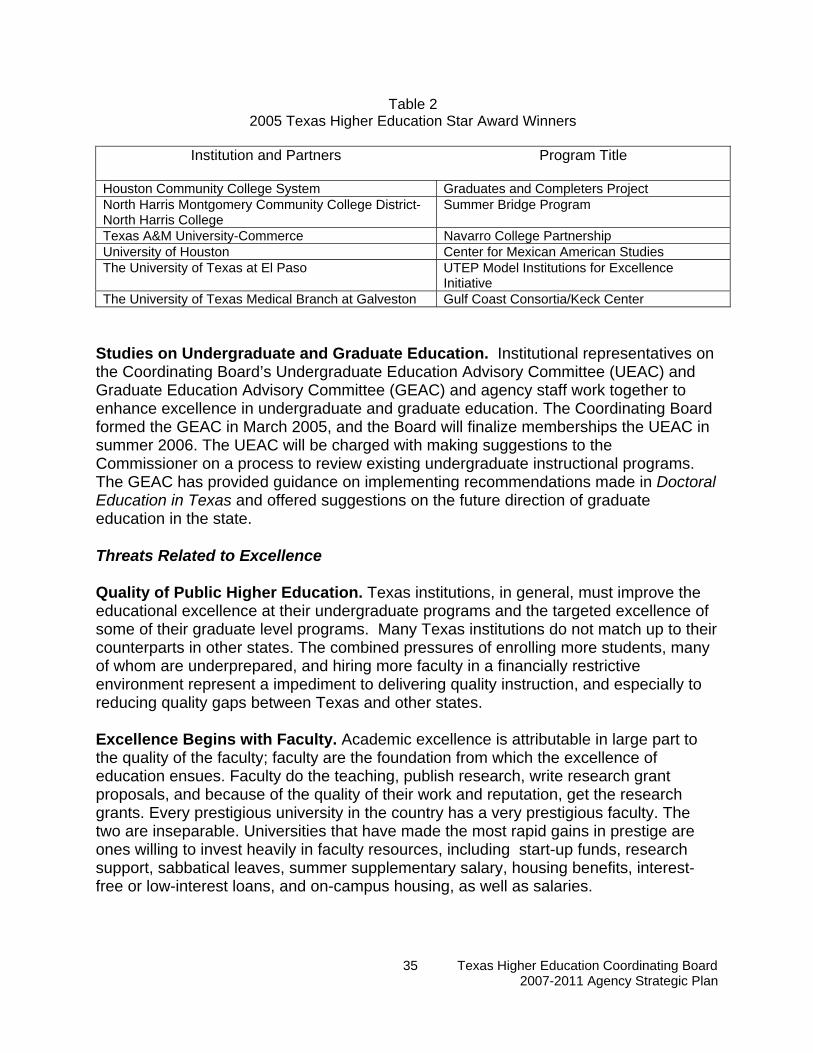
35 Texas Higher Education Coordinating Board 2007-2011 Agency Strategic Plan
Table 2 2005 Texas Higher Education Star Award Winners
Institution and Partners
Program Title
Houston Community College System Graduates and Completers Project North Harris Montgomery Community College District-North Harris College
Summer Bridge Program
Texas A&M University-Commerce Navarro College Partnership University of Houston Center for Mexican American Studies The University of Texas at El Paso
UTEP Model Institutions for Excellence Initiative
The University of Texas Medical Branch at Galveston Gulf Coast Consortia/Keck Center Studies on Undergraduate and Graduate Education. Institutional representatives on the Coordinating Board’s Undergraduate Education Advisory Committee (UEAC) and Graduate Education Advisory Committee (GEAC) and agency staff work together to enhance excellence in undergraduate and graduate education. The Coordinating Board formed the GEAC in March 2005, and the Board will finalize memberships the UEAC in summer 2006. The UEAC will be charged with making suggestions to the Commissioner on a process to review existing undergraduate instructional programs. The GEAC has provided guidance on implementing recommendations made in Doctoral Education in Texas and offered suggestions on the future direction of graduate education in the state.
Threats Related to Excellence
Quality of Public Higher Education. Texas institutions, in general, must improve the educational excellence at their undergraduate programs and the targeted excellence of some of their graduate level programs. Many Texas institutions do not match up to their counterparts in other states. The combined pressures of enrolling more students, many of whom are underprepared, and hiring more faculty in a financially restrictive environment represent a impediment to delivering quality instruction, and especially to reducing quality gaps between Texas and other states. Excellence Begins with Faculty. Academic excellence is attributable in large part to the quality of the faculty; faculty are the foundation from which the excellence of education ensues. Faculty do the teaching, publish research, write research grant proposals, and because of the quality of their work and reputation, get the research grants. Every prestigious university in the country has a very prestigious faculty. The two are inseparable. Universities that have made the most rapid gains in prestige are ones willing to invest heavily in faculty resources, including start-up funds, research support, sabbatical leaves, summer supplementary salary, housing benefits, interest-free or low-interest loans, and on-campus housing, as well as salaries.
36 Texas Higher Education Coordinating Board 2007-2011 Agency Strategic Plan
Institutions have to create research friendly environments, which include resources for laboratories, appropriate library facilities, competitive graduate student support – an area in which Texas lags far behind highly prestigious research institutions. National Academy Members. Faculty membership in the National Academy of Engineering, National Academy of Science and the Institute of Medicine contributes to institutional prestige. Texas higher education institutions combined have fewer members in the National Academies than the University of California-Berkeley. Institutions Operating Without Coordinating Board Authority. The Coordinating Board protects the public, including employers and prospective students, by requiring certain academic standards to be met before an institution – unless otherwise exempt – can offer degrees and other academic credentials to students in Texas. The growth of distance education opportunities has significantly increased access to higher education in the state, but it has also increased the ability of fraudulent or unaccredited institutions to enroll Texas students. As a result, the need to identify institutions that are operating illegally has become increasingly important. The Coordinating Board seeks to bring these entities into compliance, and, if necessary, documents their continued violations and pursues possible legal action against them. Institutions that violate the Board’s academic standards and offer degrees are subject to administrative penalties, civil penalties, criminal sanctions (misdemeanor), and injunctive relief. The Coordinating Board works closely with the Office of the Attorney General to enforce existing academic standards. Closing the Gaps: Research
Goal 4: Close the Gaps in Research – By 2015, increase the level of federal science and engineering research and development obligations to Texas institutions by 6.5 percent of obligations to higher education institutions across the nation. In 2003, Texas ranks fourth among the states in the amount of federal science and engineering research and development obligations funding it receives, and no Texas higher education institution ranks among the nation’s top 20 listings for federal research and development grants received. At least 10 institutions outside of Texas individually earn more intellectual property income – income generated by research discoveries and applications – than all Texas higher education institutions combined. More federal funds are needed to enhance research on the state’s higher education campuses.
Opportunities Related to Research Commitment by the Texas Legislature to Support Research. In surveys conducted by the National Science Foundation (NSF), Texas has ranked second among states in
37 Texas Higher Education Coordinating Board 2007-2011 Agency Strategic Plan
total research expenditures derived from state sources since 1999. From 1972 to 1998, Texas ranked first in state funding for research. The 79th Texas Legislature appropriated $8.4 million for the 2006-2007 biennium to support basic research conducted under the Advanced Research Program (ARP). The Advanced Technology Program (ATP) was not funded because applied research and commercialization were the focus of the Governor’s $200 million Emerging Technology Fund. The opportunity remains to increase funding for the ARP. The program was funded with $20 million per biennium from its inception in 1987 through 2001. Funding for the program for biennium 2004-2005 was vetoed. The ARP provides competitive, peer-reviewed grants for scientific and engineering basic research projects of Texas higher education institutions’ faculty. It also provides state-of the-art research opportunities for students and helps attract and retain the best faculty. Several former students who worked on ARP- or ATP-funded projects and who are now working in Texas industry have served on peer review panels to determine recommendations for funding ARP and ATP research proposals. The Board’s Advisory Committee on Research Programs is recommending that the state fund basic research with $75 million for the ARP and allow independent and public higher education institutions to compete for these funds. The Texas Legislature created the Research Development Fund to replace the Texas Excellence Fund and the University Research Fund, beginning Fiscal Year 2005. These funds promote increased research capacity at eligible general academic teaching institutions by providing additional support to those institutions that actively secure federal research funds. The 78th Texas Legislature allowed universities to retain 100 percent of indirect cost income from research grants and contracts. In the past, universities retained only 50 percent of indirect costs collected from external granting entities. Full retention of indirect costs allows more resources for research efforts. Projected Increases in Research Expenditures Depend on Federal Spending for Research. Because a large part of research funding to Texas higher education institutions is provided by the federal government, the state’s ability to reach its research goals is largely determined by the funding available for research at the federal level. According to the 2003 National Science Foundation’s compilation of federal obligations for research and development by the states in science and engineering, Texas now ranks fourth among the states, up from fifth place in 2002. California and New York have ranked first and second for many years. Scientists regularly report that seed funding from the state’s Advanced Research Program and Advanced Technology Program (see previous section) has been instrumental in allowing them to secure additional research funding from federal sources. ARP grants for basic research will position Texas scientists and engineers to
38 Texas Higher Education Coordinating Board 2007-2011 Agency Strategic Plan
attract more federal funding as the budget for the National Science Foundation doubles over a 10-year period that is slated to start in 2007. Emerging Technology Fund. In spring 2005, most of the higher education scientists and engineers who were present at the press conference announcing Texas’ new Emerging Technology Fund had been funded previously by the ARP and ATP. To ensure the continuing success of emerging technologies in Texas, it is necessary to “plant the seeds” through basic research. Basic research is the first step in the process of discovery that delivers opportunities for applied research and commercialization research. Research Centers Inventory. In cooperation with the Governor’s Office and higher education institutions, the Coordinating Board developed an online inventory of research centers that is being used to build collaborations between businesses that are in Texas or considering a Texas location and Texas higher education institutions. The research centers inventory can be found at https://www1.thecb.state.tx.us/apps/centers/ Federal-Funding Opportunities. The Coordinating Board maintains contact information for sponsored program officers and research executives at higher education institutions throughout the state. Agency staff provides the Governor’s Office with appropriate contact information and recommendations regarding federal funding notices that the State Grants Team in the Governor’s Office forwards to Texas higher education institutions. Board staff participate in meetings organized by the Governor’s Office with federal granting agencies and higher education researchers. Texas Workforce Investment Council (TWIC). The Board is working with TWIC to establish collaboration between workforce stakeholders and higher education representatives regarding priorities, initiatives, and challenges in 1) workforce preparation and training, and 2) research, development and commercialization. Vigorous Growth by Texas Technology Companies. Texas has seen a dramatic growth in technology companies during the past decade, especially in areas related to microelectronics and telecommunications. These companies tend to support state efforts to attain research goals. For example, many of these companies provide financial support for research at Texas institutions. They also tend to lobby for additional legislative support for research and other education-related activities. In addition, their presence makes it easier for institutions to attract research-oriented faculty. Threats Related to Research Declining Support for Basic Research. Industries conduct approximately two-thirds of all research and development (R&D) or applied research in the United States, while higher education institutions account for about 14 percent. In contrast, most of the basic research is conducted by higher education institutions and remains their proper domain as they focus on advancing knowledge and providing research education opportunities for students. In 2005, Texas received $1.83 per $1,000 dollar of Gross State Product
39 Texas Higher Education Coordinating Board 2007-2011 Agency Strategic Plan
from federal funding for sponsored research projects. Weak funding for basic research over time would inhibit future advances in technology and discourage scientists from pursuing careers in basic research. State and federal support for research on higher education campuses could be affected by the economy, which tends to call on the state and federal governmental to apply their limited resources to other more direct and immediate needs. Dilution of Research Resources. State-of-the-art facilities, whether newly constructed or updated through periodic renovations, are key to attracting top-flight research efforts. However, relatively few institutions have the human resources and research infrastructure to successfully compete for major research projects. Efforts to broaden the state’s research base could dilute research resources in such a way that institutions that currently are competitive nationally for major research grants will lose their competitive advantages. To offset any negative impact, Texas institutions could join forces to establish large, multi-disciplinary research centers that could attract faculty and students to participating Texas institutions, large and small, by offering access to super-expensive laboratories and equipment that individual institutions do not have the resources to build or support. Changing Focus of Federal Research Support: In recent years, the National Institutes of Health (NIH) have experienced dramatic growth in funds awarded to support science and engineering research. Texas higher education institutions saw substantial growth in their share of federal science and engineering obligations because they competed well for NIH funding. NIH funding is now expected to remain basically flat, while National Science Foundation funds will be the focus of increased expenditures. Achievement of the Closing the Gaps research goal may be hampered, as least short-term, by this possible funding shift. Other Opportunities and Threats to the Coordinating Board’s Success
Opportunities Related to Agency Operations
Increased Use of Automation/Technology. New information-processing technologies continue to improve the Coordinating Board’s ability to collect and maintain data effectively and efficiently. For example, the agency continues to automate routine human resources-related functions. The recent automation of the agency’s leave system has greatly reduced the amount of staff time needed to process leave. Additional functions are targeted for automation, allowing the Board to respond as more duties are added to the agency’s responsibilities without a corresponding increase in resources. Efficiencies gained through automation are reaching their limits, however, and the need for computer-related support is stretching the Board’s technology resources.
40 Texas Higher Education Coordinating Board 2007-2011 Agency Strategic Plan
Recent legislation requires establishment of an electronic student record system that must permit authorized public education and higher education officials to exchange certain student information. Increased Information Technology Applications. The agency continues to develop interactive web-based applications for data collection and dissemination. Currently, the agency leverages these applications for a myriad of functions including campus planning data collection, financial aid reporting from institutions, and interactive applications to encourage high school students to go to college. The agency expects to continue developing and maintaining these application. The Board also focuses on ensuring that its data is accurate, reliable, and accessible. Information technology directives will continue to seek opportunities to ensure data accuracy and reliability and become more user-friendly, making data more readily available and easier to find. As the agency examines current procedures and identifies opportunities for improvement, customer service will also increase. The Board is exploring the use of technology to produce and distribute training modules that would save the time and expense of sending staff members to training sessions for both institutions and the agency. The training modules would be available electronically for refresher sessions and for training new staff members as turnover occurs. Threats Related to Agency Operations Increased Data Reliance Creates Many Concerns. Increased reliance on data comes with a corresponding increase in issues related to timeliness, accuracy (in the data itself as well as in its analysis), and security. For example, the process of certifying data provided by each public institution in a timely manner has become a challenge as institutions adopt new software and some institutions have limited the number of staff available to respond to various state and federal reporting requirements. Another example involves the College for Texans Campaign, for which the need to measure and evaluate the effectiveness of campaign activities affects the Coordinating Board’s ability to use staff, volunteers, and other resources efficiently. Also, a growing number of students choose the “other” category when asked to identify their race/ethnicity. While not necessarily inaccurate, this may adversely impact interpretations of demographic trends. Additional considerations include data security issues, such as who should have access to various types of data. Federal privacy laws, such as Family Educational Rights and Privacy Act (FERPA), affect the ability of the Coordinating Board and other groups to share data that is necessary for studying and analyzing student participation and success trends in higher education. For example, through administration of state financial aid programs for students, the Coordinating Board maintains a considerable amount of data regarding the students who participate in these programs. Federal privacy laws and rules could affect access to this information. The Coordinating Board staff must continue to develop methods that allow access to the needed data while
41 Texas Higher Education Coordinating Board 2007-2011 Agency Strategic Plan
protecting students’ privacy. In addition, the Board must continue to encourage other agencies and other entities to consider using innovative, alternative data-sharing methods. Besides federal statutes and rules, the Coordinating Board and other entities in the state are subject to Texas laws protecting privacy. Frequently, federal and state regulations conflict and must be reconciled. Information security will continue to be a major focus for Information Resources and other agency staff during this planning period. Pro-active steps, including presentations on topics such as anti-virus procedures and preventing hacker access to home computers, will continue, as needed, to protect the agency and inform employees of current safeguards. The agency receives many questions that cannot be answered with available data, in part because the agency is required not to collect more than the minimum necessary data. Requesting additional data places a burden on institutions that must modify their procedures sometimes at a substantial fiscal and staff cost. Recruiting and Retaining Qualified Employees. The agency is concerned that many Coordinating Board staff members may be underpaid when compared to employees in similar positions at other Texas state agencies, institutions of higher education, and in the private sector. A related concern was raised in a September 2004 State Auditor’s Office report describing the need for competitive state employee salary levels, particularly in Austin, where the cost of living is higher than in many other parts of the state. For the 2006-2007 biennium, the SAO estimates a state employee’s salary may lag as much as 17 percent behind salaries for comparable work in the federal government and private sector positions.
In particular, the Coordinating Board’s Information Resources and Business Services programs face challenges in competing with the private sector for qualified technical staff.
Coordinating Board Staff Workload. The Legislature authorized and increased the Full-Time Equivalent (FTE) positions at the Coordinating Board in 1999, 2001, 2003 and 2005. Although these new positions have helped implement the many new responsibilities assigned by the Legislature over the past decade, including the B-on-Time program and other financial aid programs, the staff experience a pressing workload which hampers the ability of the staff to carry out existing programs effectively and efficiently.
Staff in the information technology and student services areas, in particular, face inadequate time, resources, and office space to perform their duties effectively and efficiently. Staff are concerned that they do not have adequate time to devote to special projects while simultaneously performing more routine duties and responsibilities. In
42 Texas Higher Education Coordinating Board 2007-2011 Agency Strategic Plan
particular, the move away from the mainframe to web-based programs has stretched thin student services-related staff.
Related to this is the necessity of balancing workflow surges with routine operations. As new programs and assignments are added, existing programs risk becoming diluted or excluded. Early in fiscal year 2005, the agency reorganized with the goal of maximizing staff productivity. Appendix E reflects the agency’s workforce plan and staffing strategies, as required by the State Auditor. Results of the Survey of Organizational Excellence are provided in Appendix F.
Expanding Demands on Information Technology Resources to Meet Division Obligations and Automation Needs. The Coordinating Board’s information resources staff has in the past focused on supporting the agency’s mainframe data systems, such as those used to support financial aid and other higher education data needs. During the past two years the higher education databases have been moved to the client server platform and plans are in place to decommission the Bull mainframe by August 2007. There are currently two major technology projects in progress: the Loan Program System migration project to enhance and move the mainframe loan system to a client/server platform and the legislatively mandated statewide data center consolidation project. Although need for additional resources – including additional funding – is at least an implied response for meeting some of the challenges identified in this document, the Coordinating Board continues to develop and implement efforts to respond as effectively and efficiently as possible within any necessary budgetary restraints. A description of agency priority information technology initiatives and the current strategic plan for Information Resources activities is available in a separate document. An updated strategic plan for information resources will be submitted to the Department of Information Resources by August 2006.
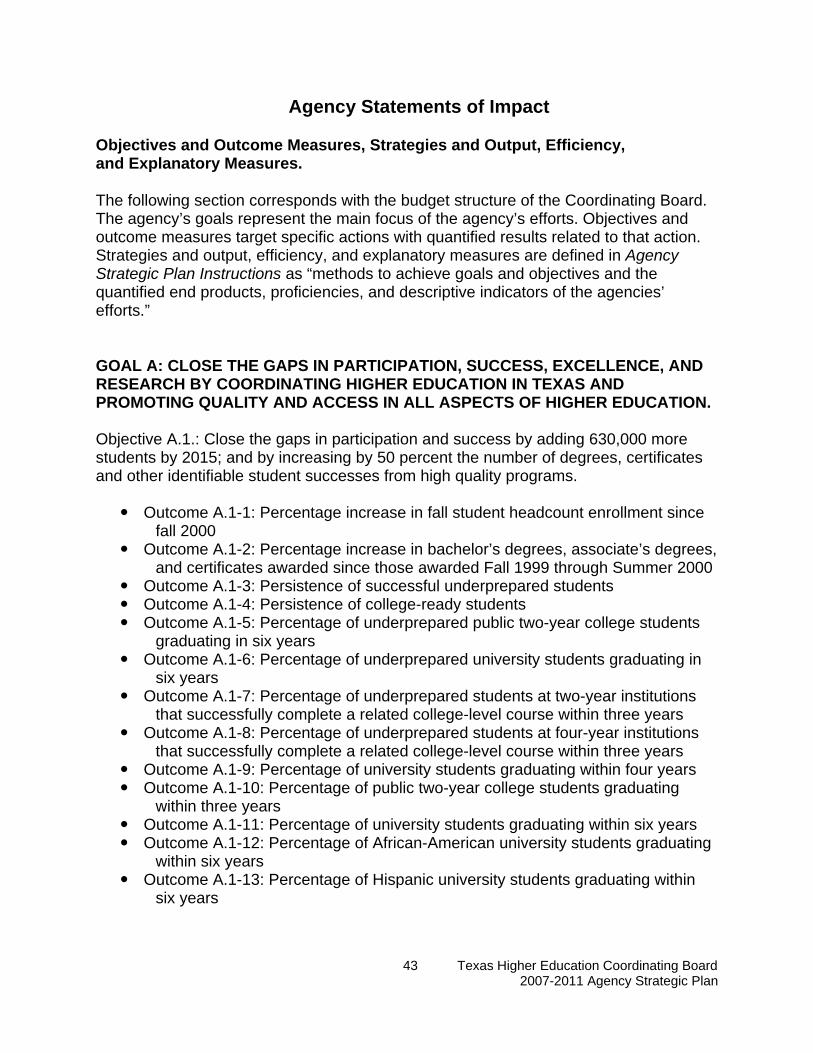
43 Texas Higher Education Coordinating Board 2007-2011 Agency Strategic Plan
Agency Statements of Impact
Objectives and Outcome Measures, Strategies and Output, Efficiency, and Explanatory Measures.
The following section corresponds with the budget structure of the Coordinating Board. The agency’s goals represent the main focus of the agency’s efforts. Objectives and outcome measures target specific actions with quantified results related to that action. Strategies and output, efficiency, and explanatory measures are defined in Agency Strategic Plan Instructions as “methods to achieve goals and objectives and the quantified end products, proficiencies, and descriptive indicators of the agencies’ efforts.”
GOAL A: CLOSE THE GAPS IN PARTICIPATION, SUCCESS, EXCELLENCE, AND RESEARCH BY COORDINATING HIGHER EDUCATION IN TEXAS AND PROMOTING QUALITY AND ACCESS IN ALL ASPECTS OF HIGHER EDUCATION. Objective A.1.: Close the gaps in participation and success by adding 630,000 more students by 2015; and by increasing by 50 percent the number of degrees, certificates and other identifiable student successes from high quality programs.
Outcome A.1-1: Percentage increase in fall student headcount enrollment since fall 2000
Outcome A.1-2: Percentage increase in bachelor’s degrees, associate’s degrees, and certificates awarded since those awarded Fall 1999 through Summer 2000
Outcome A.1-3: Persistence of successful underprepared students Outcome A.1-4: Persistence of college-ready students Outcome A.1-5: Percentage of underprepared public two-year college students
graduating in six years Outcome A.1-6: Percentage of underprepared university students graduating in
six years Outcome A.1-7: Percentage of underprepared students at two-year institutions
that successfully complete a related college-level course within three years Outcome A.1-8: Percentage of underprepared students at four-year institutions
that successfully complete a related college-level course within three years Outcome A.1-9: Percentage of university students graduating within four years Outcome A.1-10: Percentage of public two-year college students graduating
within three years Outcome A.1-11: Percentage of university students graduating within six years Outcome A.1-12: Percentage of African-American university students graduating
within six years Outcome A.1-13: Percentage of Hispanic university students graduating within
six years
44 Texas Higher Education Coordinating Board 2007-2011 Agency Strategic Plan
Strategy A.1.1.: Close the gaps in participation and success by administering grants and scholarship programs and by promoting access to higher education.
• Explanatory A.1.2-1: Dollars appropriated for developmental education Explanatory A.1.2-2: Dollars appropriated for developmental education as a
percentage of lower division instruction • Explanatory A.1.2-3: Percentage of faculty who are African-American • Explanatory A.1.2-4: Percentage of faculty who are Hispanic • Explanatory A.1.2-5: Percentage of Anglo high school graduates who are
enrolled in a Texas public college or university • Explanatory A.1.2-6: Percentage of African-American high school graduates who
are enrolled in a Texas public college or university Explanatory A.1.2-7: Percentage of Hispanic high school graduates who are
enrolled in a Texas public college or university Explanatory A.1.2-8: Percentage of Native American high school graduates who
are enrolled in a Texas public college or university Explanatory A.1.2-9: Percentage of Asian-American high school graduates who
are enrolled in a Texas public college or university Output A.1.2-1: Increase in fall student headcount enrollment since Fall 2000 Output A.1.2-2: Increase in the number of bachelor’s degrees, associate’s
degrees, and certificates reported since those awarded Fall 1999 through Summer 2000
Output A.1.2-3: Number of grants or scholarships awarded Output A.1.2-4: Amount of grant and scholarship funds distributed (in millions)
Strategy A.1.2.: Close the gaps in participation and success by administering loan programs and loan forgiveness programs and loan repayment programs.
• Efficiency A.1.2-1: Default rate on Hinson-Hazlewood loans • Output A.1.2-1: Number of students receiving Hinson-Hazlewood loans • Output A.1.2-2: Dollar amount of Hinson-Hazlewood loans made
Objective A.2.: Close the gaps in excellence and research by promoting quality in all aspects of public higher education including teaching, research, and public service; substantially increasing the number of nationally recognized programs or services at colleges and universities in Texas; and by increasing the level of federal science and engineering research funding to Texas institutions by 50 percent, to $1.3 billion, by 2015.
• Outcome A.2-1: Percentage increase in federal funding for science and engineering at Texas universities and health-related institutions relative to 1998
• Outcome A.2-2: Percentage increase in research expenditures at Texas public institutions of higher education
• Outcome A.2-3: Number of patents, licenses, copyrights, and other commercialization efforts resulting from Coordinating Board-sponsored research
45 Texas Higher Education Coordinating Board 2007-2011 Agency Strategic Plan
• Outcome A.2-4: Educational Achievement: Percent of workforce program participants receiving a degree or credential through completion of an instructional program
• Outcome A.2-5: Entered Employment Rate: Percent of workforce program participants securing employment after exiting the program
• Outcome A.2-6: Employment Retention Rate: Percent of workforce program participants retaining employment
Strategy A.2.1.: Close the gaps in excellence by coordinating and evaluating university programs, community and technical college programs, and health programs.
• Output A.2.1-1: Number of university programs and health-related programs and administrative changes reviewed
• Output A.2.1-2: Number of career school/college and public two-year college programs reviewed
Strategy A.2.2.: Close the gaps in research by administering and evaluating research programs.
• Output A.2.2-1: Dollar value of federal funding for science and engineering at Texas universities and health-related institutions relative to 1998 (in millions)
• Output A.2.2-2: Dollars of additional funding received as a result of Advanced Technology Program or Advanced Research Program funding (in thousands)
• Output A.2.2-3: Dollar amount of research expenditures Objective A.3.: Close the higher education gaps by providing planning and information through developing and maintaining a plan for higher education; providing capable and creative leadership in higher education; and promoting the creative, efficient, and effective management of the state's higher education resources.
• Outcome A.3-1: Critical deferred maintenance in educational and general space as a percentage of the total education and general building replacement value
Strategy A.3.1.: Provide planning, information services, and a performance and accountability system.
• Efficiency A.3.1-1: Percentage of requests for computerized information responded to by the Educational Data Center or Educational Data Analysis Support Center in less than three days
• Explanatory A.3.1-1: Ratio of repair and remodeling to new construction • Output A.3.1-1: Number of higher education studies conducted
GOAL B: CLOSE THE GAPS IN PARTICIPATION AND SUCCESS BY PROVIDING TRUSTEED FUNDS TO INSTITUTIONS AND STUDENTS THROUGH SPECIAL
46 Texas Higher Education Coordinating Board 2007-2011 Agency Strategic Plan
PROGRAMS DESIGNED TO IMPROVE THE AFFORDABILITY OF HIGHER EDUCATION. Objective B.1.: Provide programs which make financial assistance available to Texas students.
• Outcome B.1-1: Percentage of independent college students receiving Tuition Equalization Grants (TEG) awards
• Outcome B.1-2: Number of students attending independent colleges and universities as a percentage of total enrollment
• Outcome B.1-3: Percentage of students receiving financial aid who are employed through the Texas College Work-Study Program
• Outcome B.1-4: Percentage of Teach for Texas Loan Repayment Program recipients teaching in underserved areas for three years
Strategy B.1.1.: Tuition Equalization Grant (TEG) Program.
• Output B.1.1-1: Number of students receiving TEG awards • Output B.1.1-2: Persistence rate of TEG recipients after one academic year • Output B.1.1-3: Percentage of TEG recipients who earn a baccalaureate degree
within six academic years • Output B.1.1-4: Percentage of TEG recipients who are minority students • Output B.1.1-5: Percentage of TEG recipients who earn a baccalaureate degree
within four academic years Strategy B.1.2.: License Plate Scholarships Program. Strategy B.1.3.: State Military Tuition Assistance Program. Strategy B.1.4.: Fifth-Year Accounting Students Program. Strategy B.1.5.: Early High School Graduation Scholarship Program. Strategy B.1.6.: Temporary Assistance to Needy Families (TANF) Scholarship Program. Strategy B.1.7.: Certified Educational Aide Program. Strategy B.1.8.: Teach for Texas Loan Repayment Program. Strategy B.1.9.: Border Faculty Loan Repayment Program. Strategy B.1.10.: OAG Lawyers Loan Repayment Program. Strategy B.1.11.: Student Financial Aid Programs.
• Output B.1.11-1: Number of students receiving TEXAS grants
47 Texas Higher Education Coordinating Board 2007-2011 Agency Strategic Plan
• Output B.1.11-2: Percentage of TEXAS Grant recipients who earn a baccalaureate degree within four academic years
• Output B.1.11-3: Percentage of TEXAS Grant recipients who earn a baccalaureate degree within six academic years
• Output B.1.11-4: Persistence rate of TEXAS Grant recipients after one academic year – public universities
• Output B.1.11-5: Persistence rate of TEXAS Grant recipients after one academic year – public community and junior colleges
• Output B.1.11-6: Persistence rate of TEXAS Grant recipients after one academic year – public technical colleges
• Output B.1.11-7: Percentage of Texas B-on-Time loans forgiven Strategy B.1.12.: Doctoral Incentive Program. GOAL C: CLOSE THE GAPS IN RESEARCH BY PROVIDING TRUSTEED FUNDS TO INSTITUTIONS AND STUDENTS THROUGH SPECIAL PROGRAMS DESIGNED TO ENHANCE AND FACILITATE RESEARCH AT TEXAS INSTITUTIONS. Objective C.1.: Provide programs to promote research at Texas institutions. Strategy C.1.1.: Advanced Research Program.
• Output C.1.1-1: Number of students receiving education and experience in research through ARP research projects
• Output C.1.1-2: Number of ARP research projects funded Strategy C.1.2.: Advanced Technology Program.
• Output C.1.2-1: Number of students receiving education and experience in research through ATP research projects
• Output C.1.1-2: Number of ATP research projects funded GOAL D: CLOSE THE GAPS IN TEXAS BY PROVIDING TRUSTEED FUNDS TO INSTITUTIONS AND STUDENTS THROUGH SPECIAL PROGRAMS DESIGNED TO IMPROVE HEALTH CARE RELATED TO HIGHER EDUCATION. Objective D.1.: Provide programs to improve health care in Texas.
• Outcome D.1-1: Percentage of BCM graduates entering Texas residency programs
• Outcome D.1-2: Percentage of BCM graduates entering primary care residencies • Outcome D.1-3: Percentage of BCM students passing part 1 or part 2 of the
national licensing exam on the first attempt
48 Texas Higher Education Coordinating Board 2007-2011 Agency Strategic Plan
• Outcome D.1-4: Percentage of Family Practice Residency Program completers practicing in Medically-Underserved Areas or Health Professional Shortage Areas
• Outcome D.1-5: Percentage of Family Practice Residency Program completers practicing in Texas
Strategy D.1.1.: Baylor College of Medicine.
• Output D.1.1-1: Number of Texas resident BCM medical students funded • Output D.1.1-2: Average amount per BCM student
Strategy D.1.2.: Baylor College of Medicine Graduate Medical Education (GME). Strategy D.1.3.: Family Practice Residency Program.
• Output D.1.3-1: Number of FPRP residents supported • Output D.1.3 -2: Average funding per FPRP resident
Strategy D.1.4.: Preceptorship Program. Strategy D.1.5.: Primary Care Residency Program. Strategy D.1.6.: Graduate Medical Education Program. Strategy D.1.7.: Joint Admission Medical Program. Strategy D.1.8.: Physician’s Education Loan Repayment Program.
• Output D.1.8-1: Number of physicians receiving PELRP payment (including federal match)
Strategy D.1.9.: Financial Aid for Professional Nursing Students. Strategy D.1.10.: Financial Aid for Vocational Nursing Students. Strategy D.1.11.: Dentist’s Education Loan Program. Strategy D.1.12.: Professional Nursing Shortage Reduction Program. Strategy D.1.13.: Consortium of Alzheimer’s Disease Centers. GOAL E: CLOSE THE GAPS IN TEXAS HIGHER EDUCATION BY PROVIDING TRUSTEED FUNDS TO INSTITUTIONS THROUGH SPECIAL PROGRAMS DESIGNED TO IMPROVE THE QUALITY AND DELIVERY OF INSTRUCTION AND ALSO INCREASE THE PARTICIPATION AND SUCCESS OF TEXANS.
49 Texas Higher Education Coordinating Board 2007-2011 Agency Strategic Plan
Objective E.1.: Provide programs to improve the quality and delivery of higher education and also increase the participation and success of Texans.
Outcome E.1-1: Pass rate on TExES/ExCET exams at Centers for Teacher Education
Strategy E.1.1.: STARLINK/Virtual College. Strategy E.1.2.: Centers for Teacher Education (Texas Association of Developing Colleges).
• Explanatory E.1.2-1: Percentage of TADC funds used to increase the number of students enrolled, prepared, retained, and graduated
• Explanatory E.1.2-2: Percentage of periodic reports and audits submitted on time per contractual agreements
• Output E.1.2-1: Number of students enrolled in TADC educator preparation programs
• Output E.1.2-2: Number of graduates of TADC educator preparation programs Strategy E.1.3.: Two-Year Institution Enrollment Growth. Strategy E.1.4.: New Community College Campuses. Strategy E.1.5.: African American Museum Professional Internship. Strategy E.1.6.: Technology Workforce Development. GOAL F: CLOSE THE GAPS IN PARTICIPATION AND SUCCESS BY PROVIDING FEDERAL FUNDS TO INSTITUTIONS AND STUDENTS TO IMPROVE HIGHER EDUCATION IN TEXAS. Objective F.1.: Administer statewide federal grants programs. Strategy F.1.1.: Student Financial Assistance Programs. Strategy F.1.2.: Technical-Vocational Education Programs. Strategy F.1.3.: Teacher Quality Grants Program. Strategy F.1.4.: Other Federal Grants Programs.
50 Texas Higher Education Coordinating Board 2007-2011 Agency Strategic Plan
GOAL G: CLOSE THE GAPS IN TEXAS HIGHER EDUCATION BY PROVIDING TOBACCO SETTLEMENT RECEIPTS TO INSTITUTIONS THROUGH SPECIAL PROGRAMS. Objective G.1.: Permanent Funds. Strategy G.1.1.: Tobacco Earnings from the Permanent Fund for Minority Health Research and Education. Strategy G.1.2.: Tobacco Earnings from the Permanent Fund for Higher Education Nursing, Allied Health, and Other Health-Related Programs. Objective G.2.: Endowment Funds. Strategy G.2.1.: Tobacco Earnings – HECB for Baylor College of Medicine. GOAL H: INDIRECT ADMINISTRATION Objective H.1.: Indirect Administration. Strategy H.1.1.: Central Administration. Strategy H.1.2.: Information Resources. Strategy H.1.3.: Other Support Services.
Appendix A _____________________________________________________________________________
_____________________________________________________________________________ Texas Higher Education Coordinating Board
2007-2011 Agency Strategic Plan
A-1
Appendix A: Agency Planning Process

Appendix A _____________________________________________________________________________
_____________________________________________________________________________ Texas Higher Education Coordinating Board
2007-2011 Agency Strategic Plan
A-2
_____________________________________________________________________________ Texas Higher Education Coordinating Board
2005-2009 Agency Strategic Plan
A-3
Appendix A Agency Planning Process
This appendix summarizes the Texas Higher Education Coordinating Board’s internal planning process for developing the agency’s biennial strategic plan. The Closing the Gaps by 2015 higher education plan adopted by the Coordinating Board in 2000 is the foundation for the Board’s future direction and priorities. Closing the Gaps establishes intermediate targets for 2005 and 2010 for three of its goals, and 2007 for one of its goals, allowing progress to be monitored on the way to the plan’s culmination in 2015. It is also a dynamic plan that is amended as needed to respond to changes in state population or achievement of goals. The plan’s past and future schedule is shown below:
• 1999/2000: Development of a new higher education plan for Texas. • 2001/2002: Implementation of the plan and update agency strategic plan. • 2003/2004: Initial reporting for the plan and update agency strategic plan. • 2005: Comparison year with first set of intermediate targets. • 2005: Revision of goals and targets whose 2005 intermediate targets
were achieved, which were affected by population revisions. Also independent institution were included in the goals and targets.
• 2005/2006: Reporting for the plan and update agency strategic plan. • 2007/2008: Reporting for the plan and update agency strategic plan. • 2010: Comparison year for second set of intermediate targets. • 2009/2010: Reporting for the plan and update agency strategic plan. • 2011/2012: Reporting for the plan and update agency strategic plan. • 2013/2014: Reporting for the plan and update agency strategic plan. • 2015: Final comparison with targets, as established in the plan.
Agency Planning Highlights: 1999/2000 In March 1999, the Board agreed to develop a new Texas higher education plan to replace the 1995 Master Plan for Texas Higher Education. As an initial step, the Coordinating Board conducted a higher education priority and efficiency analysis. In addition, the Board’s standing Planning Committee was expanded to include representation from business, community leaders, and former higher education governing board members. The first Planning Committee meeting was held September 29, 1999. An oral report on the priority and efficiency analysis was provided at the April 2000 Coordinating Board meeting. A draft plan was approved and circulated for comment to over 1,500 individuals and groups. On September 21, the Planning Committee reviewed the comments received and voted to recommend the
Appendix A
_____________________________________________________________________________
_____________________________________________________________________________ Texas Higher Education Coordinating Board
2007-2011 Agency Strategic Plan
A-4
revised plan to the Coordinating Board. The plan, entitled Closing the Gaps by 2015, was approved by the Board at its October 2000 meeting. Agency Planning Highlights: 2001/2002 Throughout the late summer and fall of 2001, Coordinating Board staff established an agency-wide work plan to tie staff projects directly to goals identified in Closing the Gaps. In December, executive officers and key staff of the Coordinating Board discussed production of a strategic plan which also incorporated the goals of Closing the Gaps. Internal meetings regarding the agency’s strategic plan continued throughout early 2002. Coordinating Board staff met with representatives of the Legislative Budget Board and the Governor’s Office of Budget and Planning regarding a proposed restructuring of the budget structure to reflect the goals of Closing the Gaps. The 2003-2007 Strategic Plan was formally presented to the Coordinating Board for discussion on April 19. Comments from the meeting were incorporated and the final document was submitted on June 1, 2002. Agency Planning Highlights: 2003/Early-2004 Internal meetings regarding the agency’s strategic plan began in early 2004 after the Chairman of the Coordinating Board’s Committee on Planning was provided a tentative timetable. Comments from regents and trustees who attended the December 11, 2003,Coordinating Board conference for governing board members were incorporated. On January 18, three staff members attended a seminar for human resource strategic planning. A meeting with representatives of the Legislative Budget Board, Governor’s Office and agency staff was conducted February 3 to discuss direction in revising agency performance measures. Throughout February, planning staff met with four to eight key staff from each Coordinating Board division to identify and discuss opportunities and challenges facing the agency as it strives to achieve Closing the Gaps goals. The ideas were compiled and presented to Coordinating Board staff executive officers. Instructions for the strategic planning process were released the first week of March, and the staff incorporated the formal requirements in the initial draft report and appendix items. Staff also updated the performance measures and submitted them for formal consideration to the Legislative Budget Board and Office of the Governor. A draft of the strategic plan was circulated internally and to Planning Committee members in late-March. Coordinating Board members received the draft plan in early April. The draft of the 2005-2009 Strategic Plan was discussed among Coordinating Board members at their meeting on April 22. Comments from the meeting were incorporated into the document with final edits entered to meet the June 18 submission date.

Appendix A
_____________________________________________________________________________
_____________________________________________________________________________ Texas Higher Education Coordinating Board
2007-2011 Agency Strategic Plan
A-5
Agency Planning Highlights: 2005/Early-2006 As in recent years, the Coordinating Board continued to examine one of Closing the Gaps’ four primary goals at each Board meeting. This practice keeps higher education’s strategic plan foremost in the thoughts of Board members as they act on institutional and agency business. In early 2005, the agency was reorganized into divisions that mirror the elements of Closing the Gaps. The two primary divisions are named: Participation and Success, and Academic Excellence and Research. The reorganization resulted in shifts in focus for many staff members. The Participation and Success Division now has additional staff who work with regional representatives to increase student participation. Staff who monitor academic offerings at community colleges and undergraduate programs at universities and health-related institutions are now in a single section of the Academic Excellence and Research Division. By 2005, one-third of the 2000 to 2015 time frame of the Closing the Gaps Plan had elapsed. The agency carefully examined progress towards the 2005 benchmarks defined in the plan. It also used 2005 as an opportunity to revise Closing the Gaps measures that had been achieved, and to modify population-based goals and targets using new projections produced by the Texas State Data Center. In addition, the contributions of independent institutions toward Closing the Gaps in higher education were acknowledged by formally incorporating their student enrollments and successes into the goals and targets. Significant progress has been made toward the success goal and targets. Benchmarks were achieved in the overall number of undergraduate success, in African-American and Hispanic successes, in associate degrees generally and in nursing and allied health. The 2005 targets for bachelor’s and doctoral degrees were not reached. In participation, the interim overall and the African-American interim targets were met. The Hispanic target was not achieved. This is troubling because the 2015 target, which was revised to reflect higher population projections for Hispanics, is even more ambitious. Agency staff reviewed the existing Strategic Plan and updated progress towards the Closing the Gaps elements. Key staff members from all sections of the agency met to discuss and brainstormed additional opportunities and difficulties for the agency. New ideas were circulated to appropriate staff members for extrapolation and analysis. A draft of the strategic plan was circulated internally and comments were received. The Board’s Strategic Planning Committee members received copies before the Committee’s June 8 meeting. Comments from the members were incorporated into the document. As approved at the Board’s April 20, 2006 meeting, the Board chair and Strategic Planning
Appendix A
_____________________________________________________________________________
_____________________________________________________________________________ Texas Higher Education Coordinating Board
2007-2011 Agency Strategic Plan
A-6
Committee chair gave final approval of the document before the June 23 submission date.
Appendix B
________________________________________________________________________
_____________________________________________________________________________ Texas Higher Education Coordinating Board
2007-2011 Agency Strategic Plan
B-1
Appendix B: Organizational Chart
Appendix B
________________________________________________________________________
_____________________________________________________________________________ Texas Higher Education Coordinating Board
2007-2011 Agency Strategic Plan
B-2
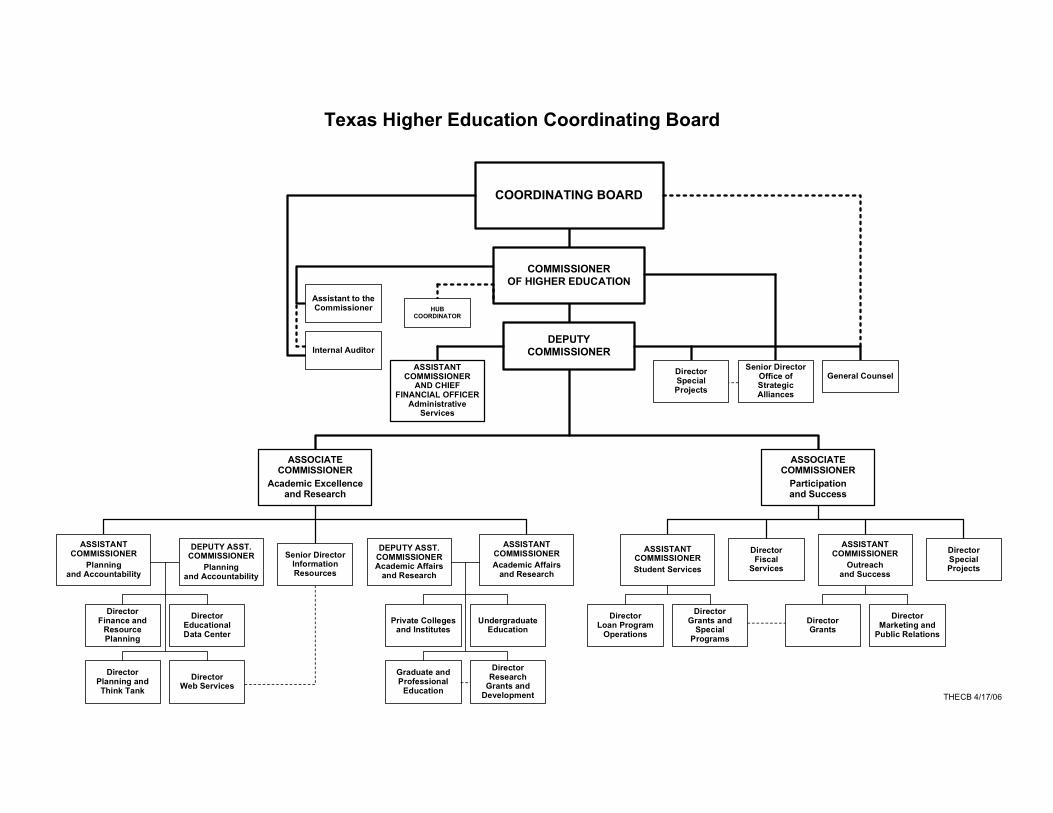
Texas Higher Education Coordinating Board
COORDINATING BOARD
COMMISSIONEROF HIGHER EDUCATION
DEPUTYCOMMISSIONER
Assistant to theCommissioner
ASSISTANTCOMMISSIONER
AND CHIEFFINANCIAL OFFICER
AdministrativeServices
ASSOCIATECOMMISSIONER
Academic Excellenceand Research
ASSOCIATECOMMISSIONER
Participationand Success
General Counsel
HUBCOORDINATOR
Internal Auditor
DirectorFinance and
ResourcePlanning
DirectorEducationalData Center
ASSISTANTCOMMISSIONERAcademic Affairs
and Research
ASSISTANTCOMMISSIONER
Planningand Accountability
Private Collegesand Institutes
UndergraduateEducation
Graduate andProfessional
Education
DirectorPlanning andThink Tank
DirectorWeb Services
DEPUTY ASST.COMMISSIONERAcademic Affairs
and Research
ASSISTANTCOMMISSIONERStudent Services
DirectorMarketing and
Public Relations
DirectorGrants and
SpecialPrograms
DirectorLoan Program
Operations
DirectorFiscal
Services
DirectorGrants
DirectorSpecialProjects
DEPUTY ASST.COMMISSIONER
Planningand Accountability
DirectorResearch
Grants andDevelopment
Senior DirectorOffice ofStrategicAlliances
Senior DirectorInformationResources
DirectorSpecialProjects
THECB 4/17/06
ASSISTANTCOMMISSIONER
Outreachand Success
Appendix C
________________________________________________________________________________
____________________________________________________________________________________ Texas Higher Education Coordinating Board
2007-2011 Agency Strategic Plan
C-1
Appendix C: Five-Year Projections for Outcomes

Appendix C
________________________________________________________________________________
____________________________________________________________________________________ Texas Higher Education Coordinating Board
2007-2011 Agency Strategic Plan
C-2
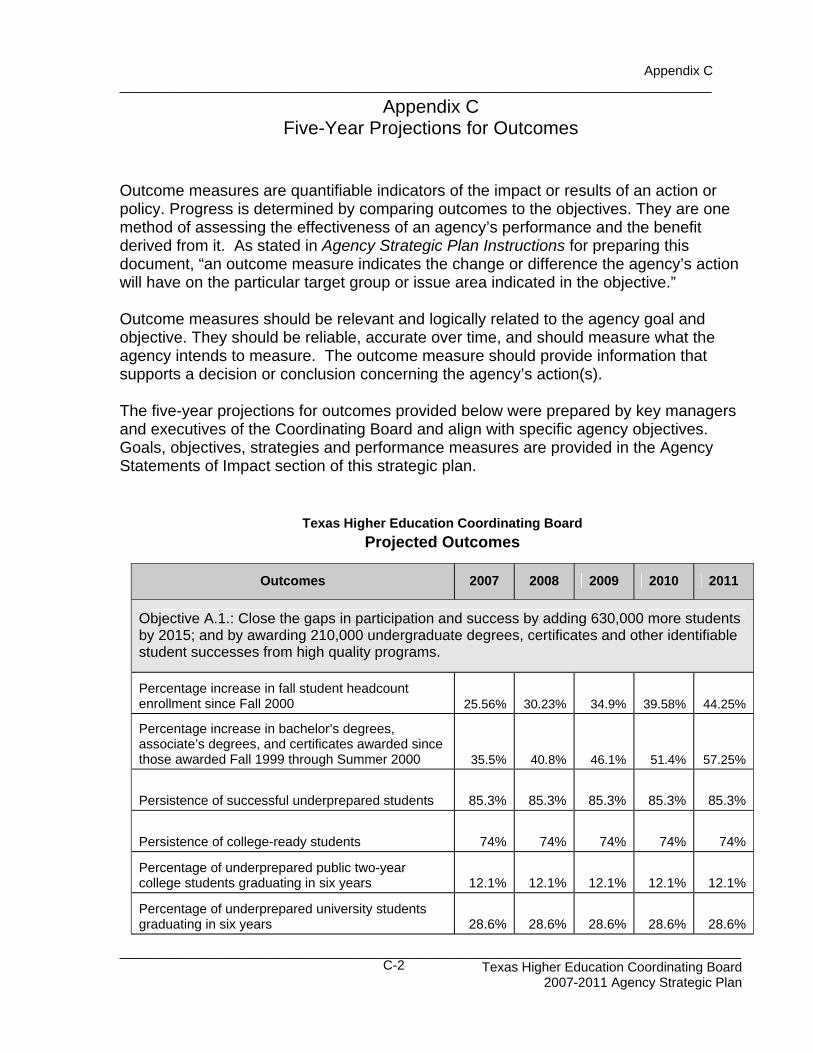
Appendix C
________________________________________________________________________________
____________________________________________________________________________________ Texas Higher Education Coordinating Board
2007-2011 Agency Strategic Plan
C-2
Appendix C Five-Year Projections for Outcomes
Outcome measures are quantifiable indicators of the impact or results of an action or policy. Progress is determined by comparing outcomes to the objectives. They are one method of assessing the effectiveness of an agency’s performance and the benefit derived from it. As stated in Agency Strategic Plan Instructions for preparing this document, “an outcome measure indicates the change or difference the agency’s action will have on the particular target group or issue area indicated in the objective.” Outcome measures should be relevant and logically related to the agency goal and objective. They should be reliable, accurate over time, and should measure what the agency intends to measure. The outcome measure should provide information that supports a decision or conclusion concerning the agency’s action(s). The five-year projections for outcomes provided below were prepared by key managers and executives of the Coordinating Board and align with specific agency objectives. Goals, objectives, strategies and performance measures are provided in the Agency Statements of Impact section of this strategic plan.
Texas Higher Education Coordinating Board Projected Outcomes
Outcomes 2007 2008 2009 2010 2011
Objective A.1.: Close the gaps in participation and success by adding 630,000 more students by 2015; and by awarding 210,000 undergraduate degrees, certificates and other identifiable student successes from high quality programs.
Percentage increase in fall student headcount enrollment since Fall 2000 25.56% 30.23% 34.9% 39.58% 44.25%
Percentage increase in bachelor’s degrees, associate’s degrees, and certificates awarded since those awarded Fall 1999 through Summer 2000 35.5% 40.8% 46.1% 51.4% 57.25%
Persistence of successful underprepared students 85.3% 85.3% 85.3% 85.3% 85.3%
Persistence of college-ready students 74% 74% 74% 74% 74%
Percentage of underprepared public two-year college students graduating in six years 12.1% 12.1% 12.1% 12.1% 12.1%
Percentage of underprepared university students graduating in six years 28.6% 28.6% 28.6% 28.6% 28.6%
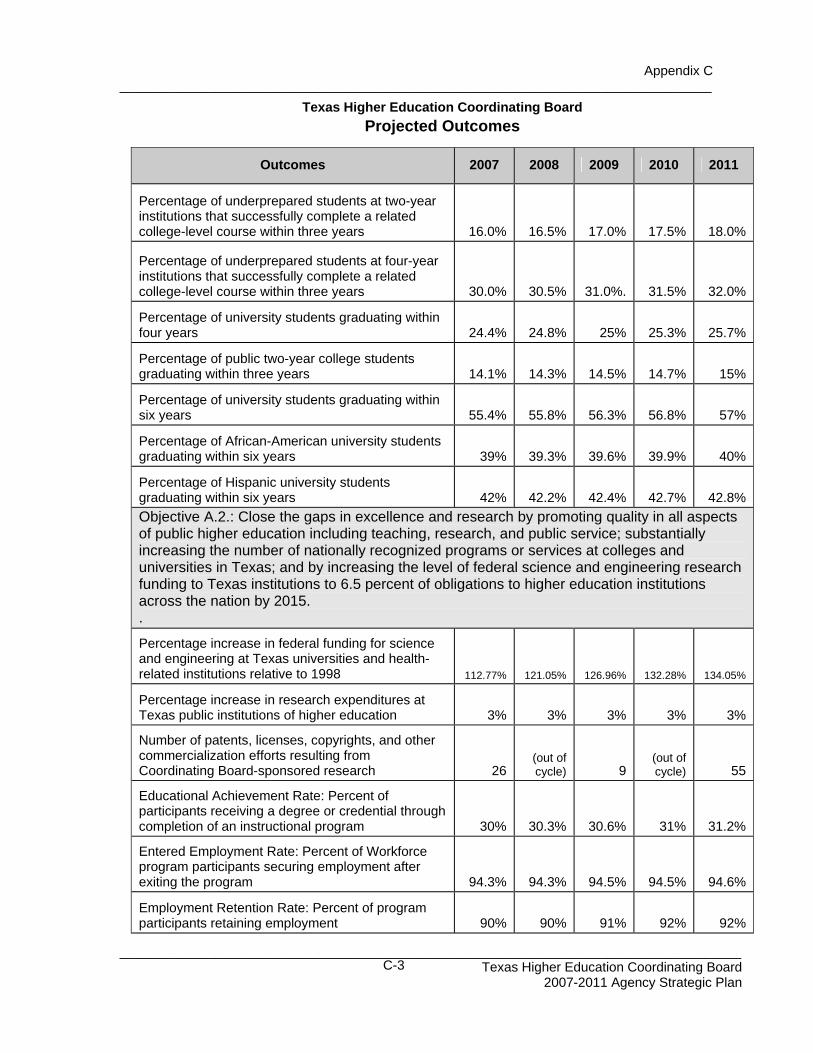
Appendix C
________________________________________________________________________________
____________________________________________________________________________________ Texas Higher Education Coordinating Board
2007-2011 Agency Strategic Plan
C-3
Texas Higher Education Coordinating Board Projected Outcomes
Outcomes 2007 2008 2009 2010 2011
Percentage of underprepared students at two-year institutions that successfully complete a related college-level course within three years 16.0% 16.5% 17.0% 17.5% 18.0%
Percentage of underprepared students at four-year institutions that successfully complete a related college-level course within three years 30.0% 30.5% 31.0%. 31.5% 32.0%
Percentage of university students graduating within four years 24.4% 24.8% 25% 25.3% 25.7%
Percentage of public two-year college students graduating within three years 14.1% 14.3% 14.5% 14.7% 15%
Percentage of university students graduating within six years 55.4% 55.8% 56.3% 56.8% 57%
Percentage of African-American university students graduating within six years 39% 39.3% 39.6% 39.9% 40%
Percentage of Hispanic university students graduating within six years 42% 42.2% 42.4% 42.7% 42.8%Objective A.2.: Close the gaps in excellence and research by promoting quality in all aspects of public higher education including teaching, research, and public service; substantially increasing the number of nationally recognized programs or services at colleges and universities in Texas; and by increasing the level of federal science and engineering research funding to Texas institutions to 6.5 percent of obligations to higher education institutions across the nation by 2015. .
Percentage increase in federal funding for science and engineering at Texas universities and health-related institutions relative to 1998 112.77% 121.05% 126.96% 132.28% 134.05%
Percentage increase in research expenditures at Texas public institutions of higher education 3% 3% 3% 3% 3%
Number of patents, licenses, copyrights, and other commercialization efforts resulting from Coordinating Board-sponsored research 26
(out of cycle) 9
(out of cycle) 55
Educational Achievement Rate: Percent of participants receiving a degree or credential through completion of an instructional program 30% 30.3% 30.6% 31% 31.2%
Entered Employment Rate: Percent of Workforce program participants securing employment after exiting the program 94.3% 94.3% 94.5% 94.5% 94.6%
Employment Retention Rate: Percent of program participants retaining employment 90% 90% 91% 92% 92%
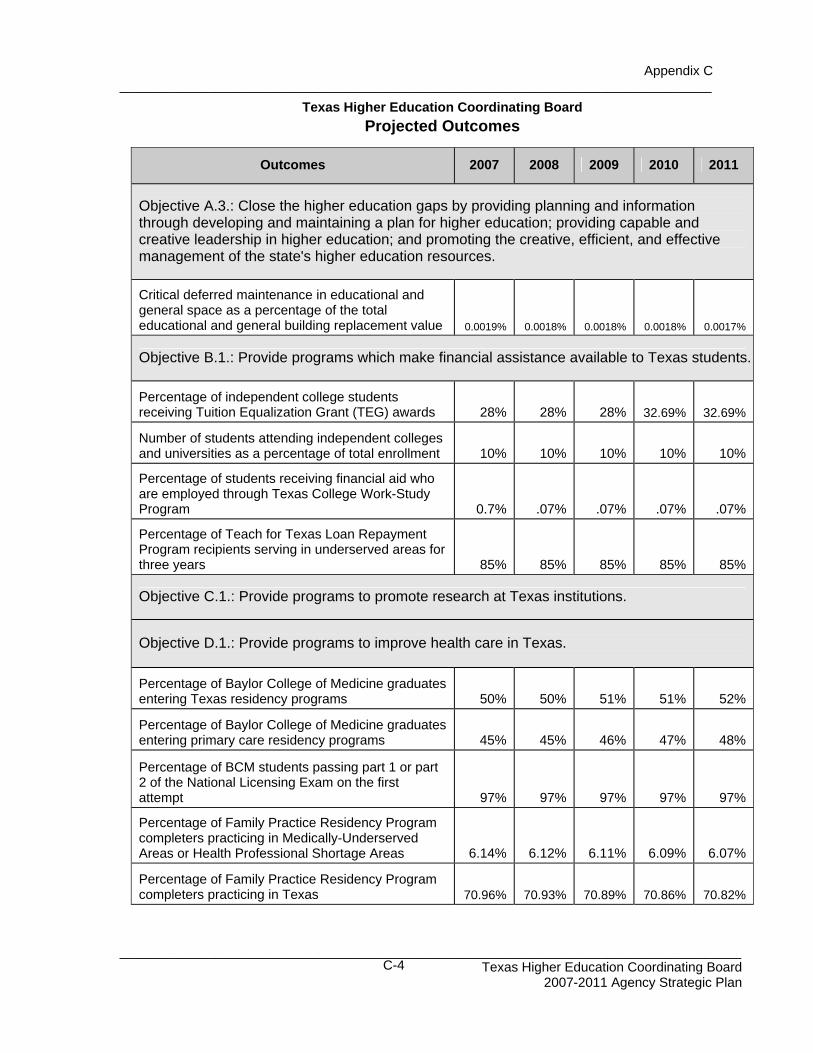
Appendix C
________________________________________________________________________________
____________________________________________________________________________________ Texas Higher Education Coordinating Board
2007-2011 Agency Strategic Plan
C-4
Texas Higher Education Coordinating Board Projected Outcomes
Outcomes 2007 2008 2009 2010 2011
Objective A.3.: Close the higher education gaps by providing planning and information through developing and maintaining a plan for higher education; providing capable and creative leadership in higher education; and promoting the creative, efficient, and effective management of the state's higher education resources.
Critical deferred maintenance in educational and general space as a percentage of the total educational and general building replacement value 0.0019% 0.0018% 0.0018% 0.0018% 0.0017%
Objective B.1.: Provide programs which make financial assistance available to Texas students.
Percentage of independent college students receiving Tuition Equalization Grant (TEG) awards 28% 28% 28% 32.69% 32.69%
Number of students attending independent colleges and universities as a percentage of total enrollment 10% 10% 10% 10% 10%
Percentage of students receiving financial aid who are employed through Texas College Work-Study Program 0.7% .07% .07% .07% .07%
Percentage of Teach for Texas Loan Repayment Program recipients serving in underserved areas for three years 85% 85% 85% 85% 85%
Objective C.1.: Provide programs to promote research at Texas institutions.
Objective D.1.: Provide programs to improve health care in Texas.
Percentage of Baylor College of Medicine graduates entering Texas residency programs 50% 50% 51% 51% 52%
Percentage of Baylor College of Medicine graduates entering primary care residency programs 45% 45% 46% 47% 48%
Percentage of BCM students passing part 1 or part 2 of the National Licensing Exam on the first attempt 97% 97% 97% 97% 97%
Percentage of Family Practice Residency Program completers practicing in Medically-Underserved Areas or Health Professional Shortage Areas 6.14% 6.12% 6.11% 6.09% 6.07%
Percentage of Family Practice Residency Program completers practicing in Texas 70.96% 70.93% 70.89% 70.86% 70.82%
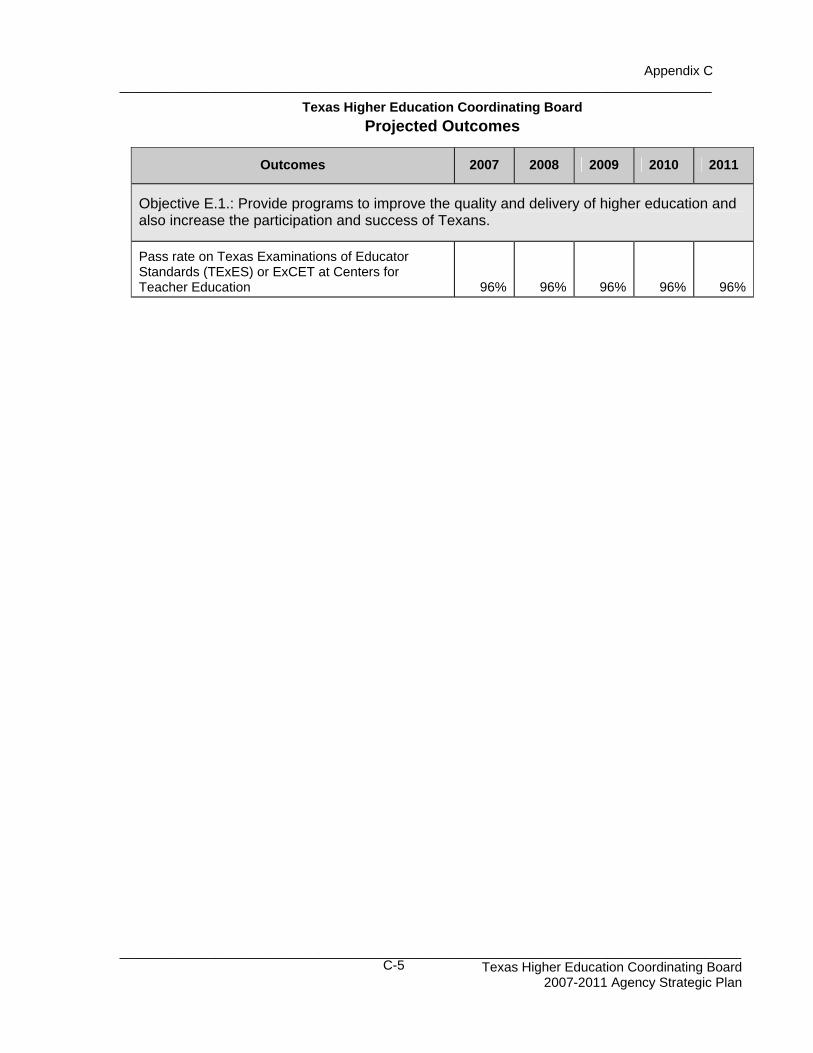
Appendix C
________________________________________________________________________________
____________________________________________________________________________________ Texas Higher Education Coordinating Board
2007-2011 Agency Strategic Plan
C-5
Texas Higher Education Coordinating Board Projected Outcomes
Outcomes 2007 2008 2009 2010 2011
Objective E.1.: Provide programs to improve the quality and delivery of higher education and also increase the participation and success of Texans.
Pass rate on Texas Examinations of Educator Standards (TExES) or ExCET at Centers for Teacher Education 96% 96% 96% 96% 96%
Appendix D
_____________________________________________________________________________
_____________________________________________________________________________ Texas Higher Education Coordinating Board
2007-2011 Agency Strategic Plan
D-1
Appendix D:
Performance Measure Definitions

Appendix D
_____________________________________________________________________________
_____________________________________________________________________________ Texas Higher Education Coordinating Board
2007-2011 Agency Strategic Plan
D-2
Appendix D
_____________________________________________________________________________
_____________________________________________________________________________ Texas Higher Education Coordinating Board
2007-2011 Agency Strategic Plan
D-3
Appendix D Performance Measure Definitions
“A performance measure’s definition establishes an explanation of the measure, the methodology for its calculation, and enough information about the measure that it can be clearly understood. The description of a measure’s calculation must be detailed enough to allow replication. Definitions submitted with the Strategic Plan must present all of the elements shown below, using the following format:
• Short Definition: Provides a brief explanation of what the measure is, with enough detail to give a general understanding of the measure.
• Purpose/Importance: Explains what the measure is intended to show and
why it is important. • Source/Collection of Data: Describes where the information comes from
and how it is collected. • Method of Calculation: Describes clearly and specifically how the measure
is calculated. • Data Limitations: Identifies any limitations about the measurement data,
including factors that may be beyond the agency’s control. • Calculation Type: Identifies whether the information is cumulative or non-
cumulative. • New Measure: Identifies whether the measure is new, has significantly
changed, or continues without change from the previous biennium. • Desired Performance: Identifies whether actual performance that is higher
or lower than targeted performance is desirable (e.g., a disease rate lower than targeted is desirable).”
Source: Agency Strategic Plan Instructions, March 2006
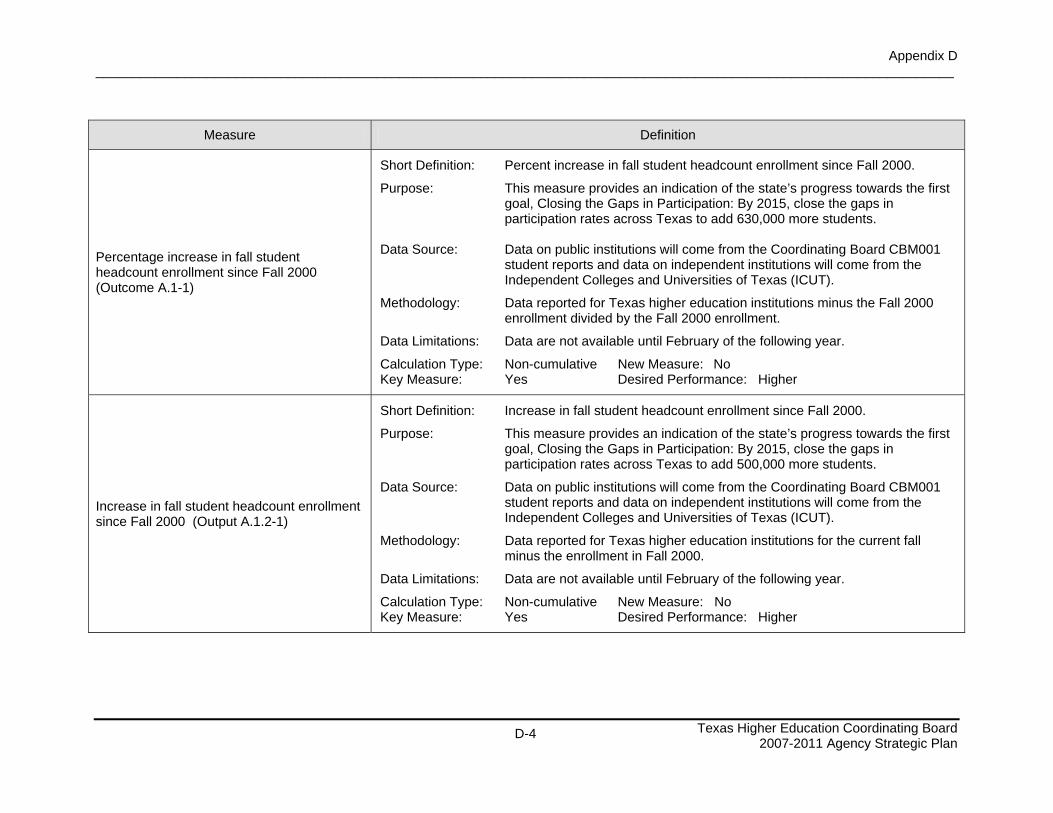
Appendix D ____________________________________________________________________________________________________________________
Texas Higher Education Coordinating Board
2007-2011 Agency Strategic Plan
D-4
Measure Definition
Percentage increase in fall student headcount enrollment since Fall 2000 (Outcome A.1-1)
Short Definition: Percent increase in fall student headcount enrollment since Fall 2000. Purpose: This measure provides an indication of the state’s progress towards the first
goal, Closing the Gaps in Participation: By 2015, close the gaps in participation rates across Texas to add 630,000 more students.
Data Source: Data on public institutions will come from the Coordinating Board CBM001
student reports and data on independent institutions will come from the Independent Colleges and Universities of Texas (ICUT).
Methodology: Data reported for Texas higher education institutions minus the Fall 2000
enrollment divided by the Fall 2000 enrollment. Data Limitations: Data are not available until February of the following year. Calculation Type: Non-cumulative New Measure: No Key Measure: Yes Desired Performance: Higher
Increase in fall student headcount enrollment since Fall 2000 (Output A.1.2-1)
Short Definition: Increase in fall student headcount enrollment since Fall 2000. Purpose: This measure provides an indication of the state’s progress towards the first
goal, Closing the Gaps in Participation: By 2015, close the gaps in participation rates across Texas to add 500,000 more students.
Data Source: Data on public institutions will come from the Coordinating Board CBM001
student reports and data on independent institutions will come from the Independent Colleges and Universities of Texas (ICUT).
Methodology: Data reported for Texas higher education institutions for the current fall
minus the enrollment in Fall 2000. Data Limitations: Data are not available until February of the following year. Calculation Type: Non-cumulative New Measure: No Key Measure: Yes Desired Performance: Higher
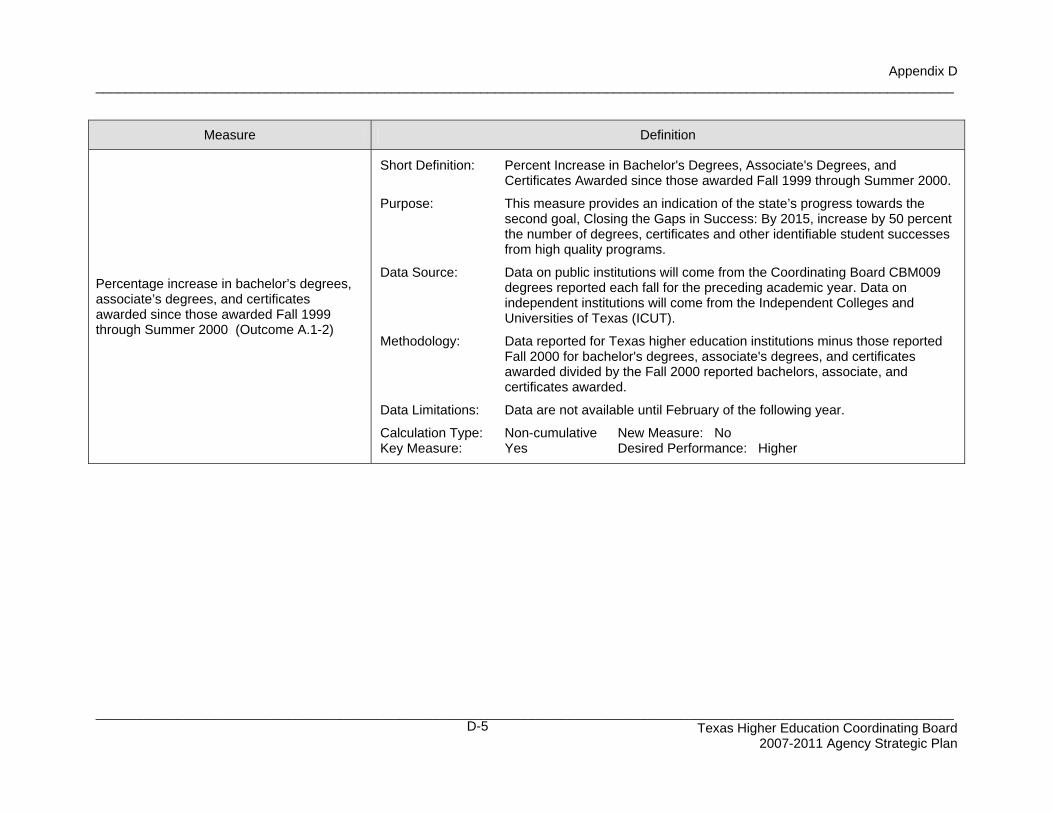
Appendix D
____________________________________________________________________________________________________________________
____________________________________________________________________________________________________________________ Texas Higher Education Coordinating Board
2007-2011 Agency Strategic Plan
D-5
Measure Definition
Percentage increase in bachelor’s degrees, associate’s degrees, and certificates awarded since those awarded Fall 1999 through Summer 2000 (Outcome A.1-2)
Short Definition: Percent Increase in Bachelor's Degrees, Associate's Degrees, and
Certificates Awarded since those awarded Fall 1999 through Summer 2000. Purpose: This measure provides an indication of the state’s progress towards the
second goal, Closing the Gaps in Success: By 2015, increase by 50 percent the number of degrees, certificates and other identifiable student successes from high quality programs.
Data Source: Data on public institutions will come from the Coordinating Board CBM009
degrees reported each fall for the preceding academic year. Data on independent institutions will come from the Independent Colleges and Universities of Texas (ICUT).
Methodology: Data reported for Texas higher education institutions minus those reported
Fall 2000 for bachelor's degrees, associate's degrees, and certificates awarded divided by the Fall 2000 reported bachelors, associate, and certificates awarded.
Data Limitations: Data are not available until February of the following year. Calculation Type: Non-cumulative New Measure: No Key Measure: Yes Desired Performance: Higher

Appendix D
____________________________________________________________________________________________________________________
____________________________________________________________________________________________________________________ Texas Higher Education Coordinating Board
2007-2011 Agency Strategic Plan
D-6
Measure Definition
Increase in the number of bachelor’s degrees, associate’s degrees, and certificates reported since those awarded Fall 1999 through Summer 2000 (Output A.1.2-2)
Short Definition: Increase in the number of bachelor's degrees, associate's degrees, and
certificates reported since those awarded Fall 1999 through Summer 2000 (reported Fall 2000).
Purpose: This measure provides an indication of the state’s progress towards the
second goal, Closing the Gaps in Success: By 2015, increase by 50 percent the number of degrees, certificates and other identifiable student successes from high quality programs.
Data Source: Data on public institutions will come from the Coordinating Board CBM009
degrees reported each fall for the preceding academic year. Data on independent institutions will come from the Independent Colleges and Universities of Texas (ICUT).
Methodology: Data reported for Texas higher education institutions minus those reported
Fall 2000 for bachelor's degrees, associate's degrees, and certificates awarded.
Data Limitations: Data are not available until February of the following year. Calculation Type: Non-cumulative New Measure: No Key Measure: Yes Desired Performance: Higher
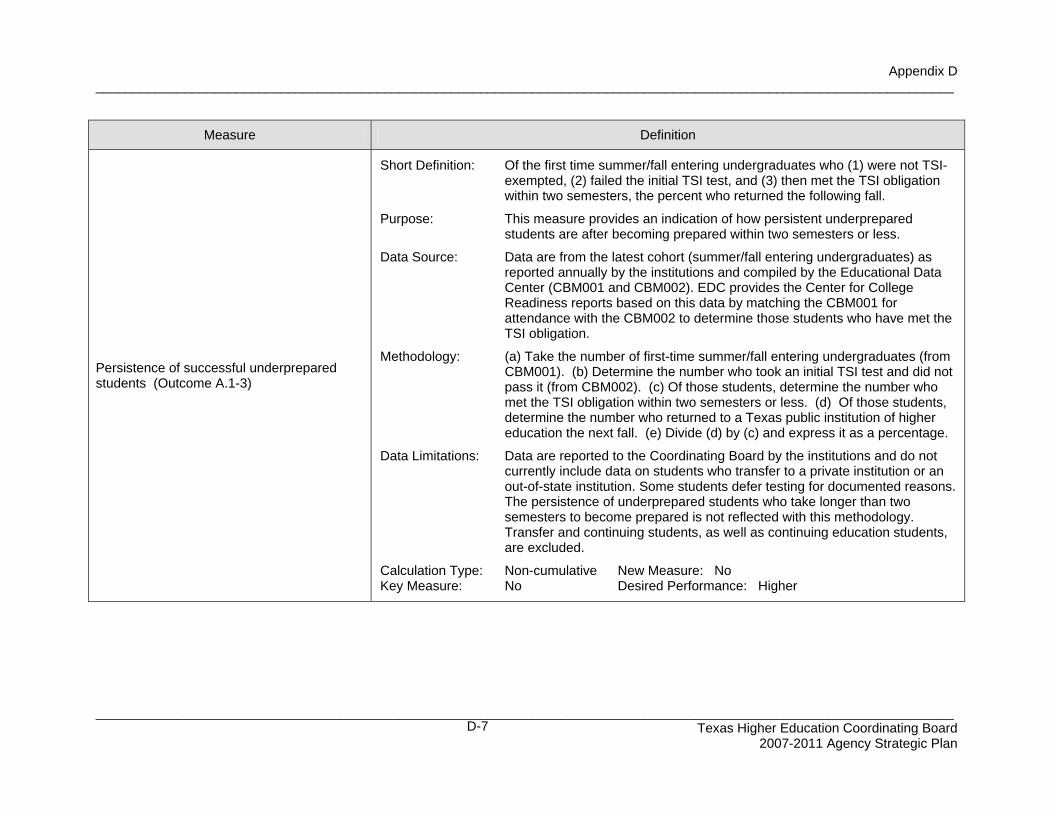
Appendix D
____________________________________________________________________________________________________________________
____________________________________________________________________________________________________________________ Texas Higher Education Coordinating Board
2007-2011 Agency Strategic Plan
D-7
Measure Definition
Persistence of successful underprepared students (Outcome A.1-3)
Short Definition: Of the first time summer/fall entering undergraduates who (1) were not TSI-
exempted, (2) failed the initial TSI test, and (3) then met the TSI obligation within two semesters, the percent who returned the following fall.
Purpose: This measure provides an indication of how persistent underprepared
students are after becoming prepared within two semesters or less. Data Source: Data are from the latest cohort (summer/fall entering undergraduates) as
reported annually by the institutions and compiled by the Educational Data Center (CBM001 and CBM002). EDC provides the Center for College Readiness reports based on this data by matching the CBM001 for attendance with the CBM002 to determine those students who have met the TSI obligation.
Methodology: (a) Take the number of first-time summer/fall entering undergraduates (from
CBM001). (b) Determine the number who took an initial TSI test and did not pass it (from CBM002). (c) Of those students, determine the number who met the TSI obligation within two semesters or less. (d) Of those students, determine the number who returned to a Texas public institution of higher education the next fall. (e) Divide (d) by (c) and express it as a percentage.
Data Limitations: Data are reported to the Coordinating Board by the institutions and do not
currently include data on students who transfer to a private institution or an out-of-state institution. Some students defer testing for documented reasons. The persistence of underprepared students who take longer than two semesters to become prepared is not reflected with this methodology. Transfer and continuing students, as well as continuing education students, are excluded.
Calculation Type: Non-cumulative New Measure: No Key Measure: No Desired Performance: Higher
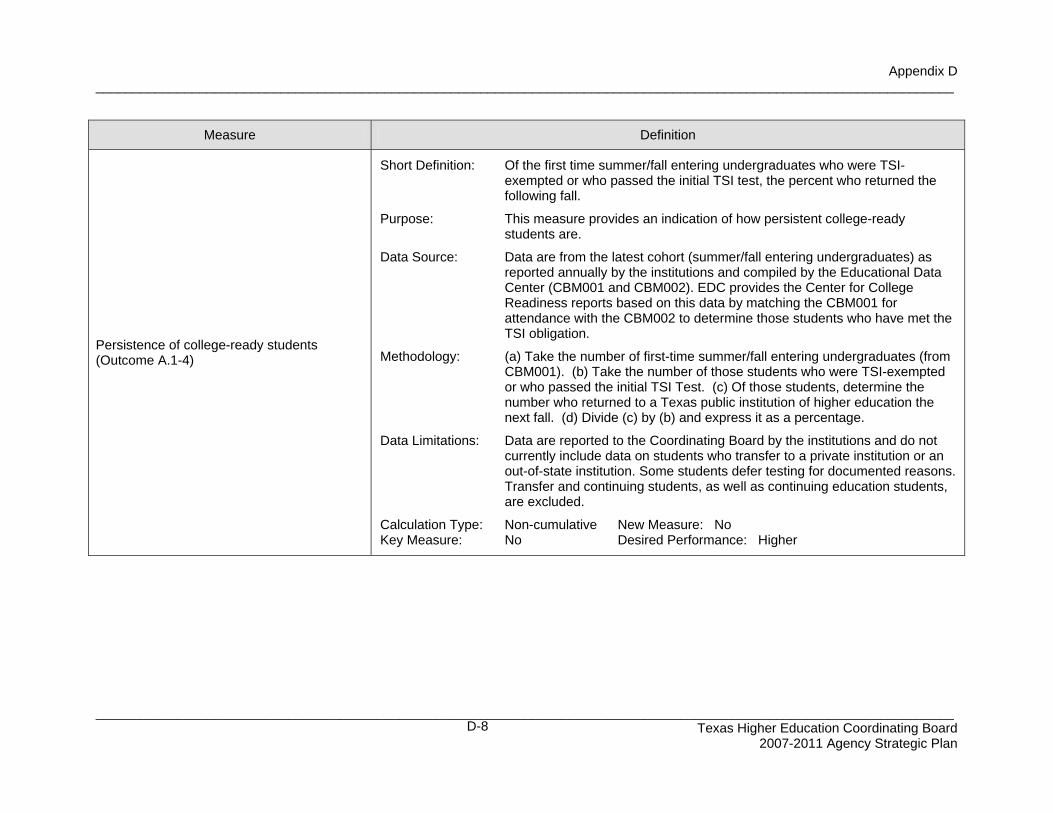
Appendix D
____________________________________________________________________________________________________________________
____________________________________________________________________________________________________________________ Texas Higher Education Coordinating Board
2007-2011 Agency Strategic Plan
D-8
Measure Definition
Persistence of college-ready students (Outcome A.1-4)
Short Definition: Of the first time summer/fall entering undergraduates who were TSI-
exempted or who passed the initial TSI test, the percent who returned the following fall.
Purpose: This measure provides an indication of how persistent college-ready
students are. Data Source: Data are from the latest cohort (summer/fall entering undergraduates) as
reported annually by the institutions and compiled by the Educational Data Center (CBM001 and CBM002). EDC provides the Center for College Readiness reports based on this data by matching the CBM001 for attendance with the CBM002 to determine those students who have met the TSI obligation.
Methodology: (a) Take the number of first-time summer/fall entering undergraduates (from
CBM001). (b) Take the number of those students who were TSI-exempted or who passed the initial TSI Test. (c) Of those students, determine the number who returned to a Texas public institution of higher education the next fall. (d) Divide (c) by (b) and express it as a percentage.
Data Limitations: Data are reported to the Coordinating Board by the institutions and do not
currently include data on students who transfer to a private institution or an out-of-state institution. Some students defer testing for documented reasons. Transfer and continuing students, as well as continuing education students, are excluded.
Calculation Type: Non-cumulative New Measure: No Key Measure: No Desired Performance: Higher
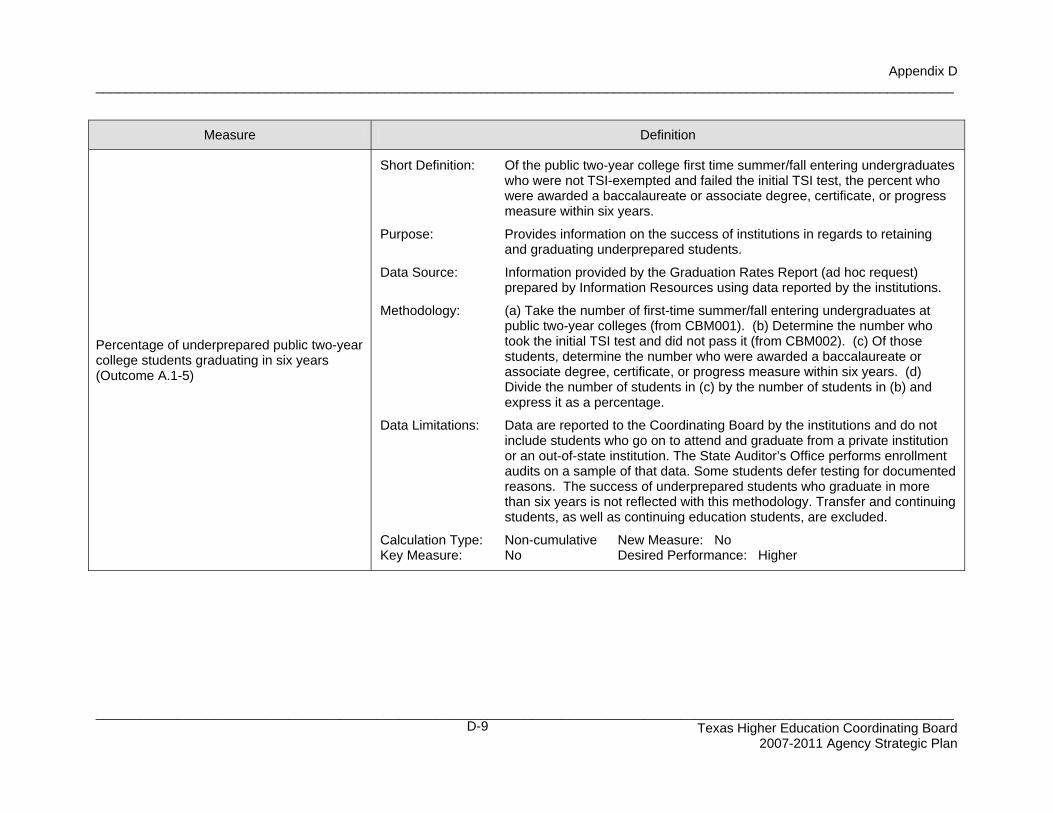
Appendix D
____________________________________________________________________________________________________________________
____________________________________________________________________________________________________________________ Texas Higher Education Coordinating Board
2007-2011 Agency Strategic Plan
D-9
Measure Definition
Percentage of underprepared public two-year college students graduating in six years (Outcome A.1-5)
Short Definition: Of the public two-year college first time summer/fall entering undergraduates
who were not TSI-exempted and failed the initial TSI test, the percent who were awarded a baccalaureate or associate degree, certificate, or progress measure within six years.
Purpose: Provides information on the success of institutions in regards to retaining
and graduating underprepared students. Data Source: Information provided by the Graduation Rates Report (ad hoc request)
prepared by Information Resources using data reported by the institutions. Methodology: (a) Take the number of first-time summer/fall entering undergraduates at
public two-year colleges (from CBM001). (b) Determine the number who took the initial TSI test and did not pass it (from CBM002). (c) Of those students, determine the number who were awarded a baccalaureate or associate degree, certificate, or progress measure within six years. (d) Divide the number of students in (c) by the number of students in (b) and express it as a percentage.
Data Limitations: Data are reported to the Coordinating Board by the institutions and do not
include students who go on to attend and graduate from a private institution or an out-of-state institution. The State Auditor’s Office performs enrollment audits on a sample of that data. Some students defer testing for documented reasons. The success of underprepared students who graduate in more than six years is not reflected with this methodology. Transfer and continuing students, as well as continuing education students, are excluded.
Calculation Type: Non-cumulative New Measure: No Key Measure: No Desired Performance: Higher
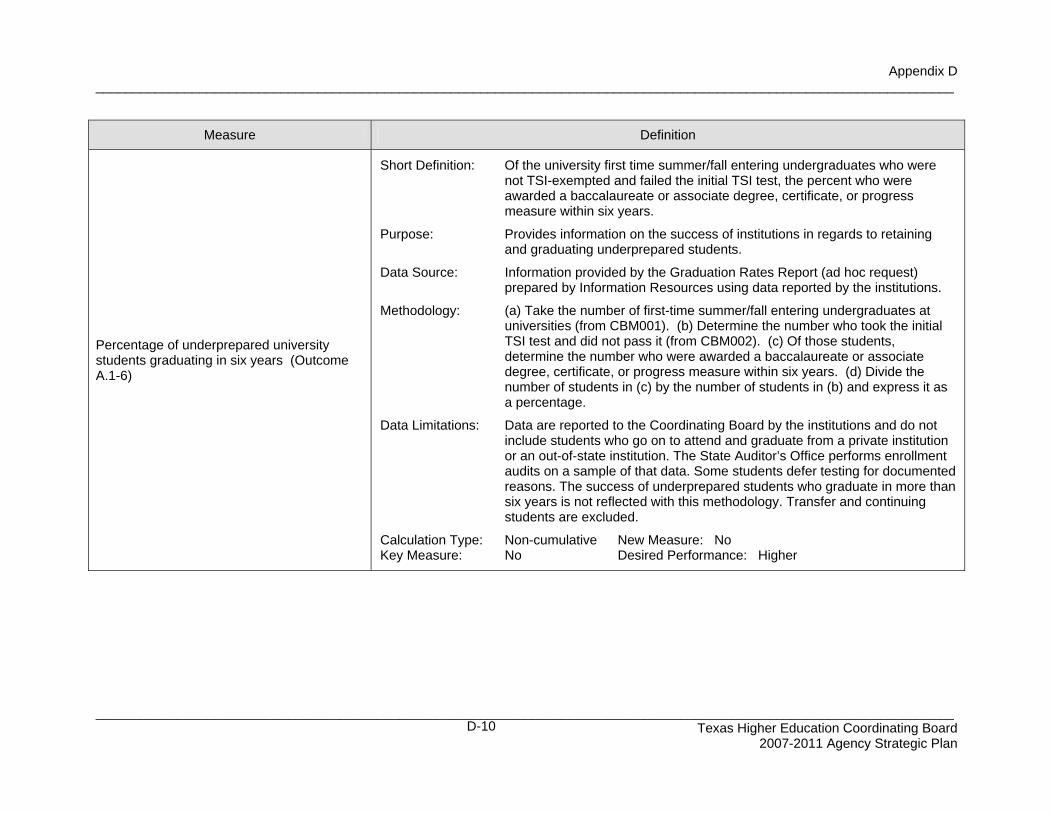
Appendix D
____________________________________________________________________________________________________________________
____________________________________________________________________________________________________________________ Texas Higher Education Coordinating Board
2007-2011 Agency Strategic Plan
D-10
Measure Definition
Percentage of underprepared university students graduating in six years (Outcome A.1-6)
Short Definition: Of the university first time summer/fall entering undergraduates who were
not TSI-exempted and failed the initial TSI test, the percent who were awarded a baccalaureate or associate degree, certificate, or progress measure within six years.
Purpose: Provides information on the success of institutions in regards to retaining
and graduating underprepared students. Data Source: Information provided by the Graduation Rates Report (ad hoc request)
prepared by Information Resources using data reported by the institutions. Methodology: (a) Take the number of first-time summer/fall entering undergraduates at
universities (from CBM001). (b) Determine the number who took the initial TSI test and did not pass it (from CBM002). (c) Of those students, determine the number who were awarded a baccalaureate or associate degree, certificate, or progress measure within six years. (d) Divide the number of students in (c) by the number of students in (b) and express it as a percentage.
Data Limitations: Data are reported to the Coordinating Board by the institutions and do not
include students who go on to attend and graduate from a private institution or an out-of-state institution. The State Auditor’s Office performs enrollment audits on a sample of that data. Some students defer testing for documented reasons. The success of underprepared students who graduate in more than six years is not reflected with this methodology. Transfer and continuing students are excluded.
Calculation Type: Non-cumulative New Measure: No Key Measure: No Desired Performance: Higher
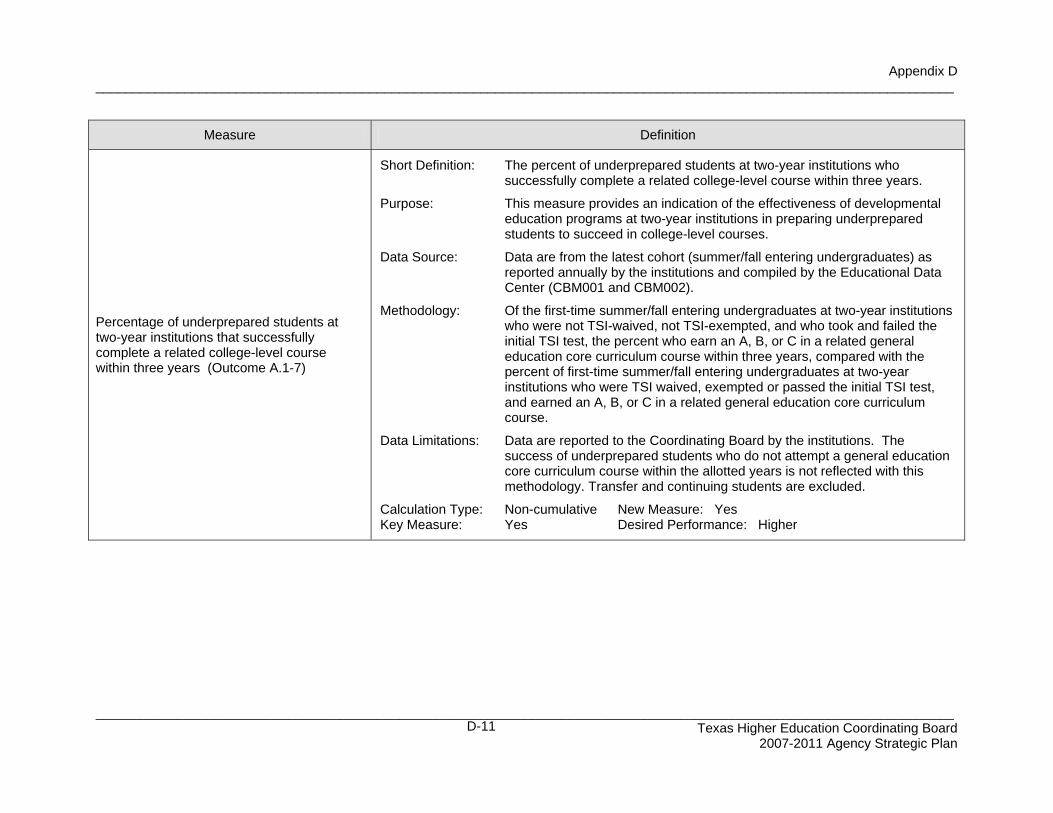
Appendix D
____________________________________________________________________________________________________________________
____________________________________________________________________________________________________________________ Texas Higher Education Coordinating Board
2007-2011 Agency Strategic Plan
D-11
Measure Definition
Percentage of underprepared students at two-year institutions that successfully complete a related college-level course within three years (Outcome A.1-7)
Short Definition: The percent of underprepared students at two-year institutions who
successfully complete a related college-level course within three years. Purpose: This measure provides an indication of the effectiveness of developmental
education programs at two-year institutions in preparing underprepared students to succeed in college-level courses.
Data Source: Data are from the latest cohort (summer/fall entering undergraduates) as
reported annually by the institutions and compiled by the Educational Data Center (CBM001 and CBM002).
Methodology: Of the first-time summer/fall entering undergraduates at two-year institutions
who were not TSI-waived, not TSI-exempted, and who took and failed the initial TSI test, the percent who earn an A, B, or C in a related general education core curriculum course within three years, compared with the percent of first-time summer/fall entering undergraduates at two-year institutions who were TSI waived, exempted or passed the initial TSI test, and earned an A, B, or C in a related general education core curriculum course.
Data Limitations: Data are reported to the Coordinating Board by the institutions. The
success of underprepared students who do not attempt a general education core curriculum course within the allotted years is not reflected with this methodology. Transfer and continuing students are excluded.
Calculation Type: Non-cumulative New Measure: Yes Key Measure: Yes Desired Performance: Higher

Appendix D
____________________________________________________________________________________________________________________
____________________________________________________________________________________________________________________ Texas Higher Education Coordinating Board
2007-2011 Agency Strategic Plan
D-12
Measure Definition
Percentage of underprepared students at four-year institutions that successfully complete a related college-level course within three years (Outcome A.1-8)
Short Definition: The percent of underprepared students at four-year institutions who
successfully complete a related college-level course within three years. Purpose: This measure provides an indication of the effectiveness of developmental
education programs at four-year institutions in preparing underprepared students to succeed in college-level courses.
Data Source: Data are from the latest cohort (summer/fall entering undergraduates) as
reported annually by the institutions and compiled by the Educational Data Center (CBM001 and CBM002).
Methodology: Of the first-time summer/fall entering undergraduates at four-year institutions
who were not TSI-waived, not TSI-exempted, and who took and failed the initial TSI test, the percent who earn an A, B, or C in a related general education core curriculum course within three years, compared with the percent of first-time summer/fall entering undergraduates at four-year institutions who were TSI waived, exempted or passed the initial TSI test, and earned an A, B, or C in a related general education core curriculum course.
Data Limitations: Data are reported to the Coordinating Board by the institutions. The
success of underprepared students who do not attempt a general education core curriculum course within the allotted years is not reflected with this methodology. Transfer and continuing students are excluded.
Calculation Type: Non-cumulative New Measure: Yes Key Measure: Yes Desired Performance: Higher

Appendix D
____________________________________________________________________________________________________________________
____________________________________________________________________________________________________________________ Texas Higher Education Coordinating Board
2007-2011 Agency Strategic Plan
D-13
Measure Definition
Percentage of university students graduating within four years (Outcome A.1-9)
Short Definition: Number of students who entered Texas public universities four years ago as
first-time full-time undergraduates (taking at least twelve semester credit hours) who received a baccalaureate degree during that four-year period divided by the total number of students who entered Texas public universities four years ago as first-time full-time undergraduates (taking at least twelve semester credit hours).
Purpose: Provides information on the success of institutions in regards to retaining
and graduating students. Data Source: Information provided by the Graduation Rates Report prepared by
Information Resources using data reported by the institutions. Methodology: Track incoming first-time full-time summer/fall entering undergraduates by
SSN for four years. Take the number that graduate from a public institution and divide by the total cohort.
Data Limitations: Data are reported to the Coordinating Board by the institutions. The State
Auditor’s Office performs enrollment audits on a sample of that data. We do not have data on students who go on to attend and graduate from a private institution or an out-of-state institution.
Calculation Type: Non-cumulative New Measure: No Key Measure: Yes Desired Performance: Higher
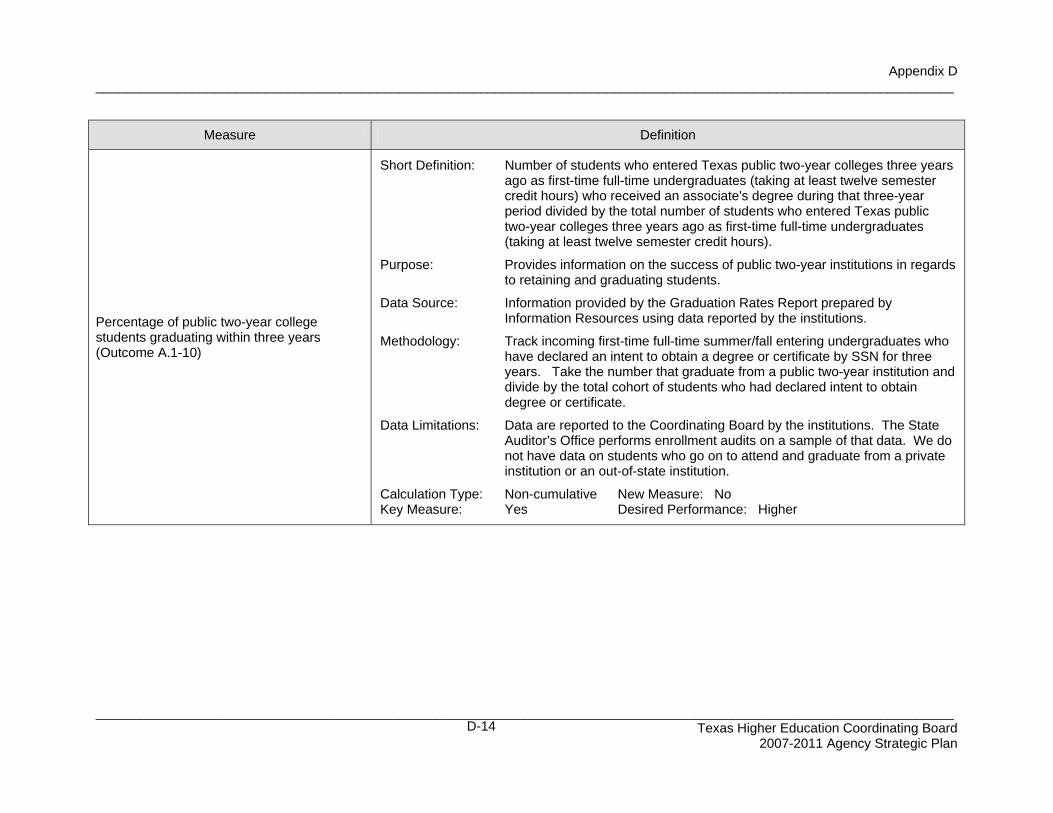
Appendix D
____________________________________________________________________________________________________________________
____________________________________________________________________________________________________________________ Texas Higher Education Coordinating Board
2007-2011 Agency Strategic Plan
D-14
Measure Definition
Percentage of public two-year college students graduating within three years (Outcome A.1-10)
Short Definition: Number of students who entered Texas public two-year colleges three years
ago as first-time full-time undergraduates (taking at least twelve semester credit hours) who received an associate's degree during that three-year period divided by the total number of students who entered Texas public two-year colleges three years ago as first-time full-time undergraduates (taking at least twelve semester credit hours).
Purpose: Provides information on the success of public two-year institutions in regards
to retaining and graduating students. Data Source: Information provided by the Graduation Rates Report prepared by
Information Resources using data reported by the institutions. Methodology: Track incoming first-time full-time summer/fall entering undergraduates who
have declared an intent to obtain a degree or certificate by SSN for three years. Take the number that graduate from a public two-year institution and divide by the total cohort of students who had declared intent to obtain degree or certificate.
Data Limitations: Data are reported to the Coordinating Board by the institutions. The State
Auditor’s Office performs enrollment audits on a sample of that data. We do not have data on students who go on to attend and graduate from a private institution or an out-of-state institution.
Calculation Type: Non-cumulative New Measure: No Key Measure: Yes Desired Performance: Higher
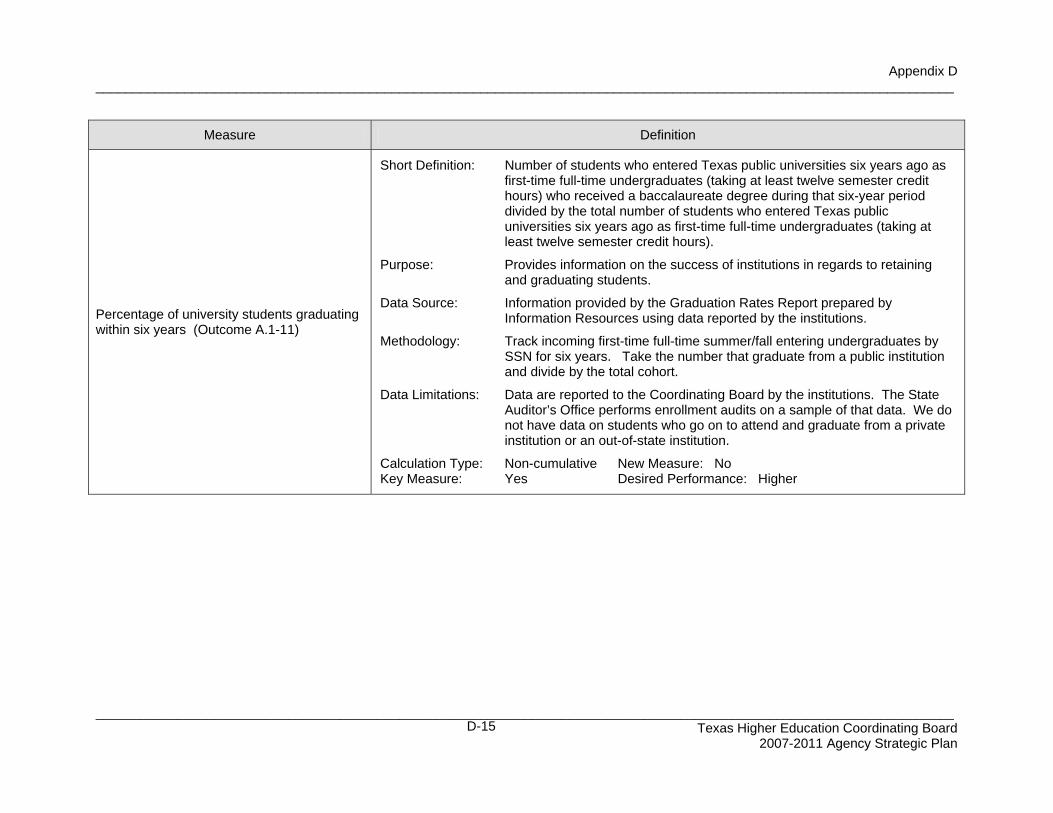
Appendix D
____________________________________________________________________________________________________________________
____________________________________________________________________________________________________________________ Texas Higher Education Coordinating Board
2007-2011 Agency Strategic Plan
D-15
Measure Definition
Percentage of university students graduating within six years (Outcome A.1-11)
Short Definition: Number of students who entered Texas public universities six years ago as
first-time full-time undergraduates (taking at least twelve semester credit hours) who received a baccalaureate degree during that six-year period divided by the total number of students who entered Texas public universities six years ago as first-time full-time undergraduates (taking at least twelve semester credit hours).
Purpose: Provides information on the success of institutions in regards to retaining
and graduating students. Data Source: Information provided by the Graduation Rates Report prepared by
Information Resources using data reported by the institutions. Methodology: Track incoming first-time full-time summer/fall entering undergraduates by
SSN for six years. Take the number that graduate from a public institution and divide by the total cohort.
Data Limitations: Data are reported to the Coordinating Board by the institutions. The State
Auditor’s Office performs enrollment audits on a sample of that data. We do not have data on students who go on to attend and graduate from a private institution or an out-of-state institution.
Calculation Type: Non-cumulative New Measure: No Key Measure: Yes Desired Performance: Higher
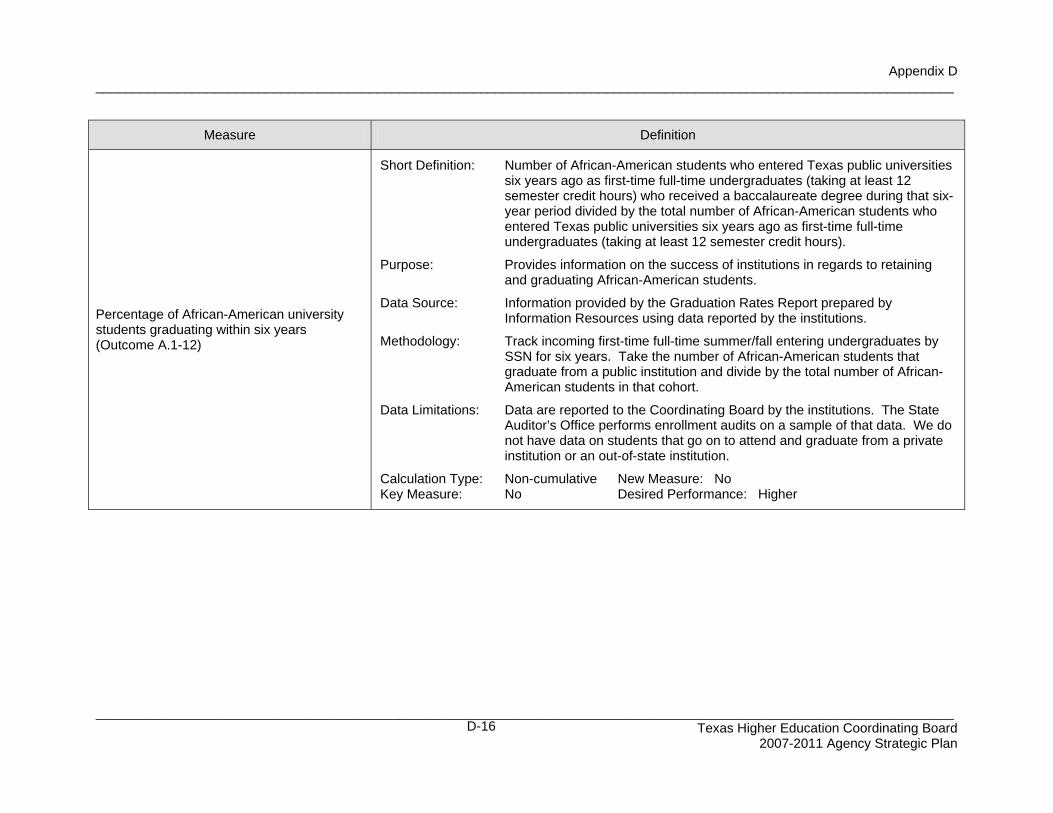
Appendix D
____________________________________________________________________________________________________________________
____________________________________________________________________________________________________________________ Texas Higher Education Coordinating Board
2007-2011 Agency Strategic Plan
D-16
Measure Definition
Percentage of African-American university students graduating within six years (Outcome A.1-12)
Short Definition: Number of African-American students who entered Texas public universities
six years ago as first-time full-time undergraduates (taking at least 12 semester credit hours) who received a baccalaureate degree during that six-year period divided by the total number of African-American students who entered Texas public universities six years ago as first-time full-time undergraduates (taking at least 12 semester credit hours).
Purpose: Provides information on the success of institutions in regards to retaining
and graduating African-American students. Data Source: Information provided by the Graduation Rates Report prepared by
Information Resources using data reported by the institutions. Methodology: Track incoming first-time full-time summer/fall entering undergraduates by
SSN for six years. Take the number of African-American students that graduate from a public institution and divide by the total number of African-American students in that cohort.
Data Limitations: Data are reported to the Coordinating Board by the institutions. The State
Auditor’s Office performs enrollment audits on a sample of that data. We do not have data on students that go on to attend and graduate from a private institution or an out-of-state institution.
Calculation Type: Non-cumulative New Measure: No Key Measure: No Desired Performance: Higher
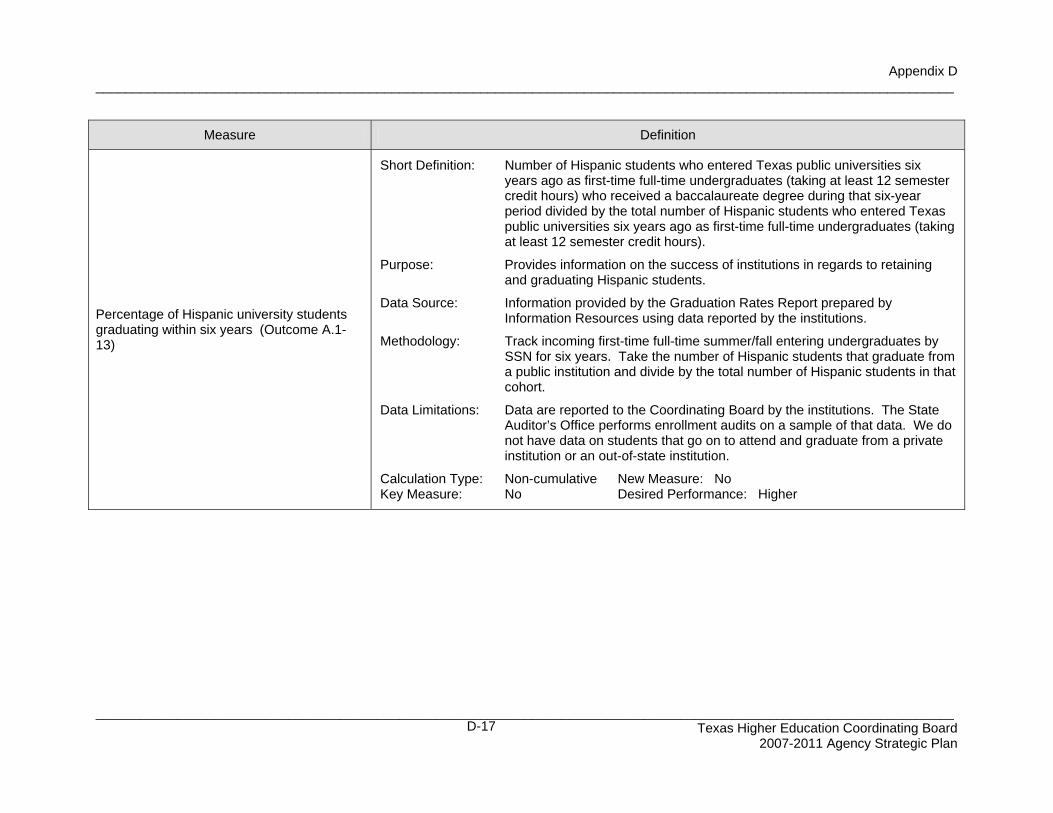
Appendix D
____________________________________________________________________________________________________________________
____________________________________________________________________________________________________________________ Texas Higher Education Coordinating Board
2007-2011 Agency Strategic Plan
D-17
Measure Definition
Percentage of Hispanic university students graduating within six years (Outcome A.1-13)
Short Definition: Number of Hispanic students who entered Texas public universities six
years ago as first-time full-time undergraduates (taking at least 12 semester credit hours) who received a baccalaureate degree during that six-year period divided by the total number of Hispanic students who entered Texas public universities six years ago as first-time full-time undergraduates (taking at least 12 semester credit hours).
Purpose: Provides information on the success of institutions in regards to retaining
and graduating Hispanic students. Data Source: Information provided by the Graduation Rates Report prepared by
Information Resources using data reported by the institutions. Methodology: Track incoming first-time full-time summer/fall entering undergraduates by
SSN for six years. Take the number of Hispanic students that graduate from a public institution and divide by the total number of Hispanic students in that cohort.
Data Limitations: Data are reported to the Coordinating Board by the institutions. The State
Auditor’s Office performs enrollment audits on a sample of that data. We do not have data on students that go on to attend and graduate from a private institution or an out-of-state institution.
Calculation Type: Non-cumulative New Measure: No Key Measure: No Desired Performance: Higher
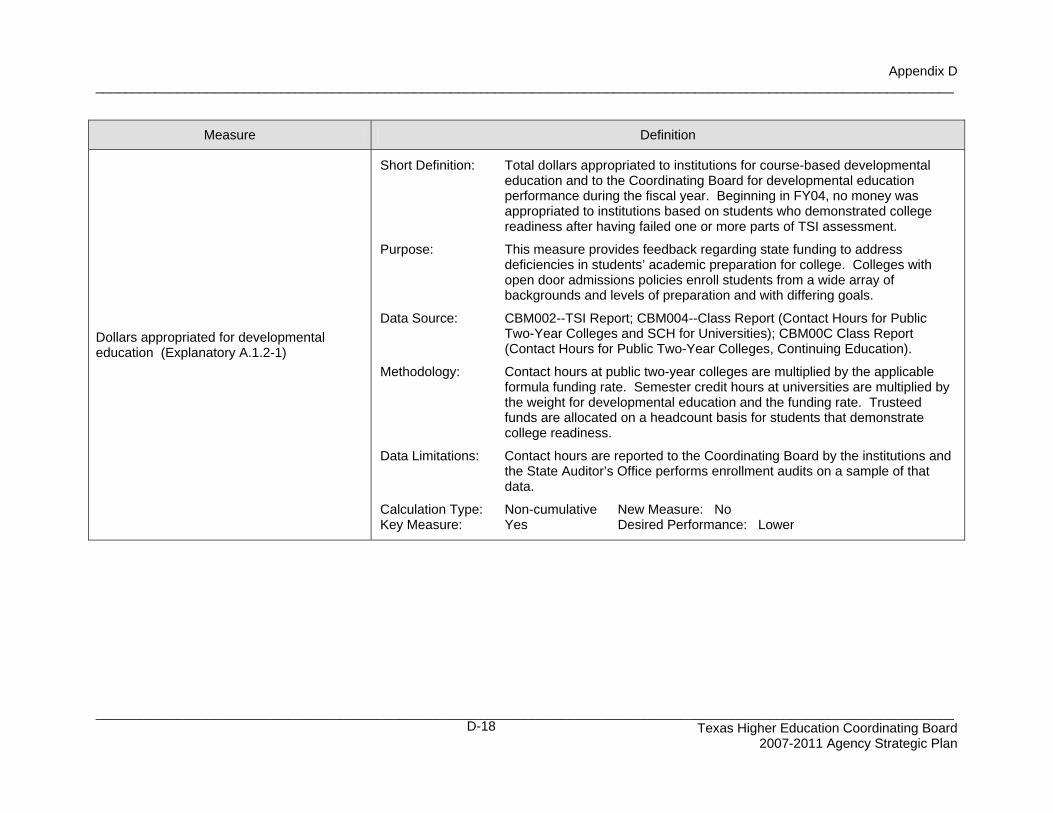
Appendix D
____________________________________________________________________________________________________________________
____________________________________________________________________________________________________________________ Texas Higher Education Coordinating Board
2007-2011 Agency Strategic Plan
D-18
Measure Definition
Dollars appropriated for developmental education (Explanatory A.1.2-1)
Short Definition: Total dollars appropriated to institutions for course-based developmental
education and to the Coordinating Board for developmental education performance during the fiscal year. Beginning in FY04, no money was appropriated to institutions based on students who demonstrated college readiness after having failed one or more parts of TSI assessment.
Purpose: This measure provides feedback regarding state funding to address
deficiencies in students’ academic preparation for college. Colleges with open door admissions policies enroll students from a wide array of backgrounds and levels of preparation and with differing goals.
Data Source: CBM002--TSI Report; CBM004--Class Report (Contact Hours for Public
Two-Year Colleges and SCH for Universities); CBM00C Class Report (Contact Hours for Public Two-Year Colleges, Continuing Education).
Methodology: Contact hours at public two-year colleges are multiplied by the applicable
formula funding rate. Semester credit hours at universities are multiplied by the weight for developmental education and the funding rate. Trusteed funds are allocated on a headcount basis for students that demonstrate college readiness.
Data Limitations: Contact hours are reported to the Coordinating Board by the institutions and
the State Auditor’s Office performs enrollment audits on a sample of that data.
Calculation Type: Non-cumulative New Measure: No Key Measure: Yes Desired Performance: Lower
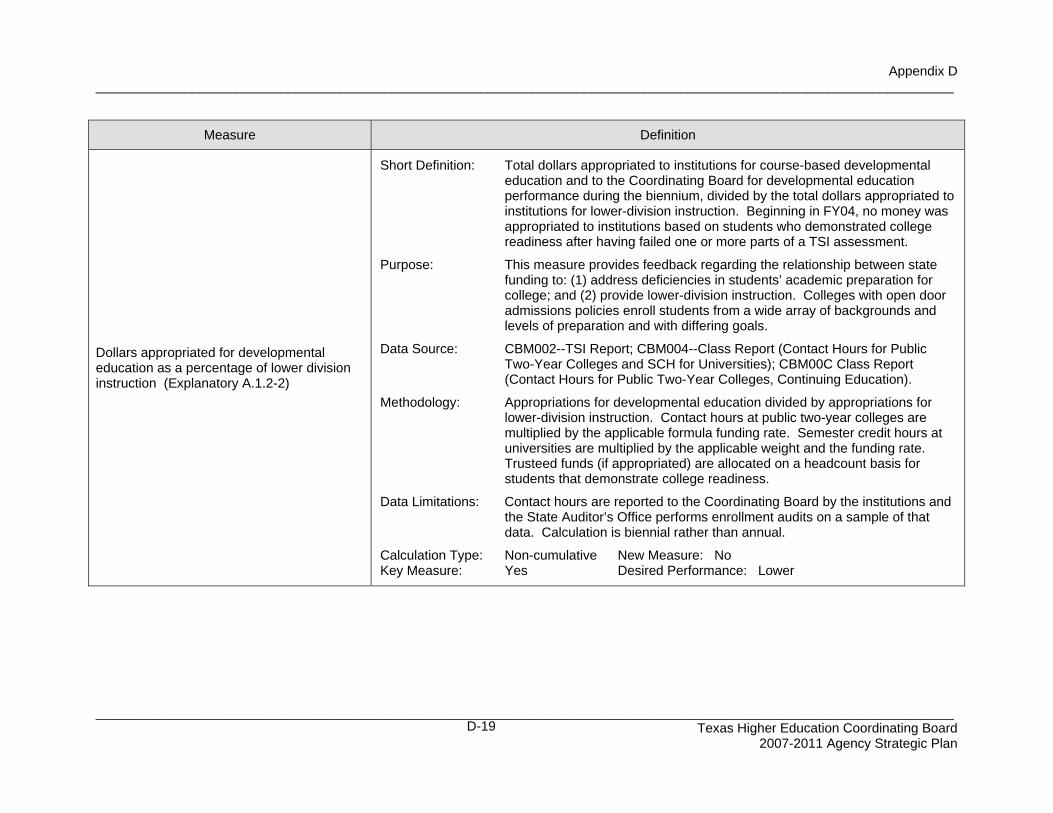
Appendix D
____________________________________________________________________________________________________________________
____________________________________________________________________________________________________________________ Texas Higher Education Coordinating Board
2007-2011 Agency Strategic Plan
D-19
Measure Definition
Dollars appropriated for developmental education as a percentage of lower division instruction (Explanatory A.1.2-2)
Short Definition: Total dollars appropriated to institutions for course-based developmental
education and to the Coordinating Board for developmental education performance during the biennium, divided by the total dollars appropriated to institutions for lower-division instruction. Beginning in FY04, no money was appropriated to institutions based on students who demonstrated college readiness after having failed one or more parts of a TSI assessment.
Purpose: This measure provides feedback regarding the relationship between state
funding to: (1) address deficiencies in students’ academic preparation for college; and (2) provide lower-division instruction. Colleges with open door admissions policies enroll students from a wide array of backgrounds and levels of preparation and with differing goals.
Data Source: CBM002--TSI Report; CBM004--Class Report (Contact Hours for Public
Two-Year Colleges and SCH for Universities); CBM00C Class Report (Contact Hours for Public Two-Year Colleges, Continuing Education).
Methodology: Appropriations for developmental education divided by appropriations for
lower-division instruction. Contact hours at public two-year colleges are multiplied by the applicable formula funding rate. Semester credit hours at universities are multiplied by the applicable weight and the funding rate. Trusteed funds (if appropriated) are allocated on a headcount basis for students that demonstrate college readiness.
Data Limitations: Contact hours are reported to the Coordinating Board by the institutions and
the State Auditor’s Office performs enrollment audits on a sample of that data. Calculation is biennial rather than annual.
Calculation Type: Non-cumulative New Measure: No Key Measure: Yes Desired Performance: Lower
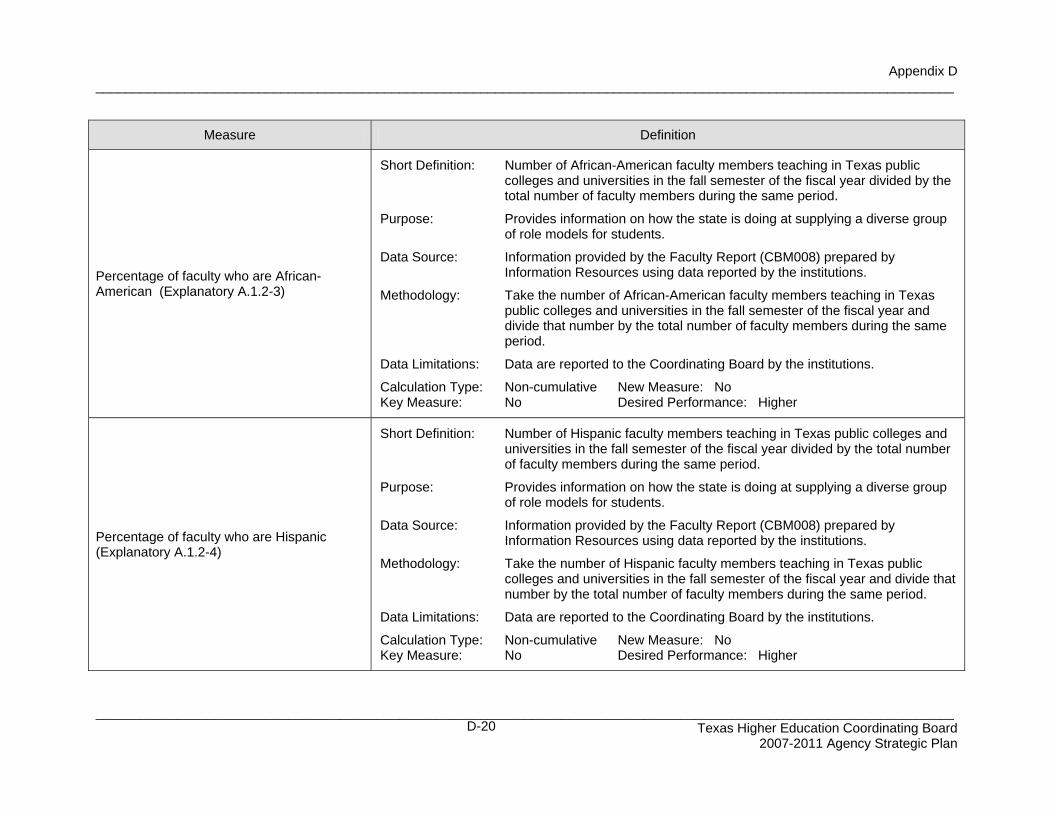
Appendix D
____________________________________________________________________________________________________________________
____________________________________________________________________________________________________________________ Texas Higher Education Coordinating Board
2007-2011 Agency Strategic Plan
D-20
Measure Definition
Percentage of faculty who are African-American (Explanatory A.1.2-3)
Short Definition: Number of African-American faculty members teaching in Texas public
colleges and universities in the fall semester of the fiscal year divided by the total number of faculty members during the same period.
Purpose: Provides information on how the state is doing at supplying a diverse group
of role models for students. Data Source: Information provided by the Faculty Report (CBM008) prepared by
Information Resources using data reported by the institutions. Methodology: Take the number of African-American faculty members teaching in Texas
public colleges and universities in the fall semester of the fiscal year and divide that number by the total number of faculty members during the same period.
Data Limitations: Data are reported to the Coordinating Board by the institutions. Calculation Type: Non-cumulative New Measure: No Key Measure: No Desired Performance: Higher
Percentage of faculty who are Hispanic (Explanatory A.1.2-4)
Short Definition: Number of Hispanic faculty members teaching in Texas public colleges and
universities in the fall semester of the fiscal year divided by the total number of faculty members during the same period.
Purpose: Provides information on how the state is doing at supplying a diverse group
of role models for students. Data Source: Information provided by the Faculty Report (CBM008) prepared by
Information Resources using data reported by the institutions. Methodology: Take the number of Hispanic faculty members teaching in Texas public
colleges and universities in the fall semester of the fiscal year and divide that number by the total number of faculty members during the same period.
Data Limitations: Data are reported to the Coordinating Board by the institutions. Calculation Type: Non-cumulative New Measure: No Key Measure: No Desired Performance: Higher
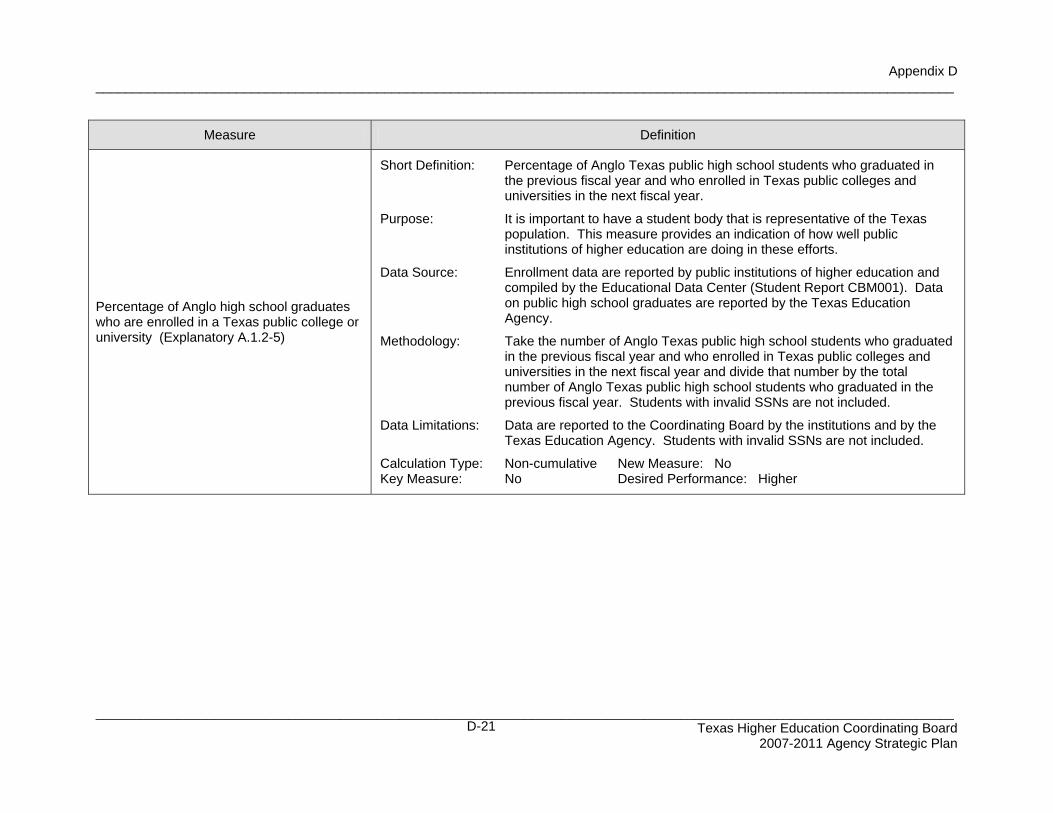
Appendix D
____________________________________________________________________________________________________________________
____________________________________________________________________________________________________________________ Texas Higher Education Coordinating Board
2007-2011 Agency Strategic Plan
D-21
Measure Definition
Percentage of Anglo high school graduates who are enrolled in a Texas public college or university (Explanatory A.1.2-5)
Short Definition: Percentage of Anglo Texas public high school students who graduated in
the previous fiscal year and who enrolled in Texas public colleges and universities in the next fiscal year.
Purpose: It is important to have a student body that is representative of the Texas
population. This measure provides an indication of how well public institutions of higher education are doing in these efforts.
Data Source: Enrollment data are reported by public institutions of higher education and
compiled by the Educational Data Center (Student Report CBM001). Data on public high school graduates are reported by the Texas Education Agency.
Methodology: Take the number of Anglo Texas public high school students who graduated
in the previous fiscal year and who enrolled in Texas public colleges and universities in the next fiscal year and divide that number by the total number of Anglo Texas public high school students who graduated in the previous fiscal year. Students with invalid SSNs are not included.
Data Limitations: Data are reported to the Coordinating Board by the institutions and by the
Texas Education Agency. Students with invalid SSNs are not included. Calculation Type: Non-cumulative New Measure: No Key Measure: No Desired Performance: Higher
Appendix D
____________________________________________________________________________________________________________________
____________________________________________________________________________________________________________________ Texas Higher Education Coordinating Board
2007-2011 Agency Strategic Plan
D-22
Measure Definition
Percentage of African-American high school graduates who are enrolled in a Texas public college or university (Explanatory A.1.2-6)
Short Definition: Percentage of African-American Texas public high school students who
graduated in the previous fiscal year and who enrolled in Texas public colleges and universities in the next fiscal year.
Purpose: It is important to have a student body that is representative of the Texas
population. This measure provides an indication of how well public institutions of higher education are doing in these efforts.
Data Source: Enrollment data are reported by public institutions of higher education and
compiled by the Educational Data Center (Student Report CBM001). Data on public high school graduates are reported by the Texas Education Agency.
Methodology: Take the number of African-American Texas public high school students
who graduated in the previous fiscal year and who enrolled in Texas public colleges and universities in the next fiscal year and divide that number by the total number of African-American Texas public high school students who graduated in the previous fiscal year. Students with invalid SSNs are not included.
Data Limitations: Data are reported to the Coordinating Board by the institutions and by the
Texas Education Agency. Students with invalid SSNs are not included. Calculation Type: Non-cumulative New Measure: No Key Measure: No Desired Performance: Higher

Appendix D
____________________________________________________________________________________________________________________
____________________________________________________________________________________________________________________ Texas Higher Education Coordinating Board
2007-2011 Agency Strategic Plan
D-23
Measure Definition
Percentage of Hispanic high school graduates who are enrolled in a Texas public college or university (Explanatory A.1.2-7)
Short Definition: Percentage of Hispanic Texas public high school students who graduated in
the previous fiscal year and who enrolled in Texas public colleges and universities in the next fiscal year.
Purpose: It is important to have a student body that is representative of the Texas
population. This measure provides an indication of how well public institutions of higher education are doing in these efforts.
Data Source: Enrollment data are reported by public institutions of higher education and
compiled by the Educational Data Center (Student Report CBM001). Data on public high school graduates are reported by the Texas Education Agency.
Methodology: Take the number of Hispanic Texas public high school students who
graduated in the previous fiscal year and who enrolled in Texas public colleges and universities in the next fiscal year and divide that number by the total number of Hispanic Texas public high school students who graduated in the previous fiscal year. Students with invalid SSNs are not included.
Data Limitations: Data are reported to the Coordinating Board by the institutions and by the
Texas Education Agency. Students with invalid SSNs are not included. Calculation Type: Non-cumulative New Measure: No Key Measure: No Desired Performance: Higher

Appendix D
____________________________________________________________________________________________________________________
____________________________________________________________________________________________________________________ Texas Higher Education Coordinating Board
2007-2011 Agency Strategic Plan
D-24
Measure Definition
Percentage of Native American high school graduates who are enrolled in a Texas public college or university (Explanatory A.1.2-8)
Short Definition: Percentage of Native American Texas public high school students who
graduated in the previous fiscal year and who enrolled in Texas public colleges and universities in the next fiscal year.
Purpose: It is important to have a student body that is representative of the Texas
population. This measure provides an indication of how well public institutions of higher education are doing in these efforts.
Data Source: Enrollment data are reported by public institutions of higher education and
compiled by the Educational Data Center (Student Report CBM001). Data on public high school graduates are reported by the Texas Education Agency.
Methodology: Take the number of Native American Texas public high school students who
graduated in the previous fiscal year and who enrolled in Texas public colleges and universities in the next fiscal year and divide that number by the total number of Native American Texas public high school students who graduated in the previous fiscal year. Students with invalid SSNs are not included.
Data Limitations: Data are reported to the Coordinating Board by the institutions and by the
Texas Education Agency. Students with invalid SSNs are not included. Calculation Type: Non-cumulative New Measure: No Key Measure: No Desired Performance: Higher

Appendix D
____________________________________________________________________________________________________________________
____________________________________________________________________________________________________________________ Texas Higher Education Coordinating Board
2007-2011 Agency Strategic Plan
D-25
Measure Definition
Percentage of Asian-American high school graduates who are enrolled in a Texas public college or university (Explanatory A.1.2-9)
Short Definition: Percentage of Asian-American Texas public high school students who
graduated in the previous fiscal year and who enrolled in Texas public colleges and universities in the next fiscal year.
Purpose: It is important to have a student body that is representative of the Texas
population. This measure provides an indication of how well public institutions of higher education are doing in these efforts.
Data Source: Enrollment data are reported by public institutions of higher education and
compiled by the Educational Data Center (Student Report CBM001). Data on public high school graduates are reported by the Texas Education Agency.
Methodology: Take the number of Asian-American Texas public high school students who
graduated in the previous fiscal year and who enrolled in Texas public colleges and universities in the next fiscal year and divide that number by the total number of Asian-American Texas public high school students who graduated in the previous fiscal year. Students with invalid SSNs are not included.
Data Limitations: Data are reported to the Coordinating Board by the institutions and by the
Texas Education Agency. Students with invalid SSNs are not included. Calculation Type: Non-cumulative New Measure: No Key Measure: No Desired Performance: Higher
Appendix D
____________________________________________________________________________________________________________________
____________________________________________________________________________________________________________________ Texas Higher Education Coordinating Board
2007-2011 Agency Strategic Plan
D-26
Measure Definition
Number of grants or scholarships awarded (Output A.1.5-1)
Short Definition: Number of grants, scholarships, work-study and exemptions awarded during
the fiscal year through non-loan financial aid programs administered by the Coordinating Board.
Purpose: This measure provides feedback on the grant and scholarship programs
administered by or funded through the Coordinating Board. It is an aggregate of all such programs.
Data Source: Data are obtained from reports submitted by institutions and from
Coordinating Board mainframe reports and in-house, PC-generated reports. Methodology: Sum the year-to-date number of awards made in the various programs and
net out the total made as of the end of the prior quarter. Data Limitations: For programs with awards issued by the Coordinating Board, the data
should be accurate. For campus-based programs, we are relying on unaudited institutional reports. However, we have no reason to question the accuracy of these reports.
(Note on Desired Performance: The target is based on historic funding and
award patterns. Annual fluctuations can be caused by changes in funding from the state and changes in the awarding philosophy of the institutions which make awards. Colleges may choose to give (1) larger awards to fewer students or (2) smaller awards to more students. If they choose to exercise the first option, performance will be below the target; if they exercise the second option, performance will be above the target.)
Calculation Type: Cumulative New Measure: No Key Measure: No Desired Performance: Higher
Appendix D
____________________________________________________________________________________________________________________
____________________________________________________________________________________________________________________ Texas Higher Education Coordinating Board
2007-2011 Agency Strategic Plan
D-27
Measure Definition
Amount of grant and scholarship funds distributed (in millions) (Output A.1.5-2)
Short Definition: Dollar amount of grant, scholarship, work-study, and exemption funds
distributed by the Coordinating Board during the fiscal year. Most students receive half their funds during the first quarter and the balance during the second quarter.
Purpose: This measure provides feedback on the non-loan programs administered by
or funded through the Coordinating Board. It is an aggregate of all such programs.
Data Source: Data are obtained from reports submitted by institutions and from
Coordinating Board mainframe reports and in-house, PC-generated reports. Methodology: Calculate the year-to-date award totals and net out the amounts issued in
prior quarters. Data Limitations: Institution-reported data are not audited, but we have no reason to question
their accuracy. Calculation Type: Cumulative New Measure: No Key Measure: No Desired Performance: Higher
Appendix D
____________________________________________________________________________________________________________________
____________________________________________________________________________________________________________________ Texas Higher Education Coordinating Board
2007-2011 Agency Strategic Plan
D-28
Measure Definition
Default rate on Hinson-Hazlewood loans (Efficiency A.1.2-1)
Short Definition: Percentage of all Hinson-Hazlewood loans that borrowers fail to repay
(including those that are paid by the guarantor). Purpose: This measure provides an indication of the Student Services Division’s
collection standards and ability to work closely with Hinson-Hazlewood borrowers to help prevent them from defaulting on their loans. When defaults occur, the Student Services Division provides substantial assistance to the Attorney General’s Office in filing suit and securing judgments.
Data Source: Data are obtained from the Analysis of Loans Report generated by the
Coordinating Board mainframe. Methodology: The sum of default claims paid, default claims pending, default claims
unpaid, claims due filing, and accounts referred to the Attorney General’s Office less suits requested but not filed, divided by the grand total of all accounts, less accounts in school and in grace. (The NG portfolio will be not be included in this calculation since these loans are over 30 years old). Default claims paid are accounts that have been paid by the guarantor. Default claims pending have been filed but have not yet been paid or denied. Default claims unpaid are accounts with at least some portion that has been denied payment by the guarantor. Claims due filing are in the process of being filed.
Data Limitations: All information is maintained in-house on the Coordinating Board mainframe,
so the data are highly reliable. Calculation Type: Non-cumulative New Measure: No Key Measure: Yes Desired Performance: Lower
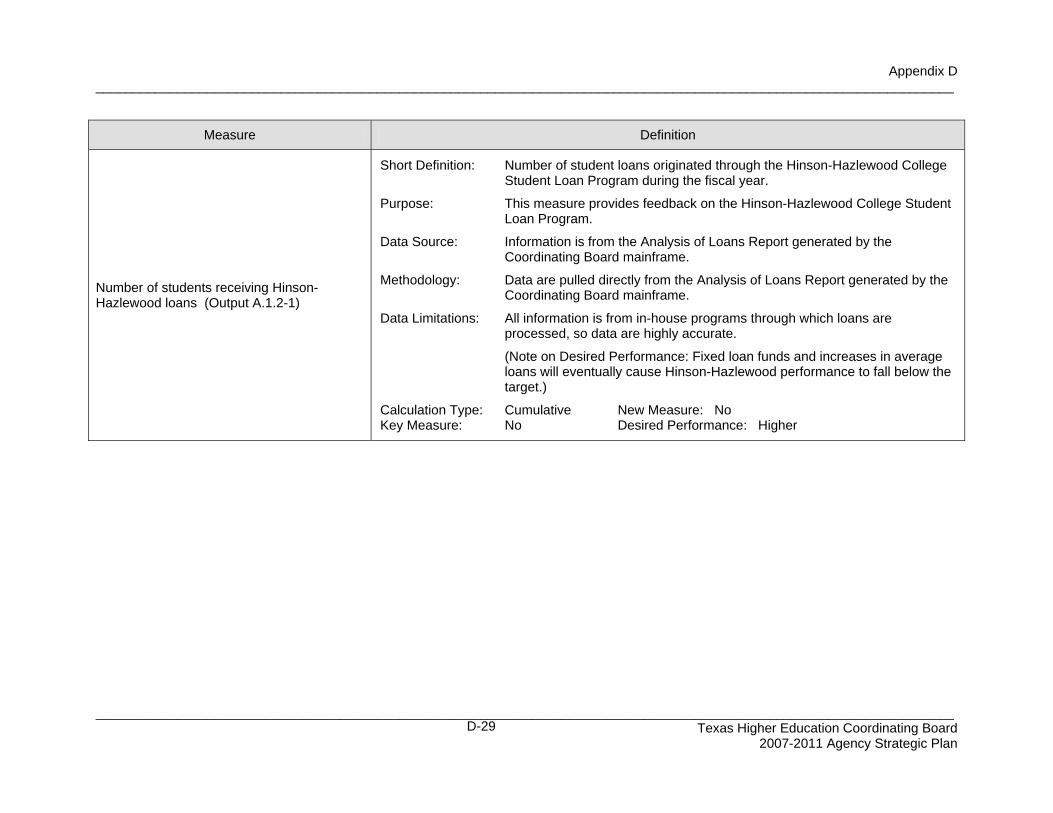
Appendix D
____________________________________________________________________________________________________________________
____________________________________________________________________________________________________________________ Texas Higher Education Coordinating Board
2007-2011 Agency Strategic Plan
D-29
Measure Definition
Number of students receiving Hinson-Hazlewood loans (Output A.1.2-1)
Short Definition: Number of student loans originated through the Hinson-Hazlewood College
Student Loan Program during the fiscal year. Purpose: This measure provides feedback on the Hinson-Hazlewood College Student
Loan Program. Data Source: Information is from the Analysis of Loans Report generated by the
Coordinating Board mainframe. Methodology: Data are pulled directly from the Analysis of Loans Report generated by the
Coordinating Board mainframe. Data Limitations: All information is from in-house programs through which loans are
processed, so data are highly accurate. (Note on Desired Performance: Fixed loan funds and increases in average
loans will eventually cause Hinson-Hazlewood performance to fall below the target.)
Calculation Type: Cumulative New Measure: No Key Measure: No Desired Performance: Higher
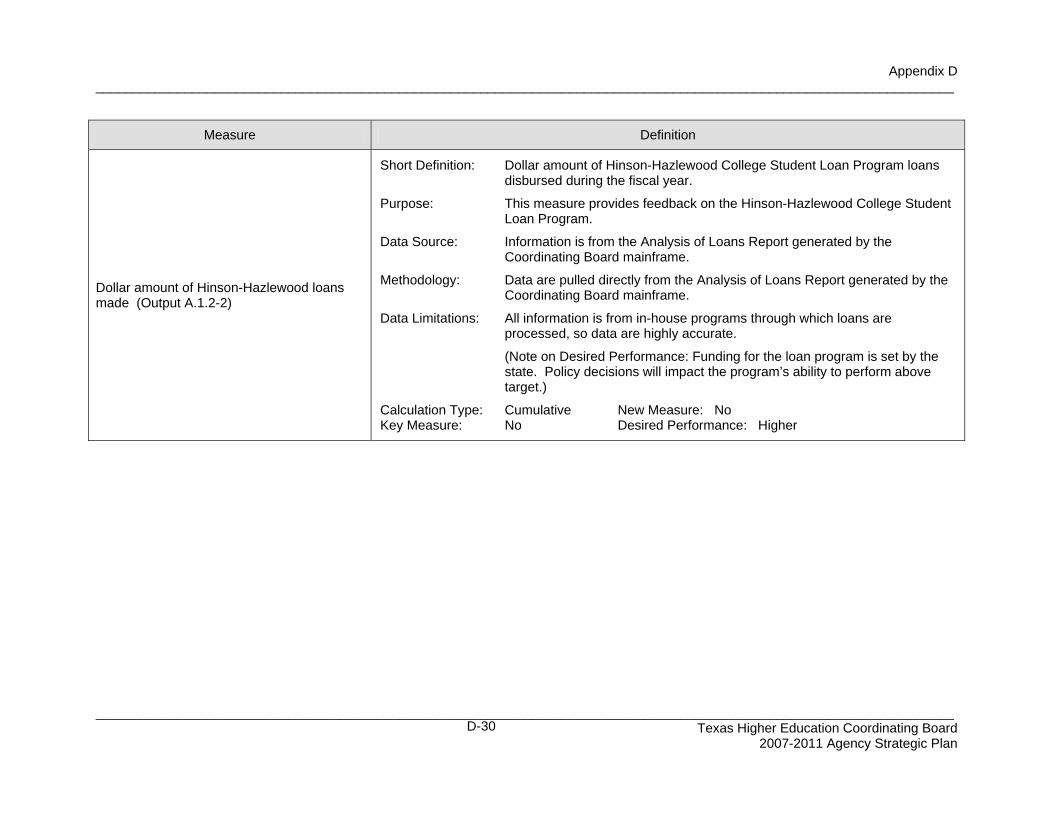
Appendix D
____________________________________________________________________________________________________________________
____________________________________________________________________________________________________________________ Texas Higher Education Coordinating Board
2007-2011 Agency Strategic Plan
D-30
Measure Definition
Dollar amount of Hinson-Hazlewood loans made (Output A.1.2-2)
Short Definition: Dollar amount of Hinson-Hazlewood College Student Loan Program loans
disbursed during the fiscal year. Purpose: This measure provides feedback on the Hinson-Hazlewood College Student
Loan Program. Data Source: Information is from the Analysis of Loans Report generated by the
Coordinating Board mainframe. Methodology: Data are pulled directly from the Analysis of Loans Report generated by the
Coordinating Board mainframe. Data Limitations: All information is from in-house programs through which loans are
processed, so data are highly accurate. (Note on Desired Performance: Funding for the loan program is set by the
state. Policy decisions will impact the program’s ability to perform above target.)
Calculation Type: Cumulative New Measure: No Key Measure: No Desired Performance: Higher
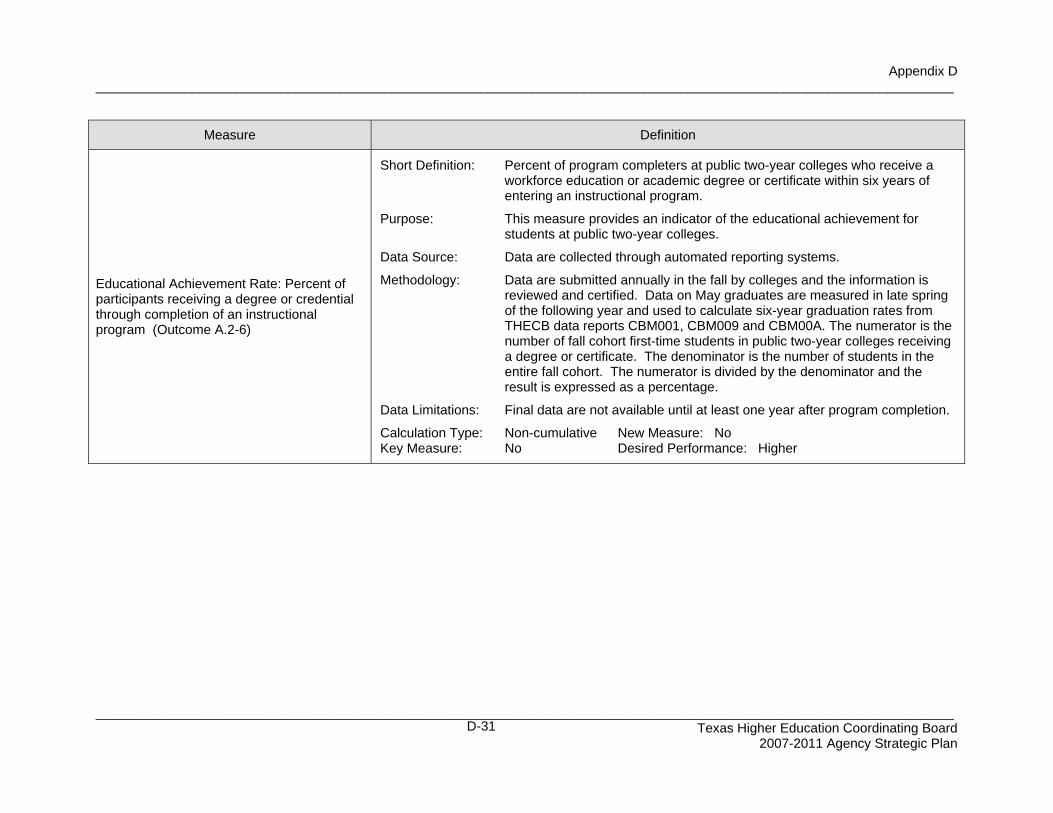
Appendix D
____________________________________________________________________________________________________________________
____________________________________________________________________________________________________________________ Texas Higher Education Coordinating Board
2007-2011 Agency Strategic Plan
D-31
Measure Definition
Educational Achievement Rate: Percent of participants receiving a degree or credential through completion of an instructional program (Outcome A.2-6)
Short Definition: Percent of program completers at public two-year colleges who receive a
workforce education or academic degree or certificate within six years of entering an instructional program.
Purpose: This measure provides an indicator of the educational achievement for
students at public two-year colleges. Data Source: Data are collected through automated reporting systems. Methodology: Data are submitted annually in the fall by colleges and the information is
reviewed and certified. Data on May graduates are measured in late spring of the following year and used to calculate six-year graduation rates from THECB data reports CBM001, CBM009 and CBM00A. The numerator is the number of fall cohort first-time students in public two-year colleges receiving a degree or certificate. The denominator is the number of students in the entire fall cohort. The numerator is divided by the denominator and the result is expressed as a percentage.
Data Limitations: Final data are not available until at least one year after program completion. Calculation Type: Non-cumulative New Measure: No Key Measure: No Desired Performance: Higher
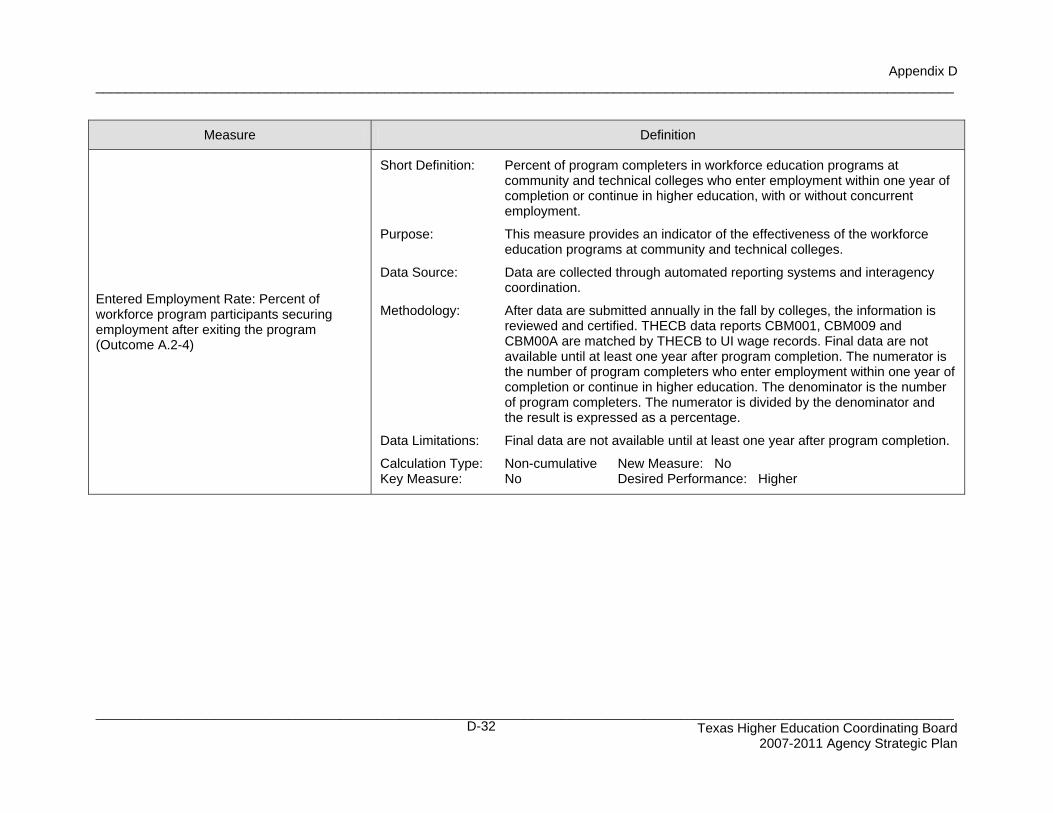
Appendix D
____________________________________________________________________________________________________________________
____________________________________________________________________________________________________________________ Texas Higher Education Coordinating Board
2007-2011 Agency Strategic Plan
D-32
Measure Definition
Entered Employment Rate: Percent of workforce program participants securing employment after exiting the program (Outcome A.2-4)
Short Definition: Percent of program completers in workforce education programs at
community and technical colleges who enter employment within one year of completion or continue in higher education, with or without concurrent employment.
Purpose: This measure provides an indicator of the effectiveness of the workforce
education programs at community and technical colleges. Data Source: Data are collected through automated reporting systems and interagency
coordination. Methodology: After data are submitted annually in the fall by colleges, the information is
reviewed and certified. THECB data reports CBM001, CBM009 and CBM00A are matched by THECB to UI wage records. Final data are not available until at least one year after program completion. The numerator is the number of program completers who enter employment within one year of completion or continue in higher education. The denominator is the number of program completers. The numerator is divided by the denominator and the result is expressed as a percentage.
Data Limitations: Final data are not available until at least one year after program completion. Calculation Type: Non-cumulative New Measure: No Key Measure: No Desired Performance: Higher
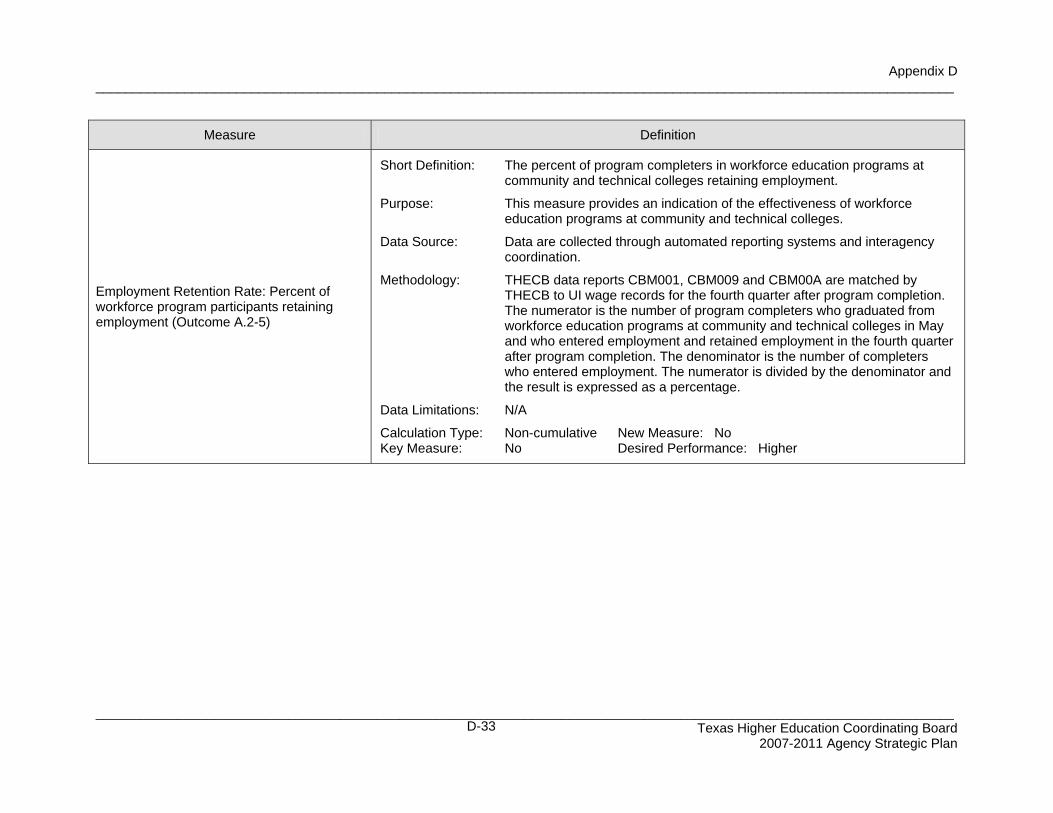
Appendix D
____________________________________________________________________________________________________________________
____________________________________________________________________________________________________________________ Texas Higher Education Coordinating Board
2007-2011 Agency Strategic Plan
D-33
Measure Definition
Employment Retention Rate: Percent of workforce program participants retaining employment (Outcome A.2-5)
Short Definition: The percent of program completers in workforce education programs at
community and technical colleges retaining employment. Purpose: This measure provides an indication of the effectiveness of workforce
education programs at community and technical colleges. Data Source: Data are collected through automated reporting systems and interagency
coordination. Methodology: THECB data reports CBM001, CBM009 and CBM00A are matched by
THECB to UI wage records for the fourth quarter after program completion. The numerator is the number of program completers who graduated from workforce education programs at community and technical colleges in May and who entered employment and retained employment in the fourth quarter after program completion. The denominator is the number of completers who entered employment. The numerator is divided by the denominator and the result is expressed as a percentage.
Data Limitations: N/A Calculation Type: Non-cumulative New Measure: No Key Measure: No Desired Performance: Higher
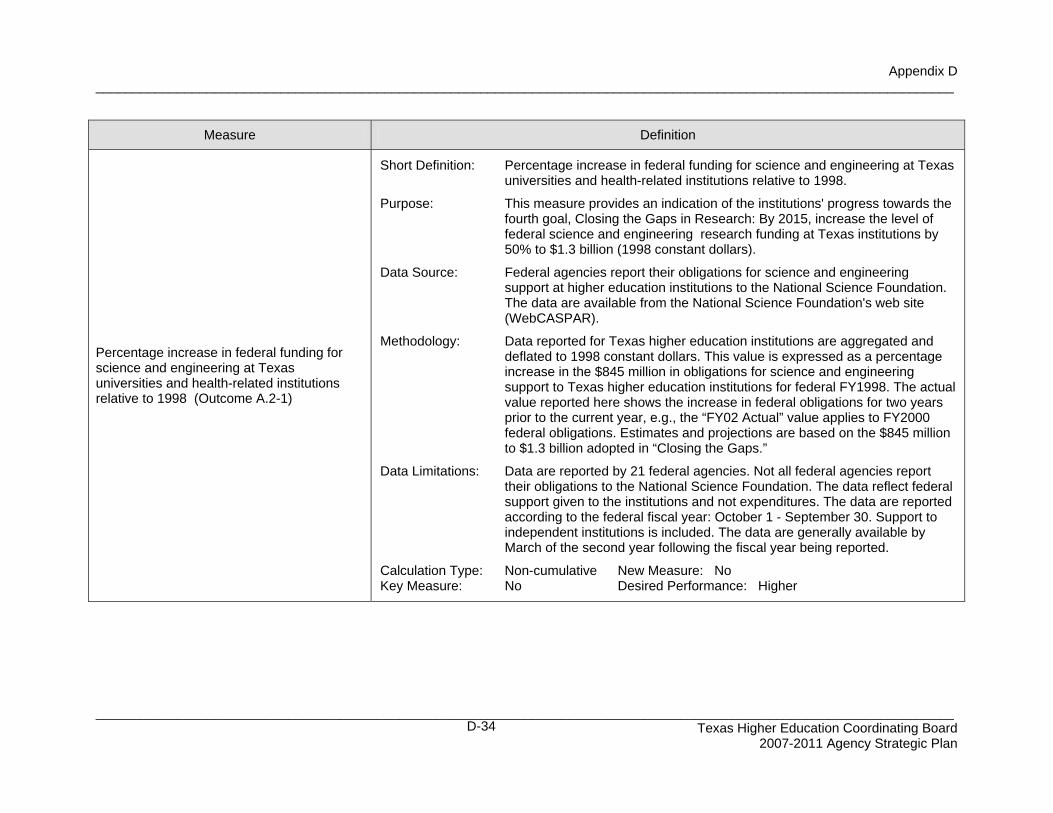
Appendix D
____________________________________________________________________________________________________________________
____________________________________________________________________________________________________________________ Texas Higher Education Coordinating Board
2007-2011 Agency Strategic Plan
D-34
Measure Definition
Percentage increase in federal funding for science and engineering at Texas universities and health-related institutions relative to 1998 (Outcome A.2-1)
Short Definition: Percentage increase in federal funding for science and engineering at Texas
universities and health-related institutions relative to 1998. Purpose: This measure provides an indication of the institutions' progress towards the
fourth goal, Closing the Gaps in Research: By 2015, increase the level of federal science and engineering research funding at Texas institutions by 50% to $1.3 billion (1998 constant dollars).
Data Source: Federal agencies report their obligations for science and engineering
support at higher education institutions to the National Science Foundation. The data are available from the National Science Foundation's web site (WebCASPAR).
Methodology: Data reported for Texas higher education institutions are aggregated and
deflated to 1998 constant dollars. This value is expressed as a percentage increase in the $845 million in obligations for science and engineering support to Texas higher education institutions for federal FY1998. The actual value reported here shows the increase in federal obligations for two years prior to the current year, e.g., the “FY02 Actual” value applies to FY2000 federal obligations. Estimates and projections are based on the $845 million to $1.3 billion adopted in “Closing the Gaps.”
Data Limitations: Data are reported by 21 federal agencies. Not all federal agencies report
their obligations to the National Science Foundation. The data reflect federal support given to the institutions and not expenditures. The data are reported according to the federal fiscal year: October 1 - September 30. Support to independent institutions is included. The data are generally available by March of the second year following the fiscal year being reported.
Calculation Type: Non-cumulative New Measure: No Key Measure: No Desired Performance: Higher
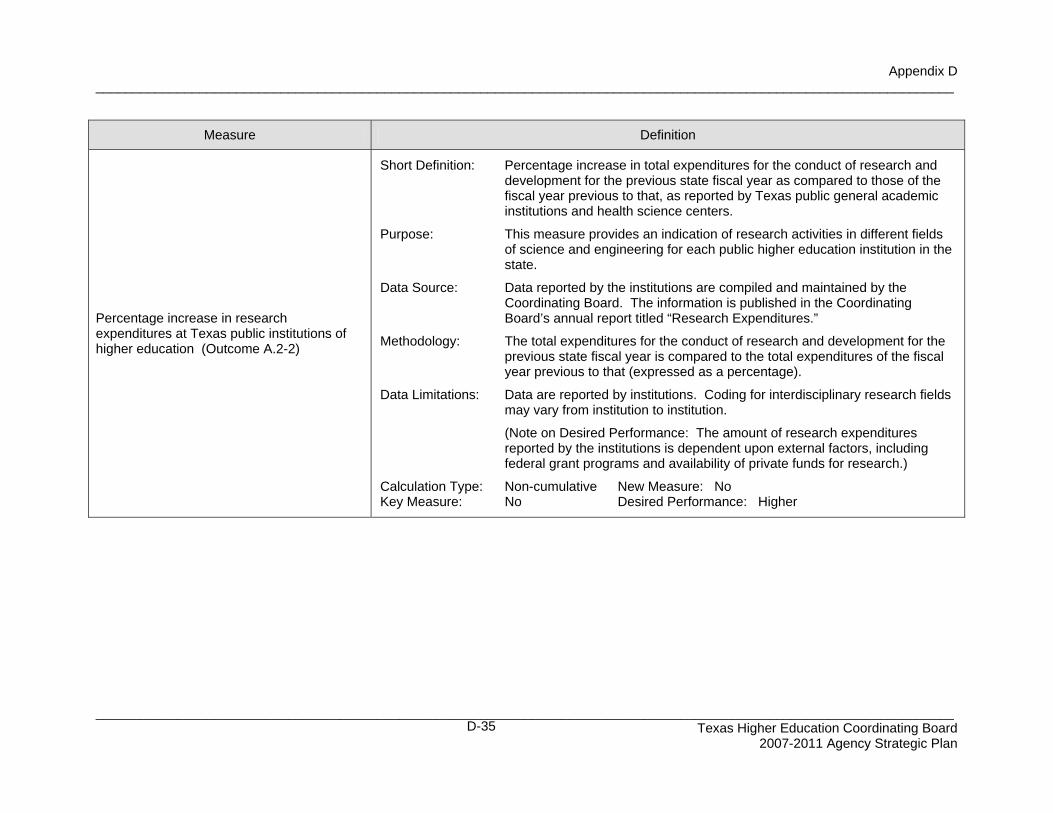
Appendix D
____________________________________________________________________________________________________________________
____________________________________________________________________________________________________________________ Texas Higher Education Coordinating Board
2007-2011 Agency Strategic Plan
D-35
Measure Definition
Percentage increase in research expenditures at Texas public institutions of higher education (Outcome A.2-2)
Short Definition: Percentage increase in total expenditures for the conduct of research and
development for the previous state fiscal year as compared to those of the fiscal year previous to that, as reported by Texas public general academic institutions and health science centers.
Purpose: This measure provides an indication of research activities in different fields
of science and engineering for each public higher education institution in the state.
Data Source: Data reported by the institutions are compiled and maintained by the
Coordinating Board. The information is published in the Coordinating Board’s annual report titled “Research Expenditures.”
Methodology: The total expenditures for the conduct of research and development for the
previous state fiscal year is compared to the total expenditures of the fiscal year previous to that (expressed as a percentage).
Data Limitations: Data are reported by institutions. Coding for interdisciplinary research fields
may vary from institution to institution. (Note on Desired Performance: The amount of research expenditures
reported by the institutions is dependent upon external factors, including federal grant programs and availability of private funds for research.)
Calculation Type: Non-cumulative New Measure: No Key Measure: No Desired Performance: Higher
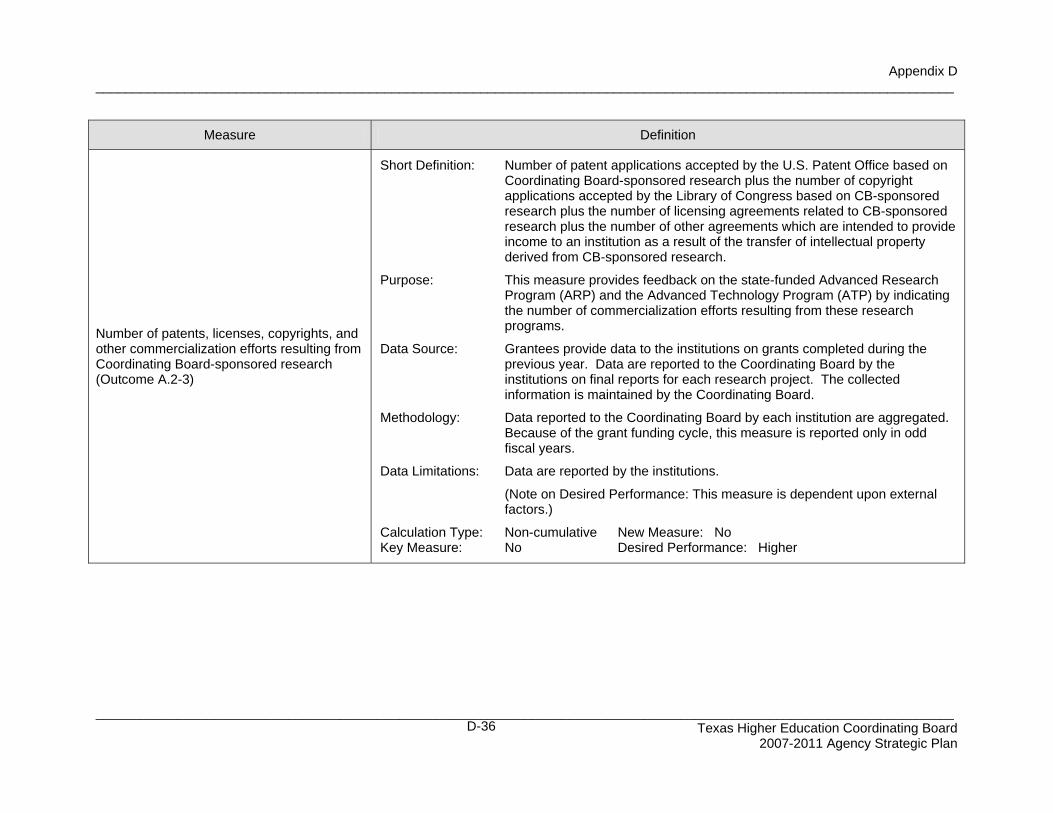
Appendix D
____________________________________________________________________________________________________________________
____________________________________________________________________________________________________________________ Texas Higher Education Coordinating Board
2007-2011 Agency Strategic Plan
D-36
Measure Definition
Number of patents, licenses, copyrights, and other commercialization efforts resulting from Coordinating Board-sponsored research (Outcome A.2-3)
Short Definition: Number of patent applications accepted by the U.S. Patent Office based on
Coordinating Board-sponsored research plus the number of copyright applications accepted by the Library of Congress based on CB-sponsored research plus the number of licensing agreements related to CB-sponsored research plus the number of other agreements which are intended to provide income to an institution as a result of the transfer of intellectual property derived from CB-sponsored research.
Purpose: This measure provides feedback on the state-funded Advanced Research
Program (ARP) and the Advanced Technology Program (ATP) by indicating the number of commercialization efforts resulting from these research programs.
Data Source: Grantees provide data to the institutions on grants completed during the
previous year. Data are reported to the Coordinating Board by the institutions on final reports for each research project. The collected information is maintained by the Coordinating Board.
Methodology: Data reported to the Coordinating Board by each institution are aggregated.
Because of the grant funding cycle, this measure is reported only in odd fiscal years.
Data Limitations: Data are reported by the institutions. (Note on Desired Performance: This measure is dependent upon external
factors.) Calculation Type: Non-cumulative New Measure: No Key Measure: No Desired Performance: Higher
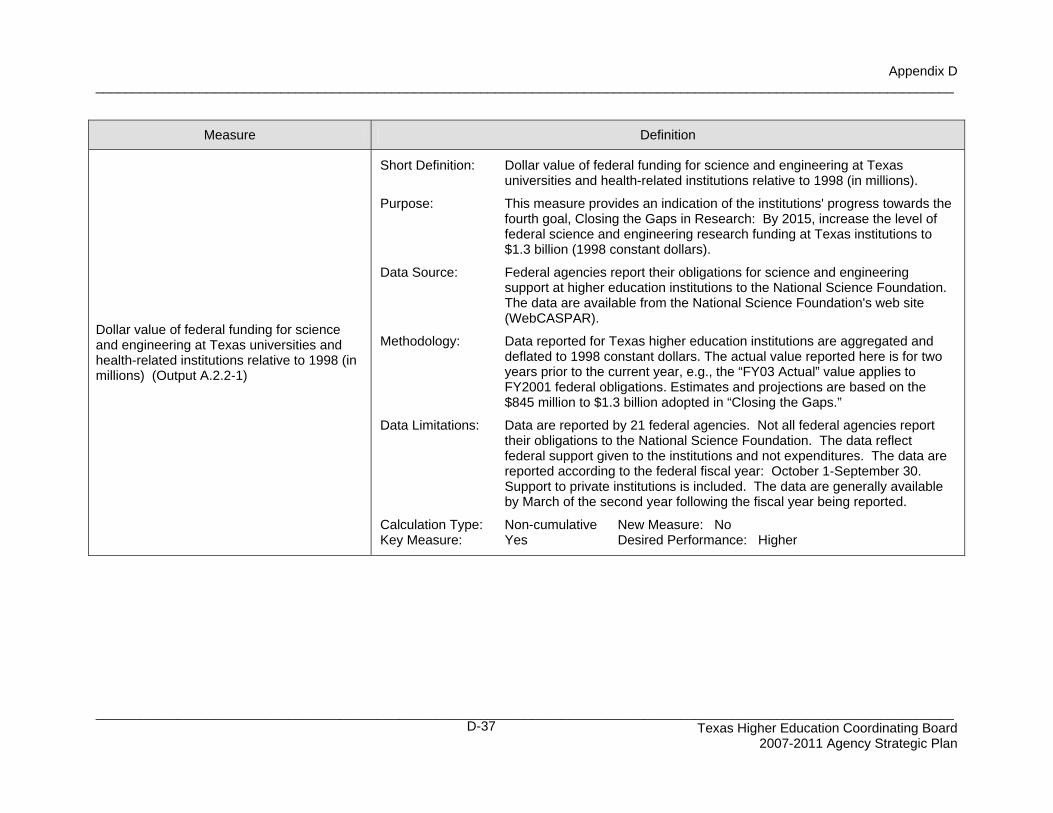
Appendix D
____________________________________________________________________________________________________________________
____________________________________________________________________________________________________________________ Texas Higher Education Coordinating Board
2007-2011 Agency Strategic Plan
D-37
Measure Definition
Dollar value of federal funding for science and engineering at Texas universities and health-related institutions relative to 1998 (in millions) (Output A.2.2-1)
Short Definition: Dollar value of federal funding for science and engineering at Texas
universities and health-related institutions relative to 1998 (in millions). Purpose: This measure provides an indication of the institutions' progress towards the
fourth goal, Closing the Gaps in Research: By 2015, increase the level of federal science and engineering research funding at Texas institutions to $1.3 billion (1998 constant dollars).
Data Source: Federal agencies report their obligations for science and engineering
support at higher education institutions to the National Science Foundation. The data are available from the National Science Foundation's web site (WebCASPAR).
Methodology: Data reported for Texas higher education institutions are aggregated and
deflated to 1998 constant dollars. The actual value reported here is for two years prior to the current year, e.g., the “FY03 Actual” value applies to FY2001 federal obligations. Estimates and projections are based on the $845 million to $1.3 billion adopted in “Closing the Gaps.”
Data Limitations: Data are reported by 21 federal agencies. Not all federal agencies report
their obligations to the National Science Foundation. The data reflect federal support given to the institutions and not expenditures. The data are reported according to the federal fiscal year: October 1-September 30. Support to private institutions is included. The data are generally available by March of the second year following the fiscal year being reported.
Calculation Type: Non-cumulative New Measure: No Key Measure: Yes Desired Performance: Higher
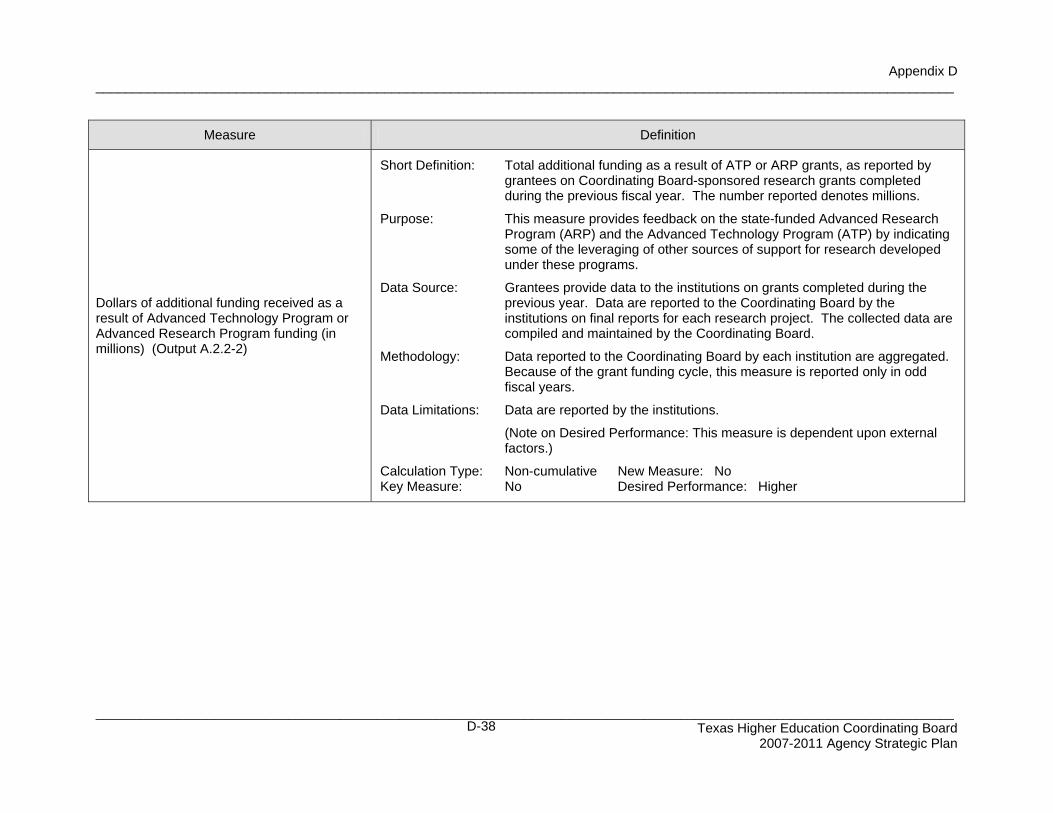
Appendix D
____________________________________________________________________________________________________________________
____________________________________________________________________________________________________________________ Texas Higher Education Coordinating Board
2007-2011 Agency Strategic Plan
D-38
Measure Definition
Dollars of additional funding received as a result of Advanced Technology Program or Advanced Research Program funding (in millions) (Output A.2.2-2)
Short Definition: Total additional funding as a result of ATP or ARP grants, as reported by
grantees on Coordinating Board-sponsored research grants completed during the previous fiscal year. The number reported denotes millions.
Purpose: This measure provides feedback on the state-funded Advanced Research
Program (ARP) and the Advanced Technology Program (ATP) by indicating some of the leveraging of other sources of support for research developed under these programs.
Data Source: Grantees provide data to the institutions on grants completed during the
previous year. Data are reported to the Coordinating Board by the institutions on final reports for each research project. The collected data are compiled and maintained by the Coordinating Board.
Methodology: Data reported to the Coordinating Board by each institution are aggregated.
Because of the grant funding cycle, this measure is reported only in odd fiscal years.
Data Limitations: Data are reported by the institutions. (Note on Desired Performance: This measure is dependent upon external
factors.) Calculation Type: Non-cumulative New Measure: No Key Measure: No Desired Performance: Higher
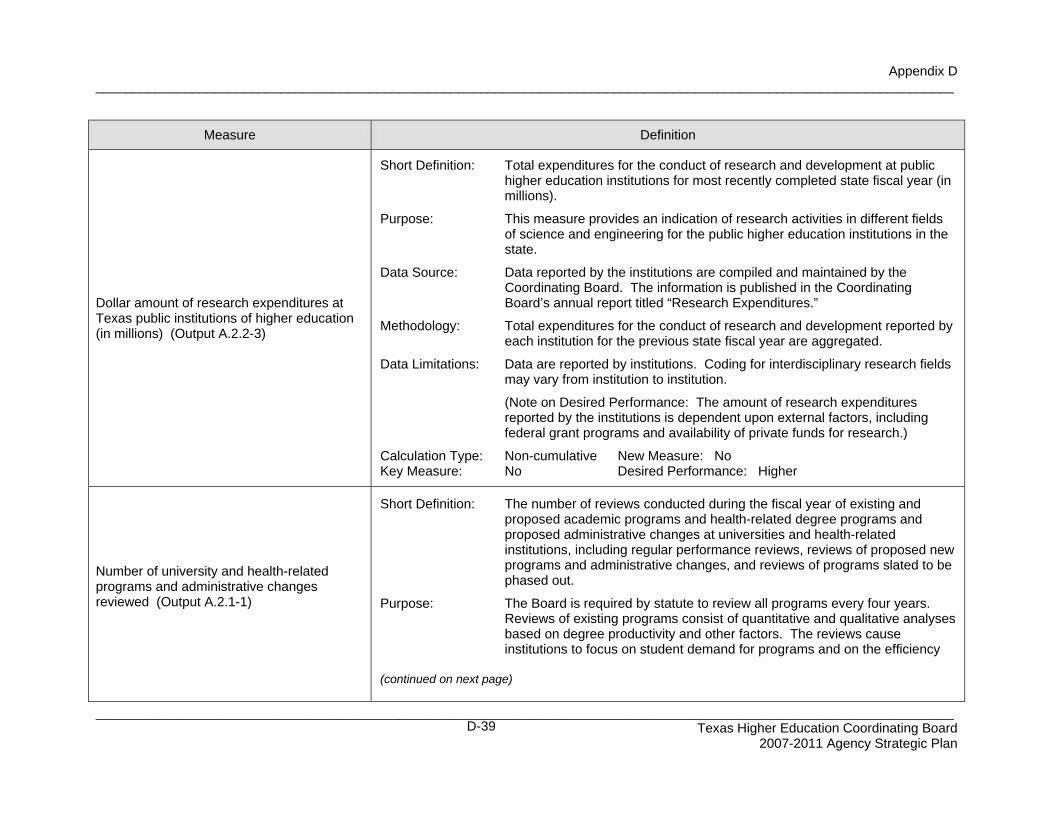
Appendix D
____________________________________________________________________________________________________________________
____________________________________________________________________________________________________________________ Texas Higher Education Coordinating Board
2007-2011 Agency Strategic Plan
D-39
Measure Definition
Dollar amount of research expenditures at Texas public institutions of higher education (in millions) (Output A.2.2-3)
Short Definition: Total expenditures for the conduct of research and development at public
higher education institutions for most recently completed state fiscal year (in millions).
Purpose: This measure provides an indication of research activities in different fields
of science and engineering for the public higher education institutions in the state.
Data Source: Data reported by the institutions are compiled and maintained by the
Coordinating Board. The information is published in the Coordinating Board’s annual report titled “Research Expenditures.”
Methodology: Total expenditures for the conduct of research and development reported by
each institution for the previous state fiscal year are aggregated. Data Limitations: Data are reported by institutions. Coding for interdisciplinary research fields
may vary from institution to institution. (Note on Desired Performance: The amount of research expenditures
reported by the institutions is dependent upon external factors, including federal grant programs and availability of private funds for research.)
Calculation Type: Non-cumulative New Measure: No Key Measure: No Desired Performance: Higher
Number of university and health-related programs and administrative changes reviewed (Output A.2.1-1)
Short Definition: The number of reviews conducted during the fiscal year of existing and
proposed academic programs and health-related degree programs and proposed administrative changes at universities and health-related institutions, including regular performance reviews, reviews of proposed new programs and administrative changes, and reviews of programs slated to be phased out.
Purpose: The Board is required by statute to review all programs every four years.
Reviews of existing programs consist of quantitative and qualitative analyses based on degree productivity and other factors. The reviews cause institutions to focus on student demand for programs and on the efficiency
(continued on next page)
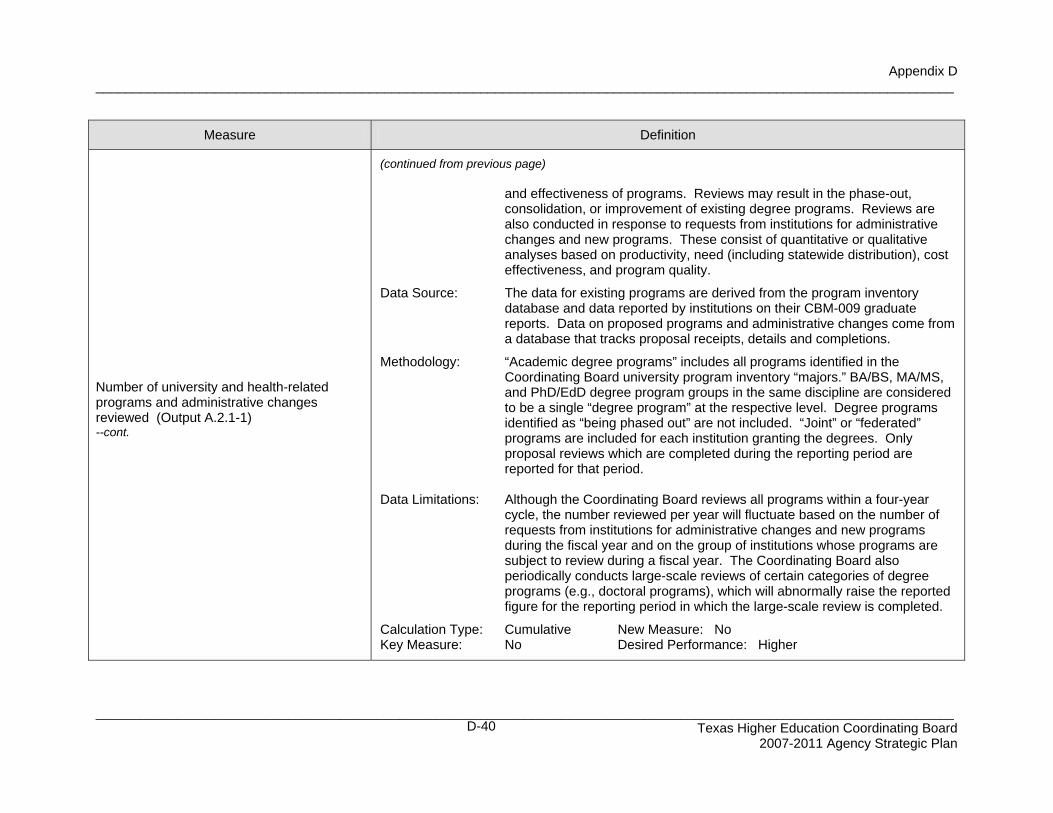
Appendix D
____________________________________________________________________________________________________________________
____________________________________________________________________________________________________________________ Texas Higher Education Coordinating Board
2007-2011 Agency Strategic Plan
D-40
Measure Definition
Number of university and health-related programs and administrative changes reviewed (Output A.2.1-1) --cont.
(continued from previous page) and effectiveness of programs. Reviews may result in the phase-out,
consolidation, or improvement of existing degree programs. Reviews are also conducted in response to requests from institutions for administrative changes and new programs. These consist of quantitative or qualitative analyses based on productivity, need (including statewide distribution), cost effectiveness, and program quality.
Data Source: The data for existing programs are derived from the program inventory
database and data reported by institutions on their CBM-009 graduate reports. Data on proposed programs and administrative changes come from a database that tracks proposal receipts, details and completions.
Methodology: “Academic degree programs” includes all programs identified in the
Coordinating Board university program inventory “majors.” BA/BS, MA/MS, and PhD/EdD degree program groups in the same discipline are considered to be a single “degree program” at the respective level. Degree programs identified as “being phased out” are not included. “Joint” or “federated” programs are included for each institution granting the degrees. Only proposal reviews which are completed during the reporting period are reported for that period.
Data Limitations: Although the Coordinating Board reviews all programs within a four-year
cycle, the number reviewed per year will fluctuate based on the number of requests from institutions for administrative changes and new programs during the fiscal year and on the group of institutions whose programs are subject to review during a fiscal year. The Coordinating Board also periodically conducts large-scale reviews of certain categories of degree programs (e.g., doctoral programs), which will abnormally raise the reported figure for the reporting period in which the large-scale review is completed.
Calculation Type: Cumulative New Measure: No Key Measure: No Desired Performance: Higher
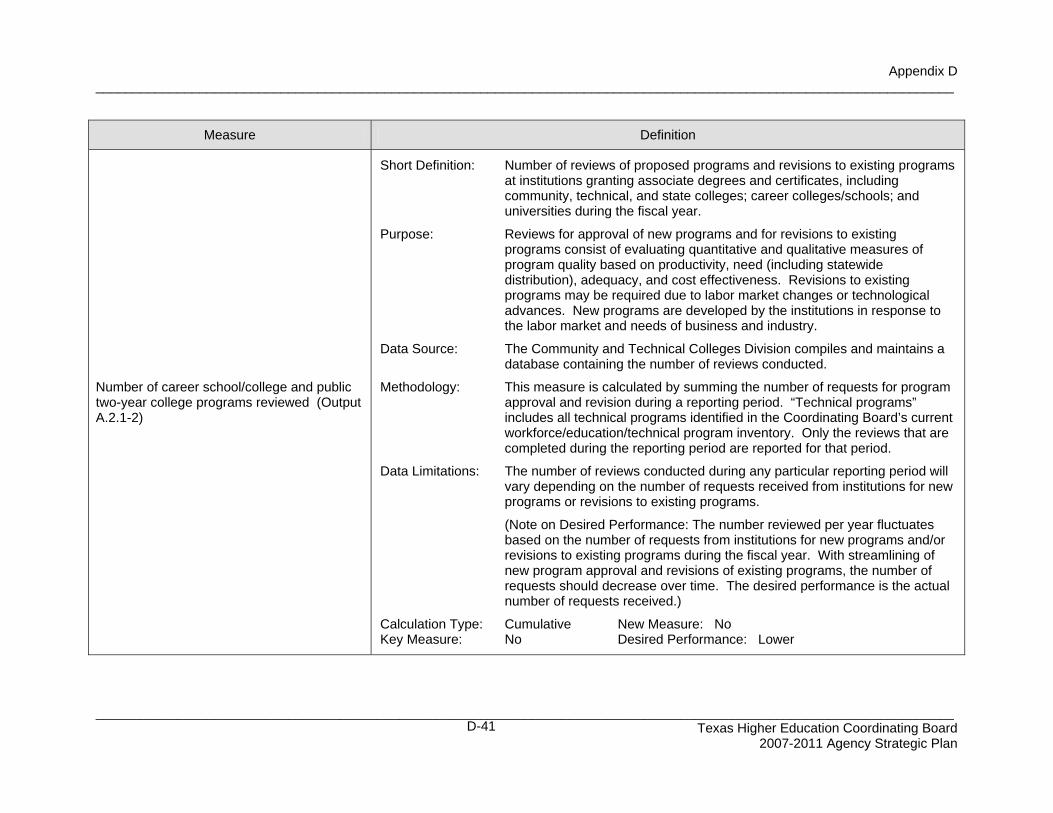
Appendix D
____________________________________________________________________________________________________________________
____________________________________________________________________________________________________________________ Texas Higher Education Coordinating Board
2007-2011 Agency Strategic Plan
D-41
Measure Definition
Number of career school/college and public two-year college programs reviewed (Output A.2.1-2)
Short Definition: Number of reviews of proposed programs and revisions to existing programs
at institutions granting associate degrees and certificates, including community, technical, and state colleges; career colleges/schools; and universities during the fiscal year.
Purpose: Reviews for approval of new programs and for revisions to existing
programs consist of evaluating quantitative and qualitative measures of program quality based on productivity, need (including statewide distribution), adequacy, and cost effectiveness. Revisions to existing programs may be required due to labor market changes or technological advances. New programs are developed by the institutions in response to the labor market and needs of business and industry.
Data Source: The Community and Technical Colleges Division compiles and maintains a
database containing the number of reviews conducted. Methodology: This measure is calculated by summing the number of requests for program
approval and revision during a reporting period. “Technical programs” includes all technical programs identified in the Coordinating Board’s current workforce/education/technical program inventory. Only the reviews that are completed during the reporting period are reported for that period.
Data Limitations: The number of reviews conducted during any particular reporting period will
vary depending on the number of requests received from institutions for new programs or revisions to existing programs.
(Note on Desired Performance: The number reviewed per year fluctuates
based on the number of requests from institutions for new programs and/or revisions to existing programs during the fiscal year. With streamlining of new program approval and revisions of existing programs, the number of requests should decrease over time. The desired performance is the actual number of requests received.)
Calculation Type: Cumulative New Measure: No Key Measure: No Desired Performance: Lower
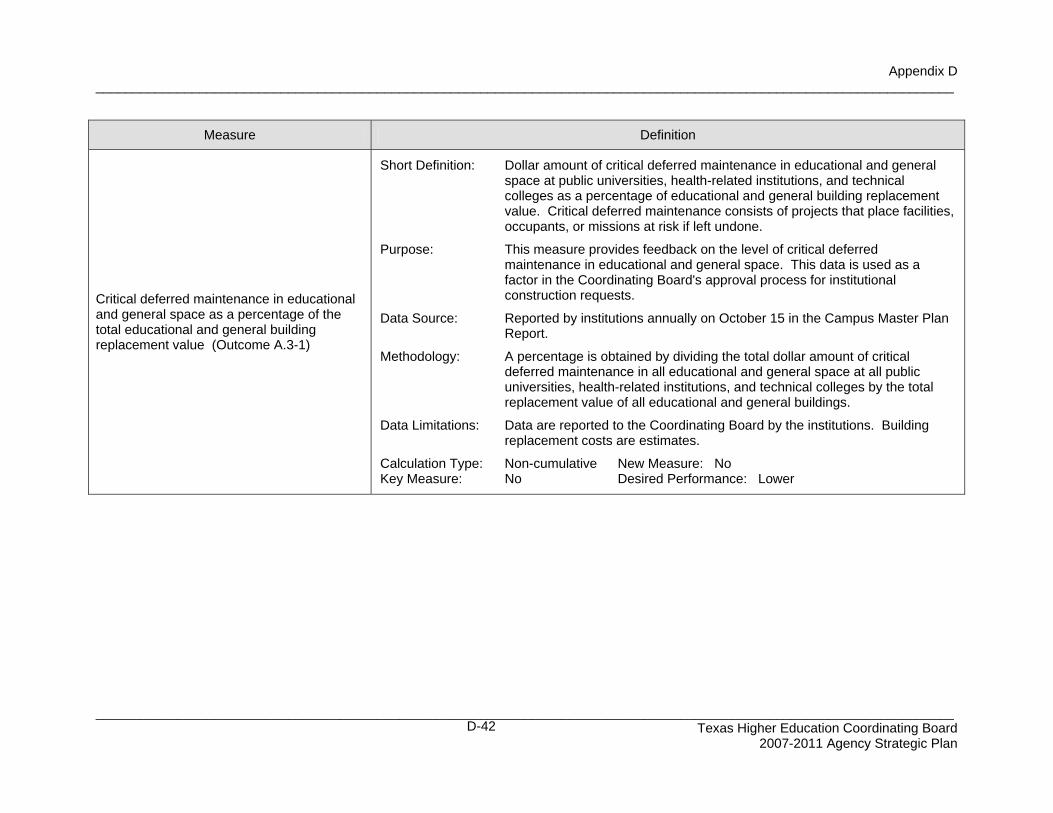
Appendix D
____________________________________________________________________________________________________________________
____________________________________________________________________________________________________________________ Texas Higher Education Coordinating Board
2007-2011 Agency Strategic Plan
D-42
Measure Definition
Critical deferred maintenance in educational and general space as a percentage of the total educational and general building replacement value (Outcome A.3-1)
Short Definition: Dollar amount of critical deferred maintenance in educational and general
space at public universities, health-related institutions, and technical colleges as a percentage of educational and general building replacement value. Critical deferred maintenance consists of projects that place facilities, occupants, or missions at risk if left undone.
Purpose: This measure provides feedback on the level of critical deferred
maintenance in educational and general space. This data is used as a factor in the Coordinating Board's approval process for institutional construction requests.
Data Source: Reported by institutions annually on October 15 in the Campus Master Plan
Report. Methodology: A percentage is obtained by dividing the total dollar amount of critical
deferred maintenance in all educational and general space at all public universities, health-related institutions, and technical colleges by the total replacement value of all educational and general buildings.
Data Limitations: Data are reported to the Coordinating Board by the institutions. Building
replacement costs are estimates. Calculation Type: Non-cumulative New Measure: No Key Measure: No Desired Performance: Lower
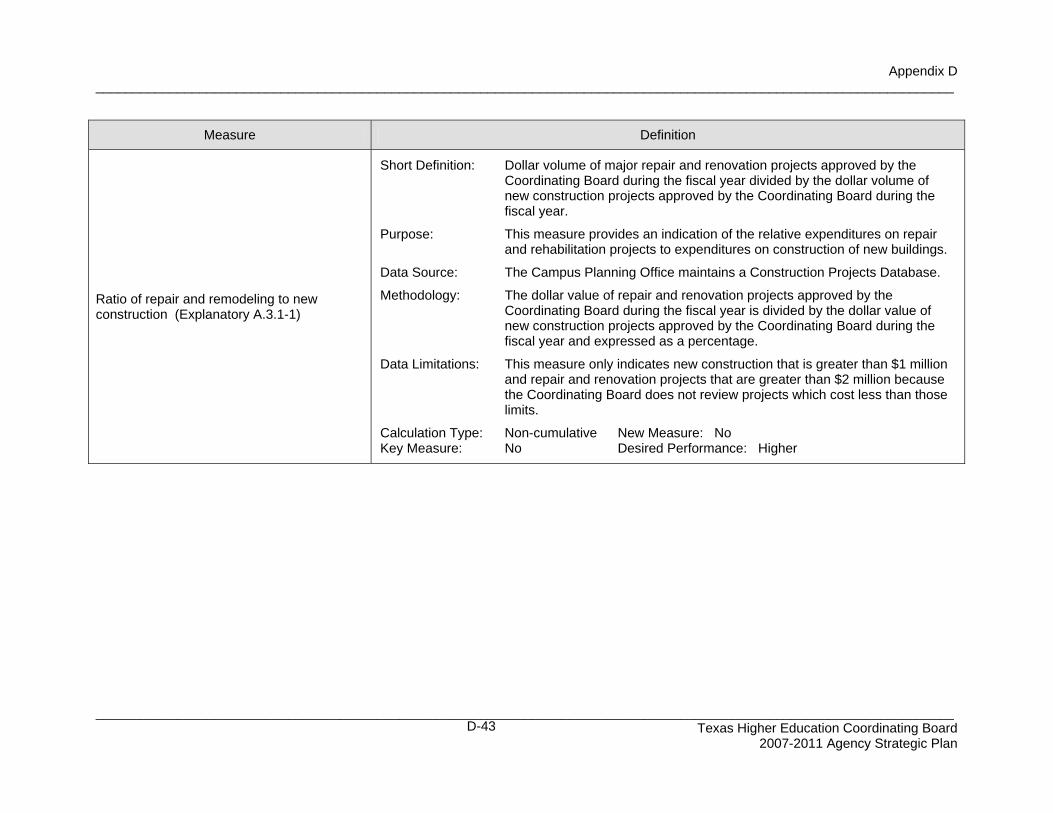
Appendix D
____________________________________________________________________________________________________________________
____________________________________________________________________________________________________________________ Texas Higher Education Coordinating Board
2007-2011 Agency Strategic Plan
D-43
Measure Definition
Ratio of repair and remodeling to new construction (Explanatory A.3.1-1)
Short Definition: Dollar volume of major repair and renovation projects approved by the
Coordinating Board during the fiscal year divided by the dollar volume of new construction projects approved by the Coordinating Board during the fiscal year.
Purpose: This measure provides an indication of the relative expenditures on repair
and rehabilitation projects to expenditures on construction of new buildings. Data Source: The Campus Planning Office maintains a Construction Projects Database. Methodology: The dollar value of repair and renovation projects approved by the
Coordinating Board during the fiscal year is divided by the dollar value of new construction projects approved by the Coordinating Board during the fiscal year and expressed as a percentage.
Data Limitations: This measure only indicates new construction that is greater than $1 million
and repair and renovation projects that are greater than $2 million because the Coordinating Board does not review projects which cost less than those limits.
Calculation Type: Non-cumulative New Measure: No Key Measure: No Desired Performance: Higher
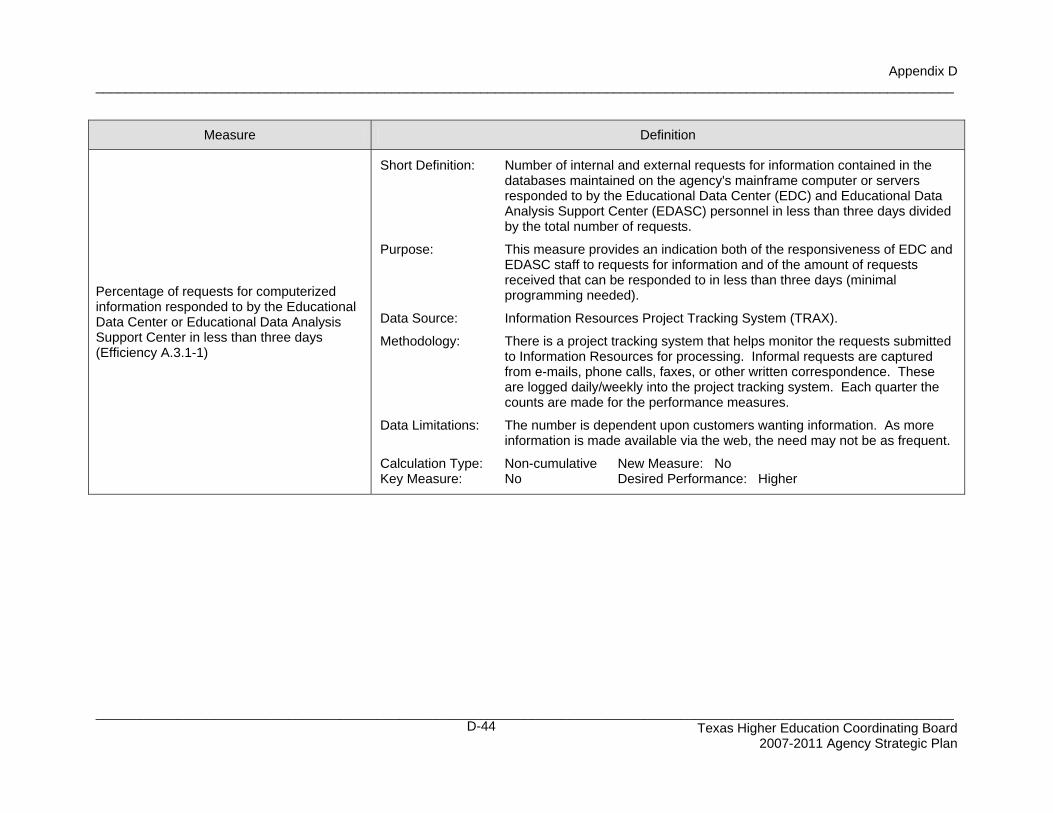
Appendix D
____________________________________________________________________________________________________________________
____________________________________________________________________________________________________________________ Texas Higher Education Coordinating Board
2007-2011 Agency Strategic Plan
D-44
Measure Definition
Percentage of requests for computerized information responded to by the Educational Data Center or Educational Data Analysis Support Center in less than three days (Efficiency A.3.1-1)
Short Definition: Number of internal and external requests for information contained in the
databases maintained on the agency's mainframe computer or servers responded to by the Educational Data Center (EDC) and Educational Data Analysis Support Center (EDASC) personnel in less than three days divided by the total number of requests.
Purpose: This measure provides an indication both of the responsiveness of EDC and
EDASC staff to requests for information and of the amount of requests received that can be responded to in less than three days (minimal programming needed).
Data Source: Information Resources Project Tracking System (TRAX). Methodology: There is a project tracking system that helps monitor the requests submitted
to Information Resources for processing. Informal requests are captured from e-mails, phone calls, faxes, or other written correspondence. These are logged daily/weekly into the project tracking system. Each quarter the counts are made for the performance measures.
Data Limitations: The number is dependent upon customers wanting information. As more
information is made available via the web, the need may not be as frequent. Calculation Type: Non-cumulative New Measure: No Key Measure: No Desired Performance: Higher
Appendix D
____________________________________________________________________________________________________________________
____________________________________________________________________________________________________________________ Texas Higher Education Coordinating Board
2007-2011 Agency Strategic Plan
D-45
Measure Definition
Number of studies on higher education issues conducted (Output A.3.1-1)
Short Definition: Number of studies of higher education issues conducted by Coordinating
Board staff, advisory committees or consultants during the fiscal year. Purpose: This measure provides feedback on the agency’s efforts to conduct formal
studies on higher education issues of interest to state government and the higher education community.
Data Source: Through its functions as the agency’s legislation liaison and publications
editor, the Office of Strategic Alliances is the central point in the agency with the broad knowledge of formal studies that are conducted by and for the agency throughout the year. In addition, divisions are surveyed as needed to determine if there were any other applicable reports or studies conducted during the reporting period.
Methodology: Only those studies which were concluded during the fiscal year are reported. Data Limitations: The number of formal studies on higher education issues is often driven by
legislative initiatives and requests, proposals from institutions, new challenges that arise, and other external factors beyond the control of the Coordinating Board.
(Note on Desired Performance: This measure is dependent on the number
of external requests for studies or information, so it varies from year to year. The target is an estimate based on previous fiscal years.)
Calculation Type: Non-cumulative New Measure: No Key Measure: No Desired Performance: Higher

Appendix D
____________________________________________________________________________________________________________________
____________________________________________________________________________________________________________________ Texas Higher Education Coordinating Board
2007-2011 Agency Strategic Plan
D-46
Measure Definition
Percentage of independent college students receiving Tuition Equalization Grant (TEG) awards (Outcome B.1-1)
Short Definition: Number of students attending independent colleges in Texas who received
grants through the Tuition Equalization Grants Program during the fiscal year divided by the total number of students attending independent colleges in Texas during the fiscal year.
Purpose: This measure provides feedback on the effect of state funding of the Tuition
Equalization Grants (TEG) program. Data Source: Enrollment data for most institutions are from the Independent Colleges and
Universities of Texas (ICUT). For non-ICUT institutions, the enrollment data are provided directly by the institutions. The number of awards comes from the Student Services Division's TEG Student Report.
Methodology: The number of students attending independent colleges in Texas who
received grants through the Tuition Equalization Grants Program during the fiscal year is divided by the total number of students attending independent colleges in Texas during the fiscal year and then expressed as a percentage.
Data Limitations: Enrollment data from the institutions and ICUT are not audited but we have
no reason to question their accuracy. (Note on Desired Performance: The target is based on historic funding and
award patterns. Annual fluctuations can be caused by changes in funding from the state and changes in the awarding philosophy of the institutions which make awards. Colleges may choose to give (1) larger awards to fewer students or (2) smaller awards to more students. If they choose to exercise the first option, performance will be below the target; if they exercise the second option, performance will be above the target.)
Calculation Type: Non-cumulative New Measure: No Key Measure: Yes Desired Performance: Higher
Appendix D
____________________________________________________________________________________________________________________
____________________________________________________________________________________________________________________ Texas Higher Education Coordinating Board
2007-2011 Agency Strategic Plan
D-47
Measure Definition
Number of students attending independent colleges and universities as a percentage of total enrollment (Outcome B.1-2)
Short Definition: Number of credit students attending independent colleges and universities in
Texas during the fall semester of the fiscal year divided by the total number of credit students attending public and independent colleges and universities in Texas during the fall semester of the fiscal year.
Purpose: This measure provides feedback on the percentage of all Texas higher
education students who attend independent colleges and universities. Data Source: Enrollment data for most institutions are from the Independent Colleges and
Universities of Texas (ICUT). For non-ICUT institutions, the enrollment data are provided directly by the institutions.
Methodology: The number of credit students attending independent colleges and
universities in Texas during the fall semester of the fiscal year is divided by the total number of credit students attending public and independent colleges and universities in Texas during the fall semester of the fiscal year.
Data Limitations: Enrollment data from the institutions and ICUT are not audited but we have
no reason to question their accuracy. Calculation Type: Non-cumulative New Measure: No Key Measure: No Desired Performance: Higher
Appendix D
____________________________________________________________________________________________________________________
____________________________________________________________________________________________________________________ Texas Higher Education Coordinating Board
2007-2011 Agency Strategic Plan
D-48
Measure Definition
Number of students receiving TEG awards (Output B.1.1-1)
Short Definition: Number of students attending independent colleges in Texas who are
receiving grants through the Tuition Equalization Grants Program during the fiscal year.
Purpose: This measure provides feedback on the Tuition Equalization Grants (TEG)
Program. Data Source: Data are obtained from the TEG report generated by the Coordinating Board
mainframe and from year-end reports submitted to the Coordinating Board by the institutions.
Methodology: Add the mainframe information to the sum of the number of students (as
reported by the institutions). Data Limitations: This is a combination campus-based program and in-house mainframe
program. Information is submitted at the end of the year by the institutions participating in the campus-based portion of the program. We have no reason to question the accuracy of the institutions.
(Note: The target is based on historic funding and award patterns. Annual
fluctuations can be caused by changes in funding from the state and changes in the awarding philosophy of the institutions which make awards. Colleges may choose to give (1) larger awards to fewer students or (2) smaller awards to more students. If they choose to exercise the first option, performance will be below the target; if they exercise the second option, performance will be above the target.)
Calculation Type: Cumulative New Measure: No Key Measure: No Desired Performance: Higher
Appendix D
____________________________________________________________________________________________________________________
____________________________________________________________________________________________________________________ Texas Higher Education Coordinating Board
2007-2011 Agency Strategic Plan
D-49
Measure Definition
Persistence rate of TEG recipients after one academic year (Output B.1.1-2)
Short Definition: The percentage of Tuition Equalization Grants (TEG) recipients who were
first-time undergraduates at an independent institution of higher education in Texas in the summer/fall semester of the previous fiscal year and who were also enrolled at an independent institution of higher education in Texas in the fall semester of the current fiscal year.
Purpose: This measure provides feedback on the effect of state funding of the Tuition
Equalization Grants (TEG) Program. Data Source: Enrollment data are from the Independent Colleges and Universities of
Texas (ICUT). Methodology: The number of TEG recipients who were enrolled for the first time as an
undergraduate at an independent institution of higher education in Texas in the fall semester of the previous fiscal year (including those who were first-time undergraduates in the summer immediately preceding that fall semester and who continued enrollment in the fall semester) and who were also enrolled as an undergraduate at an independent institution of higher education in Texas in the fall semester of the current fiscal year is divided by the number of TEG recipients who were enrolled for the first time as an undergraduate at an independent institution of higher education in Texas in the fall semester of the previous fiscal year (including those who were first-time undergraduates in the summer immediately preceding that fall semester and who continued enrollment in the fall semester).
Data Limitations: Enrollment data do not include students who transfer to an out-of-state
institution. Enrollment data reported by ICUT are not audited but we have no reason to question their accuracy.
Calculation Type: Non-cumulative New Measure: No Key Measure: No Desired Performance: Higher
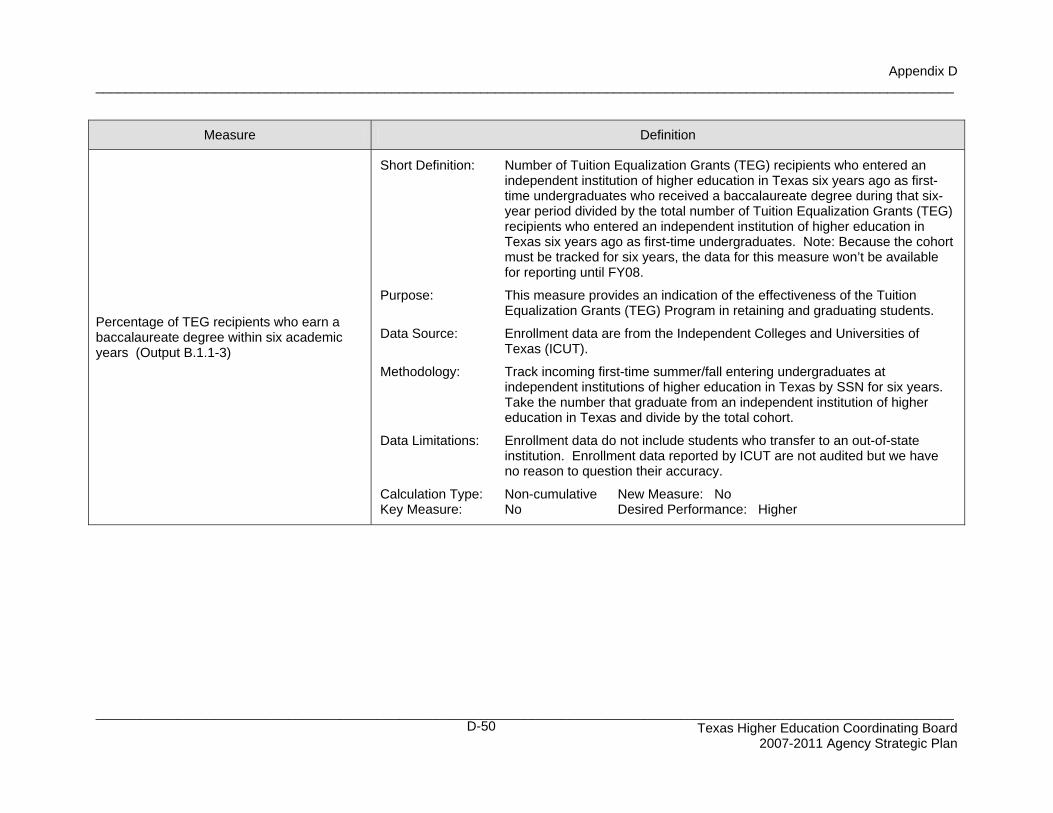
Appendix D
____________________________________________________________________________________________________________________
____________________________________________________________________________________________________________________ Texas Higher Education Coordinating Board
2007-2011 Agency Strategic Plan
D-50
Measure Definition
Percentage of TEG recipients who earn a baccalaureate degree within six academic years (Output B.1.1-3)
Short Definition: Number of Tuition Equalization Grants (TEG) recipients who entered an
independent institution of higher education in Texas six years ago as first-time undergraduates who received a baccalaureate degree during that six-year period divided by the total number of Tuition Equalization Grants (TEG) recipients who entered an independent institution of higher education in Texas six years ago as first-time undergraduates. Note: Because the cohort must be tracked for six years, the data for this measure won’t be available for reporting until FY08.
Purpose: This measure provides an indication of the effectiveness of the Tuition
Equalization Grants (TEG) Program in retaining and graduating students. Data Source: Enrollment data are from the Independent Colleges and Universities of
Texas (ICUT). Methodology: Track incoming first-time summer/fall entering undergraduates at
independent institutions of higher education in Texas by SSN for six years. Take the number that graduate from an independent institution of higher education in Texas and divide by the total cohort.
Data Limitations: Enrollment data do not include students who transfer to an out-of-state
institution. Enrollment data reported by ICUT are not audited but we have no reason to question their accuracy.
Calculation Type: Non-cumulative New Measure: No Key Measure: No Desired Performance: Higher
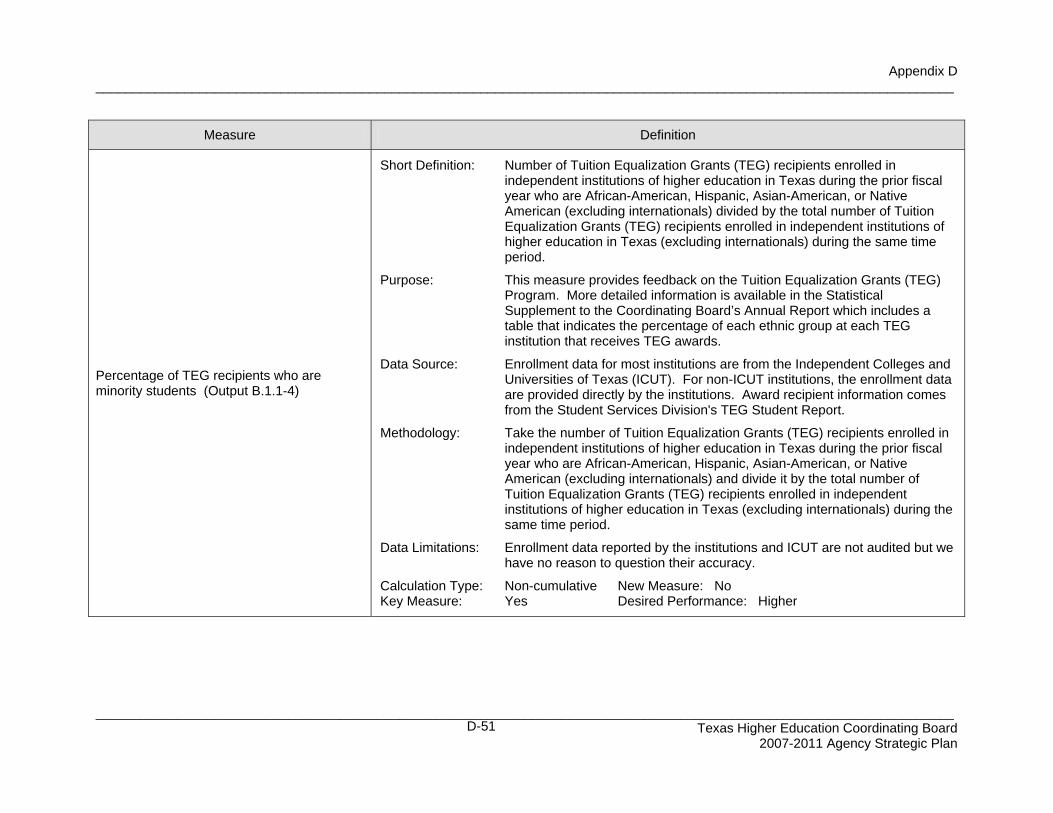
Appendix D
____________________________________________________________________________________________________________________
____________________________________________________________________________________________________________________ Texas Higher Education Coordinating Board
2007-2011 Agency Strategic Plan
D-51
Measure Definition
Percentage of TEG recipients who are minority students (Output B.1.1-4)
Short Definition: Number of Tuition Equalization Grants (TEG) recipients enrolled in
independent institutions of higher education in Texas during the prior fiscal year who are African-American, Hispanic, Asian-American, or Native American (excluding internationals) divided by the total number of Tuition Equalization Grants (TEG) recipients enrolled in independent institutions of higher education in Texas (excluding internationals) during the same time period.
Purpose: This measure provides feedback on the Tuition Equalization Grants (TEG)
Program. More detailed information is available in the Statistical Supplement to the Coordinating Board’s Annual Report which includes a table that indicates the percentage of each ethnic group at each TEG institution that receives TEG awards.
Data Source: Enrollment data for most institutions are from the Independent Colleges and
Universities of Texas (ICUT). For non-ICUT institutions, the enrollment data are provided directly by the institutions. Award recipient information comes from the Student Services Division's TEG Student Report.
Methodology: Take the number of Tuition Equalization Grants (TEG) recipients enrolled in
independent institutions of higher education in Texas during the prior fiscal year who are African-American, Hispanic, Asian-American, or Native American (excluding internationals) and divide it by the total number of Tuition Equalization Grants (TEG) recipients enrolled in independent institutions of higher education in Texas (excluding internationals) during the same time period.
Data Limitations: Enrollment data reported by the institutions and ICUT are not audited but we
have no reason to question their accuracy. Calculation Type: Non-cumulative New Measure: No Key Measure: Yes Desired Performance: Higher
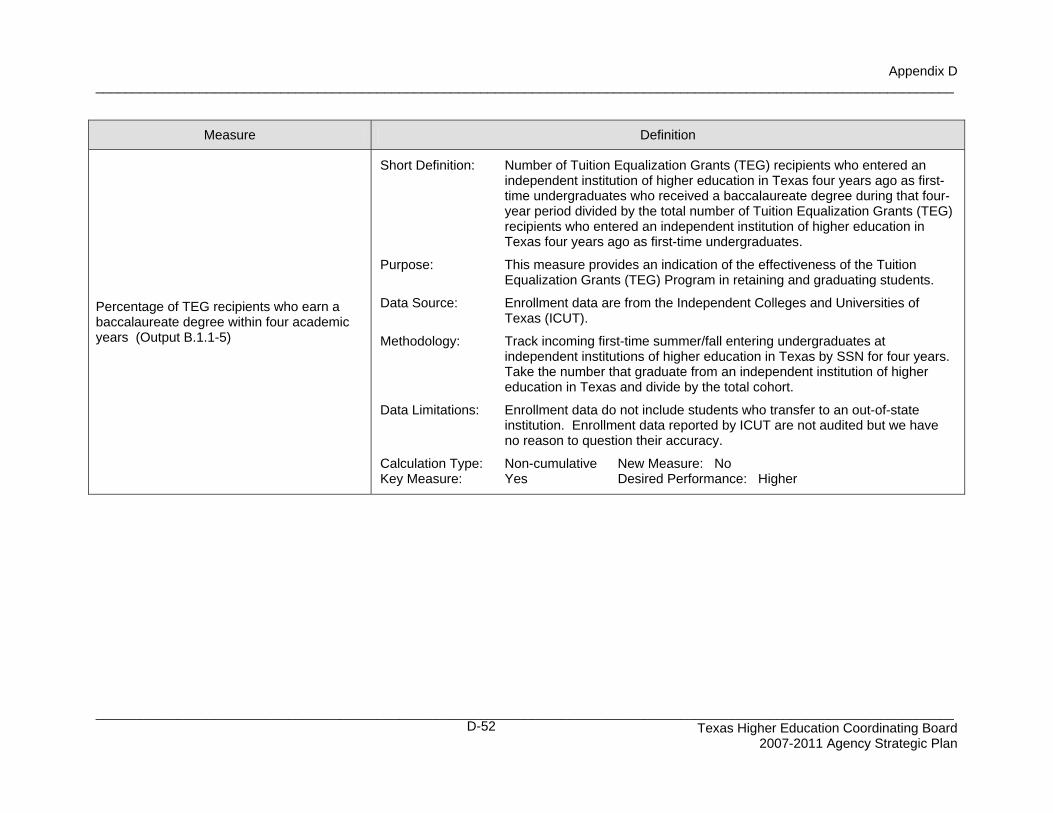
Appendix D
____________________________________________________________________________________________________________________
____________________________________________________________________________________________________________________ Texas Higher Education Coordinating Board
2007-2011 Agency Strategic Plan
D-52
Measure Definition
Percentage of TEG recipients who earn a baccalaureate degree within four academic years (Output B.1.1-5)
Short Definition: Number of Tuition Equalization Grants (TEG) recipients who entered an
independent institution of higher education in Texas four years ago as first-time undergraduates who received a baccalaureate degree during that four-year period divided by the total number of Tuition Equalization Grants (TEG) recipients who entered an independent institution of higher education in Texas four years ago as first-time undergraduates.
Purpose: This measure provides an indication of the effectiveness of the Tuition
Equalization Grants (TEG) Program in retaining and graduating students. Data Source: Enrollment data are from the Independent Colleges and Universities of
Texas (ICUT). Methodology: Track incoming first-time summer/fall entering undergraduates at
independent institutions of higher education in Texas by SSN for four years. Take the number that graduate from an independent institution of higher education in Texas and divide by the total cohort.
Data Limitations: Enrollment data do not include students who transfer to an out-of-state
institution. Enrollment data reported by ICUT are not audited but we have no reason to question their accuracy.
Calculation Type: Non-cumulative New Measure: No Key Measure: Yes Desired Performance: Higher
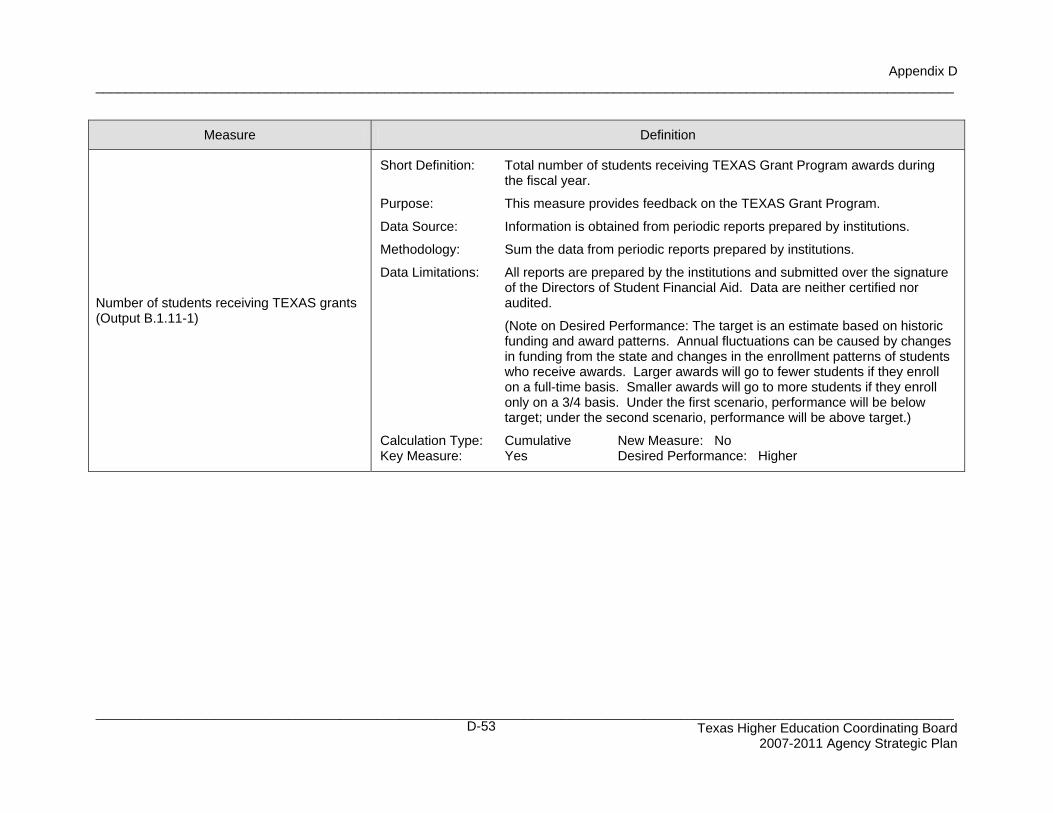
Appendix D
____________________________________________________________________________________________________________________
____________________________________________________________________________________________________________________ Texas Higher Education Coordinating Board
2007-2011 Agency Strategic Plan
D-53
Measure Definition
Number of students receiving TEXAS grants (Output B.1.11-1)
Short Definition: Total number of students receiving TEXAS Grant Program awards during
the fiscal year. Purpose: This measure provides feedback on the TEXAS Grant Program. Data Source: Information is obtained from periodic reports prepared by institutions. Methodology: Sum the data from periodic reports prepared by institutions. Data Limitations: All reports are prepared by the institutions and submitted over the signature
of the Directors of Student Financial Aid. Data are neither certified nor audited.
(Note on Desired Performance: The target is an estimate based on historic
funding and award patterns. Annual fluctuations can be caused by changes in funding from the state and changes in the enrollment patterns of students who receive awards. Larger awards will go to fewer students if they enroll on a full-time basis. Smaller awards will go to more students if they enroll only on a 3/4 basis. Under the first scenario, performance will be below target; under the second scenario, performance will be above target.)
Calculation Type: Cumulative New Measure: No Key Measure: Yes Desired Performance: Higher
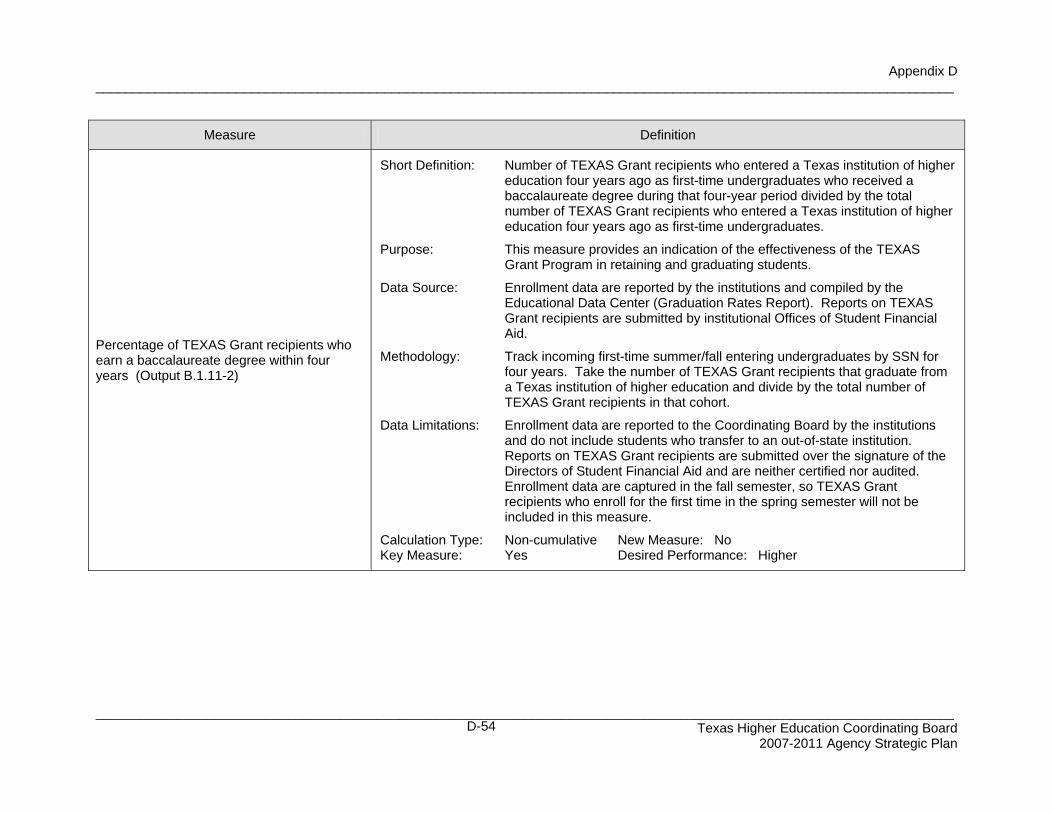
Appendix D
____________________________________________________________________________________________________________________
____________________________________________________________________________________________________________________ Texas Higher Education Coordinating Board
2007-2011 Agency Strategic Plan
D-54
Measure Definition
Percentage of TEXAS Grant recipients who earn a baccalaureate degree within four years (Output B.1.11-2)
Short Definition: Number of TEXAS Grant recipients who entered a Texas institution of higher
education four years ago as first-time undergraduates who received a baccalaureate degree during that four-year period divided by the total number of TEXAS Grant recipients who entered a Texas institution of higher education four years ago as first-time undergraduates.
Purpose: This measure provides an indication of the effectiveness of the TEXAS
Grant Program in retaining and graduating students. Data Source: Enrollment data are reported by the institutions and compiled by the
Educational Data Center (Graduation Rates Report). Reports on TEXAS Grant recipients are submitted by institutional Offices of Student Financial Aid.
Methodology: Track incoming first-time summer/fall entering undergraduates by SSN for
four years. Take the number of TEXAS Grant recipients that graduate from a Texas institution of higher education and divide by the total number of TEXAS Grant recipients in that cohort.
Data Limitations: Enrollment data are reported to the Coordinating Board by the institutions
and do not include students who transfer to an out-of-state institution. Reports on TEXAS Grant recipients are submitted over the signature of the Directors of Student Financial Aid and are neither certified nor audited. Enrollment data are captured in the fall semester, so TEXAS Grant recipients who enroll for the first time in the spring semester will not be included in this measure.
Calculation Type: Non-cumulative New Measure: No Key Measure: Yes Desired Performance: Higher
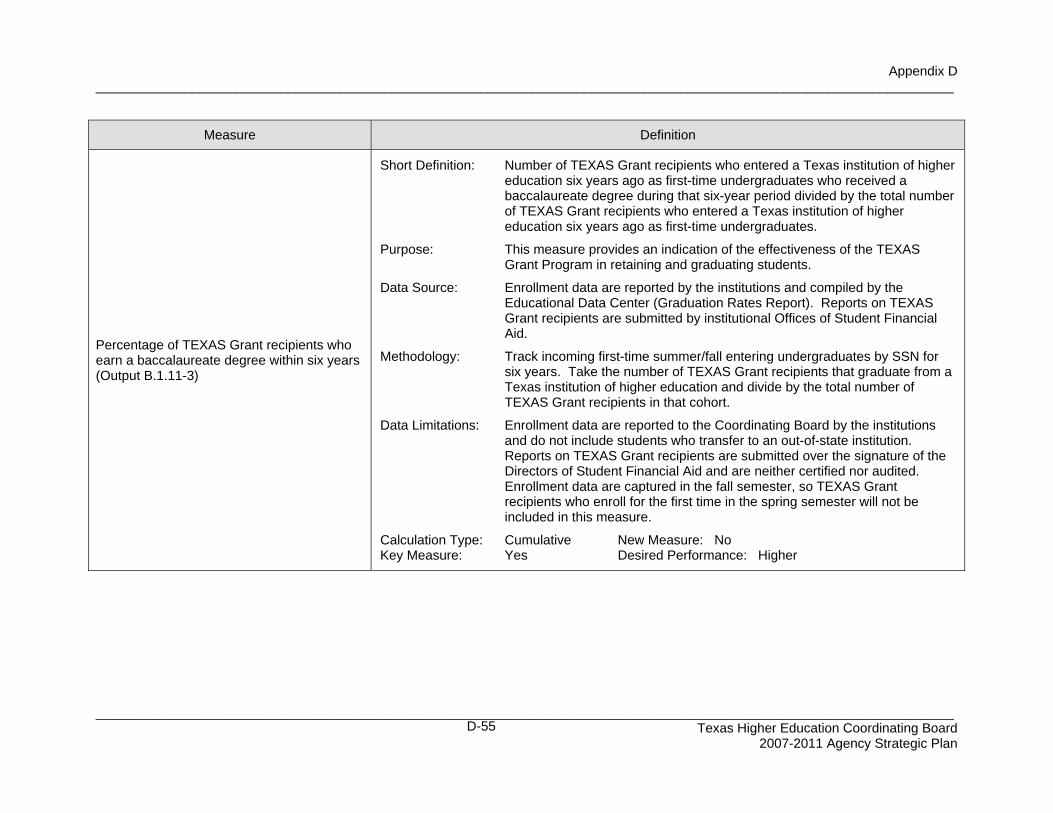
Appendix D
____________________________________________________________________________________________________________________
____________________________________________________________________________________________________________________ Texas Higher Education Coordinating Board
2007-2011 Agency Strategic Plan
D-55
Measure Definition
Percentage of TEXAS Grant recipients who earn a baccalaureate degree within six years (Output B.1.11-3)
Short Definition: Number of TEXAS Grant recipients who entered a Texas institution of higher
education six years ago as first-time undergraduates who received a baccalaureate degree during that six-year period divided by the total number of TEXAS Grant recipients who entered a Texas institution of higher education six years ago as first-time undergraduates.
Purpose: This measure provides an indication of the effectiveness of the TEXAS
Grant Program in retaining and graduating students. Data Source: Enrollment data are reported by the institutions and compiled by the
Educational Data Center (Graduation Rates Report). Reports on TEXAS Grant recipients are submitted by institutional Offices of Student Financial Aid.
Methodology: Track incoming first-time summer/fall entering undergraduates by SSN for
six years. Take the number of TEXAS Grant recipients that graduate from a Texas institution of higher education and divide by the total number of TEXAS Grant recipients in that cohort.
Data Limitations: Enrollment data are reported to the Coordinating Board by the institutions
and do not include students who transfer to an out-of-state institution. Reports on TEXAS Grant recipients are submitted over the signature of the Directors of Student Financial Aid and are neither certified nor audited. Enrollment data are captured in the fall semester, so TEXAS Grant recipients who enroll for the first time in the spring semester will not be included in this measure.
Calculation Type: Cumulative New Measure: No Key Measure: Yes Desired Performance: Higher
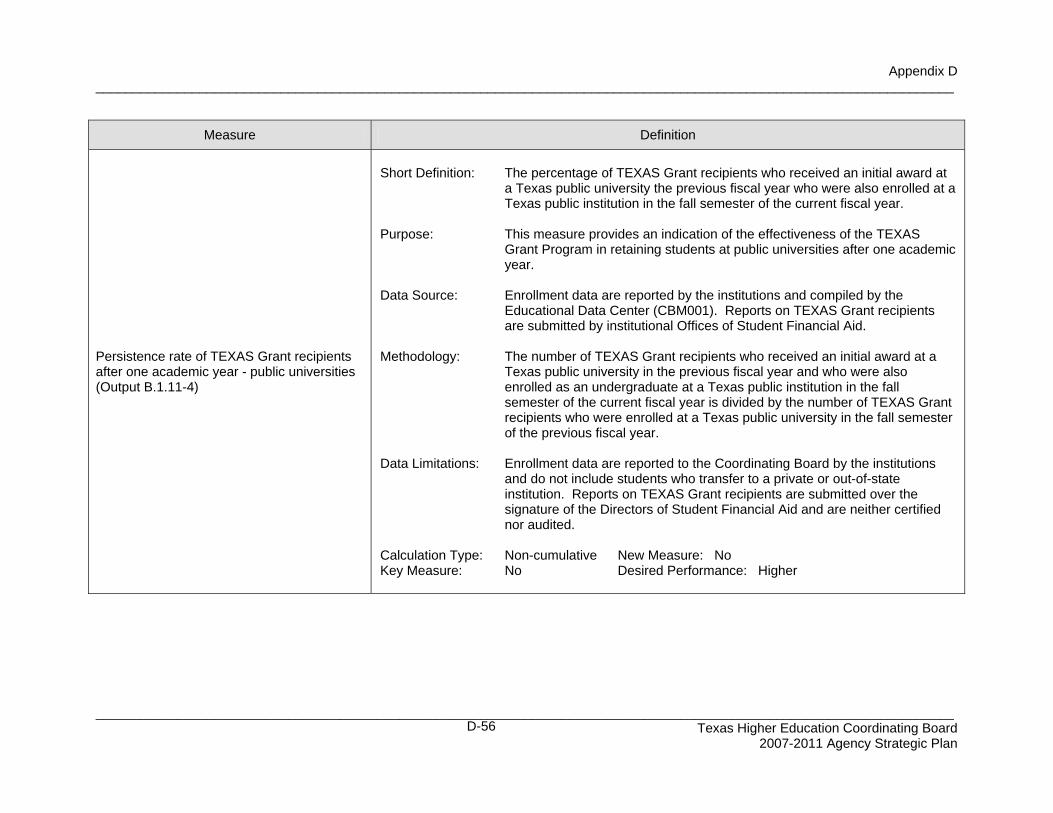
Appendix D
____________________________________________________________________________________________________________________
____________________________________________________________________________________________________________________ Texas Higher Education Coordinating Board
2007-2011 Agency Strategic Plan
D-56
Measure Definition
Persistence rate of TEXAS Grant recipients after one academic year - public universities (Output B.1.11-4)
Short Definition: The percentage of TEXAS Grant recipients who received an initial award at
a Texas public university the previous fiscal year who were also enrolled at a Texas public institution in the fall semester of the current fiscal year.
Purpose: This measure provides an indication of the effectiveness of the TEXAS
Grant Program in retaining students at public universities after one academic year.
Data Source: Enrollment data are reported by the institutions and compiled by the
Educational Data Center (CBM001). Reports on TEXAS Grant recipients are submitted by institutional Offices of Student Financial Aid.
Methodology: The number of TEXAS Grant recipients who received an initial award at a
Texas public university in the previous fiscal year and who were also enrolled as an undergraduate at a Texas public institution in the fall semester of the current fiscal year is divided by the number of TEXAS Grant recipients who were enrolled at a Texas public university in the fall semester of the previous fiscal year.
Data Limitations: Enrollment data are reported to the Coordinating Board by the institutions
and do not include students who transfer to a private or out-of-state institution. Reports on TEXAS Grant recipients are submitted over the signature of the Directors of Student Financial Aid and are neither certified nor audited.
Calculation Type: Non-cumulative New Measure: No Key Measure: No Desired Performance: Higher
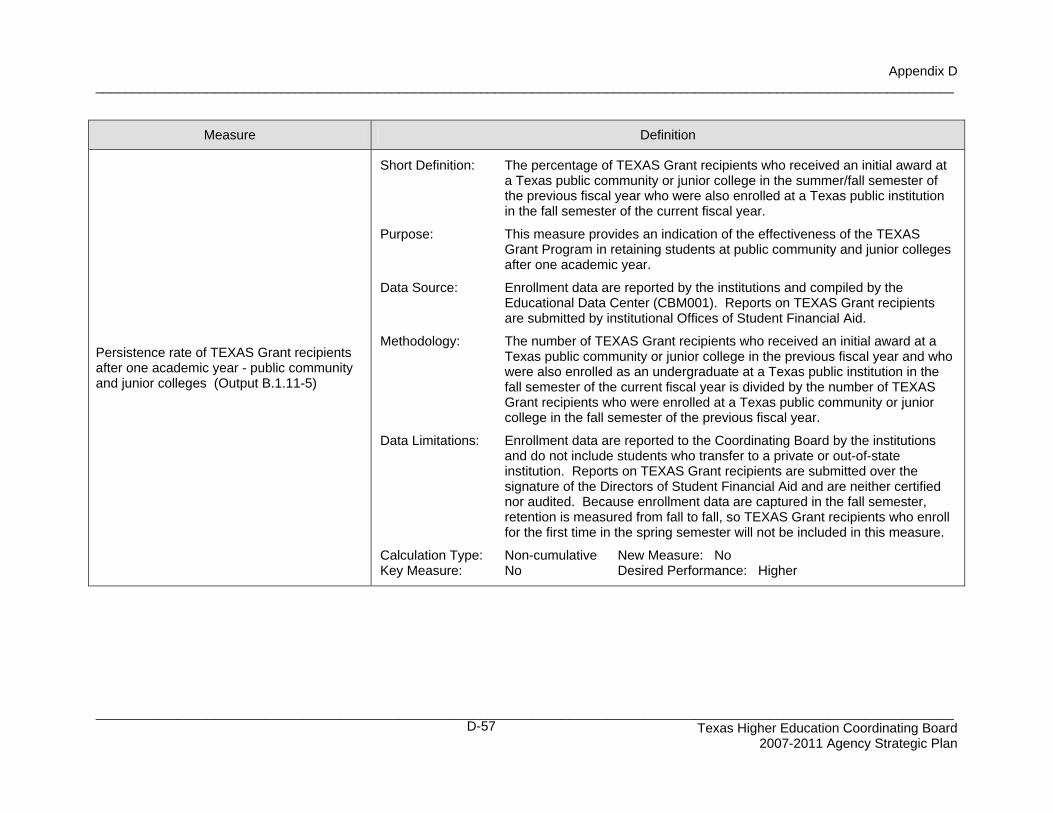
Appendix D
____________________________________________________________________________________________________________________
____________________________________________________________________________________________________________________ Texas Higher Education Coordinating Board
2007-2011 Agency Strategic Plan
D-57
Measure Definition
Persistence rate of TEXAS Grant recipients after one academic year - public community and junior colleges (Output B.1.11-5)
Short Definition: The percentage of TEXAS Grant recipients who received an initial award at
a Texas public community or junior college in the summer/fall semester of the previous fiscal year who were also enrolled at a Texas public institution in the fall semester of the current fiscal year.
Purpose: This measure provides an indication of the effectiveness of the TEXAS
Grant Program in retaining students at public community and junior colleges after one academic year.
Data Source: Enrollment data are reported by the institutions and compiled by the
Educational Data Center (CBM001). Reports on TEXAS Grant recipients are submitted by institutional Offices of Student Financial Aid.
Methodology: The number of TEXAS Grant recipients who received an initial award at a
Texas public community or junior college in the previous fiscal year and who were also enrolled as an undergraduate at a Texas public institution in the fall semester of the current fiscal year is divided by the number of TEXAS Grant recipients who were enrolled at a Texas public community or junior college in the fall semester of the previous fiscal year.
Data Limitations: Enrollment data are reported to the Coordinating Board by the institutions
and do not include students who transfer to a private or out-of-state institution. Reports on TEXAS Grant recipients are submitted over the signature of the Directors of Student Financial Aid and are neither certified nor audited. Because enrollment data are captured in the fall semester, retention is measured from fall to fall, so TEXAS Grant recipients who enroll for the first time in the spring semester will not be included in this measure.
Calculation Type: Non-cumulative New Measure: No Key Measure: No Desired Performance: Higher
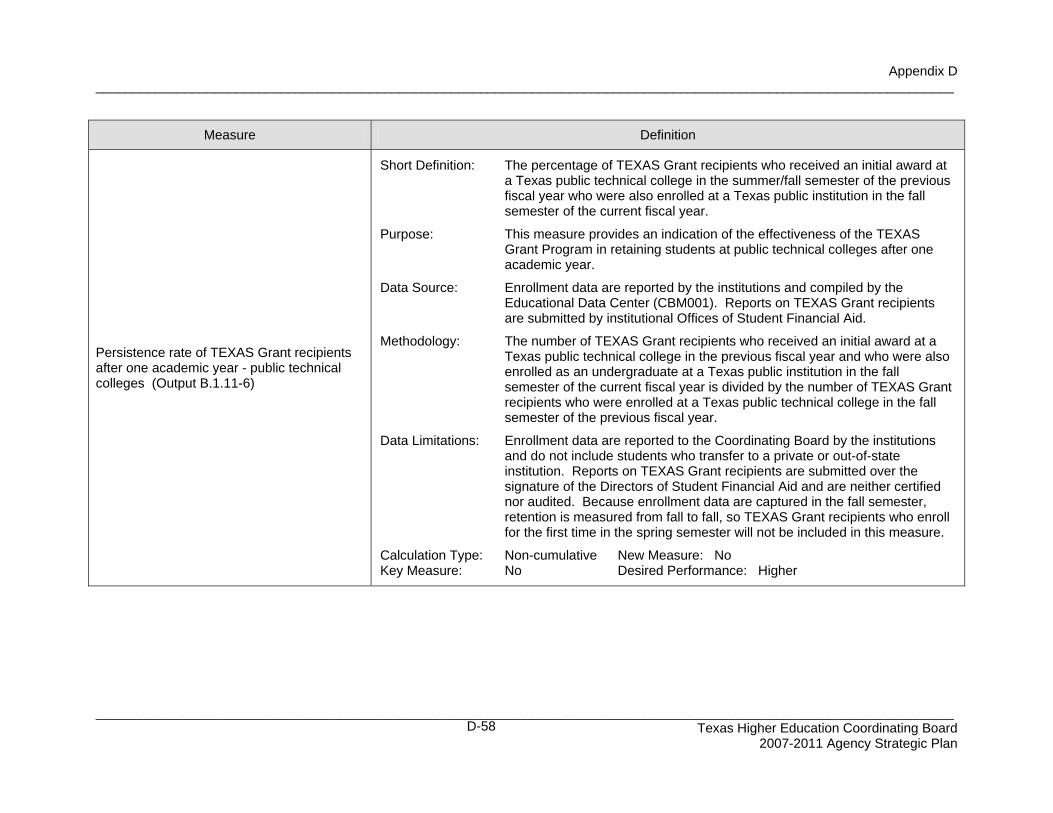
Appendix D
____________________________________________________________________________________________________________________
____________________________________________________________________________________________________________________ Texas Higher Education Coordinating Board
2007-2011 Agency Strategic Plan
D-58
Measure Definition
Persistence rate of TEXAS Grant recipients after one academic year - public technical colleges (Output B.1.11-6)
Short Definition: The percentage of TEXAS Grant recipients who received an initial award at
a Texas public technical college in the summer/fall semester of the previous fiscal year who were also enrolled at a Texas public institution in the fall semester of the current fiscal year.
Purpose: This measure provides an indication of the effectiveness of the TEXAS
Grant Program in retaining students at public technical colleges after one academic year.
Data Source: Enrollment data are reported by the institutions and compiled by the
Educational Data Center (CBM001). Reports on TEXAS Grant recipients are submitted by institutional Offices of Student Financial Aid.
Methodology: The number of TEXAS Grant recipients who received an initial award at a
Texas public technical college in the previous fiscal year and who were also enrolled as an undergraduate at a Texas public institution in the fall semester of the current fiscal year is divided by the number of TEXAS Grant recipients who were enrolled at a Texas public technical college in the fall semester of the previous fiscal year.
Data Limitations: Enrollment data are reported to the Coordinating Board by the institutions
and do not include students who transfer to a private or out-of-state institution. Reports on TEXAS Grant recipients are submitted over the signature of the Directors of Student Financial Aid and are neither certified nor audited. Because enrollment data are captured in the fall semester, retention is measured from fall to fall, so TEXAS Grant recipients who enroll for the first time in the spring semester will not be included in this measure.
Calculation Type: Non-cumulative New Measure: No Key Measure: No Desired Performance: Higher
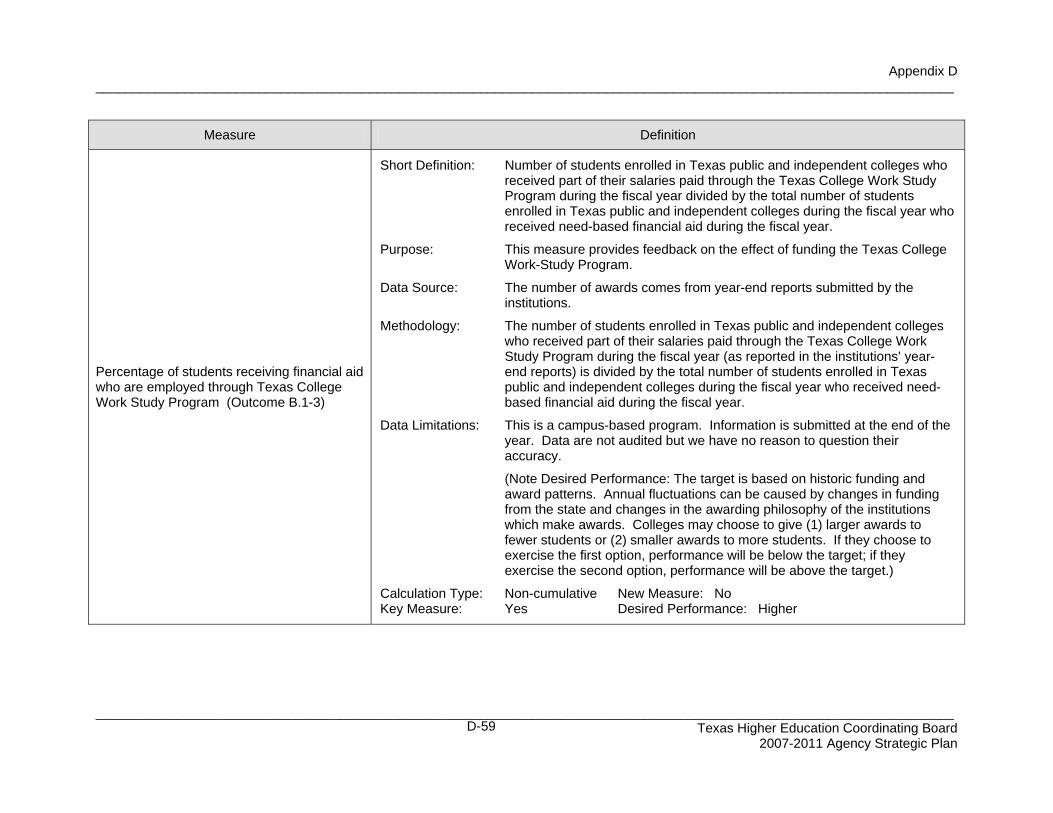
Appendix D
____________________________________________________________________________________________________________________
____________________________________________________________________________________________________________________ Texas Higher Education Coordinating Board
2007-2011 Agency Strategic Plan
D-59
Measure Definition
Percentage of students receiving financial aid who are employed through Texas College Work Study Program (Outcome B.1-3)
Short Definition: Number of students enrolled in Texas public and independent colleges who
received part of their salaries paid through the Texas College Work Study Program during the fiscal year divided by the total number of students enrolled in Texas public and independent colleges during the fiscal year who received need-based financial aid during the fiscal year.
Purpose: This measure provides feedback on the effect of funding the Texas College
Work-Study Program. Data Source: The number of awards comes from year-end reports submitted by the
institutions. Methodology: The number of students enrolled in Texas public and independent colleges
who received part of their salaries paid through the Texas College Work Study Program during the fiscal year (as reported in the institutions’ year-end reports) is divided by the total number of students enrolled in Texas public and independent colleges during the fiscal year who received need-based financial aid during the fiscal year.
Data Limitations: This is a campus-based program. Information is submitted at the end of the
year. Data are not audited but we have no reason to question their accuracy.
(Note Desired Performance: The target is based on historic funding and
award patterns. Annual fluctuations can be caused by changes in funding from the state and changes in the awarding philosophy of the institutions which make awards. Colleges may choose to give (1) larger awards to fewer students or (2) smaller awards to more students. If they choose to exercise the first option, performance will be below the target; if they exercise the second option, performance will be above the target.)
Calculation Type: Non-cumulative New Measure: No Key Measure: Yes Desired Performance: Higher
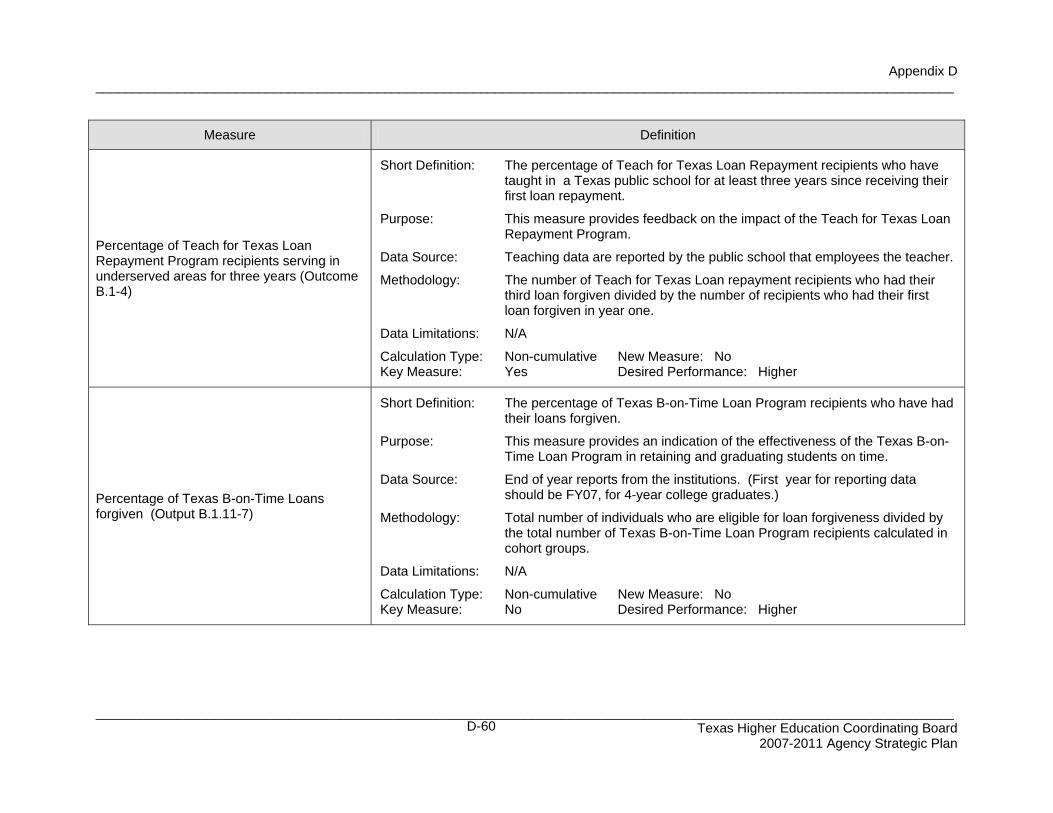
Appendix D
____________________________________________________________________________________________________________________
____________________________________________________________________________________________________________________ Texas Higher Education Coordinating Board
2007-2011 Agency Strategic Plan
D-60
Measure Definition
Percentage of Teach for Texas Loan Repayment Program recipients serving in underserved areas for three years (Outcome B.1-4)
Short Definition: The percentage of Teach for Texas Loan Repayment recipients who have
taught in a Texas public school for at least three years since receiving their first loan repayment.
Purpose: This measure provides feedback on the impact of the Teach for Texas Loan
Repayment Program. Data Source: Teaching data are reported by the public school that employees the teacher. Methodology: The number of Teach for Texas Loan repayment recipients who had their
third loan forgiven divided by the number of recipients who had their first loan forgiven in year one.
Data Limitations: N/A Calculation Type: Non-cumulative New Measure: No Key Measure: Yes Desired Performance: Higher
Percentage of Texas B-on-Time Loans forgiven (Output B.1.11-7)
Short Definition: The percentage of Texas B-on-Time Loan Program recipients who have had
their loans forgiven. Purpose: This measure provides an indication of the effectiveness of the Texas B-on-
Time Loan Program in retaining and graduating students on time. Data Source: End of year reports from the institutions. (First year for reporting data
should be FY07, for 4-year college graduates.) Methodology: Total number of individuals who are eligible for loan forgiveness divided by
the total number of Texas B-on-Time Loan Program recipients calculated in cohort groups.
Data Limitations: N/A Calculation Type: Non-cumulative New Measure: No Key Measure: No Desired Performance: Higher
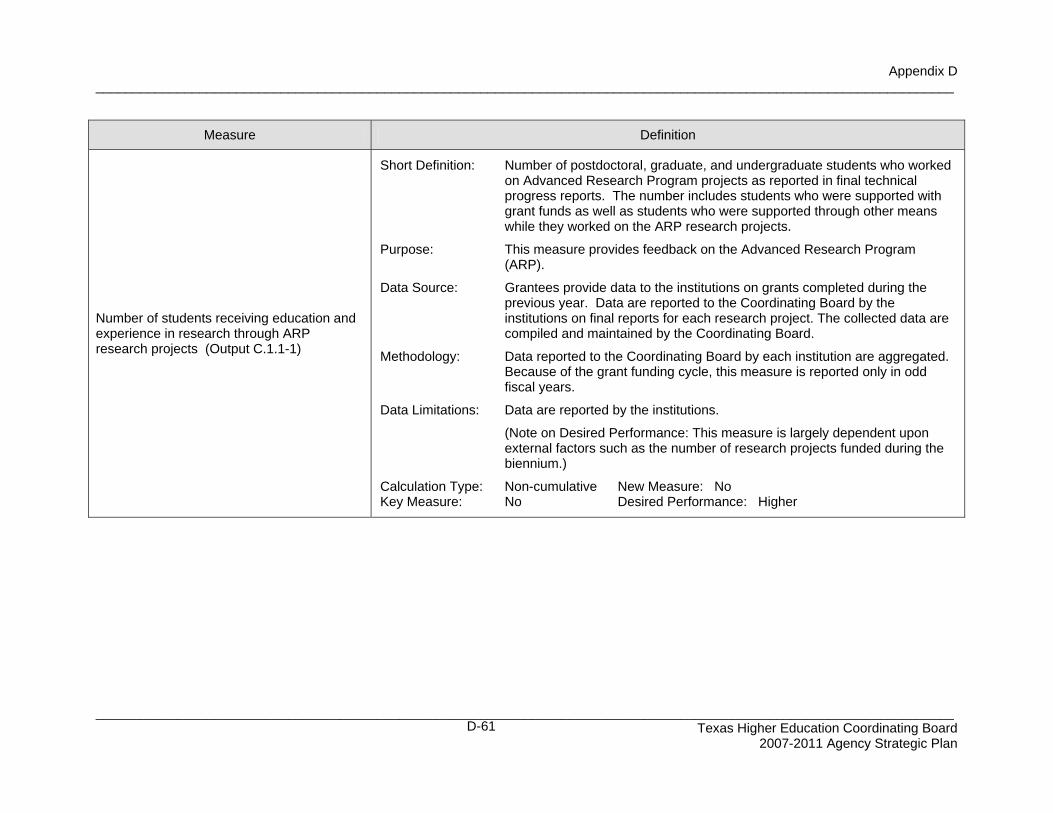
Appendix D
____________________________________________________________________________________________________________________
____________________________________________________________________________________________________________________ Texas Higher Education Coordinating Board
2007-2011 Agency Strategic Plan
D-61
Measure Definition
Number of students receiving education and experience in research through ARP research projects (Output C.1.1-1)
Short Definition: Number of postdoctoral, graduate, and undergraduate students who worked
on Advanced Research Program projects as reported in final technical progress reports. The number includes students who were supported with grant funds as well as students who were supported through other means while they worked on the ARP research projects.
Purpose: This measure provides feedback on the Advanced Research Program
(ARP). Data Source: Grantees provide data to the institutions on grants completed during the
previous year. Data are reported to the Coordinating Board by the institutions on final reports for each research project. The collected data are compiled and maintained by the Coordinating Board.
Methodology: Data reported to the Coordinating Board by each institution are aggregated.
Because of the grant funding cycle, this measure is reported only in odd fiscal years.
Data Limitations: Data are reported by the institutions. (Note on Desired Performance: This measure is largely dependent upon
external factors such as the number of research projects funded during the biennium.)
Calculation Type: Non-cumulative New Measure: No Key Measure: No Desired Performance: Higher
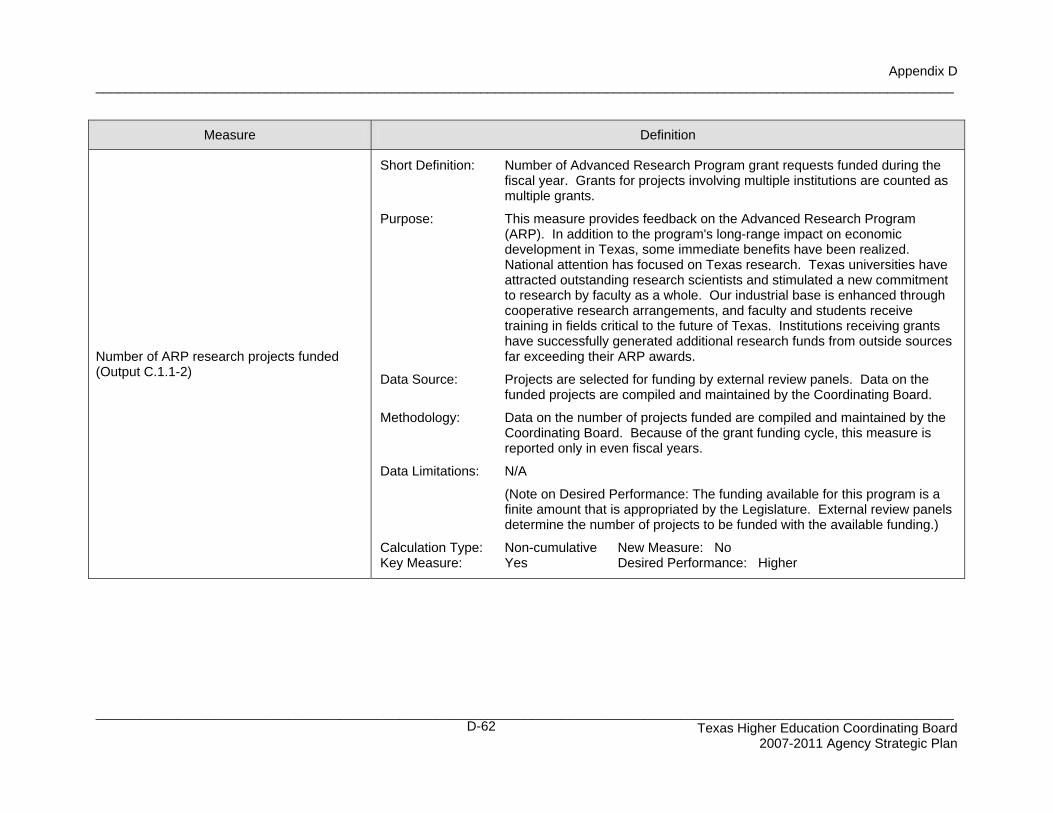
Appendix D
____________________________________________________________________________________________________________________
____________________________________________________________________________________________________________________ Texas Higher Education Coordinating Board
2007-2011 Agency Strategic Plan
D-62
Measure Definition
Number of ARP research projects funded (Output C.1.1-2)
Short Definition: Number of Advanced Research Program grant requests funded during the
fiscal year. Grants for projects involving multiple institutions are counted as multiple grants.
Purpose: This measure provides feedback on the Advanced Research Program
(ARP). In addition to the program's long-range impact on economic development in Texas, some immediate benefits have been realized. National attention has focused on Texas research. Texas universities have attracted outstanding research scientists and stimulated a new commitment to research by faculty as a whole. Our industrial base is enhanced through cooperative research arrangements, and faculty and students receive training in fields critical to the future of Texas. Institutions receiving grants have successfully generated additional research funds from outside sources far exceeding their ARP awards.
Data Source: Projects are selected for funding by external review panels. Data on the
funded projects are compiled and maintained by the Coordinating Board. Methodology: Data on the number of projects funded are compiled and maintained by the
Coordinating Board. Because of the grant funding cycle, this measure is reported only in even fiscal years.
Data Limitations: N/A (Note on Desired Performance: The funding available for this program is a
finite amount that is appropriated by the Legislature. External review panels determine the number of projects to be funded with the available funding.)
Calculation Type: Non-cumulative New Measure: No Key Measure: Yes Desired Performance: Higher

Appendix D
____________________________________________________________________________________________________________________
____________________________________________________________________________________________________________________ Texas Higher Education Coordinating Board
2007-2011 Agency Strategic Plan
D-63
Measure Definition
Number of students receiving education and experience in research through ATP research projects (Output C.1.2-1)
Short Definition: Number of postdoctoral, graduate, and undergraduate students who worked
on Advanced Technology Program projects as reported in final technical progress reports. The number includes students who were supported with grant funds as well as students who were supported through other means while they worked on the ATP research projects.
Purpose: This measure provides feedback on the Advanced Technology Program
(ATP). Data Source: Grantees provide data to the institutions on grants completed during the
fiscal year. Data are reported to the Coordinating Board by the institutions on final reports for each technology project. The collected data are compiled and maintained by the Coordinating Board.
Methodology: Data reported to the Coordinating Board by each institution are aggregated.
Because of the grant funding cycle, this measure is reported only in odd fiscal years.
Data Limitations: Data are reported by the institutions. (Note on Desired Performance: This measure is largely dependent upon
external factors such as the number of research projects funded during the biennium.)
Calculation Type: Non-cumulative New Measure: No Key Measure: No Desired Performance: Higher
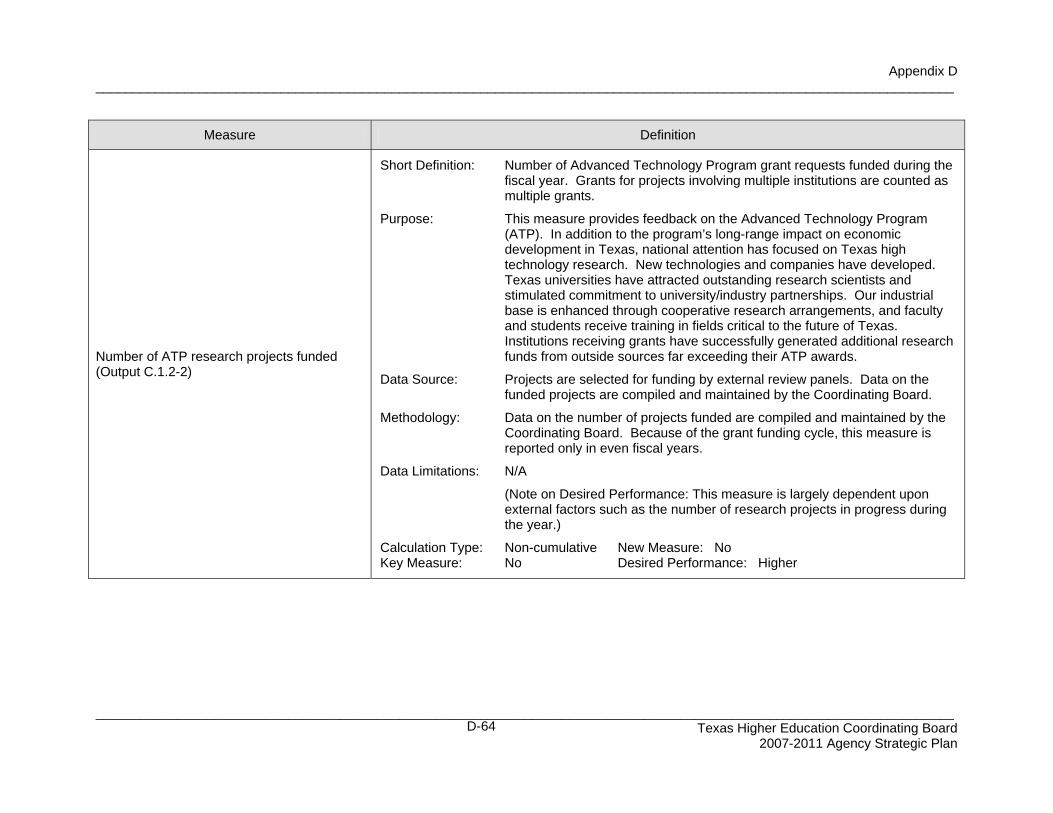
Appendix D
____________________________________________________________________________________________________________________
____________________________________________________________________________________________________________________ Texas Higher Education Coordinating Board
2007-2011 Agency Strategic Plan
D-64
Measure Definition
Number of ATP research projects funded (Output C.1.2-2)
Short Definition: Number of Advanced Technology Program grant requests funded during the
fiscal year. Grants for projects involving multiple institutions are counted as multiple grants.
Purpose: This measure provides feedback on the Advanced Technology Program
(ATP). In addition to the program’s long-range impact on economic development in Texas, national attention has focused on Texas high technology research. New technologies and companies have developed. Texas universities have attracted outstanding research scientists and stimulated commitment to university/industry partnerships. Our industrial base is enhanced through cooperative research arrangements, and faculty and students receive training in fields critical to the future of Texas. Institutions receiving grants have successfully generated additional research funds from outside sources far exceeding their ATP awards.
Data Source: Projects are selected for funding by external review panels. Data on the
funded projects are compiled and maintained by the Coordinating Board. Methodology: Data on the number of projects funded are compiled and maintained by the
Coordinating Board. Because of the grant funding cycle, this measure is reported only in even fiscal years.
Data Limitations: N/A (Note on Desired Performance: This measure is largely dependent upon
external factors such as the number of research projects in progress during the year.)
Calculation Type: Non-cumulative New Measure: No Key Measure: No Desired Performance: Higher
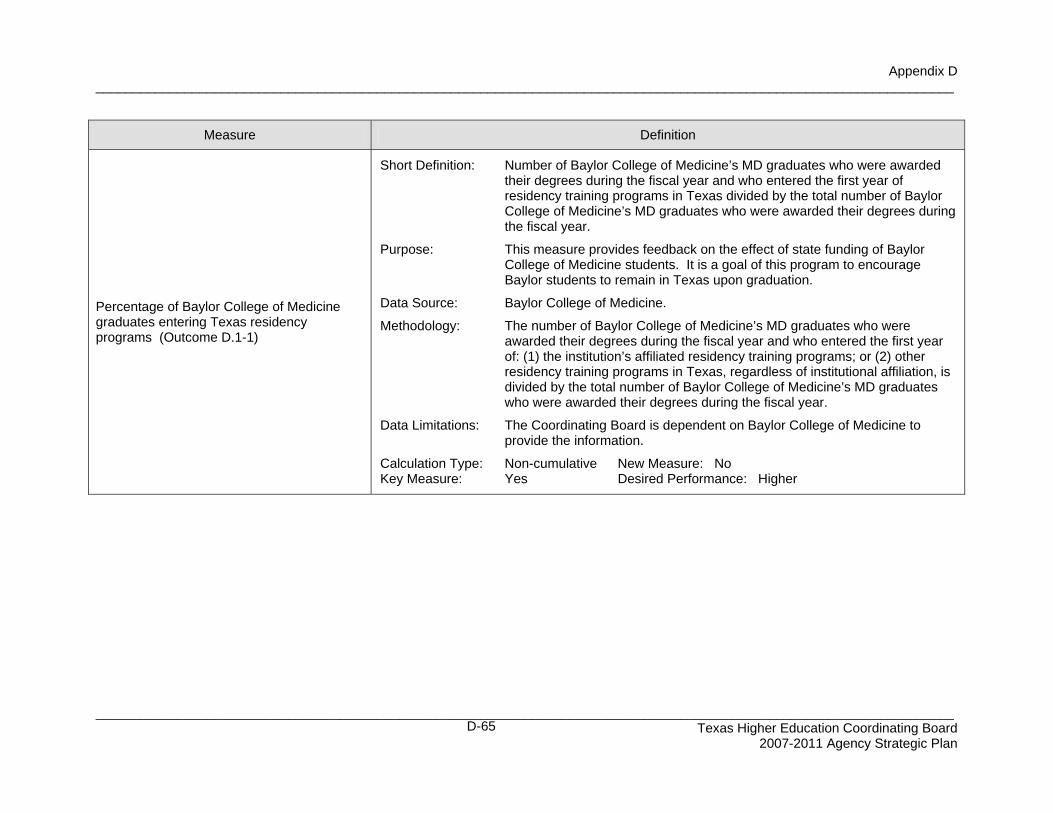
Appendix D
____________________________________________________________________________________________________________________
____________________________________________________________________________________________________________________ Texas Higher Education Coordinating Board
2007-2011 Agency Strategic Plan
D-65
Measure Definition
Percentage of Baylor College of Medicine graduates entering Texas residency programs (Outcome D.1-1)
Short Definition: Number of Baylor College of Medicine’s MD graduates who were awarded
their degrees during the fiscal year and who entered the first year of residency training programs in Texas divided by the total number of Baylor College of Medicine’s MD graduates who were awarded their degrees during the fiscal year.
Purpose: This measure provides feedback on the effect of state funding of Baylor
College of Medicine students. It is a goal of this program to encourage Baylor students to remain in Texas upon graduation.
Data Source: Baylor College of Medicine. Methodology: The number of Baylor College of Medicine’s MD graduates who were
awarded their degrees during the fiscal year and who entered the first year of: (1) the institution’s affiliated residency training programs; or (2) other residency training programs in Texas, regardless of institutional affiliation, is divided by the total number of Baylor College of Medicine’s MD graduates who were awarded their degrees during the fiscal year.
Data Limitations: The Coordinating Board is dependent on Baylor College of Medicine to
provide the information. Calculation Type: Non-cumulative New Measure: No Key Measure: Yes Desired Performance: Higher
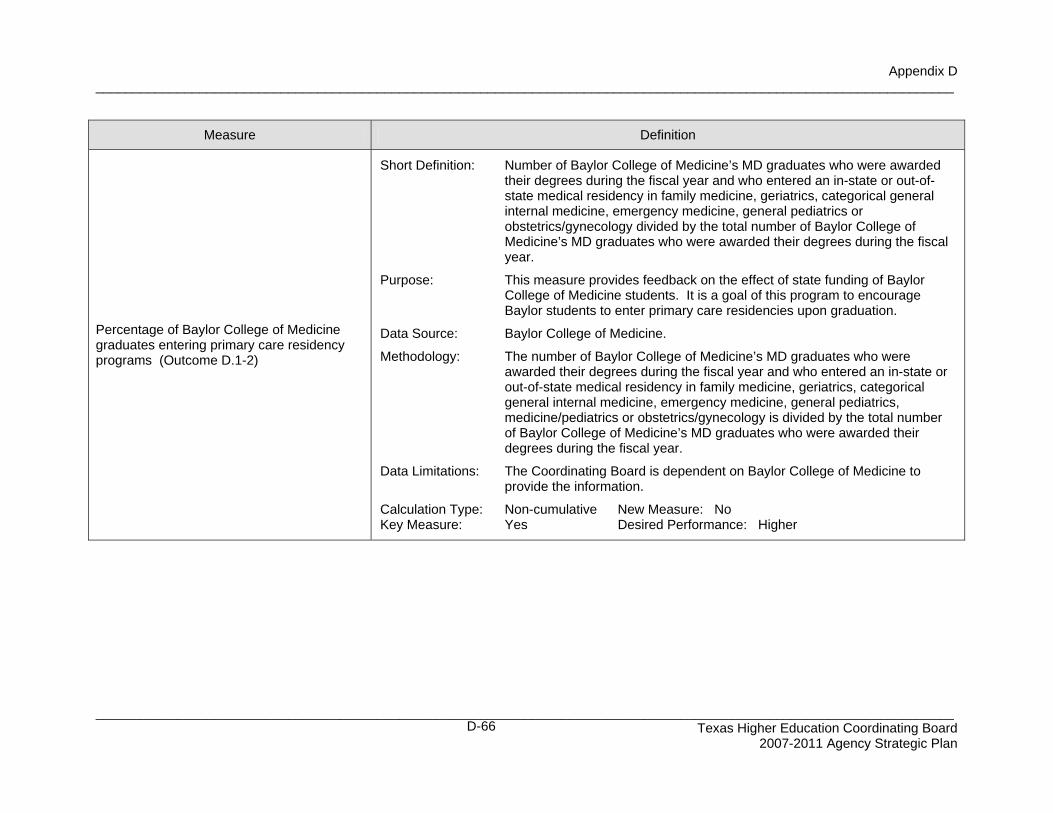
Appendix D
____________________________________________________________________________________________________________________
____________________________________________________________________________________________________________________ Texas Higher Education Coordinating Board
2007-2011 Agency Strategic Plan
D-66
Measure Definition
Percentage of Baylor College of Medicine graduates entering primary care residency programs (Outcome D.1-2)
Short Definition: Number of Baylor College of Medicine’s MD graduates who were awarded
their degrees during the fiscal year and who entered an in-state or out-of-state medical residency in family medicine, geriatrics, categorical general internal medicine, emergency medicine, general pediatrics or obstetrics/gynecology divided by the total number of Baylor College of Medicine’s MD graduates who were awarded their degrees during the fiscal year.
Purpose: This measure provides feedback on the effect of state funding of Baylor
College of Medicine students. It is a goal of this program to encourage Baylor students to enter primary care residencies upon graduation.
Data Source: Baylor College of Medicine. Methodology: The number of Baylor College of Medicine’s MD graduates who were
awarded their degrees during the fiscal year and who entered an in-state or out-of-state medical residency in family medicine, geriatrics, categorical general internal medicine, emergency medicine, general pediatrics, medicine/pediatrics or obstetrics/gynecology is divided by the total number of Baylor College of Medicine’s MD graduates who were awarded their degrees during the fiscal year.
Data Limitations: The Coordinating Board is dependent on Baylor College of Medicine to
provide the information. Calculation Type: Non-cumulative New Measure: No Key Measure: Yes Desired Performance: Higher
Appendix D
____________________________________________________________________________________________________________________
____________________________________________________________________________________________________________________ Texas Higher Education Coordinating Board
2007-2011 Agency Strategic Plan
D-67
Measure Definition
Percentage of Baylor College of Medicine students passing part 1 or part 2 of the National Licensing Exam on the first attempt (Outcome D.1-3)
Short Definition: The number of students passing part 1 or part 2 of the USMLE or
COMLEX/NBOME on the first attempt during the fiscal year, divided by the total number of students taking part 1 or part 2 for the first time during the fiscal year.
Purpose: This measure provides information on the quality of education provided by
Baylor College of Medicine. Data Source: Data provided by Baylor College of Medicine and produced by the National
Board of Medical Examiners. Methodology: The number of students passing part 1 or part 2 of the USMLE or
COMLEX/NBOME on the first attempt during the fiscal year is divided by the total number of students taking part 1 or part 2 for the first time during the fiscal year.
Data Limitations: The Coordinating Board is dependent on Baylor College of Medicine to
provide the information. Calculation Type: Non-cumulative New Measure: No Key Measure: No Desired Performance: Higher
Appendix D
____________________________________________________________________________________________________________________
____________________________________________________________________________________________________________________ Texas Higher Education Coordinating Board
2007-2011 Agency Strategic Plan
D-68
Measure Definition
Number of Texas resident Baylor College of Medicine medical students funded (Output D.1.1-1)
Short Definition: Number of Texas resident undergraduate medical students at Baylor
College of Medicine funded by the undergraduate medical education program per Sections 61.091, 61.092, and 61.093 of the Texas Education Code during the fiscal year.
Purpose: This measure provides information on the number of Texas resident medical
students at Baylor College of Medicine funded by the state. Data Source: Reported by Baylor College of Medicine to the Coordinating Board. Methodology: This measure is a headcount of the number of Texas resident
undergraduate medical students at Baylor College of Medicine funded by the undergraduate medical education program during the fiscal year.
Data Limitations: The Coordinating Board is dependent on the Baylor College of Medicine to
provide enrollment numbers. (Note on Desired Performance: The procedure for determining the number
of students to be funded is specified in the enabling legislation and is the actual number of Texas resident undergraduate medical students enrolled at Baylor College of Medicine during the fiscal year.)
Calculation Type: Non-cumulative New Measure: No Key Measure: No Desired Performance: Higher
Appendix D
____________________________________________________________________________________________________________________
____________________________________________________________________________________________________________________ Texas Higher Education Coordinating Board
2007-2011 Agency Strategic Plan
D-69
Measure Definition
Average amount per Baylor College of Medicine student (Output D.1.1-2)
Short Definition: An amount equal to the average annual state tax support per undergraduate
medical student at the established public medical schools (per Section 61.092 of the Texas Education Code), multiplied by the number of bona fide Texas resident undergraduate medical students enrolled at Baylor College of Medicine. The Coordinating Board may never disburse an amount exceeding the amount appropriated by the legislature for the undergraduate medical education program.
Purpose: This measure provides information on the level of state funding per Texas resident medical student at Baylor College of Medicine.
Data Source: General Appropriations Act, Annual Financial Reports and operating budgets from the University of Texas Medical Branch at Galveston and Southwestern Medical Center at Dallas. Information pertaining to the allocation of costs for fringe benefits and infrastructure obtained from the institutions. General Revenue through the Instruction and Operation formula come from the Legislative Budget Board work papers.
Methodology: The procedure for determining the amount to be disbursed is specified in the enabling legislation and is an amount equal to the average annual tax support per undergraduate medical student at two public medical schools in the University of Texas System (the Medical Branch at Galveston and Southwestern Medical Center at Dallas) multiplied by the number of Texas resident undergraduate medical students enrolled by Baylor College of Medicine in September of the year of disbursement. The actual amount allocated cannot exceed the trusteed appropriation and is determined by actual appropriations and actual enrollment of Texas residents for the fiscal year.
Data Limitations: The Coordinating Board is dependent on the institutions to provide cost allocation information related to fringe benefits and infrastructure.
(Note on Desired Performance: The procedure for determining the amount to be disbursed is specified in the enabling legislation. The actual amount allocated cannot exceed the trusteed appropriation and is determined by actual appropriations and actual enrollment of Texas resident undergraduate medical students at Baylor College of Medicine for the fiscal year.)
Calculation Type: Non-cumulative New Measure: No Key Measure: No Desired Performance: Higher
Appendix D
____________________________________________________________________________________________________________________
____________________________________________________________________________________________________________________ Texas Higher Education Coordinating Board
2007-2011 Agency Strategic Plan
D-70
Measure Definition
Percentage of Family Practice Residency Program completers practicing in Medically-Underserved Areas or Health Professional Shortage Areas (Outcome D.1-4)
Short Definition: The number of Family Practice Residency Program completers who are
currently practicing in Texas counties or portions of counties that are designated as Health Professional Shortage Areas (HPSAs) or Medically-Underserved Areas (MUAs) divided by the total number of program completers who are currently practicing in Texas.
Purpose: This measure provides feedback on the Family Practice Residency
Program. It is a goal of the program to achieve a better distribution of family physicians throughout the state and to improve medical care in underserved areas.
Data Source: (1) Primary Care Residency Tracking Survey completed by residency
program directors; (2) Texas State Board of Medical Examiners data; (3) Texas Department of Health list of Health Professional Shortage Areas (HPSAs) and Medically-Underserved Areas (MUAs).
Methodology: The number of Family Practice Residency Program completers who are
currently practicing in Texas counties or portions of counties that are designated as Health Professional Shortage Areas (HPSAs) or Medically-Underserved Areas (MUAs) is divided by the total number of program completers who are currently practicing in Texas and then expressed as a percentage.
Data Limitations: (1) Primary Care Residency Tracking Survey is reviewed for completeness
and accuracy by Coordinating Board staff; (2) Data collection incompatibility between the Coordinating Board and the Texas State Board of Medical Examiners.
Calculation Type: Non-cumulative New Measure: No Key Measure: Yes Desired Performance: Higher
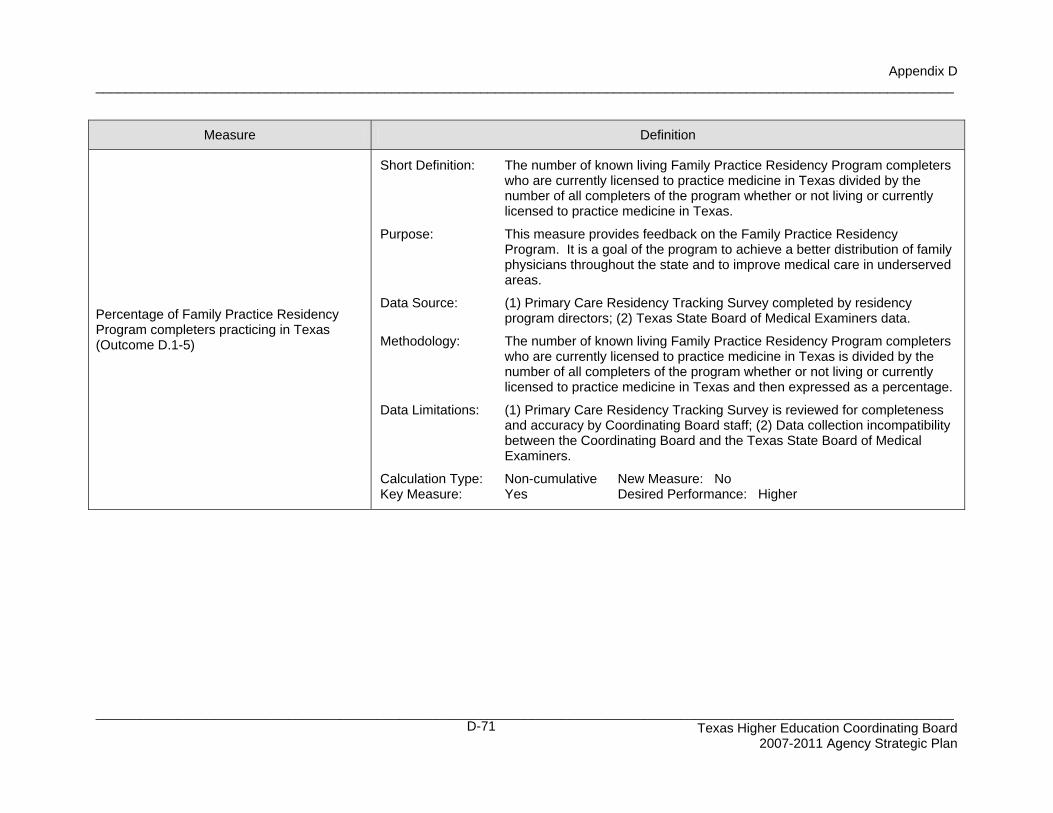
Appendix D
____________________________________________________________________________________________________________________
____________________________________________________________________________________________________________________ Texas Higher Education Coordinating Board
2007-2011 Agency Strategic Plan
D-71
Measure Definition
Percentage of Family Practice Residency Program completers practicing in Texas (Outcome D.1-5)
Short Definition: The number of known living Family Practice Residency Program completers
who are currently licensed to practice medicine in Texas divided by the number of all completers of the program whether or not living or currently licensed to practice medicine in Texas.
Purpose: This measure provides feedback on the Family Practice Residency
Program. It is a goal of the program to achieve a better distribution of family physicians throughout the state and to improve medical care in underserved areas.
Data Source: (1) Primary Care Residency Tracking Survey completed by residency
program directors; (2) Texas State Board of Medical Examiners data. Methodology: The number of known living Family Practice Residency Program completers
who are currently licensed to practice medicine in Texas is divided by the number of all completers of the program whether or not living or currently licensed to practice medicine in Texas and then expressed as a percentage.
Data Limitations: (1) Primary Care Residency Tracking Survey is reviewed for completeness
and accuracy by Coordinating Board staff; (2) Data collection incompatibility between the Coordinating Board and the Texas State Board of Medical Examiners.
Calculation Type: Non-cumulative New Measure: No Key Measure: Yes Desired Performance: Higher
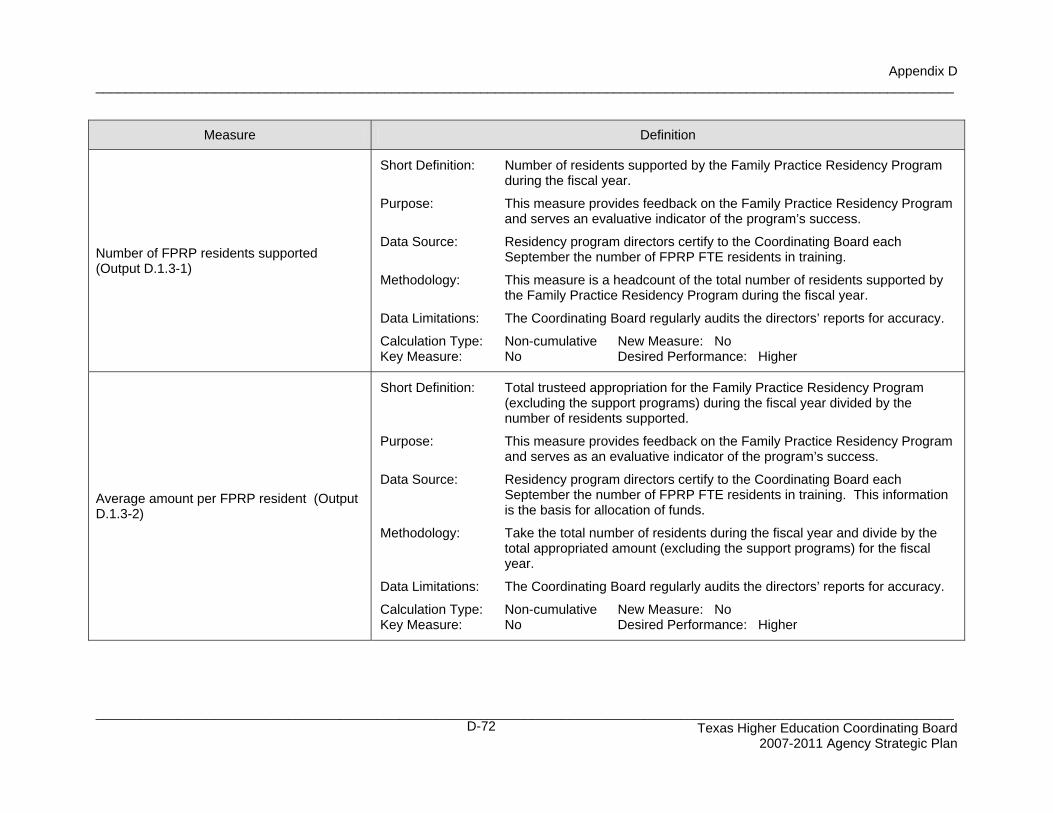
Appendix D
____________________________________________________________________________________________________________________
____________________________________________________________________________________________________________________ Texas Higher Education Coordinating Board
2007-2011 Agency Strategic Plan
D-72
Measure Definition
Number of FPRP residents supported (Output D.1.3-1)
Short Definition: Number of residents supported by the Family Practice Residency Program
during the fiscal year. Purpose: This measure provides feedback on the Family Practice Residency Program
and serves an evaluative indicator of the program’s success. Data Source: Residency program directors certify to the Coordinating Board each
September the number of FPRP FTE residents in training. Methodology: This measure is a headcount of the total number of residents supported by
the Family Practice Residency Program during the fiscal year. Data Limitations: The Coordinating Board regularly audits the directors’ reports for accuracy. Calculation Type: Non-cumulative New Measure: No Key Measure: No Desired Performance: Higher
Average amount per FPRP resident (Output D.1.3-2)
Short Definition: Total trusteed appropriation for the Family Practice Residency Program
(excluding the support programs) during the fiscal year divided by the number of residents supported.
Purpose: This measure provides feedback on the Family Practice Residency Program
and serves as an evaluative indicator of the program’s success. Data Source: Residency program directors certify to the Coordinating Board each
September the number of FPRP FTE residents in training. This information is the basis for allocation of funds.
Methodology: Take the total number of residents during the fiscal year and divide by the
total appropriated amount (excluding the support programs) for the fiscal year.
Data Limitations: The Coordinating Board regularly audits the directors’ reports for accuracy. Calculation Type: Non-cumulative New Measure: No Key Measure: No Desired Performance: Higher
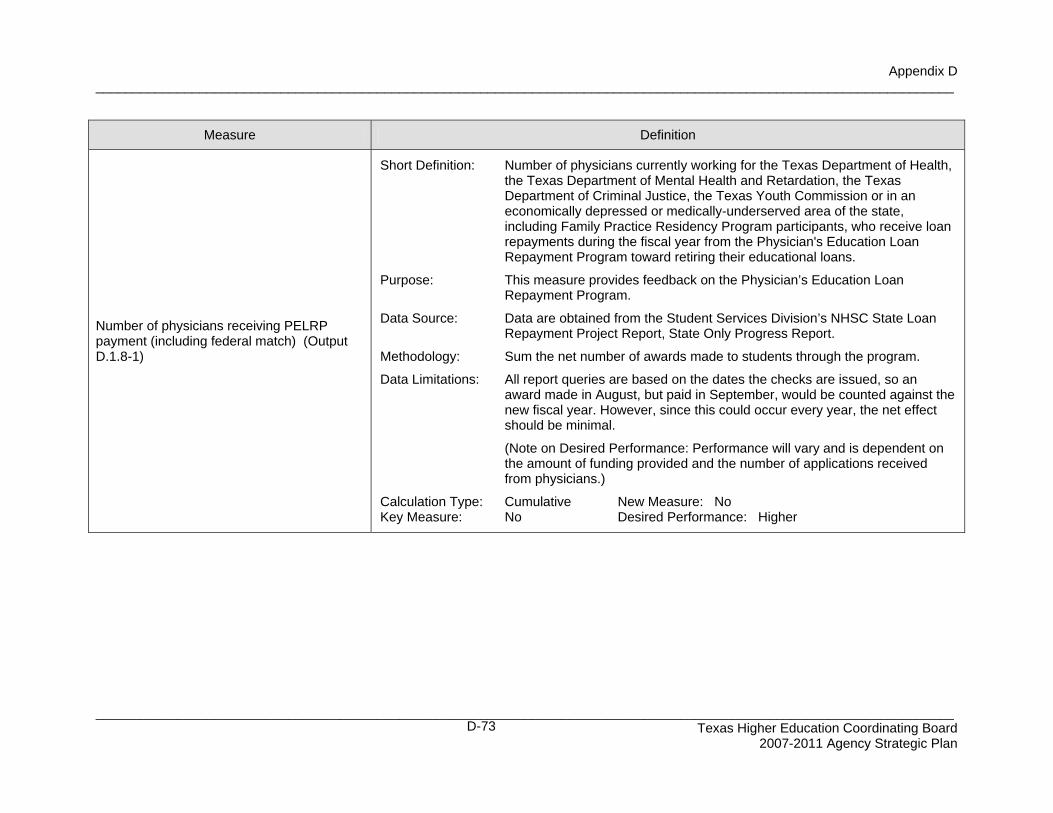
Appendix D
____________________________________________________________________________________________________________________
____________________________________________________________________________________________________________________ Texas Higher Education Coordinating Board
2007-2011 Agency Strategic Plan
D-73
Measure Definition
Number of physicians receiving PELRP payment (including federal match) (Output D.1.8-1)
Short Definition: Number of physicians currently working for the Texas Department of Health,
the Texas Department of Mental Health and Retardation, the Texas Department of Criminal Justice, the Texas Youth Commission or in an economically depressed or medically-underserved area of the state, including Family Practice Residency Program participants, who receive loan repayments during the fiscal year from the Physician's Education Loan Repayment Program toward retiring their educational loans.
Purpose: This measure provides feedback on the Physician’s Education Loan
Repayment Program. Data Source: Data are obtained from the Student Services Division’s NHSC State Loan
Repayment Project Report, State Only Progress Report. Methodology: Sum the net number of awards made to students through the program. Data Limitations: All report queries are based on the dates the checks are issued, so an
award made in August, but paid in September, would be counted against the new fiscal year. However, since this could occur every year, the net effect should be minimal.
(Note on Desired Performance: Performance will vary and is dependent on
the amount of funding provided and the number of applications received from physicians.)
Calculation Type: Cumulative New Measure: No Key Measure: No Desired Performance: Higher
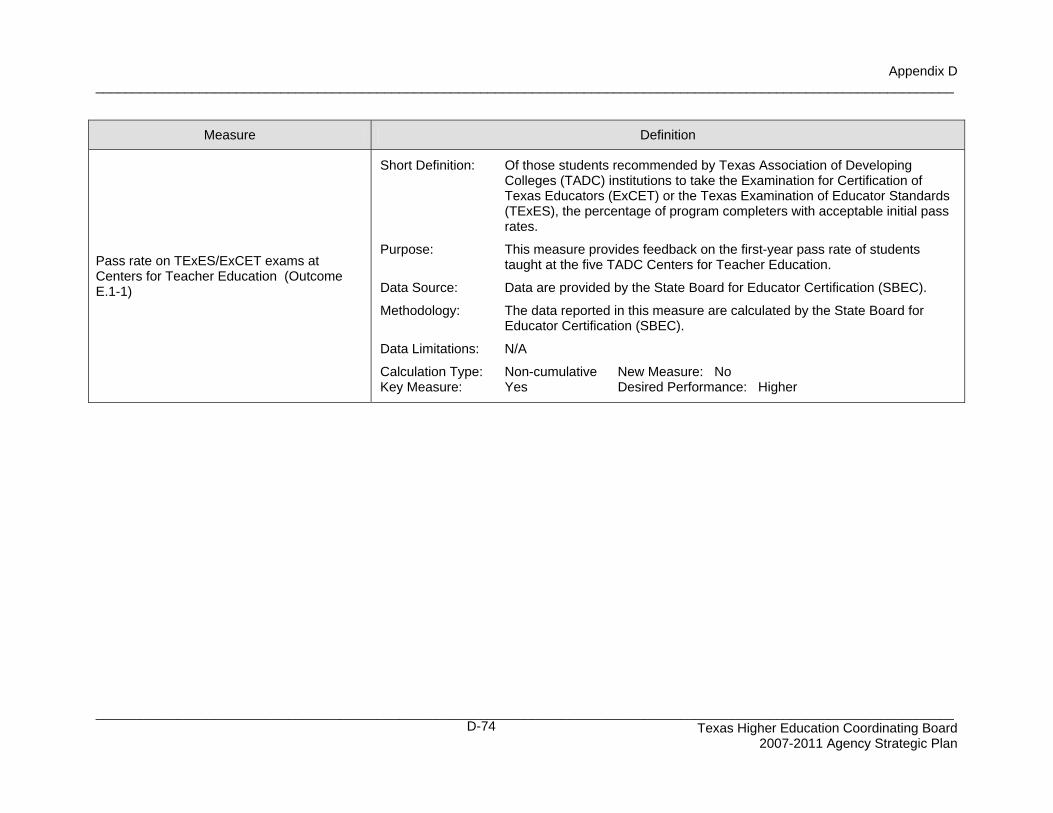
Appendix D
____________________________________________________________________________________________________________________
____________________________________________________________________________________________________________________ Texas Higher Education Coordinating Board
2007-2011 Agency Strategic Plan
D-74
Measure Definition
Pass rate on TExES/ExCET exams at Centers for Teacher Education (Outcome E.1-1)
Short Definition: Of those students recommended by Texas Association of Developing
Colleges (TADC) institutions to take the Examination for Certification of Texas Educators (ExCET) or the Texas Examination of Educator Standards (TExES), the percentage of program completers with acceptable initial pass rates.
Purpose: This measure provides feedback on the first-year pass rate of students
taught at the five TADC Centers for Teacher Education. Data Source: Data are provided by the State Board for Educator Certification (SBEC). Methodology: The data reported in this measure are calculated by the State Board for
Educator Certification (SBEC). Data Limitations: N/A Calculation Type: Non-cumulative New Measure: No Key Measure: Yes Desired Performance: Higher
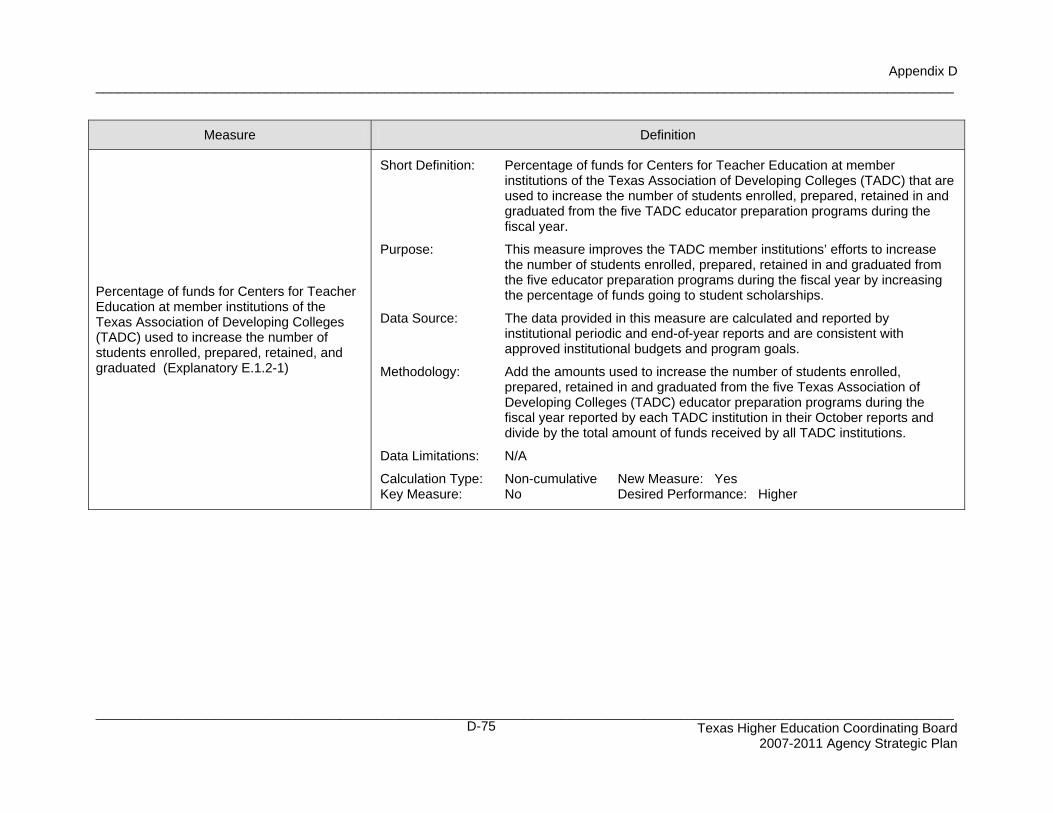
Appendix D
____________________________________________________________________________________________________________________
____________________________________________________________________________________________________________________ Texas Higher Education Coordinating Board
2007-2011 Agency Strategic Plan
D-75
Measure Definition
Percentage of funds for Centers for Teacher Education at member institutions of the Texas Association of Developing Colleges (TADC) used to increase the number of students enrolled, prepared, retained, and graduated (Explanatory E.1.2-1)
Short Definition: Percentage of funds for Centers for Teacher Education at member
institutions of the Texas Association of Developing Colleges (TADC) that are used to increase the number of students enrolled, prepared, retained in and graduated from the five TADC educator preparation programs during the fiscal year.
Purpose: This measure improves the TADC member institutions’ efforts to increase
the number of students enrolled, prepared, retained in and graduated from the five educator preparation programs during the fiscal year by increasing the percentage of funds going to student scholarships.
Data Source: The data provided in this measure are calculated and reported by
institutional periodic and end-of-year reports and are consistent with approved institutional budgets and program goals.
Methodology: Add the amounts used to increase the number of students enrolled,
prepared, retained in and graduated from the five Texas Association of Developing Colleges (TADC) educator preparation programs during the fiscal year reported by each TADC institution in their October reports and divide by the total amount of funds received by all TADC institutions.
Data Limitations: N/A Calculation Type: Non-cumulative New Measure: Yes Key Measure: No Desired Performance: Higher
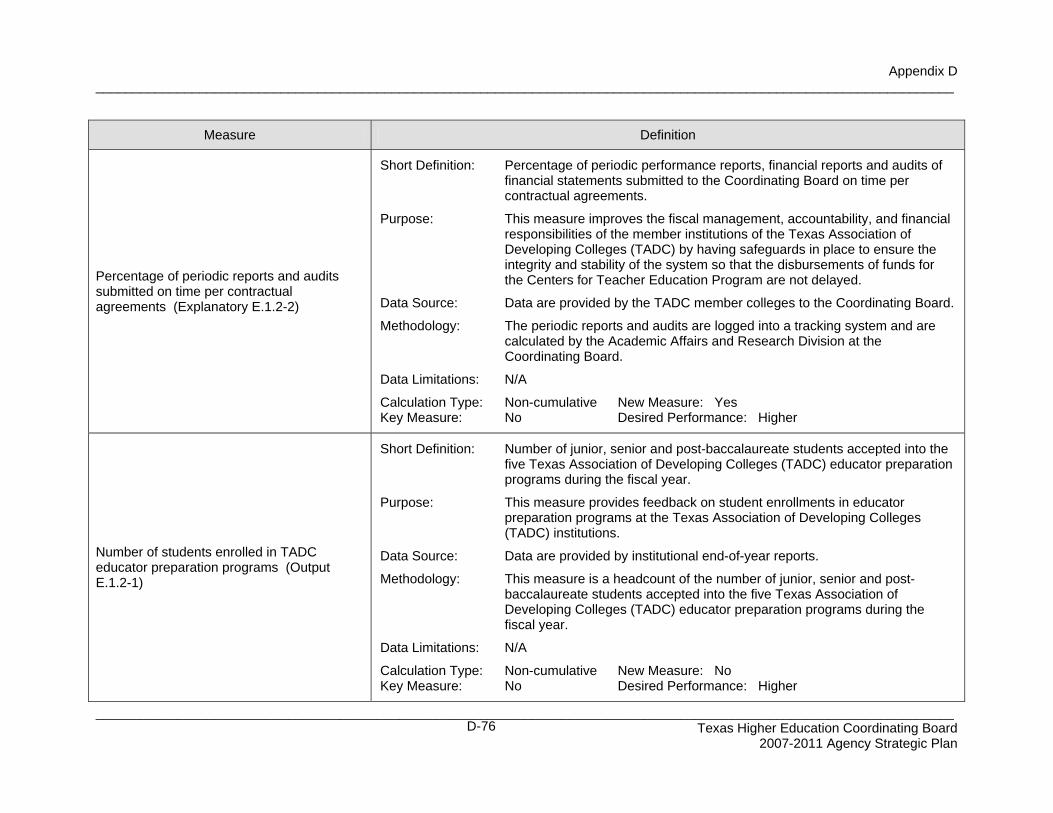
Appendix D
____________________________________________________________________________________________________________________
____________________________________________________________________________________________________________________ Texas Higher Education Coordinating Board
2007-2011 Agency Strategic Plan
D-76
Measure Definition
Percentage of periodic reports and audits submitted on time per contractual agreements (Explanatory E.1.2-2)
Short Definition: Percentage of periodic performance reports, financial reports and audits of
financial statements submitted to the Coordinating Board on time per contractual agreements.
Purpose: This measure improves the fiscal management, accountability, and financial
responsibilities of the member institutions of the Texas Association of Developing Colleges (TADC) by having safeguards in place to ensure the integrity and stability of the system so that the disbursements of funds for the Centers for Teacher Education Program are not delayed.
Data Source: Data are provided by the TADC member colleges to the Coordinating Board. Methodology: The periodic reports and audits are logged into a tracking system and are
calculated by the Academic Affairs and Research Division at the Coordinating Board.
Data Limitations: N/A Calculation Type: Non-cumulative New Measure: Yes Key Measure: No Desired Performance: Higher
Number of students enrolled in TADC educator preparation programs (Output E.1.2-1)
Short Definition: Number of junior, senior and post-baccalaureate students accepted into the
five Texas Association of Developing Colleges (TADC) educator preparation programs during the fiscal year.
Purpose: This measure provides feedback on student enrollments in educator
preparation programs at the Texas Association of Developing Colleges (TADC) institutions.
Data Source: Data are provided by institutional end-of-year reports. Methodology: This measure is a headcount of the number of junior, senior and post-
baccalaureate students accepted into the five Texas Association of Developing Colleges (TADC) educator preparation programs during the fiscal year.
Data Limitations: N/A Calculation Type: Non-cumulative New Measure: No Key Measure: No Desired Performance: Higher
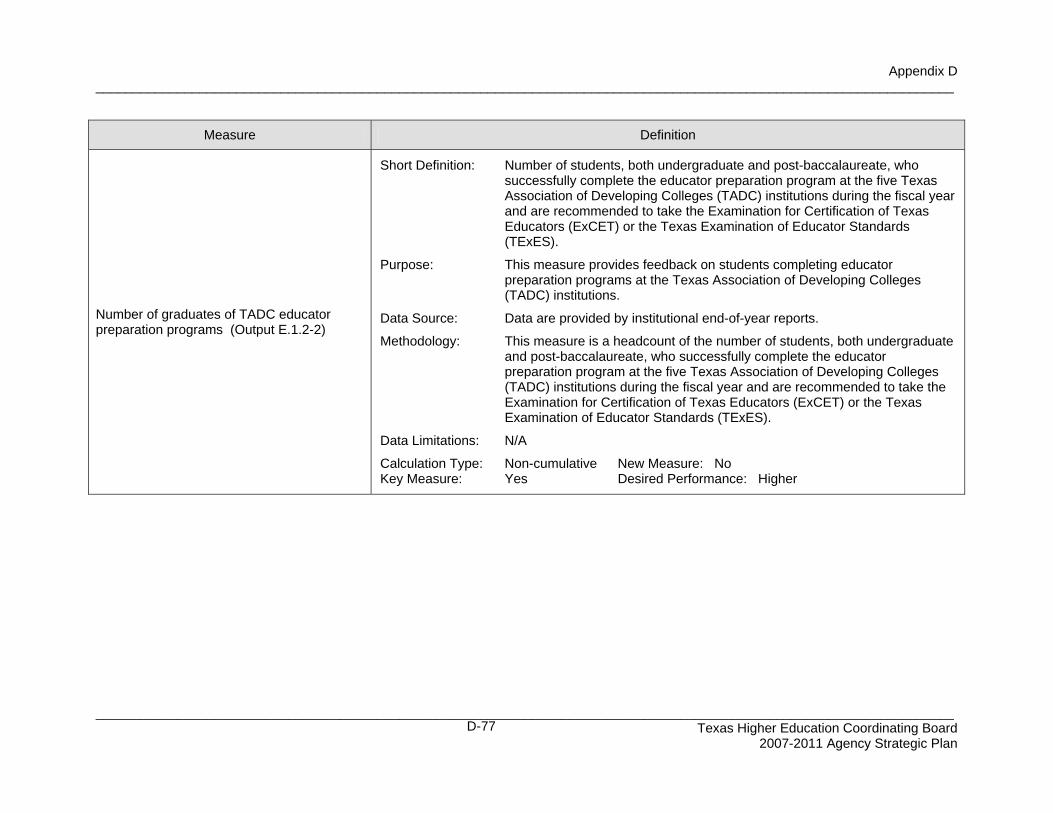
Appendix D
____________________________________________________________________________________________________________________
____________________________________________________________________________________________________________________ Texas Higher Education Coordinating Board
2007-2011 Agency Strategic Plan
D-77
Measure Definition
Number of graduates of TADC educator preparation programs (Output E.1.2-2)
Short Definition: Number of students, both undergraduate and post-baccalaureate, who
successfully complete the educator preparation program at the five Texas Association of Developing Colleges (TADC) institutions during the fiscal year and are recommended to take the Examination for Certification of Texas Educators (ExCET) or the Texas Examination of Educator Standards (TExES).
Purpose: This measure provides feedback on students completing educator
preparation programs at the Texas Association of Developing Colleges (TADC) institutions.
Data Source: Data are provided by institutional end-of-year reports. Methodology: This measure is a headcount of the number of students, both undergraduate
and post-baccalaureate, who successfully complete the educator preparation program at the five Texas Association of Developing Colleges (TADC) institutions during the fiscal year and are recommended to take the Examination for Certification of Texas Educators (ExCET) or the Texas Examination of Educator Standards (TExES).
Data Limitations: N/A Calculation Type: Non-cumulative New Measure: No Key Measure: Yes Desired Performance: Higher
Appendix E ________________________________________________________________________
______________________________________________________________________ Texas Higher Education Coordinating Board
2007-2011 Agency Strategic Plan E-1
Appendix E: Workforce Plan

Appendix E ________________________________________________________________________
______________________________________________________________________ Texas Higher Education Coordinating Board
2007-2011 Agency Strategic Plan E-2
Appendix E ________________________________________________________________________
______________________________________________________________________ Texas Higher Education Coordinating Board
2007-2011 Agency Strategic Plan E-3
Appendix E
Workforce Plan1 Fiscal Years 2006-2007
I. Agency Overview The Texas Higher Education Coordinating Board was created by the Texas Legislature in 1965 to "provide leadership and coordination for the Texas higher education system to achieve excellence for the college education of Texas students." To meet these broad obligations to the people of the state of Texas, the Board reviews and recommends changes in formulas for allocation of state funds to public institutions; authorizes quality academic programs; works to avoid unnecessary duplication in academic programs, unwarranted construction projects and real estate acquisitions; and develops plans to guarantee future quality in Texas public higher education. Working with the higher education institutions, the Governor, and the Legislature, the Board also promotes access for all Texans to high quality programs at different instructional levels and administers the state's student financial aid programs. The responsibilities of the Board have grown significantly over the last decade, with major new responsibilities added from each session of the Legislature.
In October 2000, the Coordinating Board adopted a higher education plan, Closing the Gaps by 2015. which has become the focus for the agency’s efforts to serve the people of Texas The plan’s four goals are to:
• Close the gaps in participation – By 2015, close the gaps in participation rates across Texas to add 630,000 more students.
• Close the gaps in success – By 2015, award 210,000 undergraduate degrees, certificates and other identifiable student successes from high quality programs.
• Close the gaps in excellence – By 2015, substantially increase the number of nationally recognized programs or services at colleges and universities in Texas.
• Close the gaps in research – By 2015, increase the level of federal science and engineering research and development obligations to Texas institutions to 6.5 percent of obligations to higher education institutions across the nation.
Closing the Gaps and other responsibilities are carried out by 272 full-time equivalent employees as of January 31, 2006. The agency is authorized to fill 299.9 full-time equivalent positions (not including 30 federally funded positions) for the 2006-2007 biennium. The agency is organized around the Closing the 1 This appendix item adheres to format and content recommended by the State Auditor’s Office.
Appendix E ________________________________________________________________________
______________________________________________________________________ Texas Higher Education Coordinating Board
2007-2011 Agency Strategic Plan E-4
Gaps goals into two major units: Academic Excellence and Research, and Participation and Success. The Academic Excellence and Research Unit is composed of an Academic Affairs and Research Division (with Undergraduate, Graduate and Research sections) and a Planning and Accountability Division (with Planning, Finance and Resource Planning, Web and Educational Data sections). The Participation and Success Unit has a Student Services Division and an Outreach and Success Division. Additional offices are: Administrative Services; the Deputy Commissioner’s Office; General Counsel; Office of Strategic Alliances; and the Commissioner’s Office. Appendix B contains the agency’s organizational chart, and Appendix J provides an overview of the state’s higher education plan, Closing the Gaps by 2015. The Legislature, recognizing that a substantial number of new responsibilities have been assigned to the Coordinating Board by the Legislature over recent years, increased the number of authorized full-time equivalent (FTE) positions at the Coordinating Board in 1999, 2001, 2003, and 2005. The Coordinating Board continues to develop and implement efforts to respond as effectively and efficiently as possible within any necessary budgetary restraints. The Board cooperated fully with the January 2002 request of the Governor’s Office and the Legislative Budget Board that every state agency attempt to reduce spending and identify savings as state government faces an uncertain budget for the upcoming biennium. Instructions related to the content and format of this Workforce Plan were provided on March 11, 2002. Approximately 20 lead staff within the agency met on March 21 to review the information necessary from each division to complete the workforce plan. By April 1, all nine divisions provided a review of current and anticipated workforce needs, including potential vacancies due to retirement and proposed new positions. Input from staff within divisions gave a wide range of employees the opportunity to contribute to the goals presented in this document. Frequent dialogue and exchanges took place with human resources staff and the divisions involved in implementing the proposed goals, particularly among staff in the Administrative Services and Planning units. Agency Mission and Philosophy Mission The Texas Higher Education Coordinating Board’s mission is to work with the Legislature, Governor, governing boards, higher education institutions, and other entities to help Texas meet the goals of the state’s higher education plan, Closing the Gaps by 2015, and thereby to provide the people of Texas the widest access to higher education of the highest quality in the most efficient manner.
Appendix E ________________________________________________________________________
______________________________________________________________________ Texas Higher Education Coordinating Board
2007-2011 Agency Strategic Plan E-5
Philosophy The Texas Higher Education Coordinating Board will promote access to quality higher education across the state with the conviction that access without quality is mediocrity and that quality without access is unacceptable. The Board will be open, ethical, responsive, and committed to public service. The Board will approach its work with a sense of purpose and responsibility to the people of Texas and is committed to the best use of public monies. The Coordinating Board will engage in actions that add value to Texas and to higher education. The agency will avoid efforts that do not add value or that are duplicated by other entities. Statewide Priority Goal for Higher Education The priority goal for higher education is to provide an affordable, accessible, and high quality system of higher education that prepares individuals for a changing economy and workforce that furthers the development and application of knowledge through instruction, research, and public service. State-level Benchmarks for Higher Education State-level priorities have been defined in Planning for Progress: The Statewide Strategic Planning Elements for Texas State Government. Operational definitions of measures associated with the state-level priorities are provided in Appendix D. Sources of data that are used (or derived) to serve as output measures are described with agency goals and objectives in a separate section of this document. Projected outcomes for 2007-2011 are provided in Appendix C. The state-level benchmarks for higher education include:
• Percent of recent high school graduates enrolled in a Texas public college or university
• Percent of first-time, full-time freshmen returning after one academic year • Percent of first-time, full-time freshmen who graduate within four years • Percent of first-time, full-time freshmen who graduate within six years • Percent of two-year college students who transfer to four-year institutions • Percent of two-year transfer students who graduate from four-year
institutions • Percent decrease in number of students requiring developmental
education • Percent of population age 24 and older with vocational/technical
certificates as highest level of educational attainment
Appendix E ________________________________________________________________________
______________________________________________________________________ Texas Higher Education Coordinating Board
2007-2011 Agency Strategic Plan E-6
• Percent of population age 24 and older with two-year college degree as highest level of educational attainment
• Percent of population age 24 and older with four-year college degree as highest level of educational attainment
• Number of baccalaureate graduates in science, technology, engineering, and mathematics
• Percent of M.D. graduates remaining in Texas for residency • Percent of nursing graduates employed or enrolled in nursing graduate
programs in Texas • Texas public colleges’ and universities’ cost per student as a percentage
of the national average • Percent change in average tuition over past biennium • Number of students receiving grants from the TEXAS grants programs • Percent of total federal research and development expenditures received
by Texas institutions of higher education • Percent increase in research and development expenditures in emerging
technologies over previous biennium • Number of patents obtained in emerging technologies • Number of patents obtained by institutions of higher education that are
commercialized. These benchmark elements evolved over time to reflect public policy emphases. Accordingly, these priorities may require information for which no previous sources have existed for collection of supporting data. In such cases, the best available proxies must be found until directly applicable data can be generated. The following table aligns the state-level benchmarks identified above with agency strategies and the goals of Closing the Gaps by 2015, the state’s higher education plan (Appendix J).
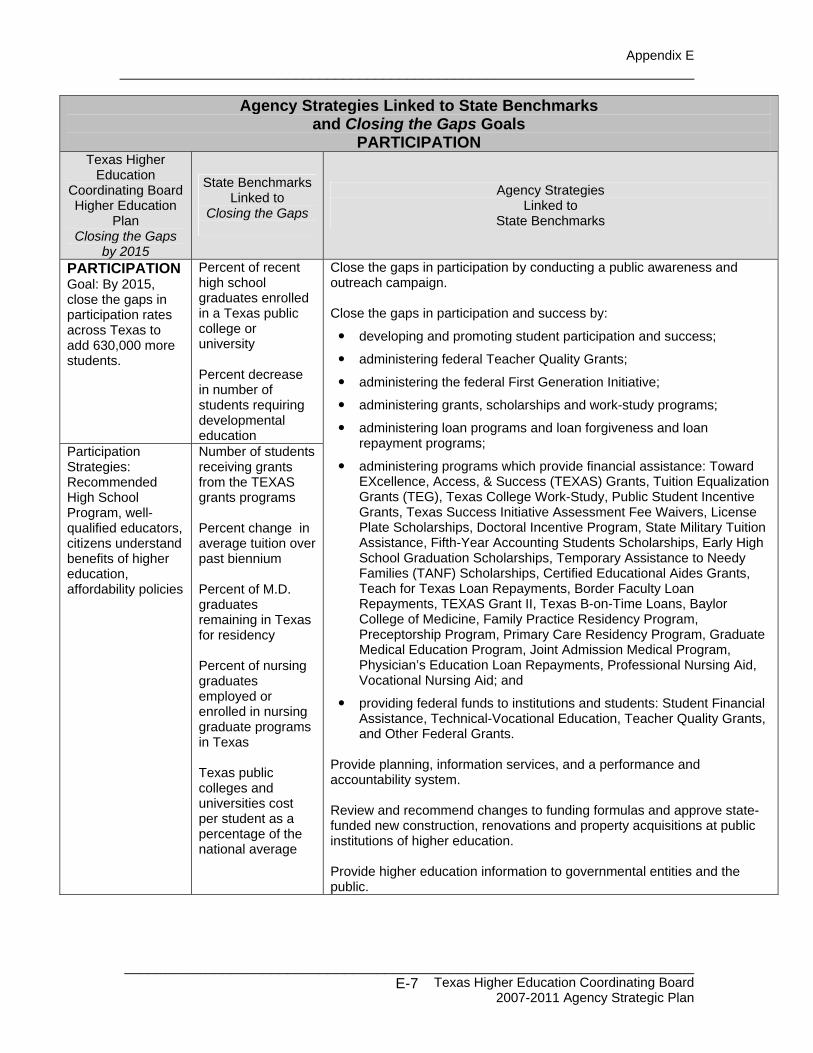
Appendix E ________________________________________________________________________
______________________________________________________________________ Texas Higher Education Coordinating Board
2007-2011 Agency Strategic Plan E-7
Agency Strategies Linked to State Benchmarks and Closing the Gaps Goals
PARTICIPATION Texas Higher
Education Coordinating Board Higher Education
Plan Closing the Gaps
by 2015
State Benchmarks Linked to
Closing the Gaps
Agency Strategies Linked to
State Benchmarks
PARTICIPATION Goal: By 2015, close the gaps in participation rates across Texas to add 630,000 more students.
Percent of recent high school graduates enrolled in a Texas public college or university Percent decrease in number of students requiring developmental education
Participation Strategies: Recommended High School Program, well-qualified educators, citizens understand benefits of higher education, affordability policies
Number of students receiving grants from the TEXAS grants programs Percent change in average tuition over past biennium Percent of M.D. graduates remaining in Texas for residency Percent of nursing graduates employed or enrolled in nursing graduate programs in Texas Texas public colleges and universities cost per student as a percentage of the national average
Close the gaps in participation by conducting a public awareness and outreach campaign. Close the gaps in participation and success by: developing and promoting student participation and success; administering federal Teacher Quality Grants; administering the federal First Generation Initiative; administering grants, scholarships and work-study programs; administering loan programs and loan forgiveness and loan
repayment programs; administering programs which provide financial assistance: Toward
EXcellence, Access, & Success (TEXAS) Grants, Tuition Equalization Grants (TEG), Texas College Work-Study, Public Student Incentive Grants, Texas Success Initiative Assessment Fee Waivers, License Plate Scholarships, Doctoral Incentive Program, State Military Tuition Assistance, Fifth-Year Accounting Students Scholarships, Early High School Graduation Scholarships, Temporary Assistance to Needy Families (TANF) Scholarships, Certified Educational Aides Grants, Teach for Texas Loan Repayments, Border Faculty Loan Repayments, TEXAS Grant II, Texas B-on-Time Loans, Baylor College of Medicine, Family Practice Residency Program, Preceptorship Program, Primary Care Residency Program, Graduate Medical Education Program, Joint Admission Medical Program, Physician’s Education Loan Repayments, Professional Nursing Aid, Vocational Nursing Aid; and
providing federal funds to institutions and students: Student Financial
Assistance, Technical-Vocational Education, Teacher Quality Grants, and Other Federal Grants.
Provide planning, information services, and a performance and accountability system. Review and recommend changes to funding formulas and approve state-funded new construction, renovations and property acquisitions at public institutions of higher education. Provide higher education information to governmental entities and the public.
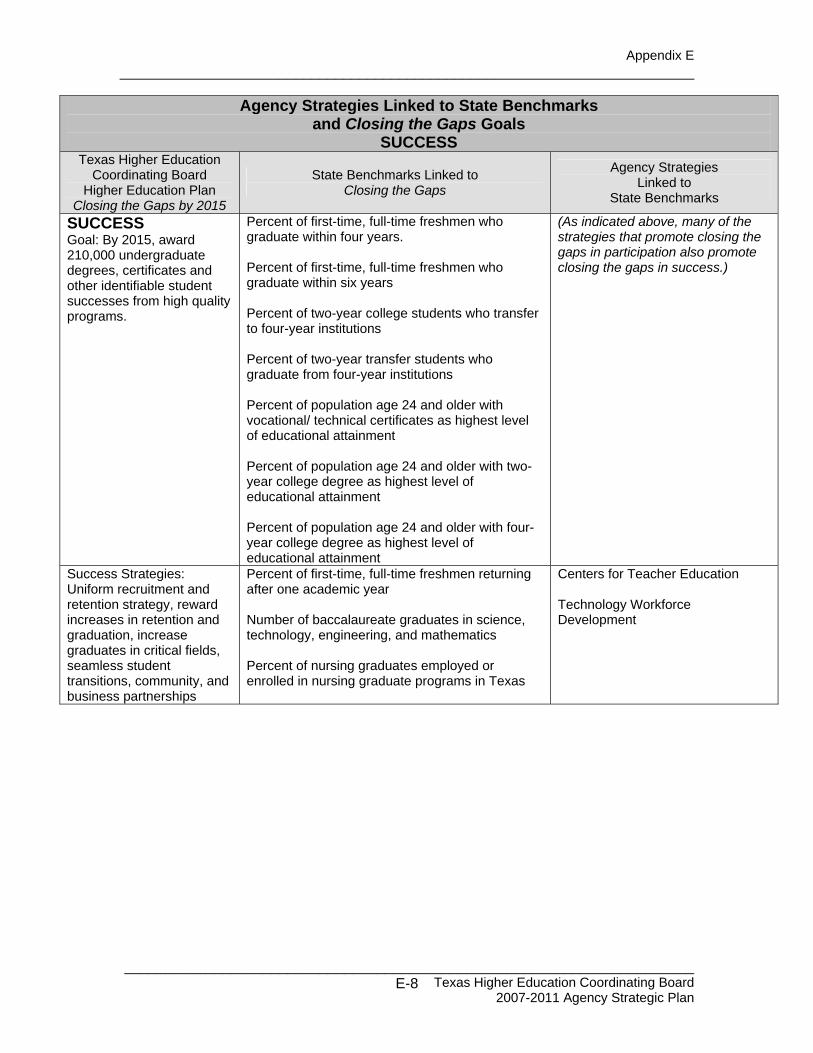
Appendix E ________________________________________________________________________
______________________________________________________________________ Texas Higher Education Coordinating Board
2007-2011 Agency Strategic Plan E-8
Agency Strategies Linked to State Benchmarks and Closing the Gaps Goals
SUCCESS Texas Higher Education
Coordinating Board Higher Education Plan
Closing the Gaps by 2015
State Benchmarks Linked to Closing the Gaps
Agency Strategies Linked to
State Benchmarks
SUCCESS Goal: By 2015, award 210,000 undergraduate degrees, certificates and other identifiable student successes from high quality programs.
Percent of first-time, full-time freshmen who graduate within four years. Percent of first-time, full-time freshmen who graduate within six years Percent of two-year college students who transfer to four-year institutions Percent of two-year transfer students who graduate from four-year institutions Percent of population age 24 and older with vocational/ technical certificates as highest level of educational attainment Percent of population age 24 and older with two-year college degree as highest level of educational attainment Percent of population age 24 and older with four-year college degree as highest level of educational attainment
(As indicated above, many of the strategies that promote closing the gaps in participation also promote closing the gaps in success.)
Success Strategies: Uniform recruitment and retention strategy, reward increases in retention and graduation, increase graduates in critical fields, seamless student transitions, community, and business partnerships
Percent of first-time, full-time freshmen returning after one academic year Number of baccalaureate graduates in science, technology, engineering, and mathematics Percent of nursing graduates employed or enrolled in nursing graduate programs in Texas
Centers for Teacher Education Technology Workforce Development
Appendix E ________________________________________________________________________
______________________________________________________________________ Texas Higher Education Coordinating Board
2007-2011 Agency Strategic Plan E-9
Anticipated Changes in Strategies The Coordinating Board anticipates several changes that will significantly impact the agency’s business and workforce, as outlined below:
• Increased requests from customers requiring new applications of technology, ranging from “real-time” review of loan status to videoconferencing to website maintenance skills for each division; and
• New programs authorized by the Legislature, such as new student
financial aid programs and increased agency responsibilities involving the higher education community.
Although many workforce issues present challenges, the Coordinating Board leadership is committed to addressing areas of critical concern. These areas include:
• A high rate of anticipated retirement in senior management/professional positions;
• Real or perceived salary differences with other state agencies and public
educational institutions/non-state agencies; and • Improved computer/technology-related skills among employees
throughout the agency. II. Current Workforce Profile (Supply Analysis) Critical Workforce Skills The scope of duties and range of responsibilities required of Coordinating Board employees varies throughout each division. The divisions consist of many well-qualified and dedicated employees, some with very highly specialized skills fairly unique to the agency. These skills include:
• Knowledge of higher education programs in general; • Specific knowledge related to higher education, such as formula funding,
curriculum review, issuance of student loan bonds, and collection of student loans; and
• Knowledge gained through cross-training exercises within divisions to
ensure more than one person is capable of carrying out the major responsibilities of other positions within the division.
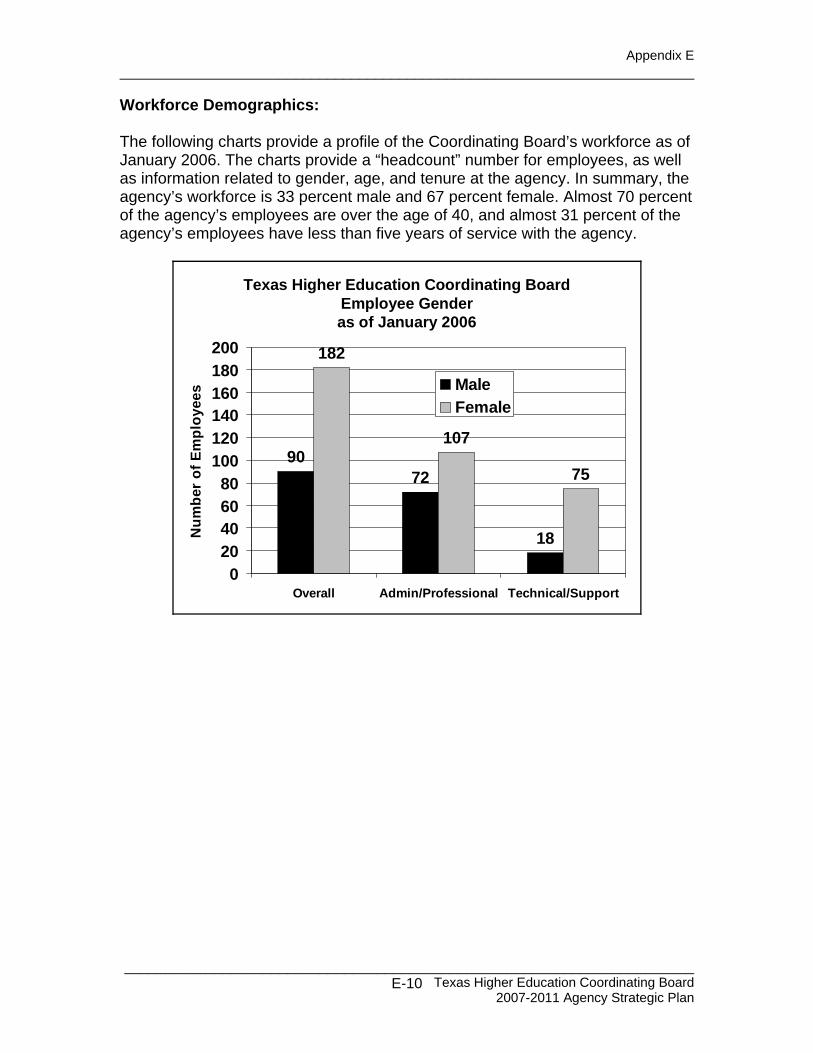
Appendix E ________________________________________________________________________
______________________________________________________________________ Texas Higher Education Coordinating Board
2007-2011 Agency Strategic Plan E-10
Workforce Demographics: The following charts provide a profile of the Coordinating Board’s workforce as of January 2006. The charts provide a “headcount” number for employees, as well as information related to gender, age, and tenure at the agency. In summary, the agency’s workforce is 33 percent male and 67 percent female. Almost 70 percent of the agency’s employees are over the age of 40, and almost 31 percent of the agency’s employees have less than five years of service with the agency.
Texas Higher Education Coordinating BoardEmployee Genderas of January 2006
9072
18
182
107
75
020406080
100120140160180200
Overall Admin/Professional Technical/Support
Num
ber
of E
mpl
oyee
s MaleFemale
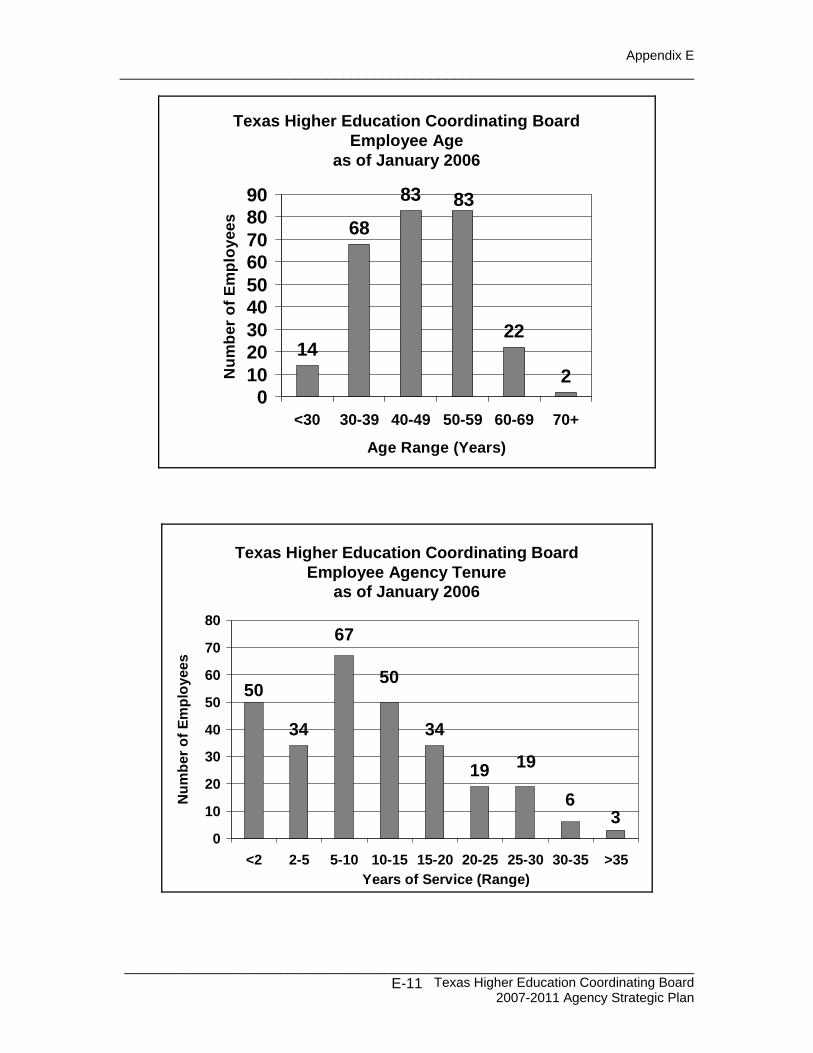
Appendix E ________________________________________________________________________
______________________________________________________________________ Texas Higher Education Coordinating Board
2007-2011 Agency Strategic Plan E-11
Texas Higher Education Coordinating BoardEmployee Age
as of January 2006
14
68
83
22
2
83
0102030405060708090
<30 30-39 40-49 50-59 60-69 70+
Age Range (Years)
Num
ber
of E
mpl
oyee
s
Texas Higher Education Coordinating BoardEmployee Agency Tenure
as of January 2006
34 34
19
36
19
50
67
50
0
10
20
30
40
50
60
70
80
<2 2-5 5-10 10-15 15-20 20-25 25-30 30-35 >35Years of Service (Range)
Num
ber o
f Em
ploy
ees
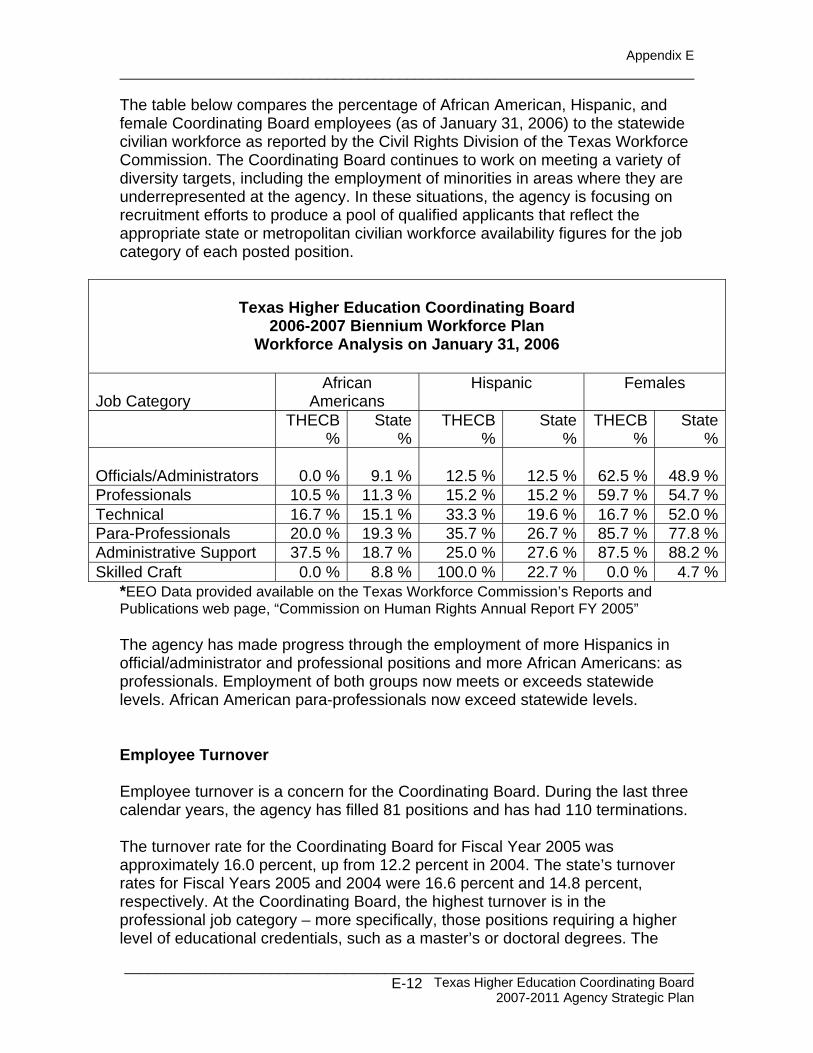
Appendix E ________________________________________________________________________
______________________________________________________________________ Texas Higher Education Coordinating Board
2007-2011 Agency Strategic Plan E-12
The table below compares the percentage of African American, Hispanic, and female Coordinating Board employees (as of January 31, 2006) to the statewide civilian workforce as reported by the Civil Rights Division of the Texas Workforce Commission. The Coordinating Board continues to work on meeting a variety of diversity targets, including the employment of minorities in areas where they are underrepresented at the agency. In these situations, the agency is focusing on recruitment efforts to produce a pool of qualified applicants that reflect the appropriate state or metropolitan civilian workforce availability figures for the job category of each posted position.
Texas Higher Education Coordinating Board
2006-2007 Biennium Workforce Plan Workforce Analysis on January 31, 2006
Job Category
African Americans
Hispanic Females
THECB %
State %
THECB %
State %
THECB %
State %
Officials/Administrators 0.0 % 9.1 % 12.5 %
12.5 %
62.5 % 48.9 %
Professionals 10.5 % 11.3 % 15.2 % 15.2 % 59.7 % 54.7 %Technical 16.7 % 15.1 % 33.3 % 19.6 % 16.7 % 52.0 %Para-Professionals 20.0 % 19.3 % 35.7 % 26.7 % 85.7 % 77.8 %Administrative Support 37.5 % 18.7 % 25.0 % 27.6 % 87.5 % 88.2 %Skilled Craft 0.0 % 8.8 % 100.0 % 22.7 % 0.0 % 4.7 %
*EEO Data provided available on the Texas Workforce Commission’s Reports and Publications web page, “Commission on Human Rights Annual Report FY 2005” The agency has made progress through the employment of more Hispanics in official/administrator and professional positions and more African Americans: as professionals. Employment of both groups now meets or exceeds statewide levels. African American para-professionals now exceed statewide levels. Employee Turnover Employee turnover is a concern for the Coordinating Board. During the last three calendar years, the agency has filled 81 positions and has had 110 terminations. The turnover rate for the Coordinating Board for Fiscal Year 2005 was approximately 16.0 percent, up from 12.2 percent in 2004. The state’s turnover rates for Fiscal Years 2005 and 2004 were 16.6 percent and 14.8 percent, respectively. At the Coordinating Board, the highest turnover is in the professional job category – more specifically, those positions requiring a higher level of educational credentials, such as a master’s or doctoral degrees. The
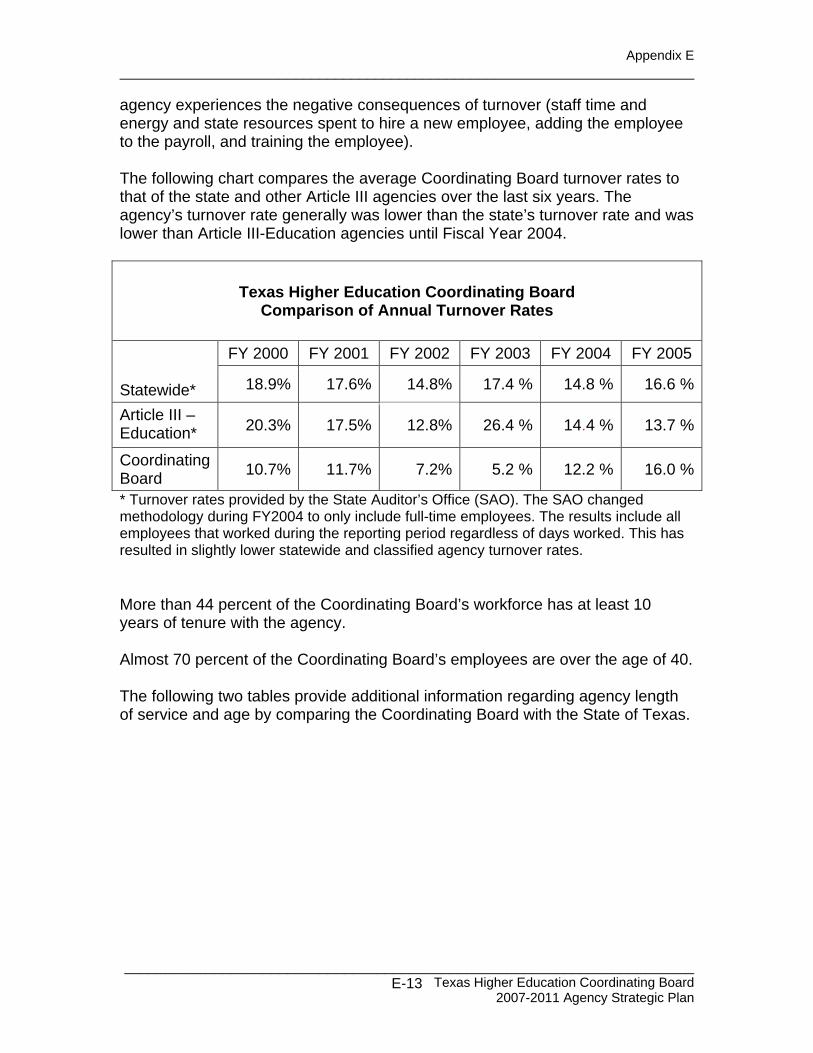
Appendix E ________________________________________________________________________
______________________________________________________________________ Texas Higher Education Coordinating Board
2007-2011 Agency Strategic Plan E-13
agency experiences the negative consequences of turnover (staff time and energy and state resources spent to hire a new employee, adding the employee to the payroll, and training the employee). The following chart compares the average Coordinating Board turnover rates to that of the state and other Article III agencies over the last six years. The agency’s turnover rate generally was lower than the state’s turnover rate and was lower than Article III-Education agencies until Fiscal Year 2004.
Texas Higher Education Coordinating Board
Comparison of Annual Turnover Rates
FY 2000 FY 2001 FY 2002 FY 2003 FY 2004 FY 2005 Statewide* 18.9% 17.6% 14.8% 17.4 % 14.8 % 16.6 %
Article III – Education* 20.3% 17.5% 12.8% 26.4 % 14.4 % 13.7 %
Coordinating Board 10.7% 11.7% 7.2% 5.2 % 12.2 % 16.0 %
* Turnover rates provided by the State Auditor’s Office (SAO). The SAO changed methodology during FY2004 to only include full-time employees. The results include all employees that worked during the reporting period regardless of days worked. This has resulted in slightly lower statewide and classified agency turnover rates. More than 44 percent of the Coordinating Board’s workforce has at least 10 years of tenure with the agency. Almost 70 percent of the Coordinating Board’s employees are over the age of 40. The following two tables provide additional information regarding agency length of service and age by comparing the Coordinating Board with the State of Texas.
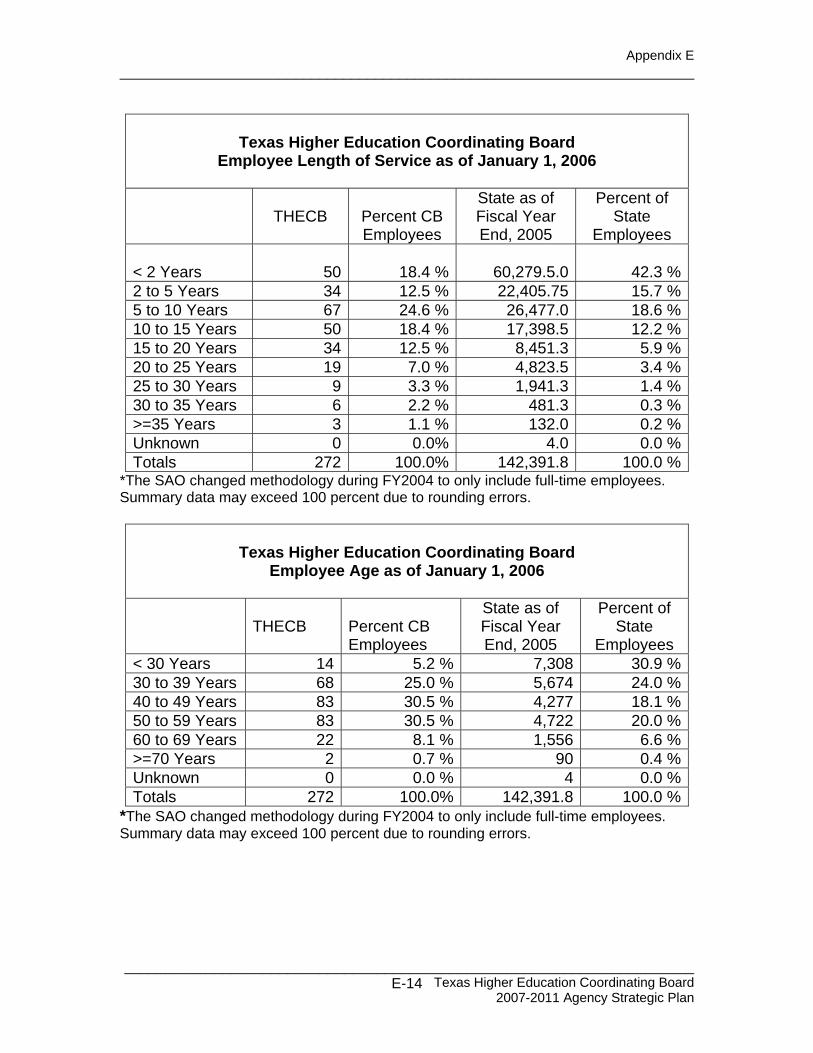
Appendix E ________________________________________________________________________
______________________________________________________________________ Texas Higher Education Coordinating Board
2007-2011 Agency Strategic Plan E-14
Texas Higher Education Coordinating Board Employee Length of Service as of January 1, 2006
THECB
Percent CB Employees
State as of Fiscal Year End, 2005
Percent of State
Employees < 2 Years 50 18.4 % 60,279.5.0 42.3 %2 to 5 Years 34 12.5 % 22,405.75 15.7 %5 to 10 Years 67 24.6 % 26,477.0 18.6 %10 to 15 Years 50 18.4 % 17,398.5 12.2 %15 to 20 Years 34 12.5 % 8,451.3 5.9 %20 to 25 Years 19 7.0 % 4,823.5 3.4 %25 to 30 Years 9 3.3 % 1,941.3 1.4 %30 to 35 Years 6 2.2 % 481.3 0.3 %>=35 Years 3 1.1 % 132.0 0.2 %Unknown 0 0.0% 4.0 0.0 %Totals 272 100.0% 142,391.8 100.0 %
*The SAO changed methodology during FY2004 to only include full-time employees. Summary data may exceed 100 percent due to rounding errors.
Texas Higher Education Coordinating Board
Employee Age as of January 1, 2006
THECB Percent CB Employees
State as of Fiscal Year End, 2005
Percent of State
Employees < 30 Years 14 5.2 % 7,308 30.9 %30 to 39 Years 68 25.0 % 5,674 24.0 %40 to 49 Years 83 30.5 % 4,277 18.1 %50 to 59 Years 83 30.5 % 4,722 20.0 %60 to 69 Years 22 8.1 % 1,556 6.6 %>=70 Years 2 0.7 % 90 0.4 %Unknown 0 0.0 % 4 0.0 %Totals 272 100.0% 142,391.8 100.0 %
*The SAO changed methodology during FY2004 to only include full-time employees. Summary data may exceed 100 percent due to rounding errors.
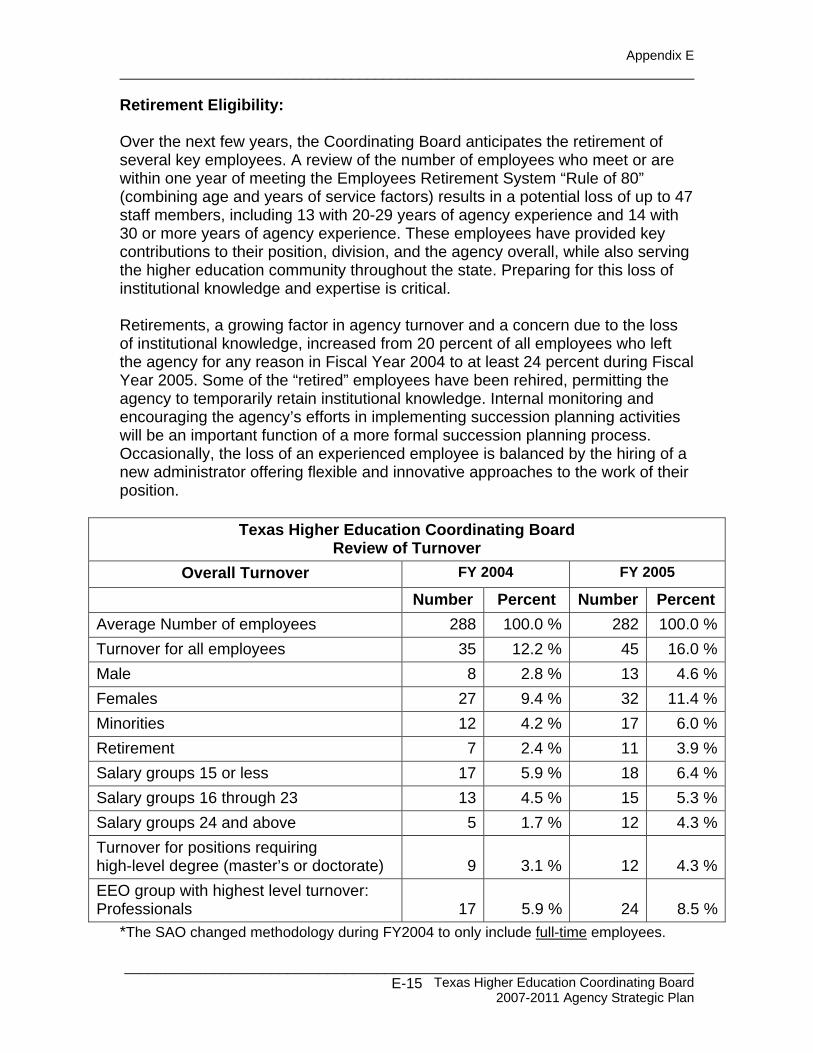
Appendix E ________________________________________________________________________
______________________________________________________________________ Texas Higher Education Coordinating Board
2007-2011 Agency Strategic Plan E-15
Retirement Eligibility: Over the next few years, the Coordinating Board anticipates the retirement of several key employees. A review of the number of employees who meet or are within one year of meeting the Employees Retirement System “Rule of 80” (combining age and years of service factors) results in a potential loss of up to 47 staff members, including 13 with 20-29 years of agency experience and 14 with 30 or more years of agency experience. These employees have provided key contributions to their position, division, and the agency overall, while also serving the higher education community throughout the state. Preparing for this loss of institutional knowledge and expertise is critical. Retirements, a growing factor in agency turnover and a concern due to the loss of institutional knowledge, increased from 20 percent of all employees who left the agency for any reason in Fiscal Year 2004 to at least 24 percent during Fiscal Year 2005. Some of the “retired” employees have been rehired, permitting the agency to temporarily retain institutional knowledge. Internal monitoring and encouraging the agency’s efforts in implementing succession planning activities will be an important function of a more formal succession planning process. Occasionally, the loss of an experienced employee is balanced by the hiring of a new administrator offering flexible and innovative approaches to the work of their position.
Texas Higher Education Coordinating Board Review of Turnover
Overall Turnover FY 2004 FY 2005
Number Percent Number Percent Average Number of employees 288 100.0 % 282 100.0 %Turnover for all employees 35 12.2 % 45 16.0 %Male 8 2.8 % 13 4.6 %Females 27 9.4 % 32 11.4 %Minorities 12 4.2 % 17 6.0 %Retirement 7 2.4 % 11 3.9 %Salary groups 15 or less 17 5.9 % 18 6.4 %Salary groups 16 through 23 13 4.5 % 15 5.3 %Salary groups 24 and above 5 1.7 % 12 4.3 %Turnover for positions requiring high-level degree (master’s or doctorate) 9 3.1 % 12 4.3 %EEO group with highest level turnover: Professionals 17 5.9 % 24 8.5 %
*The SAO changed methodology during FY2004 to only include full-time employees.
Appendix E ________________________________________________________________________
______________________________________________________________________ Texas Higher Education Coordinating Board
2007-2011 Agency Strategic Plan E-16
Efforts to implement the higher education plan (Closing the Gaps by 2015) have increased the number of requests for customer service (including data analysis, institutional and program review, and responses related to student financial aid). These requests place additional burdens on Coordinating Board employees and illustrate a need to seriously examine employee duties and assignments, as well as the existing organizational structure and the need for new employees. III. Future Workforce Profile (Demand Analysis) Critical Functions Section II identified a few of the critical functions required of agency employees. These include a general knowledge of higher education and specific skills related to the respective position, ranging from computer skills of support staff to knowledge of student financial aid, funding formulas, or computer support for the agency. Expected Workforce Changes Through 2007 Knowledge of higher education is a critical function, although the agency is concerned about the ability to successfully attract qualified applicants with higher education knowledge and experience. Successful work relationships with key stakeholders in education (including high-level administrators from institutions and systems throughout the state, representatives of other state agencies and the legislative offices, and business/community leaders all active in seeking solutions to education-related issues) have depended on staff members who are knowledgeable in higher education issues and who are able to map solutions to complex problems. The agency’s need for employees to develop policy documents, prepare non-standard reports, and analyze data in response to internally and externally generated inquiries is growing. Also, as the agency has a growing need for employees with higher technology skills. Technology-related requirements will affect the agency in two ways — first, the staffing and skills required of employees, and second, the technical support provided through the information management team. Training to increase the database software skills of current employees, and hiring new employees with those skills, will allow a wider range of staff to produce their own reports instead of relying on staff support from the Office of Academic Excellence and Research.
Appendix E ________________________________________________________________________
______________________________________________________________________ Texas Higher Education Coordinating Board
2007-2011 Agency Strategic Plan E-17
Future Workforce Skills Needed To effectively and efficiently satisfy the high standards established in the Coordinating Board’s mission and philosophy, as well as coordinate achievement of the goals set forth in Closing the Gaps, the agency will continue to rely on a knowledgeable, dedicated, and enthusiastic staff. In addition to the critical competencies mentioned previously, the agency is preparing for the expected workforce changes (also mentioned previously) requiring solution-oriented, analytical, and technologically capable employees. The agency is committed to providing current employees with opportunities to increase their computer skills. Training coordinators have been, and will continue to be, responsive to requests for additional course topics and modifications in course timing to permit as many employees to participate as are interested. IV. Gap Analysis Anticipated Surplus or Shortage of Workers or Skills Efforts related to the formulation of this document have provided a focused opportunity for the agency to examine its current and desired workforce needs. Through this process, the Coordinating Board has identified five main areas, or gaps, between the agency’s workforce supply and demand areas that must be addressed. First, the Coordinating Board will emphasize cross-training within divisions. This will permit continuous service to agency customers by ensuring that more than one person in each division is capable of carrying out the major responsibilities within the division. This training is important in a variety of situations, including the sharing of knowledge before an employee retires or when employees are out sick or on vacation, and allows for preliminary training and exposure to skills necessary for advancement. Second, the Coordinating Board will work to improve internal/external communication among current and new hires through increased and enhanced computer skills as appropriate for the respective positions. Third, the Coordinating Board will encourage the development of critical thinking and solution-oriented skills among current employees and focus on such skills in the hiring of new employees. Fourth, internal systems managed by the Administrative Services Division will be reviewed to improve the utilization of existing staff and resources within the division. The resulting modifications will improve intra- and inter-division operations and the overall functioning of the agency.
Appendix E ________________________________________________________________________
______________________________________________________________________ Texas Higher Education Coordinating Board
2007-2011 Agency Strategic Plan E-18
Fifth, the Coordinating Board needs to attract a pool of qualified candidates with higher education experience as the agency fills professional-level positions that become vacant due to retirement and attrition. V. Strategy Development:
Response to Anticipated Worker Surplus/Shortage In response to the potential deficits between the current workforce and anticipated employee demands, the Coordinating Board has identified several goals for the current workforce plan. These goals evolved through expanding the dialogue among chief administrators, requesting they consider agency potential beyond routine activities, and that they also examine the potential impact of the agency’s long-term goals (mainly Closing the Gaps) on their divisions’ workforce.
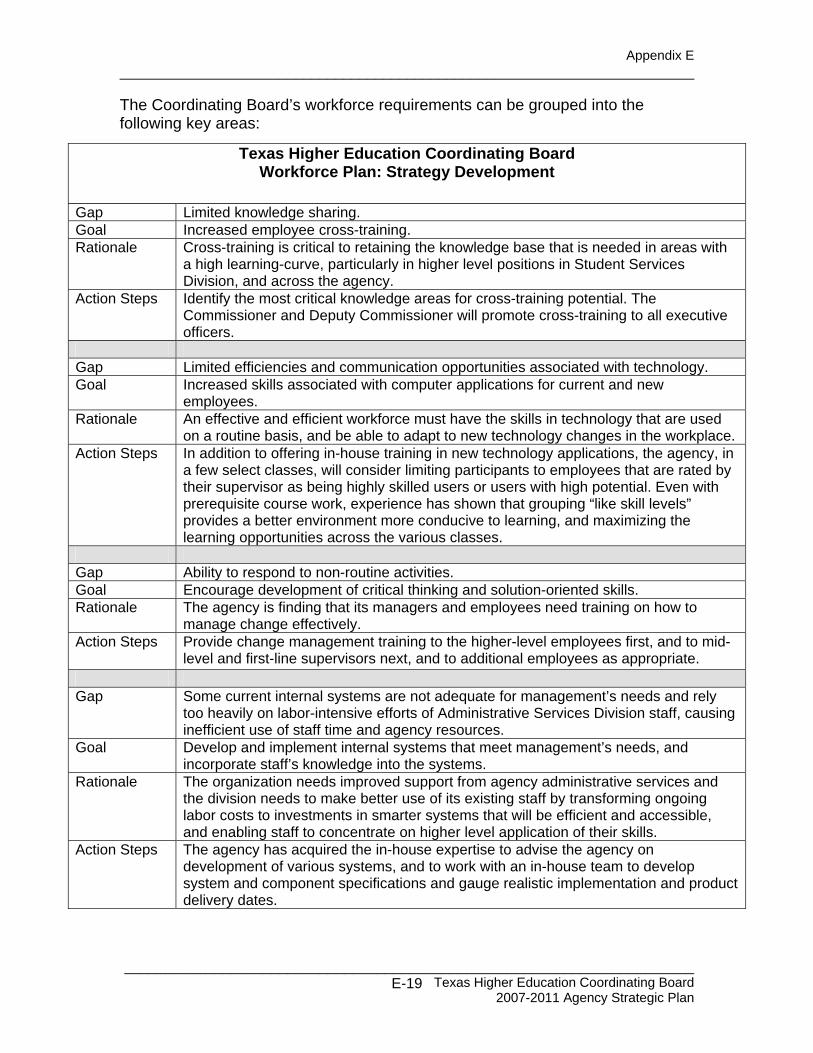
Appendix E ________________________________________________________________________
______________________________________________________________________ Texas Higher Education Coordinating Board
2007-2011 Agency Strategic Plan E-19
The Coordinating Board’s workforce requirements can be grouped into the following key areas:
Texas Higher Education Coordinating Board Workforce Plan: Strategy Development
Gap Limited knowledge sharing. Goal Increased employee cross-training. Rationale Cross-training is critical to retaining the knowledge base that is needed in areas with
a high learning-curve, particularly in higher level positions in Student Services Division, and across the agency.
Action Steps Identify the most critical knowledge areas for cross-training potential. The Commissioner and Deputy Commissioner will promote cross-training to all executive officers.
Gap Limited efficiencies and communication opportunities associated with technology. Goal Increased skills associated with computer applications for current and new
employees. Rationale An effective and efficient workforce must have the skills in technology that are used
on a routine basis, and be able to adapt to new technology changes in the workplace. Action Steps In addition to offering in-house training in new technology applications, the agency, in
a few select classes, will consider limiting participants to employees that are rated by their supervisor as being highly skilled users or users with high potential. Even with prerequisite course work, experience has shown that grouping “like skill levels” provides a better environment more conducive to learning, and maximizing the learning opportunities across the various classes.
Gap Ability to respond to non-routine activities. Goal Encourage development of critical thinking and solution-oriented skills. Rationale
The agency is finding that its managers and employees need training on how to manage change effectively.
Action Steps Provide change management training to the higher-level employees first, and to mid-level and first-line supervisors next, and to additional employees as appropriate.
Gap Some current internal systems are not adequate for management’s needs and rely
too heavily on labor-intensive efforts of Administrative Services Division staff, causing inefficient use of staff time and agency resources.
Goal Develop and implement internal systems that meet management’s needs, and incorporate staff’s knowledge into the systems.
Rationale The organization needs improved support from agency administrative services and the division needs to make better use of its existing staff by transforming ongoing labor costs to investments in smarter systems that will be efficient and accessible, and enabling staff to concentrate on higher level application of their skills.
Action Steps The agency has acquired the in-house expertise to advise the agency on development of various systems, and to work with an in-house team to develop system and component specifications and gauge realistic implementation and product delivery dates.
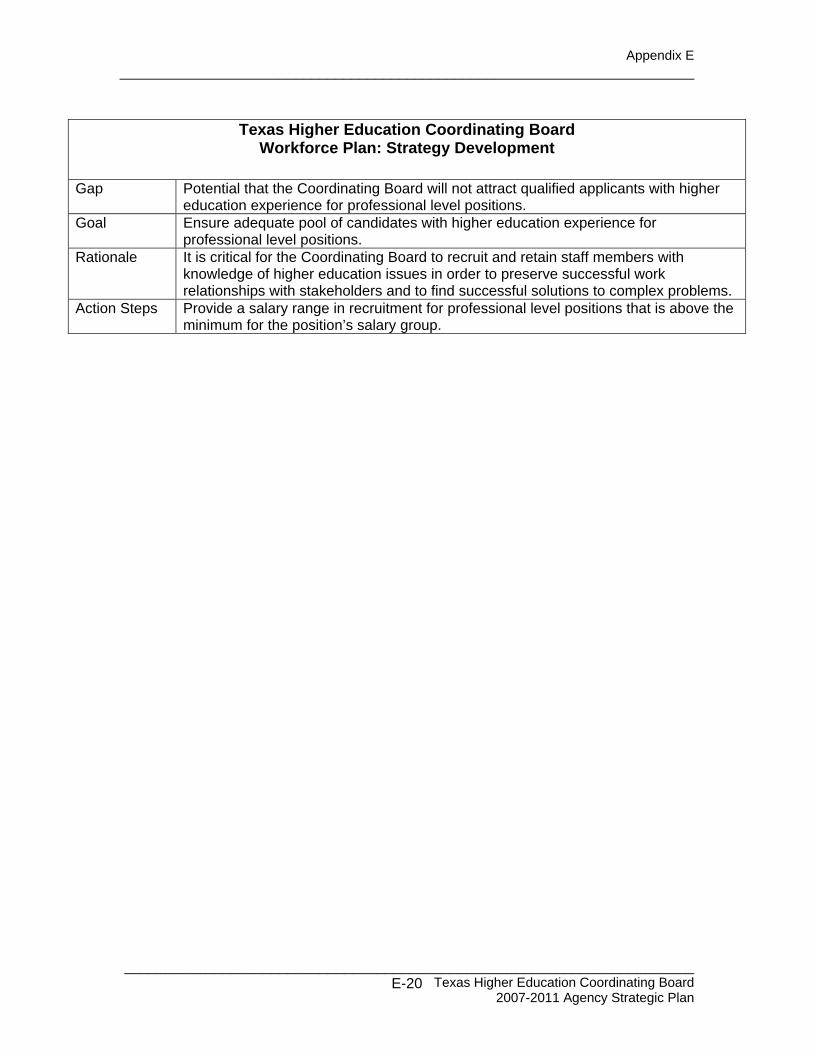
Appendix E ________________________________________________________________________
______________________________________________________________________ Texas Higher Education Coordinating Board
2007-2011 Agency Strategic Plan E-20
Texas Higher Education Coordinating Board Workforce Plan: Strategy Development
Gap Potential that the Coordinating Board will not attract qualified applicants with higher education experience for professional level positions.
Goal Ensure adequate pool of candidates with higher education experience for professional level positions.
Rationale It is critical for the Coordinating Board to recruit and retain staff members with knowledge of higher education issues in order to preserve successful work relationships with stakeholders and to find successful solutions to complex problems.
Action Steps Provide a salary range in recruitment for professional level positions that is above the minimum for the position’s salary group.
Appendix F
________________________________________________________________________
_____________________________________________________________________________ Texas Higher Education Coordinating Board
2007-2011 Agency Strategic Plan
F-1
Appendix F: Survey of Organizational Excellence

Appendix F
________________________________________________________________________
_____________________________________________________________________________ Texas Higher Education Coordinating Board
2007-2011 Agency Strategic Plan
F-2
The Survey of Organizational Excellence
Texas Higher Education Coordinating Board
Data Report
2005
ID: 781 F-3
Table of Contents 781 -Texas Higher Education Coordinating Board
Survey Results:
See our Web Page: www.survey.utexas.edu Current Benchmark Data
Survey Interventions Example and Best Practices
Helpful Publications, and
Additional Survey Information
Survey of Organizational Excellence
Survey Respondent Information..................................................................................1
Survey Constructs.......................................................................................................5
Primary Items..............................................................................................................11
Compensation.............................................................................................................27
Organization Wide......................................................................................................32
Additional Items..........................................................................................................36
*Additional Items are not included if none were submitted.Appendix:
Survey Constructs......................................................................................................A1
Key to the Data File....................................................................................................A6
Survey Insert...............................................................................................................A8
The University of Texas at AustinSchool of Social Work1925 San Jacinto BlvdAustin, Texas 78712
[email protected] (512) 471-9831Fax (512) 471-9600
F-4
Survey Respondent Information 781 -Texas Higher Education Coordinating Board
Survey respondent information is returned on all demographic variables. However, if less than five respondents have selected a demographic variable, "Less Than Five" is reported as the number of survey respondents, and "Not Available" is reported as the percent of survey respondents.
Survey of Organizational Excellence
Page 1 F-5
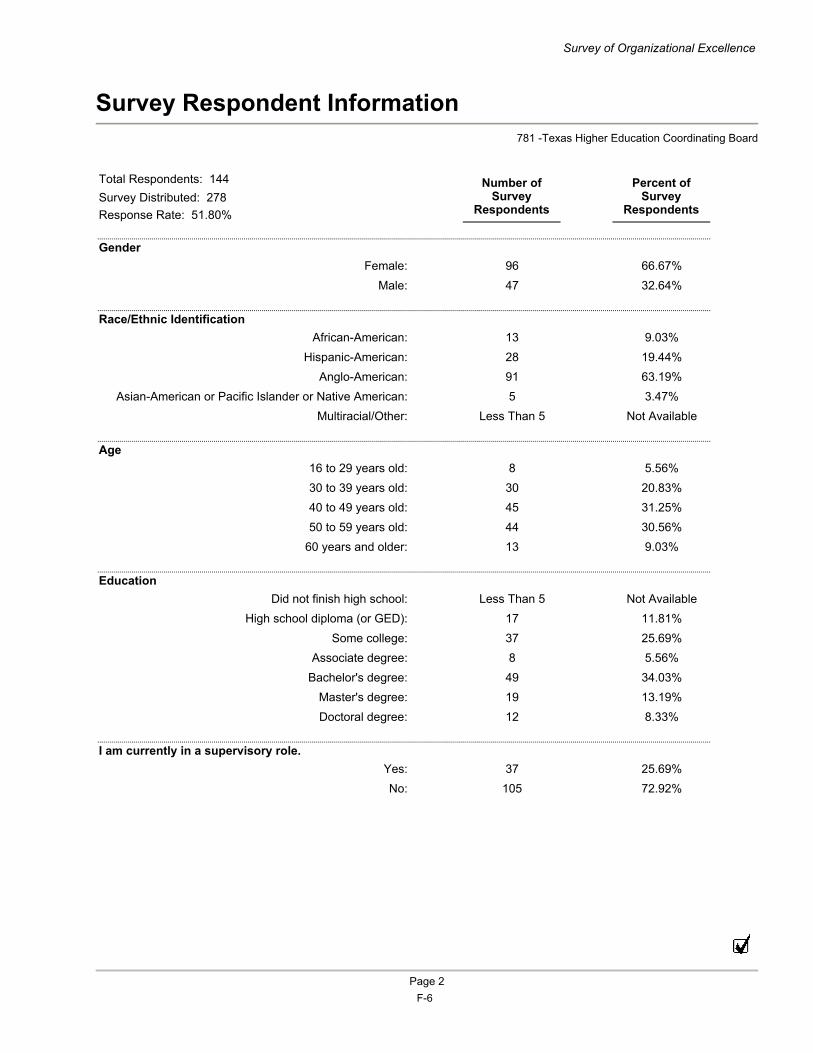
Survey Respondent Information 781 -Texas Higher Education Coordinating Board
Survey of Organizational Excellence
Total Respondents: 144 Number of Survey
Respondents
Percent of Survey
Respondents Survey Distributed: 278Response Rate: 51.80%
GenderFemale: 96 66.67%
Male: 47 32.64%
Race/Ethnic IdentificationAfrican-American: 13 9.03%
Hispanic-American: 28 19.44% Anglo-American: 91 63.19%
Asian-American or Pacific Islander or Native American: 5 3.47% Multiracial/Other: Less Than 5 Not Available
Age16 to 29 years old: 8 5.56% 30 to 39 years old: 30 20.83% 40 to 49 years old: 45 31.25% 50 to 59 years old: 44 30.56%
60 years and older: 13 9.03%
EducationDid not finish high school: Less Than 5 Not Available
High school diploma (or GED): 17 11.81% Some college: 37 25.69%
Associate degree: 8 5.56% Bachelor's degree: 49 34.03%
Master's degree: 19 13.19% Doctoral degree: 12 8.33%
I am currently in a supervisory role.Yes: 37 25.69% No: 105 72.92%
Page 2 F-6
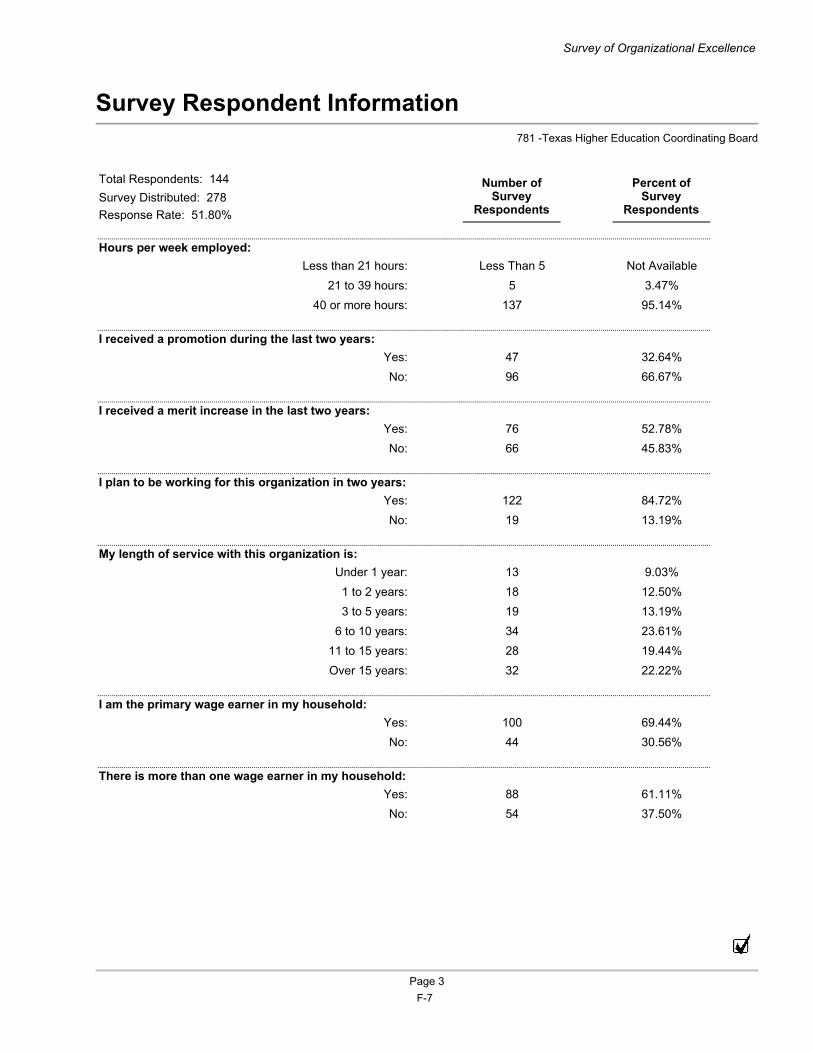
Survey Respondent Information 781 -Texas Higher Education Coordinating Board
Survey of Organizational Excellence
Total Respondents: 144 Number of Survey
Respondents
Percent of Survey
Respondents Survey Distributed: 278Response Rate: 51.80%
Hours per week employed:Less than 21 hours: Less Than 5 Not Available
21 to 39 hours: 5 3.47% 40 or more hours: 137 95.14%
I received a promotion during the last two years:Yes: 47 32.64% No: 96 66.67%
I received a merit increase in the last two years:Yes: 76 52.78% No: 66 45.83%
I plan to be working for this organization in two years:Yes: 122 84.72% No: 19 13.19%
My length of service with this organization is:Under 1 year: 13 9.03%
1 to 2 years: 18 12.50% 3 to 5 years: 19 13.19%
6 to 10 years: 34 23.61% 11 to 15 years: 28 19.44% Over 15 years: 32 22.22%
I am the primary wage earner in my household:Yes: 100 69.44% No: 44 30.56%
There is more than one wage earner in my household:Yes: 88 61.11% No: 54 37.50%
Page 3 F-7
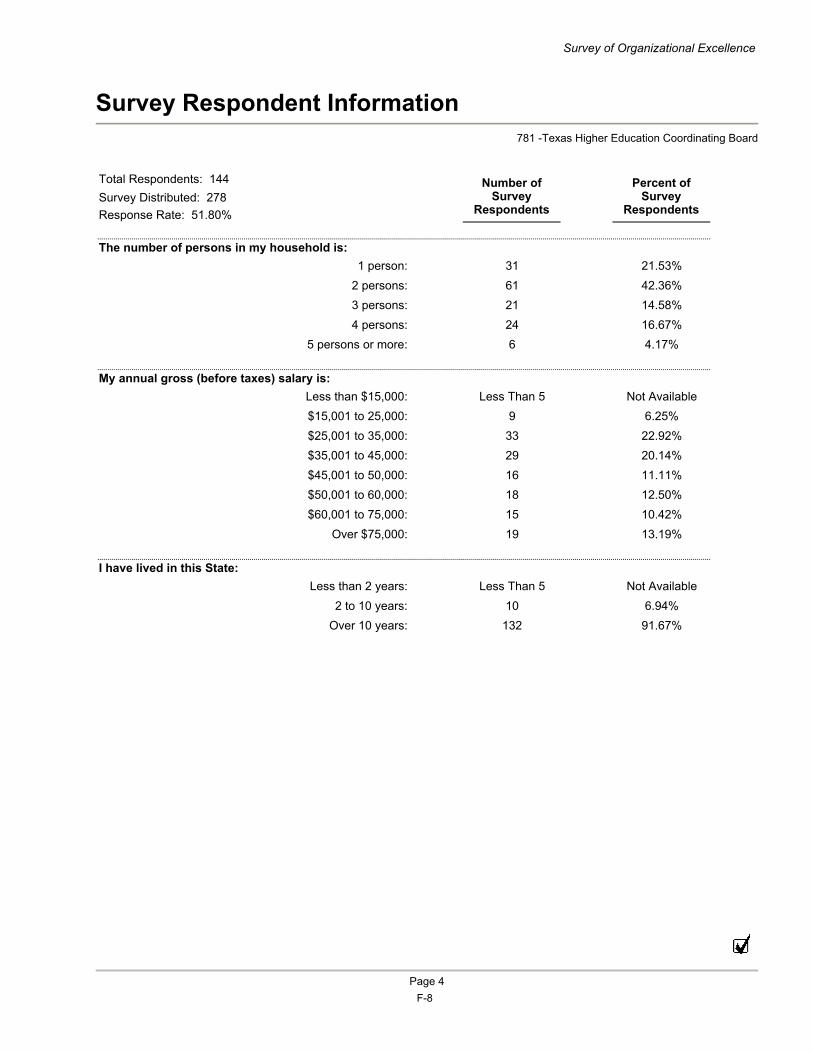
Survey Respondent Information 781 -Texas Higher Education Coordinating Board
Survey of Organizational Excellence
Total Respondents: 144 Number of Survey
Respondents
Percent of Survey
Respondents Survey Distributed: 278Response Rate: 51.80%
The number of persons in my household is:1 person: 31 21.53%
2 persons: 61 42.36% 3 persons: 21 14.58% 4 persons: 24 16.67%
5 persons or more: 6 4.17%
My annual gross (before taxes) salary is:Less than $15,000: Less Than 5 Not Available$15,001 to 25,000: 9 6.25% $25,001 to 35,000: 33 22.92% $35,001 to 45,000: 29 20.14% $45,001 to 50,000: 16 11.11% $50,001 to 60,000: 18 12.50% $60,001 to 75,000: 15 10.42%
Over $75,000: 19 13.19%
I have lived in this State:Less than 2 years: Less Than 5 Not Available
2 to 10 years: 10 6.94% Over 10 years: 132 91.67%
Page 4 F-8
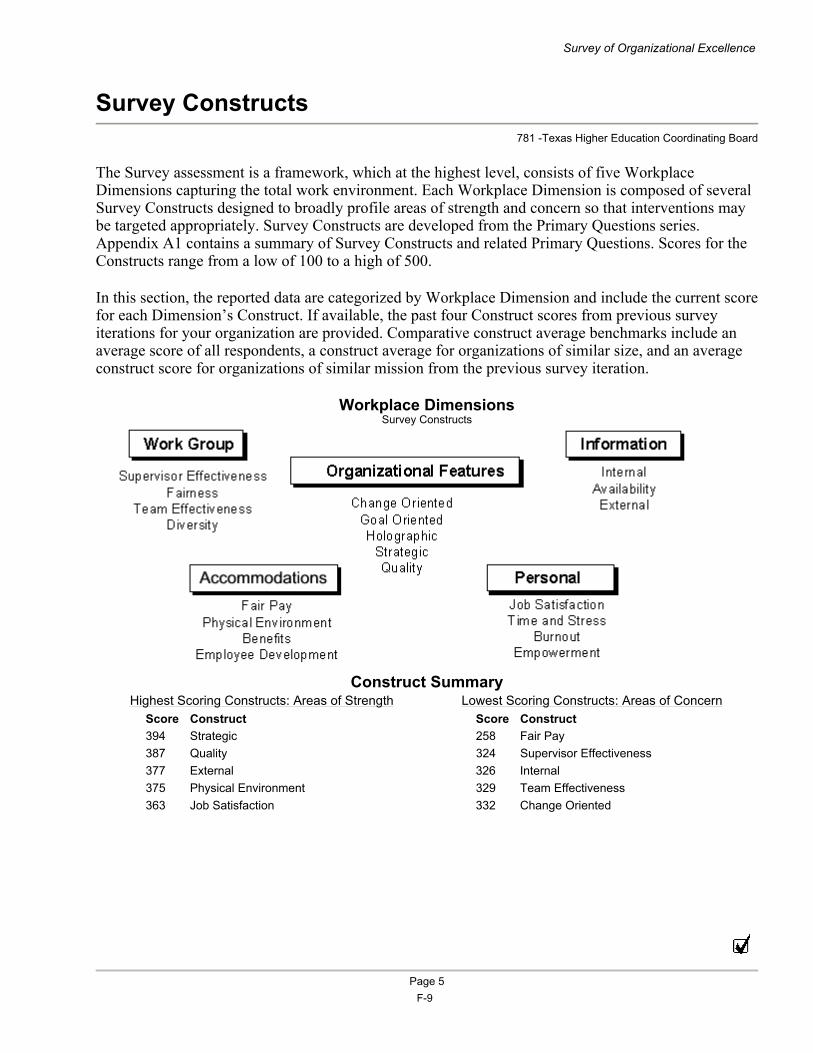
Survey Constructs 781 -Texas Higher Education Coordinating Board
The Survey assessment is a framework, which at the highest level, consists of five Workplace Dimensions capturing the total work environment. Each Workplace Dimension is composed of several Survey Constructs designed to broadly profile areas of strength and concern so that interventions may be targeted appropriately. Survey Constructs are developed from the Primary Questions series. Appendix A1 contains a summary of Survey Constructs and related Primary Questions. Scores for the Constructs range from a low of 100 to a high of 500.
In this section, the reported data are categorized by Workplace Dimension and include the current score for each Dimension’s Construct. If available, the past four Construct scores from previous survey iterations for your organization are provided. Comparative construct average benchmarks include an average score of all respondents, a construct average for organizations of similar size, and an average construct score for organizations of similar mission from the previous survey iteration.
Workplace Dimensions Survey Constructs
Construct Summary
Survey of Organizational Excellence
Highest Scoring Constructs: Areas of Strength Lowest Scoring Constructs: Areas of ConcernScore Construct Score Construct394 Strategic 258 Fair Pay387 Quality 324 Supervisor Effectiveness377 External 326 Internal375 Physical Environment 329 Team Effectiveness363 Job Satisfaction 332 Change Oriented
Page 5 F-9
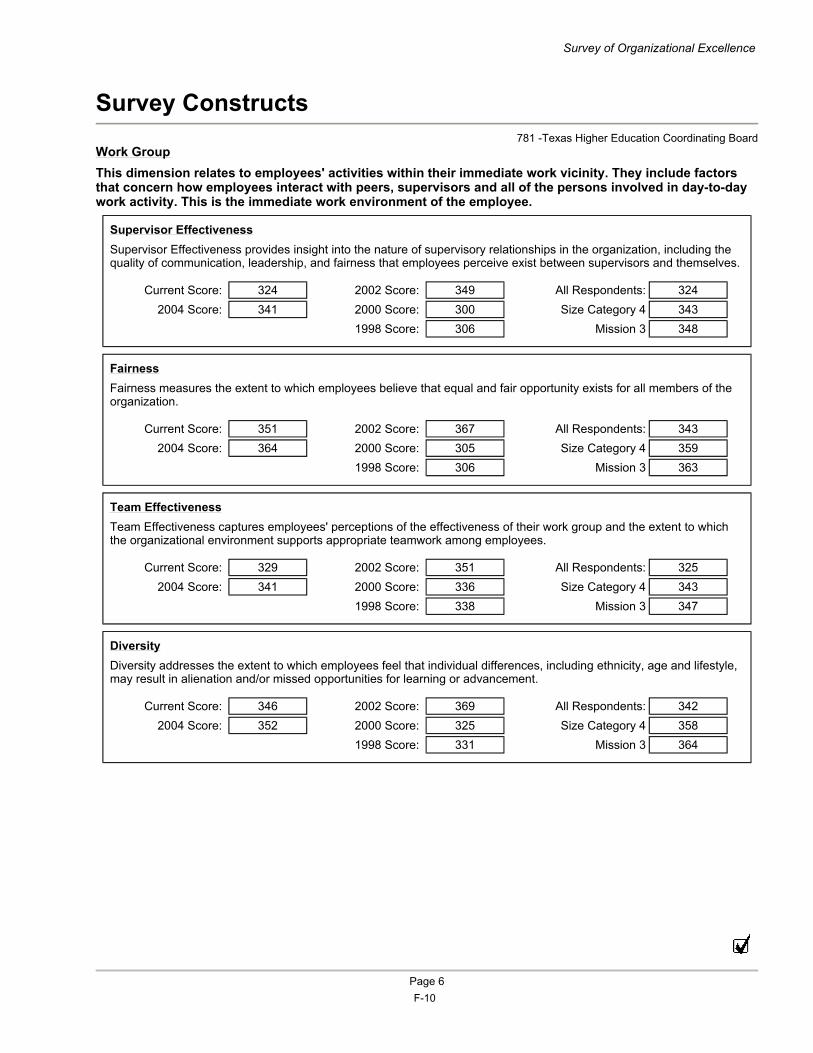
Survey Constructs 781 -Texas Higher Education Coordinating Board
Work Group This dimension relates to employees' activities within their immediate work vicinity. They include factors that concern how employees interact with peers, supervisors and all of the persons involved in day-to-day work activity. This is the immediate work environment of the employee.
Supervisor Effectiveness Supervisor Effectiveness provides insight into the nature of supervisory relationships in the organization, including the quality of communication, leadership, and fairness that employees perceive exist between supervisors and themselves.
Fairness Fairness measures the extent to which employees believe that equal and fair opportunity exists for all members of the organization.
Team Effectiveness Team Effectiveness captures employees' perceptions of the effectiveness of their work group and the extent to which the organizational environment supports appropriate teamwork among employees.
Diversity Diversity addresses the extent to which employees feel that individual differences, including ethnicity, age and lifestyle, may result in alienation and/or missed opportunities for learning or advancement.
Survey of Organizational Excellence
Current Score: 324 2002 Score: 349 All Respondents: 324 2004 Score: 341 2000 Score: 300 Size Category 4 343
1998 Score: 306 Mission 3 348
Current Score: 351 2002 Score: 367 All Respondents: 343 2004 Score: 364 2000 Score: 305 Size Category 4 359
1998 Score: 306 Mission 3 363
Current Score: 329 2002 Score: 351 All Respondents: 325 2004 Score: 341 2000 Score: 336 Size Category 4 343
1998 Score: 338 Mission 3 347
Current Score: 346 2002 Score: 369 All Respondents: 342 2004 Score: 352 2000 Score: 325 Size Category 4 358
1998 Score: 331 Mission 3 364
Page 6 F-10
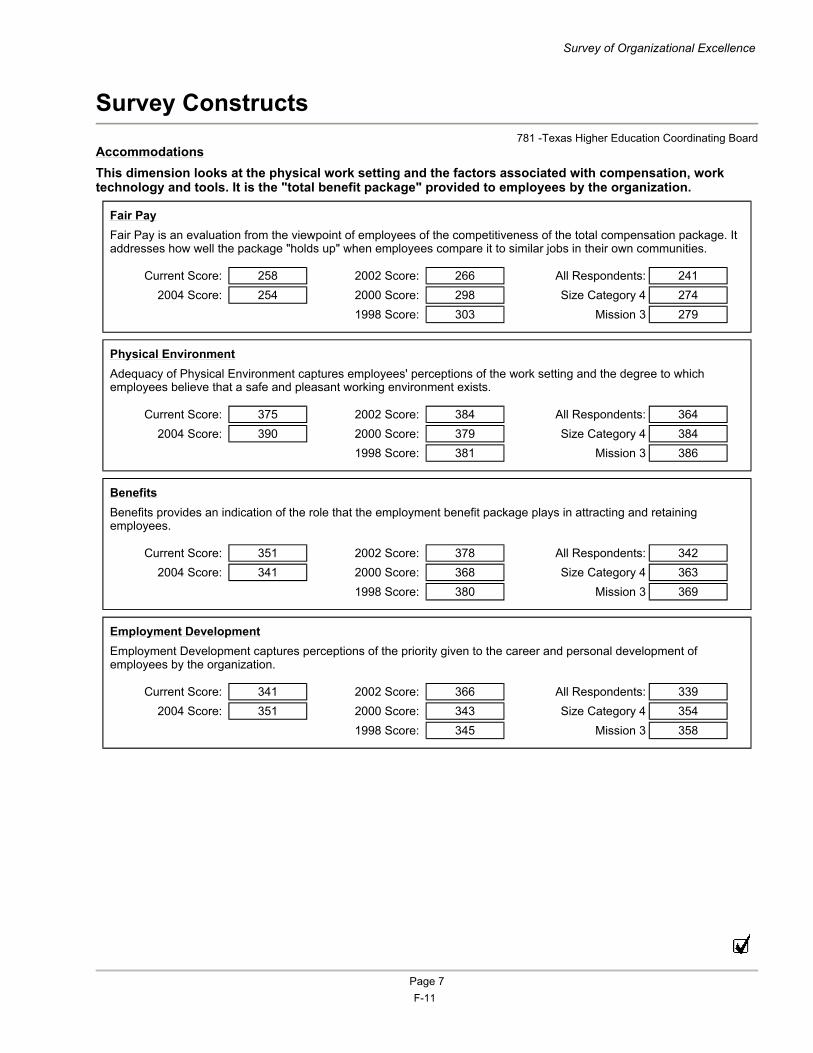
Survey Constructs 781 -Texas Higher Education Coordinating Board
Accommodations This dimension looks at the physical work setting and the factors associated with compensation, work technology and tools. It is the "total benefit package" provided to employees by the organization.
Fair Pay Fair Pay is an evaluation from the viewpoint of employees of the competitiveness of the total compensation package. It addresses how well the package "holds up" when employees compare it to similar jobs in their own communities.
Physical Environment Adequacy of Physical Environment captures employees' perceptions of the work setting and the degree to which employees believe that a safe and pleasant working environment exists.
Benefits Benefits provides an indication of the role that the employment benefit package plays in attracting and retaining employees.
Employment Development Employment Development captures perceptions of the priority given to the career and personal development of employees by the organization.
Survey of Organizational Excellence
Current Score: 258 2002 Score: 266 All Respondents: 241 2004 Score: 254 2000 Score: 298 Size Category 4 274
1998 Score: 303 Mission 3 279
Current Score: 375 2002 Score: 384 All Respondents: 364 2004 Score: 390 2000 Score: 379 Size Category 4 384
1998 Score: 381 Mission 3 386
Current Score: 351 2002 Score: 378 All Respondents: 342 2004 Score: 341 2000 Score: 368 Size Category 4 363
1998 Score: 380 Mission 3 369
Current Score: 341 2002 Score: 366 All Respondents: 339 2004 Score: 351 2000 Score: 343 Size Category 4 354
1998 Score: 345 Mission 3 358
Page 7 F-11
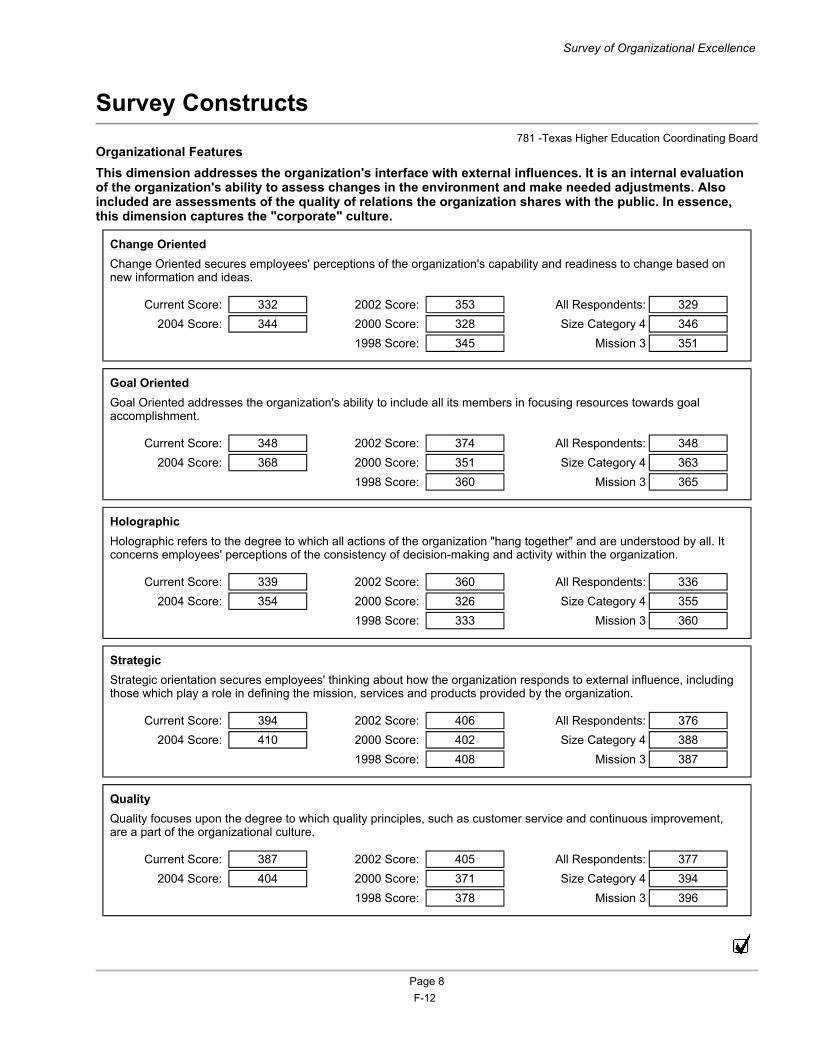
Survey Constructs 781 -Texas Higher Education Coordinating Board
Organizational Features This dimension addresses the organization's interface with external influences. It is an internal evaluation of the organization's ability to assess changes in the environment and make needed adjustments. Also included are assessments of the quality of relations the organization shares with the public. In essence, this dimension captures the "corporate" culture.
Change Oriented Change Oriented secures employees' perceptions of the organization's capability and readiness to change based on new information and ideas.
Goal Oriented Goal Oriented addresses the organization's ability to include all its members in focusing resources towards goal accomplishment.
Holographic Holographic refers to the degree to which all actions of the organization "hang together" and are understood by all. It concerns employees' perceptions of the consistency of decision-making and activity within the organization.
Strategic Strategic orientation secures employees' thinking about how the organization responds to external influence, including those which play a role in defining the mission, services and products provided by the organization.
Quality Quality focuses upon the degree to which quality principles, such as customer service and continuous improvement, are a part of the organizational culture.
Survey of Organizational Excellence
Current Score: 332 2002 Score: 353 All Respondents: 329 2004 Score: 344 2000 Score: 328 Size Category 4 346
1998 Score: 345 Mission 3 351
Current Score: 348 2002 Score: 374 All Respondents: 348 2004 Score: 368 2000 Score: 351 Size Category 4 363
1998 Score: 360 Mission 3 365
Current Score: 339 2002 Score: 360 All Respondents: 336 2004 Score: 354 2000 Score: 326 Size Category 4 355
1998 Score: 333 Mission 3 360
Current Score: 394 2002 Score: 406 All Respondents: 376 2004 Score: 410 2000 Score: 402 Size Category 4 388
1998 Score: 408 Mission 3 387
Current Score: 387 2002 Score: 405 All Respondents: 377 2004 Score: 404 2000 Score: 371 Size Category 4 394
1998 Score: 378 Mission 3 396
Page 8 F-12
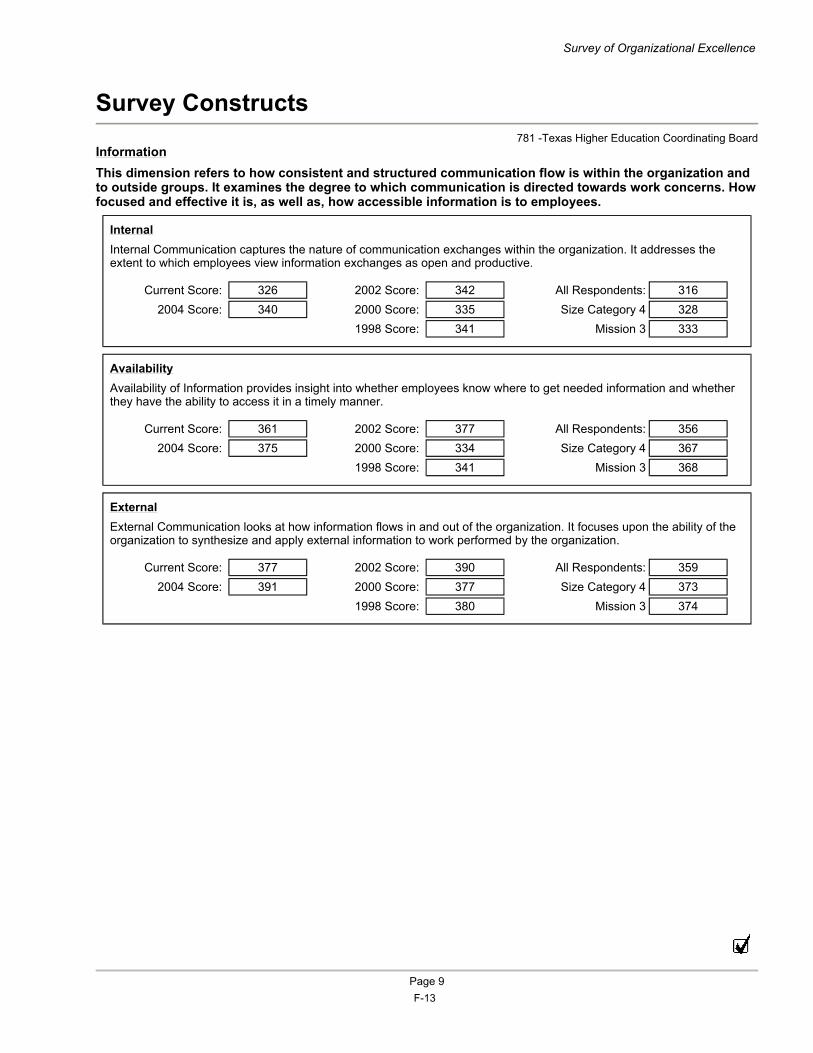
Survey Constructs 781 -Texas Higher Education Coordinating Board
Information This dimension refers to how consistent and structured communication flow is within the organization and to outside groups. It examines the degree to which communication is directed towards work concerns. How focused and effective it is, as well as, how accessible information is to employees.
Internal Internal Communication captures the nature of communication exchanges within the organization. It addresses the extent to which employees view information exchanges as open and productive.
Availability Availability of Information provides insight into whether employees know where to get needed information and whether they have the ability to access it in a timely manner.
External External Communication looks at how information flows in and out of the organization. It focuses upon the ability of the organization to synthesize and apply external information to work performed by the organization.
Survey of Organizational Excellence
Current Score: 326 2002 Score: 342 All Respondents: 316 2004 Score: 340 2000 Score: 335 Size Category 4 328
1998 Score: 341 Mission 3 333
Current Score: 361 2002 Score: 377 All Respondents: 356 2004 Score: 375 2000 Score: 334 Size Category 4 367
1998 Score: 341 Mission 3 368
Current Score: 377 2002 Score: 390 All Respondents: 359 2004 Score: 391 2000 Score: 377 Size Category 4 373
1998 Score: 380 Mission 3 374
Page 9 F-13
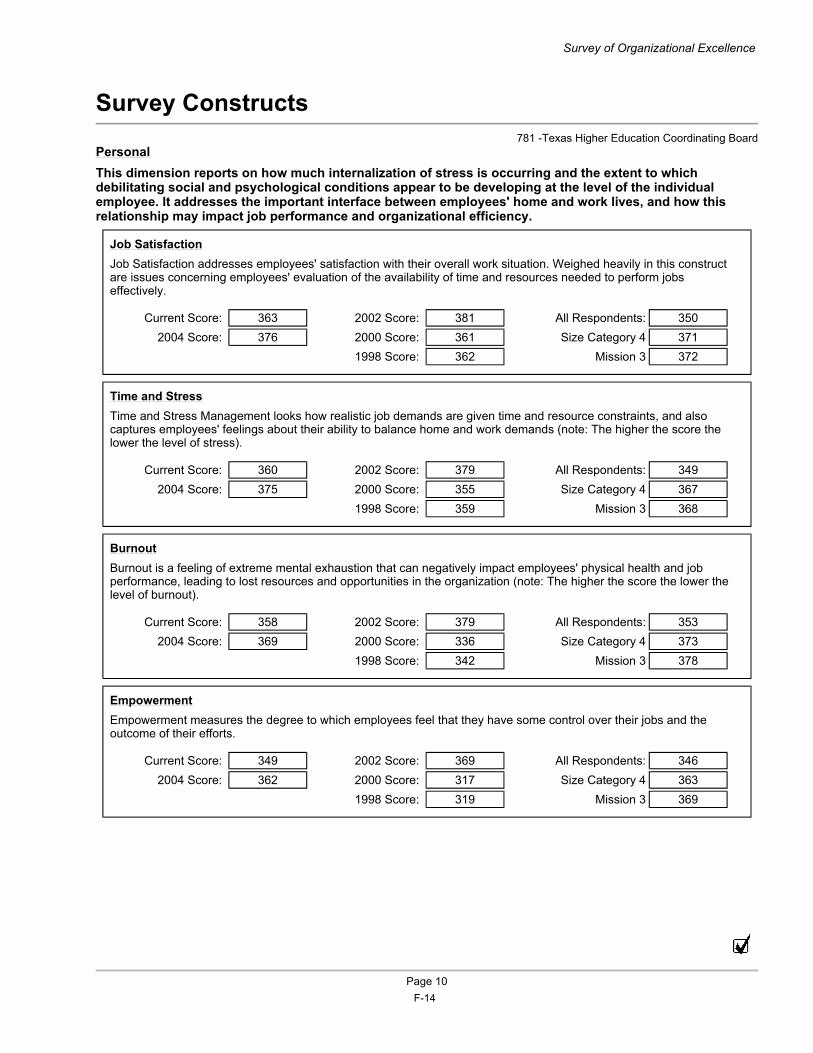
Survey Constructs 781 -Texas Higher Education Coordinating Board
Personal This dimension reports on how much internalization of stress is occurring and the extent to which debilitating social and psychological conditions appear to be developing at the level of the individual employee. It addresses the important interface between employees' home and work lives, and how this relationship may impact job performance and organizational efficiency.
Job Satisfaction Job Satisfaction addresses employees' satisfaction with their overall work situation. Weighed heavily in this construct are issues concerning employees' evaluation of the availability of time and resources needed to perform jobs effectively.
Time and Stress Time and Stress Management looks how realistic job demands are given time and resource constraints, and also captures employees' feelings about their ability to balance home and work demands (note: The higher the score the lower the level of stress).
Burnout Burnout is a feeling of extreme mental exhaustion that can negatively impact employees' physical health and job performance, leading to lost resources and opportunities in the organization (note: The higher the score the lower the level of burnout).
Empowerment Empowerment measures the degree to which employees feel that they have some control over their jobs and the outcome of their efforts.
Survey of Organizational Excellence
Current Score: 363 2002 Score: 381 All Respondents: 350 2004 Score: 376 2000 Score: 361 Size Category 4 371
1998 Score: 362 Mission 3 372
Current Score: 360 2002 Score: 379 All Respondents: 349 2004 Score: 375 2000 Score: 355 Size Category 4 367
1998 Score: 359 Mission 3 368
Current Score: 358 2002 Score: 379 All Respondents: 353 2004 Score: 369 2000 Score: 336 Size Category 4 373
1998 Score: 342 Mission 3 378
Current Score: 349 2002 Score: 369 All Respondents: 346 2004 Score: 362 2000 Score: 317 Size Category 4 363
1998 Score: 319 Mission 3 369
Page 10 F-14
Primary Items 781 -Texas Higher Education Coordinating Board
For the following section employees are asked to indicate how strongly they agree or disagree that the statement describes their immediate workplace. Possible responses include: (1) Strongly Disagree, (2) Disagree, (3) Feel Neutral, (4) Agree, (5) Strongly Disagree and (6) Don't Know/ Not Applicable. Any survey item with an average (mean) score above the neutral midpoint of "3.0" suggests that employees perceive the issue more positively than negatively. Scores of "4.0" or higher indicate areas of substantial strength for the organization. Conversely, scores below "3.0" are viewed more negatively by employees. Questions that receive below a "2.0" should be a significant source of concern for the organization and receive immediate attention.
Survey of Organizational Excellence
Page 11 F-15
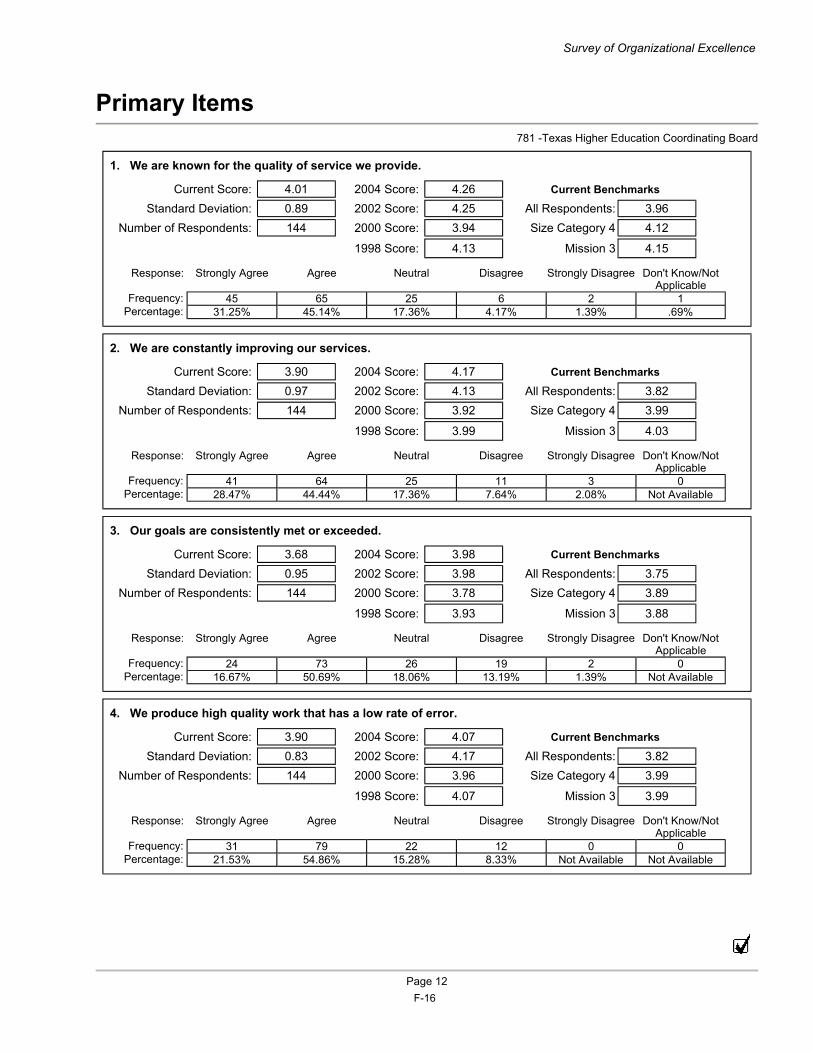
Primary Items 781 -Texas Higher Education Coordinating Board
1. We are known for the quality of service we provide.
2. We are constantly improving our services.
3. Our goals are consistently met or exceeded.
4. We produce high quality work that has a low rate of error.
Survey of Organizational Excellence
Current Score: 4.01 2004 Score: 4.26 Current Benchmarks
Standard Deviation: 0.89 2002 Score: 4.25 All Respondents: 3.96Number of Respondents: 144 2000 Score: 3.94 Size Category 4 4.12
1998 Score: 4.13 Mission 3 4.15
Current Score: 3.90 2004 Score: 4.17 Current Benchmarks
Standard Deviation: 0.97 2002 Score: 4.13 All Respondents: 3.82Number of Respondents: 144 2000 Score: 3.92 Size Category 4 3.99
1998 Score: 3.99 Mission 3 4.03
Current Score: 3.68 2004 Score: 3.98 Current Benchmarks
Standard Deviation: 0.95 2002 Score: 3.98 All Respondents: 3.75Number of Respondents: 144 2000 Score: 3.78 Size Category 4 3.89
1998 Score: 3.93 Mission 3 3.88
Current Score: 3.90 2004 Score: 4.07 Current Benchmarks
Standard Deviation: 0.83 2002 Score: 4.17 All Respondents: 3.82Number of Respondents: 144 2000 Score: 3.96 Size Category 4 3.99
1998 Score: 4.07 Mission 3 3.99
Page 12
Response: Strongly Agree Agree Neutral Disagree Strongly Disagree Don't Know/Not Applicable
Frequency: 45 65 25 6 2 1Percentage: 31.25% 45.14% 17.36% 4.17% 1.39% .69%
Response: Strongly Agree Agree Neutral Disagree Strongly Disagree Don't Know/Not Applicable
Frequency: 41 64 25 11 3 0Percentage: 28.47% 44.44% 17.36% 7.64% 2.08% Not Available
Response: Strongly Agree Agree Neutral Disagree Strongly Disagree Don't Know/Not Applicable
Frequency: 24 73 26 19 2 0Percentage: 16.67% 50.69% 18.06% 13.19% 1.39% Not Available
Response: Strongly Agree Agree Neutral Disagree Strongly Disagree Don't Know/Not Applicable
Frequency: 31 79 22 12 0 0Percentage: 21.53% 54.86% 15.28% 8.33% Not Available Not Available
F-16
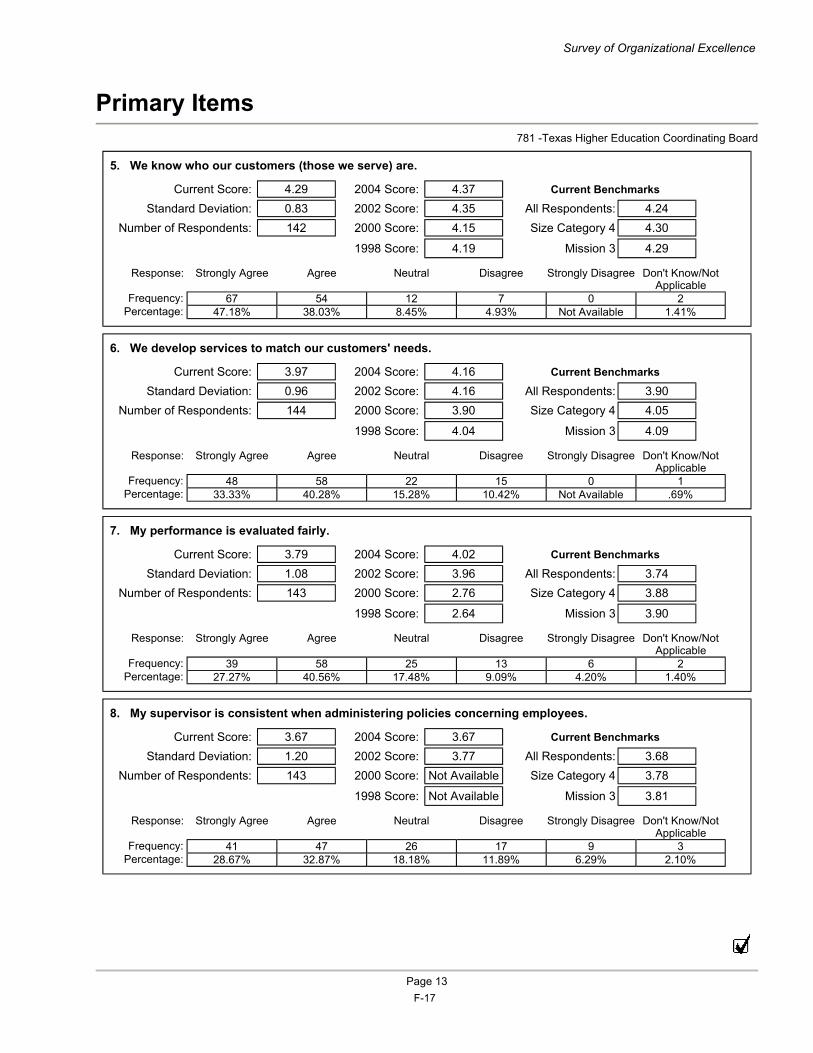
Primary Items 781 -Texas Higher Education Coordinating Board
5. We know who our customers (those we serve) are.
6. We develop services to match our customers' needs.
7. My performance is evaluated fairly.
8. My supervisor is consistent when administering policies concerning employees.
Survey of Organizational Excellence
Current Score: 4.29 2004 Score: 4.37 Current Benchmarks
Standard Deviation: 0.83 2002 Score: 4.35 All Respondents: 4.24Number of Respondents: 142 2000 Score: 4.15 Size Category 4 4.30
1998 Score: 4.19 Mission 3 4.29
Current Score: 3.97 2004 Score: 4.16 Current Benchmarks
Standard Deviation: 0.96 2002 Score: 4.16 All Respondents: 3.90Number of Respondents: 144 2000 Score: 3.90 Size Category 4 4.05
1998 Score: 4.04 Mission 3 4.09
Current Score: 3.79 2004 Score: 4.02 Current Benchmarks
Standard Deviation: 1.08 2002 Score: 3.96 All Respondents: 3.74Number of Respondents: 143 2000 Score: 2.76 Size Category 4 3.88
1998 Score: 2.64 Mission 3 3.90
Current Score: 3.67 2004 Score: 3.67 Current Benchmarks
Standard Deviation: 1.20 2002 Score: 3.77 All Respondents: 3.68Number of Respondents: 143 2000 Score: Not Available Size Category 4 3.78
1998 Score: Not Available Mission 3 3.81
Page 13
Response: Strongly Agree Agree Neutral Disagree Strongly Disagree Don't Know/Not Applicable
Frequency: 67 54 12 7 0 2Percentage: 47.18% 38.03% 8.45% 4.93% Not Available 1.41%
Response: Strongly Agree Agree Neutral Disagree Strongly Disagree Don't Know/Not Applicable
Frequency: 48 58 22 15 0 1Percentage: 33.33% 40.28% 15.28% 10.42% Not Available .69%
Response: Strongly Agree Agree Neutral Disagree Strongly Disagree Don't Know/Not Applicable
Frequency: 39 58 25 13 6 2Percentage: 27.27% 40.56% 17.48% 9.09% 4.20% 1.40%
Response: Strongly Agree Agree Neutral Disagree Strongly Disagree Don't Know/Not Applicable
Frequency: 41 47 26 17 9 3Percentage: 28.67% 32.87% 18.18% 11.89% 6.29% 2.10%
F-17
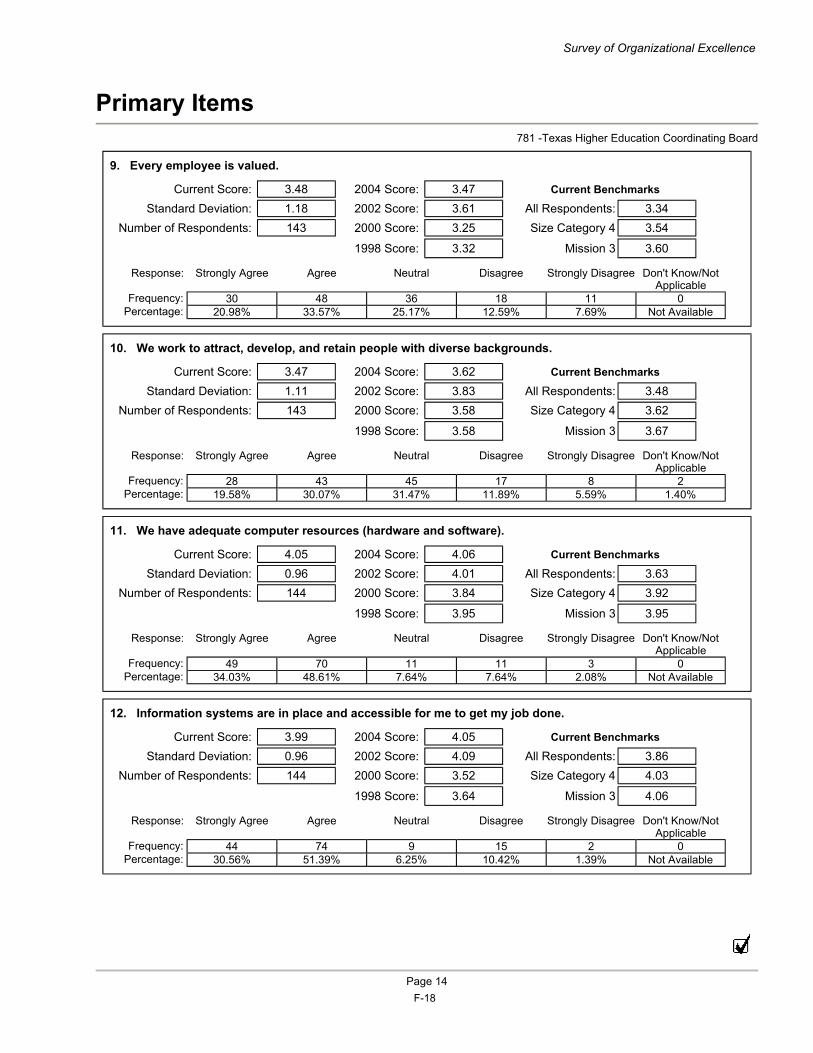
Primary Items 781 -Texas Higher Education Coordinating Board
9. Every employee is valued.
10. We work to attract, develop, and retain people with diverse backgrounds.
11. We have adequate computer resources (hardware and software).
12. Information systems are in place and accessible for me to get my job done.
Survey of Organizational Excellence
Current Score: 3.48 2004 Score: 3.47 Current Benchmarks
Standard Deviation: 1.18 2002 Score: 3.61 All Respondents: 3.34Number of Respondents: 143 2000 Score: 3.25 Size Category 4 3.54
1998 Score: 3.32 Mission 3 3.60
Current Score: 3.47 2004 Score: 3.62 Current Benchmarks
Standard Deviation: 1.11 2002 Score: 3.83 All Respondents: 3.48Number of Respondents: 143 2000 Score: 3.58 Size Category 4 3.62
1998 Score: 3.58 Mission 3 3.67
Current Score: 4.05 2004 Score: 4.06 Current Benchmarks
Standard Deviation: 0.96 2002 Score: 4.01 All Respondents: 3.63Number of Respondents: 144 2000 Score: 3.84 Size Category 4 3.92
1998 Score: 3.95 Mission 3 3.95
Current Score: 3.99 2004 Score: 4.05 Current Benchmarks
Standard Deviation: 0.96 2002 Score: 4.09 All Respondents: 3.86Number of Respondents: 144 2000 Score: 3.52 Size Category 4 4.03
1998 Score: 3.64 Mission 3 4.06
Page 14
Response: Strongly Agree Agree Neutral Disagree Strongly Disagree Don't Know/Not Applicable
Frequency: 30 48 36 18 11 0Percentage: 20.98% 33.57% 25.17% 12.59% 7.69% Not Available
Response: Strongly Agree Agree Neutral Disagree Strongly Disagree Don't Know/Not Applicable
Frequency: 28 43 45 17 8 2Percentage: 19.58% 30.07% 31.47% 11.89% 5.59% 1.40%
Response: Strongly Agree Agree Neutral Disagree Strongly Disagree Don't Know/Not Applicable
Frequency: 49 70 11 11 3 0Percentage: 34.03% 48.61% 7.64% 7.64% 2.08% Not Available
Response: Strongly Agree Agree Neutral Disagree Strongly Disagree Don't Know/Not Applicable
Frequency: 44 74 9 15 2 0Percentage: 30.56% 51.39% 6.25% 10.42% 1.39% Not Available
F-18
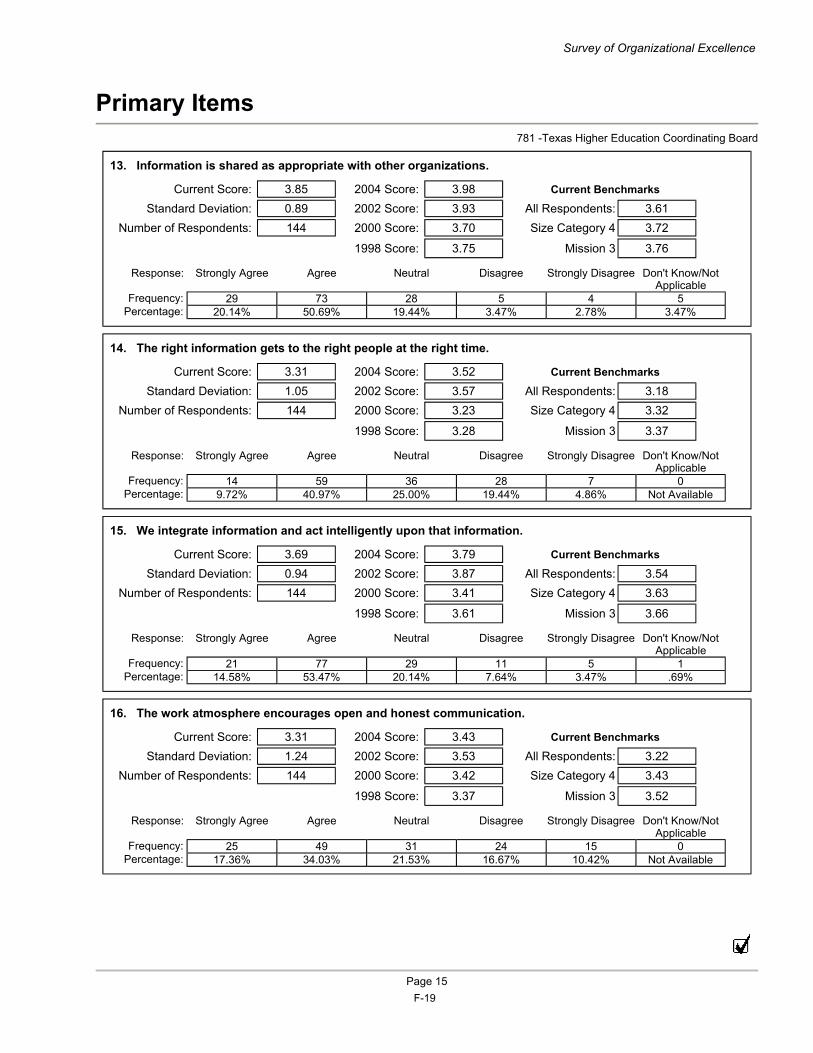
Primary Items 781 -Texas Higher Education Coordinating Board
13. Information is shared as appropriate with other organizations.
14. The right information gets to the right people at the right time.
15. We integrate information and act intelligently upon that information.
16. The work atmosphere encourages open and honest communication.
Survey of Organizational Excellence
Current Score: 3.85 2004 Score: 3.98 Current Benchmarks
Standard Deviation: 0.89 2002 Score: 3.93 All Respondents: 3.61Number of Respondents: 144 2000 Score: 3.70 Size Category 4 3.72
1998 Score: 3.75 Mission 3 3.76
Current Score: 3.31 2004 Score: 3.52 Current Benchmarks
Standard Deviation: 1.05 2002 Score: 3.57 All Respondents: 3.18Number of Respondents: 144 2000 Score: 3.23 Size Category 4 3.32
1998 Score: 3.28 Mission 3 3.37
Current Score: 3.69 2004 Score: 3.79 Current Benchmarks
Standard Deviation: 0.94 2002 Score: 3.87 All Respondents: 3.54Number of Respondents: 144 2000 Score: 3.41 Size Category 4 3.63
1998 Score: 3.61 Mission 3 3.66
Current Score: 3.31 2004 Score: 3.43 Current Benchmarks
Standard Deviation: 1.24 2002 Score: 3.53 All Respondents: 3.22Number of Respondents: 144 2000 Score: 3.42 Size Category 4 3.43
1998 Score: 3.37 Mission 3 3.52
Page 15
Response: Strongly Agree Agree Neutral Disagree Strongly Disagree Don't Know/Not Applicable
Frequency: 29 73 28 5 4 5Percentage: 20.14% 50.69% 19.44% 3.47% 2.78% 3.47%
Response: Strongly Agree Agree Neutral Disagree Strongly Disagree Don't Know/Not Applicable
Frequency: 14 59 36 28 7 0Percentage: 9.72% 40.97% 25.00% 19.44% 4.86% Not Available
Response: Strongly Agree Agree Neutral Disagree Strongly Disagree Don't Know/Not Applicable
Frequency: 21 77 29 11 5 1Percentage: 14.58% 53.47% 20.14% 7.64% 3.47% .69%
Response: Strongly Agree Agree Neutral Disagree Strongly Disagree Don't Know/Not Applicable
Frequency: 25 49 31 24 15 0Percentage: 17.36% 34.03% 21.53% 16.67% 10.42% Not Available
F-19
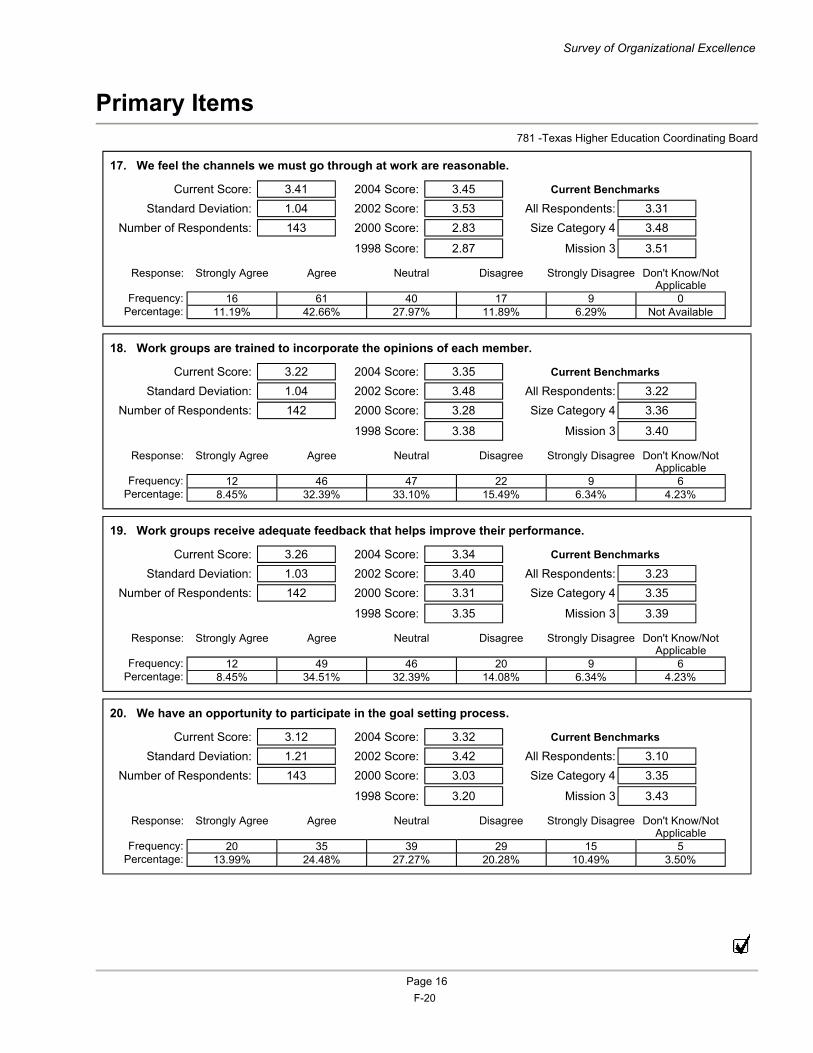
Primary Items 781 -Texas Higher Education Coordinating Board
17. We feel the channels we must go through at work are reasonable.
18. Work groups are trained to incorporate the opinions of each member.
19. Work groups receive adequate feedback that helps improve their performance.
20. We have an opportunity to participate in the goal setting process.
Survey of Organizational Excellence
Current Score: 3.41 2004 Score: 3.45 Current Benchmarks
Standard Deviation: 1.04 2002 Score: 3.53 All Respondents: 3.31Number of Respondents: 143 2000 Score: 2.83 Size Category 4 3.48
1998 Score: 2.87 Mission 3 3.51
Current Score: 3.22 2004 Score: 3.35 Current Benchmarks
Standard Deviation: 1.04 2002 Score: 3.48 All Respondents: 3.22Number of Respondents: 142 2000 Score: 3.28 Size Category 4 3.36
1998 Score: 3.38 Mission 3 3.40
Current Score: 3.26 2004 Score: 3.34 Current Benchmarks
Standard Deviation: 1.03 2002 Score: 3.40 All Respondents: 3.23Number of Respondents: 142 2000 Score: 3.31 Size Category 4 3.35
1998 Score: 3.35 Mission 3 3.39
Current Score: 3.12 2004 Score: 3.32 Current Benchmarks
Standard Deviation: 1.21 2002 Score: 3.42 All Respondents: 3.10Number of Respondents: 143 2000 Score: 3.03 Size Category 4 3.35
1998 Score: 3.20 Mission 3 3.43
Page 16
Response: Strongly Agree Agree Neutral Disagree Strongly Disagree Don't Know/Not Applicable
Frequency: 16 61 40 17 9 0Percentage: 11.19% 42.66% 27.97% 11.89% 6.29% Not Available
Response: Strongly Agree Agree Neutral Disagree Strongly Disagree Don't Know/Not Applicable
Frequency: 12 46 47 22 9 6Percentage: 8.45% 32.39% 33.10% 15.49% 6.34% 4.23%
Response: Strongly Agree Agree Neutral Disagree Strongly Disagree Don't Know/Not Applicable
Frequency: 12 49 46 20 9 6Percentage: 8.45% 34.51% 32.39% 14.08% 6.34% 4.23%
Response: Strongly Agree Agree Neutral Disagree Strongly Disagree Don't Know/Not Applicable
Frequency: 20 35 39 29 15 5Percentage: 13.99% 24.48% 27.27% 20.28% 10.49% 3.50%
F-20
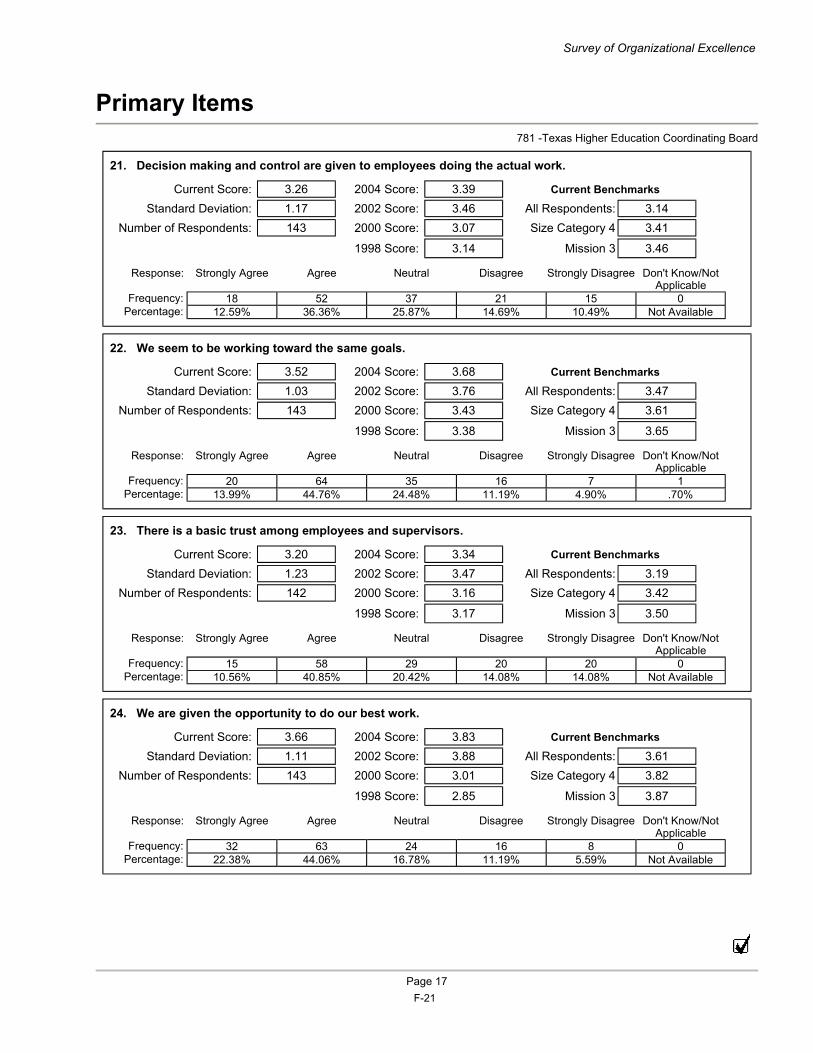
Primary Items 781 -Texas Higher Education Coordinating Board
21. Decision making and control are given to employees doing the actual work.
22. We seem to be working toward the same goals.
23. There is a basic trust among employees and supervisors.
24. We are given the opportunity to do our best work.
Survey of Organizational Excellence
Current Score: 3.26 2004 Score: 3.39 Current Benchmarks
Standard Deviation: 1.17 2002 Score: 3.46 All Respondents: 3.14Number of Respondents: 143 2000 Score: 3.07 Size Category 4 3.41
1998 Score: 3.14 Mission 3 3.46
Current Score: 3.52 2004 Score: 3.68 Current Benchmarks
Standard Deviation: 1.03 2002 Score: 3.76 All Respondents: 3.47Number of Respondents: 143 2000 Score: 3.43 Size Category 4 3.61
1998 Score: 3.38 Mission 3 3.65
Current Score: 3.20 2004 Score: 3.34 Current Benchmarks
Standard Deviation: 1.23 2002 Score: 3.47 All Respondents: 3.19Number of Respondents: 142 2000 Score: 3.16 Size Category 4 3.42
1998 Score: 3.17 Mission 3 3.50
Current Score: 3.66 2004 Score: 3.83 Current Benchmarks
Standard Deviation: 1.11 2002 Score: 3.88 All Respondents: 3.61Number of Respondents: 143 2000 Score: 3.01 Size Category 4 3.82
1998 Score: 2.85 Mission 3 3.87
Page 17
Response: Strongly Agree Agree Neutral Disagree Strongly Disagree Don't Know/Not Applicable
Frequency: 18 52 37 21 15 0Percentage: 12.59% 36.36% 25.87% 14.69% 10.49% Not Available
Response: Strongly Agree Agree Neutral Disagree Strongly Disagree Don't Know/Not Applicable
Frequency: 20 64 35 16 7 1Percentage: 13.99% 44.76% 24.48% 11.19% 4.90% .70%
Response: Strongly Agree Agree Neutral Disagree Strongly Disagree Don't Know/Not Applicable
Frequency: 15 58 29 20 20 0Percentage: 10.56% 40.85% 20.42% 14.08% 14.08% Not Available
Response: Strongly Agree Agree Neutral Disagree Strongly Disagree Don't Know/Not Applicable
Frequency: 32 63 24 16 8 0Percentage: 22.38% 44.06% 16.78% 11.19% 5.59% Not Available
F-21
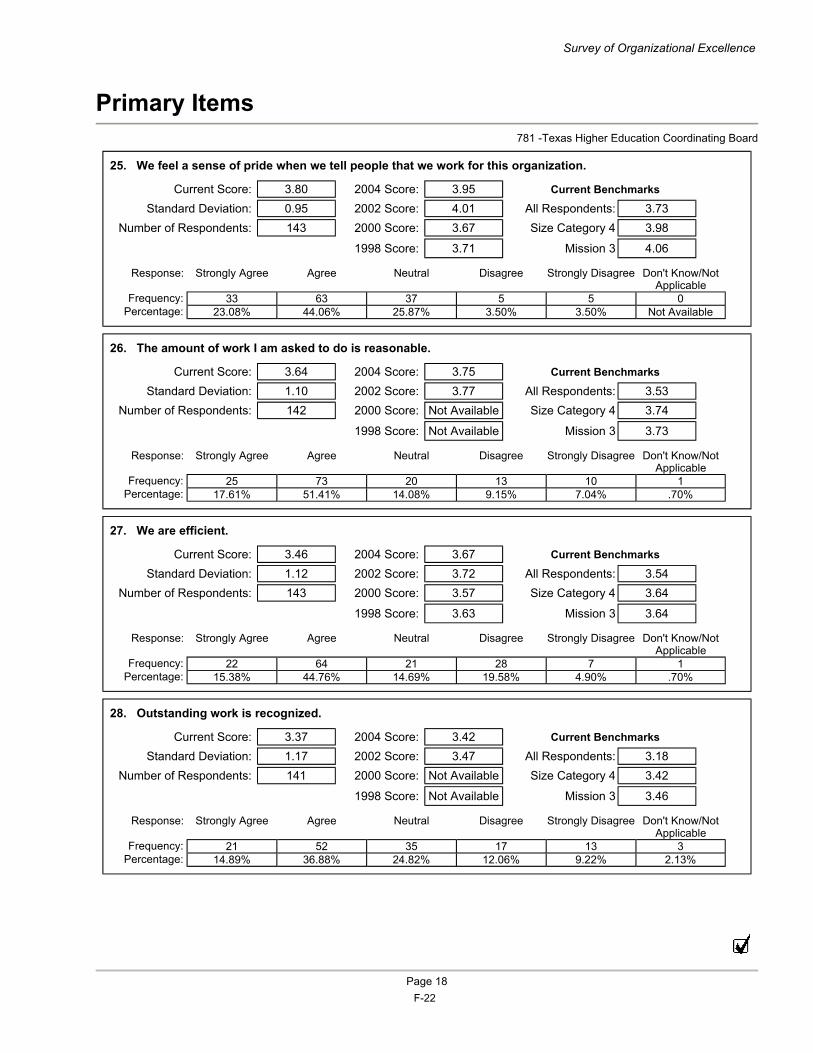
Primary Items 781 -Texas Higher Education Coordinating Board
25. We feel a sense of pride when we tell people that we work for this organization.
26. The amount of work I am asked to do is reasonable.
27. We are efficient.
28. Outstanding work is recognized.
Survey of Organizational Excellence
Current Score: 3.80 2004 Score: 3.95 Current Benchmarks
Standard Deviation: 0.95 2002 Score: 4.01 All Respondents: 3.73Number of Respondents: 143 2000 Score: 3.67 Size Category 4 3.98
1998 Score: 3.71 Mission 3 4.06
Current Score: 3.64 2004 Score: 3.75 Current Benchmarks
Standard Deviation: 1.10 2002 Score: 3.77 All Respondents: 3.53Number of Respondents: 142 2000 Score: Not Available Size Category 4 3.74
1998 Score: Not Available Mission 3 3.73
Current Score: 3.46 2004 Score: 3.67 Current Benchmarks
Standard Deviation: 1.12 2002 Score: 3.72 All Respondents: 3.54Number of Respondents: 143 2000 Score: 3.57 Size Category 4 3.64
1998 Score: 3.63 Mission 3 3.64
Current Score: 3.37 2004 Score: 3.42 Current Benchmarks
Standard Deviation: 1.17 2002 Score: 3.47 All Respondents: 3.18Number of Respondents: 141 2000 Score: Not Available Size Category 4 3.42
1998 Score: Not Available Mission 3 3.46
Page 18
Response: Strongly Agree Agree Neutral Disagree Strongly Disagree Don't Know/Not Applicable
Frequency: 33 63 37 5 5 0Percentage: 23.08% 44.06% 25.87% 3.50% 3.50% Not Available
Response: Strongly Agree Agree Neutral Disagree Strongly Disagree Don't Know/Not Applicable
Frequency: 25 73 20 13 10 1Percentage: 17.61% 51.41% 14.08% 9.15% 7.04% .70%
Response: Strongly Agree Agree Neutral Disagree Strongly Disagree Don't Know/Not Applicable
Frequency: 22 64 21 28 7 1Percentage: 15.38% 44.76% 14.69% 19.58% 4.90% .70%
Response: Strongly Agree Agree Neutral Disagree Strongly Disagree Don't Know/Not Applicable
Frequency: 21 52 35 17 13 3Percentage: 14.89% 36.88% 24.82% 12.06% 9.22% 2.13%
F-22
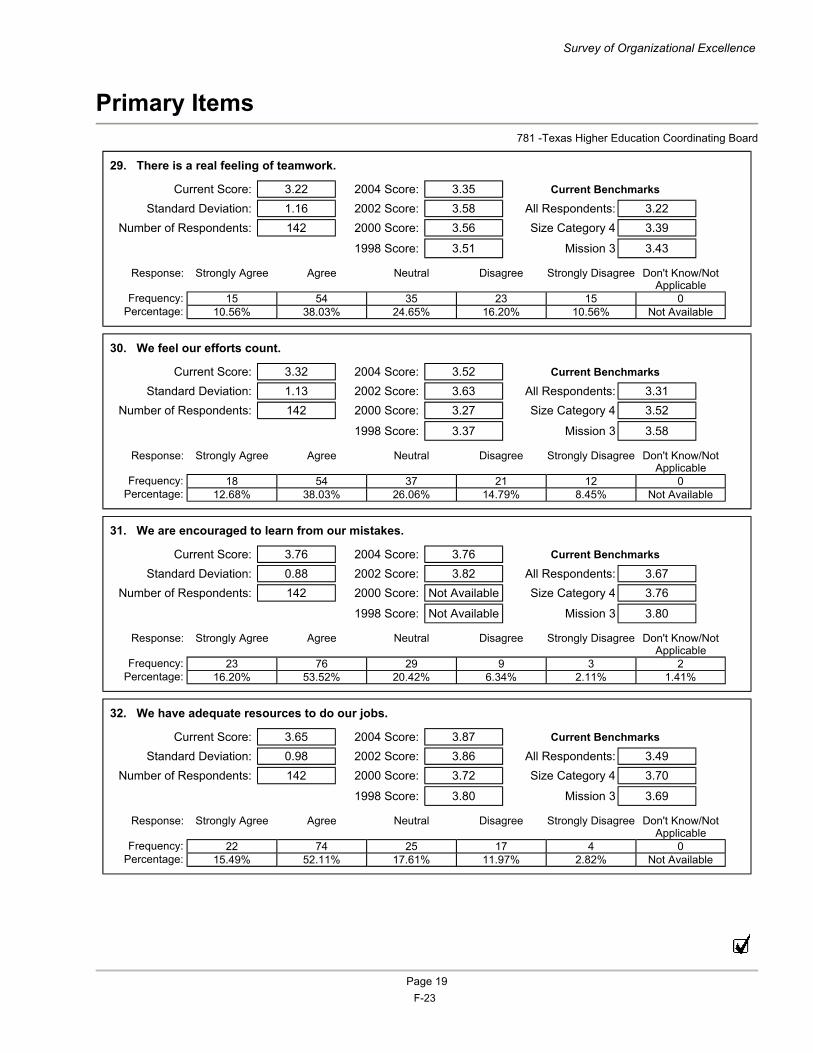
Primary Items 781 -Texas Higher Education Coordinating Board
29. There is a real feeling of teamwork.
30. We feel our efforts count.
31. We are encouraged to learn from our mistakes.
32. We have adequate resources to do our jobs.
Survey of Organizational Excellence
Current Score: 3.22 2004 Score: 3.35 Current Benchmarks
Standard Deviation: 1.16 2002 Score: 3.58 All Respondents: 3.22Number of Respondents: 142 2000 Score: 3.56 Size Category 4 3.39
1998 Score: 3.51 Mission 3 3.43
Current Score: 3.32 2004 Score: 3.52 Current Benchmarks
Standard Deviation: 1.13 2002 Score: 3.63 All Respondents: 3.31Number of Respondents: 142 2000 Score: 3.27 Size Category 4 3.52
1998 Score: 3.37 Mission 3 3.58
Current Score: 3.76 2004 Score: 3.76 Current Benchmarks
Standard Deviation: 0.88 2002 Score: 3.82 All Respondents: 3.67Number of Respondents: 142 2000 Score: Not Available Size Category 4 3.76
1998 Score: Not Available Mission 3 3.80
Current Score: 3.65 2004 Score: 3.87 Current Benchmarks
Standard Deviation: 0.98 2002 Score: 3.86 All Respondents: 3.49Number of Respondents: 142 2000 Score: 3.72 Size Category 4 3.70
1998 Score: 3.80 Mission 3 3.69
Page 19
Response: Strongly Agree Agree Neutral Disagree Strongly Disagree Don't Know/Not Applicable
Frequency: 15 54 35 23 15 0Percentage: 10.56% 38.03% 24.65% 16.20% 10.56% Not Available
Response: Strongly Agree Agree Neutral Disagree Strongly Disagree Don't Know/Not Applicable
Frequency: 18 54 37 21 12 0Percentage: 12.68% 38.03% 26.06% 14.79% 8.45% Not Available
Response: Strongly Agree Agree Neutral Disagree Strongly Disagree Don't Know/Not Applicable
Frequency: 23 76 29 9 3 2Percentage: 16.20% 53.52% 20.42% 6.34% 2.11% 1.41%
Response: Strongly Agree Agree Neutral Disagree Strongly Disagree Don't Know/Not Applicable
Frequency: 22 74 25 17 4 0Percentage: 15.49% 52.11% 17.61% 11.97% 2.82% Not Available
F-23
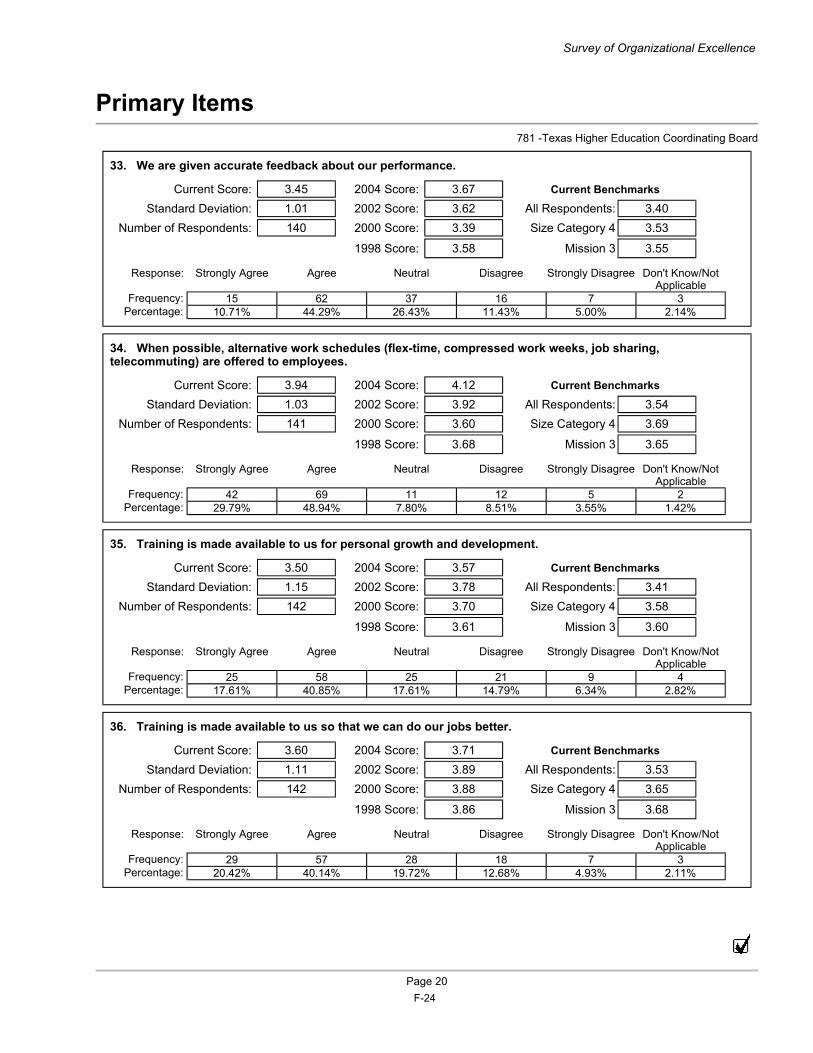
Primary Items 781 -Texas Higher Education Coordinating Board
33. We are given accurate feedback about our performance.
34. When possible, alternative work schedules (flex-time, compressed work weeks, job sharing, telecommuting) are offered to employees.
35. Training is made available to us for personal growth and development.
36. Training is made available to us so that we can do our jobs better.
Survey of Organizational Excellence
Current Score: 3.45 2004 Score: 3.67 Current Benchmarks
Standard Deviation: 1.01 2002 Score: 3.62 All Respondents: 3.40Number of Respondents: 140 2000 Score: 3.39 Size Category 4 3.53
1998 Score: 3.58 Mission 3 3.55
Current Score: 3.94 2004 Score: 4.12 Current Benchmarks
Standard Deviation: 1.03 2002 Score: 3.92 All Respondents: 3.54Number of Respondents: 141 2000 Score: 3.60 Size Category 4 3.69
1998 Score: 3.68 Mission 3 3.65
Current Score: 3.50 2004 Score: 3.57 Current Benchmarks
Standard Deviation: 1.15 2002 Score: 3.78 All Respondents: 3.41Number of Respondents: 142 2000 Score: 3.70 Size Category 4 3.58
1998 Score: 3.61 Mission 3 3.60
Current Score: 3.60 2004 Score: 3.71 Current Benchmarks
Standard Deviation: 1.11 2002 Score: 3.89 All Respondents: 3.53Number of Respondents: 142 2000 Score: 3.88 Size Category 4 3.65
1998 Score: 3.86 Mission 3 3.68
Page 20
Response: Strongly Agree Agree Neutral Disagree Strongly Disagree Don't Know/Not Applicable
Frequency: 15 62 37 16 7 3Percentage: 10.71% 44.29% 26.43% 11.43% 5.00% 2.14%
Response: Strongly Agree Agree Neutral Disagree Strongly Disagree Don't Know/Not Applicable
Frequency: 42 69 11 12 5 2Percentage: 29.79% 48.94% 7.80% 8.51% 3.55% 1.42%
Response: Strongly Agree Agree Neutral Disagree Strongly Disagree Don't Know/Not Applicable
Frequency: 25 58 25 21 9 4Percentage: 17.61% 40.85% 17.61% 14.79% 6.34% 2.82%
Response: Strongly Agree Agree Neutral Disagree Strongly Disagree Don't Know/Not Applicable
Frequency: 29 57 28 18 7 3Percentage: 20.42% 40.14% 19.72% 12.68% 4.93% 2.11%
F-24
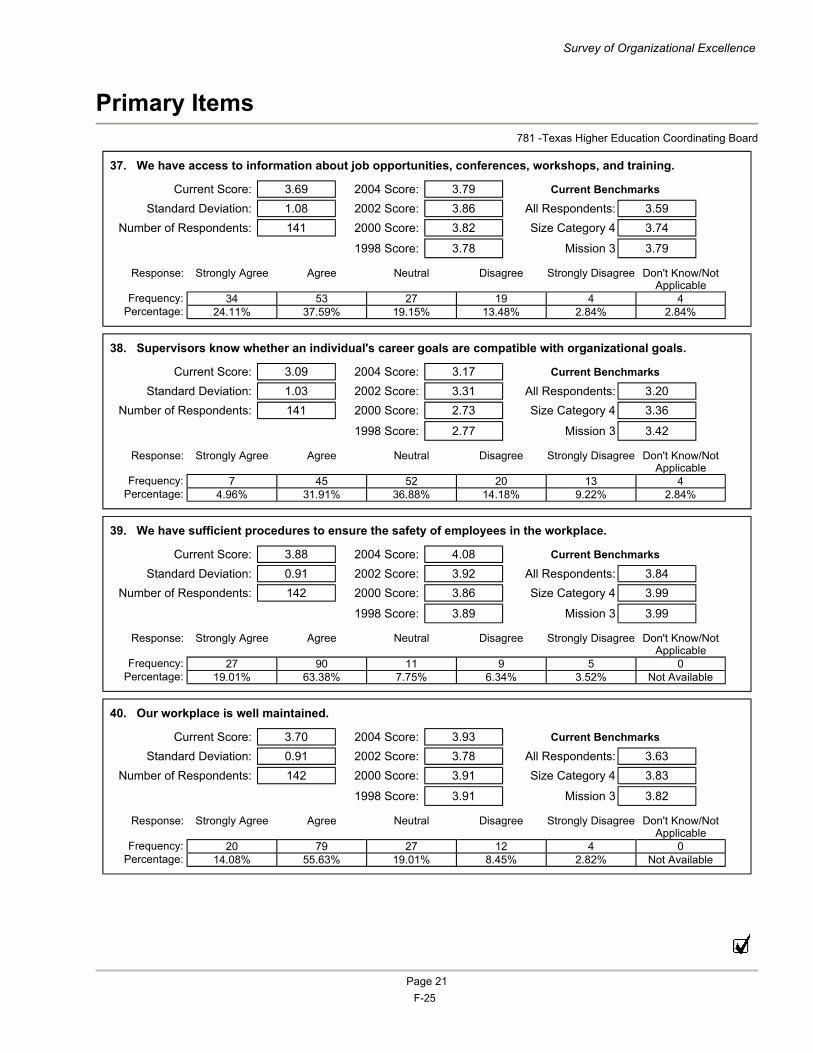
Primary Items 781 -Texas Higher Education Coordinating Board
37. We have access to information about job opportunities, conferences, workshops, and training.
38. Supervisors know whether an individual's career goals are compatible with organizational goals.
39. We have sufficient procedures to ensure the safety of employees in the workplace.
40. Our workplace is well maintained.
Survey of Organizational Excellence
Current Score: 3.69 2004 Score: 3.79 Current Benchmarks
Standard Deviation: 1.08 2002 Score: 3.86 All Respondents: 3.59Number of Respondents: 141 2000 Score: 3.82 Size Category 4 3.74
1998 Score: 3.78 Mission 3 3.79
Current Score: 3.09 2004 Score: 3.17 Current Benchmarks
Standard Deviation: 1.03 2002 Score: 3.31 All Respondents: 3.20Number of Respondents: 141 2000 Score: 2.73 Size Category 4 3.36
1998 Score: 2.77 Mission 3 3.42
Current Score: 3.88 2004 Score: 4.08 Current Benchmarks
Standard Deviation: 0.91 2002 Score: 3.92 All Respondents: 3.84Number of Respondents: 142 2000 Score: 3.86 Size Category 4 3.99
1998 Score: 3.89 Mission 3 3.99
Current Score: 3.70 2004 Score: 3.93 Current Benchmarks
Standard Deviation: 0.91 2002 Score: 3.78 All Respondents: 3.63Number of Respondents: 142 2000 Score: 3.91 Size Category 4 3.83
1998 Score: 3.91 Mission 3 3.82
Page 21
Response: Strongly Agree Agree Neutral Disagree Strongly Disagree Don't Know/Not Applicable
Frequency: 34 53 27 19 4 4Percentage: 24.11% 37.59% 19.15% 13.48% 2.84% 2.84%
Response: Strongly Agree Agree Neutral Disagree Strongly Disagree Don't Know/Not Applicable
Frequency: 7 45 52 20 13 4Percentage: 4.96% 31.91% 36.88% 14.18% 9.22% 2.84%
Response: Strongly Agree Agree Neutral Disagree Strongly Disagree Don't Know/Not Applicable
Frequency: 27 90 11 9 5 0Percentage: 19.01% 63.38% 7.75% 6.34% 3.52% Not Available
Response: Strongly Agree Agree Neutral Disagree Strongly Disagree Don't Know/Not Applicable
Frequency: 20 79 27 12 4 0Percentage: 14.08% 55.63% 19.01% 8.45% 2.82% Not Available
F-25
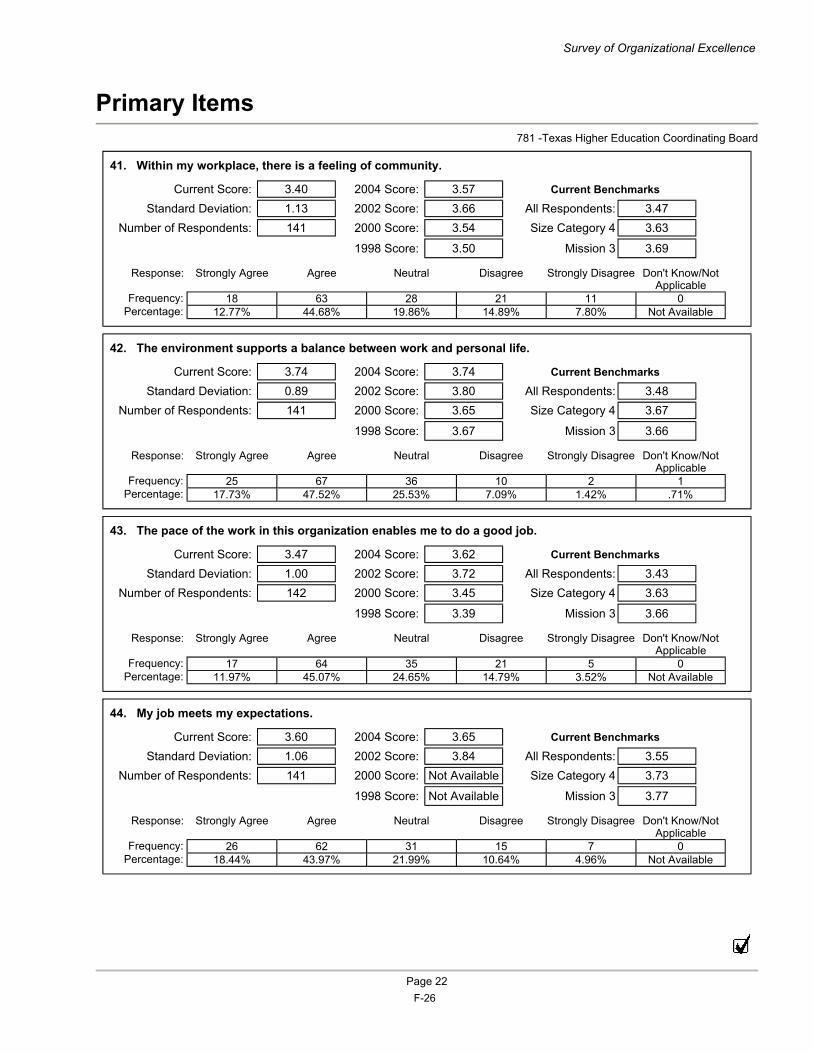
Primary Items 781 -Texas Higher Education Coordinating Board
41. Within my workplace, there is a feeling of community.
42. The environment supports a balance between work and personal life.
43. The pace of the work in this organization enables me to do a good job.
44. My job meets my expectations.
Survey of Organizational Excellence
Current Score: 3.40 2004 Score: 3.57 Current Benchmarks
Standard Deviation: 1.13 2002 Score: 3.66 All Respondents: 3.47Number of Respondents: 141 2000 Score: 3.54 Size Category 4 3.63
1998 Score: 3.50 Mission 3 3.69
Current Score: 3.74 2004 Score: 3.74 Current Benchmarks
Standard Deviation: 0.89 2002 Score: 3.80 All Respondents: 3.48Number of Respondents: 141 2000 Score: 3.65 Size Category 4 3.67
1998 Score: 3.67 Mission 3 3.66
Current Score: 3.47 2004 Score: 3.62 Current Benchmarks
Standard Deviation: 1.00 2002 Score: 3.72 All Respondents: 3.43Number of Respondents: 142 2000 Score: 3.45 Size Category 4 3.63
1998 Score: 3.39 Mission 3 3.66
Current Score: 3.60 2004 Score: 3.65 Current Benchmarks
Standard Deviation: 1.06 2002 Score: 3.84 All Respondents: 3.55Number of Respondents: 141 2000 Score: Not Available Size Category 4 3.73
1998 Score: Not Available Mission 3 3.77
Page 22
Response: Strongly Agree Agree Neutral Disagree Strongly Disagree Don't Know/Not Applicable
Frequency: 18 63 28 21 11 0Percentage: 12.77% 44.68% 19.86% 14.89% 7.80% Not Available
Response: Strongly Agree Agree Neutral Disagree Strongly Disagree Don't Know/Not Applicable
Frequency: 25 67 36 10 2 1Percentage: 17.73% 47.52% 25.53% 7.09% 1.42% .71%
Response: Strongly Agree Agree Neutral Disagree Strongly Disagree Don't Know/Not Applicable
Frequency: 17 64 35 21 5 0Percentage: 11.97% 45.07% 24.65% 14.79% 3.52% Not Available
Response: Strongly Agree Agree Neutral Disagree Strongly Disagree Don't Know/Not Applicable
Frequency: 26 62 31 15 7 0Percentage: 18.44% 43.97% 21.99% 10.64% 4.96% Not Available
F-26
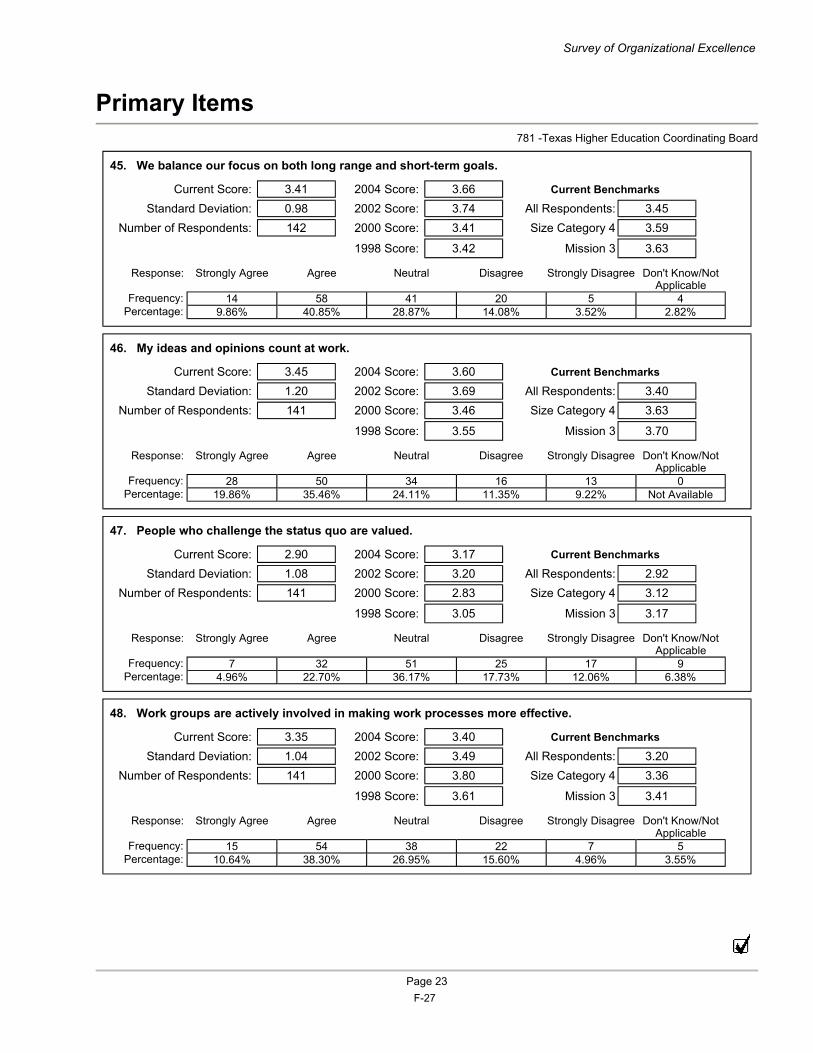
Primary Items 781 -Texas Higher Education Coordinating Board
45. We balance our focus on both long range and short-term goals.
46. My ideas and opinions count at work.
47. People who challenge the status quo are valued.
48. Work groups are actively involved in making work processes more effective.
Survey of Organizational Excellence
Current Score: 3.41 2004 Score: 3.66 Current Benchmarks
Standard Deviation: 0.98 2002 Score: 3.74 All Respondents: 3.45Number of Respondents: 142 2000 Score: 3.41 Size Category 4 3.59
1998 Score: 3.42 Mission 3 3.63
Current Score: 3.45 2004 Score: 3.60 Current Benchmarks
Standard Deviation: 1.20 2002 Score: 3.69 All Respondents: 3.40Number of Respondents: 141 2000 Score: 3.46 Size Category 4 3.63
1998 Score: 3.55 Mission 3 3.70
Current Score: 2.90 2004 Score: 3.17 Current Benchmarks
Standard Deviation: 1.08 2002 Score: 3.20 All Respondents: 2.92Number of Respondents: 141 2000 Score: 2.83 Size Category 4 3.12
1998 Score: 3.05 Mission 3 3.17
Current Score: 3.35 2004 Score: 3.40 Current Benchmarks
Standard Deviation: 1.04 2002 Score: 3.49 All Respondents: 3.20Number of Respondents: 141 2000 Score: 3.80 Size Category 4 3.36
1998 Score: 3.61 Mission 3 3.41
Page 23
Response: Strongly Agree Agree Neutral Disagree Strongly Disagree Don't Know/Not Applicable
Frequency: 14 58 41 20 5 4Percentage: 9.86% 40.85% 28.87% 14.08% 3.52% 2.82%
Response: Strongly Agree Agree Neutral Disagree Strongly Disagree Don't Know/Not Applicable
Frequency: 28 50 34 16 13 0Percentage: 19.86% 35.46% 24.11% 11.35% 9.22% Not Available
Response: Strongly Agree Agree Neutral Disagree Strongly Disagree Don't Know/Not Applicable
Frequency: 7 32 51 25 17 9Percentage: 4.96% 22.70% 36.17% 17.73% 12.06% 6.38%
Response: Strongly Agree Agree Neutral Disagree Strongly Disagree Don't Know/Not Applicable
Frequency: 15 54 38 22 7 5Percentage: 10.64% 38.30% 26.95% 15.60% 4.96% 3.55%
F-27
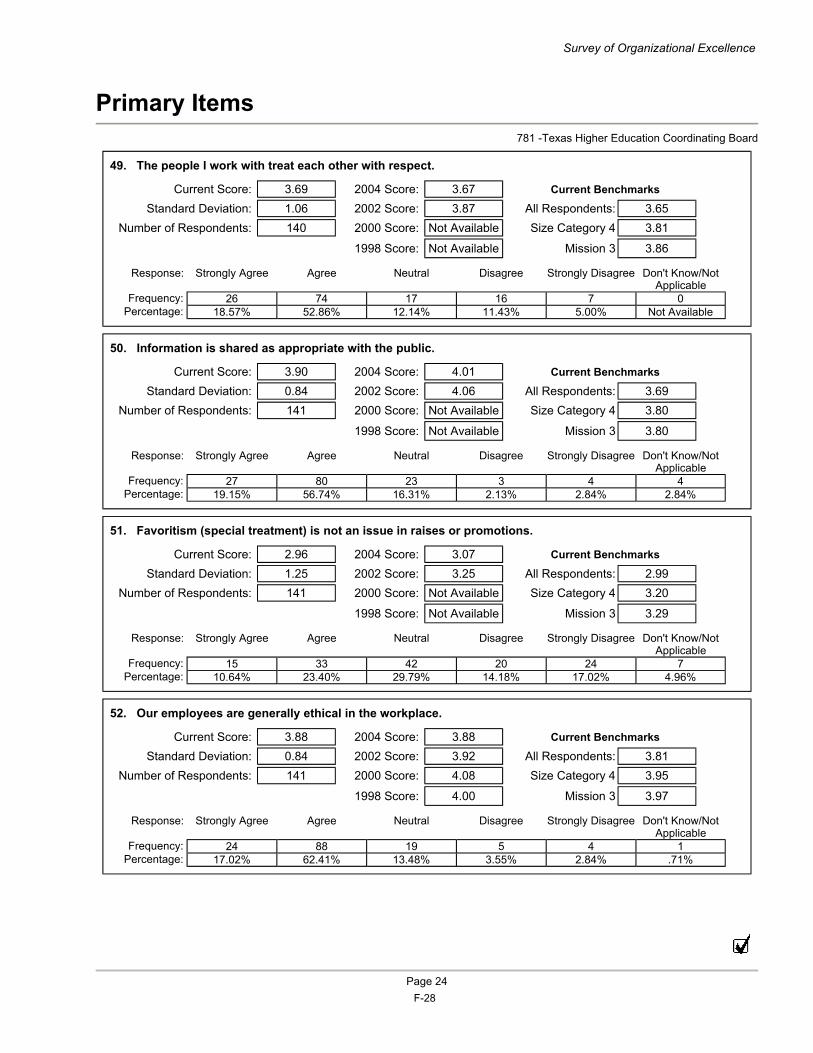
Primary Items 781 -Texas Higher Education Coordinating Board
49. The people I work with treat each other with respect.
50. Information is shared as appropriate with the public.
51. Favoritism (special treatment) is not an issue in raises or promotions.
52. Our employees are generally ethical in the workplace.
Survey of Organizational Excellence
Current Score: 3.69 2004 Score: 3.67 Current Benchmarks
Standard Deviation: 1.06 2002 Score: 3.87 All Respondents: 3.65Number of Respondents: 140 2000 Score: Not Available Size Category 4 3.81
1998 Score: Not Available Mission 3 3.86
Current Score: 3.90 2004 Score: 4.01 Current Benchmarks
Standard Deviation: 0.84 2002 Score: 4.06 All Respondents: 3.69Number of Respondents: 141 2000 Score: Not Available Size Category 4 3.80
1998 Score: Not Available Mission 3 3.80
Current Score: 2.96 2004 Score: 3.07 Current Benchmarks
Standard Deviation: 1.25 2002 Score: 3.25 All Respondents: 2.99Number of Respondents: 141 2000 Score: Not Available Size Category 4 3.20
1998 Score: Not Available Mission 3 3.29
Current Score: 3.88 2004 Score: 3.88 Current Benchmarks
Standard Deviation: 0.84 2002 Score: 3.92 All Respondents: 3.81Number of Respondents: 141 2000 Score: 4.08 Size Category 4 3.95
1998 Score: 4.00 Mission 3 3.97
Page 24
Response: Strongly Agree Agree Neutral Disagree Strongly Disagree Don't Know/Not Applicable
Frequency: 26 74 17 16 7 0Percentage: 18.57% 52.86% 12.14% 11.43% 5.00% Not Available
Response: Strongly Agree Agree Neutral Disagree Strongly Disagree Don't Know/Not Applicable
Frequency: 27 80 23 3 4 4Percentage: 19.15% 56.74% 16.31% 2.13% 2.84% 2.84%
Response: Strongly Agree Agree Neutral Disagree Strongly Disagree Don't Know/Not Applicable
Frequency: 15 33 42 20 24 7Percentage: 10.64% 23.40% 29.79% 14.18% 17.02% 4.96%
Response: Strongly Agree Agree Neutral Disagree Strongly Disagree Don't Know/Not Applicable
Frequency: 24 88 19 5 4 1Percentage: 17.02% 62.41% 13.48% 3.55% 2.84% .71%
F-28
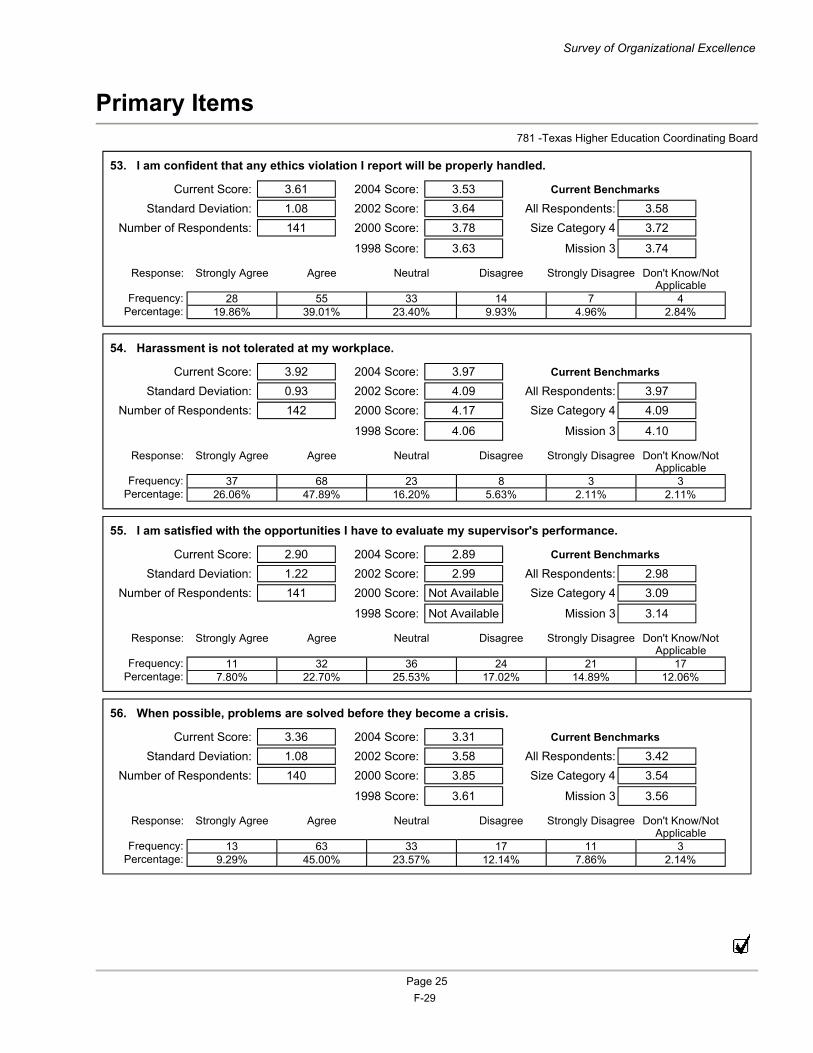
Primary Items 781 -Texas Higher Education Coordinating Board
53. I am confident that any ethics violation I report will be properly handled.
54. Harassment is not tolerated at my workplace.
55. I am satisfied with the opportunities I have to evaluate my supervisor's performance.
56. When possible, problems are solved before they become a crisis.
Survey of Organizational Excellence
Current Score: 3.61 2004 Score: 3.53 Current Benchmarks
Standard Deviation: 1.08 2002 Score: 3.64 All Respondents: 3.58Number of Respondents: 141 2000 Score: 3.78 Size Category 4 3.72
1998 Score: 3.63 Mission 3 3.74
Current Score: 3.92 2004 Score: 3.97 Current Benchmarks
Standard Deviation: 0.93 2002 Score: 4.09 All Respondents: 3.97Number of Respondents: 142 2000 Score: 4.17 Size Category 4 4.09
1998 Score: 4.06 Mission 3 4.10
Current Score: 2.90 2004 Score: 2.89 Current Benchmarks
Standard Deviation: 1.22 2002 Score: 2.99 All Respondents: 2.98Number of Respondents: 141 2000 Score: Not Available Size Category 4 3.09
1998 Score: Not Available Mission 3 3.14
Current Score: 3.36 2004 Score: 3.31 Current Benchmarks
Standard Deviation: 1.08 2002 Score: 3.58 All Respondents: 3.42Number of Respondents: 140 2000 Score: 3.85 Size Category 4 3.54
1998 Score: 3.61 Mission 3 3.56
Page 25
Response: Strongly Agree Agree Neutral Disagree Strongly Disagree Don't Know/Not Applicable
Frequency: 28 55 33 14 7 4Percentage: 19.86% 39.01% 23.40% 9.93% 4.96% 2.84%
Response: Strongly Agree Agree Neutral Disagree Strongly Disagree Don't Know/Not Applicable
Frequency: 37 68 23 8 3 3Percentage: 26.06% 47.89% 16.20% 5.63% 2.11% 2.11%
Response: Strongly Agree Agree Neutral Disagree Strongly Disagree Don't Know/Not Applicable
Frequency: 11 32 36 24 21 17Percentage: 7.80% 22.70% 25.53% 17.02% 14.89% 12.06%
Response: Strongly Agree Agree Neutral Disagree Strongly Disagree Don't Know/Not Applicable
Frequency: 13 63 33 17 11 3Percentage: 9.29% 45.00% 23.57% 12.14% 7.86% 2.14%
F-29
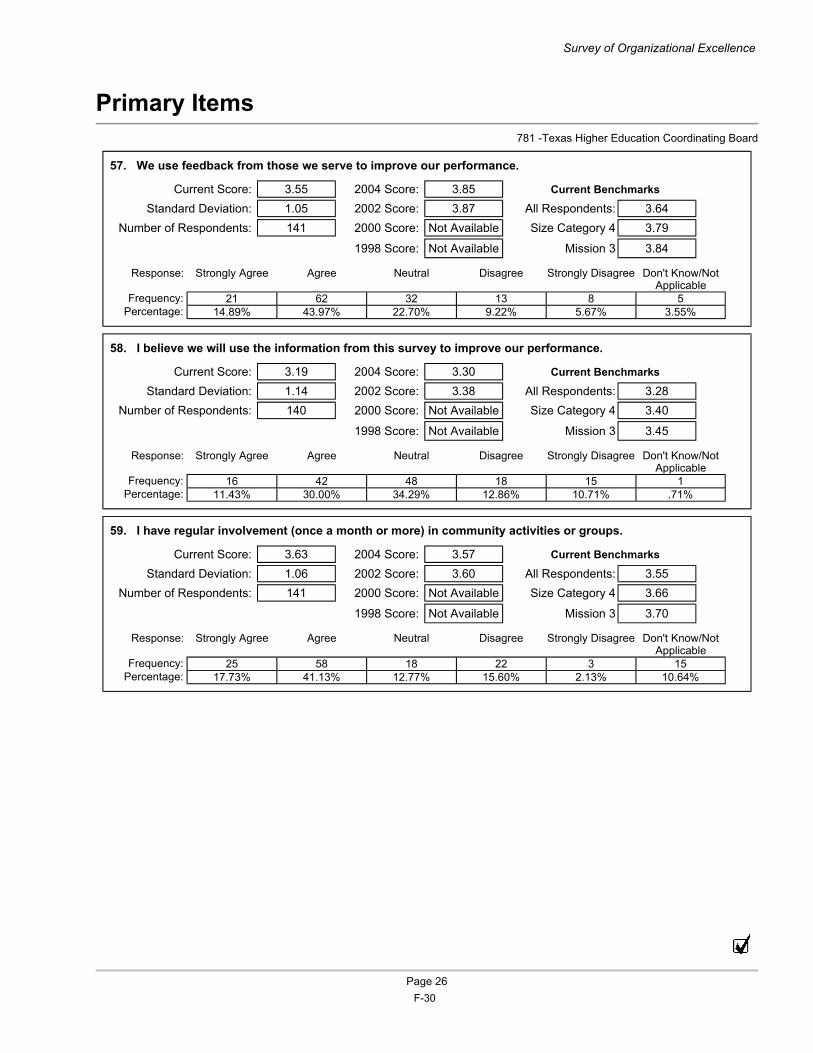
Primary Items 781 -Texas Higher Education Coordinating Board
57. We use feedback from those we serve to improve our performance.
58. I believe we will use the information from this survey to improve our performance.
59. I have regular involvement (once a month or more) in community activities or groups.
Survey of Organizational Excellence
Current Score: 3.55 2004 Score: 3.85 Current Benchmarks
Standard Deviation: 1.05 2002 Score: 3.87 All Respondents: 3.64Number of Respondents: 141 2000 Score: Not Available Size Category 4 3.79
1998 Score: Not Available Mission 3 3.84
Current Score: 3.19 2004 Score: 3.30 Current Benchmarks
Standard Deviation: 1.14 2002 Score: 3.38 All Respondents: 3.28Number of Respondents: 140 2000 Score: Not Available Size Category 4 3.40
1998 Score: Not Available Mission 3 3.45
Current Score: 3.63 2004 Score: 3.57 Current Benchmarks
Standard Deviation: 1.06 2002 Score: 3.60 All Respondents: 3.55Number of Respondents: 141 2000 Score: Not Available Size Category 4 3.66
1998 Score: Not Available Mission 3 3.70
Page 26
Response: Strongly Agree Agree Neutral Disagree Strongly Disagree Don't Know/Not Applicable
Frequency: 21 62 32 13 8 5Percentage: 14.89% 43.97% 22.70% 9.22% 5.67% 3.55%
Response: Strongly Agree Agree Neutral Disagree Strongly Disagree Don't Know/Not Applicable
Frequency: 16 42 48 18 15 1Percentage: 11.43% 30.00% 34.29% 12.86% 10.71% .71%
Response: Strongly Agree Agree Neutral Disagree Strongly Disagree Don't Know/Not Applicable
Frequency: 25 58 18 22 3 15Percentage: 17.73% 41.13% 12.77% 15.60% 2.13% 10.64%
F-30
Compensation 781 -Texas Higher Education Coordinating Board
For the following section employees are asked to indicate how strongly they agree or disagree that the statement describes their level of satisfaction with their compensation. Possible responses include: (1) Strongly Disagree, (2) Disagree, (3) Feel Neutral, (4) Agree, (5) Strongly Disagree and (6) Don't Know/ Not Applicable. Any survey item with an average (mean) score above the neutral midpoint of "3.0" suggests that employees perceive the issue more positively than negatively. Scores of "4.0" or higher indicate areas of substantial strength for the organization. Conversely, scores below "3.0" are viewed more negatively by employees. Questions that receive below a "2.0" should be a significant source of concern for the organization and receive immediate attention.
Survey of Organizational Excellence
Page 27 F-31
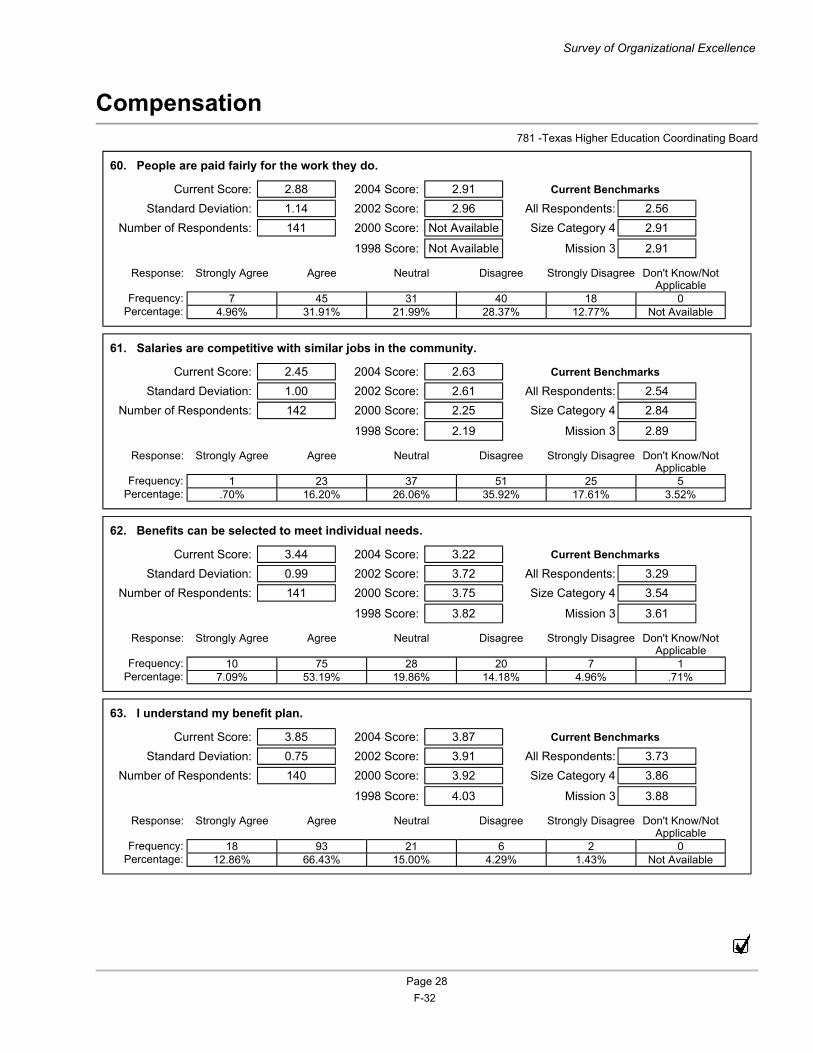
Compensation 781 -Texas Higher Education Coordinating Board
60. People are paid fairly for the work they do.
61. Salaries are competitive with similar jobs in the community.
62. Benefits can be selected to meet individual needs.
63. I understand my benefit plan.
Survey of Organizational Excellence
Current Score: 2.88 2004 Score: 2.91 Current Benchmarks
Standard Deviation: 1.14 2002 Score: 2.96 All Respondents: 2.56Number of Respondents: 141 2000 Score: Not Available Size Category 4 2.91
1998 Score: Not Available Mission 3 2.91
Current Score: 2.45 2004 Score: 2.63 Current Benchmarks
Standard Deviation: 1.00 2002 Score: 2.61 All Respondents: 2.54Number of Respondents: 142 2000 Score: 2.25 Size Category 4 2.84
1998 Score: 2.19 Mission 3 2.89
Current Score: 3.44 2004 Score: 3.22 Current Benchmarks
Standard Deviation: 0.99 2002 Score: 3.72 All Respondents: 3.29Number of Respondents: 141 2000 Score: 3.75 Size Category 4 3.54
1998 Score: 3.82 Mission 3 3.61
Current Score: 3.85 2004 Score: 3.87 Current Benchmarks
Standard Deviation: 0.75 2002 Score: 3.91 All Respondents: 3.73Number of Respondents: 140 2000 Score: 3.92 Size Category 4 3.86
1998 Score: 4.03 Mission 3 3.88
Page 28
Response: Strongly Agree Agree Neutral Disagree Strongly Disagree Don't Know/Not Applicable
Frequency: 7 45 31 40 18 0Percentage: 4.96% 31.91% 21.99% 28.37% 12.77% Not Available
Response: Strongly Agree Agree Neutral Disagree Strongly Disagree Don't Know/Not Applicable
Frequency: 1 23 37 51 25 5Percentage: .70% 16.20% 26.06% 35.92% 17.61% 3.52%
Response: Strongly Agree Agree Neutral Disagree Strongly Disagree Don't Know/Not Applicable
Frequency: 10 75 28 20 7 1Percentage: 7.09% 53.19% 19.86% 14.18% 4.96% .71%
Response: Strongly Agree Agree Neutral Disagree Strongly Disagree Don't Know/Not Applicable
Frequency: 18 93 21 6 2 0Percentage: 12.86% 66.43% 15.00% 4.29% 1.43% Not Available
F-32
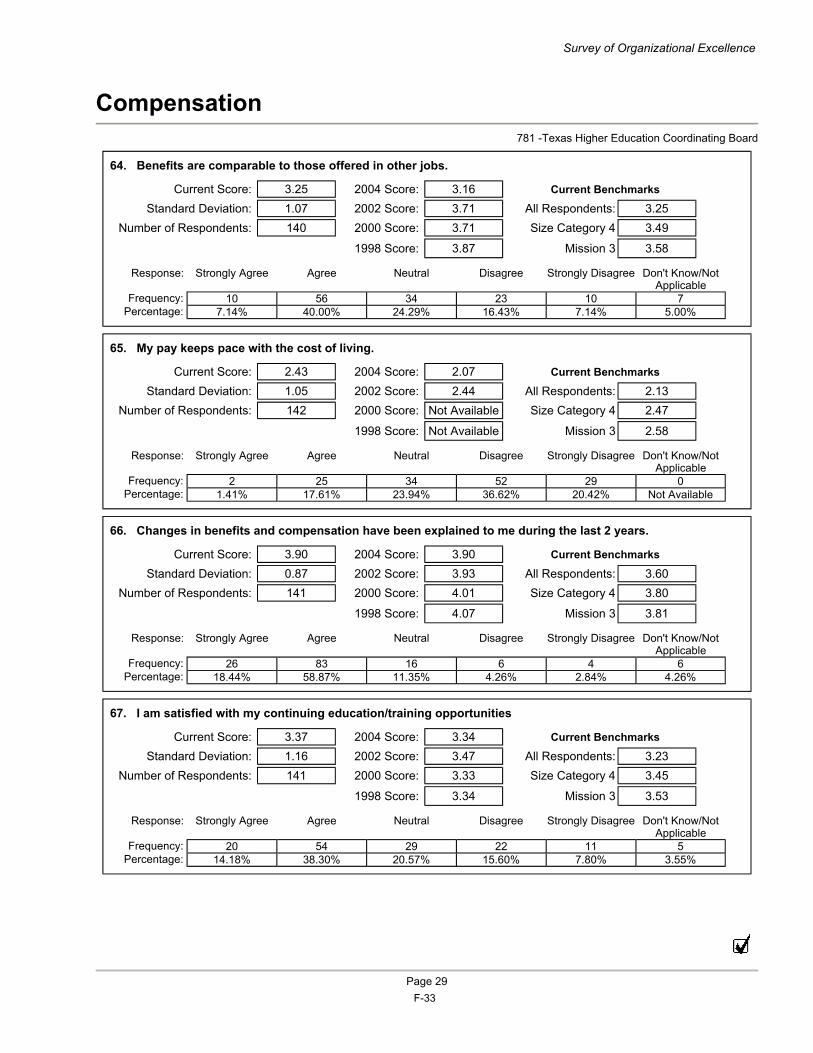
Compensation 781 -Texas Higher Education Coordinating Board
64. Benefits are comparable to those offered in other jobs.
65. My pay keeps pace with the cost of living.
66. Changes in benefits and compensation have been explained to me during the last 2 years.
67. I am satisfied with my continuing education/training opportunities
Survey of Organizational Excellence
Current Score: 3.25 2004 Score: 3.16 Current Benchmarks
Standard Deviation: 1.07 2002 Score: 3.71 All Respondents: 3.25Number of Respondents: 140 2000 Score: 3.71 Size Category 4 3.49
1998 Score: 3.87 Mission 3 3.58
Current Score: 2.43 2004 Score: 2.07 Current Benchmarks
Standard Deviation: 1.05 2002 Score: 2.44 All Respondents: 2.13Number of Respondents: 142 2000 Score: Not Available Size Category 4 2.47
1998 Score: Not Available Mission 3 2.58
Current Score: 3.90 2004 Score: 3.90 Current Benchmarks
Standard Deviation: 0.87 2002 Score: 3.93 All Respondents: 3.60Number of Respondents: 141 2000 Score: 4.01 Size Category 4 3.80
1998 Score: 4.07 Mission 3 3.81
Current Score: 3.37 2004 Score: 3.34 Current Benchmarks
Standard Deviation: 1.16 2002 Score: 3.47 All Respondents: 3.23Number of Respondents: 141 2000 Score: 3.33 Size Category 4 3.45
1998 Score: 3.34 Mission 3 3.53
Page 29
Response: Strongly Agree Agree Neutral Disagree Strongly Disagree Don't Know/Not Applicable
Frequency: 10 56 34 23 10 7Percentage: 7.14% 40.00% 24.29% 16.43% 7.14% 5.00%
Response: Strongly Agree Agree Neutral Disagree Strongly Disagree Don't Know/Not Applicable
Frequency: 2 25 34 52 29 0Percentage: 1.41% 17.61% 23.94% 36.62% 20.42% Not Available
Response: Strongly Agree Agree Neutral Disagree Strongly Disagree Don't Know/Not Applicable
Frequency: 26 83 16 6 4 6Percentage: 18.44% 58.87% 11.35% 4.26% 2.84% 4.26%
Response: Strongly Agree Agree Neutral Disagree Strongly Disagree Don't Know/Not Applicable
Frequency: 20 54 29 22 11 5Percentage: 14.18% 38.30% 20.57% 15.60% 7.80% 3.55%
F-33
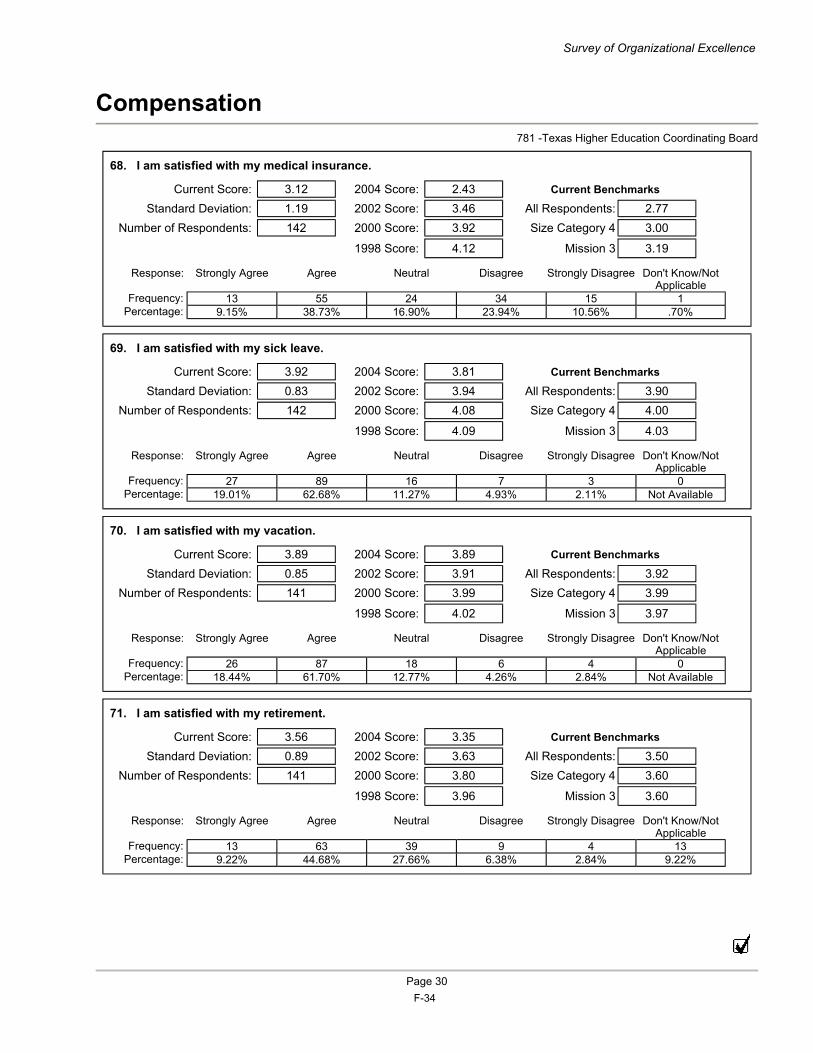
Compensation 781 -Texas Higher Education Coordinating Board
68. I am satisfied with my medical insurance.
69. I am satisfied with my sick leave.
70. I am satisfied with my vacation.
71. I am satisfied with my retirement.
Survey of Organizational Excellence
Current Score: 3.12 2004 Score: 2.43 Current Benchmarks
Standard Deviation: 1.19 2002 Score: 3.46 All Respondents: 2.77Number of Respondents: 142 2000 Score: 3.92 Size Category 4 3.00
1998 Score: 4.12 Mission 3 3.19
Current Score: 3.92 2004 Score: 3.81 Current Benchmarks
Standard Deviation: 0.83 2002 Score: 3.94 All Respondents: 3.90Number of Respondents: 142 2000 Score: 4.08 Size Category 4 4.00
1998 Score: 4.09 Mission 3 4.03
Current Score: 3.89 2004 Score: 3.89 Current Benchmarks
Standard Deviation: 0.85 2002 Score: 3.91 All Respondents: 3.92Number of Respondents: 141 2000 Score: 3.99 Size Category 4 3.99
1998 Score: 4.02 Mission 3 3.97
Current Score: 3.56 2004 Score: 3.35 Current Benchmarks
Standard Deviation: 0.89 2002 Score: 3.63 All Respondents: 3.50Number of Respondents: 141 2000 Score: 3.80 Size Category 4 3.60
1998 Score: 3.96 Mission 3 3.60
Page 30
Response: Strongly Agree Agree Neutral Disagree Strongly Disagree Don't Know/Not Applicable
Frequency: 13 55 24 34 15 1Percentage: 9.15% 38.73% 16.90% 23.94% 10.56% .70%
Response: Strongly Agree Agree Neutral Disagree Strongly Disagree Don't Know/Not Applicable
Frequency: 27 89 16 7 3 0Percentage: 19.01% 62.68% 11.27% 4.93% 2.11% Not Available
Response: Strongly Agree Agree Neutral Disagree Strongly Disagree Don't Know/Not Applicable
Frequency: 26 87 18 6 4 0Percentage: 18.44% 61.70% 12.77% 4.26% 2.84% Not Available
Response: Strongly Agree Agree Neutral Disagree Strongly Disagree Don't Know/Not Applicable
Frequency: 13 63 39 9 4 13Percentage: 9.22% 44.68% 27.66% 6.38% 2.84% 9.22%
F-34
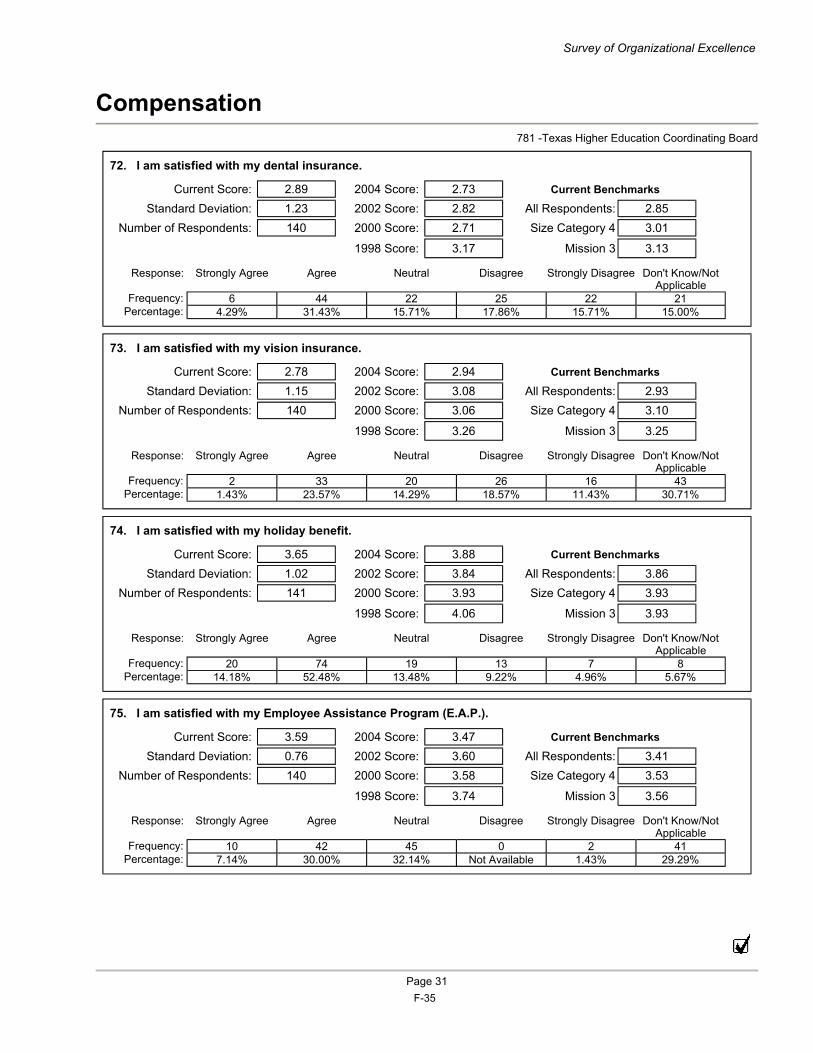
Compensation 781 -Texas Higher Education Coordinating Board
72. I am satisfied with my dental insurance.
73. I am satisfied with my vision insurance.
74. I am satisfied with my holiday benefit.
75. I am satisfied with my Employee Assistance Program (E.A.P.).
Survey of Organizational Excellence
Current Score: 2.89 2004 Score: 2.73 Current Benchmarks
Standard Deviation: 1.23 2002 Score: 2.82 All Respondents: 2.85Number of Respondents: 140 2000 Score: 2.71 Size Category 4 3.01
1998 Score: 3.17 Mission 3 3.13
Current Score: 2.78 2004 Score: 2.94 Current Benchmarks
Standard Deviation: 1.15 2002 Score: 3.08 All Respondents: 2.93Number of Respondents: 140 2000 Score: 3.06 Size Category 4 3.10
1998 Score: 3.26 Mission 3 3.25
Current Score: 3.65 2004 Score: 3.88 Current Benchmarks
Standard Deviation: 1.02 2002 Score: 3.84 All Respondents: 3.86Number of Respondents: 141 2000 Score: 3.93 Size Category 4 3.93
1998 Score: 4.06 Mission 3 3.93
Current Score: 3.59 2004 Score: 3.47 Current Benchmarks
Standard Deviation: 0.76 2002 Score: 3.60 All Respondents: 3.41Number of Respondents: 140 2000 Score: 3.58 Size Category 4 3.53
1998 Score: 3.74 Mission 3 3.56
Page 31
Response: Strongly Agree Agree Neutral Disagree Strongly Disagree Don't Know/Not Applicable
Frequency: 6 44 22 25 22 21Percentage: 4.29% 31.43% 15.71% 17.86% 15.71% 15.00%
Response: Strongly Agree Agree Neutral Disagree Strongly Disagree Don't Know/Not Applicable
Frequency: 2 33 20 26 16 43Percentage: 1.43% 23.57% 14.29% 18.57% 11.43% 30.71%
Response: Strongly Agree Agree Neutral Disagree Strongly Disagree Don't Know/Not Applicable
Frequency: 20 74 19 13 7 8Percentage: 14.18% 52.48% 13.48% 9.22% 4.96% 5.67%
Response: Strongly Agree Agree Neutral Disagree Strongly Disagree Don't Know/Not Applicable
Frequency: 10 42 45 0 2 41Percentage: 7.14% 30.00% 32.14% Not Available 1.43% 29.29%
F-35
Organization Wide 781 -Texas Higher Education Coordinating Board
For the following section employees are asked to indicate how strongly they agree or disagree that the statement describes the organization as a whole. Possible responses include: (1) Strongly Disagree, (2) Disagree, (3) Feel Neutral, (4) Agree, (5) Strongly Disagree and (6) Don't Know/ Not Applicable. Any survey item with an average (mean) score above the neutral midpoint of "3.0" suggests that employees perceive the issue more positively than negatively. Scores of "4.0" or higher indicate areas of substantial strength for the organization. Conversely, scores below "3.0" are viewed more negatively by employees. Questions that receive below a "2.0" should be a significant source of concern for the organization and receive immediate attention.
Survey of Organizational Excellence
Page 32 F-36
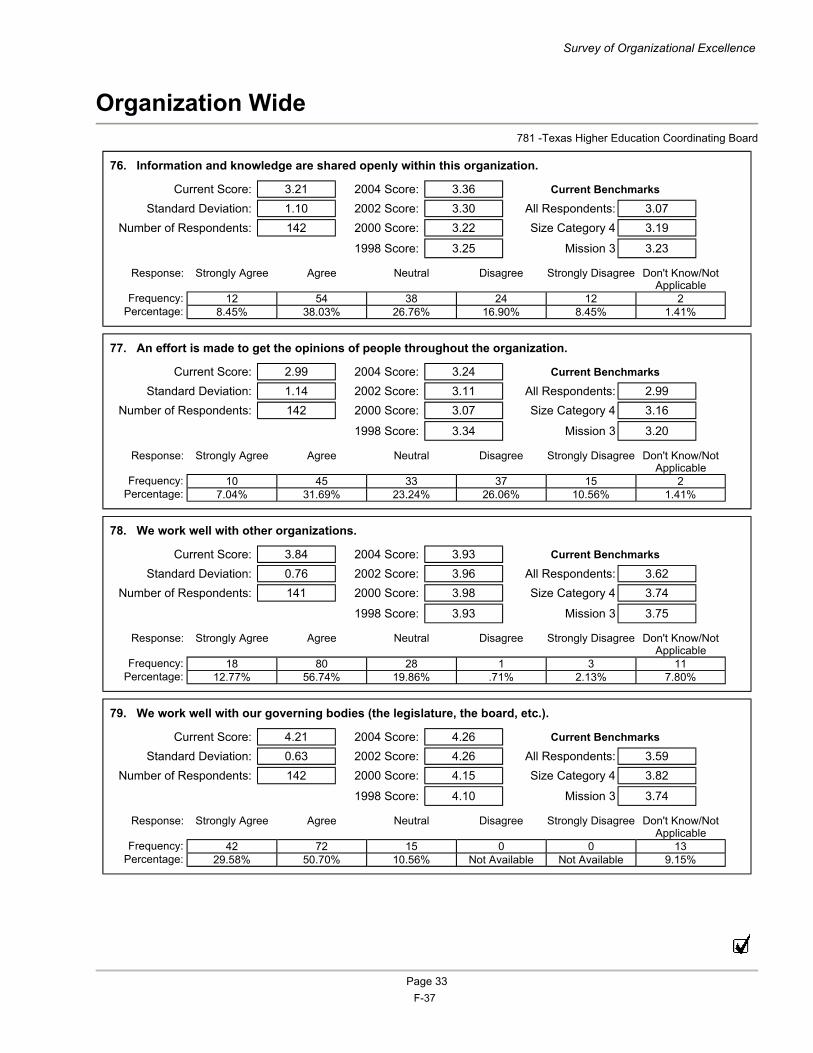
Organization Wide 781 -Texas Higher Education Coordinating Board
76. Information and knowledge are shared openly within this organization.
77. An effort is made to get the opinions of people throughout the organization.
78. We work well with other organizations.
79. We work well with our governing bodies (the legislature, the board, etc.).
Survey of Organizational Excellence
Current Score: 3.21 2004 Score: 3.36 Current Benchmarks
Standard Deviation: 1.10 2002 Score: 3.30 All Respondents: 3.07Number of Respondents: 142 2000 Score: 3.22 Size Category 4 3.19
1998 Score: 3.25 Mission 3 3.23
Current Score: 2.99 2004 Score: 3.24 Current Benchmarks
Standard Deviation: 1.14 2002 Score: 3.11 All Respondents: 2.99Number of Respondents: 142 2000 Score: 3.07 Size Category 4 3.16
1998 Score: 3.34 Mission 3 3.20
Current Score: 3.84 2004 Score: 3.93 Current Benchmarks
Standard Deviation: 0.76 2002 Score: 3.96 All Respondents: 3.62Number of Respondents: 141 2000 Score: 3.98 Size Category 4 3.74
1998 Score: 3.93 Mission 3 3.75
Current Score: 4.21 2004 Score: 4.26 Current Benchmarks
Standard Deviation: 0.63 2002 Score: 4.26 All Respondents: 3.59Number of Respondents: 142 2000 Score: 4.15 Size Category 4 3.82
1998 Score: 4.10 Mission 3 3.74
Page 33
Response: Strongly Agree Agree Neutral Disagree Strongly Disagree Don't Know/Not Applicable
Frequency: 12 54 38 24 12 2Percentage: 8.45% 38.03% 26.76% 16.90% 8.45% 1.41%
Response: Strongly Agree Agree Neutral Disagree Strongly Disagree Don't Know/Not Applicable
Frequency: 10 45 33 37 15 2Percentage: 7.04% 31.69% 23.24% 26.06% 10.56% 1.41%
Response: Strongly Agree Agree Neutral Disagree Strongly Disagree Don't Know/Not Applicable
Frequency: 18 80 28 1 3 11Percentage: 12.77% 56.74% 19.86% .71% 2.13% 7.80%
Response: Strongly Agree Agree Neutral Disagree Strongly Disagree Don't Know/Not Applicable
Frequency: 42 72 15 0 0 13Percentage: 29.58% 50.70% 10.56% Not Available Not Available 9.15%
F-37
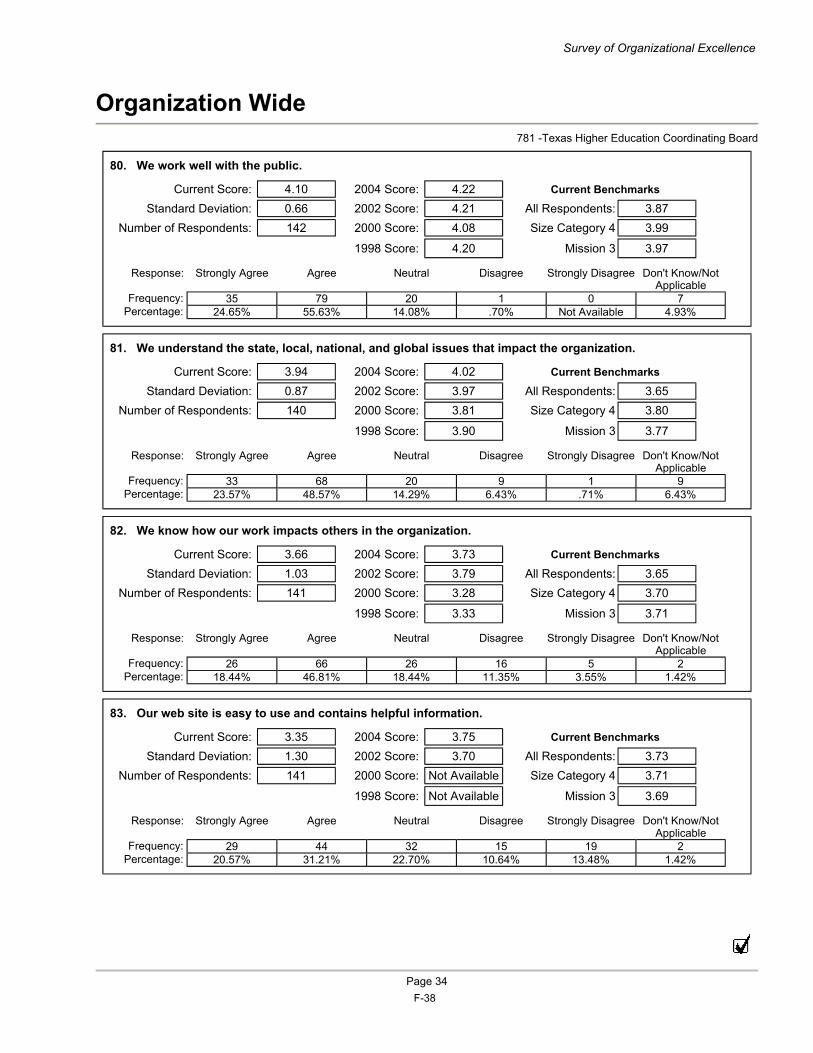
Organization Wide 781 -Texas Higher Education Coordinating Board
80. We work well with the public.
81. We understand the state, local, national, and global issues that impact the organization.
82. We know how our work impacts others in the organization.
83. Our web site is easy to use and contains helpful information.
Survey of Organizational Excellence
Current Score: 4.10 2004 Score: 4.22 Current Benchmarks
Standard Deviation: 0.66 2002 Score: 4.21 All Respondents: 3.87Number of Respondents: 142 2000 Score: 4.08 Size Category 4 3.99
1998 Score: 4.20 Mission 3 3.97
Current Score: 3.94 2004 Score: 4.02 Current Benchmarks
Standard Deviation: 0.87 2002 Score: 3.97 All Respondents: 3.65Number of Respondents: 140 2000 Score: 3.81 Size Category 4 3.80
1998 Score: 3.90 Mission 3 3.77
Current Score: 3.66 2004 Score: 3.73 Current Benchmarks
Standard Deviation: 1.03 2002 Score: 3.79 All Respondents: 3.65Number of Respondents: 141 2000 Score: 3.28 Size Category 4 3.70
1998 Score: 3.33 Mission 3 3.71
Current Score: 3.35 2004 Score: 3.75 Current Benchmarks
Standard Deviation: 1.30 2002 Score: 3.70 All Respondents: 3.73Number of Respondents: 141 2000 Score: Not Available Size Category 4 3.71
1998 Score: Not Available Mission 3 3.69
Page 34
Response: Strongly Agree Agree Neutral Disagree Strongly Disagree Don't Know/Not Applicable
Frequency: 35 79 20 1 0 7Percentage: 24.65% 55.63% 14.08% .70% Not Available 4.93%
Response: Strongly Agree Agree Neutral Disagree Strongly Disagree Don't Know/Not Applicable
Frequency: 33 68 20 9 1 9Percentage: 23.57% 48.57% 14.29% 6.43% .71% 6.43%
Response: Strongly Agree Agree Neutral Disagree Strongly Disagree Don't Know/Not Applicable
Frequency: 26 66 26 16 5 2Percentage: 18.44% 46.81% 18.44% 11.35% 3.55% 1.42%
Response: Strongly Agree Agree Neutral Disagree Strongly Disagree Don't Know/Not Applicable
Frequency: 29 44 32 15 19 2Percentage: 20.57% 31.21% 22.70% 10.64% 13.48% 1.42%
F-38
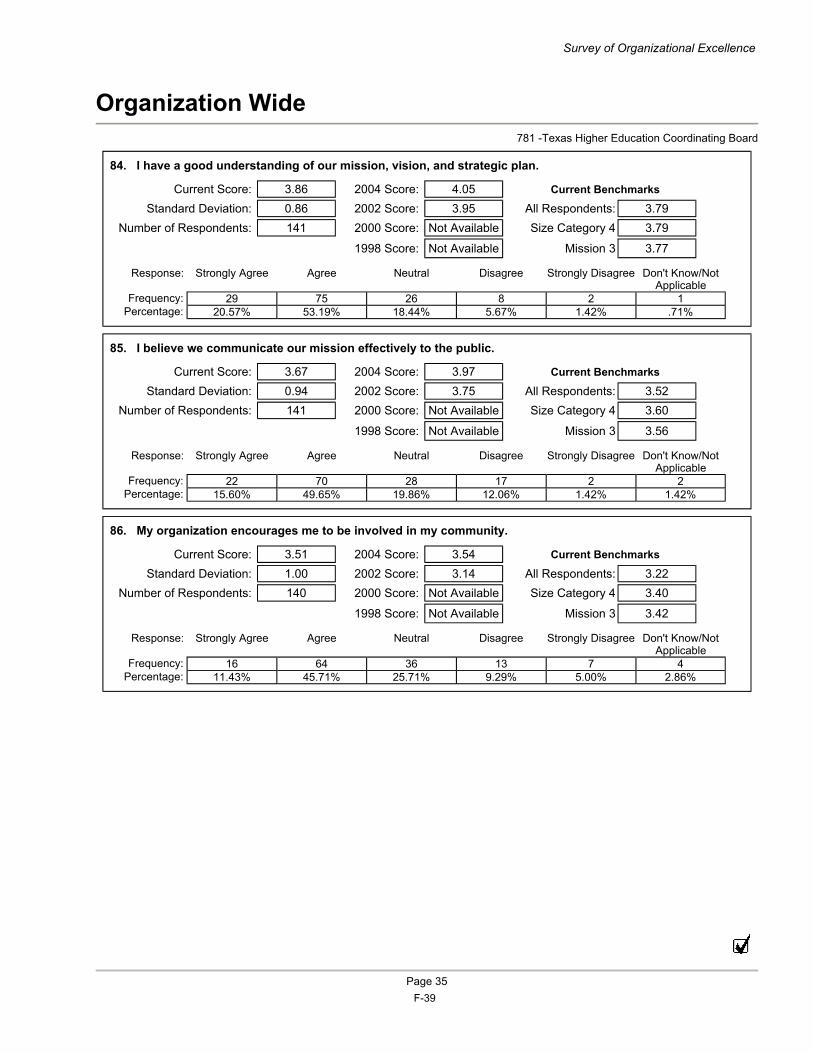
Organization Wide 781 -Texas Higher Education Coordinating Board
84. I have a good understanding of our mission, vision, and strategic plan.
85. I believe we communicate our mission effectively to the public.
86. My organization encourages me to be involved in my community.
Survey of Organizational Excellence
Current Score: 3.86 2004 Score: 4.05 Current Benchmarks
Standard Deviation: 0.86 2002 Score: 3.95 All Respondents: 3.79Number of Respondents: 141 2000 Score: Not Available Size Category 4 3.79
1998 Score: Not Available Mission 3 3.77
Current Score: 3.67 2004 Score: 3.97 Current Benchmarks
Standard Deviation: 0.94 2002 Score: 3.75 All Respondents: 3.52Number of Respondents: 141 2000 Score: Not Available Size Category 4 3.60
1998 Score: Not Available Mission 3 3.56
Current Score: 3.51 2004 Score: 3.54 Current Benchmarks
Standard Deviation: 1.00 2002 Score: 3.14 All Respondents: 3.22Number of Respondents: 140 2000 Score: Not Available Size Category 4 3.40
1998 Score: Not Available Mission 3 3.42
Page 35
Response: Strongly Agree Agree Neutral Disagree Strongly Disagree Don't Know/Not Applicable
Frequency: 29 75 26 8 2 1Percentage: 20.57% 53.19% 18.44% 5.67% 1.42% .71%
Response: Strongly Agree Agree Neutral Disagree Strongly Disagree Don't Know/Not Applicable
Frequency: 22 70 28 17 2 2Percentage: 15.60% 49.65% 19.86% 12.06% 1.42% 1.42%
Response: Strongly Agree Agree Neutral Disagree Strongly Disagree Don't Know/Not Applicable
Frequency: 16 64 36 13 7 4Percentage: 11.43% 45.71% 25.71% 9.29% 5.00% 2.86%
F-39
Additional Items 781 -Texas Higher Education Coordinating Board
Organizations participating in the Survey are invited to submit up to 20 additional items for inclusion in the Survey. These items are printed on an insert and included in each employee's survey packet. Please refer to the insert that has been included later in this binder for more information on additional items submitted by this organization.
*Additional Items are not included if none were submitted.
Survey of Organizational Excellence
Page 36 F-40
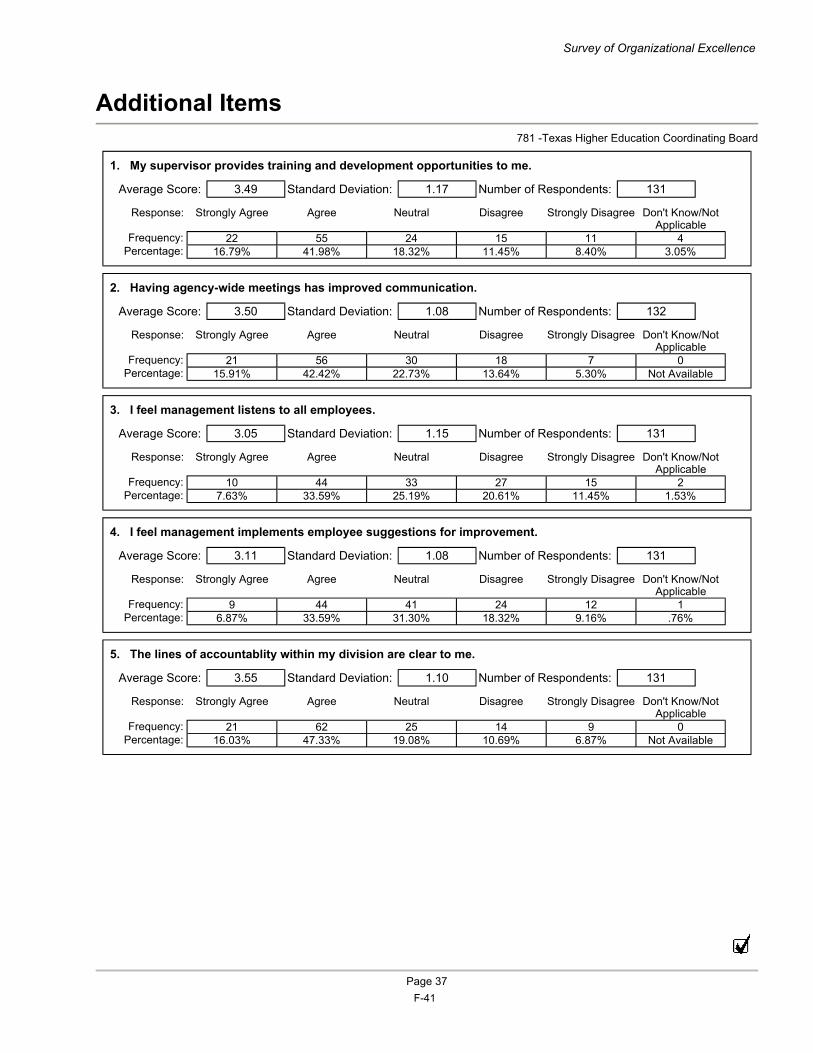
Additional Items 781 -Texas Higher Education Coordinating Board
1. My supervisor provides training and development opportunities to me.
2. Having agency-wide meetings has improved communication.
3. I feel management listens to all employees.
4. I feel management implements employee suggestions for improvement.
5. The lines of accountablity within my division are clear to me.
Survey of Organizational Excellence
Average Score: 3.49 Standard Deviation: 1.17 Number of Respondents: 131
Average Score: 3.50 Standard Deviation: 1.08 Number of Respondents: 132
Average Score: 3.05 Standard Deviation: 1.15 Number of Respondents: 131
Average Score: 3.11 Standard Deviation: 1.08 Number of Respondents: 131
Average Score: 3.55 Standard Deviation: 1.10 Number of Respondents: 131
Page 37
Response: Strongly Agree Agree Neutral Disagree Strongly Disagree Don't Know/Not Applicable
Frequency: 22 55 24 15 11 4Percentage: 16.79% 41.98% 18.32% 11.45% 8.40% 3.05%
Response: Strongly Agree Agree Neutral Disagree Strongly Disagree Don't Know/Not Applicable
Frequency: 21 56 30 18 7 0Percentage: 15.91% 42.42% 22.73% 13.64% 5.30% Not Available
Response: Strongly Agree Agree Neutral Disagree Strongly Disagree Don't Know/Not Applicable
Frequency: 10 44 33 27 15 2Percentage: 7.63% 33.59% 25.19% 20.61% 11.45% 1.53%
Response: Strongly Agree Agree Neutral Disagree Strongly Disagree Don't Know/Not Applicable
Frequency: 9 44 41 24 12 1Percentage: 6.87% 33.59% 31.30% 18.32% 9.16% .76%
Response: Strongly Agree Agree Neutral Disagree Strongly Disagree Don't Know/Not Applicable
Frequency: 21 62 25 14 9 0Percentage: 16.03% 47.33% 19.08% 10.69% 6.87% Not Available
F-41
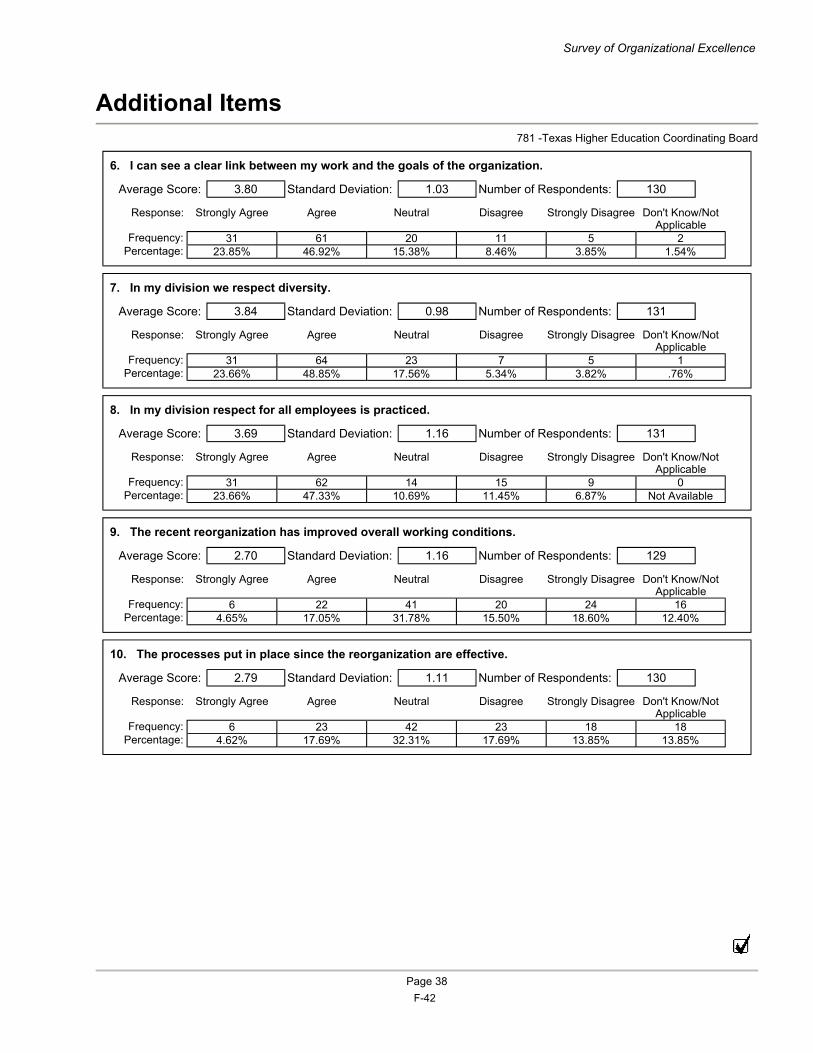
Additional Items 781 -Texas Higher Education Coordinating Board
6. I can see a clear link between my work and the goals of the organization.
7. In my division we respect diversity.
8. In my division respect for all employees is practiced.
9. The recent reorganization has improved overall working conditions.
10. The processes put in place since the reorganization are effective.
Survey of Organizational Excellence
Average Score: 3.80 Standard Deviation: 1.03 Number of Respondents: 130
Average Score: 3.84 Standard Deviation: 0.98 Number of Respondents: 131
Average Score: 3.69 Standard Deviation: 1.16 Number of Respondents: 131
Average Score: 2.70 Standard Deviation: 1.16 Number of Respondents: 129
Average Score: 2.79 Standard Deviation: 1.11 Number of Respondents: 130
Page 38
Response: Strongly Agree Agree Neutral Disagree Strongly Disagree Don't Know/Not Applicable
Frequency: 31 61 20 11 5 2Percentage: 23.85% 46.92% 15.38% 8.46% 3.85% 1.54%
Response: Strongly Agree Agree Neutral Disagree Strongly Disagree Don't Know/Not Applicable
Frequency: 31 64 23 7 5 1Percentage: 23.66% 48.85% 17.56% 5.34% 3.82% .76%
Response: Strongly Agree Agree Neutral Disagree Strongly Disagree Don't Know/Not Applicable
Frequency: 31 62 14 15 9 0Percentage: 23.66% 47.33% 10.69% 11.45% 6.87% Not Available
Response: Strongly Agree Agree Neutral Disagree Strongly Disagree Don't Know/Not Applicable
Frequency: 6 22 41 20 24 16Percentage: 4.65% 17.05% 31.78% 15.50% 18.60% 12.40%
Response: Strongly Agree Agree Neutral Disagree Strongly Disagree Don't Know/Not Applicable
Frequency: 6 23 42 23 18 18Percentage: 4.62% 17.69% 32.31% 17.69% 13.85% 13.85%
F-42
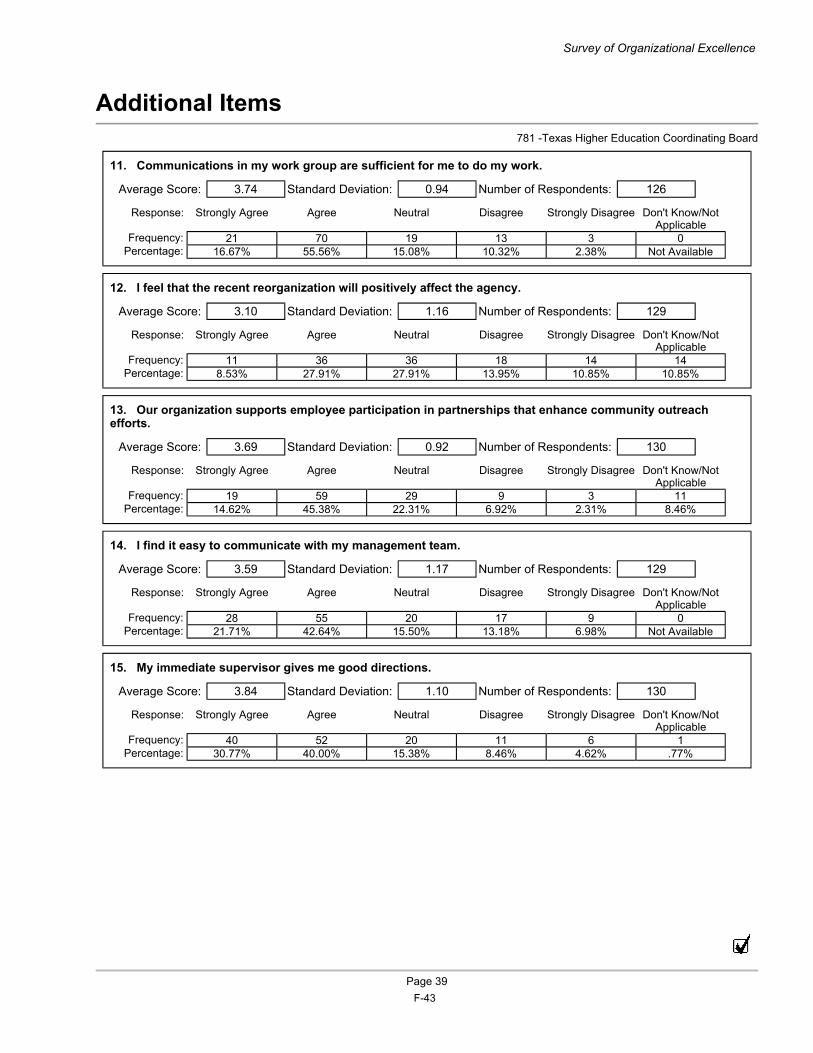
Additional Items 781 -Texas Higher Education Coordinating Board
11. Communications in my work group are sufficient for me to do my work.
12. I feel that the recent reorganization will positively affect the agency.
13. Our organization supports employee participation in partnerships that enhance community outreach efforts.
14. I find it easy to communicate with my management team.
15. My immediate supervisor gives me good directions.
Survey of Organizational Excellence
Average Score: 3.74 Standard Deviation: 0.94 Number of Respondents: 126
Average Score: 3.10 Standard Deviation: 1.16 Number of Respondents: 129
Average Score: 3.69 Standard Deviation: 0.92 Number of Respondents: 130
Average Score: 3.59 Standard Deviation: 1.17 Number of Respondents: 129
Average Score: 3.84 Standard Deviation: 1.10 Number of Respondents: 130
Page 39
Response: Strongly Agree Agree Neutral Disagree Strongly Disagree Don't Know/Not Applicable
Frequency: 21 70 19 13 3 0Percentage: 16.67% 55.56% 15.08% 10.32% 2.38% Not Available
Response: Strongly Agree Agree Neutral Disagree Strongly Disagree Don't Know/Not Applicable
Frequency: 11 36 36 18 14 14Percentage: 8.53% 27.91% 27.91% 13.95% 10.85% 10.85%
Response: Strongly Agree Agree Neutral Disagree Strongly Disagree Don't Know/Not Applicable
Frequency: 19 59 29 9 3 11Percentage: 14.62% 45.38% 22.31% 6.92% 2.31% 8.46%
Response: Strongly Agree Agree Neutral Disagree Strongly Disagree Don't Know/Not Applicable
Frequency: 28 55 20 17 9 0Percentage: 21.71% 42.64% 15.50% 13.18% 6.98% Not Available
Response: Strongly Agree Agree Neutral Disagree Strongly Disagree Don't Know/Not Applicable
Frequency: 40 52 20 11 6 1Percentage: 30.77% 40.00% 15.38% 8.46% 4.62% .77%
F-43
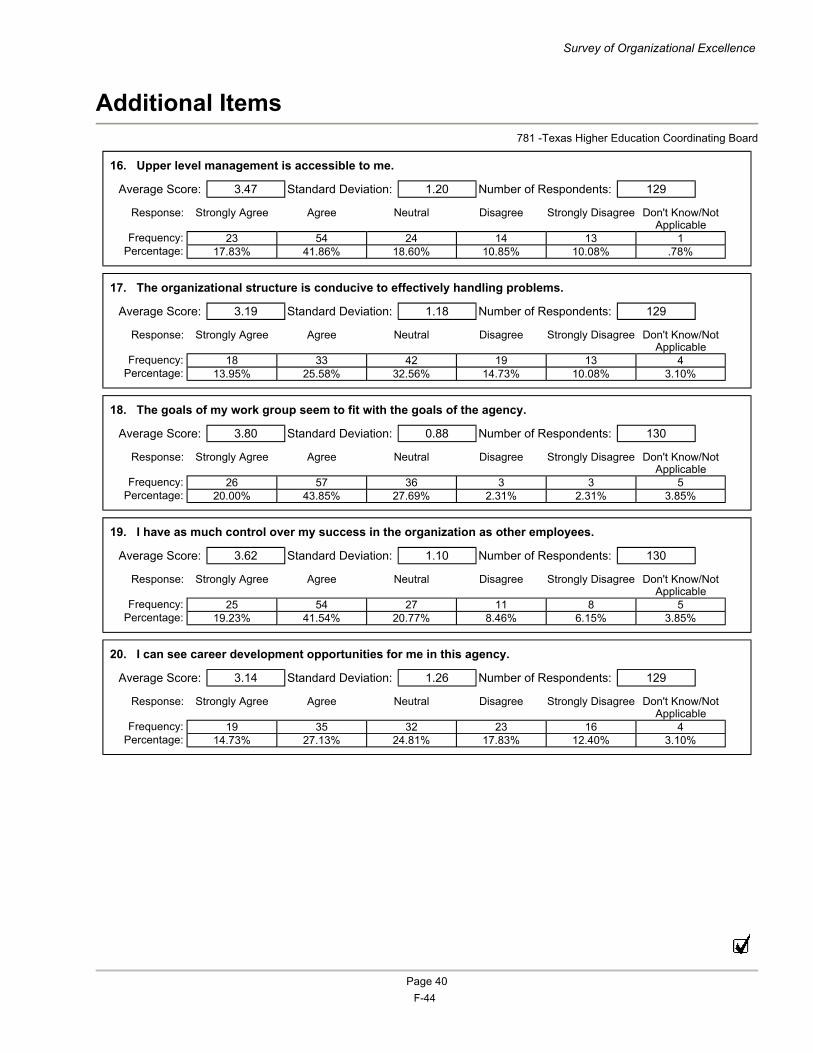
Additional Items 781 -Texas Higher Education Coordinating Board
16. Upper level management is accessible to me.
17. The organizational structure is conducive to effectively handling problems.
18. The goals of my work group seem to fit with the goals of the agency.
19. I have as much control over my success in the organization as other employees.
20. I can see career development opportunities for me in this agency.
Survey of Organizational Excellence
Average Score: 3.47 Standard Deviation: 1.20 Number of Respondents: 129
Average Score: 3.19 Standard Deviation: 1.18 Number of Respondents: 129
Average Score: 3.80 Standard Deviation: 0.88 Number of Respondents: 130
Average Score: 3.62 Standard Deviation: 1.10 Number of Respondents: 130
Average Score: 3.14 Standard Deviation: 1.26 Number of Respondents: 129
Page 40
Response: Strongly Agree Agree Neutral Disagree Strongly Disagree Don't Know/Not Applicable
Frequency: 23 54 24 14 13 1Percentage: 17.83% 41.86% 18.60% 10.85% 10.08% .78%
Response: Strongly Agree Agree Neutral Disagree Strongly Disagree Don't Know/Not Applicable
Frequency: 18 33 42 19 13 4Percentage: 13.95% 25.58% 32.56% 14.73% 10.08% 3.10%
Response: Strongly Agree Agree Neutral Disagree Strongly Disagree Don't Know/Not Applicable
Frequency: 26 57 36 3 3 5Percentage: 20.00% 43.85% 27.69% 2.31% 2.31% 3.85%
Response: Strongly Agree Agree Neutral Disagree Strongly Disagree Don't Know/Not Applicable
Frequency: 25 54 27 11 8 5Percentage: 19.23% 41.54% 20.77% 8.46% 6.15% 3.85%
Response: Strongly Agree Agree Neutral Disagree Strongly Disagree Don't Know/Not Applicable
Frequency: 19 35 32 23 16 4Percentage: 14.73% 27.13% 24.81% 17.83% 12.40% 3.10%
F-44
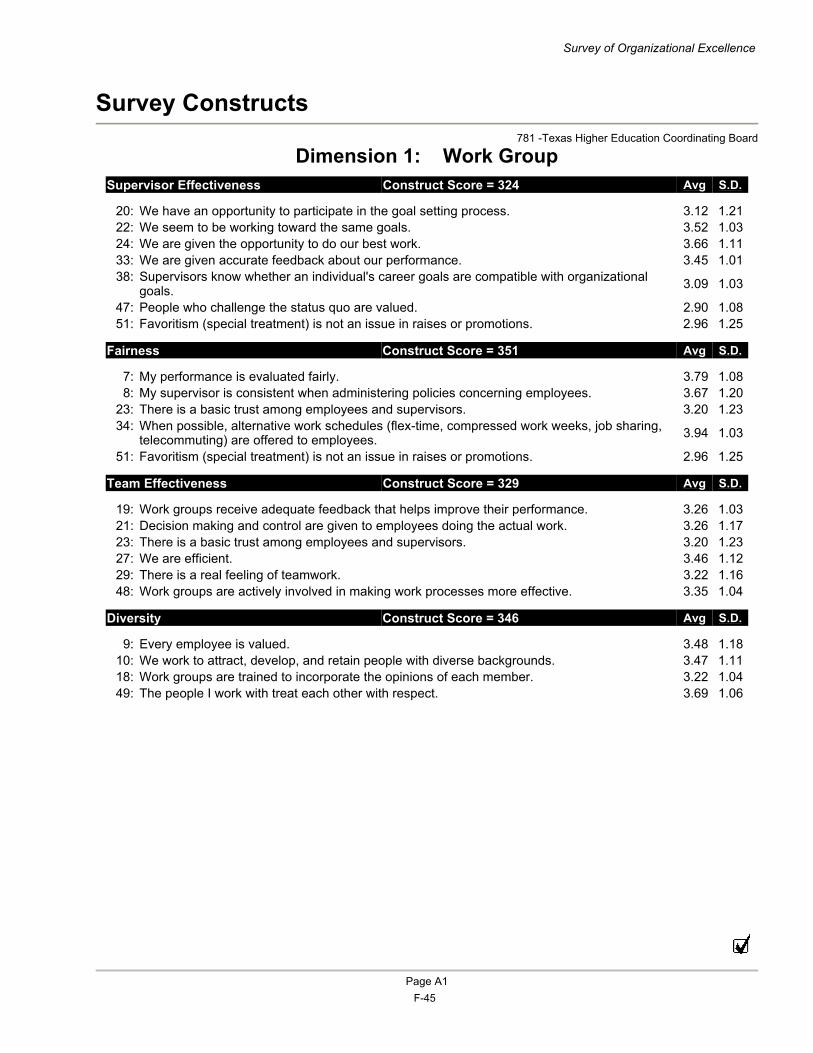
Survey Constructs 781 -Texas Higher Education Coordinating Board
Dimension 1: Work Group
Survey of Organizational Excellence
Supervisor Effectiveness Construct Score = 324 Avg S.D.
20: We have an opportunity to participate in the goal setting process. 3.12 1.2122: We seem to be working toward the same goals. 3.52 1.0324: We are given the opportunity to do our best work. 3.66 1.1133: We are given accurate feedback about our performance. 3.45 1.0138: Supervisors know whether an individual's career goals are compatible with organizational
goals. 3.09 1.03
47: People who challenge the status quo are valued. 2.90 1.0851: Favoritism (special treatment) is not an issue in raises or promotions. 2.96 1.25
Fairness Construct Score = 351 Avg S.D.
7: My performance is evaluated fairly. 3.79 1.088: My supervisor is consistent when administering policies concerning employees. 3.67 1.20
23: There is a basic trust among employees and supervisors. 3.20 1.2334: When possible, alternative work schedules (flex-time, compressed work weeks, job sharing,
telecommuting) are offered to employees. 3.94 1.03
51: Favoritism (special treatment) is not an issue in raises or promotions. 2.96 1.25
Team Effectiveness Construct Score = 329 Avg S.D.
19: Work groups receive adequate feedback that helps improve their performance. 3.26 1.0321: Decision making and control are given to employees doing the actual work. 3.26 1.1723: There is a basic trust among employees and supervisors. 3.20 1.2327: We are efficient. 3.46 1.1229: There is a real feeling of teamwork. 3.22 1.1648: Work groups are actively involved in making work processes more effective. 3.35 1.04
Diversity Construct Score = 346 Avg S.D.
9: Every employee is valued. 3.48 1.1810: We work to attract, develop, and retain people with diverse backgrounds. 3.47 1.1118: Work groups are trained to incorporate the opinions of each member. 3.22 1.0449: The people I work with treat each other with respect. 3.69 1.06
Page A1 F-45
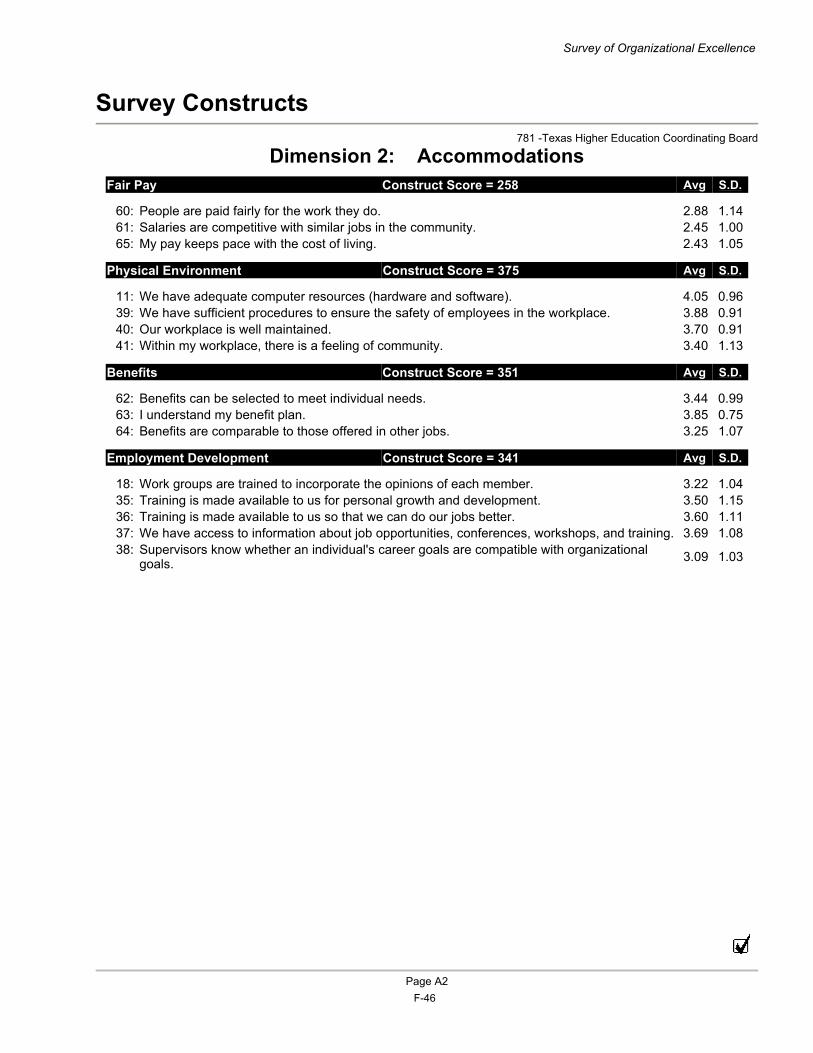
Survey Constructs 781 -Texas Higher Education Coordinating Board
Dimension 2: Accommodations
Survey of Organizational Excellence
Fair Pay Construct Score = 258 Avg S.D.
60: People are paid fairly for the work they do. 2.88 1.1461: Salaries are competitive with similar jobs in the community. 2.45 1.0065: My pay keeps pace with the cost of living. 2.43 1.05
Physical Environment Construct Score = 375 Avg S.D.
11: We have adequate computer resources (hardware and software). 4.05 0.9639: We have sufficient procedures to ensure the safety of employees in the workplace. 3.88 0.9140: Our workplace is well maintained. 3.70 0.9141: Within my workplace, there is a feeling of community. 3.40 1.13
Benefits Construct Score = 351 Avg S.D.
62: Benefits can be selected to meet individual needs. 3.44 0.9963: I understand my benefit plan. 3.85 0.7564: Benefits are comparable to those offered in other jobs. 3.25 1.07
Employment Development Construct Score = 341 Avg S.D.
18: Work groups are trained to incorporate the opinions of each member. 3.22 1.0435: Training is made available to us for personal growth and development. 3.50 1.1536: Training is made available to us so that we can do our jobs better. 3.60 1.1137: We have access to information about job opportunities, conferences, workshops, and training. 3.69 1.0838: Supervisors know whether an individual's career goals are compatible with organizational
goals. 3.09 1.03
Page A2 F-46
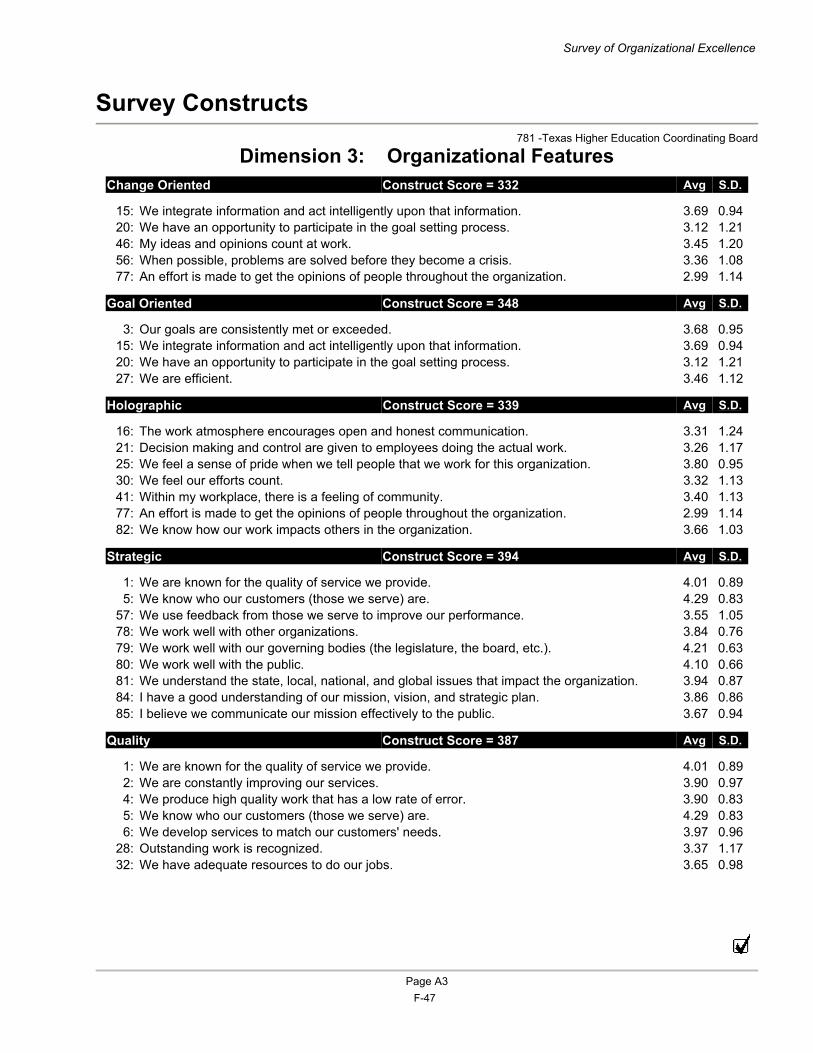
Survey Constructs 781 -Texas Higher Education Coordinating Board
Dimension 3: Organizational Features
Survey of Organizational Excellence
Change Oriented Construct Score = 332 Avg S.D.
15: We integrate information and act intelligently upon that information. 3.69 0.9420: We have an opportunity to participate in the goal setting process. 3.12 1.2146: My ideas and opinions count at work. 3.45 1.2056: When possible, problems are solved before they become a crisis. 3.36 1.0877: An effort is made to get the opinions of people throughout the organization. 2.99 1.14
Goal Oriented Construct Score = 348 Avg S.D.
3: Our goals are consistently met or exceeded. 3.68 0.9515: We integrate information and act intelligently upon that information. 3.69 0.9420: We have an opportunity to participate in the goal setting process. 3.12 1.2127: We are efficient. 3.46 1.12
Holographic Construct Score = 339 Avg S.D.
16: The work atmosphere encourages open and honest communication. 3.31 1.2421: Decision making and control are given to employees doing the actual work. 3.26 1.1725: We feel a sense of pride when we tell people that we work for this organization. 3.80 0.9530: We feel our efforts count. 3.32 1.1341: Within my workplace, there is a feeling of community. 3.40 1.1377: An effort is made to get the opinions of people throughout the organization. 2.99 1.1482: We know how our work impacts others in the organization. 3.66 1.03
Strategic Construct Score = 394 Avg S.D.
1: We are known for the quality of service we provide. 4.01 0.895: We know who our customers (those we serve) are. 4.29 0.83
57: We use feedback from those we serve to improve our performance. 3.55 1.0578: We work well with other organizations. 3.84 0.7679: We work well with our governing bodies (the legislature, the board, etc.). 4.21 0.6380: We work well with the public. 4.10 0.6681: We understand the state, local, national, and global issues that impact the organization. 3.94 0.8784: I have a good understanding of our mission, vision, and strategic plan. 3.86 0.8685: I believe we communicate our mission effectively to the public. 3.67 0.94
Quality Construct Score = 387 Avg S.D.
1: We are known for the quality of service we provide. 4.01 0.892: We are constantly improving our services. 3.90 0.974: We produce high quality work that has a low rate of error. 3.90 0.835: We know who our customers (those we serve) are. 4.29 0.836: We develop services to match our customers' needs. 3.97 0.96
28: Outstanding work is recognized. 3.37 1.1732: We have adequate resources to do our jobs. 3.65 0.98
Page A3 F-47
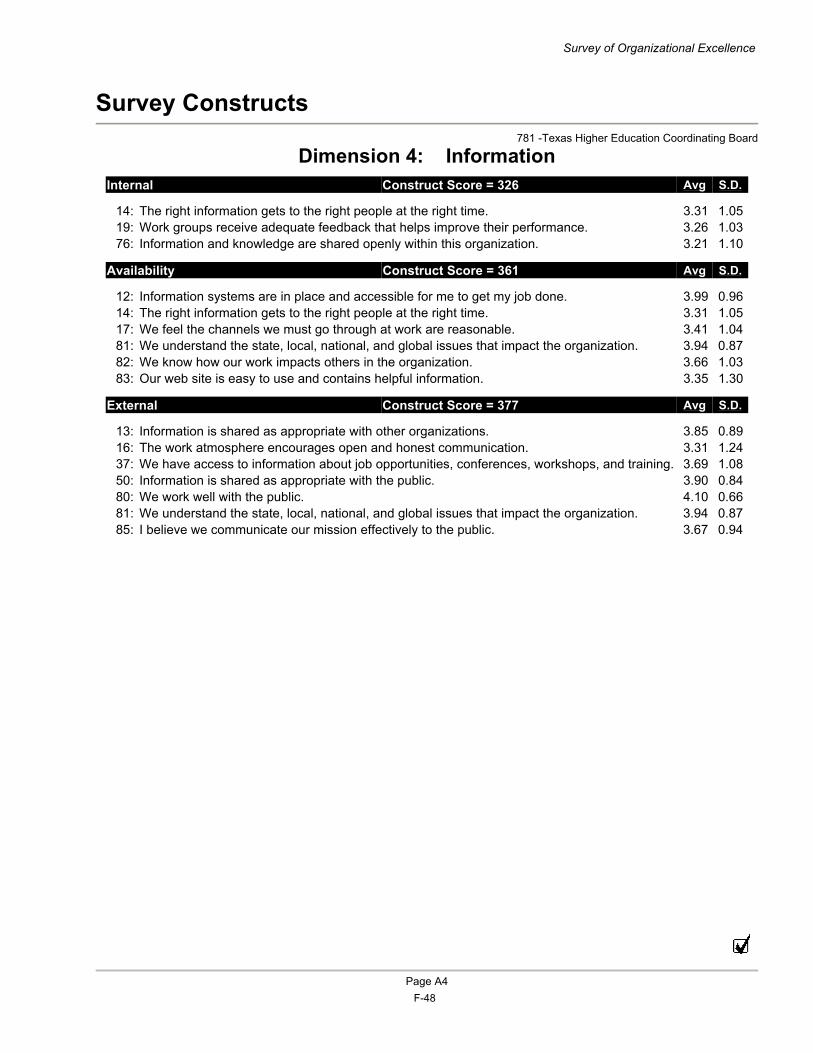
Survey Constructs 781 -Texas Higher Education Coordinating Board
Dimension 4: Information
Survey of Organizational Excellence
Internal Construct Score = 326 Avg S.D.
14: The right information gets to the right people at the right time. 3.31 1.0519: Work groups receive adequate feedback that helps improve their performance. 3.26 1.0376: Information and knowledge are shared openly within this organization. 3.21 1.10
Availability Construct Score = 361 Avg S.D.
12: Information systems are in place and accessible for me to get my job done. 3.99 0.9614: The right information gets to the right people at the right time. 3.31 1.0517: We feel the channels we must go through at work are reasonable. 3.41 1.0481: We understand the state, local, national, and global issues that impact the organization. 3.94 0.8782: We know how our work impacts others in the organization. 3.66 1.0383: Our web site is easy to use and contains helpful information. 3.35 1.30
External Construct Score = 377 Avg S.D.
13: Information is shared as appropriate with other organizations. 3.85 0.8916: The work atmosphere encourages open and honest communication. 3.31 1.2437: We have access to information about job opportunities, conferences, workshops, and training. 3.69 1.0850: Information is shared as appropriate with the public. 3.90 0.8480: We work well with the public. 4.10 0.6681: We understand the state, local, national, and global issues that impact the organization. 3.94 0.8785: I believe we communicate our mission effectively to the public. 3.67 0.94
Page A4 F-48
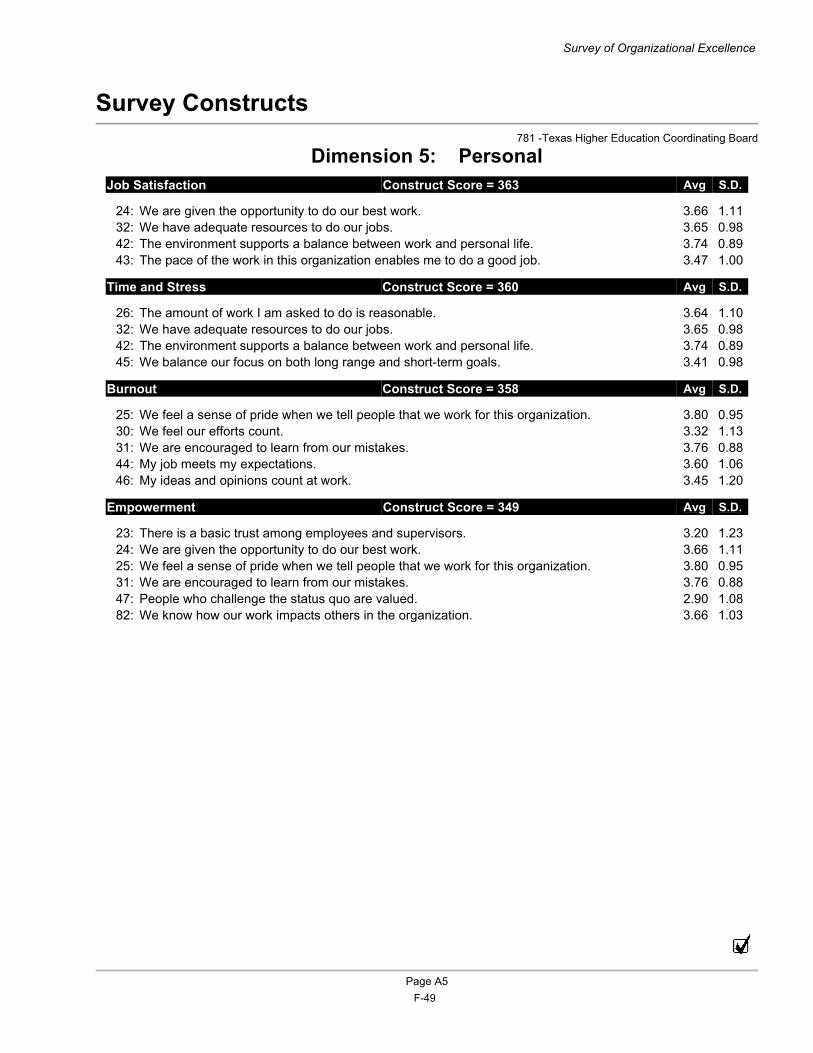
Survey Constructs 781 -Texas Higher Education Coordinating Board
Dimension 5: Personal
Survey of Organizational Excellence
Job Satisfaction Construct Score = 363 Avg S.D.
24: We are given the opportunity to do our best work. 3.66 1.1132: We have adequate resources to do our jobs. 3.65 0.9842: The environment supports a balance between work and personal life. 3.74 0.8943: The pace of the work in this organization enables me to do a good job. 3.47 1.00
Time and Stress Construct Score = 360 Avg S.D.
26: The amount of work I am asked to do is reasonable. 3.64 1.1032: We have adequate resources to do our jobs. 3.65 0.9842: The environment supports a balance between work and personal life. 3.74 0.8945: We balance our focus on both long range and short-term goals. 3.41 0.98
Burnout Construct Score = 358 Avg S.D.
25: We feel a sense of pride when we tell people that we work for this organization. 3.80 0.9530: We feel our efforts count. 3.32 1.1331: We are encouraged to learn from our mistakes. 3.76 0.8844: My job meets my expectations. 3.60 1.0646: My ideas and opinions count at work. 3.45 1.20
Empowerment Construct Score = 349 Avg S.D.
23: There is a basic trust among employees and supervisors. 3.20 1.2324: We are given the opportunity to do our best work. 3.66 1.1125: We feel a sense of pride when we tell people that we work for this organization. 3.80 0.9531: We are encouraged to learn from our mistakes. 3.76 0.8847: People who challenge the status quo are valued. 2.90 1.0882: We know how our work impacts others in the organization. 3.66 1.03
Page A5 F-49
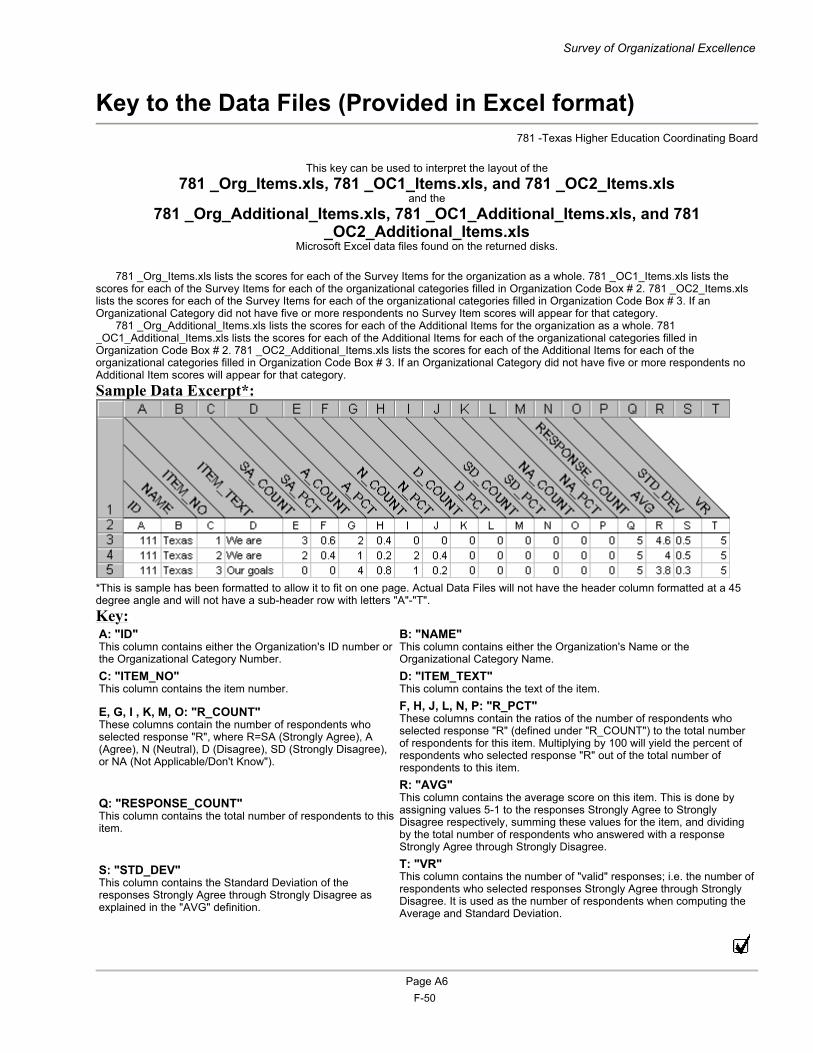
Key to the Data Files (Provided in Excel format) 781 -Texas Higher Education Coordinating Board
This key can be used to interpret the layout of the
781 _Org_Items.xls, 781 _OC1_Items.xls, and 781 _OC2_Items.xls and the
781 _Org_Additional_Items.xls, 781 _OC1_Additional_Items.xls, and 781 _OC2_Additional_Items.xls
Microsoft Excel data files found on the returned disks.
781 _Org_Items.xls lists the scores for each of the Survey Items for the organization as a whole. 781 _OC1_Items.xls lists the scores for each of the Survey Items for each of the organizational categories filled in Organization Code Box # 2. 781 _OC2_Items.xls lists the scores for each of the Survey Items for each of the organizational categories filled in Organization Code Box # 3. If an Organizational Category did not have five or more respondents no Survey Item scores will appear for that category.
781 _Org_Additional_Items.xls lists the scores for each of the Additional Items for the organization as a whole. 781 _OC1_Additional_Items.xls lists the scores for each of the Additional Items for each of the organizational categories filled in Organization Code Box # 2. 781 _OC2_Additional_Items.xls lists the scores for each of the Additional Items for each of the organizational categories filled in Organization Code Box # 3. If an Organizational Category did not have five or more respondents no Additional Item scores will appear for that category. Sample Data Excerpt*:
*This is sample has been formatted to allow it to fit on one page. Actual Data Files will not have the header column formatted at a 45 degree angle and will not have a sub-header row with letters "A"-"T". Key:
Survey of Organizational Excellence
A: "ID" This column contains either the Organization's ID number or the Organizational Category Number.
B: "NAME" This column contains either the Organization's Name or the Organizational Category Name.
C: "ITEM_NO" This column contains the item number.
D: "ITEM_TEXT" This column contains the text of the item.
E, G, I , K, M, O: "R_COUNT" These columns contain the number of respondents who selected response "R", where R=SA (Strongly Agree), A (Agree), N (Neutral), D (Disagree), SD (Strongly Disagree), or NA (Not Applicable/Don't Know").
F, H, J, L, N, P: "R_PCT" These columns contain the ratios of the number of respondents who selected response "R" (defined under "R_COUNT") to the total number of respondents for this item. Multiplying by 100 will yield the percent of respondents who selected response "R" out of the total number of respondents to this item.
Q: "RESPONSE_COUNT" This column contains the total number of respondents to this item.
R: "AVG" This column contains the average score on this item. This is done by assigning values 5-1 to the responses Strongly Agree to Strongly Disagree respectively, summing these values for the item, and dividing by the total number of respondents who answered with a response Strongly Agree through Strongly Disagree.
S: "STD_DEV" This column contains the Standard Deviation of the responses Strongly Agree through Strongly Disagree as explained in the "AVG" definition.
T: "VR" This column contains the number of "valid" responses; i.e. the number of respondents who selected responses Strongly Agree through Strongly Disagree. It is used as the number of respondents when computing the Average and Standard Deviation.
Page A6 F-50
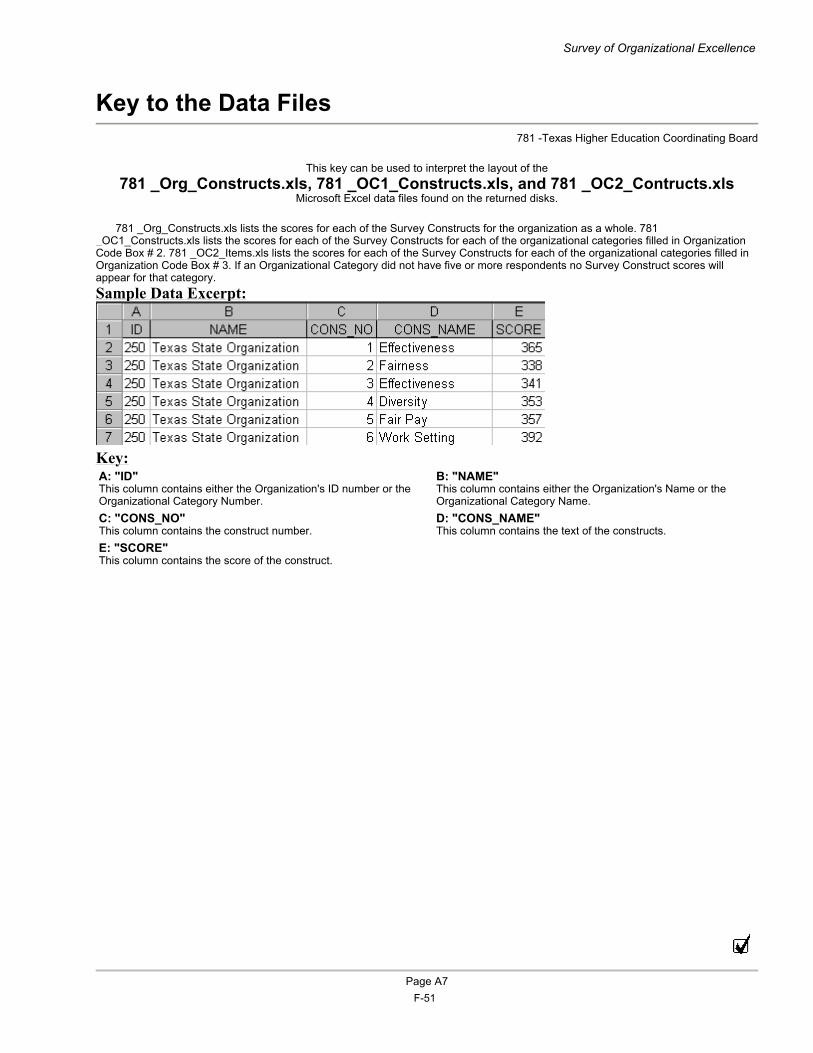
Key to the Data Files 781 -Texas Higher Education Coordinating Board
This key can be used to interpret the layout of the
781 _Org_Constructs.xls, 781 _OC1_Constructs.xls, and 781 _OC2_Contructs.xls Microsoft Excel data files found on the returned disks.
781 _Org_Constructs.xls lists the scores for each of the Survey Constructs for the organization as a whole. 781
_OC1_Constructs.xls lists the scores for each of the Survey Constructs for each of the organizational categories filled in Organization Code Box # 2. 781 _OC2_Items.xls lists the scores for each of the Survey Constructs for each of the organizational categories filled in Organization Code Box # 3. If an Organizational Category did not have five or more respondents no Survey Construct scores will appear for that category. Sample Data Excerpt:
Key:
Survey of Organizational Excellence
A: "ID" This column contains either the Organization's ID number or the Organizational Category Number.
B: "NAME" This column contains either the Organization's Name or the Organizational Category Name.
C: "CONS_NO" This column contains the construct number.
D: "CONS_NAME" This column contains the text of the constructs.
E: "SCORE" This column contains the score of the construct.
Page A7 F-51
Survey Insert 781 -Texas Higher Education Coordinating Board
Organization Codes 1. In Code Box 1, all employees of the Texas Higher Education Coordinating Board should fill in code 781 . 2. In Code Box 2,Please indicate your Division and/or Section:
Additional Items
Survey of Organizational Excellence
Code Category Code Category101 Comm's Off, Dep Comm's Off, Off of Strat Allncs,
Admin Srvcs 102 Office of Participation & Success
103 Office of Academic Excellence & Research
1. My supervisor provides training and development opportunities to me. 2. Having agency-wide meetings has improved communication. 3. I feel management listens to all employees. 4. I feel management implements employee suggestions for improvement. 5. The lines of accountablity within my division are clear to me. 6. I can see a clear link between my work and the goals of the organization. 7. In my division we respect diversity. 8. In my division respect for all employees is practiced. 9. The recent reorganization has improved overall working conditions. 10. The processes put in place since the reorganization are effective. 11. Communications in my work group are sufficient for me to do my work. 12. I feel that the recent reorganization will positively affect the agency. 13. Our organization supports employee participation in partnerships that enhance community outreach efforts. 14. I find it easy to communicate with my management team. 15. My immediate supervisor gives me good directions. 16. Upper level management is accessible to me. 17. The organizational structure is conducive to effectively handling problems. 18. The goals of my work group seem to fit with the goals of the agency. 19. I have as much control over my success in the organization as other employees. 20. I can see career development opportunities for me in this agency.
Page A8 F-52

F-53
Appendix G _____________________________________________________________________________
_____________________________________________________________________________ Texas Higher Education Coordinating Board
2005-2009 Agency Strategic Plan
G-1
Appendix G: Workforce Development System Strategic Plan

Appendix G _____________________________________________________________________________
_____________________________________________________________________________ Texas Higher Education Coordinating Board
2005-2009 Agency Strategic Plan
G-2
Appendix G _____________________________________________________________________________
_____________________________________________________________________________ Texas Higher Education Coordinating Board
2005-2009 Agency Strategic Plan
G-3
Appendix G Workforce Development System Strategic Plan
The Texas Higher Education Coordinating Board’s Strategic Plan instructions require the inclusion of this appendix item to summarize the agency’s work with the Texas Workforce Investment Council (TWIC). This appendix responds in the required format and utilizes the TWIC Strategy Statement included in Destination 2010: Fiscal Years 2005-2009 Strategic Plan for the Texas Workforce Development System and its updates for the Coordinating Board. Texas Higher Education Coordinating Board Strategy Statement The goal of the Texas Higher Education Coordinating Board (THECB) is to assist universities, community colleges, technical colleges and individuals in achieving career and workforce relevant education through program approval, advocacy for funding needs, financial aid, and tech-prep funding. The agency’s primary focus within the workforce system is the community and technical colleges, which serve as the hub of workforce education and training in Texas higher education. This will be accomplished by:
• Executing the Closing the Gaps goals: o Increasing the overall Texas higher education participation rate to
5.6 percent by 2010 and to 2.7 percent by 2015 o Increase the overall number of students completing bachelor’s
degrees, associate’s degrees and certificates to 176,00 by 2010 and to 210,000 by 2015
o Increase the number of students completing allied health and nursing bachelor’s and associate’s degrees and certificates to 20,300 by 2010, and to 26,100 by 2015
o Increase the number of teachers initially certified through all teacher certification routes to 34,600 by 2010 and to 44,700 by 2015
o Increasing science and engineering research obligations to Texas institutions to 6.5 percent of obligations to higher education institutions across the nation
• Coordinating data, information and analysis with the Texas Education Agency, the Texas Workforce Commission and other workforce system partners.
• Undertaking legislative advocacy for higher education needs.
Efforts will be measured by participation (enrollment) and success (completion) rates across a wide range of student populations as well as targeted occupations.
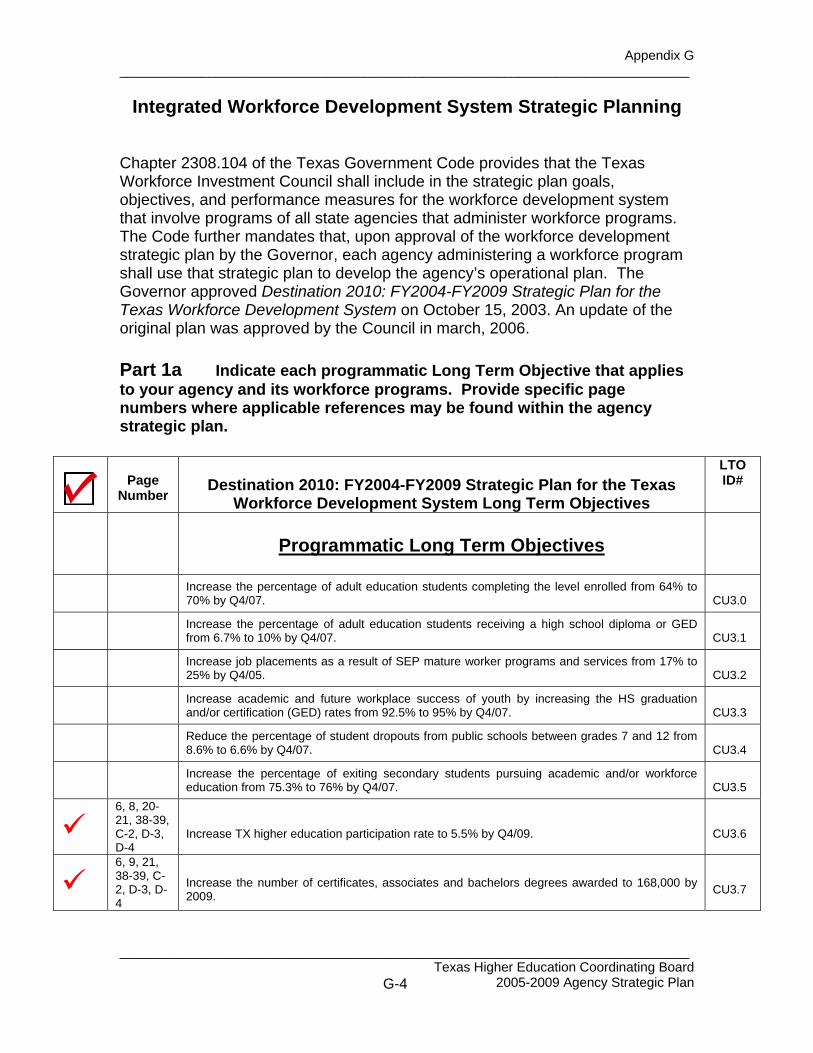
Appendix G _____________________________________________________________________________
_____________________________________________________________________________ Texas Higher Education Coordinating Board
2005-2009 Agency Strategic Plan
G-4
Integrated Workforce Development System Strategic Planning Chapter 2308.104 of the Texas Government Code provides that the Texas Workforce Investment Council shall include in the strategic plan goals, objectives, and performance measures for the workforce development system that involve programs of all state agencies that administer workforce programs. The Code further mandates that, upon approval of the workforce development strategic plan by the Governor, each agency administering a workforce program shall use that strategic plan to develop the agency’s operational plan. The Governor approved Destination 2010: FY2004-FY2009 Strategic Plan for the Texas Workforce Development System on October 15, 2003. An update of the original plan was approved by the Council in march, 2006. Part 1a Indicate each programmatic Long Term Objective that applies to your agency and its workforce programs. Provide specific page numbers where applicable references may be found within the agency strategic plan.
Page
Number
Destination 2010: FY2004-FY2009 Strategic Plan for the Texas
Workforce Development System Long Term Objectives
LTO ID#
Programmatic Long Term Objectives
Increase the percentage of adult education students completing the level enrolled from 64% to 70% by Q4/07.
CU3.0
Increase the percentage of adult education students receiving a high school diploma or GED from 6.7% to 10% by Q4/07.
CU3.1
Increase job placements as a result of SEP mature worker programs and services from 17% to 25% by Q4/05.
CU3.2
Increase academic and future workplace success of youth by increasing the HS graduation and/or certification (GED) rates from 92.5% to 95% by Q4/07.
CU3.3
Reduce the percentage of student dropouts from public schools between grades 7 and 12 from 8.6% to 6.6% by Q4/07.
CU3.4
Increase the percentage of exiting secondary students pursuing academic and/or workforce education from 75.3% to 76% by Q4/07.
CU3.5
6, 8, 20-21, 38-39, C-2, D-3, D-4
Increase TX higher education participation rate to 5.5% by Q4/09.
CU3.6
6, 9, 21, 38-39, C-2, D-3, D-4
Increase the number of certificates, associates and bachelors degrees awarded to 168,000 by 2009.
CU3.7
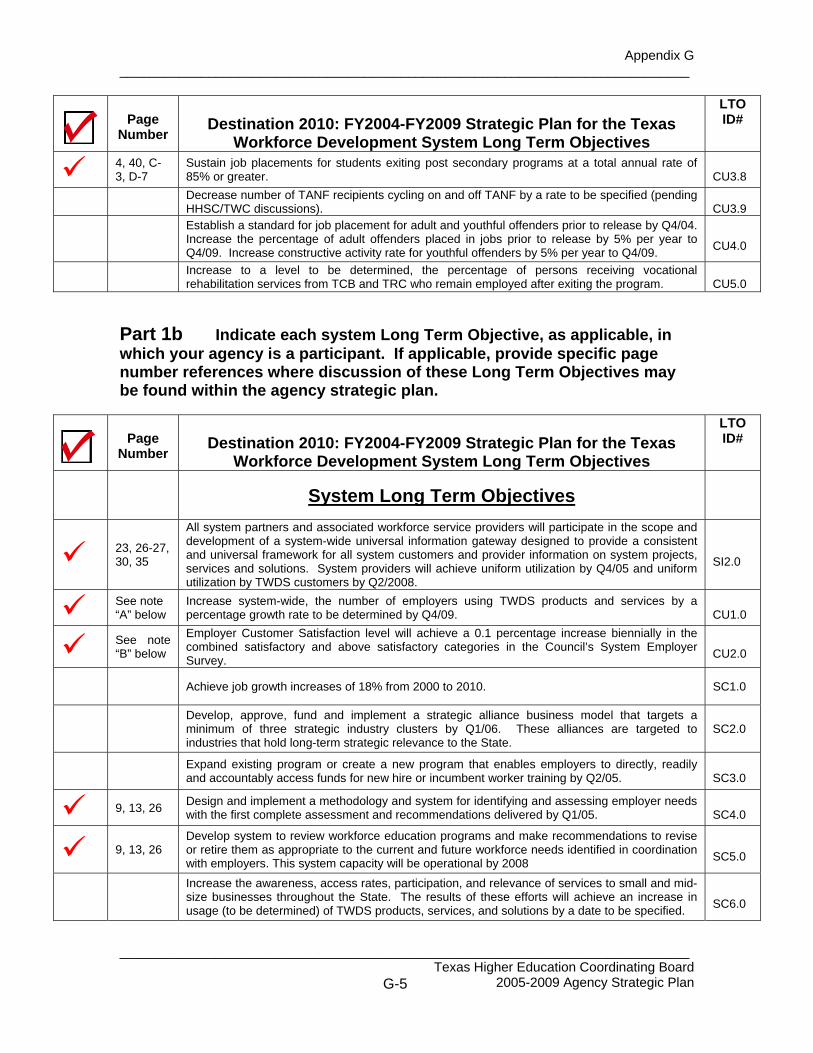
Appendix G _____________________________________________________________________________
_____________________________________________________________________________ Texas Higher Education Coordinating Board
2005-2009 Agency Strategic Plan
G-5
Page
Number
Destination 2010: FY2004-FY2009 Strategic Plan for the Texas
Workforce Development System Long Term Objectives
LTO ID#
4, 40, C-3, D-7
Sustain job placements for students exiting post secondary programs at a total annual rate of 85% or greater.
CU3.8
Decrease number of TANF recipients cycling on and off TANF by a rate to be specified (pending HHSC/TWC discussions).
CU3.9
Establish a standard for job placement for adult and youthful offenders prior to release by Q4/04. Increase the percentage of adult offenders placed in jobs prior to release by 5% per year to Q4/09. Increase constructive activity rate for youthful offenders by 5% per year to Q4/09.
CU4.0
Increase to a level to be determined, the percentage of persons receiving vocational rehabilitation services from TCB and TRC who remain employed after exiting the program.
CU5.0
Part 1b Indicate each system Long Term Objective, as applicable, in which your agency is a participant. If applicable, provide specific page number references where discussion of these Long Term Objectives may be found within the agency strategic plan.
Page
Number
Destination 2010: FY2004-FY2009 Strategic Plan for the Texas
Workforce Development System Long Term Objectives LTO ID#
System Long Term Objectives
23, 26-27, 30, 35
All system partners and associated workforce service providers will participate in the scope and development of a system-wide universal information gateway designed to provide a consistent and universal framework for all system customers and provider information on system projects, services and solutions. System providers will achieve uniform utilization by Q4/05 and uniform utilization by TWDS customers by Q2/2008.
SI2.0
See note “A” below
Increase system-wide, the number of employers using TWDS products and services by a percentage growth rate to be determined by Q4/09.
CU1.0
See note “B” below
Employer Customer Satisfaction level will achieve a 0.1 percentage increase biennially in the combined satisfactory and above satisfactory categories in the Council’s System Employer Survey.
CU2.0
Achieve job growth increases of 18% from 2000 to 2010. SC1.0
Develop, approve, fund and implement a strategic alliance business model that targets a minimum of three strategic industry clusters by Q1/06. These alliances are targeted to industries that hold long-term strategic relevance to the State.
SC2.0
Expand existing program or create a new program that enables employers to directly, readily and accountably access funds for new hire or incumbent worker training by Q2/05.
SC3.0
9, 13, 26 Design and implement a methodology and system for identifying and assessing employer needs with the first complete assessment and recommendations delivered by Q1/05.
SC4.0
9, 13, 26 Develop system to review workforce education programs and make recommendations to revise or retire them as appropriate to the current and future workforce needs identified in coordination with employers. This system capacity will be operational by 2008
SC5.0
Increase the awareness, access rates, participation, and relevance of services to small and mid-size businesses throughout the State. The results of these efforts will achieve an increase in usage (to be determined) of TWDS products, services, and solutions by a date to be specified.
SC6.0
Appendix G _____________________________________________________________________________
_____________________________________________________________________________ Texas Higher Education Coordinating Board
2005-2009 Agency Strategic Plan
G-6
Notes: A: The Coordinating Board does not interact directly with employers, but supports this objective as it corresponds to postsecondary education offerings and curriculum. B: The Coordinating Board is not directly involved in outcomes related to this objective (number of jobs created or listed, etc.), but the agency provides assistance in accomplishing this objective as it relates to higher education.
Part 2 Provide a brief narrative description of the activities and programs your agency is implementing or plans to implement in response to your agency Strategy Statement for the workforce system included in Destination 2010: FY2004-FY2009 Strategic Plan for the Texas Workforce Development System. Please provide specific information regarding your agency’s response to the following issues:
1. Accountability to customers. 2. Securing and maintaining client employment opportunities. 3. Coordination and sharing of information, data and analyses.
Coordinating Board Response: The Coordinating Board reviews all comments and inquiries related to customer service and implements recommendations for improvement as appropriate on an ongoing basis. The Report on Customer Service will be submitted to the Legislative Budget Board and Governor’s Office of Budget, Planning and Policy as required, no later than June 1, 2006. The Coordinating Board is not directly involved in securing and maintaining client employment opportunities. However, agency staff actively encourage and support two-year colleges throughout the state in their efforts to provide career training and guidance. Agency staff members have participated in the System Integration Technical Advisory Committee, to further the development of a system gateway/portal. In addition, Coordinating Board staff have coordinated with Texas Workforce Commission personnel to establish an administrative data exchange Memorandum of Understanding (MOU) that matches wage records with student enrollment files (a solution to previous Family Education Rights and Privacy Act –FERPA—constraints). Discussions are underway to add other participant agencies, such as Texas Rehabilitation Commission and Texas Youth Commission, to the mix.
Appendix G _____________________________________________________________________________
_____________________________________________________________________________ Texas Higher Education Coordinating Board
2005-2009 Agency Strategic Plan
G-7
The Coordinating Board continues to contribute to the “Texas PK-16 Public Education Information Resource” (TPEIR) project with the Texas Education Agency, providing a wealth of information related to tracking Texas public school students through higher education. A relatively new initiative, the data project is considering expansion to include Texas Assessment of Knowledge and Skills (TAKS) Test Data and adult basic education data. This project has potential to include career placement data in the future. There are two workforce system objectives that do not directly correspond with a specific strategy in Closing the Gaps: (1) Sustain job placements for students exiting post secondary programs at a total annual rate of 85 percent or greater, (CU-3.8), and (2) All system partners and associated workforce service providers will participate in the scope and development of a system-wide universal information gateway … (S12.0). Additionally, there are two Closing the Gaps goals (to close the gaps in excellence and to close the gaps in research) and their corresponding strategies/objectives that do not have a direct relationship with any Texas Workforce Development System objectives. A complete listing of Closing the Gaps goals, objectives and strategies is provided in Appendix J. The following table demonstrates direct linkages with the higher education plan, Closing the Gaps by 2015, and workforce development strategies through FY2009.
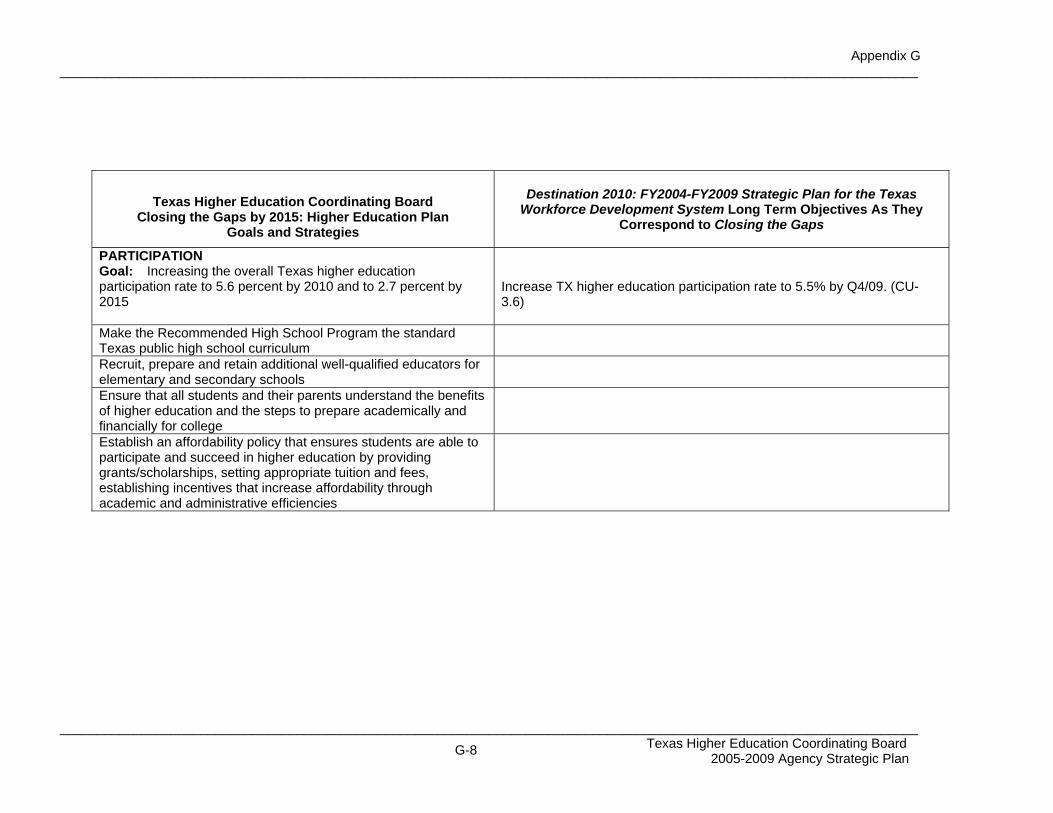
Appendix G ____________________________________________________________________________________________________________________
____________________________________________________________________________________________________________________ Texas Higher Education Coordinating Board 2005-2009 Agency Strategic Plan G-8
Texas Higher Education Coordinating Board
Closing the Gaps by 2015: Higher Education Plan Goals and Strategies
Destination 2010: FY2004-FY2009 Strategic Plan for the Texas
Workforce Development System Long Term Objectives As They Correspond to Closing the Gaps
PARTICIPATION Goal: Increasing the overall Texas higher education participation rate to 5.6 percent by 2010 and to 2.7 percent by 2015
Increase TX higher education participation rate to 5.5% by Q4/09. (CU-3.6)
Make the Recommended High School Program the standard Texas public high school curriculum
Recruit, prepare and retain additional well-qualified educators for elementary and secondary schools
Ensure that all students and their parents understand the benefits of higher education and the steps to prepare academically and financially for college
Establish an affordability policy that ensures students are able to participate and succeed in higher education by providing grants/scholarships, setting appropriate tuition and fees, establishing incentives that increase affordability through academic and administrative efficiencies
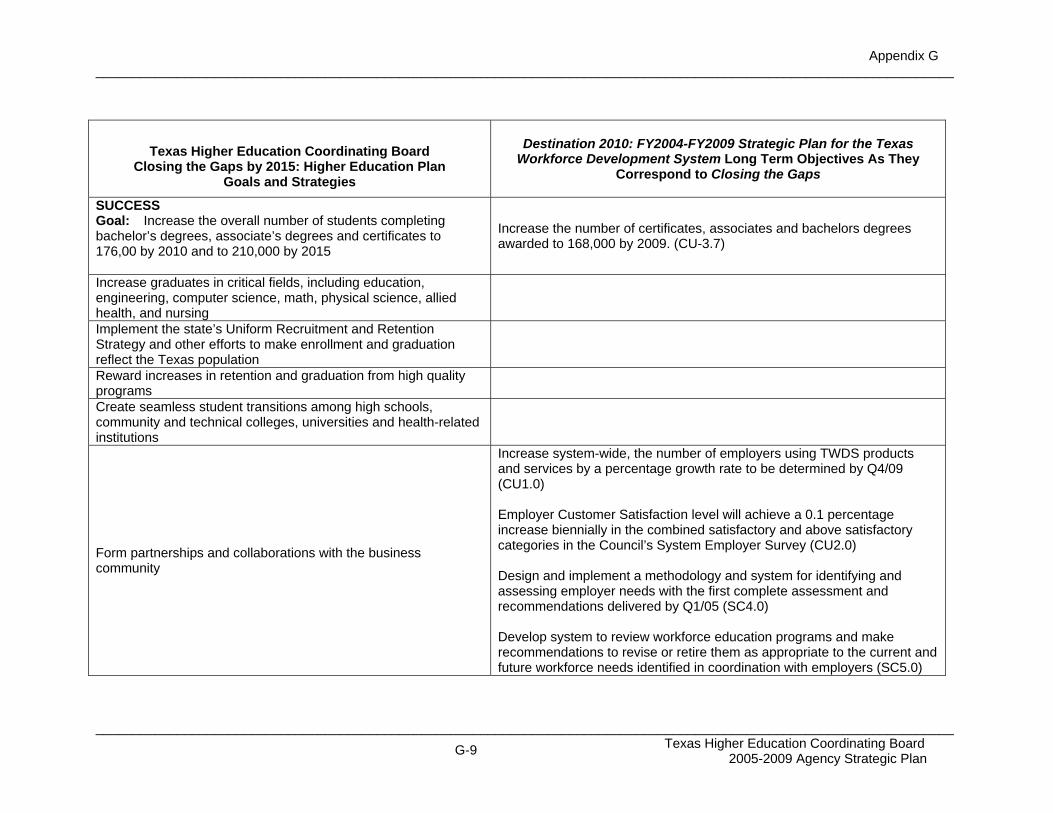
Appendix G ____________________________________________________________________________________________________________________
____________________________________________________________________________________________________________________ Texas Higher Education Coordinating Board 2005-2009 Agency Strategic Plan G-9
Texas Higher Education Coordinating Board
Closing the Gaps by 2015: Higher Education Plan Goals and Strategies
Destination 2010: FY2004-FY2009 Strategic Plan for the Texas
Workforce Development System Long Term Objectives As They Correspond to Closing the Gaps
SUCCESS Goal: Increase the overall number of students completing bachelor’s degrees, associate’s degrees and certificates to 176,00 by 2010 and to 210,000 by 2015
Increase the number of certificates, associates and bachelors degrees awarded to 168,000 by 2009. (CU-3.7)
Increase graduates in critical fields, including education, engineering, computer science, math, physical science, allied health, and nursing
Implement the state’s Uniform Recruitment and Retention Strategy and other efforts to make enrollment and graduation reflect the Texas population
Reward increases in retention and graduation from high quality programs
Create seamless student transitions among high schools, community and technical colleges, universities and health-related institutions
Form partnerships and collaborations with the business community
Increase system-wide, the number of employers using TWDS products and services by a percentage growth rate to be determined by Q4/09 (CU1.0) Employer Customer Satisfaction level will achieve a 0.1 percentage increase biennially in the combined satisfactory and above satisfactory categories in the Council’s System Employer Survey (CU2.0) Design and implement a methodology and system for identifying and assessing employer needs with the first complete assessment and recommendations delivered by Q1/05 (SC4.0) Develop system to review workforce education programs and make recommendations to revise or retire them as appropriate to the current and future workforce needs identified in coordination with employers (SC5.0)
Appendix H
_____________________________________________________________________________
_____________________________________________________________________________ Texas Higher Education Coordinating Board
2007-2011 Agency Strategic Plan
H-1
Appendix H: Historically Underutilized Business Plan
Appendix H
_____________________________________________________________________________
_____________________________________________________________________________ Texas Higher Education Coordinating Board
2007-2011 Agency Strategic Plan
H-3
Appendix H Historically Underutilized Business Plan
In accordance with Chapter 2161 of the Texas Government Code, Section 111.111 of the Texas Administrative Code, and the State of Texas Disparity Study, the Texas Higher Education Coordinating Board is dedicated and committed to including Historically Underutilized Businesses (HUBs) in the procurement process. All businesses – regardless of size, economic, gender, or ethnic status – have an equal opportunity to participate in the procurement process with the Coordinating Board.
For example, the Coordinating Board strives to ensure that contracting opportunities for minority and woman-owned businesses exist within the agency. The Coordinating Board reported positive results for Fiscal Year 2005 with a 42.9% HUB participation. The high HUB participation is mainly attributed to appropriations for the Statewide Higher Education Awareness and Motivational Campaign (also referred to as the College for Texans Campaign). In addition, for the past 14 fiscal years, the Coordinating Board has exceeded the overall statewide average percentage of HUB usage for all state agencies.
GOAL
The Texas Higher Education Coordinating Board is dedicated and committed to including Historically Underutilized Businesses (HUBs) in the procurement process and will continue to make a good faith effort to utilize HUBs through three key elements: executive management support, a strong emphasis on HUB vendor solicitation, and HUB vendor recruitment. Additionally, the agency will annually exceed the overall statewide average percentage of HUB usage for all state agencies.
OBJECTIVES
Executive Management Support
1. Procurement staff will build and maintain HUB vendor relationships and will identify a minimum of five new HUBs each year that are qualified and capable of providing goods and services to agency activities.
Appendix H
_____________________________________________________________________________
_____________________________________________________________________________ Texas Higher Education Coordinating Board
2007-2011 Agency Strategic Plan
H-4
2. The agency will require inclusion of HUB subcontract requirements in all contracts in excess of $100,000 when subcontract opportunities exist.
3. The agency will promote the mentor-protégé program by adding such a
statement to all their formal contract opportunities.
HUB Vendor Solicitation
1. The agency will make available to all potential prime contractors a resource list of certified HUBs available for subcontracting opportunities for contracts over $100,000.
2. The agency will use affirmative action efforts to solicit more HUBs on
contract solicitations and will use a HUB vendor for contracts under $5,000 to the fullest extent possible.
HUB Vendor Recruitment
1. The agency will invite HUBs to deliver technical and business presentations as potential contractors, with at least one such HUB presentation conducted per year.
2. The agency will sponsor or co-sponsor an Economic Opportunity Forum
per year.
3. The agency will participate in external Economic Opportunity Forums at least two such forums per year.
EXTERNAL/INTERNAL ASSESSMENT
The Coordinating Board will continue to make a good faith effort to utilize HUBs through three key elements: executive management support, a strong emphasis on HUB vendor solicitation, and vendor recruitment. A variety of factors, both within and external to the agency, impact and contribute to the goal of increased participation of Historically Underutilized Businesses in Coordinating Board contracts.
Appendix H
_____________________________________________________________________________
_____________________________________________________________________________ Texas Higher Education Coordinating Board
2007-2011 Agency Strategic Plan
H-5
Executive Management Support: Opportunities
• Increased awareness of the benefits and contributions provided by conducting business with HUBs at all levels of management throughout the agency improves the contracting process.
• Coordinating Board members, as leaders throughout the state, understand and support HUB outreach.
Executive Management Support: Threats
• Turnover of key personnel throughout the agency and within the procurement office reduces efficiency due to lost knowledge of processes and established vendor partnerships.
HUB Vendor Solicitation: Opportunities
• Increasing number of HUBs vendor contracts
• Increasing number of contracts among HUB ethnicity groups.
HUB Vendor Solicitation: Threats
• Increasing competition for HUB contractors and subcontractors dilutes quality of vendor partnerships.
• Underutilization of HUBs goals since HUB vendors may not be able to compete with large company’s volume pricing.
• Limited time available among procurement staff to find HUB vendors that will provide competitive market prices for contracts less than $5,000.
HUB Vendor Recruitment: Opportunities
• Network of state agencies encourages development of HUB relationships and contracts.
• Increasing number of HUB-qualified businesses to select from.
Appendix H
_____________________________________________________________________________
_____________________________________________________________________________ Texas Higher Education Coordinating Board
2007-2011 Agency Strategic Plan
H-6
HUB Vendor Recruitment: Threats
• Limited time available among procurement staff to fully explore opportunities to promote and recruit HUBs.
• Limited opportunities to recruit new HUBs vendors due to same HUB vendor attendance.
STRATEGIES
Procurement staff will persist in working towards increased use of HUBs in procurement contracts and subcontracts in the procurement categories of special trade construction, other services, and commodities. In support of these goals, agency staff identified the following strategies to improve its HUB program:
Executive Management Support:
• Assist HUBs in their ability to compete for procurements by promoting the availability of HUBs and removing unfair barriers to HUB participation.
• Stress agency goals regarding HUB participation and require inclusion of HUB subcontract requirements in all contracts in excess of $100,000 when subcontract opportunities exist.
• Support external and internal HUB forums Economic Opportunity Forums.
• Develop and implement a mentor protégé program to foster long-term
relationships between prime contractors and HUBs and to increase the number of HUBs to contract and subcontract.
• Continue to maintain a monthly HUB reporting system in order to track
HUB utilization. • Submit a supplemental letter, when necessary, with the Coordinating
Board’s HUB report to the Texas Building and Procurement Commission.
Appendix H
_____________________________________________________________________________
_____________________________________________________________________________ Texas Higher Education Coordinating Board
2007-2011 Agency Strategic Plan
H-7
HUB Vendor Solicitation:
• Allow for maximum participation by all businesses by specifying reasonable and realistic contract specifications and terms and conditions consistent with the agency’s actual requirements.
• Provide potential contractors with references or sources of certified HUBs
available for subcontracting opportunities. • Utilize all available HUB directories within the appropriate vendor criteria
for procurement opportunity.
HUB Vendor Recruitment:
• Invite HUBs to deliver technical and business presentations regarding the HUBs’ capability to do business with the Coordinating Board.
• Inform the public of the Coordinating Board contract opportunities by sponsoring or co-sponsoring Economic Opportunity Forums.
• Participate in external HUB Economic Opportunity forums with the
purpose of identifying HUBs capable of providing goods and services and to make procurement opportunities available.
Appendix I
_____________________________________________________________________________
_____________________________________________________________________________ Texas Higher Education Coordinating Board
2007-2011 Agency Strategic Plan
I-1
Appendix I: Current-Year Activities
Appendix I
_____________________________________________________________________________
_____________________________________________________________________________ Texas Higher Education Coordinating Board
2007-2011 Agency Strategic Plan
I-3
Appendix I Current-Year Activities
The State of Texas and the Coordinating Board recognize the future-oriented approach required to prepare an agency’s strategic plan. Documentation of current-year activities provides the necessary context to understand the vision presented in the strategic plan. This appendix offers a review of activities accomplished in Fiscal Year 2006 in support of the agency’s goals, objectives, and strategies. The Coordinating Board’s master plan for higher education, entitled Closing the Gaps by 2015, has now been in place for five years (details are provided in Appendix J). From its 2000 adoption forward, the majority of activities planned, conducted, and evaluated by the Board and agency staff aligned directly with one or more goals of the plan. In FY 2005, the Coordinating Board reorganized to apply resources more effectively to reach Closing the Gaps goals. There are two major units: Academic Excellence and Research and Participation and Success. The Academic Excellence and Research Unit is composed of the Academic Affairs and Research Division (with Undergraduate, Graduate and Research sections) and the Planning and Accountability Division (with Planning, Finance and Resource Planning, Web and Educational Data sections). The Participation and Success Unit has Student Services, and Outreach and Success Divisions. The agency’s Board committees have been reorganized in a similar manner. These changes are having major effects on how the agency undertakes and carries out its duties. Fiscal Year 2006 In October 2005, the Commissioner of Higher Education shared with the Coordinating Board his vision of the agency’s strategic planning process. In conjunction with his presentation, the Board considered and adopted changes to Closing the Gaps goals and targets. These measures were revised for several reasons: state population by ethnicity projections were updated, some 2005 interim targets had been surpassed, and independent institutions’ students were incorporated into the measures. The quarterly report on preliminary fall enrollment was presented along with updates on the institutions’ assistance to students displaced by Hurricanes Katrina and Hurricane Rita. The Board also heard about the Technology Workforce Development Grants Program which is designed to increase the quantity and quality of baccalaureate-level electrical engineers and computer scientists. Institutions with these grants are using a variety of strategies to increase enrollments and baccalaureate degrees awarded
Appendix I
_____________________________________________________________________________
_____________________________________________________________________________ Texas Higher Education Coordinating Board
2007-2011 Agency Strategic Plan
I-4
in related fields. Special efforts are being made to attract and retain underrepresented minorities. As part of the Board’s effort to discuss a major issue at every quarterly meeting, the lead topic at its January 2006 meeting was the this fundamental question of how to create greater access to and opportunity in higher education while simultaneously improving cost-effectiveness and accountability. Three critical factors explored were:
1) Technology – What are cost effective and superior ways to deliver instruction and improve learning? 2) Facilities – How can facilities be used more effectively? How can institutions improve the use of facilities during the week, including weekends, and during the summer? 3) Financial aid – Can work-study be expanded to address the cost of accommodating 630,000 new students? Should the state create more forgivable loan programs in critical shortage areas such as nursing, teaching and other fields?
In November, the Commissioner convened a summit on Ensuring Academic Excellence: Developing Strategies of Success Campus by Campus. The summit brought together Texas education stakeholders, campus leaders, and policy makers to discuss the state of developmental education and to develop strategies for improving the quality of education, especially for underprepared students. Over 400 chancellors, provosts, presidents, vice presidents, and other educational leaders from across Texas participated in the Summit's policy discussions. The result was a call to action for all of higher education. Follow-up strategies identified included:
• Compilation of Summit information into a Call-to-Action document to be distributed at regional forums,
• Presentation of Summit information on improving educational partnerships at the P-16 Council,
• Presentation of professional development workshops for all Texas developmental educators via STARLINK in spring 2006, and
• Use of Summit findings to inform the merger and consolidation of Coordinating Board Uniform Recruitment and Retention Strategy (URRS) Plans and Coordinating Board Developmental Education Plans beginning spring 2006.
Regional meetings are another major undertaking to promote higher education. The Coordinating Board has received grant funds to host 10 regional meetings across the state. Regional meetings provide an ideal setting for board leaders and executives to discuss strategies and important institutional and community-level indicators in the regions. Regional meetings also lead to a better understanding of the partnerships and coordination needed between colleges
Appendix I
_____________________________________________________________________________
_____________________________________________________________________________ Texas Higher Education Coordinating Board
2007-2011 Agency Strategic Plan
I-5
and universities and schools to achieve the goals of Closing the Gaps. The first regional meeting was held in Bexar County in February. A second meeting was held in the Valley in May. An El Paso area meeting is scheduled for June. The collaborations of public school and higher education personnel were presented to Coordinating Board members at their meeting on April 20, 2006. The focus concerned development of a statewide strategy for P-16 to close the gaps between public education and higher education. The Board reviewed progress on its initiative to create a college-going culture. Also on the agenda was consideration of funding formulas for use by the Governor and the Legislative Budget Board in making appropriations recommendations to the Legislature.
In April 2006, a P-16 State Leadership Consortium Conference was held in Austin. The Consortium solicits and reviews input from the field regarding programs, activities, and/or projects that link public secondary education institutions with public postsecondary institutions, including community and technical colleges and state-supported universities.
The Consortium’s annual conference showcases programs, processes, and activities that contribute to student achievement at all levels, the successful transition of students from secondary to post secondary education, and their retention, both while in public high school and at the community or technical college and university levels.
In June 2006, a leadership meeting for higher education board members and executive officers, called Funding Closing the Gaps, was held. The meeting’s primary purposes were: 1) to help define effective governance and strengthen the leadership capacity of our board leaders, presidents, and chancellors, and 2) to accelerate our progress on Closing the Gaps by 2015. Discussions centered on the important roles that all leaders – regents, chancellors and presidents, and the Coordinating Board –play at the institutional, system, and state levels to address the challenges presented by Closing the Gaps.
79th Legislature, Third Called Session
79th Texas Legislature, Third Called Session passed a major piece of legislation to address public school finance, public school accountability, and related matters. As part of the “related matters,” a number of initiatives to enhance integration of public education and higher education. Portions of the legislation that are significant for Closing the Gaps are highlighted below:
• An Education Research Center that conduct studies affecting public education could be located at the Coordinating Board or a public college or university.
Appendix I
_____________________________________________________________________________
_____________________________________________________________________________ Texas Higher Education Coordinating Board
2007-2011 Agency Strategic Plan
I-6
• An Electronic Student Records System to facilitate the sharing of student data between and among public and higher education officials will be created.
• The Recommended High School Program, Performance
Indicators, College Readiness and Success Strategic Action Plan, and End of Course Assessment as Placement Instruments will increase the academic rigor of the standard high school curriculum, measure students’ progress toward preparation for postsecondary success, aid appropriate placement of students in higher education courses, and decrease the need for developmental education.
• Vertical Teams of public education and higher education leaders will
recommend standards and expectations of college readiness and develop instructional strategies that prepared students to successfully perform college-level work.
• College Credit Program, Summer Bridge Programs, and Texas
Governor’s Schools will assist public school students as they prepare for and earn college credit before high school graduation.
• The Course Redesign Project’s goal is to revise entry-level, lower-
division academic courses at participating higher education institutions.
Coming in the Remainder of FY 2006 Tentative agenda items for the Board’s consideration in July 2006 include the annual report on progress toward Closing the Gaps. The Coordinating Board will continue to monitor the progress of institutions relative to the goals and targets identified in Closing the Gaps on a quarterly cycle. Eight additional regional meetings, as described above, will be held.
Appendix J
_____________________________________________________________________________
_____________________________________________________________________________ Texas Higher Education Coordinating Board
2007-2011 Agency Strategic Plan
J-1
Appendix J: Closing the Gaps by 2015
Appendix J
_____________________________________________________________________________
_____________________________________________________________________________ Texas Higher Education Coordinating Board
2007-2011 Agency Strategic Plan
J-3
Appendix J Closing the Gaps by 2015
A Summary of Goals, Strategies and Targets
Closing the Gaps by 2015, the Texas higher education plan, was developed to ensure a well-educated workforce for the future and to support research efforts. The plan was created in recognition of the low proportion of Texans enrolled in higher education compared to other states, that too few higher education programs are noted for excellence, and that too few higher education research efforts have reached their full potential. The plan outlines the goals of closing the gaps in higher education participation and success, in educational excellence, and in funded research over the next 15 years. By no means a list of all desirable actions in Texas higher education, the plan outlines the four challenges which are the most critical to overcome for the future well-being of our state.
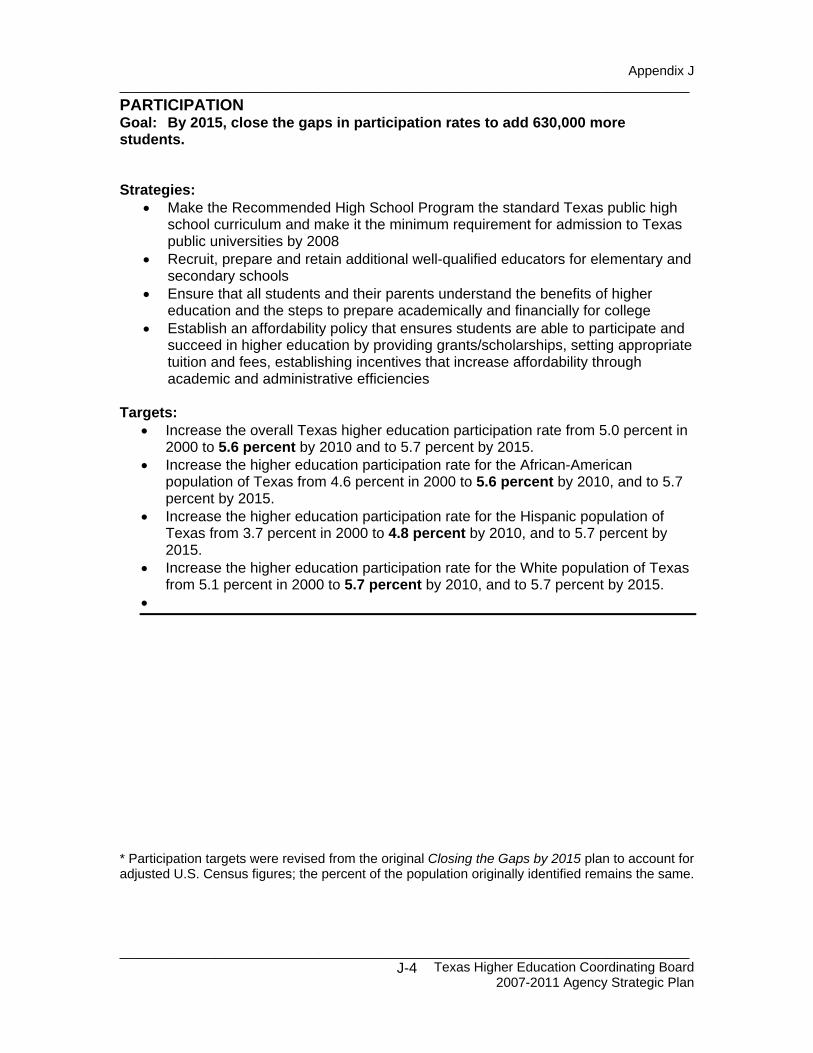
Appendix J
_____________________________________________________________________________
_____________________________________________________________________________ Texas Higher Education Coordinating Board
2007-2011 Agency Strategic Plan
J-4
PARTICIPATION Goal: By 2015, close the gaps in participation rates to add 630,000 more students. Strategies:
• Make the Recommended High School Program the standard Texas public high school curriculum and make it the minimum requirement for admission to Texas public universities by 2008
• Recruit, prepare and retain additional well-qualified educators for elementary and secondary schools
• Ensure that all students and their parents understand the benefits of higher education and the steps to prepare academically and financially for college
• Establish an affordability policy that ensures students are able to participate and succeed in higher education by providing grants/scholarships, setting appropriate tuition and fees, establishing incentives that increase affordability through academic and administrative efficiencies
Targets:
• Increase the overall Texas higher education participation rate from 5.0 percent in 2000 to 5.6 percent by 2010 and to 5.7 percent by 2015.
• Increase the higher education participation rate for the African-American population of Texas from 4.6 percent in 2000 to 5.6 percent by 2010, and to 5.7 percent by 2015.
• Increase the higher education participation rate for the Hispanic population of Texas from 3.7 percent in 2000 to 4.8 percent by 2010, and to 5.7 percent by 2015.
• Increase the higher education participation rate for the White population of Texas from 5.1 percent in 2000 to 5.7 percent by 2010, and to 5.7 percent by 2015.
• * Participation targets were revised from the original Closing the Gaps by 2015 plan to account for adjusted U.S. Census figures; the percent of the population originally identified remains the same.
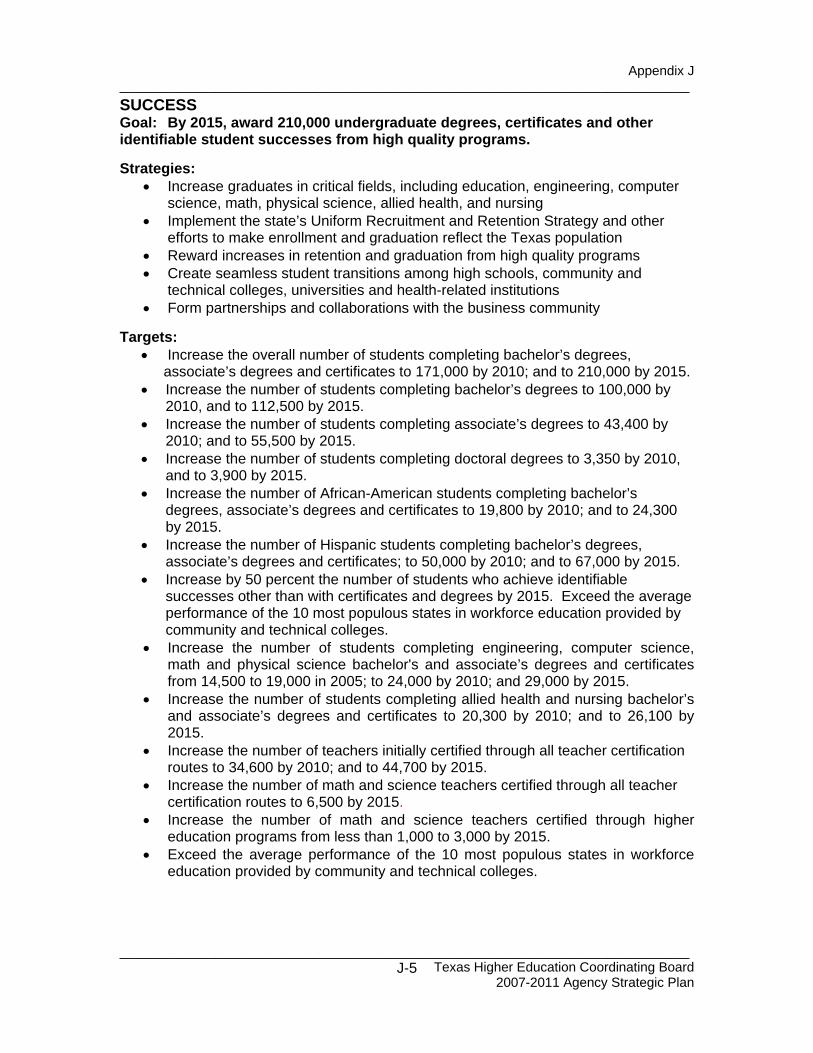
Appendix J
_____________________________________________________________________________
_____________________________________________________________________________ Texas Higher Education Coordinating Board
2007-2011 Agency Strategic Plan
J-5
SUCCESS Goal: By 2015, award 210,000 undergraduate degrees, certificates and other identifiable student successes from high quality programs. Strategies:
• Increase graduates in critical fields, including education, engineering, computer science, math, physical science, allied health, and nursing
• Implement the state’s Uniform Recruitment and Retention Strategy and other efforts to make enrollment and graduation reflect the Texas population
• Reward increases in retention and graduation from high quality programs • Create seamless student transitions among high schools, community and
technical colleges, universities and health-related institutions • Form partnerships and collaborations with the business community
Targets:
• Increase the overall number of students completing bachelor’s degrees, associate’s degrees and certificates to 171,000 by 2010; and to 210,000 by 2015.
• Increase the number of students completing bachelor’s degrees to 100,000 by 2010, and to 112,500 by 2015.
• Increase the number of students completing associate’s degrees to 43,400 by 2010; and to 55,500 by 2015.
• Increase the number of students completing doctoral degrees to 3,350 by 2010, and to 3,900 by 2015.
• Increase the number of African-American students completing bachelor’s degrees, associate’s degrees and certificates to 19,800 by 2010; and to 24,300 by 2015.
• Increase the number of Hispanic students completing bachelor’s degrees, associate’s degrees and certificates; to 50,000 by 2010; and to 67,000 by 2015.
• Increase by 50 percent the number of students who achieve identifiable successes other than with certificates and degrees by 2015. Exceed the average performance of the 10 most populous states in workforce education provided by community and technical colleges.
• Increase the number of students completing engineering, computer science, math and physical science bachelor's and associate’s degrees and certificates from 14,500 to 19,000 in 2005; to 24,000 by 2010; and 29,000 by 2015.
• Increase the number of students completing allied health and nursing bachelor’s and associate’s degrees and certificates to 20,300 by 2010; and to 26,100 by 2015.
• Increase the number of teachers initially certified through all teacher certification routes to 34,600 by 2010; and to 44,700 by 2015.
• Increase the number of math and science teachers certified through all teacher certification routes to 6,500 by 2015.
• Increase the number of math and science teachers certified through higher education programs from less than 1,000 to 3,000 by 2015.
• Exceed the average performance of the 10 most populous states in workforce education provided by community and technical colleges.
Appendix J
_____________________________________________________________________________
_____________________________________________________________________________ Texas Higher Education Coordinating Board
2007-2011 Agency Strategic Plan
J-6
EXCELLENCE Goal: By 2015, substantially increase the number of nationally recognized programs or services at colleges and universities in Texas. Strategies:
• Establish ladders of excellence for different types of institutions • Require institutions to prepare a strategy for one or more programs or services to
reach a level of nationally recognized excellence • Identify peer institutions and establish benchmarks • Fund competitive grants to match business contributions for acquiring equipment
and software and maintaining high-tech instructional laboratories Targets:
• Increase the number of research institutions ranked in the top 10 among all research institutions from zero to one, and two additional research universities ranked in the top 30 by 2010; increase the number of public research universities ranked in the top 10 among all public research universities from zero to two, and four ranked among the top 30 by 2015.
• Increase the number of public liberal arts universities ranked in the top 30 among all public liberal arts institutions from zero to two by 2010, and four by 2015.
• Increase the number of health science centers ranked among the top 10 medical institutions from zero to one by 2010, and two by 2015.
• Each college and university will have identified by 2002 at least one program to achieve nationally recognized excellence.
• Community and technical colleges and universities will have at least one program or service nationally recognized: 25 percent of the institutions by 2005; 75 percent by 2010; and 100 percent by 2015.
• Meet all benchmarks of the Priority Plan to Strengthen Education at Texas Southern University and Prairie View A&M University.
Appendix J
_____________________________________________________________________________
_____________________________________________________________________________ Texas Higher Education Coordinating Board
2007-2011 Agency Strategic Plan
J-7
RESEARCH Goal: By 2015, increase the level of federal science and engineering research and development obligations to Texas institutions to 6.5 percent of obligations to higher education institutions across the nation. Strategies:
• Permit universities to retain all overhead income from grants and contracts • Establish the Texas Science and Engineering Collaborative to expand research
through collaboration among institutions • Increase funding for the Advanced Research/Advanced Technology Programs • Establish a competitive grant program to expand research and research capacity
Targets:
• Increase federal science and engineering obligations to Texas universities and health-related institutions from 5.6 percent of the obligations in 2000 (or $1.1 billion in 1998 constant dollars) to 6.2 percent in 2010, and to 6.5 percent of obligations to higher education by 2015.
• Increase research expenditures by Texas public universities and health-related institutions from $1.45 billion to $3 billion by 2015 (approximate 5 percent increase per year).
Ensuring Progress Towards These Goals Develop benchmarks and measures to assess progress toward goals of the plan by each institution and by higher education as a whole.