the€commonwealth€ of€kentucky...
TRANSCRIPT
The Commonwealth of Kentucky Health Care Facility Capacity Report
December 2013 (3/28/13)
The Commonwealth of Kentucky Health Care Facility Capacity Report, 2013 2
Contents Executive Summary ............................................................................................................................................ 7 Overview of Study Components ...................................................................................................................... 11 Demand Projections & Peer Benchmarking .................................................................................................. 13 1 Projection Methodology ............................................................................................................................ 14
1.1 Facility Tiers ......................................................................................................................................... 14 1.2 Demand Projections Methodology ....................................................................................................... 15 1.3 Occupancy Projections Methodology................................................................................................... 21 1.4 Demand Projections Assumptions ....................................................................................................... 22
2 Projection Results ...................................................................................................................................... 25 2.1 Demand Projections............................................................................................................................. 25 2.2 Occupancy Projections ........................................................................................................................ 27
3 Sensitivity Analysis & Future State Scenarios ........................................................................................ 30 3.1 Sensitivity Analysis .............................................................................................................................. 30 3.2 Future State Scenarios ........................................................................................................................ 33
4 Limitations of Projection Analysis ........................................................................................................... 38 4.1 Data Limitations ................................................................................................................................... 38 4.2 Methodology Limitations ...................................................................................................................... 38
5 Peer Benchmark Analysis ......................................................................................................................... 39 5.1 Benchmark Objectives ......................................................................................................................... 39 5.2 Comparison Regions ........................................................................................................................... 39 5.3 Benchmark Sourcing............................................................................................................................ 40
Deeper Exploration & Next Steps for Consideration ..................................................................................... 47 6 Health Services Data .................................................................................................................................. 48
6.1 Summary.............................................................................................................................................. 48 6.2 Data Challenges .................................................................................................................................. 48
7 Certificate of Need ...................................................................................................................................... 52 7.1 Introduction to CON ............................................................................................................................. 52 7.2 The Impact of CON Programs on Utilization ........................................................................................ 53 7.3 States Revisit CON Regulations .......................................................................................................... 54 7.4 Next Steps for Consideration ............................................................................................................... 57
8 Acute Care Facilities .................................................................................................................................. 58 8.1 Analysis Summary ............................................................................................................................... 58 8.2 Utilization & Occupancy ....................................................................................................................... 58 8.3 Distribution of Services ........................................................................................................................ 60 8.4 Critical Access Hospitals and Drive Time ............................................................................................ 62 8.5 Consolidation of Services .................................................................................................................... 64 8.6 Berger Commission – a Case Study in Reducing Excess Capacity .................................................... 67 8.7 Patient Satisfaction and Occupancy .................................................................................................... 68 8.8 Next Steps for Consideration ............................................................................................................... 69 8.9 Potential Challenges ............................................................................................................................ 70
9 Nursing Facilities & Home Health ............................................................................................................. 71 9.1 Summary.............................................................................................................................................. 71 9.2 Long-Term Care Budget and Utilization............................................................................................... 71 9.3 Distribution of Services ........................................................................................................................ 75 9.4 Home and Community Based Services ............................................................................................... 77 9.5 Rebalancing ......................................................................................................................................... 78 9.6 Home Health – A Central Pillar ............................................................................................................ 79 9.7 Economics and Reimbursement .......................................................................................................... 83 9.8 Next Steps for Consideration ............................................................................................................... 85

The Commonwealth of Kentucky Health Care Facility Capacity Report, 2013 3
9.9 Potential Challenges ............................................................................................................................ 86 10 Mental Health Services .............................................................................................................................. 88
10.1 Summary.............................................................................................................................................. 88 10.2 Utilization of Mental Health Services ................................................................................................... 88 10.3 Distribution of Services ........................................................................................................................ 90 10.4 Economics Related to Mental Health Care .......................................................................................... 92 10.5 Behavioral Health Workforce ............................................................................................................... 94 10.6 Home and Community Based Services ............................................................................................... 96 10.7 Next Steps for Consideration ............................................................................................................... 96 10.8 Potential Challenges ............................................................................................................................ 97
11 Imaging: MRI, PET ...................................................................................................................................... 98 11.1 Summary.............................................................................................................................................. 98 11.2 Imaging Utilization................................................................................................................................ 98 11.3 Next Steps for Consideration ............................................................................................................. 105 11.4 Potential Challenges .......................................................................................................................... 105
12 Ambulatory Surgical Centers .................................................................................................................. 106 12.1 Summary............................................................................................................................................ 106 12.2 ASC Utilization ................................................................................................................................... 106 12.3 ASC - Competitive Barriers ................................................................................................................ 107 12.4 Next Steps for Consideration ............................................................................................................. 110 12.5 Potential Challenges .......................................................................................................................... 110
13 Physical and Occupational Therapy Workforce .................................................................................... 111 13.1 Summary............................................................................................................................................ 111 13.2 Physical Therapy Workforce .............................................................................................................. 111 13.3 Occupational Therapy Workforce ...................................................................................................... 112 13.4 Next Steps for Consideration ............................................................................................................. 114 13.5 Potential Challenges .......................................................................................................................... 114
14 Appendix ................................................................................................................................................... 115 14.1 Benchmarking .................................................................................................................................... 115 14.2 Acknowledgments .............................................................................................................................. 120
The Commonwealth of Kentucky Health Care Facility Capacity Report, 2013 4
Figures Figure 1: Healthcare Facilities Selected for Inclusion in Study 7 Figure 2: Facility Capacity – Potential Health Policy Levers to Address Supply and Demand 9 Figure 3: Prioritization Matrix for Next Steps 9 Figure 4: Overview of Study Components 11 Figure 5: Demand Projections Methodology 15 Figure 6: Population Model and Insurance Coverage Mix 17 Figure 7: Coverage Shifts Utilization – Inpatient 18 Figure 8: Coverage Shifts Utilization – Outpatient 19 Figure 9: Continued Momentum – Historical Change in Use Rates between 2009 and 2012 20 Figure 10: Factors Included in Demand Projections – Acute Care Example 21 Figure 11: Medicaid Managed Care Regions (MMRC) 24 Figure 12: Tier 1 – Estimated Statewide Change in Demand from 2012 to 2017 26 Figure 13: Tier 2 – Estimated Statewide Change in Demand from 2012 to 2017 26 Figure 14: Occupancy Projections by Facility Type (2012 - 2017) 27 Figure 15: Tier 1 - Occupancy Projections by MMCR 28 Figure 16: Tier 2 - Occupancy Projections by MMCR 29 Figure 17: Demand Sensitivities – Acute Care Hospital Occupancy 31 Figure 18: Demand Sensitivities – Ambulatory Surgery Occupancy 32 Figure 19: Demand Sensitivities – Nursing Facilities Occupancy 32 Figure 20: Supply Sensitivities – Acute, ASC, Nursing 33 Figure 21: Future State Scenarios - Acute Care 35 Figure 22: Future State Scenarios - ASCs 36 Figure 23: Future State Scenarios - Nursing Facility 37 Figure 24: U.S Department of Health & Human Services Region 4 40 Figure 25: Comparison of Projected 2017 Demand versus National and South Benchmarks - Tier 1 45 Figure 26: Comparison of Projected 2017 Demand versus National and South Benchmarks - Tier 2 46 Figure 27: CON History 52 Figure 28: States With and Without CON Programs 52 Figure 29: Health Status vs. Utilization of Health Services in CON and Non-CON States 53 Figure 30: Bed Capacity Comparison between CON and Non-CON States 54 Figure 31: Utilization Comparison between CON and Non-CON States 54 Figure 32: Contiguous States CON Programs (2011) 57 Figure 33: Beds and Occupancy Rates per Contiguous States 59 Figure 34: Acute Care Occupancy Rates by MMCR in 2012 and 2017 60 Figure 35: Distribution of Kentucky Acute Care and Critical Access Hospitals 61 Figure 36: Occupancy Levels and Discharges for Acute Hospitals and CAH Hospitals in 2012 62 Figure 37: Drive Time to Closest Acute Provider Type 63 Figure 38: Drive Time Saved by Critical Access Hospitals 64 Figure 39: Patient Origin and Site of Care for Cardiac Surgery in 2012 65 Figure 40: Patient Origin and Site of Care for Transplant Surgery in 2012 66 Figure 41: Patient Origin and Site of Care for General Medicine in 2012 67 Figure 42: Occupancy, Bed Count, Patient Satisfaction of Acute Care Facilities 69 Figure 43: Commonwealth Medicaid Budget for Select Institutional Services (SFY11) 72 Figure 44: Commonwealth’s 2012 Occupancy Rates for Nursing and Acute Care by MMCR 75 Figure 45: Distribution of Nursing Facilities and Occupancy Compared to County Population 76 Figure 46: County-wide Nursing Facility Occupancy & Volume of Patients Obtaining Care Outside of Service
Area 77 Figure 47: Comparison of State Utilization Rates for Nursing Facilities and Home Health Services 79

The Commonwealth of Kentucky Health Care Facility Capacity Report, 2013 5
Figure 48: Relative Use of Home Health Services by County and Location of Home Health Agency Headquarters 80
Figure 49: Relative Need for Home Health Services By County (Red Indicates Higher Need) 81 Figure 50: Trends in Home Health Patients Served in the Commonwealth from 2008-2012 82 Figure 51: Medicaid Nursing Facility Expenditures per Medicaid Enrollee 83 Figure 52: Medicaid Home Health Expenditures per Medicaid Enrollee 84 Figure 53: Overview of Home Health Waiver Program Expenditures 85 Figure 54: Rank of DRG 885 “Psychoses” Relative to Other Inpatient Discharges by County 89 Figure 55: Utilization of Psychiatric Inpatient Care by County and Location of Facilities Where Care Was
Provided 90 Figure 56: Distribution of Inpatient Psychiatric Facilities and Drive Time to Closest Facility 91 Figure 57: Distribution of PRTF Facilities and Drive Time to Closest Facility 91 Figure 58: Claims Volume and Expenses for Out-Of-State PRTF Care 92 Figure 59: Commercial Cost Allowance for Inpatient Psychiatry Care 93 Figure 60: Commercial Cost Allowance for Mental Health Professional Services 93 Figure 61: Rural Kentucky Mental Health Professionals Need (2012) 94 Figure 62: Comparison of Inpatient Utilization Against Workforce Shortages 95 Figure 63: MRI –Baseline and Projected Demand 99 Figure 64: Overview of MRI Use in 2011 (Occupancy calculated as % of State Health Plan recommended
volume) 100 Figure 65: Overview of CON Impact on MRI and PET Utilization 103 Figure 66: Demand Utilization Tools for Imaging Services 104 Figure 67: Overview of HMO Penetration by State 105 Figure 68: Occupancy and Use Rates for ASCs by MMCR (2012) 107 Figure 69: Distribution of Ambulatory Surgery Facilities and Drive Time to Closest Facility 108 Figure 70: Overview of Commercial Cost Allowance per Surgery for Kentucky and Contiguous States 109 Figure 71: Overview of CON Applications for Ambulatory Surgery 2003-2013 109 Figure 72: Comparison of the Commonwealth's Physical Therapist Supply Relative to National, Regional, and
Contiguous States 111 Figure 73: Physical Therapy Projections- 2008 and Beyond 112 Figure 74: Comparison of the Commonwealth's Occupational Therapy Supply versus National, Regional, and
Contiguous States 113 Figure 75: Tier 1-Overview of Commonwealth and Benchmark Data Sources and Most Recent Years Used,,,
117 Figure 76: Tier 2- Overview of Commonwealth and Benchmark Data Sources for Most Recent Year Used,,, 117 Figure 77: Data Sources- Tier 1, National Benchmarks 118 Figure 78: Data Sources- Tier 1, Regional and State Benchmarks 118 Figure 79: Data Sources- Tier 2, National Benchmarks 119 Figure 80: Data Sources- Tier 2, Regional and State Benchmarks 119
The Commonwealth of Kentucky Health Care Facility Capacity Report, 2013 6
Tables Table 1: Overview of Objectives and Output ....................................................................................................... 12 Table 2: Tier 1 Facilities ...................................................................................................................................... 14 Table 3: Tier 2 Facilities ...................................................................................................................................... 15 Table 4: Sensitivity Analysis Methodology .......................................................................................................... 30 Table 5: Future State Scenarios Overview ......................................................................................................... 34 Table 6: Commonwealth of Kentucky Health Outcomes Rank Relative to other U.S. States ............................. 39 Table 7: Tier 1 Benchmarks (metrics are use rate per 10,000 population) ......................................................... 42 Table 8: Tier 2 Benchmarks ................................................................................................................................ 43 Table 9: Overview of Benchmark Discrepancies and Adjustments ................................................................ 44 Table 10: Data Source Used per Facility Analysis .............................................................................................. 48 Table 11: Kentucky Health Care Facility Data Limitations .................................................................................. 49 Table 12: Comparison of Florida and Ohio Moratorium on Long-Term Care Facilities ....................................... 74 Table 13: State Comparison of Home Health Services Offered Under 1915 (c) Waiver Programs ................... 78 Table 14: Catalog of Home Health Services in the Commonwealth ................................................................... 82 Table 15: Waiver Expenditures for Kentucky, Florida, Ohio, and Indiana ........................................................... 85 Table 16: Utilization of Mental Health Diagnosis Related Groups (DRGs) per 10,000 Population ..................... 89 Table 17: Supply of various types of mental health providers within Kentucky ................................................... 94 Table 18: Cabinet's Decisions for MRI, PET, and MRE Applications 2007-2013 ............................................. 101 Table 19: Overview of Contiguous States' CON Policies for MRI ..................................................................... 102 Table 20: Fee-For-Service Medicaid Services Requiring Pre-Authorization in Kentucky ................................. 104 Table 21: OT Vacancies Percentage vs. Budgeted FTE Positions ................................................................... 113 Table 22: Tier 1 Benchmark Overview .............................................................................................................. 115 Table 23: Tier 2 Benchmark Overview .............................................................................................................. 116

The Commonwealth of Kentucky Health Care Facility Capacity Report, 2013 7
Executive Summary The individual coverage mandate and expansion of the Medicaid program may result in a majority of the Commonwealth’s 640,000 uninsured individuals obtaining health coverage starting in 2014. Through the newly-established Kentucky Health Benefit Exchange (KHBE), individuals can purchase health coverage, many with premium assistance, or qualify for Medicaid under the new eligibility rules. In early 2013, KHBE commissioned two distinct studies to test the potential impacts of coverage expansion on (i) health care work force1, and (ii) health care facility capacity across the Commonwealth2. This report summarizes the findings of the facility capacity study.
The objective of the facility capacity analysis was to test whether existing healthcare facility supply could sustain the increase in demand created as a result of anticipated insurance coverage changes across the Commonwealth. The Cabinet selected 18 distinct facility types that are subject to Certificate of Need (CON) and state licensure for further exploration.
Figure 1 identifies the 18 facility types included in this study.
Figure 1: Healthcare Facilities Selected for Inclusion in Study
In reviewing the 18 specific healthcare facility types in scope, this study followed three guiding questions: 1. Is there available capacity… 2. …aligned with geographic demand… 3. …and consistent with anticipated utilization patterns?
1 Deloitte Consulting. “The Commonwealth of Kentucky Health Care Workforce Capacity Report.” (2013). Accessed at: http://healthbenefitexchange.ky.gov/Documents/KY Healthcare Workforce Capacity Report FINAL 5_28_13.pdf 2 Ibid
I. Acute Carea. Acute care bedsb. Comprehensive physical rehab bedsd. Special care neonatal bedse. Open heart surgery programsf. Organ transplant programs
II. Mental Health Care a. Psychiatric hospital bedsb. Psychiatric residential treatment facility (PRFT)
III. Long-Term Carea. Nursing facility bedsb. Home health servicesc. Hospice servicesd. Residential hospice facilities
IV. Diagnostic and Therapeutic Equipment
and Procedures
a. Cardiac catheterization servicesb. Magnetic resonance imaging equipmentc. Megavoltage radiation equipmentd. Positron emission tomography equipment
V. Miscellaneous Services
a. . Ambulatory surgical centersc. Chemical dependency treatment bedsd. Private duty nursing services (included in III.a)e. Physical and occupational therapy services
Capacity and supply planning is driven by factors beyond CON, e.g. size of acute care center
Opportunity to explore progressive care delivery with different overall mix of services
Functional overlap

The Commonwealth of Kentucky Health Care Facility Capacity Report, 2013 8
This facility capacity study was designed to include the following components: • Projections of 2017 demand for health services and healthcare facility occupancy levels • Benchmarking of Commonwealth use of health services relative to contiguous states • Deeper exploration of drivers of health services demand and facility capacity • Suggested next steps for consideration and potential execution challenges
Given supply and demand analysis results, suggested next steps were focused in the following areas:
• Acute Care o Selection rationale: Low occupancy and statewide excess capacity o Next step for consideration: Consider consolidating and/or repurposing acute care capacity
• Nursing Facility and Home Health o Selection rationale: Chronic capacity constraints in nursing facilities o Next step for consideration: Strengthen home health and other community based services to
facilitate transition and reduce readmissions to facility-based care3 (e.g. through expansion of HCBS4 waiver programs or suspension / discontinuation of CON for home health agencies)
• Inpatient and Residential Psychiatry o Selection rationale: High utilization of inpatient psychiatric services compared to peers o Next step for consideration: Strengthen coordination of outpatient services and expand mental
health professional workforce • Imaging – MRI and PET5
o Selection rationale: Excess capacity and market distortion through partial regulation o Next step for consideration: Consider discontinuing CON program for MRI and PET
• Ambulatory Surgery Centers (ASCs) o Selection rationale: Movement toward outpatient care will drive need for ASCs o Next step for consideration: Consider discontinuing CON for ASC or relaxing State Health
Plan provisions related to ASC • Physical And Occupational Therapy
o Selection rationale: Enable transition of comprehensive rehab from inpatient to ambulatory o Next step for consideration: Recruit and retain additional PT and OT practitioners
• Health Services Data Reporting o Selection rationale: Consistency and comprehensiveness of health service data o Next step for consideration: Harmonize data reporting; combine claims and quality data
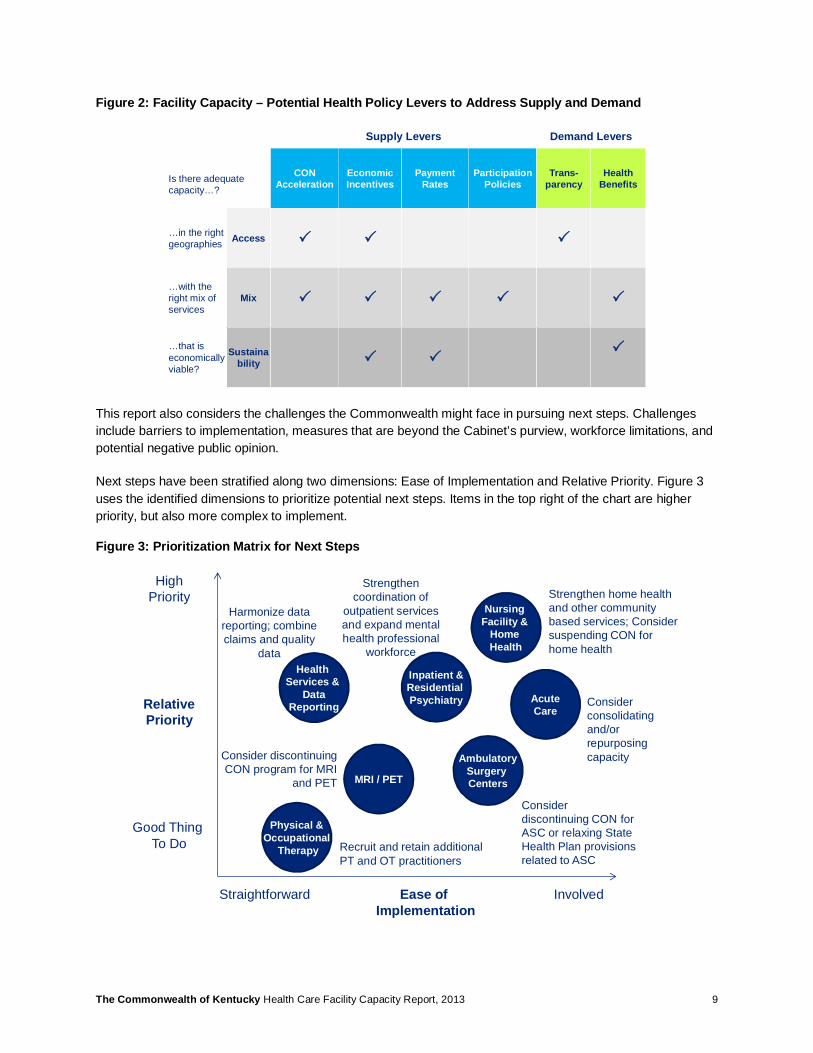
In formulating next steps for consideration for each service, a range of potential demand and supply levers were taken into consideration. Figure 2 shows a matrix of potential policy levers for consideration and how each lever impacts access, mix, and sustainability of health services. For example: CON is a supply-side lever. The CON process can impact access to services (e.g., through approval of new facilities in locations where demand for a certain service is high), as well as mix of services (e.g., by encouraging development of ambulatory care facilities over inpatient care).
3 Readmission to facility-based care after being cared for in home and community based settings is also referred to as re-institutionalization, particularly in the context of nursing facilities and long-term care 4 HBCS: Home and Community Based Services provide an alternative to facility-based long-term care 5 MRI: Magnetic Resonance Imaging; PET: Positron Emission Tomography
The Commonwealth of Kentucky Health Care Facility Capacity Report, 2013 9
Figure 2: Facility Capacity – Potential Health Policy Levers to Address Supply and Demand
This report also considers the challenges the Commonwealth might face in pursuing next steps. Challenges include barriers to implementation, measures that are beyond the Cabinet’s purview, workforce limitations, and potential negative public opinion.
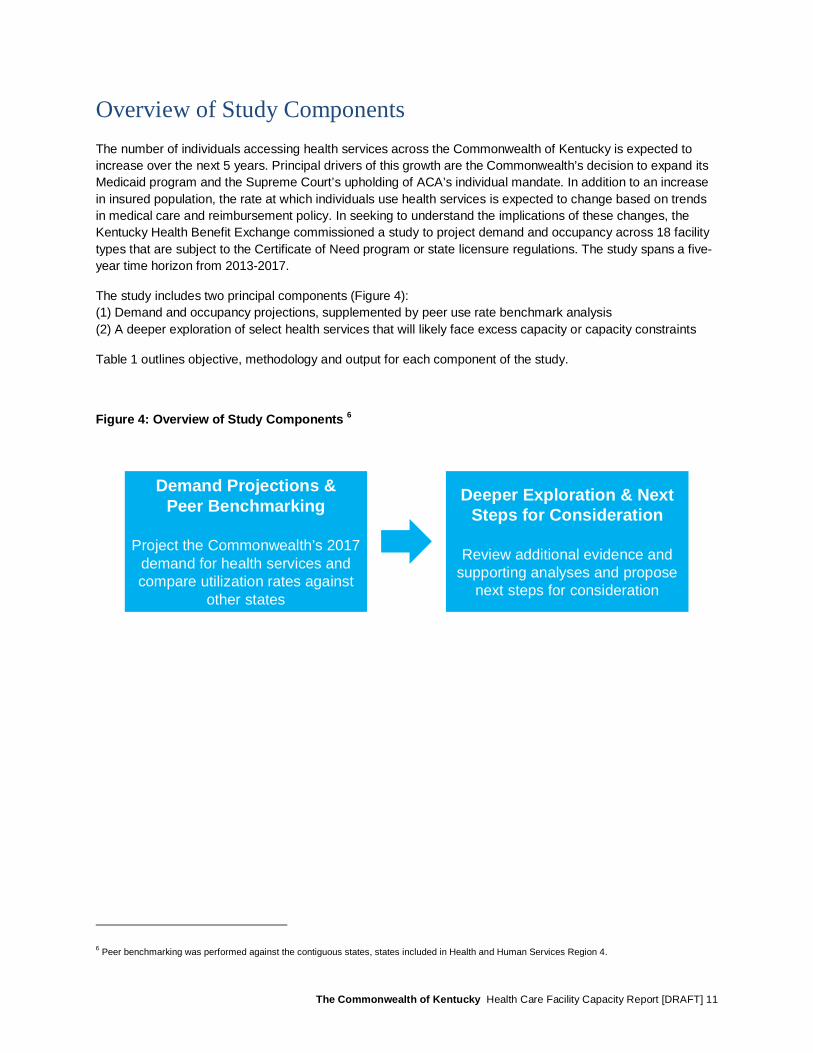
Next steps have been stratified along two dimensions: Ease of Implementation and Relative Priority. Figure 3 uses the identified dimensions to prioritize potential next steps. Items in the top right of the chart are higher priority, but also more complex to implement.
Figure 3: Prioritization Matrix for Next Steps
Supply Levers Demand Levers
Is there adequate capacity…?
CON Acceleration
EconomicIncentives
PaymentRates
Participation Policies
Trans-parency
Health Benefits
…in the right geographies Access P P P
…with the right mix of services
Mix P P P P P
…that is economically viable?
Sustainability P P
P
Consider consolidating and/or repurposing capacityConsider discontinuing
CON program for MRI and PET
Ease of Implementation
RelativePriority
Straightforward Involved
HighPriority
Good Thing To Do
Nursing Facility &
Home Health
Strengthen home health and other community based services; Consider suspending CON for home health
MRI / PET
AcuteCare
Health Services &
DataReporting
Harmonize data reporting; combine claims and quality
data
Inpatient &Residential Psychiatry
Strengthen coordination of
outpatient services and expand mental health professional
workforce
AmbulatorySurgery Centers
Consider discontinuing CON for ASC or relaxing State Health Plan provisions related to ASC
Physical &Occupational
Therapy Recruit and retain additional PT and OT practitioners

The Commonwealth of Kentucky Health Care Facility Capacity Report, 2013 10
In addition to this narrative report, Deloitte Consulting also developed a dynamic visualization tool to geo-map the underlying analysis of facility capacity and to identify areas of excess or constrained capacity across the Commonwealth. The visualization tool includes the ability to model capacity (2012), apply future state scenarios, and assess five-year projected occupancy (2017). Select output from that tool is contained within the report to illustrate specific findings; however, it is recommended the reader view both the report and visualization tool in tandem.
The Commonwealth of Kentucky Health Care Facility Capacity Report [DRAFT] 11
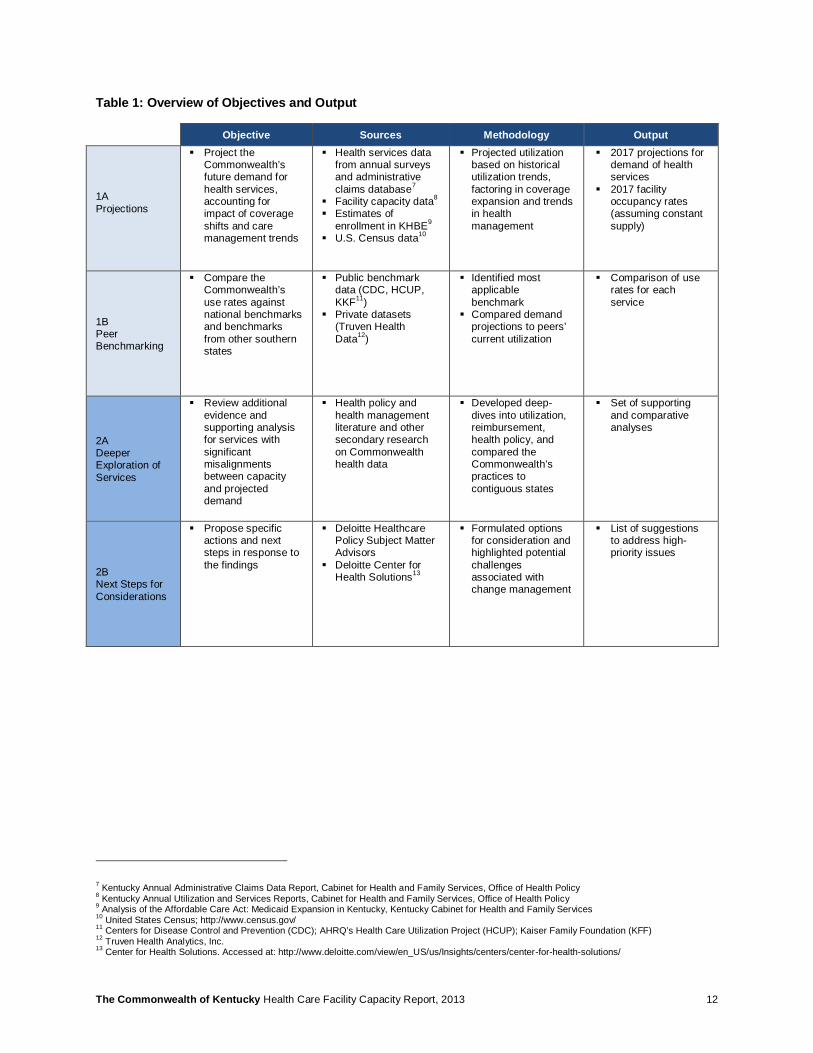
Overview of Study Components The number of individuals accessing health services across the Commonwealth of Kentucky is expected to increase over the next 5 years. Principal drivers of this growth are the Commonwealth’s decision to expand its Medicaid program and the Supreme Court’s upholding of ACA’s individual mandate. In addition to an increase in insured population, the rate at which individuals use health services is expected to change based on trends in medical care and reimbursement policy. In seeking to understand the implications of these changes, the Kentucky Health Benefit Exchange commissioned a study to project demand and occupancy across 18 facility types that are subject to the Certificate of Need program or state licensure regulations. The study spans a five-year time horizon from 2013-2017.
The study includes two principal components (Figure 4): (1) Demand and occupancy projections, supplemented by peer use rate benchmark analysis (2) A deeper exploration of select health services that will likely face excess capacity or capacity constraints
Table 1 outlines objective, methodology and output for each component of the study.
Figure 4: Overview of Study Components 6
6 Peer benchmarking was performed against the contiguous states, states included in Health and Human Services Region 4.
Demand Projections & Peer Benchmarking
Project the Commonwealth’s 2017 demand for health services and compare utilization rates against
other states
Deeper Exploration & Next Steps for Consideration
Review additional evidence and supporting analyses and propose
next steps for consideration
The Commonwealth of Kentucky Health Care Facility Capacity Report, 2013 12
Table 1: Overview of Objectives and Output
Objective Sources Methodology Output
1A Projections
§ Project the Commonwealth’s future demand for health services, accounting for impact of coverage shifts and care management trends
§ Health services data from annual surveys and administrative claims database7
§ Facility capacity data8 § Estimates of
enrollment in KHBE9 § U.S. Census data10
§ Projected utilization based on historical utilization trends, factoring in coverage expansion and trends in health management
§ 2017 projections for demand of health services
§ 2017 facility occupancy rates (assuming constant supply)
1B Peer Benchmarking
§ Compare the Commonwealth’s use rates against national benchmarks and benchmarks from other southern states
§ Public benchmark data (CDC, HCUP, KKF11)
§ Private datasets (Truven Health Data12)
§ Identified most applicable benchmark
§ Compared demand projections to peers’ current utilization
§ Comparison of use rates for each service
2A Deeper Exploration of Services
§ Review additional evidence and supporting analysis for services with significant misalignments between capacity and projected demand
§ Health policy and health management literature and other secondary research on Commonwealth health data
§ Developed deep-dives into utilization, reimbursement, health policy, and compared the Commonwealth’s practices to contiguous states
§ Set of supporting and comparative analyses
2B Next Steps for Considerations
§ Propose specific actions and next steps in response to the findings
§ Deloitte Healthcare Policy Subject Matter Advisors
§ Deloitte Center for Health Solutions13
§ Formulated options for consideration and highlighted potential challenges associated with change management
§ List of suggestions to address high-priority issues
7 Kentucky Annual Administrative Claims Data Report, Cabinet for Health and Family Services, Office of Health Policy 8 Kentucky Annual Utilization and Services Reports, Cabinet for Health and Family Services, Office of Health Policy 9 Analysis of the Affordable Care Act: Medicaid Expansion in Kentucky, Kentucky Cabinet for Health and Family Services 10 United States Census; http://www.census.gov/ 11 Centers for Disease Control and Prevention (CDC); AHRQ’s Health Care Utilization Project (HCUP); Kaiser Family Foundation (KFF) 12 Truven Health Analytics, Inc. 13 Center for Health Solutions. Accessed at: http://www.deloitte.com/view/en_US/us/Insights/centers/center-for-health-solutions/
The Commonwealth of Kentucky Health Care Facility Capacity Report, 2013 13
Demand Projections &
Peer Benchmarking
Projection Methodology 14
Projection Results 25
Sensitivity Analysis & Future State Scenarios 30
Limitations of Projection Analysis 38
Peer Benchmark 39
The Commonwealth of Kentucky Health Care Facility Capacity Report, 2013 14
1 Projection Methodology
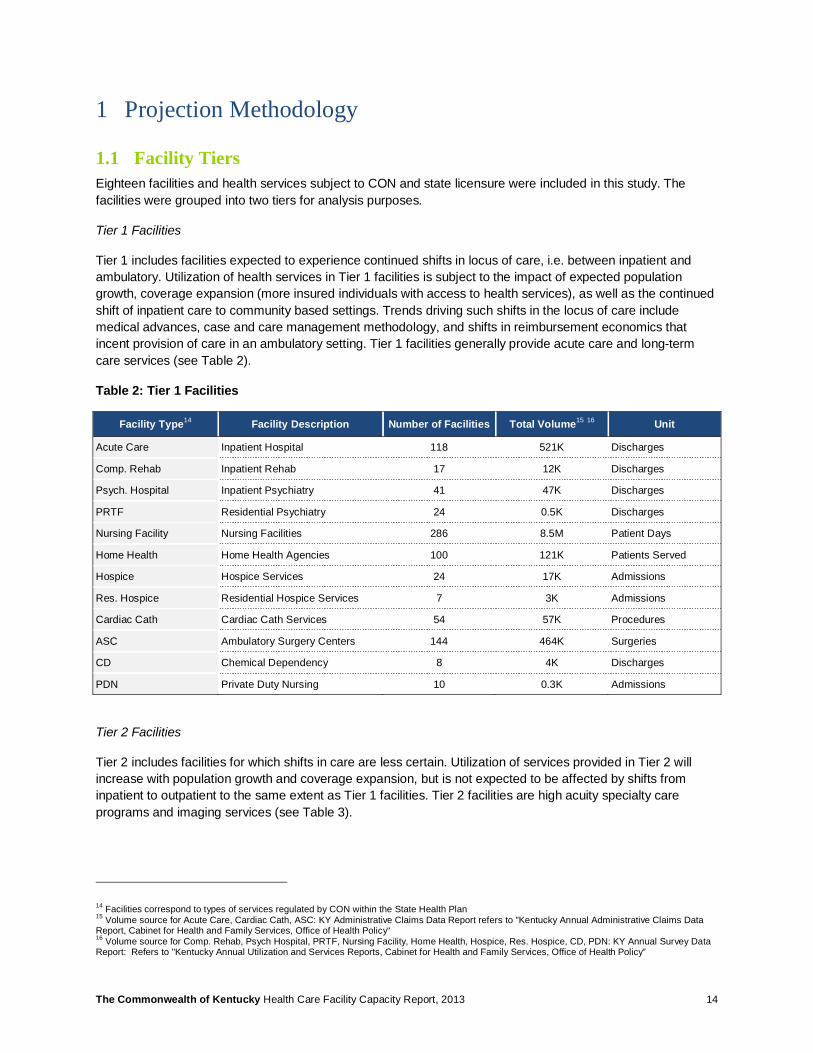
1.1 Facility Tiers Eighteen facilities and health services subject to CON and state licensure were included in this study. The facilities were grouped into two tiers for analysis purposes.
Tier 1 Facilities
Tier 1 includes facilities expected to experience continued shifts in locus of care, i.e. between inpatient and ambulatory. Utilization of health services in Tier 1 facilities is subject to the impact of expected population growth, coverage expansion (more insured individuals with access to health services), as well as the continued shift of inpatient care to community based settings. Trends driving such shifts in the locus of care include medical advances, case and care management methodology, and shifts in reimbursement economics that incent provision of care in an ambulatory setting. Tier 1 facilities generally provide acute care and long-term care services (see Table 2).
Table 2: Tier 1 Facilities
Facility Type14 Facility Description Number of Facilities Total Volume15 16 Unit
Acute Care Inpatient Hospital 118 521K Discharges
Comp. Rehab Inpatient Rehab 17 12K Discharges
Psych. Hospital Inpatient Psychiatry 41 47K Discharges
PRTF Residential Psychiatry 24 0.5K Discharges
Nursing Facility Nursing Facilities 286 8.5M Patient Days
Home Health Home Health Agencies 100 121K Patients Served
Hospice Hospice Services 24 17K Admissions
Res. Hospice Residential Hospice Services 7 3K Admissions
Cardiac Cath Cardiac Cath Services 54 57K Procedures
ASC Ambulatory Surgery Centers 144 464K Surgeries
CD Chemical Dependency 8 4K Discharges
PDN Private Duty Nursing 10 0.3K Admissions
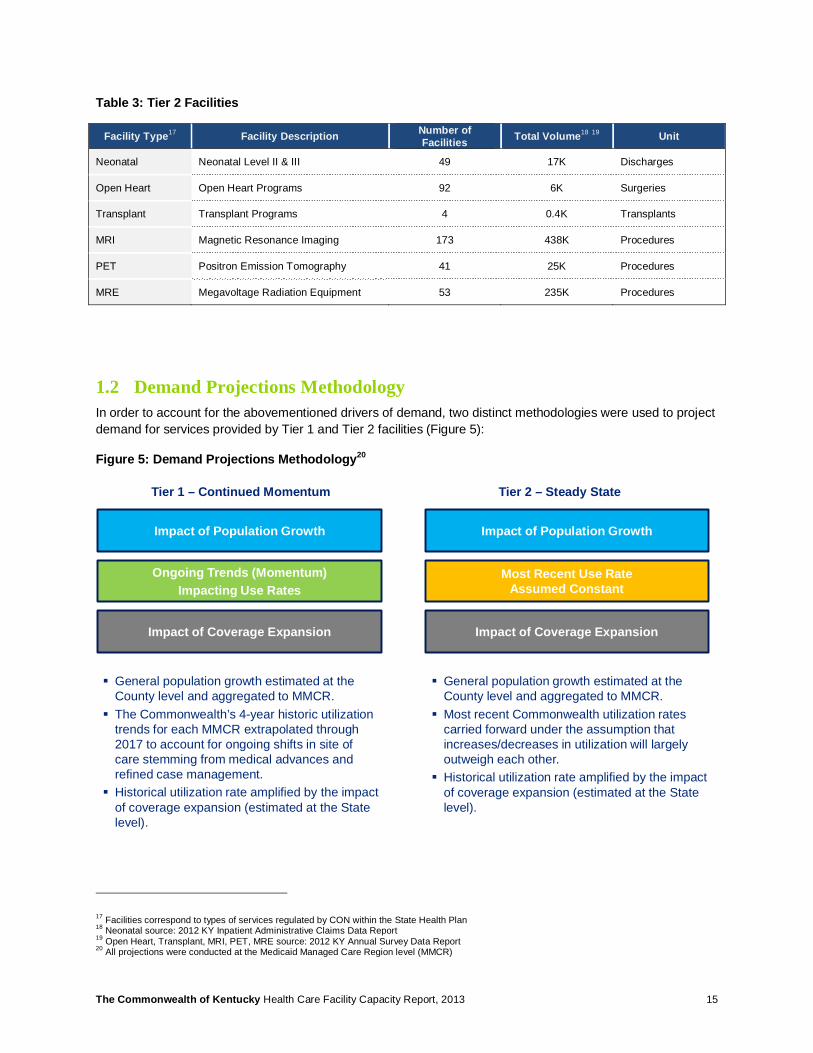
Tier 2 Facilities
Tier 2 includes facilities for which shifts in care are less certain. Utilization of services provided in Tier 2 will increase with population growth and coverage expansion, but is not expected to be affected by shifts from inpatient to outpatient to the same extent as Tier 1 facilities. Tier 2 facilities are high acuity specialty care programs and imaging services (see Table 3).
14 Facilities correspond to types of services regulated by CON within the State Health Plan 15 Volume source for Acute Care, Cardiac Cath, ASC: KY Administrative Claims Data Report refers to "Kentucky Annual Administrative Claims Data Report, Cabinet for Health and Family Services, Office of Health Policy“ 16 Volume source for Comp. Rehab, Psych Hospital, PRTF, Nursing Facility, Home Health, Hospice, Res. Hospice, CD, PDN: KY Annual Survey Data Report: Refers to "Kentucky Annual Utilization and Services Reports, Cabinet for Health and Family Services, Office of Health Policy”
The Commonwealth of Kentucky Health Care Facility Capacity Report, 2013 15
Table 3: Tier 2 Facilities
Facility Type17 Facility Description Number of Facilities Total Volume18 19 Unit
Neonatal Neonatal Level II & III 49 17K Discharges
Open Heart Open Heart Programs 92 6K Surgeries
Transplant Transplant Programs 4 0.4K Transplants
MRI Magnetic Resonance Imaging 173 438K Procedures
PET Positron Emission Tomography 41 25K Procedures
MRE Megavoltage Radiation Equipment 53 235K Procedures
1.2 Demand Projections Methodology In order to account for the abovementioned drivers of demand, two distinct methodologies were used to project demand for services provided by Tier 1 and Tier 2 facilities (Figure 5):
Figure 5: Demand Projections Methodology20
17 Facilities correspond to types of services regulated by CON within the State Health Plan 18 Neonatal source: 2012 KY Inpatient Administrative Claims Data Report 19 Open Heart, Transplant, MRI, PET, MRE source: 2012 KY Annual Survey Data Report 20 All projections were conducted at the Medicaid Managed Care Region level (MMCR)
Ongoing Trends (Momentum) Impacting Use Rates
Tier 1 – Continued Momentum Tier 2 – Steady State
Impact of Population Growth
Impact of Coverage Expansion
Impact of Population Growth
Impact of Coverage Expansion
§ General population growth estimated at the County level and aggregated to MMCR.§ The Commonwealth’s 4-year historic utilization
trends for each MMCR extrapolated through 2017 to account for ongoing shifts in site of care stemming from medical advances and refined case management.§ Historical utilization rate amplified by the impact
of coverage expansion (estimated at the State level).
§ General population growth estimated at the County level and aggregated to MMCR.§ Most recent Commonwealth utilization rates
carried forward under the assumption that increases/decreases in utilization will largely outweigh each other.§ Historical utilization rate amplified by the impact
of coverage expansion (estimated at the State level).
Most Recent Use Rate Assumed Constant
The Commonwealth of Kentucky Health Care Facility Capacity Report, 2013 16
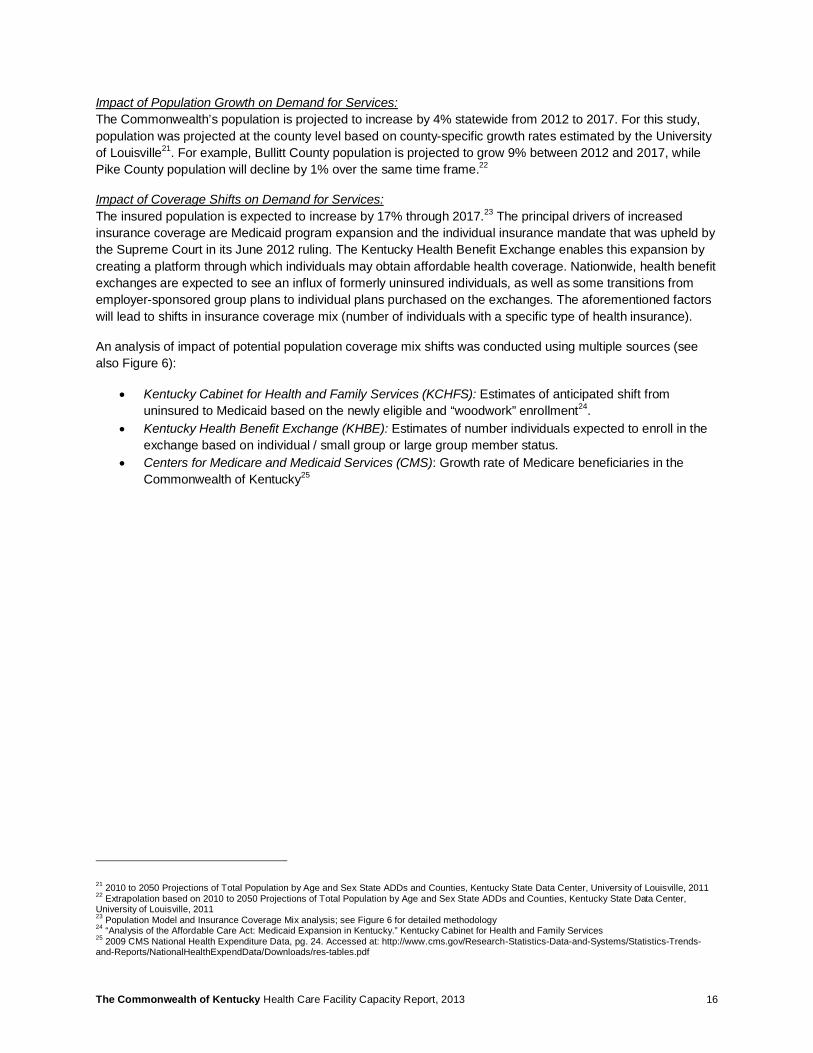
Impact of Population Growth on Demand for Services: The Commonwealth’s population is projected to increase by 4% statewide from 2012 to 2017. For this study, population was projected at the county level based on county-specific growth rates estimated by the University of Louisville21. For example, Bullitt County population is projected to grow 9% between 2012 and 2017, while Pike County population will decline by 1% over the same time frame.22
Impact of Coverage Shifts on Demand for Services: The insured population is expected to increase by 17% through 2017.23 The principal drivers of increased insurance coverage are Medicaid program expansion and the individual insurance mandate that was upheld by the Supreme Court in its June 2012 ruling. The Kentucky Health Benefit Exchange enables this expansion by creating a platform through which individuals may obtain affordable health coverage. Nationwide, health benefit exchanges are expected to see an influx of formerly uninsured individuals, as well as some transitions from employer-sponsored group plans to individual plans purchased on the exchanges. The aforementioned factors will lead to shifts in insurance coverage mix (number of individuals with a specific type of health insurance).
An analysis of impact of potential population coverage mix shifts was conducted using multiple sources (see also Figure 6):
• Kentucky Cabinet for Health and Family Services (KCHFS): Estimates of anticipated shift from uninsured to Medicaid based on the newly eligible and “woodwork” enrollment24.
• Kentucky Health Benefit Exchange (KHBE): Estimates of number individuals expected to enroll in the exchange based on individual / small group or large group member status.
• Centers for Medicare and Medicaid Services (CMS): Growth rate of Medicare beneficiaries in the Commonwealth of Kentucky25
21 2010 to 2050 Projections of Total Population by Age and Sex State ADDs and Counties, Kentucky State Data Center, University of Louisville, 2011 22 Extrapolation based on 2010 to 2050 Projections of Total Population by Age and Sex State ADDs and Counties, Kentucky State Data Center, University of Louisville, 2011 23 Population Model and Insurance Coverage Mix analysis; see Figure 6 for detailed methodology 24 “Analysis of the Affordable Care Act: Medicaid Expansion in Kentucky.” Kentucky Cabinet for Health and Family Services 25 2009 CMS National Health Expenditure Data, pg. 24. Accessed at: http://www.cms.gov/Research-Statistics-Data-and-Systems/Statistics-Trends-and-Reports/NationalHealthExpendData/Downloads/res-tables.pdf
The Commonwealth of Kentucky Health Care Facility Capacity Report, 2013 17
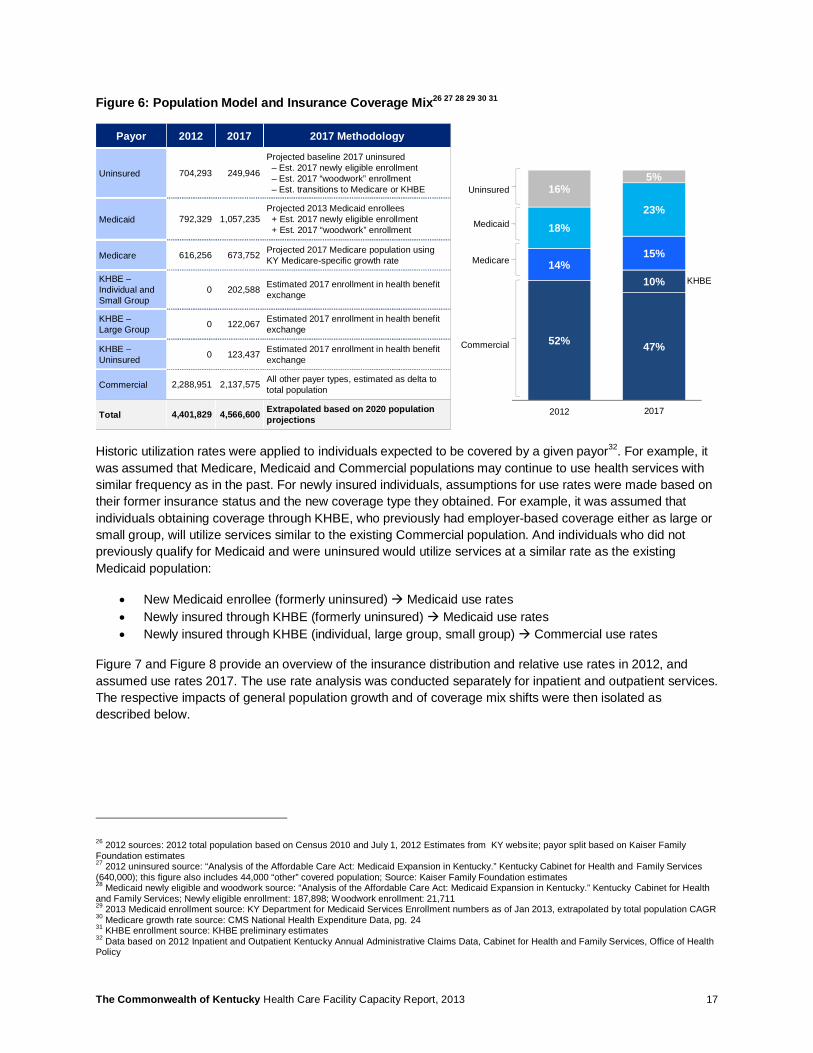
Figure 6: Population Model and Insurance Coverage Mix26 27 28 29 30 31
Historic utilization rates were applied to individuals expected to be covered by a given payor32. For example, it was assumed that Medicare, Medicaid and Commercial populations may continue to use health services with similar frequency as in the past. For newly insured individuals, assumptions for use rates were made based on their former insurance status and the new coverage type they obtained. For example, it was assumed that individuals obtaining coverage through KHBE, who previously had employer-based coverage either as large or small group, will utilize services similar to the existing Commercial population. And individuals who did not previously qualify for Medicaid and were uninsured would utilize services at a similar rate as the existing Medicaid population:
• New Medicaid enrollee (formerly uninsured) à Medicaid use rates • Newly insured through KHBE (formerly uninsured) à Medicaid use rates • Newly insured through KHBE (individual, large group, small group) à Commercial use rates
Figure 7 and Figure 8 provide an overview of the insurance distribution and relative use rates in 2012, and assumed use rates 2017. The use rate analysis was conducted separately for inpatient and outpatient services. The respective impacts of general population growth and of coverage mix shifts were then isolated as described below.
26 2012 sources: 2012 total population based on Census 2010 and July 1, 2012 Estimates from KY website; payor split based on Kaiser Family Foundation estimates 27 2012 uninsured source: “Analysis of the Affordable Care Act: Medicaid Expansion in Kentucky.” Kentucky Cabinet for Health and Family Services (640,000); this figure also includes 44,000 “other” covered population; Source: Kaiser Family Foundation estimates 28 Medicaid newly eligible and woodwork source: “Analysis of the Affordable Care Act: Medicaid Expansion in Kentucky.” Kentucky Cabinet for Health and Family Services; Newly eligible enrollment: 187,898; Woodwork enrollment: 21,711 29 2013 Medicaid enrollment source: KY Department for Medicaid Services Enrollment numbers as of Jan 2013, extrapolated by total population CAGR 30 Medicare growth rate source: CMS National Health Expenditure Data, pg. 24 31 KHBE enrollment source: KHBE preliminary estimates 32 Data based on 2012 Inpatient and Outpatient Kentucky Annual Administrative Claims Data, Cabinet for Health and Family Services, Office of Health Policy
Payor 2012 2017 2017 Methodology
Uninsured 704,293 249,946
Projected baseline 2017 uninsured– Est. 2017 newly eligible enrollment– Est. 2017 “woodwork” enrollment– Est. transitions to Medicare or KHBE
Medicaid 792,329 1,057,235 Projected 2013 Medicaid enrollees
+ Est. 2017 newly eligible enrollment+ Est. 2017 “woodwork” enrollment
Medicare 616,256 673,752 Projected 2017 Medicare population using KY Medicare-specific growth rate
KHBE –Individual and Small Group
0 202,588 Estimated 2017 enrollment in health benefit exchange
KHBE –Large Group 0 122,067 Estimated 2017 enrollment in health benefit
exchange
KHBE –Uninsured 0 123,437 Estimated 2017 enrollment in health benefit
exchange
Commercial 2,288,951 2,137,575 All other payer types, estimated as delta to total population
Total 4,401,829 4,566,600 Extrapolated based on 2020 populationprojections
52% 47%
10%14%
15%
18%23%
16%5%
2011 2017
Uninsured
Medicaid
Medicare
KHBE
Commercial
2012
The Commonwealth of Kentucky Health Care Facility Capacity Report, 2013 18
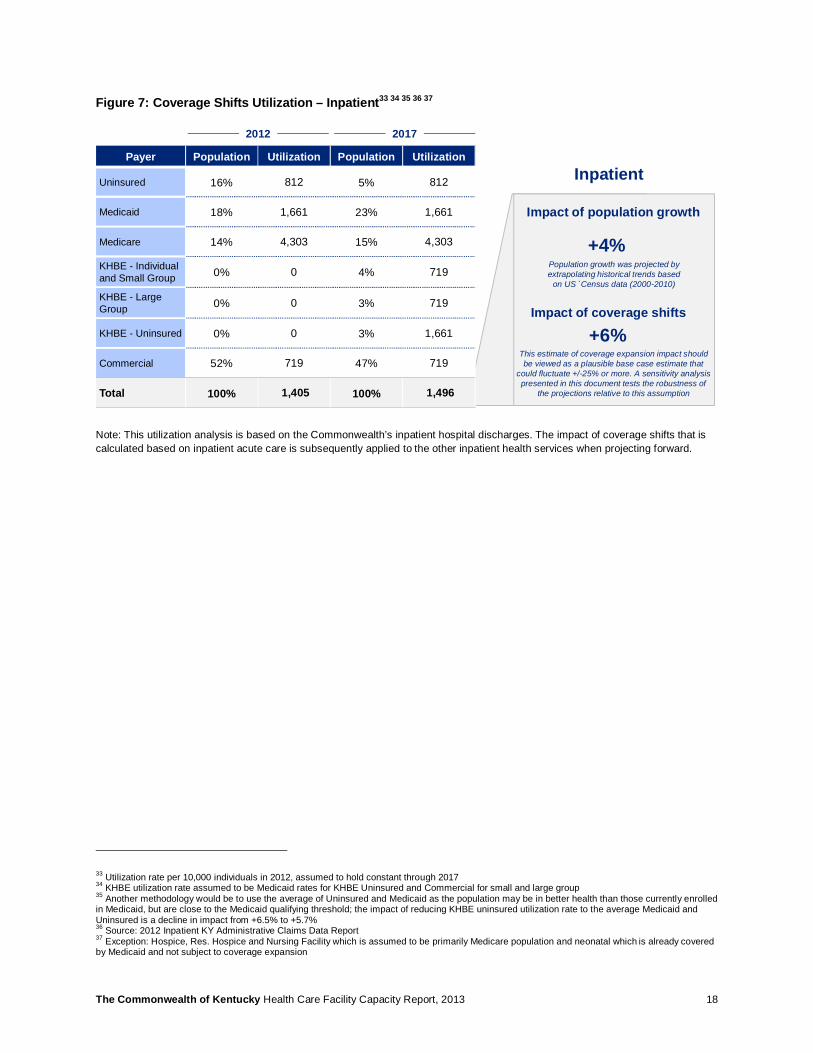
Figure 7: Coverage Shifts Utilization – Inpatient33 34 35 36 37
Note: This utilization analysis is based on the Commonwealth’s inpatient hospital discharges. The impact of coverage shifts that is calculated based on inpatient acute care is subsequently applied to the other inpatient health services when projecting forward.
33 Utilization rate per 10,000 individuals in 2012, assumed to hold constant through 2017 34 KHBE utilization rate assumed to be Medicaid rates for KHBE Uninsured and Commercial for small and large group 35 Another methodology would be to use the average of Uninsured and Medicaid as the population may be in better health than those currently enrolled in Medicaid, but are close to the Medicaid qualifying threshold; the impact of reducing KHBE uninsured utilization rate to the average Medicaid and Uninsured is a decline in impact from +6.5% to +5.7% 36 Source: 2012 Inpatient KY Administrative Claims Data Report 37 Exception: Hospice, Res. Hospice and Nursing Facility which is assumed to be primarily Medicare population and neonatal which is already covered by Medicaid and not subject to coverage expansion
Payer Population Utilization Population Utilization
Uninsured 16% 812 5% 812
Medicaid 18% 1,661 23% 1,661
Medicare 14% 4,303 15% 4,303
KHBE - Individual and Small Group 0% 0 4% 719
KHBE - Large Group 0% 0 3% 719
KHBE - Uninsured 0% 0 3% 1,661
Commercial 52% 719 47% 719
Total 100% 1,405 100% 1,496
2012 2017
Impact of population growth
Impact of coverage shifts
+4%
+6%
Inpatient
Population growth was projected by extrapolating historical trends based
on US `Census data (2000-2010)
This estimate of coverage expansion impact should be viewed as a plausible base case estimate that
could fluctuate +/-25% or more. A sensitivity analysis presented in this document tests the robustness of
the projections relative to this assumption
The Commonwealth of Kentucky Health Care Facility Capacity Report, 2013 19
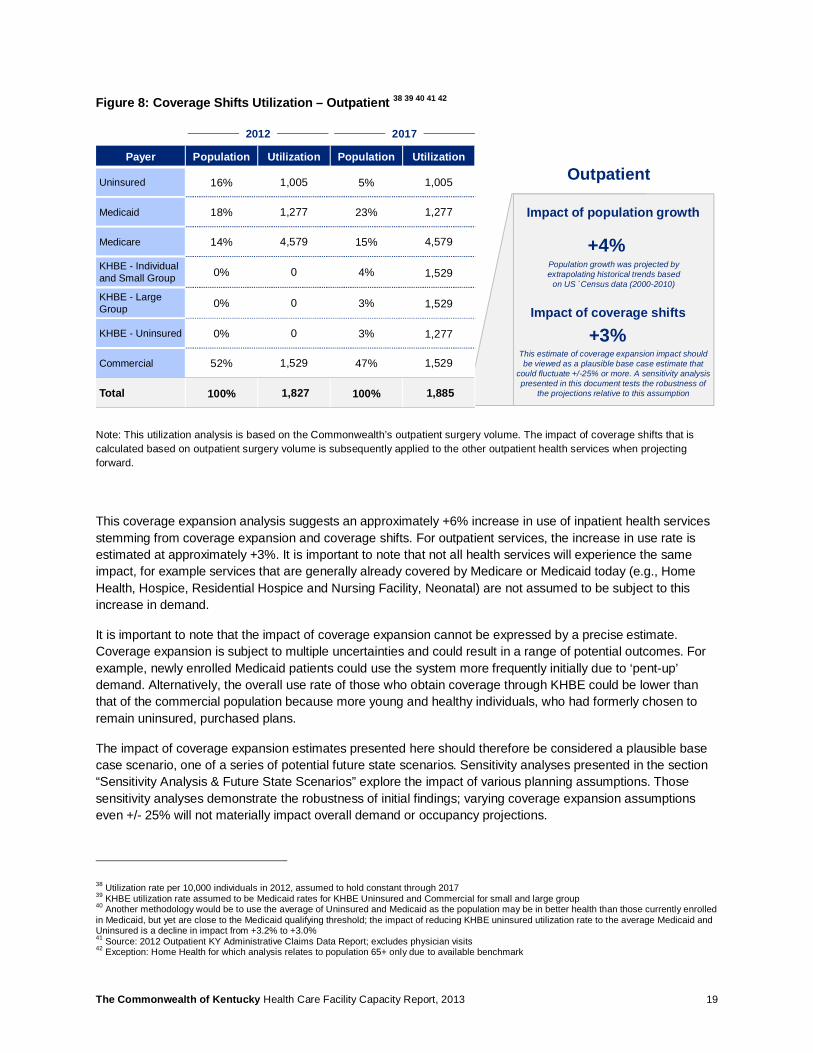
Figure 8: Coverage Shifts Utilization – Outpatient 38 39 40 41 42
Note: This utilization analysis is based on the Commonwealth’s outpatient surgery volume. The impact of coverage shifts that is calculated based on outpatient surgery volume is subsequently applied to the other outpatient health services when projecting forward.
This coverage expansion analysis suggests an approximately +6% increase in use of inpatient health services stemming from coverage expansion and coverage shifts. For outpatient services, the increase in use rate is estimated at approximately +3%. It is important to note that not all health services will experience the same impact, for example services that are generally already covered by Medicare or Medicaid today (e.g., Home Health, Hospice, Residential Hospice and Nursing Facility, Neonatal) are not assumed to be subject to this increase in demand.
It is important to note that the impact of coverage expansion cannot be expressed by a precise estimate. Coverage expansion is subject to multiple uncertainties and could result in a range of potential outcomes. For example, newly enrolled Medicaid patients could use the system more frequently initially due to ‘pent-up’ demand. Alternatively, the overall use rate of those who obtain coverage through KHBE could be lower than that of the commercial population because more young and healthy individuals, who had formerly chosen to remain uninsured, purchased plans.
The impact of coverage expansion estimates presented here should therefore be considered a plausible base case scenario, one of a series of potential future state scenarios. Sensitivity analyses presented in the section “Sensitivity Analysis & Future State Scenarios” explore the impact of various planning assumptions. Those sensitivity analyses demonstrate the robustness of initial findings; varying coverage expansion assumptions even +/- 25% will not materially impact overall demand or occupancy projections.
38 Utilization rate per 10,000 individuals in 2012, assumed to hold constant through 2017 39 KHBE utilization rate assumed to be Medicaid rates for KHBE Uninsured and Commercial for small and large group 40 Another methodology would be to use the average of Uninsured and Medicaid as the population may be in better health than those currently enrolled in Medicaid, but yet are close to the Medicaid qualifying threshold; the impact of reducing KHBE uninsured utilization rate to the average Medicaid and Uninsured is a decline in impact from +3.2% to +3.0% 41 Source: 2012 Outpatient KY Administrative Claims Data Report; excludes physician visits 42 Exception: Home Health for which analysis relates to population 65+ only due to available benchmark
Impact of population growth
+4%
OutpatientPayer Population Utilization Population Utilization
Uninsured 16% 1,005 5% 1,005
Medicaid 18% 1,277 23% 1,277
Medicare 14% 4,579 15% 4,579
KHBE - Individual and Small Group 0% 0 4% 1,529
KHBE - Large Group 0% 0 3% 1,529
KHBE - Uninsured 0% 0 3% 1,277
Commercial 52% 1,529 47% 1,529
Total 100% 1,827 100% 1,885
2012 2017
Impact of coverage shifts
+3%
Population growth was projected by extrapolating historical trends based
on US `Census data (2000-2010)
This estimate of coverage expansion impact should be viewed as a plausible base case estimate that
could fluctuate +/-25% or more. A sensitivity analysis presented in this document tests the robustness of
the projections relative to this assumption
The Commonwealth of Kentucky Health Care Facility Capacity Report, 2013 20
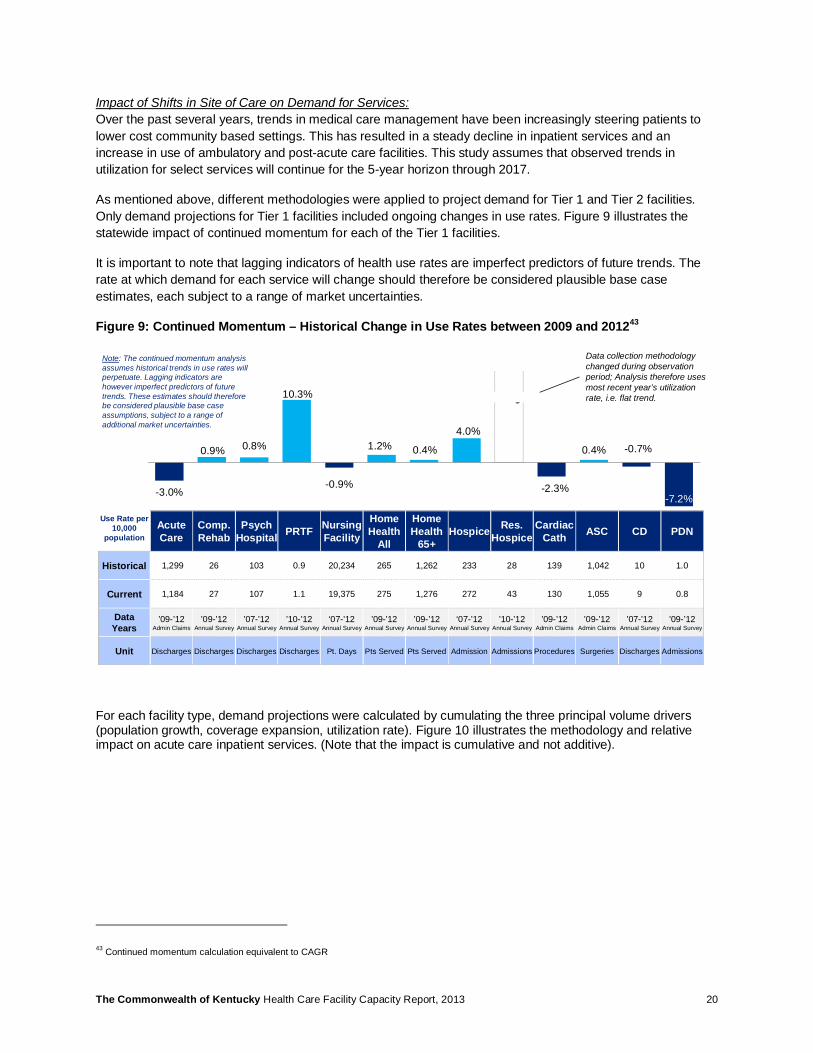
Impact of Shifts in Site of Care on Demand for Services: Over the past several years, trends in medical care management have been increasingly steering patients to lower cost community based settings. This has resulted in a steady decline in inpatient services and an increase in use of ambulatory and post-acute care facilities. This study assumes that observed trends in utilization for select services will continue for the 5-year horizon through 2017.
As mentioned above, different methodologies were applied to project demand for Tier 1 and Tier 2 facilities. Only demand projections for Tier 1 facilities included ongoing changes in use rates. Figure 9 illustrates the statewide impact of continued momentum for each of the Tier 1 facilities.
It is important to note that lagging indicators of health use rates are imperfect predictors of future trends. The rate at which demand for each service will change should therefore be considered plausible base case estimates, each subject to a range of market uncertainties.
Figure 9: Continued Momentum – Historical Change in Use Rates between 2009 and 201243
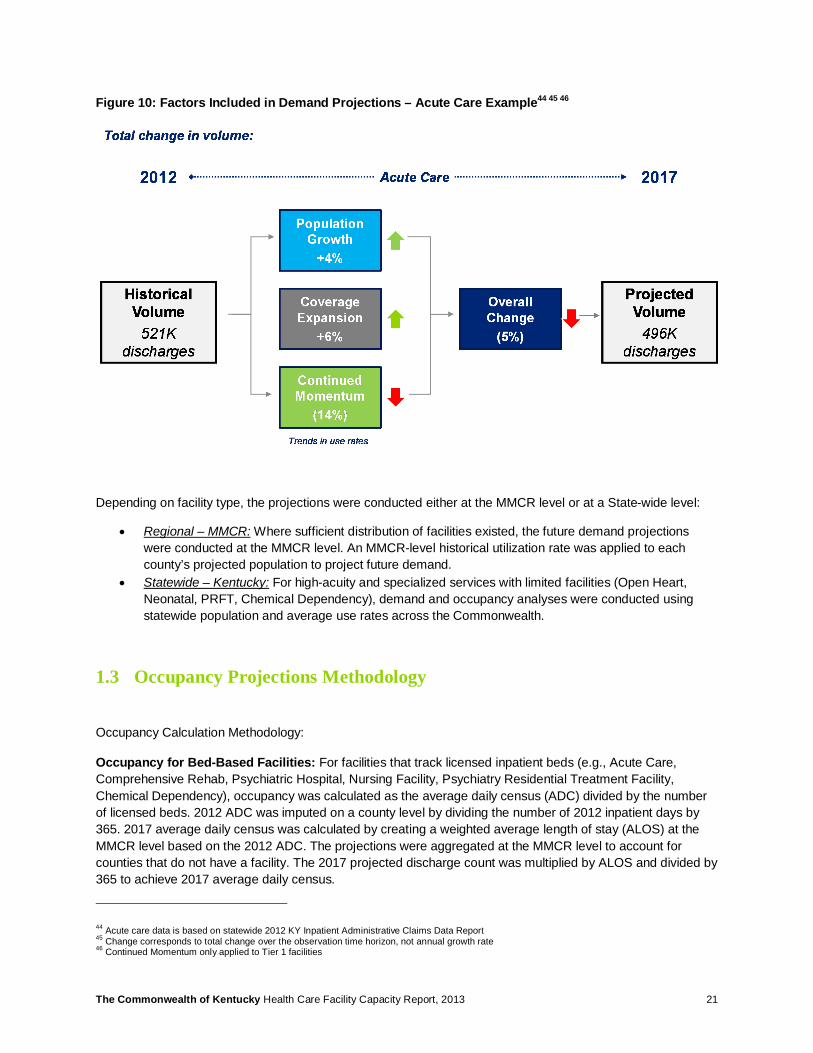
For each facility type, demand projections were calculated by cumulating the three principal volume drivers (population growth, coverage expansion, utilization rate). Figure 10 illustrates the methodology and relative impact on acute care inpatient services. (Note that the impact is cumulative and not additive).
43 Continued momentum calculation equivalent to CAGR
-3.0%
0.9% 0.8%
10.3%
-0.9%
1.2% 0.4%
4.0%
-2.3%
0.4% -0.7%
-7.2%
Use Rate per 10,000
populationAcute Care
Comp. Rehab
Psych Hospital PRTF Nursing
Facility
Home Health
All
Home Health
65+Hospice Res.
HospiceCardiac
Cath ASC CD PDN
Historical 1,299 26 103 0.9 20,234 265 1,262 233 28 139 1,042 10 1.0
Current 1,184 27 107 1.1 19,375 275 1,276 272 43 130 1,055 9 0.8
Data Years
’09-’12Admin Claims
’09-’12Annual Survey
’07-’12Annual Survey
’10-’12Annual Survey
‘07-’12Annual Survey
’09-’12Annual Survey
’09-’12Annual Survey
‘07-’12Annual Survey
’10-’12Annual Survey
’09-’12Admin Claims
’09-’12Admin Claims
’07-’12Annual Survey
’09-’12Annual Survey
Unit Discharges Discharges Discharges Discharges Pt. Days Pts Served Pts Served Admission Admissions Procedures Surgeries Discharges Admissions
Data collection methodology changed during observation period; Analysis therefore uses most recent year’s utilization rate, i.e. flat trend.
Note: The continued momentum analysis assumes historical trends in use rates will perpetuate. Lagging indicators are however imperfect predictors of future trends. These estimates should therefore be considered plausible base case assumptions, subject to a range of additional market uncertainties.
The Commonwealth of Kentucky Health Care Facility Capacity Report, 2013 21
Figure 10: Factors Included in Demand Projections – Acute Care Example44 45 46
Depending on facility type, the projections were conducted either at the MMCR level or at a State-wide level:
• Regional – MMCR: Where sufficient distribution of facilities existed, the future demand projections were conducted at the MMCR level. An MMCR-level historical utilization rate was applied to each county’s projected population to project future demand.
• Statewide – Kentucky: For high-acuity and specialized services with limited facilities (Open Heart, Neonatal, PRFT, Chemical Dependency), demand and occupancy analyses were conducted using statewide population and average use rates across the Commonwealth.
1.3 Occupancy Projections Methodology
Occupancy Calculation Methodology:
Occupancy for Bed-Based Facilities: For facilities that track licensed inpatient beds (e.g., Acute Care, Comprehensive Rehab, Psychiatric Hospital, Nursing Facility, Psychiatry Residential Treatment Facility, Chemical Dependency), occupancy was calculated as the average daily census (ADC) divided by the number of licensed beds. 2012 ADC was imputed on a county level by dividing the number of 2012 inpatient days by 365. 2017 average daily census was calculated by creating a weighted average length of stay (ALOS) at the MMCR level based on the 2012 ADC. The projections were aggregated at the MMCR level to account for counties that do not have a facility. The 2017 projected discharge count was multiplied by ALOS and divided by 365 to achieve 2017 average daily census.
44 Acute care data is based on statewide 2012 KY Inpatient Administrative Claims Data Report 45 Change corresponds to total change over the observation time horizon, not annual growth rate 46 Continued Momentum only applied to Tier 1 facilities
The Commonwealth of Kentucky Health Care Facility Capacity Report, 2013 22
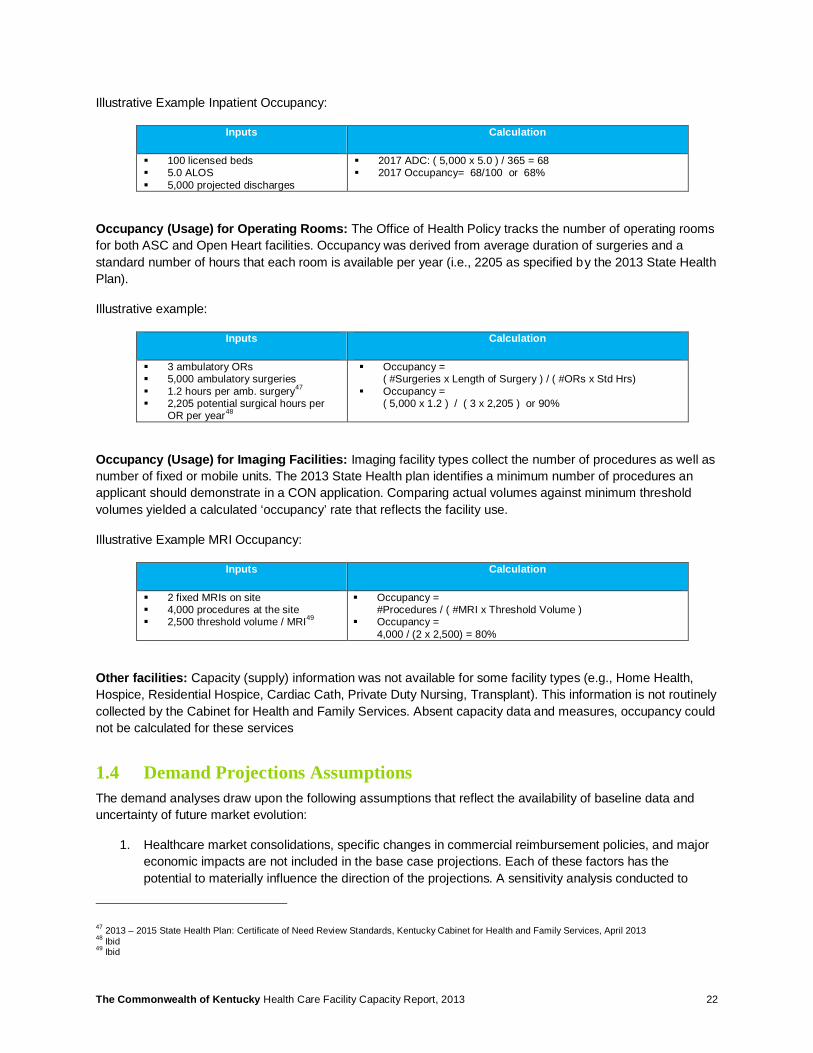
Illustrative Example Inpatient Occupancy:
Inputs Calculation
§ 100 licensed beds § 5.0 ALOS § 5,000 projected discharges
§ 2017 ADC: ( 5,000 x 5.0 ) / 365 = 68 § 2017 Occupancy= 68/100 or 68%
Occupancy (Usage) for Operating Rooms: The Office of Health Policy tracks the number of operating rooms for both ASC and Open Heart facilities. Occupancy was derived from average duration of surgeries and a standard number of hours that each room is available per year (i.e., 2205 as specified by the 2013 State Health Plan).
Illustrative example:
Inputs Calculation
§ 3 ambulatory ORs § 5,000 ambulatory surgeries § 1.2 hours per amb. surgery47 § 2,205 potential surgical hours per
OR per year48
§ Occupancy = ( #Surgeries x Length of Surgery ) / ( #ORs x Std Hrs)
§ Occupancy = ( 5,000 x 1.2 ) / ( 3 x 2,205 ) or 90%
Occupancy (Usage) for Imaging Facilities: Imaging facility types collect the number of procedures as well as number of fixed or mobile units. The 2013 State Health plan identifies a minimum number of procedures an applicant should demonstrate in a CON application. Comparing actual volumes against minimum threshold volumes yielded a calculated ‘occupancy’ rate that reflects the facility use.
Illustrative Example MRI Occupancy:
Inputs Calculation
§ 2 fixed MRIs on site § 4,000 procedures at the site § 2,500 threshold volume / MRI49
§ Occupancy = #Procedures / ( #MRI x Threshold Volume )
§ Occupancy = 4,000 / (2 x 2,500) = 80%
Other facilities: Capacity (supply) information was not available for some facility types (e.g., Home Health, Hospice, Residential Hospice, Cardiac Cath, Private Duty Nursing, Transplant). This information is not routinely collected by the Cabinet for Health and Family Services. Absent capacity data and measures, occupancy could not be calculated for these services
1.4 Demand Projections Assumptions The demand analyses draw upon the following assumptions that reflect the availability of baseline data and uncertainty of future market evolution:
1. Healthcare market consolidations, specific changes in commercial reimbursement policies, and major economic impacts are not included in the base case projections. Each of these factors has the potential to materially influence the direction of the projections. A sensitivity analysis conducted to
47 2013 – 2015 State Health Plan: Certificate of Need Review Standards, Kentucky Cabinet for Health and Family Services, April 2013 48 Ibid 49 Ibid
The Commonwealth of Kentucky Health Care Facility Capacity Report, 2013 23
assess the effect of altering specific planning assumptions demonstrated that the demand projections are durable relative to coverage expansion and continued momentum trends (see Section 3).
2. Average length of stay for inpatient facilities was assumed to remain constant over the observation period. This assumption is based on available information, acknowledging that arguments could be made to extend or shorten assumed length of stay. For example: As healthier individuals are increasingly cared for as outpatients, inpatient facilities may be left with sicker patients that require longer hospitalization. Conversely, significant care management methods could result in overall healthier populations that require fewer and shorter inpatient stays.
3. Historical utilization trends in the Commonwealth assumed general improvements in medical care management, i.e. a shift from inpatient to ambulatory setting. The projections assume that historical trends will continue for the next 5-7 years. However, lagging indicators are not exact predictors for future trends and projections remain subject to a range of health care market uncertainties.
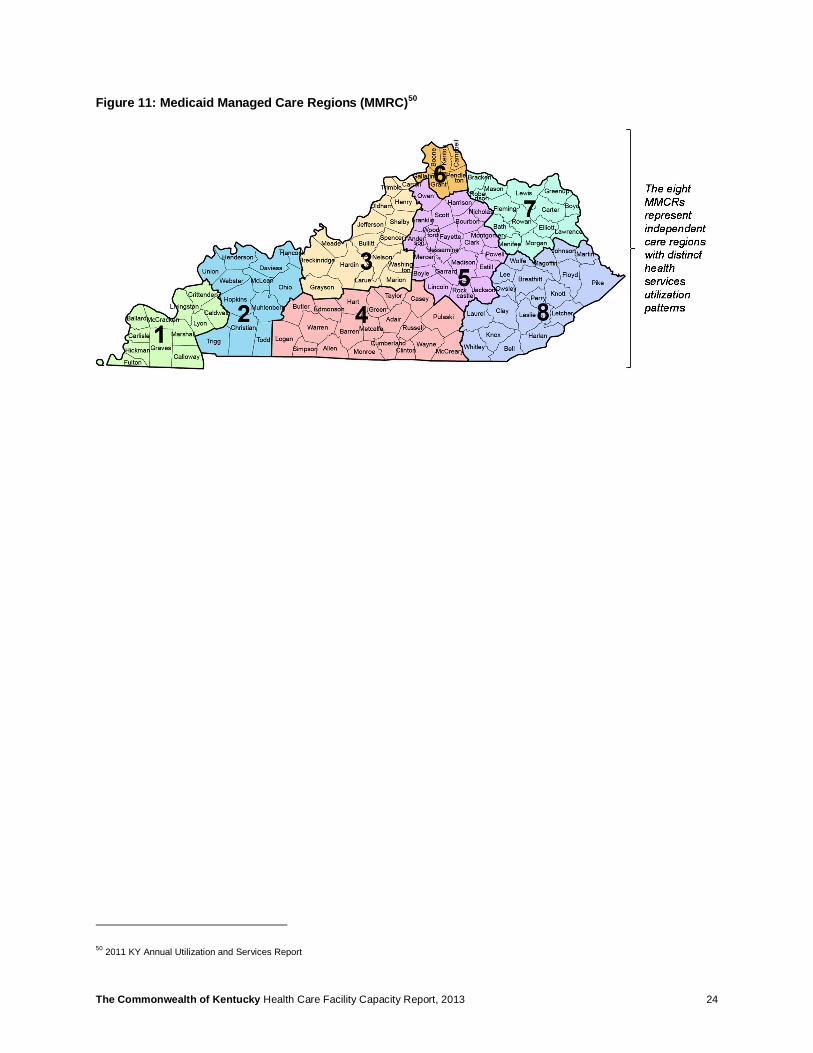
4. Medicaid Managed Care Regions (MMCR) were used for geographic regionalization (see map in Figure 11). Each MMCR is thereby assumed to represent an independent care region with a ‘captive’ population, i.e. facilities in the MMCR primarily source patients from that MMCR, and patient influx or outflow remains constant over time.
5. Population projections include population growth at the county level, but the impact of coverage mix shifts was projected using a statewide model due to lack of more granular insurance status information at the county level. Given these data limitations, the study assumes that the impact of coverage expansion calculated for the Commonwealth in aggregate will apply in similar manner to each of the MMCRs.
6. For most health services in scope, 2012 baseline volume is sourced from the Kentucky Annual Utilization and Services Reports, Cabinet for Health and Family Services, Office of Health Policy that is reported at the facility level. For acute inpatient care, ambulatory surgery, neonatal and cardiac cath services were sourced from the Kentucky Annual Administrative Claims Data Report, Cabinet for Health and Family Services, Office of Health Policy. Either facility county location or patient origin information are used to attribute care to a given MMCR.
7. For Residential Hospice, insufficient historical data was available to calculate a continuous momentum use rate trend. For lack of more specific data, utilization for this service was assumed to remain constant (similar to Tier 2 facilities).
8. For purposes of future occupancy calculations, facility supply was assumed to remain largely constant over the 5-7 year planning horizon, absent major market intervention or new policy changes. The analysis was conducted based on licensed beds (and tested, in select circumstances, using estimated beds in operation).
9. Some facilities do not readily report capacity data (e.g., transplant, home health, hospice, cardiac cath, private duty nursing). In such cases the capacity analysis could not be conducted. For imaging modalities and OR utilization, minimum use threshold specified in the State Health Plan were used to calculate capacity projections (see Methodology in Section 1.3).
10. For ambulatory surgeries, the average length of a surgical procedure was based on the State Health Plan’s standard duration of 1.2 hours per case including clean-up time. Depending on mix of procedures performed in the ambulatory OR, this procedure duration assumption may be high or low. For open heart surgeries, an average length of procedure of 6 hours per was assumed, including clean-up time. This duration will again depend on the mix of cardiac procedures that are conducted within a given open heart program.
The Commonwealth of Kentucky Health Care Facility Capacity Report, 2013 24
Figure 11: Medicaid Managed Care Regions (MMRC)50
50 2011 KY Annual Utilization and Services Report
The Commonwealth of Kentucky Health Care Facility Capacity Report, 2013 25
2 Projection Results
2.1 Demand Projections Demand projections accounted for population growth, impacts of coverage expansion, and general trends in medical care management. (Refer to Section 1.2 for a description of the demand projection methodology).
Figure 12 depicts the projected cumulative change in volume for Tier 1 facilities between 2012 and 2017. The blue line shows total change over baseline volume, and the bars represent the total volume change. The table beneath the chart decomposes the change into individual components. A confidence interval (+/- 25%) is provided in addition to the assumed base case change. The table also features the unit of measure for individual facilities (e.g., Acute Care discharges, Nursing Facility patient days, Home Health patients served).
Tier 1 demand projections (Figure 12):
• Hospital Acute Care (including acute hospital and Critical Access Hospitals) and Nursing Facilities are projected to experience a decline in volume. This is consistent with an anticipated shift from inpatient care to ambulatory and community based health services.
• Private Duty Nursing is projected to decline slightly, though this may be a reflection of shifts to home health services rather than a net decline. Total volume of patients served is very low (341 admissions in 2012).
• Other Tier 1 facilities are expected to experience an increase in total demand. This is consistent with impacts of population growth and aging, as well as coverage expansion.
Tier 2 demand projections (Figure 13):
• Tier 2 facilities are projected to experience increased volumes between 4% and 10%. This is consistent with the impacts of population growth and aging, as well as coverage expansion.
• Open Heart and Transplant have comparatively low base year volumes, which is why the blue bars are less prominent for these facility types.
• MRI imaging services is projected to have the largest growth rate and also the largest total volume, driven by number of scans in the base year.
Technical notes:
• Population age 65+ was used to project demand for Home Health for Elderly and for Hospice Care, given these services primarily cater to the elderly and not to the general population.
• The impact of coverage expansion was not applied to services for which sufficient insurance coverage exists today: Nursing Facility (Medicaid serves as guarantor), Home Health 65+ and Hospice (mostly elderly, i.e. covered by Medicare or Medicaid).
• Continued momentum trends in medical care management were not applied to Tier 2 facilities, as described in the methodology section.

The Commonwealth of Kentucky Health Care Facility Capacity Report, 2013 26
Figure 12: Tier 1 – Estimated Statewide Change in Demand from 2012 to 2017 51 52 53 54 55
Figure 13: Tier 2 – Estimated Statewide Change in Demand from 2012 to 201756 57 58 59
51 Commonwealth future demand projected by trending out change in utilization patterns (‘continued momentum’ methodology) 52 Coverage shifts not included for Nursing Facility, Home Health 65+, and Hospice, as services assumed to already be covered for population 65+ 53 The continued momentum is an aggregate value that results out of the accumulation of individual counties or MMCRs 54 Totals may differ from sum of components as factors don’t add but compound 55 Range estimates are included to demonstrate that projections are subject to a range of market uncertainties and could vary +/- 25% or more 56 Commonwealth future demand projected by using most recent utilization rates (‘steady state’ methodology) 57 Coverage shifts not included as services assumed to already be covered 58 Totals may differ from sum of components due to rounding 59 Range estimates are included to demonstrate that projections are subject to a range of market uncertainties and could vary +/- 25% or more
-26K 2K 8K 1K -50K 17K 15K 6K 0K 4K 49K 1K 0K-5%
19% 17%
138%
-1%
14% 20%39%
17%7% 11%
32%
4%
Total Change %
Acute Care
Comp. Rehab
PsychHospital PRTF Nursing
Facility
Home Health
All
Home Health
65+Hospice Res.
HospiceCardiac
Cath ASC CD PDN
Range-4%
to-6%
+14%to
+24%
+13%to
+21%
+104%to
+173%
-1% to
-1%
+11%to
+18%
+15%to
+25%
+29%to
+49%
+13% to
+21%
+5%to
+9%
+8%to
+14%
+24%to
+40%
+3%to
+5%
Unit Discharges Discharges Discharges Discharges Pt. Days Pts Served Pts Served Admissions Admissions Procedures Surgeries Discharges Admissions
1K 1K 0K 34K 17K2K
4%
10% 10%
8% 7%
8%
Total Change % Neonatal Open Heart Transplant MRI MRE PET
Range +3% to +5% +8% to +13% +8% to +13% +6% to +10% +5% to +9% +6% to +10%
Unit Discharges Operations Transplants Procedures Procedures Procedures
The Commonwealth of Kentucky Health Care Facility Capacity Report, 2013 27
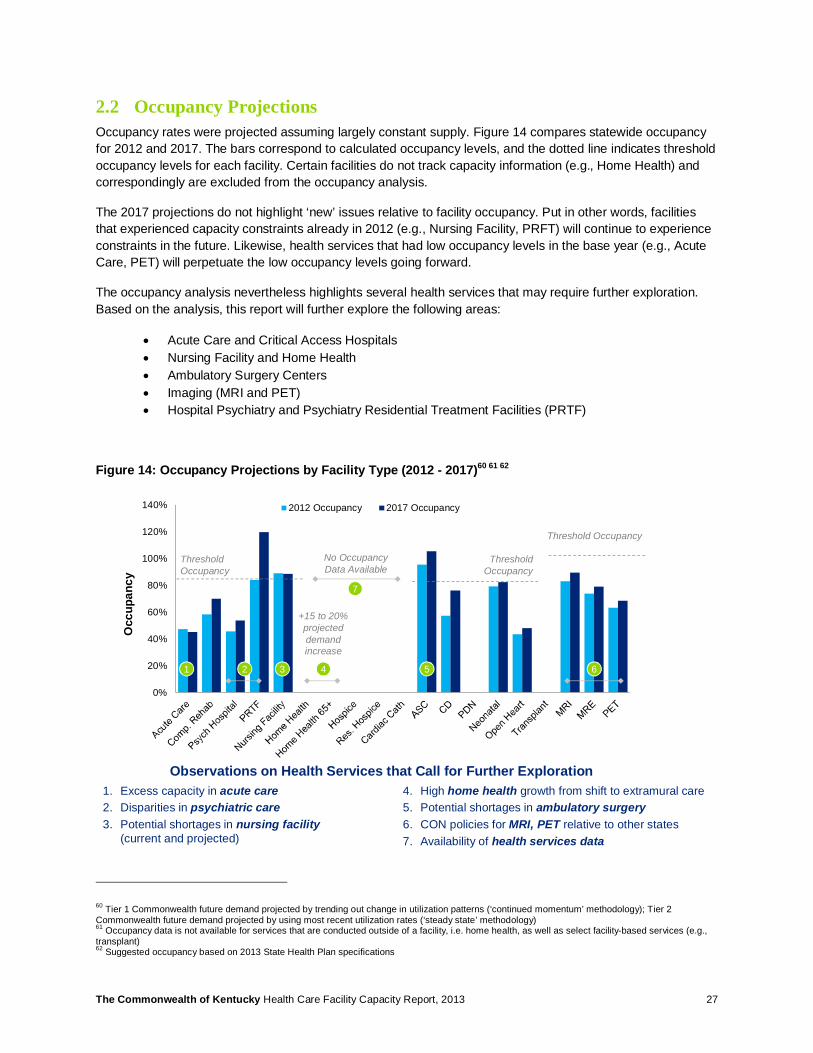
2.2 Occupancy Projections Occupancy rates were projected assuming largely constant supply. Figure 14 compares statewide occupancy for 2012 and 2017. The bars correspond to calculated occupancy levels, and the dotted line indicates threshold occupancy levels for each facility. Certain facilities do not track capacity information (e.g., Home Health) and correspondingly are excluded from the occupancy analysis.
The 2017 projections do not highlight ‘new’ issues relative to facility occupancy. Put in other words, facilities that experienced capacity constraints already in 2012 (e.g., Nursing Facility, PRFT) will continue to experience constraints in the future. Likewise, health services that had low occupancy levels in the base year (e.g., Acute Care, PET) will perpetuate the low occupancy levels going forward.
The occupancy analysis nevertheless highlights several health services that may require further exploration. Based on the analysis, this report will further explore the following areas:
• Acute Care and Critical Access Hospitals • Nursing Facility and Home Health • Ambulatory Surgery Centers • Imaging (MRI and PET) • Hospital Psychiatry and Psychiatry Residential Treatment Facilities (PRTF)
Figure 14: Occupancy Projections by Facility Type (2012 - 2017)60 61 62
60 Tier 1 Commonwealth future demand projected by trending out change in utilization patterns (‘continued momentum’ methodology); Tier 2 Commonwealth future demand projected by using most recent utilization rates (‘steady state’ methodology) 61 Occupancy data is not available for services that are conducted outside of a facility, i.e. home health, as well as select facility-based services (e.g., transplant) 62 Suggested occupancy based on 2013 State Health Plan specifications
0%
20%
40%
60%
80%
100%
120%
140% 2012 Occupancy 2017 Occupancy
1 2 3 5 64
Occ
upan
cy
Threshold Occupancy
Threshold Occupancy
Threshold Occupancy
No Occupancy Data Available
1. Excess capacity in acute care2. Disparities in psychiatric care3. Potential shortages in nursing facility
(current and projected)
4. High home health growth from shift to extramural care 5. Potential shortages in ambulatory surgery6. CON policies for MRI, PET relative to other states7. Availability of health services data
Observations on Health Services that Call for Further Exploration
+15 to 20% projected demand increase
7

The Commonwealth of Kentucky Health Care Facility Capacity Report, 2013 28
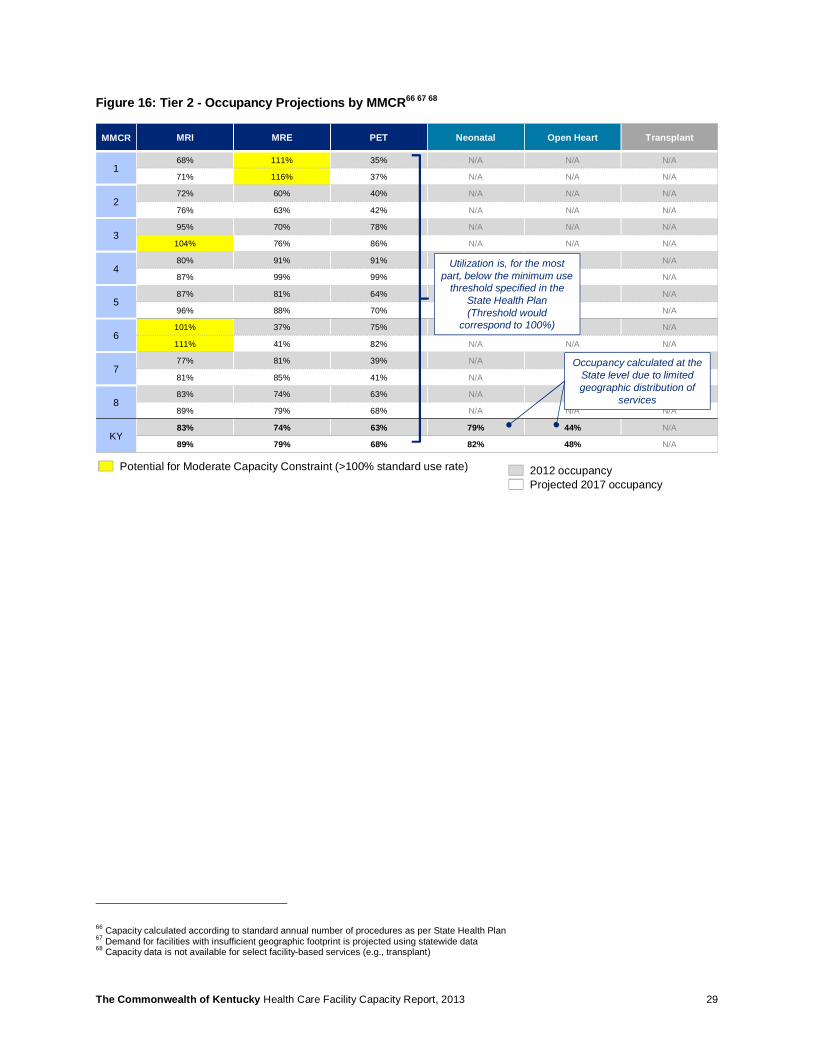
Figure 15 and Figure 16 display occupancy projections at the MMCR level. The first row (shaded) displays 2012 occupancy and the second (white) shows 2017 projected occupancy. Color indicates MMCRs for which services are projected to operate at or close to suggested occupancy thresholds.
Figure 15: Tier 1 - Occupancy Projections by MMCR63 64 65
63 Utilization rate per 10,000 individuals in 2012, assumed to hold constant through 2017 64 Demand for facilities with insufficient geographic footprint is projected using statewide data 65 Capacity data is not available for services that are conducted outside of a facility, i.e. home health, as well as select facility-based services (e.g., residential psychiatry)
Potential for Moderate Capacity Constraint (>70% projected occupancy)Potential for Severe Capacity Constraint (>85% projected occupancy)
2012 occupancyProjected 2017 occupancy
MMCR Acute Care
Comp. Rehab
Psych Hospital
Nursing Facility ASC PRTF CD Home
Health
Home Health
65+Hospice Res.
HospiceCardiac
Cath PDN
140% 53% 36% 82% 123% N/A N/A N/A N/A N/A N/A N/A N/A
36% 51% 56% 75% 202% N/A N/A N/A N/A N/A N/A N/A N/A
237% 45% 27% 89% 70% N/A N/A N/A N/A N/A N/A N/A N/A
34% 40% 31% 88% 71% N/A N/A N/A N/A N/A N/A N/A N/A
349% 50% 52% 87% 84% N/A N/A N/A N/A N/A N/A N/A N/A
49% 54% 64% 86% 87% N/A N/A N/A N/A N/A N/A N/A N/A
452% 70% 54% 93% 171% N/A N/A N/A N/A N/A N/A N/A N/A
51% 75% 64% 94% 181% N/A N/A N/A N/A N/A N/A N/A N/A
541% 64% 46% 89% 69% N/A N/A N/A N/A N/A N/A N/A N/A
44% 88% 44% 92% 83% N/A N/A N/A N/A N/A N/A N/A N/A
654% 79% 47% 93% 115% N/A N/A N/A N/A N/A N/A N/A N/A
50% 128% 52% 90% 124% N/A N/A N/A N/A N/A N/A N/A N/A
747% 53% 39% 92% 90% N/A N/A N/A N/A N/A N/A N/A N/A
38% 46% 33% 91% 84% N/A N/A N/A N/A N/A N/A N/A N/A
857% 46% 76% 89% 95% N/A N/A N/A N/A N/A N/A N/A N/A
49% 46% 105% 88% 105% N/A N/A N/A N/A N/A N/A N/A N/A
KY47% 58% 46% 89% 95% 84% 57% N/A N/A N/A N/A N/A N/A
45% 70% 54% 88% 105% 120% 76% N/A N/A N/A N/A N/A N/A
2012 occupancy not available
The Commonwealth of Kentucky Health Care Facility Capacity Report, 2013 29
Figure 16: Tier 2 - Occupancy Projections by MMCR66 67 68
66 Capacity calculated according to standard annual number of procedures as per State Health Plan 67 Demand for facilities with insufficient geographic footprint is projected using statewide data 68 Capacity data is not available for select facility-based services (e.g., transplant)
MMCR MRI MRE PET Neonatal Open Heart Transplant
168% 111% 35% N/A N/A N/A
71% 116% 37% N/A N/A N/A
272% 60% 40% N/A N/A N/A
76% 63% 42% N/A N/A N/A
395% 70% 78% N/A N/A N/A
104% 76% 86% N/A N/A N/A
480% 91% 91% N/A N/A N/A
87% 99% 99% N/A N/A N/A
587% 81% 64% N/A N/A N/A
96% 88% 70% N/A N/A N/A
6101% 37% 75% N/A N/A N/A
111% 41% 82% N/A N/A N/A
777% 81% 39% N/A N/A N/A
81% 85% 41% N/A N/A N/A
883% 74% 63% N/A N/A N/A
89% 79% 68% N/A N/A N/A
KY83% 74% 63% 79% 44% N/A
89% 79% 68% 82% 48% N/A
Utilization is, for the most part, below the minimum use
threshold specified in the State Health Plan (Threshold would
correspond to 100%)
2012 occupancyProjected 2017 occupancy
Potential for Moderate Capacity Constraint (>100% standard use rate)
Occupancy calculated at the State level due to limited geographic distribution of
services
The Commonwealth of Kentucky Health Care Facility Capacity Report, 2013 30
3 Sensitivity Analysis & Future State Scenarios
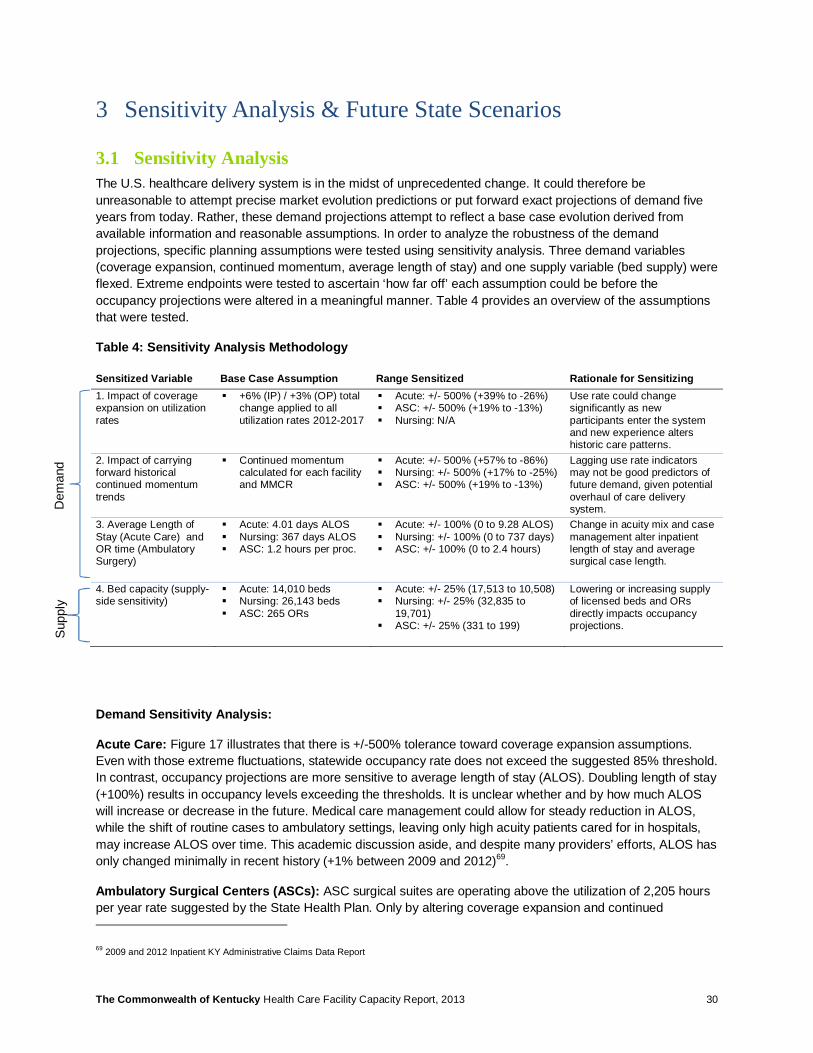
3.1 Sensitivity Analysis The U.S. healthcare delivery system is in the midst of unprecedented change. It could therefore be unreasonable to attempt precise market evolution predictions or put forward exact projections of demand five years from today. Rather, these demand projections attempt to reflect a base case evolution derived from available information and reasonable assumptions. In order to analyze the robustness of the demand projections, specific planning assumptions were tested using sensitivity analysis. Three demand variables (coverage expansion, continued momentum, average length of stay) and one supply variable (bed supply) were flexed. Extreme endpoints were tested to ascertain ‘how far off’ each assumption could be before the occupancy projections were altered in a meaningful manner. Table 4 provides an overview of the assumptions that were tested.
Table 4: Sensitivity Analysis Methodology
Sensitized Variable Base Case Assumption Range Sensitized Rationale for Sensitizing 1. Impact of coverage expansion on utilization rates
§ +6% (IP) / +3% (OP) total change applied to all utilization rates 2012-2017
§ Acute: +/- 500% (+39% to -26%) § ASC: +/- 500% (+19% to -13%) § Nursing: N/A
Use rate could change significantly as new participants enter the system and new experience alters historic care patterns.
2. Impact of carrying forward historical continued momentum trends
§ Continued momentum calculated for each facility and MMCR
§ Acute: +/- 500% (+57% to -86%) § Nursing: +/- 500% (+17% to -25%) § ASC: +/- 500% (+19% to -13%)
Lagging use rate indicators may not be good predictors of future demand, given potential overhaul of care delivery system.
3. Average Length of Stay (Acute Care) and OR time (Ambulatory Surgery)
§ Acute: 4.01 days ALOS § Nursing: 367 days ALOS § ASC: 1.2 hours per proc.
§ Acute: +/- 100% (0 to 9.28 ALOS) § Nursing: +/- 100% (0 to 737 days) § ASC: +/- 100% (0 to 2.4 hours)
Change in acuity mix and case management alter inpatient length of stay and average surgical case length.
4. Bed capacity (supply-side sensitivity)
§ Acute: 14,010 beds § Nursing: 26,143 beds § ASC: 265 ORs
§ Acute: +/- 25% (17,513 to 10,508) § Nursing: +/- 25% (32,835 to
19,701) § ASC: +/- 25% (331 to 199)
Lowering or increasing supply of licensed beds and ORs directly impacts occupancy projections.
Demand Sensitivity Analysis:
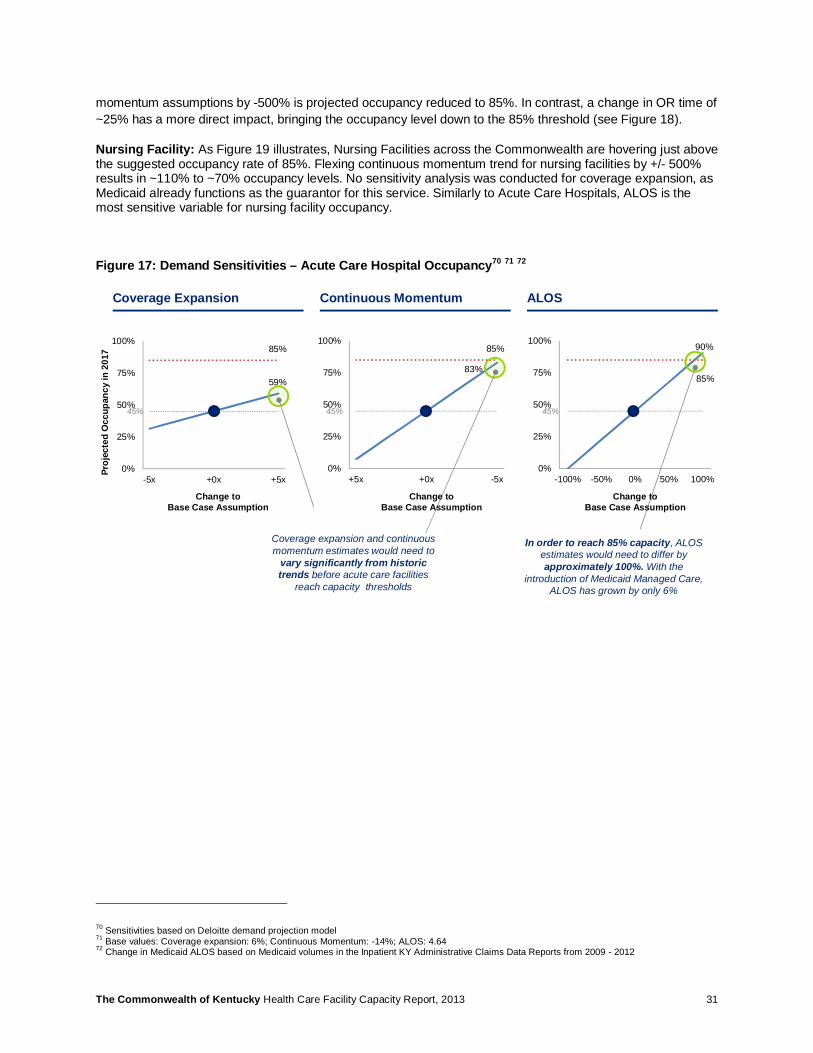
Acute Care: Figure 17 illustrates that there is +/-500% tolerance toward coverage expansion assumptions. Even with those extreme fluctuations, statewide occupancy rate does not exceed the suggested 85% threshold. In contrast, occupancy projections are more sensitive to average length of stay (ALOS). Doubling length of stay (+100%) results in occupancy levels exceeding the thresholds. It is unclear whether and by how much ALOS will increase or decrease in the future. Medical care management could allow for steady reduction in ALOS, while the shift of routine cases to ambulatory settings, leaving only high acuity patients cared for in hospitals, may increase ALOS over time. This academic discussion aside, and despite many providers’ efforts, ALOS has only changed minimally in recent history (+1% between 2009 and 2012)69.
Ambulatory Surgical Centers (ASCs): ASC surgical suites are operating above the utilization of 2,205 hours per year rate suggested by the State Health Plan. Only by altering coverage expansion and continued
69 2009 and 2012 Inpatient KY Administrative Claims Data Report
Dem
and
Sup
ply
The Commonwealth of Kentucky Health Care Facility Capacity Report, 2013 31
momentum assumptions by -500% is projected occupancy reduced to 85%. In contrast, a change in OR time of ~25% has a more direct impact, bringing the occupancy level down to the 85% threshold (see Figure 18).
Nursing Facility: As Figure 19 illustrates, Nursing Facilities across the Commonwealth are hovering just above the suggested occupancy rate of 85%. Flexing continuous momentum trend for nursing facilities by +/- 500% results in ~110% to ~70% occupancy levels. No sensitivity analysis was conducted for coverage expansion, as Medicaid already functions as the guarantor for this service. Similarly to Acute Care Hospitals, ALOS is the most sensitive variable for nursing facility occupancy.
Figure 17: Demand Sensitivities – Acute Care Hospital Occupancy70 71 72
70 Sensitivities based on Deloitte demand projection model 71 Base values: Coverage expansion: 6%; Continuous Momentum: -14%; ALOS: 4.64 72 Change in Medicaid ALOS based on Medicaid volumes in the Inpatient KY Administrative Claims Data Reports from 2009 - 2012
59%
85%
0%
25%
50%
75%
100%
-5x +0x +5x
83%
85%
0%
25%
50%
75%
100%
+5x +0x -5x
90%
85%
0%
25%
50%
75%
100%
-100% -50% 0% 50% 100%
Coverage Expansion Continuous Momentum ALOS
Coverage expansion and continuous momentum estimates would need to
vary significantly from historic trends before acute care facilities
reach capacity thresholds
In order to reach 85% capacity, ALOS estimates would need to differ by approximately 100%. With the
introduction of Medicaid Managed Care, ALOS has grown by only 6%
45% 45% 45%
Change to Base Case Assumption
Proj
ecte
d O
ccup
ancy
in 2
017
Change to Base Case Assumption
Change to Base Case Assumption
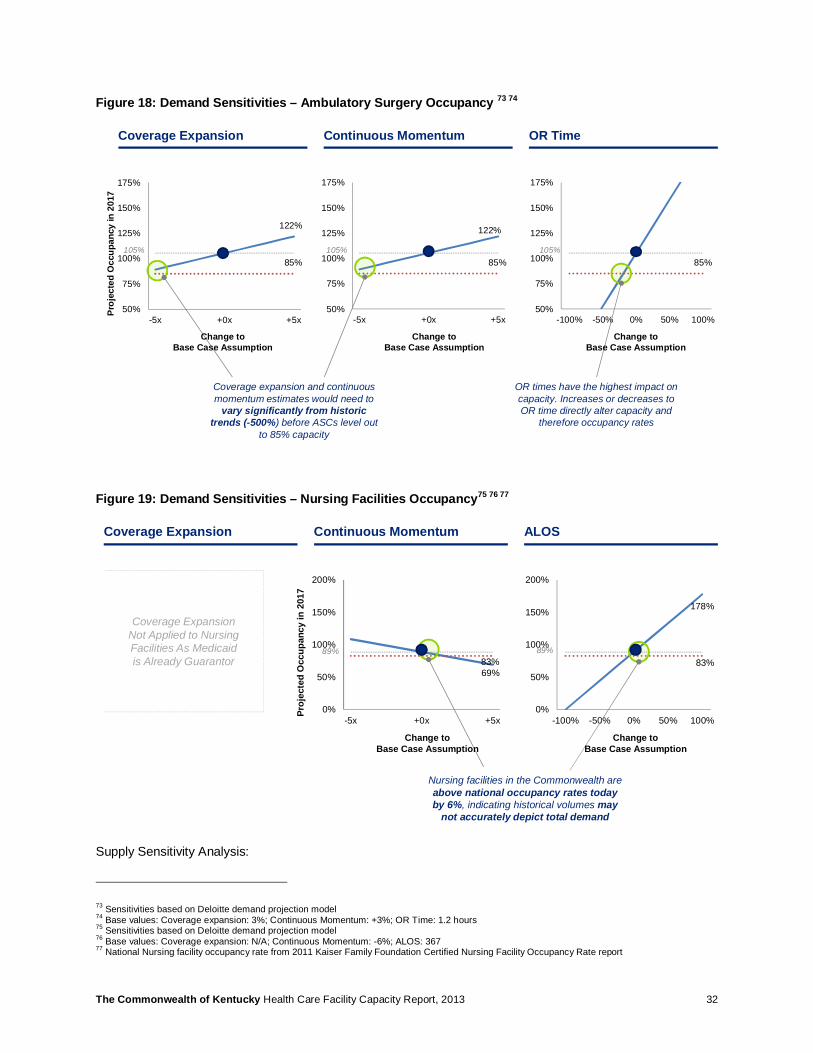
The Commonwealth of Kentucky Health Care Facility Capacity Report, 2013 32
Figure 18: Demand Sensitivities – Ambulatory Surgery Occupancy 73 74
Figure 19: Demand Sensitivities – Nursing Facilities Occupancy75 76 77
Supply Sensitivity Analysis:
73 Sensitivities based on Deloitte demand projection model 74 Base values: Coverage expansion: 3%; Continuous Momentum: +3%; OR Time: 1.2 hours 75 Sensitivities based on Deloitte demand projection model 76 Base values: Coverage expansion: N/A; Continuous Momentum: -6%; ALOS: 367 77 National Nursing facility occupancy rate from 2011 Kaiser Family Foundation Certified Nursing Facility Occupancy Rate report
85%
50%
75%
100%
125%
150%
175%
-100% -50% 0% 50% 100%
122%
85%
50%
75%
100%
125%
150%
175%
-5x +0x +5x
122%
85%
50%
75%
100%
125%
150%
175%
-5x +0x +5x
Coverage Expansion Continuous Momentum OR Time
Coverage expansion and continuous momentum estimates would need to
vary significantly from historic trends (-500%) before ASCs level out
to 85% capacity
OR times have the highest impact on capacity. Increases or decreases to OR time directly alter capacity and
therefore occupancy rates
105% 105% 105%
Change to Base Case Assumption
Change to Base Case Assumption
Change to Base Case Assumption
Proj
ecte
d O
ccup
ancy
in 2
017
178%
83%
0%
50%
100%
150%
200%
-100% -50% 0% 50% 100%
69%83%
0%
50%
100%
150%
200%
-5x +0x +5x
Coverage Expansion Continuous Momentum ALOS
Nursing facilities in the Commonwealth are above national occupancy rates today by 6%, indicating historical volumes may
not accurately depict total demand
89% 89%
Coverage Expansion Not Applied to Nursing Facilities As Medicaid is Already Guarantor
Change to Base Case Assumption
Change to Base Case Assumption
Proj
ecte
d O
ccup
ancy
in 2
017

The Commonwealth of Kentucky Health Care Facility Capacity Report, 2013 33
Acute Care: The removal of as many as 25% of total licensed beds (~3,500 beds) only increases the statewide occupancy rate by 11% to ~56%. This indicates that significant contraction of supply may likely be required to address excess capacity.
ASC: Increasing the number of ambulatory ORs by 25% is required to reach a statewide occupancy of ~80%.
Nursing Facility: A 5%-10% increase in beds (1,300-2,600 beds) achieves the suggested occupancy of 85%.
Figure 20: Supply Sensitivities – Acute, ASC, Nursing78 79
3.2 Future State Scenarios While the sensitivity analysis highlighted the implication of specific assumptions at a state-level, three future state scenarios were crafted in order to understand the impact of altered assumptions on an MMCR-level. Table 5 provides an overview of the three scenarios.
78 Sensitivities based on Deloitte demand projection model 79 Base values: Acute Care Beds: 14,010; ASC ORs: 265; Nursing Facility Beds: 26,143
34%
85%
0%
50%
100%
150%
-25% -15% -5% 5% 15% 25%
79%
85%
0%
50%
100%
150%
-25% -15% -5% 5% 15% 25%
67%
83%
0%
50%
100%
150%
-25% -15% -5% 5% 15% 25%
Acute Care Beds ASC ORs
By removing 25% of the total bed supply, the Commonwealth would still have a surplus of acute care
capacity
45%
105%
Nursing Facility Beds
89%
By increasing the number of ambulatory ORs by 25%, the
Commonwealth could achieve a standard utilization rate of 85%
during normal operating hours
By increasing the number of nursing facility beds between 5%-10% (+1,300 to +2,600 beds), the Commonwealth could lower occupancy to national norms
Change to Base Case Assumption
Change to Base Case Assumption
Change to Base Case Assumption
Proj
ecte
d O
ccup
ancy
in 2
017

The Commonwealth of Kentucky Health Care Facility Capacity Report, 2013 34
Table 5: Future State Scenarios Overview80
Scenario Description Modeling Impact
Base Case Base assumptions including coverage expansion, utilization rate change momentum, and ALOS or OR operating time
§ Coverage expansion: +6% (Inpat.) and +3% (Ambulatory)
§ Momentum: Varies by service § ALOS: Assumed constant
1. Pent-up demand emerges Coverage expansion results in an unanticipated spike in utilization of health services
§ Coverage expansion results in double the base case increase in demand for services
2. Momentum accelerates The historical rate of change in utilization doubles over the next 5 years due to high-quality case management
§ Change in use rates (momentum) doubles
3. Facilities care only for the sickest patients
Healthier individuals are cared for in the ambulatory setting, and only the ‘really sick’ patients are treated in the hospital; types of cases treated in ambulatory setting grow more complex
§ Average length of stay or OR operating time increases by 25%
80 Scenarios were chosen to illustrate why demand drivers help test potential future states (what might happen). Simple assumptions were selected for modeling purposes, i.e. double use rates or increase ALOS by one quarter
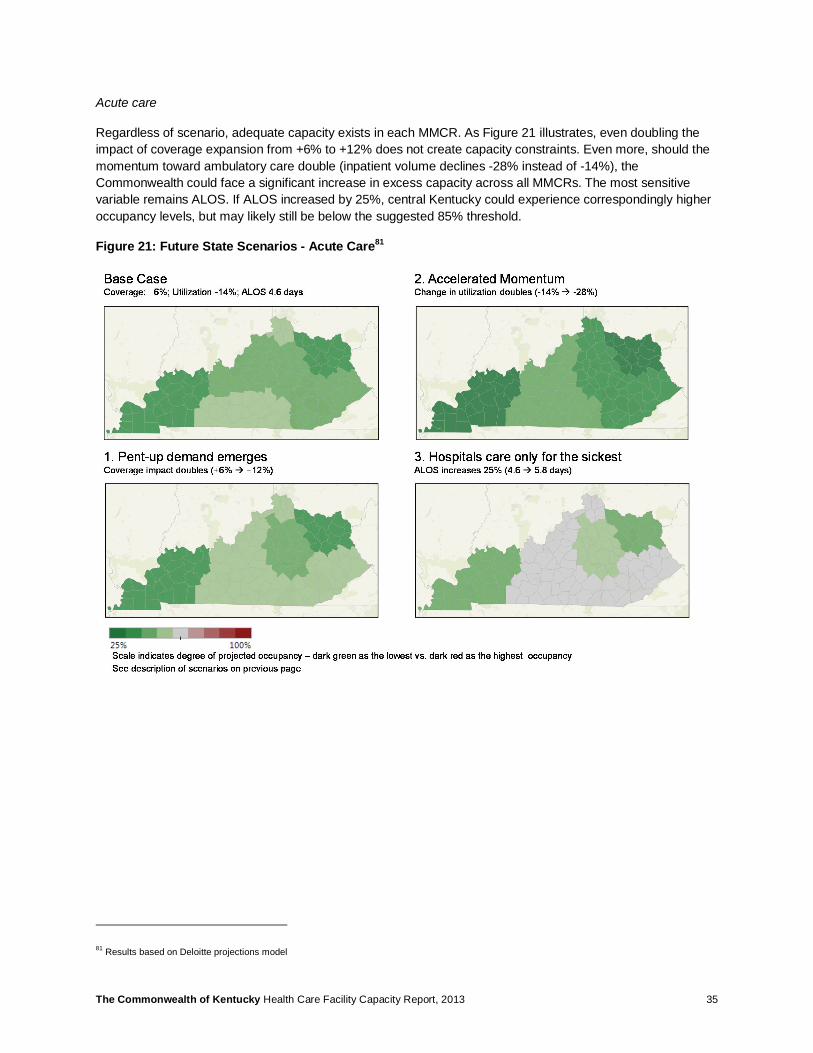
The Commonwealth of Kentucky Health Care Facility Capacity Report, 2013 35
Acute care
Regardless of scenario, adequate capacity exists in each MMCR. As Figure 21 illustrates, even doubling the impact of coverage expansion from +6% to +12% does not create capacity constraints. Even more, should the momentum toward ambulatory care double (inpatient volume declines -28% instead of -14%), the Commonwealth could face a significant increase in excess capacity across all MMCRs. The most sensitive variable remains ALOS. If ALOS increased by 25%, central Kentucky could experience correspondingly higher occupancy levels, but may likely still be below the suggested 85% threshold.
Figure 21: Future State Scenarios - Acute Care81
81 Results based on Deloitte projections model

The Commonwealth of Kentucky Health Care Facility Capacity Report, 2013 36
ASCs
Half of MMCRs are projected to be operating above the standard number of ambulatory surgeries per ambulatory OR already in the base case. Three of the MMCRs have occupancy rates close to the suggested threshold, while one is operating slightly below (MMCR 2 at ~70%). While there is some variation between each future state scenario, the high occupancy levels do not change materially based on the future state scenarios.
Figure 22: Future State Scenarios - ASCs82
82 Results based on Deloitte projections model

The Commonwealth of Kentucky Health Care Facility Capacity Report, 2013 37
Nursing Facility
Similar to ASCs, many MMCRs have Nursing Facilities that are already operating above the suggested occupancy level. While in the base case only one MMCR is operating below 80% occupancy, a change in ALOS of +25% pushes all MMCRs to over 100% occupancy.
Figure 23: Future State Scenarios - Nursing Facility83
83 Results based on Deloitte projections model
The Commonwealth of Kentucky Health Care Facility Capacity Report, 2013 38
4 Limitations of Projection Analysis
4.1 Data Limitations A number of data challenges impacted this analysis. As noted previously, the Commonwealth does not collect and report supply data for all facility types (e.g., Home Health, Hospice, Residential Hospice, Cardiac Cath, Private Duty Nursing, Transplant). In addition, datasets are not consistently comprehensive. For example, the three state-operated psychiatric facilities have received a waiver from reporting their administrative claims data in 2012. For a full set of data issues and next steps for consideration, please see Section 6- Health Services Data.
4.2 Methodology Limitations While the facility occupancy rates were projected using available data and quantitative methodologies, a number of assumptions were required in order to conduct the analysis:
• Lagging indicators: The continued momentum and steady state methodologies utilize historical experience to project future volumes. Given the ongoing overhaul in the healthcare industry, these lagging indicators may not be a good predictor for future market demand.
• Market uncertainty: Predicting future volumes is a challenging task given the multitude of factors that could impact demand for health services, for example: The degree to which coverage expansion takes hold, the velocity at which scientific advances alter the way care is provided, the stringency with which case management leading practices are implemented, and macro-economic trends such as rate of unemployment. A sensitivity analysis was conducted in this study to test robustness of planning assumptions in light of these market uncertainties (see Sensitivity Analysis & Future State Scenarios).
• Projection ranges: Projections should not be considered as discrete results but rather as a plausible base case within a range of potential outcomes. The projections include a confidence interval of +/- 25%, with the understanding that market evolution scenarios could sway that number even farther.
• Facility discharge reports: The Kentucky Annual Utilization and Services Reports, leveraged for much of this analysis, are compiled using facility-based discharge data. Estimating demand based on reported discharges may underestimate true demand, e.g. if there are existing barriers to access care and a patient is not admitted to a facility in the first place.
• MMCR-level aggregation: Not all counties feature all facility types. For this reason, the analysis was conducted at the MMCR level in order to account for the demand originating and being served within the broader health region. It is assumed that MMCRs represent mutually exclusive care regions each with a captive population, and that providers in a particular MMCR primarily source patients from that MMCR. This aggregation methodology could potentially distort an individual provider’s trajectory.
The Commonwealth of Kentucky Health Care Facility Capacity Report, 2013 39
5 Peer Benchmark Analysis
5.1 Benchmark Objectives A benchmarking analysis was conducted to compare the Commonwealth’s utilization rate of health services with other states’ and national benchmarks. The comparison was conducted to identify services for which the Commonwealth was far above or below benchmark utilization. This could be a first indicator of next steps for consideration in addressing supply and demand misalignment. As Table 6 illustrates, the comparison is of particular interest as the Commonwealth stands at the low end of relative health ranking. The question at hand is whether a lower population health status results in higher utilization of health services, or, conversely, whether poor health status may result from barriers to accessing care in the Commonwealth (which could show as lower utilization of services compared to other states despite worse health status). Both of these possibilities could be important factors to consider by the Commonwealth as part of future facility planning.
Table 6: Commonwealth of Kentucky Health Outcomes Rank Relative to other U.S. States84
Outcome Measure KY Ranking
Smoking 50th
Obesity 40th
Sedentary lifestyles 43rd
Diabetes 41st
Poor mental health days 48th
Poor physical health days 49th
Cancer deaths 50th
Cardiac heart disease 49th
High cholesterol 43rd
Heart attacks 48th
Annual dental visits 44th
Overall ranking 45th
5.2 Comparison Regions Health & Human Services Region 4 (HHS-4) was selected as comparable region (Figure 24). This selection was based on an assumed correspondence in patient populations regarding prevalence of chronic conditions, rural versus urban populations, and overall access to care. 5 of the 8 states in HHS Region 4 are also in the bottom third of health ranks.85 HHS Region 4’s expansive geographic area establishes a sufficiently large peer group in order to avoid the effect of potential outlier states. (Note: HHS Region 4 was also selected for benchmarking purposes in the Commonwealth’s 2013 Workforce Capacity Study86).
84 Kentucky Cabinet for Health and Family Services. “Analysis of the Affordable Care Act (ACA): Medicaid expansion in Kentucky.” 85 United Health Foundation. America’s Health Rankings. (2012) 86 Deloitte Consulting. “The Commonwealth of Kentucky Health Care Workforce Capacity Report.” (2013).
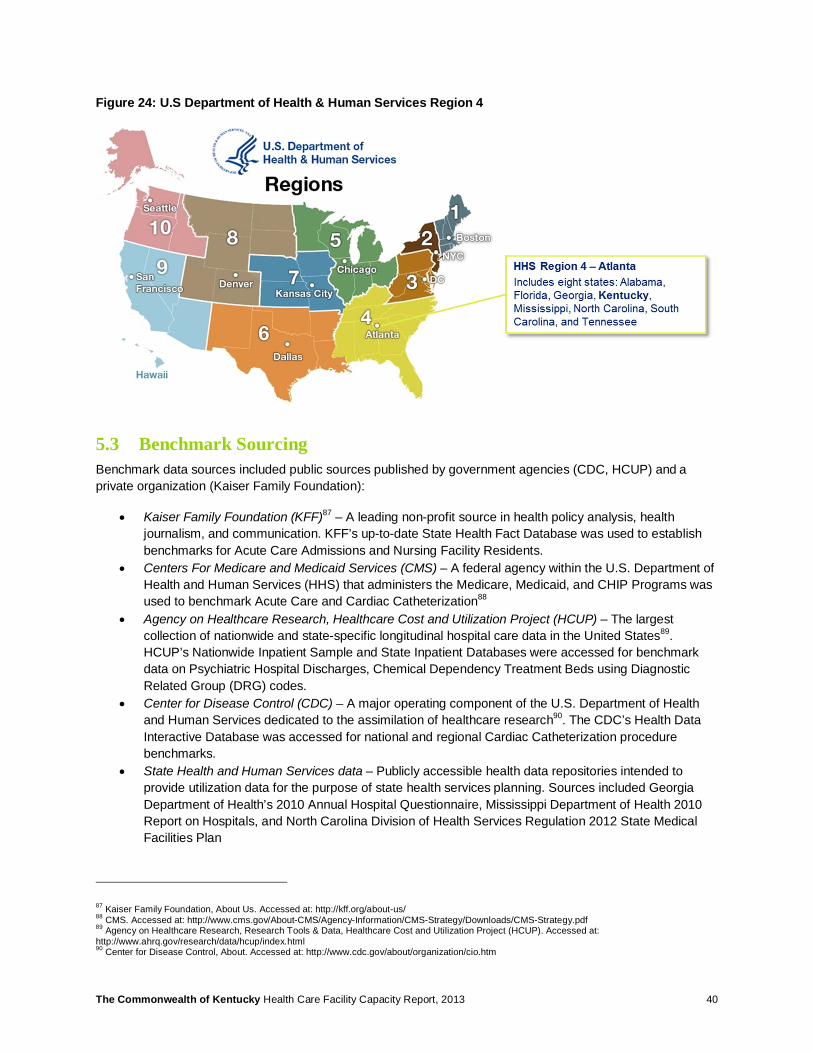
The Commonwealth of Kentucky Health Care Facility Capacity Report, 2013 40
Figure 24: U.S Department of Health & Human Services Region 4
5.3 Benchmark Sourcing Benchmark data sources included public sources published by government agencies (CDC, HCUP) and a private organization (Kaiser Family Foundation):
• Kaiser Family Foundation (KFF)87 – A leading non-profit source in health policy analysis, health journalism, and communication. KFF’s up-to-date State Health Fact Database was used to establish benchmarks for Acute Care Admissions and Nursing Facility Residents.
• Centers For Medicare and Medicaid Services (CMS) – A federal agency within the U.S. Department of Health and Human Services (HHS) that administers the Medicare, Medicaid, and CHIP Programs was used to benchmark Acute Care and Cardiac Catheterization88
• Agency on Healthcare Research, Healthcare Cost and Utilization Project (HCUP) – The largest collection of nationwide and state-specific longitudinal hospital care data in the United States89. HCUP’s Nationwide Inpatient Sample and State Inpatient Databases were accessed for benchmark data on Psychiatric Hospital Discharges, Chemical Dependency Treatment Beds using Diagnostic Related Group (DRG) codes.
• Center for Disease Control (CDC) – A major operating component of the U.S. Department of Health and Human Services dedicated to the assimilation of healthcare research90. The CDC’s Health Data Interactive Database was accessed for national and regional Cardiac Catheterization procedure benchmarks.
• State Health and Human Services data – Publicly accessible health data repositories intended to provide utilization data for the purpose of state health services planning. Sources included Georgia Department of Health’s 2010 Annual Hospital Questionnaire, Mississippi Department of Health 2010 Report on Hospitals, and North Carolina Division of Health Services Regulation 2012 State Medical Facilities Plan
87 Kaiser Family Foundation, About Us. Accessed at: http://kff.org/about-us/ 88 CMS. Accessed at: http://www.cms.gov/About-CMS/Agency-Information/CMS-Strategy/Downloads/CMS-Strategy.pdf 89 Agency on Healthcare Research, Research Tools & Data, Healthcare Cost and Utilization Project (HCUP). Accessed at: http://www.ahrq.gov/research/data/hcup/index.html 90 Center for Disease Control, About. Accessed at: http://www.cdc.gov/about/organization/cio.htm
The Commonwealth of Kentucky Health Care Facility Capacity Report, 2013 41
• Other third-party data aggregators – Third-party suppliers of aggregate information (e.g., Truven Health Analytics, Inc.; Press Ganey’s DataAdvantage based on Medicare cost reports), analytic tools, benchmarks, and other services to the healthcare industry were accessed to supplement public data
• Peer-reviewed literature and market reports – Other miscellaneous sources included peer-reviewed journals and market reports (e.g., The Journal of Nuclear Medicine)
Individual state and national benchmark data was standardized to a per 10,000 population rate. To facilitate reliability, state benchmarks were routinely compared to the Commonwealth data for accuracy and appropriate inclusivity of services or diagnoses. Specific attention was given to find benchmarks for which included data was clearly described by the reporting party. Additionally, where HHS Region 4 data was not available, a “South” region was calculated based on data from individual states contained in HHS Region 4. In such instances, the calculated average utilization was weighted according to state population.
Table 7 and Table 8 provide an overview of the national and regional benchmarks for Tier 1 and Tier 2 facilities. Benchmark sources are further detailed in the Appendix (Section 14.1).
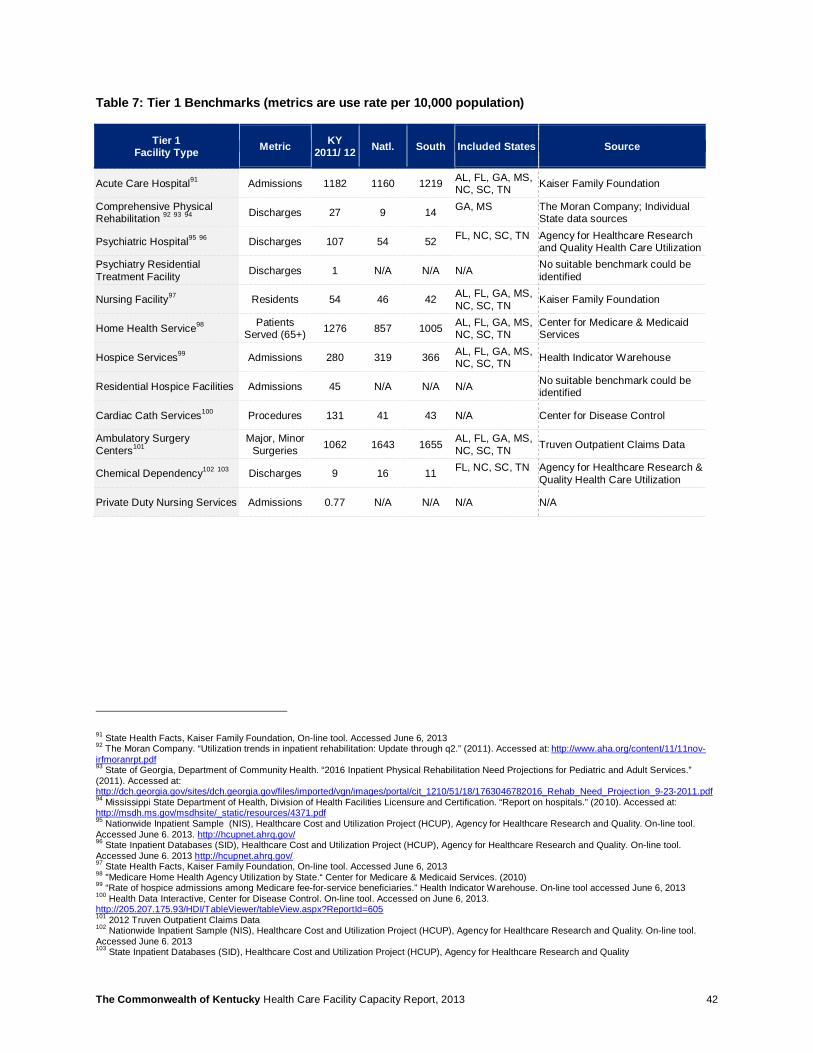
The Commonwealth of Kentucky Health Care Facility Capacity Report, 2013 42
Table 7: Tier 1 Benchmarks (metrics are use rate per 10,000 population)
Tier 1 Facility Type Metric KY
2011/ 12 Natl. South Included States Source
Acute Care Hospital91 Admissions 1182 1160 1219 AL, FL, GA, MS, NC, SC, TN Kaiser Family Foundation
Comprehensive Physical Rehabilitation 92 93 94 Discharges 27 9 14 GA, MS
The Moran Company; Individual State data sources
Psychiatric Hospital95 96 Discharges 107 54 52 FL, NC, SC, TN
Agency for Healthcare Research and Quality Health Care Utilization
Psychiatry Residential Treatment Facility Discharges 1 N/A N/A N/A No suitable benchmark could be
identified
Nursing Facility97 Residents 54 46 42 AL, FL, GA, MS, NC, SC, TN Kaiser Family Foundation
Home Health Service98 Patients Served (65+) 1276 857 1005 AL, FL, GA, MS,
NC, SC, TN Center for Medicare & Medicaid Services
Hospice Services99 Admissions 280 319 366 AL, FL, GA, MS, NC, SC, TN Health Indicator Warehouse
Residential Hospice Facilities Admissions 45 N/A N/A N/A No suitable benchmark could be identified
Cardiac Cath Services100 Procedures 131 41 43 N/A Center for Disease Control
Ambulatory Surgery Centers101
Major, Minor Surgeries 1062 1643 1655 AL, FL, GA, MS,
NC, SC, TN Truven Outpatient Claims Data
Chemical Dependency102 103 Discharges 9 16 11 FL, NC, SC, TN
Agency for Healthcare Research & Quality Health Care Utilization
Private Duty Nursing Services Admissions 0.77 N/A N/A N/A N/A
91 State Health Facts, Kaiser Family Foundation, On-line tool. Accessed June 6, 2013 92 The Moran Company. “Utilization trends in inpatient rehabilitation: Update through q2.” (2011). Accessed at: http://www.aha.org/content/11/11nov-irfmoranrpt.pdf 93 State of Georgia, Department of Community Health. “2016 Inpatient Physical Rehabilitation Need Projections for Pediatric and Adult Services.” (2011). Accessed at: http://dch.georgia.gov/sites/dch.georgia.gov/files/imported/vgn/images/portal/cit_1210/51/18/1763046782016_Rehab_Need_Project ion_9-23-2011.pdf 94 Mississippi State Department of Health, Division of Health Facilities Licensure and Certification. “Report on hospitals.” (2010). Accessed at: http://msdh.ms.gov/msdhsite/_static/resources/4371.pdf 95 Nationwide Inpatient Sample (NIS), Healthcare Cost and Utilization Project (HCUP), Agency for Healthcare Research and Quality. On-line tool. Accessed June 6. 2013. http://hcupnet.ahrq.gov/ 96 State Inpatient Databases (SID), Healthcare Cost and Utilization Project (HCUP), Agency for Healthcare Research and Quality. On-line tool. Accessed June 6. 2013 http://hcupnet.ahrq.gov/ 97 State Health Facts, Kaiser Family Foundation, On-line tool. Accessed June 6, 2013 98 "Medicare Home Health Agency Utilization by State.“ Center for Medicare & Medicaid Services. (2010) 99 “Rate of hospice admissions among Medicare fee-for-service beneficiaries.” Health Indicator Warehouse. On-line tool accessed June 6, 2013 100 Health Data Interactive, Center for Disease Control. On-line tool. Accessed on June 6, 2013. http://205.207.175.93/HDI/TableViewer/tableView.aspx?ReportId=605 101 2012 Truven Outpatient Claims Data 102 Nationwide Inpatient Sample (NIS), Healthcare Cost and Utilization Project (HCUP), Agency for Healthcare Research and Quality. On-line tool. Accessed June 6. 2013 103 State Inpatient Databases (SID), Healthcare Cost and Utilization Project (HCUP), Agency for Healthcare Research and Quality
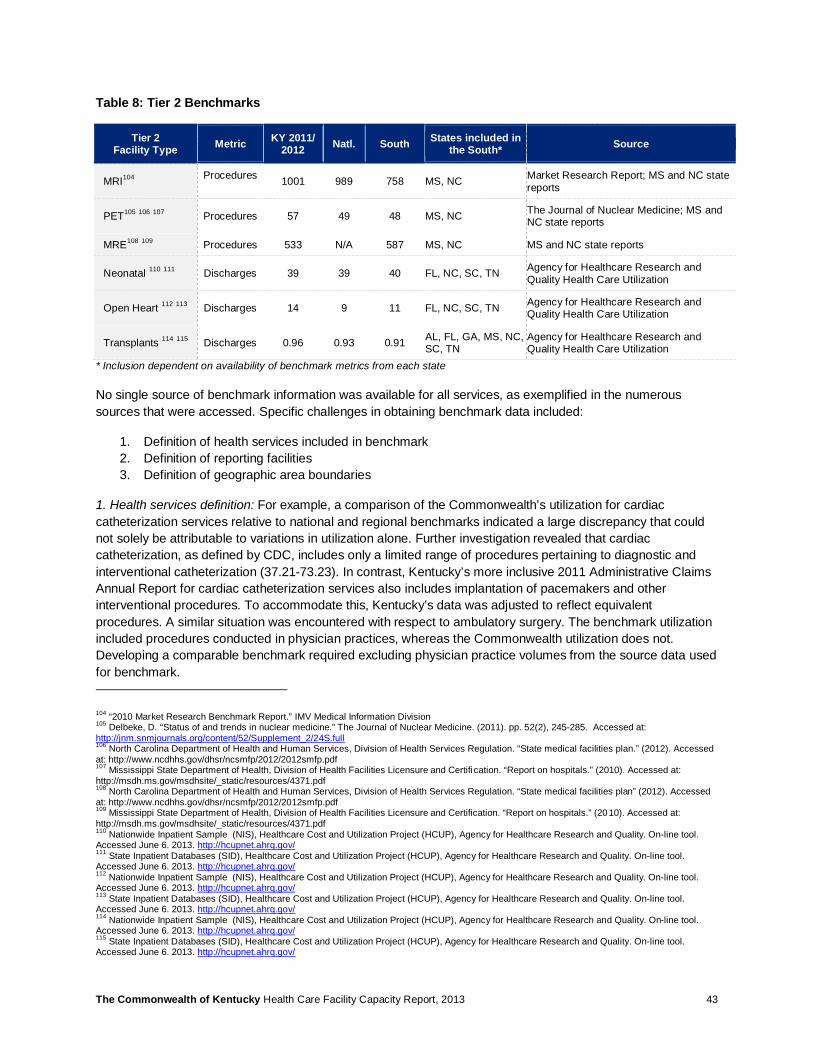
The Commonwealth of Kentucky Health Care Facility Capacity Report, 2013 43
Table 8: Tier 2 Benchmarks
Tier 2 Facility Type Metric KY 2011/
2012 Natl. South States included in the South* Source
MRI104 Procedures 1001 989 758 MS, NC Market Research Report; MS and NC state
reports
PET105 106 107 Procedures 57 49 48 MS, NC The Journal of Nuclear Medicine; MS and NC state reports
MRE108 109 Procedures 533 N/A 587 MS, NC MS and NC state reports
Neonatal 110 111 Discharges 39 39 40 FL, NC, SC, TN Agency for Healthcare Research and Quality Health Care Utilization
Open Heart 112 113 Discharges 14 9 11 FL, NC, SC, TN Agency for Healthcare Research and Quality Health Care Utilization
Transplants 114 115 Discharges 0.96 0.93 0.91 AL, FL, GA, MS, NC, SC, TN
Agency for Healthcare Research and Quality Health Care Utilization
* Inclusion dependent on availability of benchmark metrics from each state
No single source of benchmark information was available for all services, as exemplified in the numerous sources that were accessed. Specific challenges in obtaining benchmark data included:
1. Definition of health services included in benchmark 2. Definition of reporting facilities 3. Definition of geographic area boundaries
1. Health services definition: For example, a comparison of the Commonwealth’s utilization for cardiac catheterization services relative to national and regional benchmarks indicated a large discrepancy that could not solely be attributable to variations in utilization alone. Further investigation revealed that cardiac catheterization, as defined by CDC, includes only a limited range of procedures pertaining to diagnostic and interventional catheterization (37.21-73.23). In contrast, Kentucky’s more inclusive 2011 Administrative Claims Annual Report for cardiac catheterization services also includes implantation of pacemakers and other interventional procedures. To accommodate this, Kentucky’s data was adjusted to reflect equivalent procedures. A similar situation was encountered with respect to ambulatory surgery. The benchmark utilization included procedures conducted in physician practices, whereas the Commonwealth utilization does not. Developing a comparable benchmark required excluding physician practice volumes from the source data used for benchmark.
104 “2010 Market Research Benchmark Report.” IMV Medical Information Division 105 Delbeke, D. “Status of and trends in nuclear medicine.” The Journal of Nuclear Medicine. (2011). pp. 52(2), 245-285. Accessed at: http://jnm.snmjournals.org/content/52/Supplement_2/24S.full 106 North Carolina Department of Health and Human Services, Division of Health Services Regulation. “State medical facilities plan.” (2012). Accessed at: http://www.ncdhhs.gov/dhsr/ncsmfp/2012/2012smfp.pdf 107 Mississippi State Department of Health, Division of Health Facilities Licensure and Certifi cation. “Report on hospitals.” (2010). Accessed at: http://msdh.ms.gov/msdhsite/_static/resources/4371.pdf 108 North Carolina Department of Health and Human Services, Division of Health Services Regulation. “State medical facilities plan” (2012). Accessed at: http://www.ncdhhs.gov/dhsr/ncsmfp/2012/2012smfp.pdf 109 Mississippi State Department of Health, Division of Health Facilities Licensure and Certification. “Report on hospitals.” (2010). Accessed at: http://msdh.ms.gov/msdhsite/_static/resources/4371.pdf 110 Nationwide Inpatient Sample (NIS), Healthcare Cost and Utilization Project (HCUP), Agency for Healthcare Research and Quality. On-line tool. Accessed June 6. 2013. http://hcupnet.ahrq.gov/ 111 State Inpatient Databases (SID), Healthcare Cost and Utilization Project (HCUP), Agency for Healthcare Research and Quality. On-line tool. Accessed June 6. 2013. http://hcupnet.ahrq.gov/ 112 Nationwide Inpatient Sample (NIS), Healthcare Cost and Utilization Project (HCUP), Agency for Healthcare Research and Quality. On-line tool. Accessed June 6. 2013. http://hcupnet.ahrq.gov/ 113 State Inpatient Databases (SID), Healthcare Cost and Utilization Project (HCUP), Agency for Healthcare Research and Quality. On-line tool. Accessed June 6. 2013. http://hcupnet.ahrq.gov/ 114 Nationwide Inpatient Sample (NIS), Healthcare Cost and Utilization Project (HCUP), Agency for Healthcare Research and Quality. On-line tool. Accessed June 6. 2013. http://hcupnet.ahrq.gov/ 115 State Inpatient Databases (SID), Healthcare Cost and Utilization Project (HCUP), Agency for Healthcare Research and Quality. On-line tool. Accessed June 6. 2013. http://hcupnet.ahrq.gov/
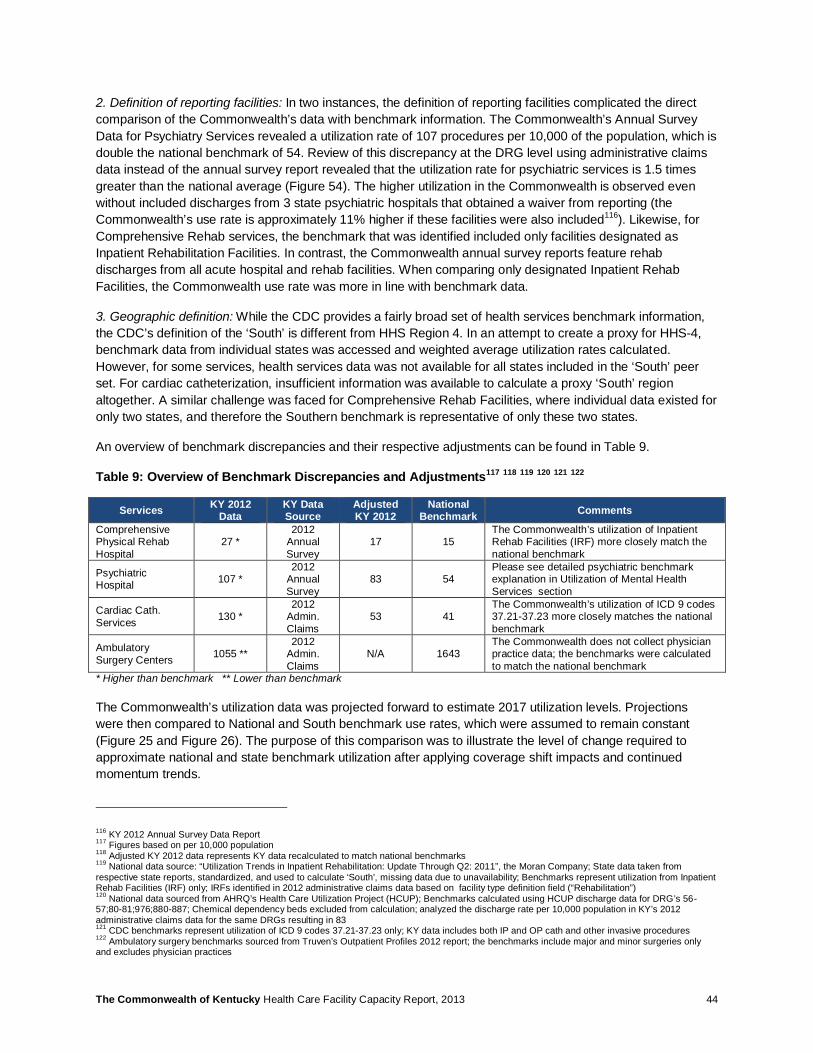
The Commonwealth of Kentucky Health Care Facility Capacity Report, 2013 44
2. Definition of reporting facilities: In two instances, the definition of reporting facilities complicated the direct comparison of the Commonwealth’s data with benchmark information. The Commonwealth’s Annual Survey Data for Psychiatry Services revealed a utilization rate of 107 procedures per 10,000 of the population, which is double the national benchmark of 54. Review of this discrepancy at the DRG level using administrative claims data instead of the annual survey report revealed that the utilization rate for psychiatric services is 1.5 times greater than the national average (Figure 54). The higher utilization in the Commonwealth is observed even without included discharges from 3 state psychiatric hospitals that obtained a waiver from reporting (the Commonwealth’s use rate is approximately 11% higher if these facilities were also included116). Likewise, for Comprehensive Rehab services, the benchmark that was identified included only facilities designated as Inpatient Rehabilitation Facilities. In contrast, the Commonwealth annual survey reports feature rehab discharges from all acute hospital and rehab facilities. When comparing only designated Inpatient Rehab Facilities, the Commonwealth use rate was more in line with benchmark data.
3. Geographic definition: While the CDC provides a fairly broad set of health services benchmark information, the CDC’s definition of the ‘South’ is different from HHS Region 4. In an attempt to create a proxy for HHS-4, benchmark data from individual states was accessed and weighted average utilization rates calculated. However, for some services, health services data was not available for all states included in the ‘South’ peer set. For cardiac catheterization, insufficient information was available to calculate a proxy ‘South’ region altogether. A similar challenge was faced for Comprehensive Rehab Facilities, where individual data existed for only two states, and therefore the Southern benchmark is representative of only these two states.
An overview of benchmark discrepancies and their respective adjustments can be found in Table 9.
Table 9: Overview of Benchmark Discrepancies and Adjustments117 118 119 120 121 122
Services KY 2012 Data
KY Data Source
Adjusted KY 2012
National Benchmark Comments
Comprehensive Physical Rehab Hospital
27 * 2012
Annual Survey
17 15 The Commonwealth’s utilization of Inpatient Rehab Facilities (IRF) more closely match the national benchmark
Psychiatric Hospital 107 *
2012 Annual Survey
83 54 Please see detailed psychiatric benchmark explanation in Utilization of Mental Health Services section
Cardiac Cath. Services 130 *
2012 Admin. Claims
53 41 The Commonwealth’s utilization of ICD 9 codes 37.21-37.23 more closely matches the national benchmark
Ambulatory Surgery Centers 1055 **
2012 Admin. Claims
N/A 1643 The Commonwealth does not collect physician practice data; the benchmarks were calculated to match the national benchmark
* Higher than benchmark ** Lower than benchmark
The Commonwealth’s utilization data was projected forward to estimate 2017 utilization levels. Projections were then compared to National and South benchmark use rates, which were assumed to remain constant (Figure 25 and Figure 26). The purpose of this comparison was to illustrate the level of change required to approximate national and state benchmark utilization after applying coverage shift impacts and continued momentum trends.
116 KY 2012 Annual Survey Data Report 117 Figures based on per 10,000 population 118 Adjusted KY 2012 data represents KY data recalculated to match national benchmarks 119 National data source: “Utilization Trends in Inpatient Rehabilitation: Update Through Q2: 2011”, the Moran Company; State data taken from respective state reports, standardized, and used to calculate ‘South’, missing data due to unavailability; Benchmarks represent utilization from Inpatient Rehab Facilities (IRF) only; IRFs identified in 2012 administrative claims data based on facility type definition field (“Rehabilitation”) 120 National data sourced from AHRQ’s Health Care Utilization Project (HCUP); Benchmarks calculated using HCUP discharge data for DRG’s 56-57;80-81;976;880-887; Chemical dependency beds excluded from calculation; analyzed the discharge rate per 10,000 population in KY’s 2012 administrative claims data for the same DRGs resulting in 83 121 CDC benchmarks represent utilization of ICD 9 codes 37.21-37.23 only; KY data includes both IP and OP cath and other invasive procedures 122 Ambulatory surgery benchmarks sourced from Truven’s Outpatient Profiles 2012 report; the benchmarks include major and minor surgeries only and excludes physician practices
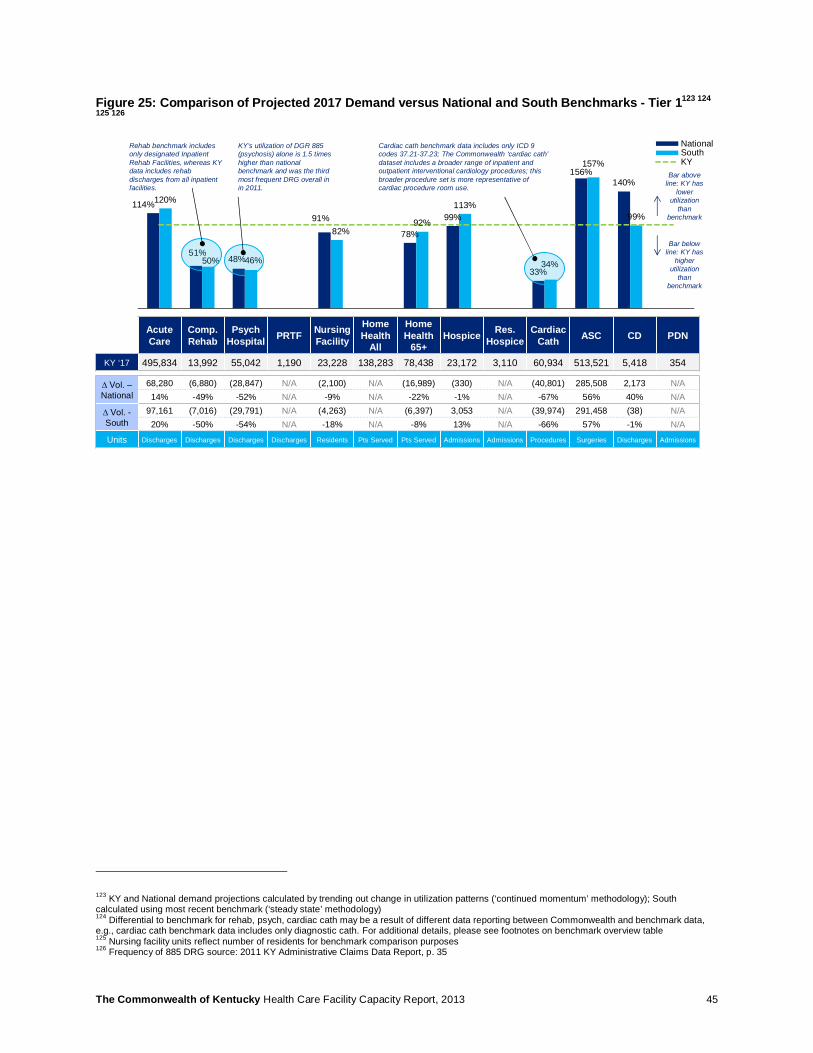
The Commonwealth of Kentucky Health Care Facility Capacity Report, 2013 45
Figure 25: Comparison of Projected 2017 Demand versus National and South Benchmarks - Tier 1123 124
125 126
123 KY and National demand projections calculated by trending out change in utilization patterns (‘continued momentum’ methodology); South calculated using most recent benchmark (‘steady state’ methodology) 124 Differential to benchmark for rehab, psych, cardiac cath may be a result of different data reporting between Commonwealth and benchmark data, e.g., cardiac cath benchmark data includes only diagnostic cath. For additional details, please see footnotes on benchmark overview table 125 Nursing facility units reflect number of residents for benchmark comparison purposes 126 Frequency of 885 DRG source: 2011 KY Administrative Claims Data Report, p. 35
Acute Care
Comp. Rehab
Psych Hospital PRTF Nursing
Facility
Home Health
All
HomeHealth
65+Hospice Res.
HospiceCardiac
Cath ASC CD PDN
KY ‘17 495,834 13,992 55,042 1,190 23,228 138,283 78,438 23,172 3,110 60,934 513,521 5,418 354
∆ Vol. –National
68,280 (6,880) (28,847) N/A (2,100) N/A (16,989) (330) N/A (40,801) 285,508 2,173 N/A14% -49% -52% N/A -9% N/A -22% -1% N/A -67% 56% 40% N/A
∆ Vol. -South
97,161 (7,016) (29,791) N/A (4,263) N/A (6,397) 3,053 N/A (39,974) 291,458 (38) N/A20% -50% -54% N/A -18% N/A -8% 13% N/A -66% 57% -1% N/A
Units Discharges Discharges Discharges Discharges Residents Pts Served Pts Served Admissions Admissions Procedures Surgeries Discharges Admissions
114%
51%48%
91%
78%
99%
33%
156%140%
120%
50% 46%
82%92%
113%
34%
157%
99%
NationalSouthKY
Rehab benchmark includes only designated Inpatient Rehab Facilities, whereas KY data includes rehab discharges from all inpatient facilities.
KY’s utilization of DGR 885 (psychosis) alone is 1.5 times higher than national benchmark and was the third most frequent DRG overall in in 2011.
Cardiac cath benchmark data includes only ICD 9 codes 37.21-37.23; The Commonwealth ‘cardiac cath’ dataset includes a broader range of inpatient and outpatient interventional cardiology procedures; this broader procedure set is more representative of cardiac procedure room use.
Bar above line: KY has
lower utilization
than benchmark
Bar below line: KY has
higher utilization
than benchmark

The Commonwealth of Kentucky Health Care Facility Capacity Report, 2013 46
Figure 26: Comparison of Projected 2017 Demand versus National and South Benchmarks - Tier 2127
In general, this comparison of Commonwealth projections against baseline benchmark data revealed a comparable level of utilization across services for the majority of facility types. Observations include:
• Ambulatory Surgery: Matching national and south benchmark utilization levels in Ambulatory Surgery Centers corresponds to a 56% and 57% increase in the utilization of these services. This could be an indication that the Commonwealth has an opportunity to shift more inpatient surgery to ambulatory settings. If general trends accelerate the transition from hospital-based to ambulatory surgery, then the actual gap for the Commonwealth may be even larger than this initial estimation. (Note: Some ambulatory surgery procedures in the Commonwealth may be conducted in private practices today, which may not be captured in the Commonwealth’s utilization data).
• Chemical Dependency: The Commonwealth’s projected utilization of Chemical Dependency beds is comparable to the ‘South’ benchmark, both of which are 40% below the national average. Coverage for chemical dependency treatment is expanded by the ACA, which could result in a larger number of individuals accessing these services in the near future. Demand for chemical dependency beds in the Commonwealth could thereby rise to levels close to the national benchmark.
• Comprehensive Physical Rehabilitation, Cardiac Catheterization: The discrepancies between projections for the Commonwealth and the baseline benchmark for these services is likely due to the aforementioned challenges in obtaining perfectly comparable benchmark data. But additional factors such as prevalence of medical conditions and access to services cannot be completely ruled out. This could require further exploration on a facility-by-facility basis. (Cardiac Cath is also subject to intense scrutiny relative to medical appropriateness).
• Acute Care, Psychiatric Hospital & PRTF, Nursing Facility & Home Health, Ambulatory Surgery and Imaging: These services are discussed in more detail in separate sections of this report.
127 KY, National and South demand projections calculated using a constant use rate (‘steady state’ methodology)
100%
78%
97% 97%
85%
98%
78%
95%
77%
110%
83%
National SouthKY
Neonatal Open Heart Transplant MRI MRE PET
KY ‘171 17,986 6,712 466 471,500 251,341 26,924
∆ Vol. –National
14 (1,496) (15) (14,759) N/A (4,030)0% -22% -3% -3% N/A -15%
∆ Vol. -South
(450) (1,497) (25) (107,588) 25,175 (4,507)-2% -22% -5% -23% 10% -17%
Units Discharges Operations Transplants Procedures Procedures Procedures
Bar above line: KY has
lower utilization
than benchmark
Bar below line: KY has
higher utilization
than benchmark
The Commonwealth of Kentucky Health Care Facility Capacity Report, 2013 47
Deeper Exploration &
Next Steps for Consideration
Health Services Data 48
Certificate of Need 52
Acute Care Facilities 58
Nursing Facilities 71
Mental Health Services 88
Imaging: MRI, PE 98
Ambulatory Surgical Centers 106
Physical and Occupational Therapy Workforce 111

The Commonwealth of Kentucky Health Care Facility Capacity Report, 2013 48
6 Health Services Data
6.1 Summary Two sets of data were used to perform the analysis: Data sourced from the Annual Utilization and Service Report and The Kentucky Annual Administrative Claims Data Report. Table 10 below indicates the type of data that was used for each facility analysis.
Table 10: Data Source Used per Facility Analysis
Facility Type
Annual Utilization and Service Reports
Administrative Claims Database
Tier 1 Facilities
Acute Care X
Ambulatory Surgery X
Cardiac Catheterization X
Comprehensive Rehabilitation X
Home Health X
Hospice X
Nursing Facilities X
Private Duty Nursing X
Inpatient Psychiatric X
Residential Hospice X
PRTF X
Tier 2 Facilities
MRE X
MRI X
PET X
Neonatal X
Open Heart X
Transplants X
6.2 Data Challenges Generally, the administrative claims data was more detailed and easier to analyze than the summary information provided in the annual survey data. Administrative claims data had the following benefits:
1. Data was better defined (CPT, DRG codes) 2. Data had a higher degree of organization (one entry per claim, additional descriptors like payor) 3. Data was consistent year to year (standard database format) 4. Data included unique identifiers (facility ID, patient origin)
For health services that were reported through the annual survey data, a number of challenges arose. The following section explores these challenges and associated recommendations in four primary categories:
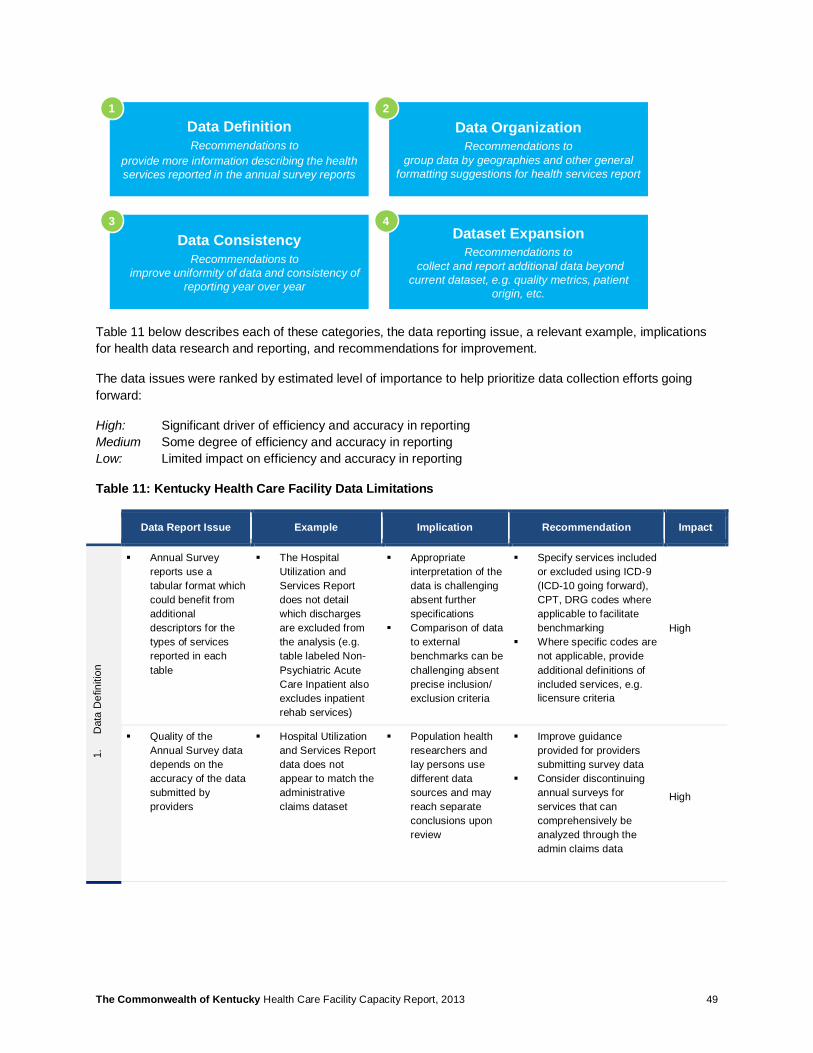
The Commonwealth of Kentucky Health Care Facility Capacity Report, 2013 49
Table 11 below describes each of these categories, the data reporting issue, a relevant example, implications for health data research and reporting, and recommendations for improvement.
The data issues were ranked by estimated level of importance to help prioritize data collection efforts going forward:
High: Significant driver of efficiency and accuracy in reporting Medium Some degree of efficiency and accuracy in reporting Low: Limited impact on efficiency and accuracy in reporting
Table 11: Kentucky Health Care Facility Data Limitations
Data Report Issue Example Implication Recommendation Impact
1.
Dat
a D
efin
ition
§ Annual Survey reports use a tabular format which could benefit from additional descriptors for the types of services reported in each table
§ The Hospital Utilization and Services Report does not detail which discharges are excluded from the analysis (e.g. table labeled Non-Psychiatric Acute Care Inpatient also excludes inpatient rehab services)
§ Appropriate interpretation of the data is challenging absent further specifications
§ Comparison of data to external benchmarks can be challenging absent precise inclusion/ exclusion criteria
§ Specify services included or excluded using ICD-9 (ICD-10 going forward), CPT, DRG codes where applicable to facilitate benchmarking
§ Where specific codes are not applicable, provide additional definitions of included services, e.g. licensure criteria
High
§ Quality of the Annual Survey data depends on the accuracy of the data submitted by providers
§ Hospital Utilization and Services Report data does not appear to match the administrative claims dataset
§ Population health researchers and lay persons use different data sources and may reach separate conclusions upon review
§ Improve guidance provided for providers submitting survey data
§ Consider discontinuing annual surveys for services that can comprehensively be analyzed through the admin claims data
High
Data DefinitionRecommendations to
provide more information describing the health services reported in the annual survey reports
Data OrganizationRecommendations to
group data by geographies and other general formatting suggestions for health services report
Data ConsistencyRecommendations to
improve uniformity of data and consistency of reporting year over year
Dataset ExpansionRecommendations to
collect and report additional data beyond current dataset, e.g. quality metrics, patient
origin, etc.
1 2
3 4
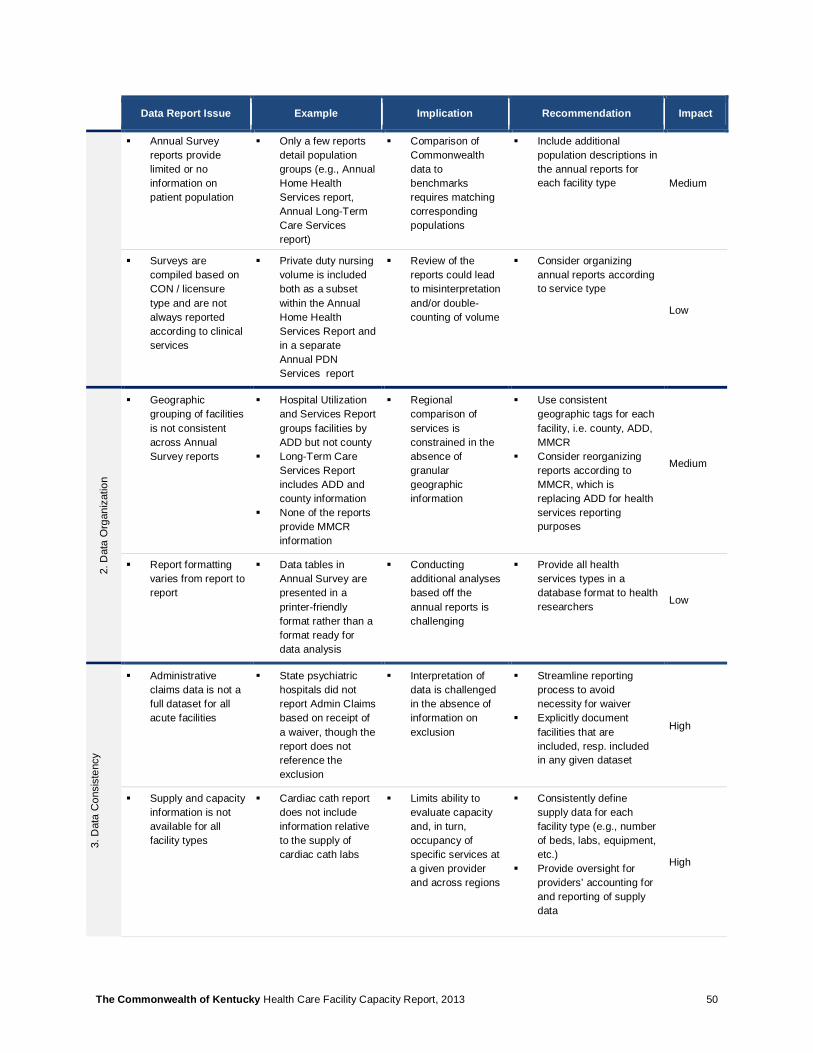
The Commonwealth of Kentucky Health Care Facility Capacity Report, 2013 50
Data Report Issue Example Implication Recommendation Impact
§ Annual Survey reports provide limited or no information on patient population
§ Only a few reports detail population groups (e.g., Annual Home Health Services report, Annual Long-Term Care Services report)
§ Comparison of Commonwealth data to benchmarks requires matching corresponding populations
§ Include additional population descriptions in the annual reports for each facility type Medium
§ Surveys are compiled based on CON / licensure type and are not always reported according to clinical services
§ Private duty nursing volume is included both as a subset within the Annual Home Health Services Report and in a separate Annual PDN Services report
§ Review of the reports could lead to misinterpretation and/or double-counting of volume
§ Consider organizing annual reports according to service type
Low
2. D
ata
Org
aniz
atio
n
§ Geographic grouping of facilities is not consistent across Annual Survey reports
§ Hospital Utilization and Services Report groups facilities by ADD but not county
§ Long-Term Care Services Report includes ADD and county information
§ None of the reports provide MMCR information
§ Regional comparison of services is constrained in the absence of granular geographic information
§ Use consistent geographic tags for each facility, i.e. county, ADD, MMCR
§ Consider reorganizing reports according to MMCR, which is replacing ADD for health services reporting purposes
Medium
§ Report formatting varies from report to report
§ Data tables in Annual Survey are presented in a printer-friendly format rather than a format ready for data analysis
§ Conducting additional analyses based off the annual reports is challenging
§ Provide all health services types in a database format to health researchers Low
3. D
ata
Con
sist
ency
§ Administrative claims data is not a full dataset for all acute facilities
§ State psychiatric hospitals did not report Admin Claims based on receipt of a waiver, though the report does not reference the exclusion
§ Interpretation of data is challenged in the absence of information on exclusion
§ Streamline reporting process to avoid necessity for waiver
§ Explicitly document facilities that are included, resp. included in any given dataset
High
§ Supply and capacity information is not available for all facility types
§ Cardiac cath report does not include information relative to the supply of cardiac cath labs
§ Limits ability to evaluate capacity and, in turn, occupancy of specific services at a given provider and across regions
§ Consistently define supply data for each facility type (e.g., number of beds, labs, equipment, etc.)
§ Provide oversight for providers’ accounting for and reporting of supply data
High

The Commonwealth of Kentucky Health Care Facility Capacity Report, 2013 51
Data Report Issue Example Implication Recommendation Impact
§ Demand data not available for all facility types
§ Within the Annual Hospital Utilization and Services report, the Newborn, Nursery and Neonatal Care table lists information on total births but not the number of neonates treated
§ Limits ability to project demand of high-acuity and high-cost service such as the care of sick neonates
§ Increase level of granularity for reporting volume of high-acuity services, (e.g., neonatal ICU care, etc.)
High
§ Annual Surveys do not include a unique identifier for facilities
§ Spelling of facility names vary between Annual Survey and Admin Claims dataset
§ Restricts ability to longitudinally evaluate provision of healthcare services or compare facility performance across datasets
§ Include Medicare Provider ID or Medicaid/State Provider ID numbers alongside facility names to facilitate comparison across datasets
High
4. H
ealth
Dat
a R
epor
ting
§ Patient origin data is not available for all services or facility types
§ Annual Survey data is based on facility volume data and not patient origin information
§ Restricts ability to comprehensively evaluate geographic demand variations
§ Provide information on patient origin, and other patient characteristics such as admission source, or discharge destination, payor information, etc. more consistently for all services
High
§ The health services dataset focuses predominantly on administrative information and does not include clinical data
§ Beyond the data collected centrally for hospital comparison, the Cabinet does not currently report on quality or patient satisfaction metrics
§ Absence of clinical outcomes data precludes effective comparison of cost vs. quality
§ Quality data could also promote self-regulation in which informed patients opt for higher quality sites
§ Review what quality metrics should be reported year-over-year, and how the Cabinet can supplement third-party outcomes reports, e.g. the Commonwealth Funds’ www.whynotthebest.org
High
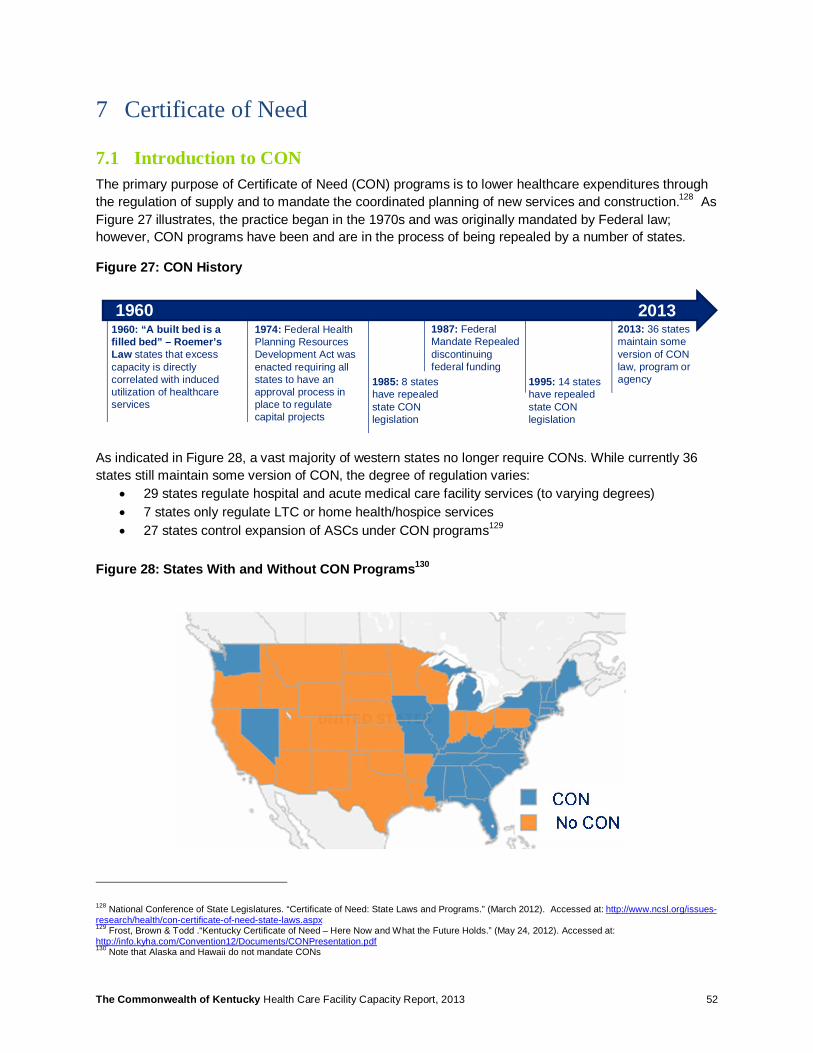
The Commonwealth of Kentucky Health Care Facility Capacity Report, 2013 52
7 Certificate of Need
7.1 Introduction to CON The primary purpose of Certificate of Need (CON) programs is to lower healthcare expenditures through the regulation of supply and to mandate the coordinated planning of new services and construction.128 As Figure 27 illustrates, the practice began in the 1970s and was originally mandated by Federal law; however, CON programs have been and are in the process of being repealed by a number of states.
Figure 27: CON History
As indicated in Figure 28, a vast majority of western states no longer require CONs. While currently 36 states still maintain some version of CON, the degree of regulation varies:
• 29 states regulate hospital and acute medical care facility services (to varying degrees) • 7 states only regulate LTC or home health/hospice services • 27 states control expansion of ASCs under CON programs129
Figure 28: States With and Without CON Programs130
128 National Conference of State Legislatures. “Certificate of Need: State Laws and Programs.” (March 2012). Accessed at: http://www.ncsl.org/issues-research/health/con-certificate-of-need-state-laws.aspx 129 Frost, Brown & Todd .“Kentucky Certificate of Need – Here Now and What the Future Holds.” (May 24, 2012). Accessed at: http://info.kyha.com/Convention12/Documents/CONPresentation.pdf 130 Note that Alaska and Hawaii do not mandate CONs
1960: “A built bed is a filled bed” – Roemer’s Law states that excess capacity is directly correlated with induced utilization of healthcare services
1974: Federal Health Planning Resources Development Act was enacted requiring all states to have an approval process in place to regulate capital projects
1987: Federal Mandate Repealed discontinuing federal funding
1985: 8 states have repealed state CON legislation
1995: 14 states have repealed state CON legislation
2013: 36 states maintain some version of CON law, program or agency
1960 2013
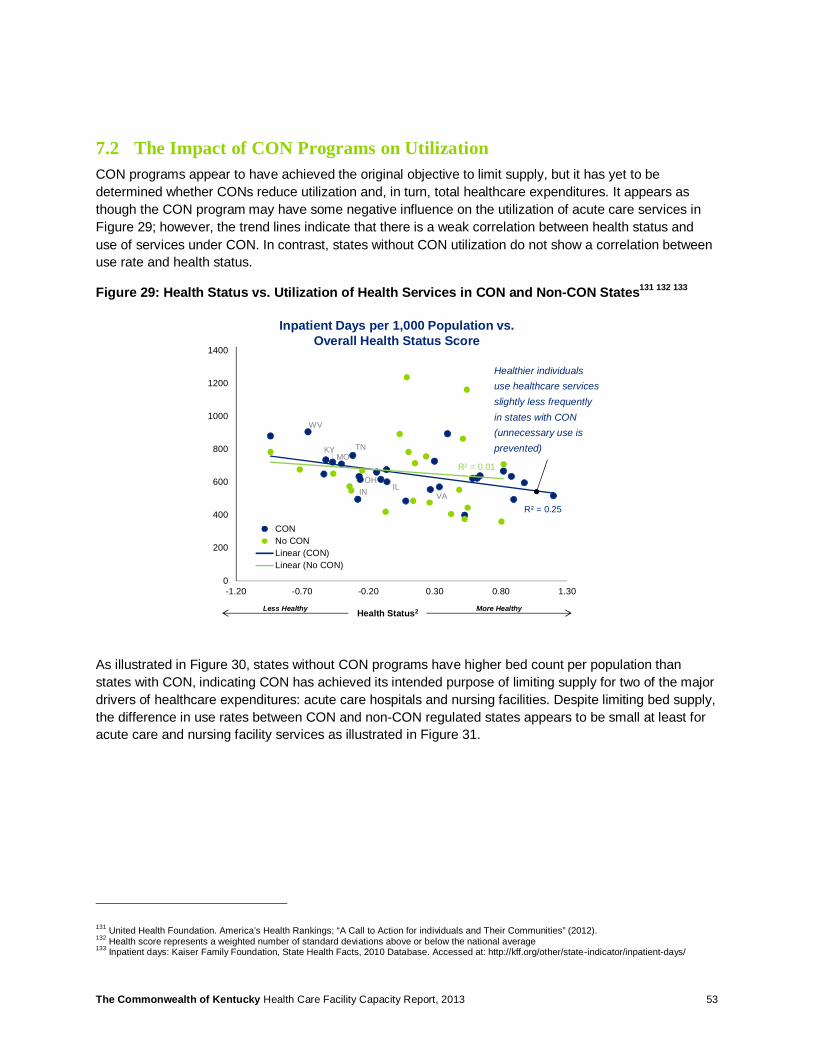
The Commonwealth of Kentucky Health Care Facility Capacity Report, 2013 53
7.2 The Impact of CON Programs on Utilization CON programs appear to have achieved the original objective to limit supply, but it has yet to be determined whether CONs reduce utilization and, in turn, total healthcare expenditures. It appears as though the CON program may have some negative influence on the utilization of acute care services in Figure 29; however, the trend lines indicate that there is a weak correlation between health status and use of services under CON. In contrast, states without CON utilization do not show a correlation between use rate and health status.
Figure 29: Health Status vs. Utilization of Health Services in CON and Non-CON States131 132 133
As illustrated in Figure 30, states without CON programs have higher bed count per population than states with CON, indicating CON has achieved its intended purpose of limiting supply for two of the major drivers of healthcare expenditures: acute care hospitals and nursing facilities. Despite limiting bed supply, the difference in use rates between CON and non-CON regulated states appears to be small at least for acute care and nursing facility services as illustrated in Figure 31.
131 United Health Foundation. America’s Health Rankings; “A Call to Action for individuals and Their Communities” (2012). 132 Health score represents a weighted number of standard deviations above or below the national average 133 Inpatient days: Kaiser Family Foundation, State Health Facts, 2010 Database. Accessed at: http://kff.org/other/state-indicator/inpatient-days/
R² = 0.25
R² = 0.01
0
200
400
600
800
1000
1200
1400
-1.20 -0.70 -0.20 0.30 0.80 1.30
CONNo CONLinear (CON)Linear (No CON)
Health Status2 More HealthyLess Healthy
WV
TN
OH
MO
VAIL
KY
IN
Healthier individuals use healthcare services slightly less frequently in states with CON (unnecessary use is prevented)
Inpatient Days per 1,000 Population vs. Overall Health Status Score

The Commonwealth of Kentucky Health Care Facility Capacity Report, 2013 54
Figure 30: Bed Capacity Comparison between CON and Non-CON States134 135 136
Figure 31: Utilization Comparison between CON and Non-CON States137 138 139
7.3 States Revisit CON Regulations In recent years there has been an increasing amount of activity at the state level related to CON policies. In 2012, 40 CON related bills were passed by 20 of the 36 states with CON requirements and between
134 Kaiser Family Foundation, State Health Facts, 2010 Database. Accessed at: http://kff.org/other/state-indicator/beds/ 135 No additional calculations required for acute care beds 136 Total Certified Nursing Facility Beds were standardized to per 10,000 Medicare Beneficiary population rate taken from Kaiser Family Foundation, State Health Facts database; Medicare enrollees used as a proxy for the 65+ population 137 Kaiser Family Foundation, State Health Facts, 2010 Database. Accessed at: http://kff.org/other/state-indicator/inpatient-days/ 138 No additional calculations required for acute care inpatient days 139 Total Nursing Residents was standardized to per 10,000 Medicare Beneficiary population rate taken from Kaiser Family Foundation, State Health Facts database 2010; Medicare enrollees used as a proxy for the 65+ population
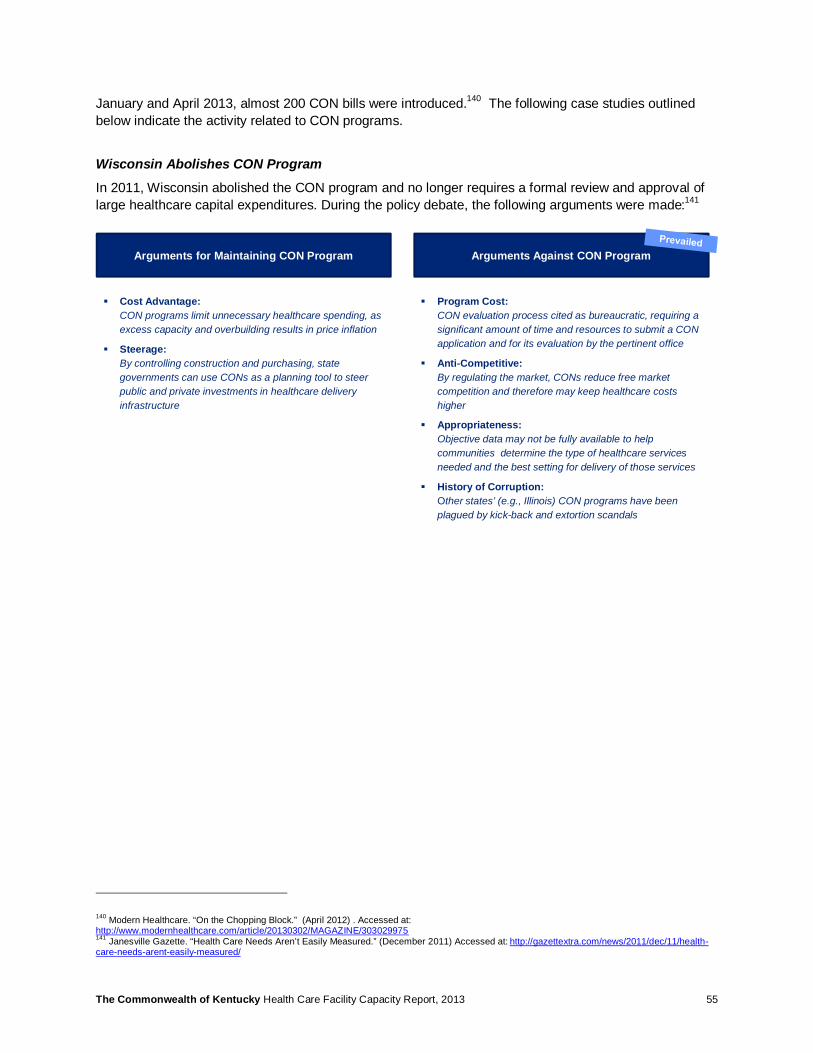
The Commonwealth of Kentucky Health Care Facility Capacity Report, 2013 55
January and April 2013, almost 200 CON bills were introduced.140 The following case studies outlined below indicate the activity related to CON programs.
Wisconsin Abolishes CON Program
In 2011, Wisconsin abolished the CON program and no longer requires a formal review and approval of large healthcare capital expenditures. During the policy debate, the following arguments were made:141
140 Modern Healthcare. “On the Chopping Block.” (April 2012) . Accessed at: http://www.modernhealthcare.com/article/20130302/MAGAZINE/303029975 141 Janesville Gazette. “Health Care Needs Aren’t Easily Measured.” (December 2011) Accessed at: http://gazettextra.com/news/2011/dec/11/health-care-needs-arent-easily-measured/
Arguments for Maintaining CON Program Arguments Against CON Program
§ Cost Advantage:CON programs limit unnecessary healthcare spending, as excess capacity and overbuilding results in price inflation
§ Steerage:By controlling construction and purchasing, state governments can use CONs as a planning tool to steer public and private investments in healthcare delivery infrastructure
§ Program Cost:CON evaluation process cited as bureaucratic, requiring a significant amount of time and resources to submit a CON application and for its evaluation by the pertinent office
§ Anti-Competitive:By regulating the market, CONs reduce free market competition and therefore may keep healthcare costs higher
§ Appropriateness:Objective data may not be fully available to help communities determine the type of healthcare services needed and the best setting for delivery of those services
§ History of Corruption:Other states’ (e.g., Illinois) CON programs have been plagued by kick-back and extortion scandals
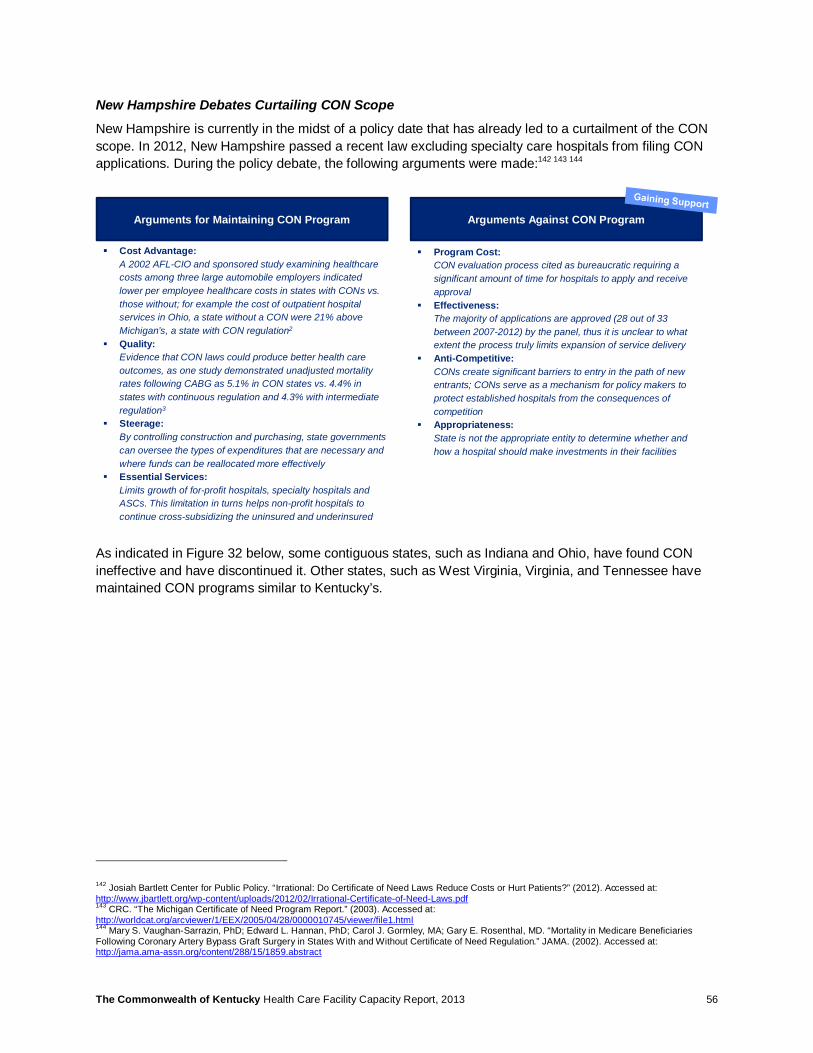
The Commonwealth of Kentucky Health Care Facility Capacity Report, 2013 56
New Hampshire Debates Curtailing CON Scope
New Hampshire is currently in the midst of a policy date that has already led to a curtailment of the CON scope. In 2012, New Hampshire passed a recent law excluding specialty care hospitals from filing CON applications. During the policy debate, the following arguments were made:142 143 144
As indicated in Figure 32 below, some contiguous states, such as Indiana and Ohio, have found CON ineffective and have discontinued it. Other states, such as West Virginia, Virginia, and Tennessee have maintained CON programs similar to Kentucky’s.
142 Josiah Bartlett Center for Public Policy. “Irrational: Do Certificate of Need Laws Reduce Costs or Hurt Patients?” (2012). Accessed at: http://www.jbartlett.org/wp-content/uploads/2012/02/Irrational-Certificate-of-Need-Laws.pdf 143 CRC. “The Michigan Certificate of Need Program Report.” (2003). Accessed at: http://worldcat.org/arcviewer/1/EEX/2005/04/28/0000010745/viewer/file1.html 144 Mary S. Vaughan-Sarrazin, PhD; Edward L. Hannan, PhD; Carol J. Gormley, MA; Gary E. Rosenthal, MD. “Mortality in Medicare Beneficiaries Following Coronary Artery Bypass Graft Surgery in States With and Without Certificate of Need Regulation.” JAMA. (2002). Accessed at: http://jama.ama-assn.org/content/288/15/1859.abstract
Arguments for Maintaining CON Program Arguments Against CON Program
§ Cost Advantage:A 2002 AFL-CIO and sponsored study examining healthcare costs among three large automobile employers indicated lower per employee healthcare costs in states with CONs vs. those without; for example the cost of outpatient hospital services in Ohio, a state without a CON were 21% above Michigan’s, a state with CON regulation2
§ Quality:Evidence that CON laws could produce better health care outcomes, as one study demonstrated unadjusted mortality rates following CABG as 5.1% in CON states vs. 4.4% in states with continuous regulation and 4.3% with intermediate regulation3
§ Steerage:By controlling construction and purchasing, state governments can oversee the types of expenditures that are necessary and where funds can be reallocated more effectively
§ Essential Services:Limits growth of for-profit hospitals, specialty hospitals and ASCs. This limitation in turns helps non-profit hospitals to continue cross-subsidizing the uninsured and underinsured
§ Program Cost:CON evaluation process cited as bureaucratic requiring a significant amount of time for hospitals to apply and receive approval
§ Effectiveness:The majority of applications are approved (28 out of 33 between 2007-2012) by the panel, thus it is unclear to what extent the process truly limits expansion of service delivery
§ Anti-Competitive:CONs create significant barriers to entry in the path of new entrants; CONs serve as a mechanism for policy makers to protect established hospitals from the consequences of competition
§ Appropriateness:State is not the appropriate entity to determine whether and how a hospital should make investments in their facilities
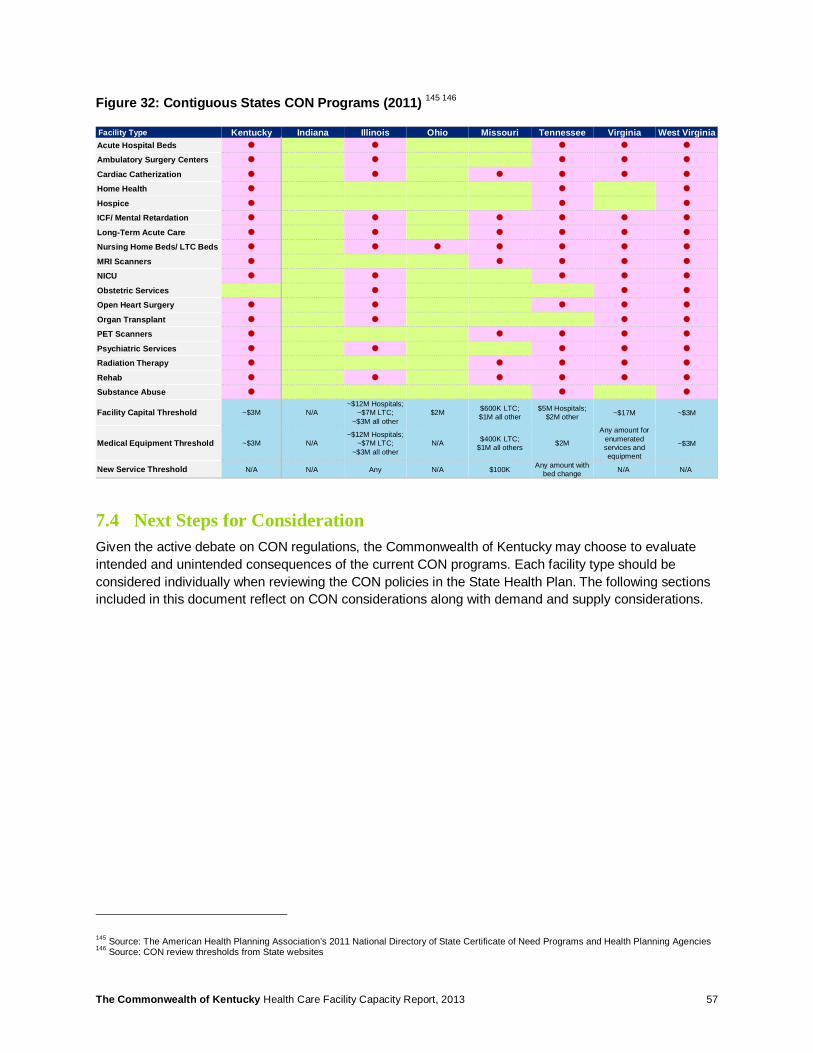
The Commonwealth of Kentucky Health Care Facility Capacity Report, 2013 57
Figure 32: Contiguous States CON Programs (2011) 145 146
7.4 Next Steps for Consideration Given the active debate on CON regulations, the Commonwealth of Kentucky may choose to evaluate intended and unintended consequences of the current CON programs. Each facility type should be considered individually when reviewing the CON policies in the State Health Plan. The following sections included in this document reflect on CON considerations along with demand and supply considerations.
145 Source: The American Health Planning Association’s 2011 National Directory of State Certificate of Need Programs and Health Planning Agencies 146 Source: CON review thresholds from State websites
Facility Type Kentucky Indiana Illinois Ohio Missouri Tennessee Virginia West VirginiaAcute Hospital Beds � � � � �
Ambulatory Surgery Centers � � � � �
Cardiac Catherization � � � � � �
Home Health � � �
Hospice � � �
ICF/ Mental Retardation � � � � � �
Long-Term Acute Care � � � � � �
Nursing Home Beds/ LTC Beds � � � � � � �
MRI Scanners � � � � �
NICU � � � � �
Obstetric Services � � �
Open Heart Surgery � � � � �
Organ Transplant � � � �
PET Scanners � � � � �
Psychiatric Services � � � � �
Radiation Therapy � � � � �
Rehab � � � � � �
Substance Abuse � � �
Facility Capital Threshold ~$3M N/A~$12M Hospitals;
~$7M LTC; ~$3M all other
$2M $600K LTC;$1M all other
$5M Hospitals; $2M other ~$17M ~$3M
Medical Equipment Threshold ~$3M N/A~$12M Hospitals;
~$7M LTC; ~$3M all other
N/A $400K LTC; $1M all others $2M
Any amount for enumerated services and equipment
~$3M
New Service Threshold N/A N/A Any N/A $100K Any amount with bed change N/A N/A

The Commonwealth of Kentucky Health Care Facility Capacity Report, 2013 58
8 Acute Care Facilities
8.1 Analysis Summary Utilization for inpatient services is expected to continue to decline across the nation as hospitals and health systems further transition care to outpatient and community based settings, which offer more cost effective alternatives to inpatient care. Specifically in the Commonwealth of Kentucky, demand for inpatient acute care services is projected to decline as much as 5% over the next 5 years, even after accounting for impacts of population growth and coverage expansion.147
Acute care facilities are well distributed across the Commonwealth. However, a minority of facilities (30%) – largely concentrated in metropolitan areas – provide the majority of patient discharges (60%). In aggregate though, Acute Care occupancy across the Commonwealth is low, with an average of 47% occupancy of licensed beds and 53% occupancy of beds in operation in 2012148.
Large discrepancies exist between facilities, with average occupancy of licensed beds below 30% at some facilities149. Health researchers have cited concerns that minimum scale is needed in order to facilitate consistent quality of care, though such a correlation could not be ascertained for facilities in the Commonwealth. However, in the Commonwealth there appears to be a positive relationship between occupancy level and patient satisfaction scores.
Critical Access Hospitals display varying levels of occupancy ranging from 11% to 85%. But regardless of occupancy levels, many Critical Access Hospitals serve an important role in improving access to urgent and emergent care. Some strategically positioned facilities reduce patient drive time upwards of 60 minutes.150
8.2 Utilization & Occupancy Demand for acute services is projected to decline in Kentucky at a rate of 5% through 2017.151 This trend is driven by items such as:
• Penetration of accountable care models, which encourages multi-specialty care across inpatient, outpatient, and long-term care settings
• Readmission penalties from ACA, which create the checks and balances necessary when operating within a prospective payment system
• Advent of bundled payments, which align incentives for physicians in managing resource utilization • Reimbursement policies that favor outpatient treatment • Adoption of technology-based substitutes (e.g., telemedicine)
Figure 33 shows a comparison to contiguous states: the Commonwealth has a relatively higher hospital bed capacity (36 beds per 10,000 population) but average occupancy (53% of staffed beds). Note: This occupancy benchmark was calculated from third-party sources and may not perfectly match occupancy determined from the Commonwealth’s own health services data.152
147 Based on 2012 KY Inpatient Administrative Claims Data Report; projections based on Deloitte facility capacity model 148 DataAdvantage dataset run April 2012; based on 2011 Medicare Cost Reports 149 Based on 2012 KY Inpatient Administrative Claims Data Report; projections based on Deloitte facility capacity model 150 Ibid 151 Ibid 152 DataAdvantage dataset run April 2012; based on 2011 Medicare Cost Reports
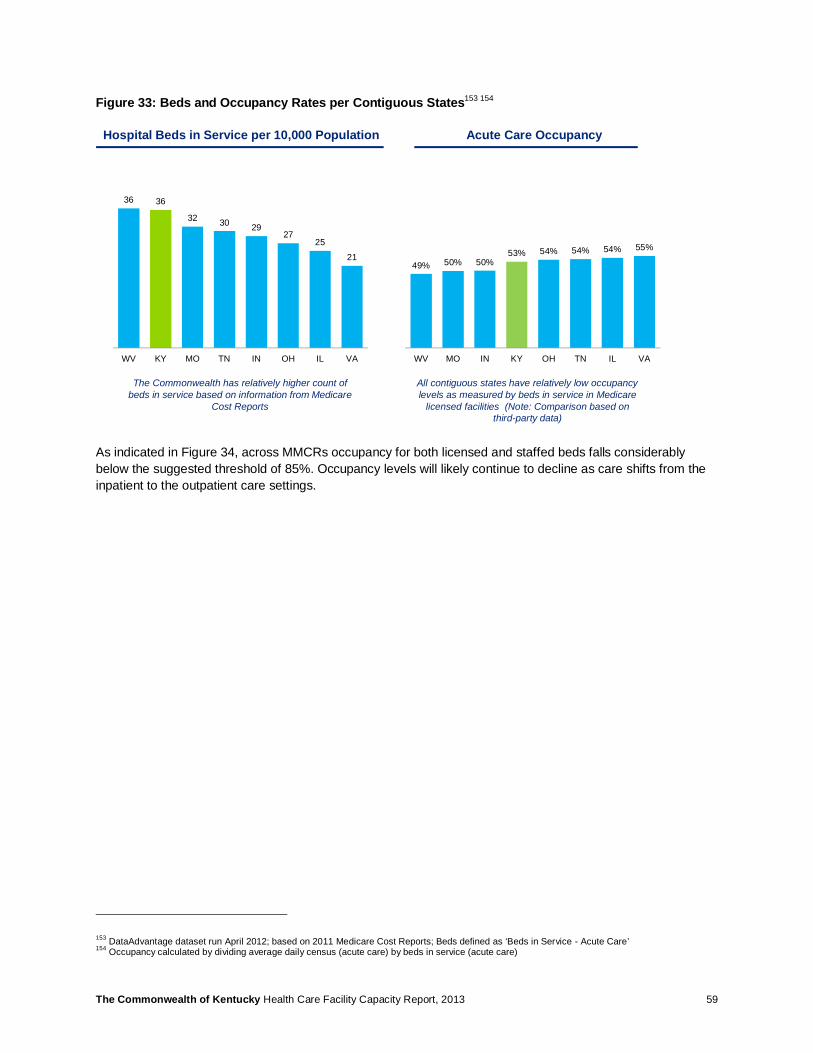
The Commonwealth of Kentucky Health Care Facility Capacity Report, 2013 59
Figure 33: Beds and Occupancy Rates per Contiguous States153 154
As indicated in Figure 34, across MMCRs occupancy for both licensed and staffed beds falls considerably below the suggested threshold of 85%. Occupancy levels will likely continue to decline as care shifts from the inpatient to the outpatient care settings.
153 DataAdvantage dataset run April 2012; based on 2011 Medicare Cost Reports; Beds defined as ‘Beds in Service - Acute Care’ 154 Occupancy calculated by dividing average daily census (acute care) by beds in service (acute care)
36 36
32 30 2927
25
21
WV KY MO TN IN OH IL VA
49% 50% 50%53% 54% 54% 54% 55%
WV MO IN KY OH TN IL VA
Hospital Beds in Service per 10,000 Population Acute Care Occupancy
All contiguous states have relatively low occupancy levels as measured by beds in service in Medicare
licensed facilities (Note: Comparison based on third-party data)
The Commonwealth has relatively higher count of beds in service based on information from Medicare
Cost Reports
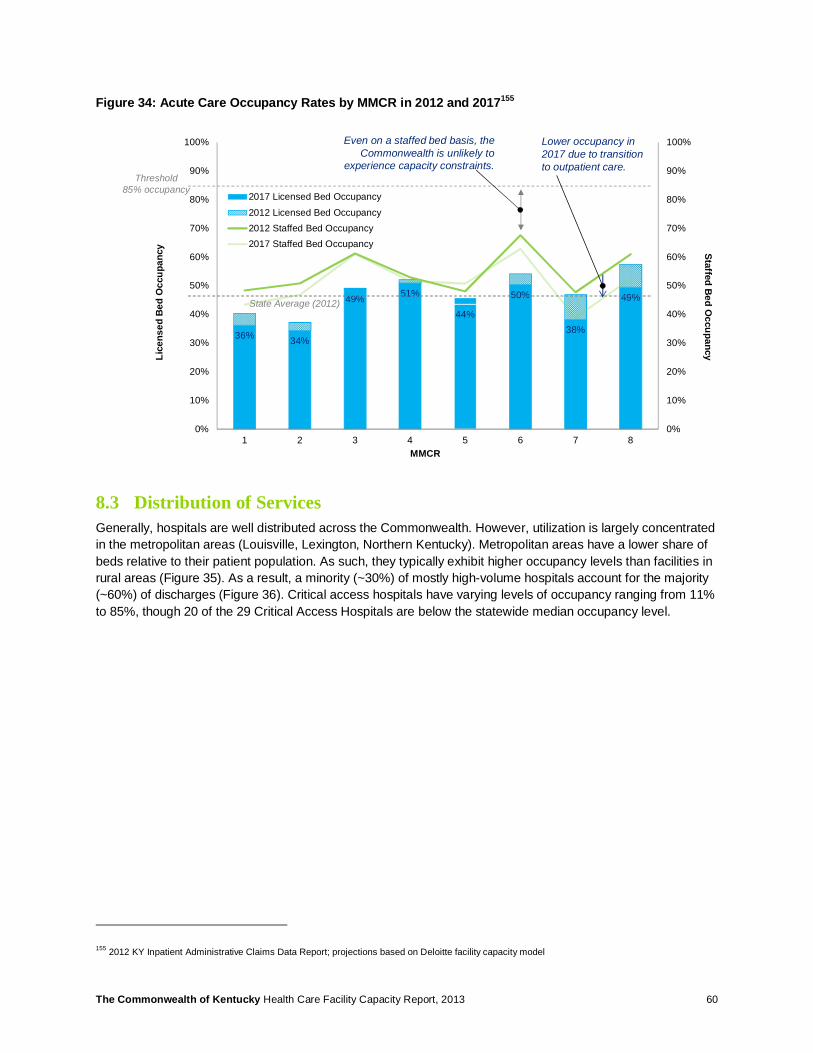
The Commonwealth of Kentucky Health Care Facility Capacity Report, 2013 60
Figure 34: Acute Care Occupancy Rates by MMCR in 2012 and 2017155
8.3 Distribution of Services Generally, hospitals are well distributed across the Commonwealth. However, utilization is largely concentrated in the metropolitan areas (Louisville, Lexington, Northern Kentucky). Metropolitan areas have a lower share of beds relative to their patient population. As such, they typically exhibit higher occupancy levels than facilities in rural areas (Figure 35). As a result, a minority (~30%) of mostly high-volume hospitals account for the majority (~60%) of discharges (Figure 36). Critical access hospitals have varying levels of occupancy ranging from 11% to 85%, though 20 of the 29 Critical Access Hospitals are below the statewide median occupancy level.
155 2012 KY Inpatient Administrative Claims Data Report; projections based on Deloitte facility capacity model
Lice
nsed
Bed
Occ
upan
cy
MMCR
Staffed Bed O
ccupancy
36% 34%
49% 51%
44%
50%
38%
49%
0%
10%
20%
30%
40%
50%
60%
70%
80%
90%
100%
0%
10%
20%
30%
40%
50%
60%
70%
80%
90%
100%
1 2 3 4 5 6 7 8
2017 Licensed Bed Occupancy
2012 Licensed Bed Occupancy2012 Staffed Bed Occupancy2017 Staffed Bed Occupancy
Threshold 85% occupancy
Even on a staffed bed basis, the Commonwealth is unlikely to
experience capacity constraints.
Lower occupancy in 2017 due to transition to outpatient care.
State Average (2012)
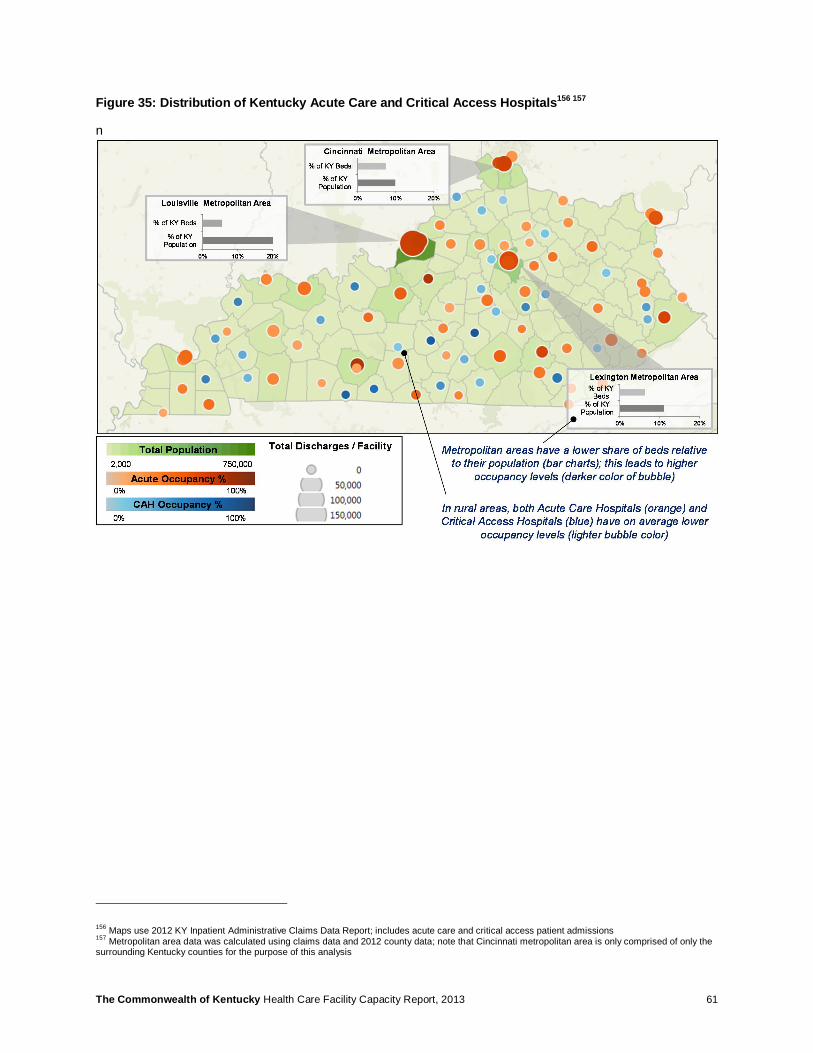
The Commonwealth of Kentucky Health Care Facility Capacity Report, 2013 61
Figure 35: Distribution of Kentucky Acute Care and Critical Access Hospitals156 157
n
156 Maps use 2012 KY Inpatient Administrative Claims Data Report; includes acute care and critical access patient admissions 157 Metropolitan area data was calculated using claims data and 2012 county data; note that Cincinnati metropolitan area is only comprised of only the surrounding Kentucky counties for the purpose of this analysis
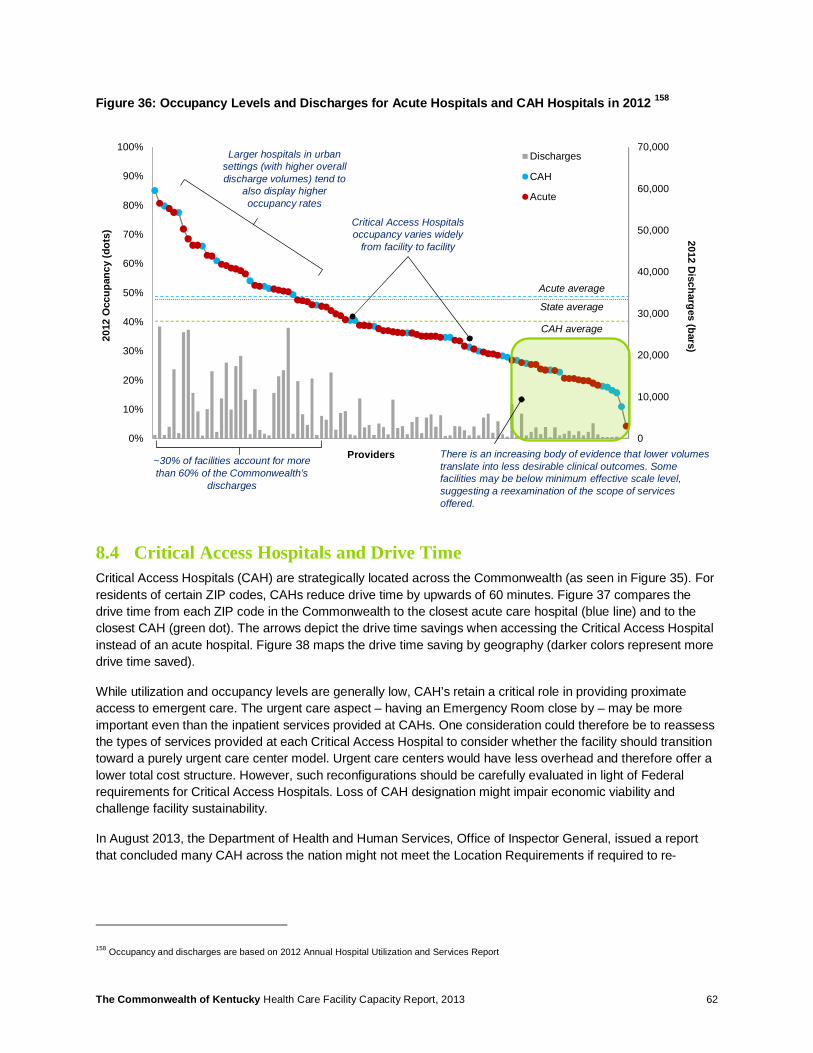
The Commonwealth of Kentucky Health Care Facility Capacity Report, 2013 62
Figure 36: Occupancy Levels and Discharges for Acute Hospitals and CAH Hospitals in 2012 158
8.4 Critical Access Hospitals and Drive Time Critical Access Hospitals (CAH) are strategically located across the Commonwealth (as seen in Figure 35). For residents of certain ZIP codes, CAHs reduce drive time by upwards of 60 minutes. Figure 37 compares the drive time from each ZIP code in the Commonwealth to the closest acute care hospital (blue line) and to the closest CAH (green dot). The arrows depict the drive time savings when accessing the Critical Access Hospital instead of an acute hospital. Figure 38 maps the drive time saving by geography (darker colors represent more drive time saved).
While utilization and occupancy levels are generally low, CAH’s retain a critical role in providing proximate access to emergent care. The urgent care aspect – having an Emergency Room close by – may be more important even than the inpatient services provided at CAHs. One consideration could therefore be to reassess the types of services provided at each Critical Access Hospital to consider whether the facility should transition toward a purely urgent care center model. Urgent care centers would have less overhead and therefore offer a lower total cost structure. However, such reconfigurations should be carefully evaluated in light of Federal requirements for Critical Access Hospitals. Loss of CAH designation might impair economic viability and challenge facility sustainability.
In August 2013, the Department of Health and Human Services, Office of Inspector General, issued a report that concluded many CAH across the nation might not meet the Location Requirements if required to re-
158 Occupancy and discharges are based on 2012 Annual Hospital Utilization and Services Report
Providers
2012
Occ
upan
cy (d
ots)
CAH average
Acute average
State average
0
10,000
20,000
30,000
40,000
50,000
60,000
70,000
0%
10%
20%
30%
40%
50%
60%
70%
80%
90%
100%Discharges
CAH
Acute
2012 Discharges (bars)
~30% of facilities account for more than 60% of the Commonwealth’s
discharges
Larger hospitals in urban settings (with higher overall discharge volumes) tend to
also display higher occupancy rates
Critical Access Hospitals occupancy varies widely
from facility to facility
There is an increasing body of evidence that lower volumes translate into less desirable clinical outcomes. Some facilities may be below minimum effective scale level, suggesting a reexamination of the scope of services offered.
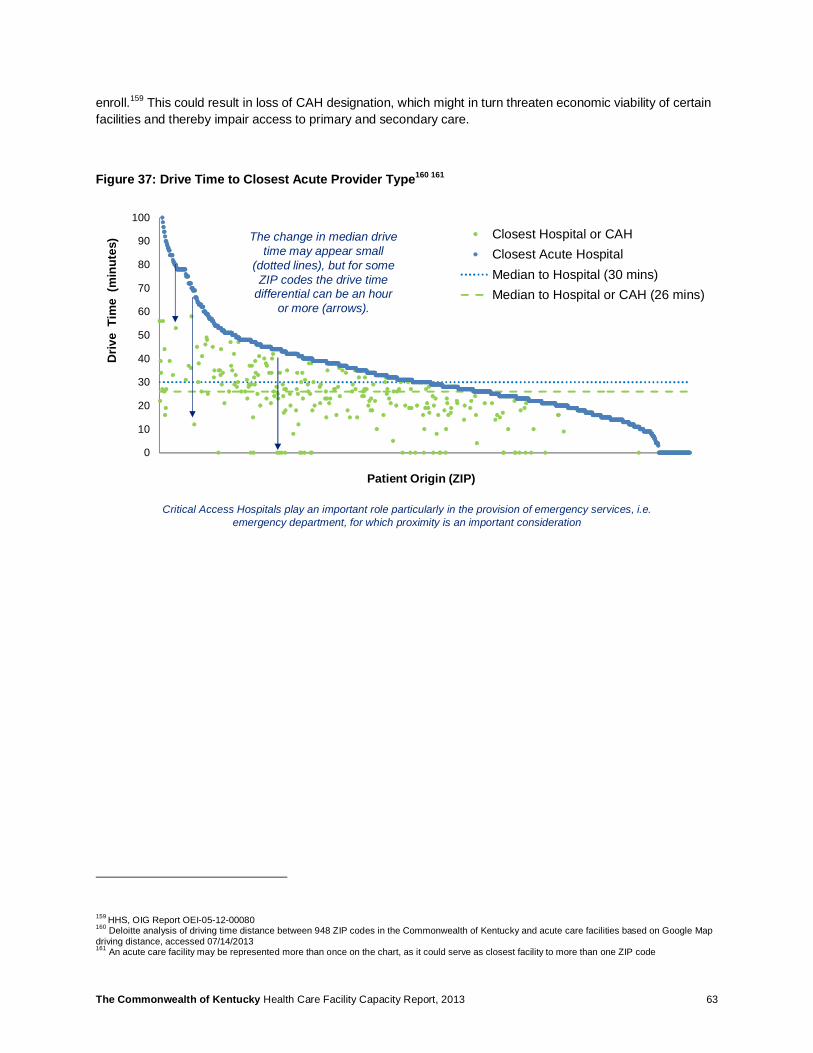
The Commonwealth of Kentucky Health Care Facility Capacity Report, 2013 63
enroll.159 This could result in loss of CAH designation, which might in turn threaten economic viability of certain facilities and thereby impair access to primary and secondary care.
Figure 37: Drive Time to Closest Acute Provider Type160 161
159 HHS, OIG Report OEI-05-12-00080 160 Deloitte analysis of driving time distance between 948 ZIP codes in the Commonwealth of Kentucky and acute care facilities based on Google Map driving distance, accessed 07/14/2013 161 An acute care facility may be represented more than once on the chart, as it could serve as closest facility to more than one ZIP code
0
10
20
30
40
50
60
70
80
90
100
4010
440
291
4027
240
170
4024
241
534
4025
140
868
4014
242
461
4172
240
075
4004
040
983
4237
040
461
4165
140
346
4275
942
047
4213
542
129
4116
441
092
4164
541
635
4172
341
760
4207
042
207
4081
340
337
4177
842
303
4101
740
932
4036
141
653
Closest Hospital or CAHClosest Acute HospitalMedian to Hospital (30 mins)Median to Hospital or CAH (26 mins)
Driv
e T
ime
(min
utes
)
Patient Origin (ZIP)
The change in median drive time may appear small
(dotted lines), but for some ZIP codes the drive time
differential can be an hour or more (arrows).
Critical Access Hospitals play an important role particularly in the provision of emergency services, i.e. emergency department, for which proximity is an important consideration

The Commonwealth of Kentucky Health Care Facility Capacity Report, 2013 64
Figure 38: Drive Time Saved by Critical Access Hospitals162 163
8.5 Consolidation of Services There is an increasing body of evidence that lower volumes translate into inferior clinical outcomes.164 165 Some facilities fall below minimum effective scale level, suggesting deeper scrutiny of services provided may be needed. Cardiac surgery, for example, is performed at a number of facilities across the Commonwealth, but many do not appear to reach reasonable scale (Figure 39). Hardin Memorial Hospital, for example, only discharged 40 cardiac surgery patients in 2012. Three other hospitals that are accredited to provide open heart surgery did not report procedures in 2012: St. Joseph East Hospital, Lexington, KY; St. Elizabeth Florence, Florence, KY; and Greenview Regional Hospital, Bowling Green, KY.
162 2012 KY Inpatient Administrative Claims Data Report; includes all acute care and critical access patient admissions 163 Drive time was calculated as distance between facility zip codes using GoogleMaps® 164 Karen E. Joynt, Yael Harris, E. John Orav, Ashish K. Jha,. Quality of Care and Patient Outcomes in Critical Access Rural Hospitals.” (July 2011). Journal of the American Medical Association 165 Ross, Joseph. Hospital Volume and 30-Day Mortality for Three Common Medical Conditions.” (March 2010). New England Journal of Medicine.
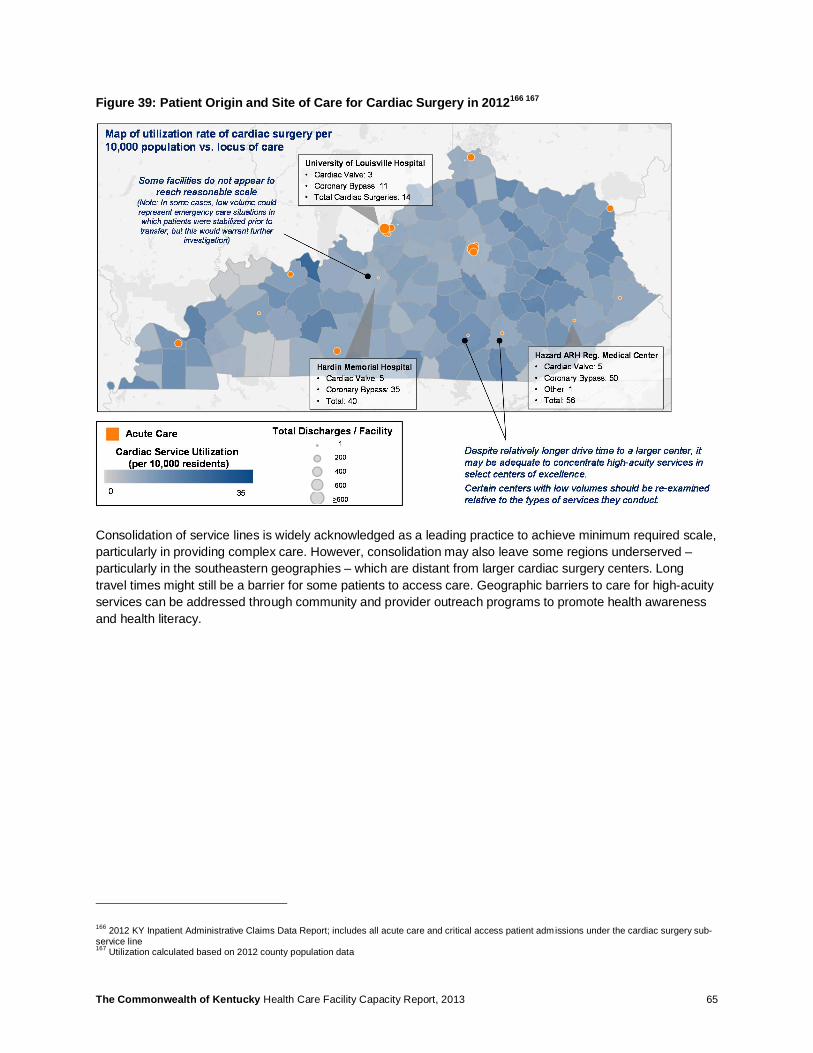
The Commonwealth of Kentucky Health Care Facility Capacity Report, 2013 65
Figure 39: Patient Origin and Site of Care for Cardiac Surgery in 2012166 167
Consolidation of service lines is widely acknowledged as a leading practice to achieve minimum required scale, particularly in providing complex care. However, consolidation may also leave some regions underserved – particularly in the southeastern geographies – which are distant from larger cardiac surgery centers. Long travel times might still be a barrier for some patients to access care. Geographic barriers to care for high-acuity services can be addressed through community and provider outreach programs to promote health awareness and health literacy.
166 2012 KY Inpatient Administrative Claims Data Report; includes all acute care and critical access patient admissions under the cardiac surgery sub-service line 167 Utilization calculated based on 2012 county population data

The Commonwealth of Kentucky Health Care Facility Capacity Report, 2013 66
Organ transplantation is an example of service line that has been consolidated to achieve effective scale. Transplant centers are concentrated in the Louisville and Lexington metropolitan areas (Figure 40).The University of Louisville and Jewish Hospital have recently consolidated their service lines to further increase scale and achieve efficiencies.
Figure 40: Patient Origin and Site of Care for Transplant Surgery in 2012168 169
While concentration of services is recommended for specialized high-acuity care, general health services should remain accessible to the population in proximate locations. Figure 41 shows that General Medicine services, the highest frequency inpatient health service, are relatively evenly distributed across the state (each bubble corresponds to a hospital). Even so, some counties without an acute care facility appear to have lower utilization rates (lighter shading of the county). This could potentially be an indicator that these geographies are medically underserved due to barriers to access in proximate acute care.
168 2012 KY Inpatient Administrative Claims Data Report; includes all acute care and critical access patient admissions under the transplant sub-service line 169 Utilization calculated based on 2012 county population data
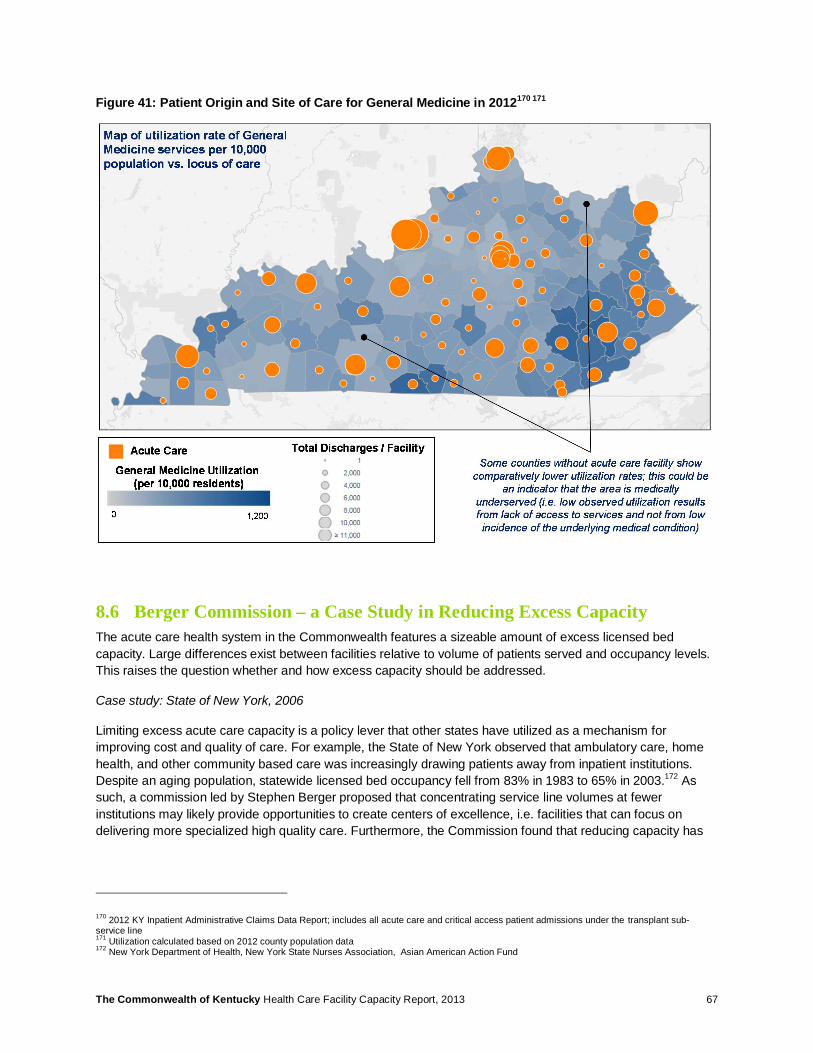
The Commonwealth of Kentucky Health Care Facility Capacity Report, 2013 67
Figure 41: Patient Origin and Site of Care for General Medicine in 2012170 171
8.6 Berger Commission – a Case Study in Reducing Excess Capacity The acute care health system in the Commonwealth features a sizeable amount of excess licensed bed capacity. Large differences exist between facilities relative to volume of patients served and occupancy levels. This raises the question whether and how excess capacity should be addressed.
Case study: State of New York, 2006
Limiting excess acute care capacity is a policy lever that other states have utilized as a mechanism for improving cost and quality of care. For example, the State of New York observed that ambulatory care, home health, and other community based care was increasingly drawing patients away from inpatient institutions. Despite an aging population, statewide licensed bed occupancy fell from 83% in 1983 to 65% in 2003.172 As such, a commission led by Stephen Berger proposed that concentrating service line volumes at fewer institutions may likely provide opportunities to create centers of excellence, i.e. facilities that can focus on delivering more specialized high quality care. Furthermore, the Commission found that reducing capacity has
170 2012 KY Inpatient Administrative Claims Data Report; includes all acute care and critical access patient admissions under the transplant sub-service line 171 Utilization calculated based on 2012 county population data 172 New York Department of Health, New York State Nurses Association, Asian American Action Fund

The Commonwealth of Kentucky Health Care Facility Capacity Report, 2013 68
the potential to curb healthcare costs – the New York State legislature forecasted that Medicaid savings alone could be upward of $249 million over 10 years.173
Facing an unsustainable growth trajectory in Medicaid expenditures as well as a host of other health system failures, the Berger Commission final report addressed both acute care and nursing facilities. The final recommendations targeted 57 hospitals, or one-quarter of the hospitals in New York. The report proposed 48 reconfigurations, affiliations, and conversion schemes. For acute care, recommendations were expected to reduce inpatient capacity by 4,200 beds or 7% of the state’s supply. The nursing facility recommendations focused on downsizing as opposed to closures, proposing a reduction of 3,000 nursing beds across the state, or 2.6% of total capacity.174
Takeaways from Berger Report
In theory, there may be good reason for reducing acute capacity. Even so, a number of important considerations should be accounted for in developing capacity reduction plans:
• Capacity and staffing should be evaluated together: Excess beds should not directly be equated with excess staffing – Facilities that experience excess capacity may actually be understaffed in their current configuration. If a staffing-neutral capacity reduction is targeted, total economies may be less than projected based on average cost of maintaining a staffed bed (at the margin, dropping an unstaffed bed does not reduce costs).
• Mobility of clinical staff should not be overestimated: Achieving higher specialization levels will require re-training clinical staff, which will entail an initial – and potentially longer-term – loss in productivity. This could temporarily exacerbate shortage in nursing and other clinical staff.
• Retaining sufficient emergency contingency capacity is critical: Surge demand should be planned for, and the level of event severity for which the system is designed should be judiciously selected, i.e. taking into account natural disasters, terrorist threats, etc. Case in point: When Hurricane Sandy hit Manhattan, there were insufficient acute beds to transfer patients from disabled Manhattan-based hospitals. Evacuation from the peninsula to surrounding locations was also impaired due to interruptions in the transportation.
8.7 Patient Satisfaction and Occupancy Ultimately, the objective of the Berger Commissions was to drive volume to providers that demonstrate scale efficiencies, high quality outcomes, and higher levels of patient satisfaction. As illustrated in Figure 42, the Commonwealth’s larger facilities appear to have less variation in their occupancy levels on a day-to-day basis, while smaller facilities vary from 11%-85% occupancy. Further, facilities with higher patient satisfaction also have higher occupancy levels. The causality is subject to interpretation: Patients may have preferences based on PCP recommendation or word of mouth, leading to higher admissions and occupancy for certain hospitals. Conversely, tighter facility operations may translate into both higher occupancy and greater patient satisfaction.
173 “A Plan to Stabilize and Strengthen New York’s Health Care System: Final Report of the Commission on Health Care Facilities in the 21st Century.” (2006). Accessed at: http://www.nyhealthcarecommission.org/docs/final/commissionfinalreport.pdf Figure calculated based on reductions in inappropriate utilization of services due to excess capacity, avoided capital investment in underutilized facilities, and leveraging the savings achieved from the reinvestment of foregoing savings into “savings-generating activities” 174 “A Plan to Stabilize and Strengthen New York’s Health Care System: Final Report of the Commission on Health Care Facilities in the 21st Century.” (2006). Accessed at: http://www.nyhealthcarecommission.org/docs/final/commissionfinalreport.pdf
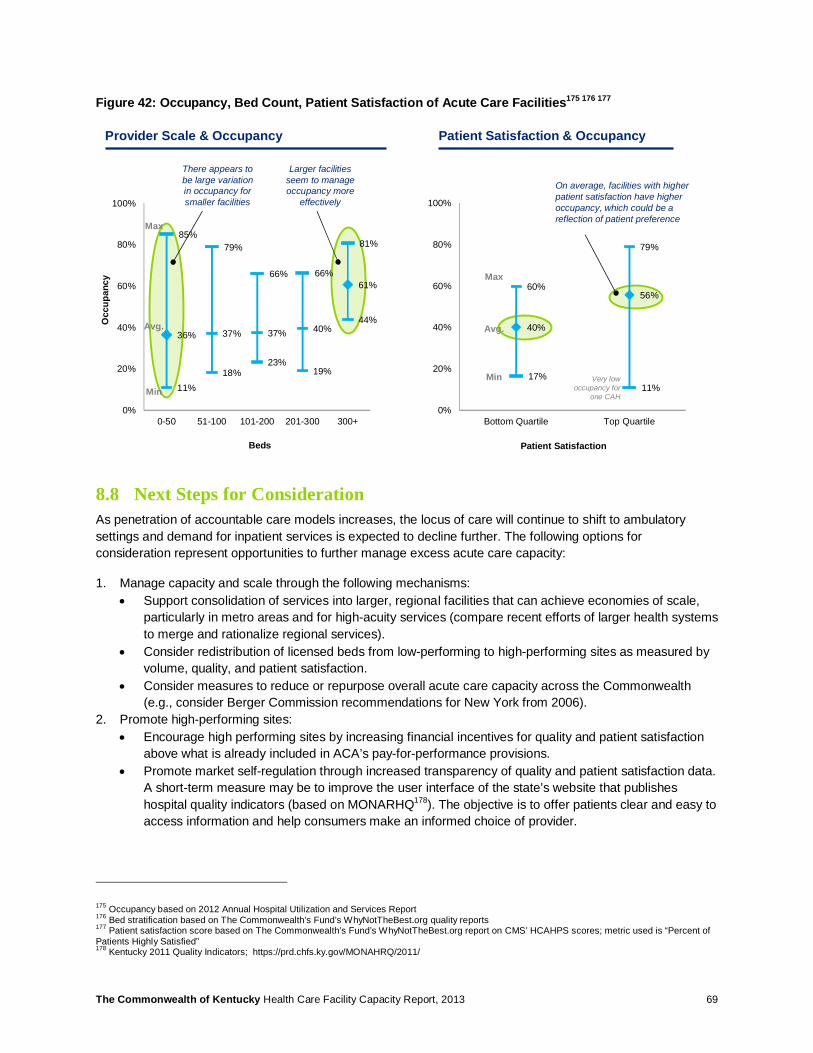
The Commonwealth of Kentucky Health Care Facility Capacity Report, 2013 69
Figure 42: Occupancy, Bed Count, Patient Satisfaction of Acute Care Facilities175 176 177
8.8 Next Steps for Consideration As penetration of accountable care models increases, the locus of care will continue to shift to ambulatory settings and demand for inpatient services is expected to decline further. The following options for consideration represent opportunities to further manage excess acute care capacity:
1. Manage capacity and scale through the following mechanisms: • Support consolidation of services into larger, regional facilities that can achieve economies of scale,
particularly in metro areas and for high-acuity services (compare recent efforts of larger health systems to merge and rationalize regional services).
• Consider redistribution of licensed beds from low-performing to high-performing sites as measured by volume, quality, and patient satisfaction.
• Consider measures to reduce or repurpose overall acute care capacity across the Commonwealth (e.g., consider Berger Commission recommendations for New York from 2006).
2. Promote high-performing sites: • Encourage high performing sites by increasing financial incentives for quality and patient satisfaction
above what is already included in ACA’s pay-for-performance provisions. • Promote market self-regulation through increased transparency of quality and patient satisfaction data.
A short-term measure may be to improve the user interface of the state’s website that publishes hospital quality indicators (based on MONARHQ178). The objective is to offer patients clear and easy to access information and help consumers make an informed choice of provider.
175 Occupancy based on 2012 Annual Hospital Utilization and Services Report 176 Bed stratification based on The Commonwealth’s Fund’s WhyNotTheBest.org quality reports 177 Patient satisfaction score based on The Commonwealth’s Fund’s WhyNotTheBest.org report on CMS’ HCAHPS scores; metric used is “Percent of Patients Highly Satisfied” 178 Kentucky 2011 Quality Indicators; https://prd.chfs.ky.gov/MONAHRQ/2011/
36% 37% 37% 40%
61%
85%79%
66% 66%
81%
11%18%
23%19%
44%
0%
20%
40%
60%
80%
100%
0-50 51-100 101-200 201-300 300+
60%
79%
17%11%
40%
56%
0%
20%
40%
60%
80%
100%
Bottom Quartile Top Quartile
Beds Patient Satisfaction
Provider Scale & Occupancy Patient Satisfaction & Occupancy
Max
Min
Avg.
Max
Min
Avg.
Occ
upan
cy
There appears to be large variation in occupancy for smaller facilities
On average, facilities with higher patient satisfaction have higher occupancy, which could be a reflection of patient preference
Very low occupancy for
one CAH
Larger facilities seem to manage occupancy more
effectively

The Commonwealth of Kentucky Health Care Facility Capacity Report, 2013 70
3. Reshape focus of Critical Access Hospitals • Consider redesigning the types of services provided at Kentucky CAHs, increasing their role in
delivering emergency and urgent care services while de-emphasizing non-urgent services.
It is important to note that reallocation of acute bed capacity is a complex endeavor and could have a range of unintended repercussions. The impact on delivery system – both at the local and regional level – should be judiciously evaluated. Additional in-depth analyses should precede potential action.
8.9 Potential Challenges As stated above, planning to remove or repurpose excess capacity requires taking into account a range of factors and evaluating upstream and downstream impacts across the health system. Potential challenges include:
• Any process to encourage consolidation of capacity should be judiciously monitored in order to retain market competition, i.e. not create an anti-competitive situation in a local or regional market.
• Redeployment of capacity from one provider to another should be substantiated by careful analysis of historical performance trends along a range of care and outcomes metrics (i.e., quality, satisfaction, total cost of care, staffing situation, etc.). Capacity reduction should account for provider workforce considerations. Capacity redistribution should consider whether residents have timely access to both common and critical health services. Such a major market intervention could face strong opposition from incumbents.
• Suggestions to reduce capacity and discontinue facilities could have repercussions in the community. Hospitals are often major employers and substantial economic drivers, particularly within smaller communities. Communities also attach emotional value to having a freestanding acute care facility in their vicinity and fear being medically underserved if capacity cuts are implemented. Health care capacity planning initiatives may trigger a public outcry.
• A self-regulating market that promotes informed consumer choice will be offset by trends in the payer market that are moving toward ‘narrow networks’ (Narrow networks limit patients’ choice of provider in exchange for lower premiums).The narrow network concept is expected to be particularly prevalent in plans sold over the exchanges. In addition to limitations on choice, the lay consumer may not have sufficient knowledge to make judicious choices for site of care and should incorporate professional recommendations from primary care providers.
• Reshaping services provided at Critical Access Hospitals should be conducted within the Federal requirements for Critical Access status. Loss of CAH designation may endanger economic viability.
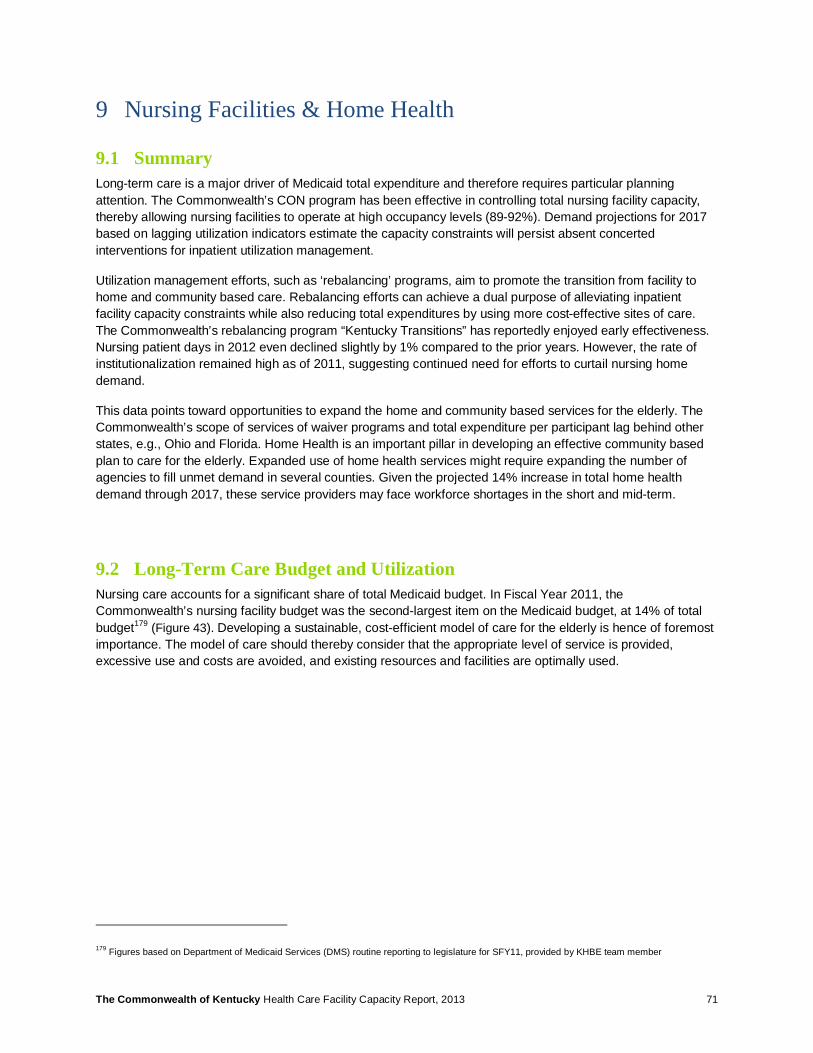
The Commonwealth of Kentucky Health Care Facility Capacity Report, 2013 71
9 Nursing Facilities & Home Health
9.1 Summary Long-term care is a major driver of Medicaid total expenditure and therefore requires particular planning attention. The Commonwealth’s CON program has been effective in controlling total nursing facility capacity, thereby allowing nursing facilities to operate at high occupancy levels (89-92%). Demand projections for 2017 based on lagging utilization indicators estimate the capacity constraints will persist absent concerted interventions for inpatient utilization management.
Utilization management efforts, such as ‘rebalancing’ programs, aim to promote the transition from facility to home and community based care. Rebalancing efforts can achieve a dual purpose of alleviating inpatient facility capacity constraints while also reducing total expenditures by using more cost-effective sites of care. The Commonwealth’s rebalancing program “Kentucky Transitions” has reportedly enjoyed early effectiveness. Nursing patient days in 2012 even declined slightly by 1% compared to the prior years. However, the rate of institutionalization remained high as of 2011, suggesting continued need for efforts to curtail nursing home demand.
This data points toward opportunities to expand the home and community based services for the elderly. The Commonwealth’s scope of services of waiver programs and total expenditure per participant lag behind other states, e.g., Ohio and Florida. Home Health is an important pillar in developing an effective community based plan to care for the elderly. Expanded use of home health services might require expanding the number of agencies to fill unmet demand in several counties. Given the projected 14% increase in total home health demand through 2017, these service providers may face workforce shortages in the short and mid-term.
9.2 Long-Term Care Budget and Utilization Nursing care accounts for a significant share of total Medicaid budget. In Fiscal Year 2011, the Commonwealth’s nursing facility budget was the second-largest item on the Medicaid budget, at 14% of total budget179 (Figure 43). Developing a sustainable, cost-efficient model of care for the elderly is hence of foremost importance. The model of care should thereby consider that the appropriate level of service is provided, excessive use and costs are avoided, and existing resources and facilities are optimally used.
179 Figures based on Department of Medicaid Services (DMS) routine reporting to legislature for SFY11, provided by KHBE team member

The Commonwealth of Kentucky Health Care Facility Capacity Report, 2013 72
Figure 43: Commonwealth Medicaid Budget for Select Institutional Services (SFY11) 180 181
Note: The Commonwealth’s Medicaid budget in 2011 was $5.9B. The chart represents select institutional services only.
Two principal mechanisms can be used to manage total costs: (i) Limit nursing facility bed supply, and (ii) Develop Home and Community Based Services (HCBS) to transition care to the community. The Commonwealth already utilizes both mechanisms today: On the one hand, supply is tightly monitored and managed through the nursing facility CON program. On the other hand, the Kentucky Transitions Demonstration Program promotes transfer of intramural to extramural care (i.e. transition to home and community based care).
Some states have taken more aggressive approaches in an attempt to contain expenditures on nursing facility services. For example, Ohio and Florida have enacted moratoriums on new nursing care facilities.
Case example Ohio:
In 1993, Ohio recognized the need to limit Medicaid nursing facility expenditures and enacted a moratorium on nursing facilities on July 1, 1993.182 The moratorium was not introduced in isolation but rather as part of an integrated approach to managing nursing facility utilization. Accompanying measures included, among others, a pre-admission review process for nursing facility patients and the transition to a prospective payment system. Both initiatives directly help control the Medicaid budget.183 Under Ohio’s long-term care moratorium, long-term care providers are able to buy and sell the operating license to beds through private transactions within the same county. In addition, every four years a review board reevaluates shortages and surpluses on a county-by-county basis. Counties experiencing a capacity shortage can then purchase beds from counties that have
180 Ibid 181 Budget Inclusions: Acute Care budget includes rehab hospitals; Home Health data does not include waiver services; Hospice includes hospice and residential hospice; Comprehensive Rehabilitation data only include Rehab Distinct Parts 182 Ohio Department of Health, “Historical Highlights of the Ohio Certificate of Need Law” 183 (2000). Applebaum, R., Ohio’s long-term care system: trends and issues, Scripps Gerontology Center Publications. Accessed at: http://sc.lib.muohio.edu/bitstream/handle/2374.MIA/37/fulltext.pdf?sequence=1
The Commonwealth of Kentucky Health Care Facility Capacity Report, 2013 73
excess capacity. In addition, existing facilities wishing to expand may purchase up to 10 beds from a contiguous county during the review period184 185.
Case example Florida:
Similarly, Florida passed a moratorium on nursing facilities in 2001 in order to control the Medicaid budget while more community based programs were being developed to meet the health requirements of the elderly population. Florida’s statute 408.0435 states that, “the continued growth in the Medicaid budget for nursing home care has constrained the ability of the state to meet the health requirements of its elderly residents through the use of less restrictive and less institutional methods of long-term care.” Therefore, the moratorium’s purpose is to “limit the increase in Medicaid nursing home expenditures in order to provide funds to invest in long-term care that is community based and provides supportive services in a manner that is both more cost-effective and more in keeping with the wishes of the elderly residents of this state”.186 187 Table 12 provides an overview of both states’ pertinent provisions.
184 Telephone interview. Representative from Ohio Department of Health, July 8, 2013 185 Ohio Revised Code, Chapter 3702.59. Accessed at: http://codes.ohio.gov/orc/3702.59 186 The Florida Senate, 2011 Florida Statutes. Accessed at: http://www.flsenate.gov/laws/statutes/2011/408.0435 187 Florida Agency for Healthcare Administration . Certificate of Need Program Overview. Accessed at: http://ahca.myflorida.com/mchq/con_fa/index.shtml
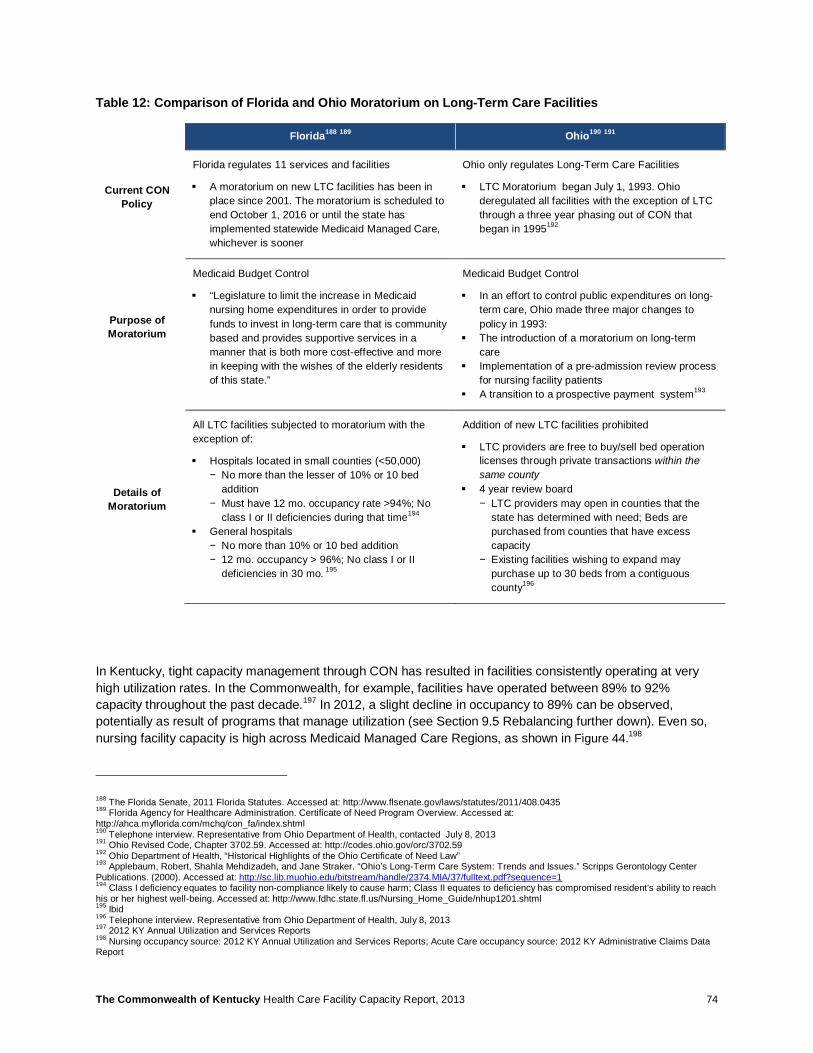
The Commonwealth of Kentucky Health Care Facility Capacity Report, 2013 74
Table 12: Comparison of Florida and Ohio Moratorium on Long-Term Care Facilities
Florida188 189 Ohio190 191
Current CON Policy
Florida regulates 11 services and facilities
§ A moratorium on new LTC facilities has been in place since 2001. The moratorium is scheduled to end October 1, 2016 or until the state has implemented statewide Medicaid Managed Care, whichever is sooner
Ohio only regulates Long-Term Care Facilities
§ LTC Moratorium began July 1, 1993. Ohio deregulated all facilities with the exception of LTC through a three year phasing out of CON that began in 1995192
Purpose of Moratorium
Medicaid Budget Control
§ “Legislature to limit the increase in Medicaid nursing home expenditures in order to provide funds to invest in long-term care that is community based and provides supportive services in a manner that is both more cost-effective and more in keeping with the wishes of the elderly residents of this state.”
Medicaid Budget Control
§ In an effort to control public expenditures on long-term care, Ohio made three major changes to policy in 1993:
§ The introduction of a moratorium on long-term care
§ Implementation of a pre-admission review process for nursing facility patients
§ A transition to a prospective payment system193
Details of Moratorium
All LTC facilities subjected to moratorium with the exception of:
§ Hospitals located in small counties (<50,000) − No more than the lesser of 10% or 10 bed
addition − Must have 12 mo. occupancy rate >94%; No
class I or II deficiencies during that time194 § General hospitals
− No more than 10% or 10 bed addition − 12 mo. occupancy > 96%; No class I or II
deficiencies in 30 mo. 195
Addition of new LTC facilities prohibited
§ LTC providers are free to buy/sell bed operation licenses through private transactions within the same county
§ 4 year review board − LTC providers may open in counties that the
state has determined with need; Beds are purchased from counties that have excess capacity
− Existing facilities wishing to expand may purchase up to 30 beds from a contiguous county196
In Kentucky, tight capacity management through CON has resulted in facilities consistently operating at very high utilization rates. In the Commonwealth, for example, facilities have operated between 89% to 92% capacity throughout the past decade.197 In 2012, a slight decline in occupancy to 89% can be observed, potentially as result of programs that manage utilization (see Section 9.5 Rebalancing further down). Even so, nursing facility capacity is high across Medicaid Managed Care Regions, as shown in Figure 44.198
188 The Florida Senate, 2011 Florida Statutes. Accessed at: http://www.flsenate.gov/laws/statutes/2011/408.0435 189 Florida Agency for Healthcare Administration. Certificate of Need Program Overview. Accessed at: http://ahca.myflorida.com/mchq/con_fa/index.shtml 190 Telephone interview. Representative from Ohio Department of Health, contacted July 8, 2013 191 Ohio Revised Code, Chapter 3702.59. Accessed at: http://codes.ohio.gov/orc/3702.59 192 Ohio Department of Health, “Historical Highlights of the Ohio Certificate of Need Law” 193 Applebaum, Robert, Shahla Mehdizadeh, and Jane Straker. “Ohio’s Long-Term Care System: Trends and Issues.” Scripps Gerontology Center Publications. (2000). Accessed at: http://sc.lib.muohio.edu/bitstream/handle/2374.MIA/37/fulltext.pdf?sequence=1 194 Class I deficiency equates to facility non-compliance likely to cause harm; Class II equates to deficiency has compromised resident’s ability to reach his or her highest well-being. Accessed at: http://www.fdhc.state.fl.us/Nursing_Home_Guide/nhup1201.shtml 195 Ibid 196 Telephone interview. Representative from Ohio Department of Health, July 8, 2013 197 2012 KY Annual Utilization and Services Reports 198 Nursing occupancy source: 2012 KY Annual Utilization and Services Reports; Acute Care occupancy source: 2012 KY Administrative Claims Data Report
The Commonwealth of Kentucky Health Care Facility Capacity Report, 2013 75
Figure 44: Commonwealth’s 2012 Occupancy Rates for Nursing and Acute Care by MMCR
Maintaining consistently high occupancy levels is desirable in order to increase asset utilization. However, high capacity can also negatively constrain access to services and leave unmet demand in the community, i.e. some patients may not be admitted to facilities due to the lack of available beds. Capacity constraints in long-term care can also create a bottleneck that will hinder timely discharge of patients requiring nursing care from acute care facilities. Given the higher cost structure of acute hospitals vs. nursing facilities, the inability to discharge patients in a timely manner from acute care may add to total health care expenditure.
It is important to note this study projects future demand using 2012 baseline utilization as input. If patients are not admitted to nursing facilities in the first place because of capacity constraints, then baseline utilization data may underestimate actual demand for nursing services (unmet demand is not captured). Future projections could correspondingly under-represent total demand. This consideration applies particularly to health services that operate at or close to capacity today.
9.3 Distribution of Services Nursing Facility distribution across the Commonwealth generally follows the population distribution, with few Counties lacking a nursing facility. Figure 45 shows the distribution of nursing facilities across the state and the level of occupancy of each facility (color of bubble). High occupancy seems to correlate with size of population, with the highest occupancy found in metropolitan areas.199
199 2011 KY Annual Long-Term Care Services Survey Data Report
85%90% 90%
93%90% 93% 92% 90%
40%37%
49%52%
41%
54%
47%
57%
1 2 3 4 5 6 7 8
Nursing Facilities Acute Care
MMCR
2012
Occ
upan
cy
ThresholdOccupancy

The Commonwealth of Kentucky Health Care Facility Capacity Report, 2013 76
Figure 45: Distribution of Nursing Facilities and Occupancy Compared to County Population
While in aggregate there may be sufficient nursing facility bed capacity within each service area, on a case-by-case basis a nursing bed may not be rapidly available when needed. In such cases, patients may likely consider obtaining nursing care outside of their service area. The number of patients that leave the state altogether is not known. As mentioned before, severe capacity constraints can also cause bottlenecks in discharging patients from acute facilities. Figure 46 illustrates occupancy level of nursing facilities in each county and volume of patients from each county that receive care outside of their service area.200 201 Louisville and Lexington metro areas stand out as having high volumes of outmigration for long-term care.
Note: Occupancy for each county is calculated as the potential patient days for each county’s service area relative to the effective patient days provided in 2012; A county’s service area includes its contiguous counties The free nursing bed calculation methodology used by the Cabinet for Health and Family Services may result in double counting beds (In this methodology, a county’s free bed is also attributed to each of the surrounding 6-8 counties).
200 Ibid 201 Analysis based on 2012 LTC Need evaluation provided by the Cabinet of Health and Family Services
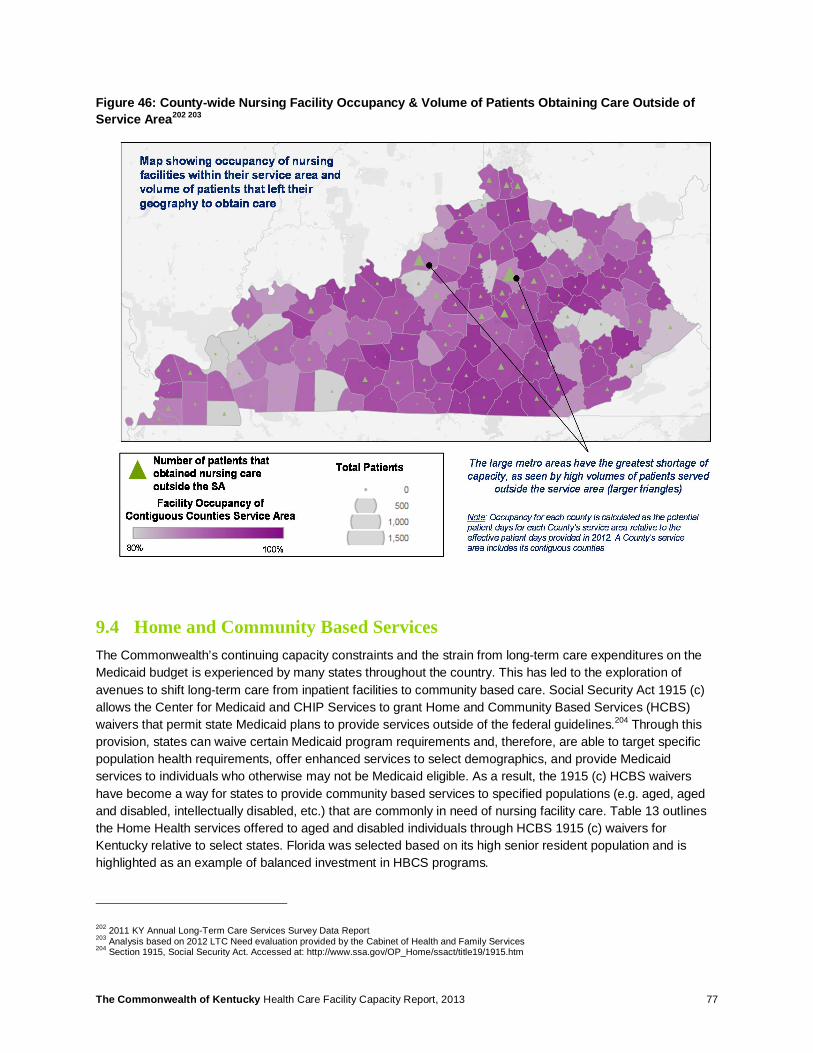
The Commonwealth of Kentucky Health Care Facility Capacity Report, 2013 77
Figure 46: County-wide Nursing Facility Occupancy & Volume of Patients Obtaining Care Outside of Service Area202 203
9.4 Home and Community Based Services The Commonwealth’s continuing capacity constraints and the strain from long-term care expenditures on the Medicaid budget is experienced by many states throughout the country. This has led to the exploration of avenues to shift long-term care from inpatient facilities to community based care. Social Security Act 1915 (c) allows the Center for Medicaid and CHIP Services to grant Home and Community Based Services (HCBS) waivers that permit state Medicaid plans to provide services outside of the federal guidelines.204 Through this provision, states can waive certain Medicaid program requirements and, therefore, are able to target specific population health requirements, offer enhanced services to select demographics, and provide Medicaid services to individuals who otherwise may not be Medicaid eligible. As a result, the 1915 (c) HCBS waivers have become a way for states to provide community based services to specified populations (e.g. aged, aged and disabled, intellectually disabled, etc.) that are commonly in need of nursing facility care. Table 13 outlines the Home Health services offered to aged and disabled individuals through HCBS 1915 (c) waivers for Kentucky relative to select states. Florida was selected based on its high senior resident population and is highlighted as an example of balanced investment in HBCS programs.
202 2011 KY Annual Long-Term Care Services Survey Data Report 203 Analysis based on 2012 LTC Need evaluation provided by the Cabinet of Health and Family Services 204 Section 1915, Social Security Act. Accessed at: http://www.ssa.gov/OP_Home/ssact/title19/1915.htm

The Commonwealth of Kentucky Health Care Facility Capacity Report, 2013 78
Table 13: State Comparison of Home Health Services Offered Under 1915 (c) Waiver Programs205 206
Home Health Services KY FL OH IN
Adult Day Health Care ü ü ü ü Assessment/Reassessment ü ✗ ✗ ✗
Assisted Living ✗ ü ü ü Attendant Care ü ü ü ü
Case Management ü ✗ ✗ ü Chore ✗ ü ü ✗
Emergency Response Services ✗ ü ü ü Financial Management Services ü ü ✗ ✗
Home Adaptations ü ü ü ü Home Support Services (non-medical) ü ü ü ✗
Home Delivered Meals ✗ ü ü ü Home Medical Equipment & Supplies ✗ ü ü ü
Homemaker ü ü ü ü Nutritional Consultation & Support ✗ ✗ ✗ ü
Occupational Therapy ü ü ✗ ✗ Personal Care ü ü ü ✗ Pest Control ✗ ü ✗ ü
Physical Therapy ü ü ✗ ✗ Respite Care Services ü ü ü ü
Speech Therapy ü ✗ ✗ ✗ Transportation ✗ ü ü ü
Checkmarks indicate community based services are provided under the waiver program207. The red shadings call out areas in which the Commonwealth could potentially supplement its offering to match other states. The separator distinguishes states with greater level of community based services vs. other states whose programs may be less broad based on review of published waiver programs.
9.5 Rebalancing In addition to waiver programs, the Center for Medicaid and Medicare Services (CMS) has introduced grants to assist states in transitioning nursing facility patients to community based services. The Money Follows the Person (MFP) grant is a federal initiative that began in 2007, aiming to reduce state utilization of institutional care and expand community care options for the elderly and individuals with disabilities by providing matched federal funds to promote community initiatives208. Since 2008, the Commonwealth’s nursing care rebalancing program, Kentucky Transitions, has been in place to facilitate the rebalancing of individuals from institutions into the community.
205 Medicaid.gov. Accessed at: http://www.medicaid.gov/Medicaid-CHIP-Program-Information/By-Topics/Waivers/Waivers.html 206 Specific names of services may differ, however the service provided is comparable (i.e “Personal care” vs “Personal Care Aide”); Service descriptions were standardized for the purpose of grouping. 207 Note that certain home health services may be provided as part of Medicaid or other programs, and not through waivers. Therefore, the population of a given state may still have access to a service marked as X in the table above. 208 Medicaid.gov. Accessed at: http://medicaid.gov/Medicaid-CHIP-Program-Information/By-Topics/Long-Term-Services-and-Support/Balancing/Money-Follows-the-Person.html
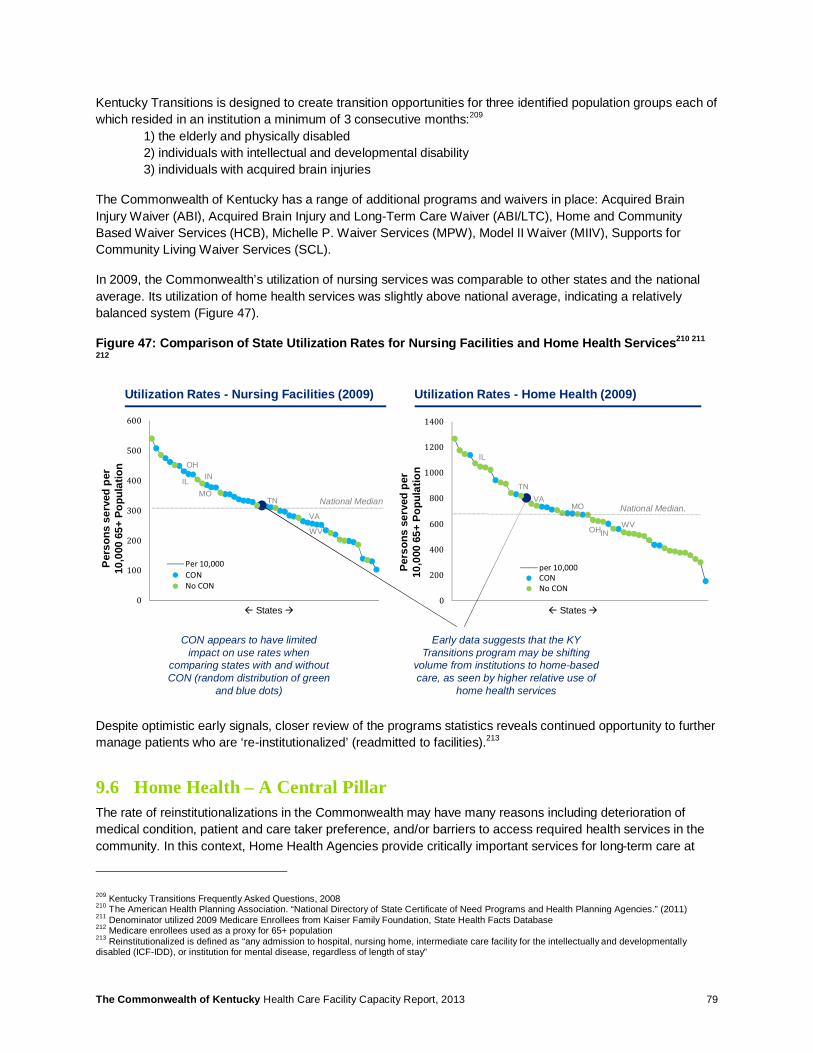
The Commonwealth of Kentucky Health Care Facility Capacity Report, 2013 79
Kentucky Transitions is designed to create transition opportunities for three identified population groups each of which resided in an institution a minimum of 3 consecutive months:209 1) the elderly and physically disabled 2) individuals with intellectual and developmental disability 3) individuals with acquired brain injuries
The Commonwealth of Kentucky has a range of additional programs and waivers in place: Acquired Brain Injury Waiver (ABI), Acquired Brain Injury and Long-Term Care Waiver (ABI/LTC), Home and Community Based Waiver Services (HCB), Michelle P. Waiver Services (MPW), Model II Waiver (MIIV), Supports for Community Living Waiver Services (SCL).
In 2009, the Commonwealth’s utilization of nursing services was comparable to other states and the national average. Its utilization of home health services was slightly above national average, indicating a relatively balanced system (Figure 47).
Figure 47: Comparison of State Utilization Rates for Nursing Facilities and Home Health Services210 211
212
Despite optimistic early signals, closer review of the programs statistics reveals continued opportunity to further manage patients who are ‘re-institutionalized’ (readmitted to facilities).213
9.6 Home Health – A Central Pillar The rate of reinstitutionalizations in the Commonwealth may have many reasons including deterioration of medical condition, patient and care taker preference, and/or barriers to access required health services in the community. In this context, Home Health Agencies provide critically important services for long-term care at
209 Kentucky Transitions Frequently Asked Questions, 2008 210 The American Health Planning Association. “National Directory of State Certificate of Need Programs and Health Planning Agencies.” (2011) 211 Denominator utilized 2009 Medicare Enrollees from Kaiser Family Foundation, State Health Facts Database 212 Medicare enrollees used as a proxy for 65+ population 213 Reinstitutionalized is defined as “any admission to hospital, nursing home, intermediate care facility for the intellectually and developmentally disabled (ICF-IDD), or institution for mental disease, regardless of length of stay”
0
100
200
300
400
500
600
Per 10,000CONNo CON
0
200
400
600
800
1000
1200
1400
per 10,000CONNo CON
Early data suggests that the KY Transitions program may be shifting
volume from institutions to home-based care, as seen by higher relative use of
home health services
Utilization Rates - Nursing Facilities (2009) Utilization Rates - Home Health (2009)
National MedianNational Median.
ß States à ß States à
Pers
ons
serv
ed p
er
10,0
00 6
5+ P
opul
atio
n
IL
TNVA
OHINWV
MO
OH
IL IN
MOTN
VA
WV
CON appears to have limited impact on use rates when
comparing states with and without CON (random distribution of green
and blue dots)
Pers
ons
serv
ed p
er
10,0
00 6
5+ P
opul
atio
n

The Commonwealth of Kentucky Health Care Facility Capacity Report, 2013 80
home. Figure 48 depicts the distribution of Home Health Agencies across the Commonwealth along with the relative utilization rate in each county (darker shading is higher use). Interestingly, counties that do not have a Home Health Agency based within the county itself appear to have lower utilization. This could be an indicator of potential unmet need. Conversely, Counties in vicinity of a large Home Health Agency appear to use home health services more readily.
Figure 49 illustrates the findings of the Cabinet’s 2013 Home Health Need report that identifies counties in which there is a shortage of home health services. The Cabinet’s analysis provides recommendations for counties in which existing home health agencies should expand into. In addition, nine counties were identified that could benefit from the establishment of a new agency (Boyd, Christian, Daviess, Fayette, Greenup, McCracken, Oldham, Pike, Warren). However, there appear to be delays in approving new HHA: Only 2 HHA applications were approved in 2012, while several were deferred or disapproved, are pending decisions, or have been withdrawn again. In the nine counties identified as having a need to establish a new agency, only two new agencies were approved since 2008. Withdrawals are said to result not from an inconsistency with the State Health Plan, but because applicants anticipate their application being declined in a public hearing. It is also noteworthy that several contiguous states do not maintain CON programs for Home Health Agencies, such as Indiana, Illinois, Ohio, Missouri, Virginia (Figure 32).
Figure 48: Relative Use of Home Health Services by County and Location of Home Health Agency Headquarters214 215 216 217
214 2012 KY Annual Home Health Services Survey Data Report 215 Data includes all Traditional, EPSDT, Model II Waiver, Traditional & PDN, EPSDT & PDN patients 216 Utilization was calculated using 2012 county-level data 217 Map illustrates only a home health agency's primary office zip codes; size of the circles represent total patient case count for entire agency
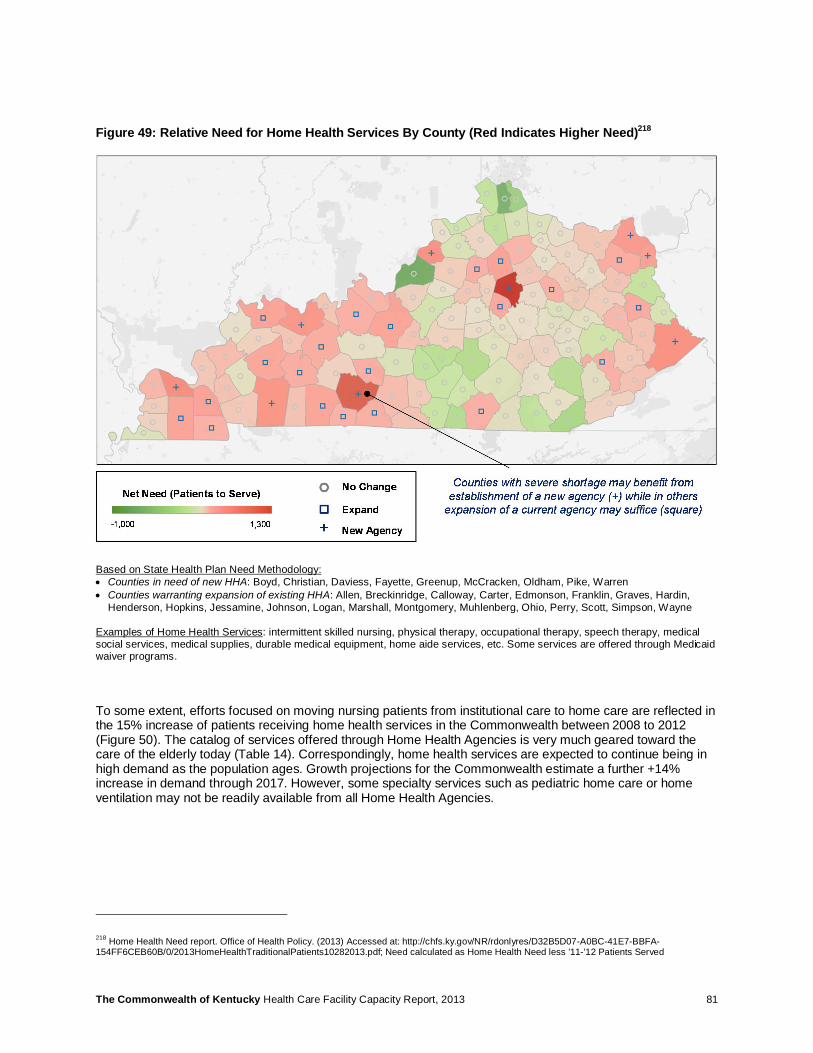
The Commonwealth of Kentucky Health Care Facility Capacity Report, 2013 81
Figure 49: Relative Need for Home Health Services By County (Red Indicates Higher Need)218
Based on State Health Plan Need Methodology: • Counties in need of new HHA: Boyd, Christian, Daviess, Fayette, Greenup, McCracken, Oldham, Pike, Warren • Counties warranting expansion of existing HHA: Allen, Breckinridge, Calloway, Carter, Edmonson, Franklin, Graves, Hardin,
Henderson, Hopkins, Jessamine, Johnson, Logan, Marshall, Montgomery, Muhlenberg, Ohio, Perry, Scott, Simpson, Wayne
Examples of Home Health Services: intermittent skilled nursing, physical therapy, occupational therapy, speech therapy, medical social services, medical supplies, durable medical equipment, home aide services, etc. Some services are offered through Medicaid waiver programs.
To some extent, efforts focused on moving nursing patients from institutional care to home care are reflected in the 15% increase of patients receiving home health services in the Commonwealth between 2008 to 2012 (Figure 50). The catalog of services offered through Home Health Agencies is very much geared toward the care of the elderly today (Table 14). Correspondingly, home health services are expected to continue being in high demand as the population ages. Growth projections for the Commonwealth estimate a further +14% increase in demand through 2017. However, some specialty services such as pediatric home care or home ventilation may not be readily available from all Home Health Agencies.
218 Home Health Need report. Office of Health Policy. (2013) Accessed at: http://chfs.ky.gov/NR/rdonlyres/D32B5D07-A0BC-41E7-BBFA-154FF6CEB60B/0/2013HomeHealthTraditionalPatients10282013.pdf; Need calculated as Home Health Need less ’11-’12 Patients Served
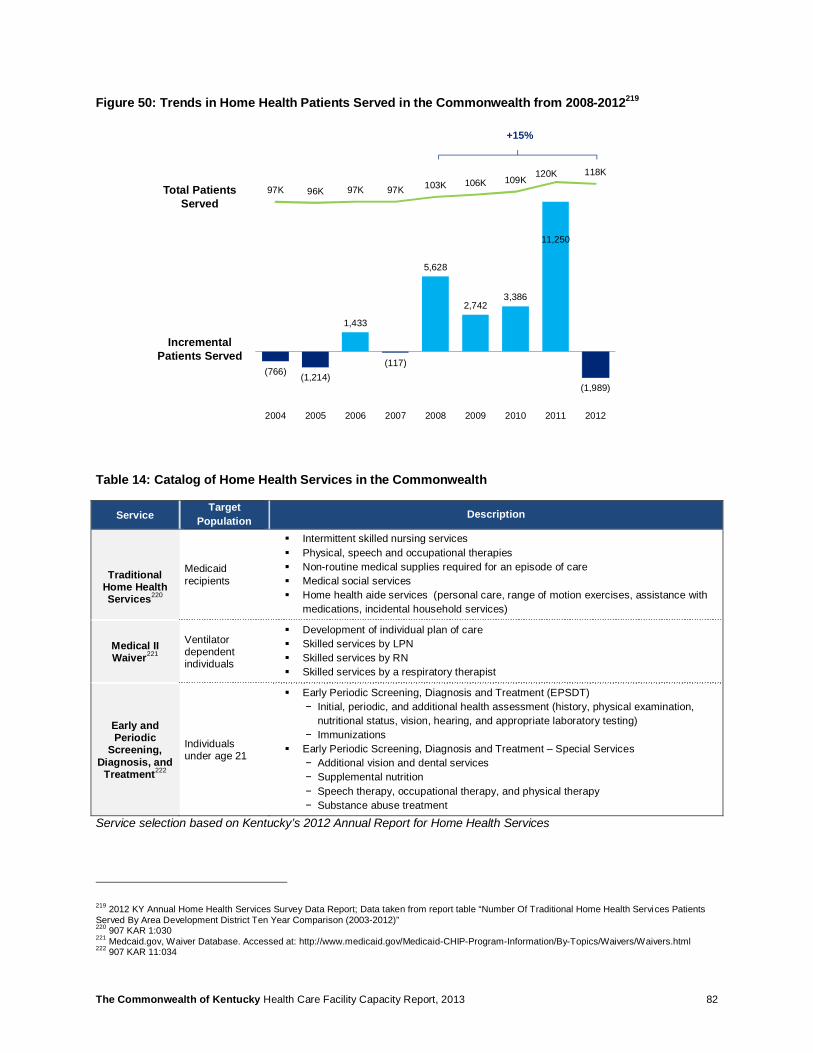
The Commonwealth of Kentucky Health Care Facility Capacity Report, 2013 82
Figure 50: Trends in Home Health Patients Served in the Commonwealth from 2008-2012219
Table 14: Catalog of Home Health Services in the Commonwealth
Service Target
Population Description
Traditional Home Health Services220
Medicaid recipients
§ Intermittent skilled nursing services § Physical, speech and occupational therapies § Non-routine medical supplies required for an episode of care § Medical social services § Home health aide services (personal care, range of motion exercises, assistance with
medications, incidental household services)
Medical II Waiver221
Ventilator dependent individuals
§ Development of individual plan of care § Skilled services by LPN § Skilled services by RN § Skilled services by a respiratory therapist
Early and Periodic
Screening, Diagnosis, and
Treatment222
Individuals under age 21
§ Early Periodic Screening, Diagnosis and Treatment (EPSDT) − Initial, periodic, and additional health assessment (history, physical examination,
nutritional status, vision, hearing, and appropriate laboratory testing) − Immunizations
§ Early Periodic Screening, Diagnosis and Treatment – Special Services − Additional vision and dental services − Supplemental nutrition − Speech therapy, occupational therapy, and physical therapy − Substance abuse treatment
Service selection based on Kentucky’s 2012 Annual Report for Home Health Services
219 2012 KY Annual Home Health Services Survey Data Report; Data taken from report table “Number Of Traditional Home Health Services Patients Served By Area Development District Ten Year Comparison (2003-2012)” 220 907 KAR 1:030 221 Medcaid.gov, Waiver Database. Accessed at: http://www.medicaid.gov/Medicaid-CHIP-Program-Information/By-Topics/Waivers/Waivers.html 222 907 KAR 11:034
(766) (1,214)
1,433
(117)
5,628
2,742 3,386
11,250
(1,989)
97K 96K 97K 97K 103K 106K 109K120K 118K
-140,000
-100,000
-60,000
-20,000
20,000
60,000
100,000
140,000
-4,000
0
4,000
8,000
12,000
2004 2005 2006 2007 2008 2009 2010 2011 2012
Incremental Patients Served
Total Patients Served
+15%
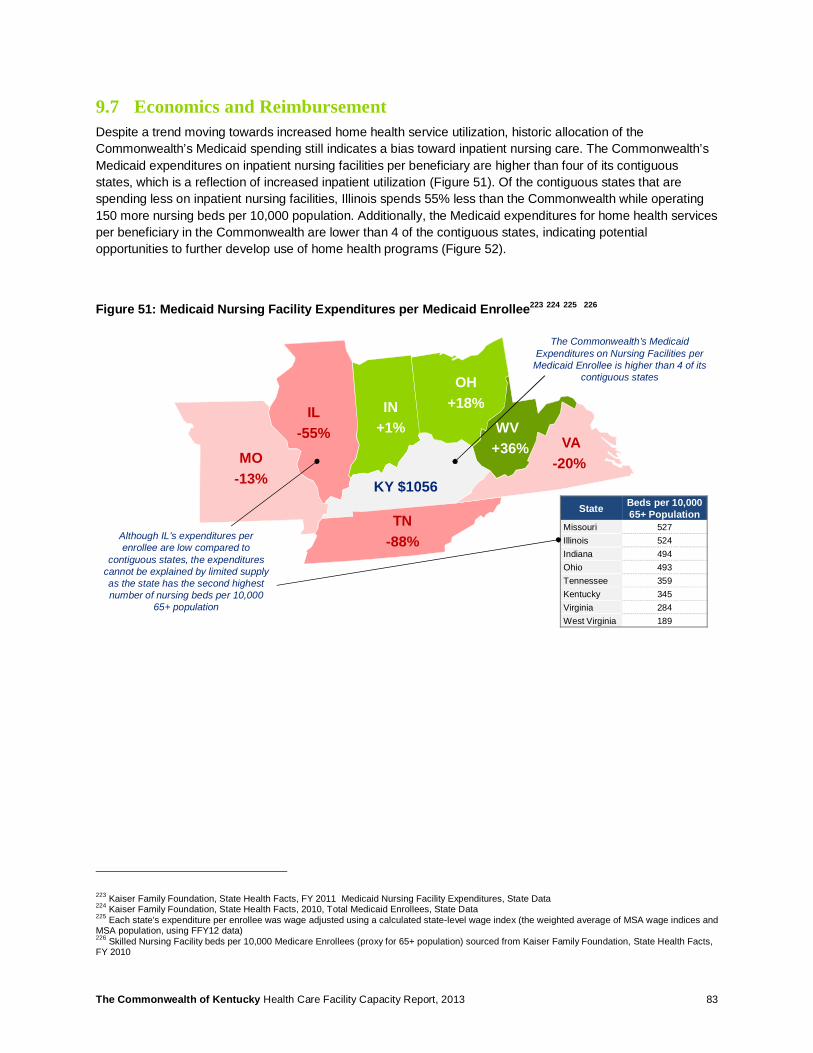
The Commonwealth of Kentucky Health Care Facility Capacity Report, 2013 83
9.7 Economics and Reimbursement Despite a trend moving towards increased home health service utilization, historic allocation of the Commonwealth’s Medicaid spending still indicates a bias toward inpatient nursing care. The Commonwealth’s Medicaid expenditures on inpatient nursing facilities per beneficiary are higher than four of its contiguous states, which is a reflection of increased inpatient utilization (Figure 51). Of the contiguous states that are spending less on inpatient nursing facilities, Illinois spends 55% less than the Commonwealth while operating 150 more nursing beds per 10,000 population. Additionally, the Medicaid expenditures for home health services per beneficiary in the Commonwealth are lower than 4 of the contiguous states, indicating potential opportunities to further develop use of home health programs (Figure 52).
Figure 51: Medicaid Nursing Facility Expenditures per Medicaid Enrollee223 224 225 226
223 Kaiser Family Foundation, State Health Facts, FY 2011 Medicaid Nursing Facility Expenditures, State Data 224 Kaiser Family Foundation, State Health Facts, 2010, Total Medicaid Enrollees, State Data 225 Each state’s expenditure per enrollee was wage adjusted using a calculated state-level wage index (the weighted average of MSA wage indices and MSA population, using FFY12 data) 226 Skilled Nursing Facility beds per 10,000 Medicare Enrollees (proxy for 65+ population) sourced from Kaiser Family Foundation, State Health Facts, FY 2010
IL-55%
IN+1%
KY $1056
MO-13%
OH+18%
TN -88%
VA-20%
WV+36%
The Commonwealth’s Medicaid Expenditures on Nursing Facilities per
Medicaid Enrollee is higher than 4 of its contiguous states
State Beds per 10,000 65+ Population
Missouri 527Illinois 524Indiana 494Ohio 493Tennessee 359Kentucky 345Virginia 284West Virginia 189
Although IL’s expenditures per enrollee are low compared to
contiguous states, the expenditures cannot be explained by limited supply as the state has the second highest number of nursing beds per 10,000
65+ population
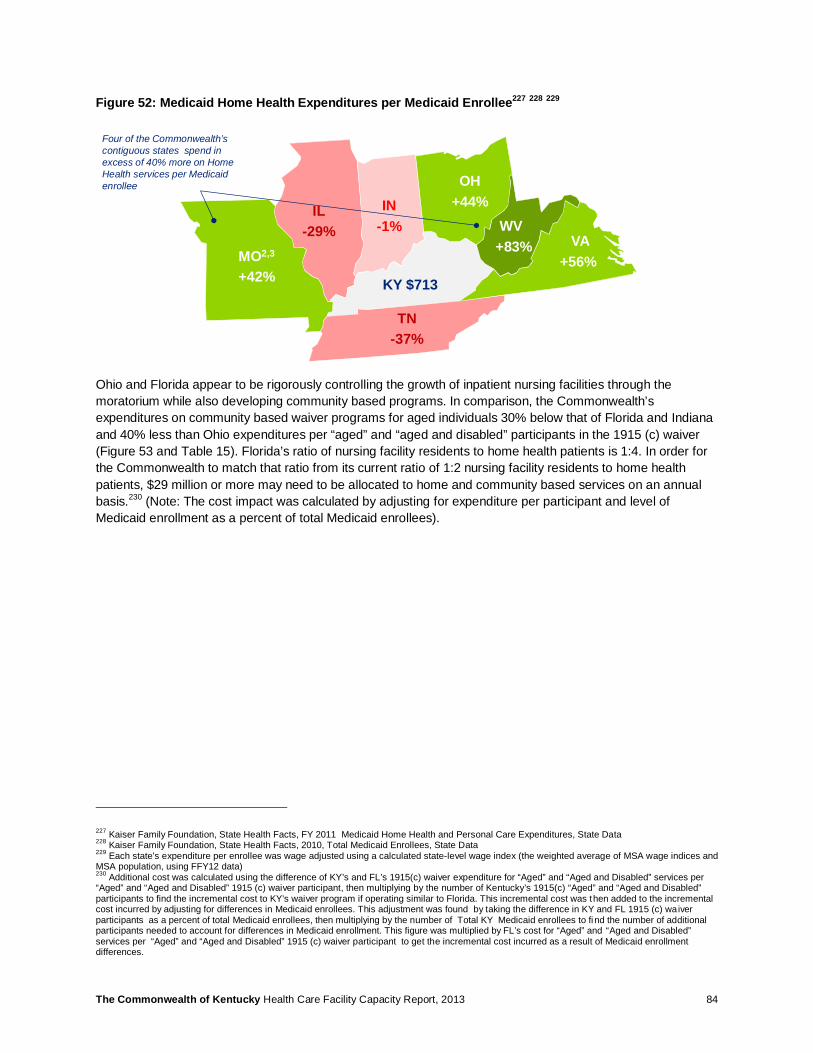
The Commonwealth of Kentucky Health Care Facility Capacity Report, 2013 84
Figure 52: Medicaid Home Health Expenditures per Medicaid Enrollee227 228 229
Ohio and Florida appear to be rigorously controlling the growth of inpatient nursing facilities through the moratorium while also developing community based programs. In comparison, the Commonwealth’s expenditures on community based waiver programs for aged individuals 30% below that of Florida and Indiana and 40% less than Ohio expenditures per “aged” and “aged and disabled” participants in the 1915 (c) waiver (Figure 53 and Table 15). Florida’s ratio of nursing facility residents to home health patients is 1:4. In order for the Commonwealth to match that ratio from its current ratio of 1:2 nursing facility residents to home health patients, $29 million or more may need to be allocated to home and community based services on an annual basis.230 (Note: The cost impact was calculated by adjusting for expenditure per participant and level of Medicaid enrollment as a percent of total Medicaid enrollees).
227 Kaiser Family Foundation, State Health Facts, FY 2011 Medicaid Home Health and Personal Care Expenditures, State Data 228 Kaiser Family Foundation, State Health Facts, 2010, Total Medicaid Enrollees, State Data 229 Each state’s expenditure per enrollee was wage adjusted using a calculated state-level wage index (the weighted average of MSA wage indices and MSA population, using FFY12 data) 230 Additional cost was calculated using the difference of KY’s and FL’s 1915(c) waiver expenditure for “Aged” and “Aged and Disabled” services per “Aged” and “Aged and Disabled” 1915 (c) waiver participant, then multiplying by the number of Kentucky’s 1915(c) “Aged” and “Aged and Disabled” participants to find the incremental cost to KY’s waiver program if operating similar to Florida. This incremental cost was then added to the incremental cost incurred by adjusting for differences in Medicaid enrollees. This adjustment was found by taking the difference in KY and FL 1915 (c) waiver participants as a percent of total Medicaid enrollees, then multiplying by the number of Total KY Medicaid enrollees to fi nd the number of additional participants needed to account for differences in Medicaid enrollment. This figure was multiplied by FL’s cost for “Aged” and “Aged and Disabled” services per “Aged” and “Aged and Disabled” 1915 (c) waiver participant to get the incremental cost incurred as a result of Medicaid enrollment differences.
IL-29%
IN-1%
KY $713
MO2,3
+42%
OH+44%
TN -37%
VA+56%
WV+83%
Four of the Commonwealth’s contiguous states spend in excess of 40% more on Home Health services per Medicaid enrollee

The Commonwealth of Kentucky Health Care Facility Capacity Report, 2013 85
Figure 53: Overview of Home Health Waiver Program Expenditures231 232
Table 15: Waiver Expenditures for Kentucky, Florida, Ohio, and Indiana
Home Health Services KY FL OH IN
Ratio of Nursing Facility Residents to Home Health Patients 1:2 1:4 1:1 1:2
Total Expenditures on Waiver Programs for “Aged“ and “Aged Disabled”233 ~$72M ~$309M ~$377M ~$85M
Waiver Expenditures for “Aged“ and “Aged Disabled” Individuals per Waiver Participant234 235 236 $6,069 $8,483 $10,326 $8,862
9.8 Next Steps for Consideration Nursing Facilities
Given the propensity for nursing facilities to drive total Medicaid budgets, capping capacity may remain a primary lever. However, the Commonwealth may further consider how to allocate dollars across inpatient and ambulatory services that provide assistance for the care for the elderly. More explicitly evaluating the care continuum across acute inpatient, long-term facility-based, and home and community based services can offer avenues to rebalance locus of care and alleviate capacity constraints in nursing facilities:
231 Kaiser Family Foundation, 2009 State Health Facts, 1915 (c) waiver expenditures, and waiver participants 232 2009 Medicaid beneficiary data. Accessed at: Medicaid.gov 233 1915 (c) Waiver Expenditure Data for “Aged” and “Aged and Disabled” from Kaiser Family Foundation, State Health Facts; data not wage adjusted 234 Ibid 235 Waiver expenditure data was multiplied from per thousand dollar amount to total dollar amount 236 1915 (c) Waiver Participant Data for “Aged” and “Aged and Disabled” from Kaiser Family Foundation, State Health Facts
$0
$5,000
$10,000
$15,000
Virginia Ohio Indiana Florida Illinois Tennessee Kentucky Missouri
Expenditure Per Participant
Key: Home Health Patients Nursing Facility Residents
Ratio:
Expenditures per Waiver ParticipantHighest Lowest
Florida achieves the highest ratio of patients cared for in a home setting relative to inpatient nursing care (4:1) through a balanced investment in 1915 (c) waiver programs
The Commonwealth of Kentucky Health Care Facility Capacity Report, 2013 86
• Explore whether additional community based programs could help further reduce re-institutionalization rates of Kentucky Transitions and waiver participants. Services could include, for example, chores support, emergency response services, home delivered meals, home medical equipment supplies, nutritional consultation, transportation assistance, etc.
• Evaluate the level of total health expenditure per waiver participant relative to the health requirements of the elderly and disabled population. Conduct more detailed benchmarking of health benefits and expenditure levels against other states with high elderly populations (e.g., Ohio, Florida). Combine program expansion with guidelines for eligibility criteria to facilitate appropriate use and prevent over-use of services.
• Commission a study to determine whether nursing facility capacity constraints, and other limitations in home and community based services, are delaying discharges of nursing patients from acute facilities. Longer acute hospital stays could have a negative impact on total healthcare expenditures.
• Consider incorporating long-term care in Medicaid Managed Care and providing financial incentives to health plans to expand home and community based services and public health programs. For example, shift from fee-for-service to capitated payments that cover the mix of institutional and home-based care. Arizona has succeeded in reversing the ratio of institutional care to community based care from 70/30 in the 1980s to nearly 30/70 today237. (Note: The risks of subjecting vulnerable populations to managed care programs need to be judiciously evaluated in considering this option).
• Explore opportunities to coordinate provision of care among dual eligible population, i.e. identify whether Medicare savings (e.g., avoided acute readmissions) could result from improved management of long-term services reimbursed through Medicaid.
Home Health
Acknowledging the importance of home health services in providing community based care for the aging and disabled, the Commonwealth may consider avenues to promote availability and encourage standardization of services:
• Encourage expansion of home health agencies into areas that have already been identified by the Cabinet as being underserved, or consider suspending / discontinuing the CON program for Home Health Agencies.
• Explore avenues to better match patients with the desirable tier of medical care, i.e. refine pre-approval criteria for admission, and define appropriate locus of care based on patients’ medical and other health requirements.
• Consider implementing economic incentives through higher reimbursement for home health and other community based services. Reimbursement will also help address workforce shortages by increasing attractiveness of the profession.
• Develop mechanisms to facilitate standardization of home health services. Elevating the level of care provided in the community can have a meaningful impact on reducing re-institutionalization rates
• Explore avenues to further deploy technology advances for home care (e.g., tele-health hub/spoke sites and remote monitoring).
9.9 Potential Challenges Nursing Facilities
The Commonwealth may want to consider the tradeoff between creating extra capacity in the short-term to serve unmet demand and developing sustainable programs to transition patients to community care, including programs to effectively preempt re-institutionalization of patients. Short-term measures could include
237 Source: Center for Healthcare Strategies, Medicaid-Funded Long-Term Care: Toward More Home- and Community Based Options
The Commonwealth of Kentucky Health Care Facility Capacity Report, 2013 87
repurposing excess acute care beds as nursing facility beds. This may alleviate pressing capacity constraints, but the cost structure for nursing facilities that reside within acute hospitals may be higher than free-standing nursing facilities, hence not providing a cost advantage relative to overall healthcare expenditure:
• Current utilization patterns for nursing facility services may not be reflective of true demand in the population (since existing facilities are capacity constrained, current volume served may not represent total demand, i.e. there may be unmet demand due to existing capacity constraints).
• Assuming there is unmet demand today, the effect of economic, policy, or health management programs may not be apparent (a bed freed by transitioning a patient to community care could be filled by a wait-listed patient). Expansion of Medicaid waiver programs may therefore initially result in incremental total cost rather than cost reduction, at least until a new equilibrium is established.
• Some rural counties may not lend themselves to developing the applicable infrastructure to care for elderly in the community. In such instances, waiver programs may require further customization beyond their general format.
Home Health
• Expansion of home health agencies might be slowed by a shortage in qualified health professionals. This workforce shortage could take several years to address, even after increasing attractiveness of the profession (i.e. delay until new graduates emerge from training programs). The mix of professionals will need to be examined, i.e. ratio of skilled nurses to home support services.
• The velocity at which care management programs take hold (i.e. nursing facility rebalancing, acute care average length of stay initiatives, etc.) may be difficult to predict. The shift to ambulatory care will directly impact the demand for home health services.
The Commonwealth of Kentucky Health Care Facility Capacity Report, 2013 88
10 Mental Health Services
10.1 Summary Inpatient psychiatry care is in high demand in the Commonwealth with utilization rates for inpatient services 50% higher than the national benchmark.238, 239 In aggregate, supply of inpatient psychiatry services currently addresses demand. However, inpatient psychiatry facilities are generally concentrated in a limited number of counties, which may create geographic barriers to access the appropriate level of care from specific locations within the state.
Access to services is further accentuated by workforce challenges. A recent workforce capacity study estimated that the Commonwealth has a shortage of 1,638 mental health providers across specific disciplines in 2012, and the state is recognized as a Health Professional Shortage Area (HPSA) for mental health services. 240 The shortage of mental health providers is estimated to be comparatively higher in rural areas, and there appears to be a correspondence between workforce shortage and high inpatient utilization in those geographies. This could be an indication that the ambulatory mental health care system may not be enough to effectively address the health requirements of the local population in these areas.
Community-based programs are critical instruments to transitioning patient care away from repeated acute episodes to stable chronic conditions that can be managed in an ambulatory setting. An established ambulatory behavioral health system can also prevent unnecessary admissions to facility-based care. Community-based behavioral health programs, however, face economic challenges. When benchmarking against contiguous states, the Commonwealth of Kentucky has lower commercial reimbursement allowances for both mental health facilities and for mental health professional services.
Aside from adult mental health care, the Commonwealth has long suffered a shortage of mental health care beds for children and adolescents. Managed care programs have reduced utilization in recent years, but given capacity constraints in the system, concerns have been voiced that medical need is not being appropriately met. The Cabinet has recognized the capacity issues for Psychiatric Residential Treatment Facilities (PRTF) and in 2011 approved 132 additional Level II beds. This additional capacity, when it comes online, will help repatriate children and adolescents who previously obtained care outside of the Commonwealth.
10.2 Utilization of Mental Health Services Relative to other states, the Commonwealth’s utilization of inpatient psychiatric care is about 50% higher than the national benchmark. This finding is documented by a 2008 survey by the Substance Abuse and Mental Health Services Administration (SAMHSA) which concluded that Kentucky has the 7th highest patient population of individuals with serious mental illnesses in the United States at 5.4% of population.241 Table 16 shows a comparison of use rates for inpatient psychiatry.242 In this study’s analysis of 2012 inpatient claims data, utilization rate of inpatient mental health care was 83 discharges per 10,000 patients. However, this figure may be understated as 3 of the state’s psychiatric hospitals received a waiver from reporting claims data that year.243
238 Use rate is based on 2012 KY Inpatient Administrative Claims Data Report 239 Benchmarks generated using the AHRQ’s Health Care Utilization Project (HCUP) 2010 data 240 Deloitte Consulting “The Commonwealth of Kentucky Workforce Capacity Report.” (2013). 241 SAMHSA. The National Survey on Drug Use and Health Report. (2012). Accessed on 7/30/13 at: http://www.samhsa.gov/data/2k12/NSDUH110/sr110-adult-mental-illness.htm 242 DRG: Diagnosis Related Groups; a coding system that supports prospective payment 243 The utilization rate from administrative claims data (83 per 10,000) is lower than that from 2012 KY Annual Hospital Utilization and Services Report (107 per 10,000), because three state psychiatric hospitals received a waiver from reporting in 2012

The Commonwealth of Kentucky Health Care Facility Capacity Report, 2013 89
Table 16: Utilization of Mental Health Diagnosis Related Groups (DRGs) per 10,000 Population
DRG # DRG Description KY Use Rate244
National Use Rate245 246
Ratio KY to National
56 Degenerative nervous system disorders w mcc 0.7 0.8 0.9x 57 Degenerative nervous system disorders w/o mcc 4.3 3.4 1.3x 80 Non-traumatic stupor & coma w mcc 0.1 0.1 1.0x 81 Non-traumatic stupor & coma w/o mcc 0.5 0.5 1.0x 875 O.R. procedure w principal diagnoses of mental illness 0.1 0.1 1.0x 880 Acute adjustment reaction & psychosocial dysfunction 1.9 1.5 1.3x 881 Depressive neuroses 10.6 4.4 2.4x 882 Neuroses except depressive 2.8 1.6 1.8x 883 Disorders of personality & impulse control 1.1 0.5 2.2x 884 Organic disturbances & mental retardation 2.9 2.2 1.3x 885 Psychoses 55.5 38.0 1.5x 886 Behavioral & developmental disorders 2.8 0.9 3.1x 887 Other mental disorder diagnoses 0.2 0.1 2.0x
Average Discharges per 10,000 83 54 1.5x Kentucky appears to have a 50% higher utilization of inpatient psychiatric care than the national benchmark
In comparison to other inpatient discharges, DRG 885 – the code for Psychoses – ranks among the top 5 inpatient DRGs in three quarters of counties. As illustrated in Figure 54, Psychosis is even ranked as the number 1 or 2 diagnosis in approximately 25% of counties. 247
Figure 54: Rank of DRG 885 “Psychoses” Relative to Other Inpatient Discharges by County
244 2012 KY Inpatient Administrative Claims Data Report 245 The utilization rate from administrative claims data (83 per 10,000) is lower than that from 2012 KY Annual Hospital Utilization and Services Report (107 per 10,000) because three state psychiatric hospitals received a waiver from reporting in 2012 246 Nationwide Inpatient Sample (NIS), Healthcare Cost and Utilization Project (HCUP), Agency for Healthcare Research and Quality. On-line tool. Accessed June 6. 2013. http://hcupnet.ahrq.gov/ 247 2012 KY Inpatient Administrative Claims Data
1
2
3
4
5
BallardBoydJohnsonLaurel
LetcherMcCracken
PulaskiBourbon
ChristianHarrison
Jefferson
Lawrence
Magoffin
Mercer
Pendleton
Rockcastle
Wolfe
Allen
Bath
Breathitt
Campbell
CarterDaviess
FloydGallatin
GrantJessamine
LincolnMcCrearyMontgomeryRussell
ShelbyWayneElliottFleming
HenryLyon
MarionMcLeanOhio
Rowan
Trigg
Woodford
Graves
Hickman
Owen
Caldwell
Hart
Morgan
Calloway
Clay
BarrenUnion
LoganClintonCrittenden
FultonHopkinsRobertsonHenderson
Psychoses - Rank relative to other DRGs
Psychosis is the number 1 or 2 diagnosis in approx. 25% of counties
In approx. 50% of counties, psychosis is the
third, forth or fifth most frequent diagnosis
Psychosis features among the top 20
DRGs in all counties
Rank 1-5
Rank 5-10
Rank10-15
Rank 15-20
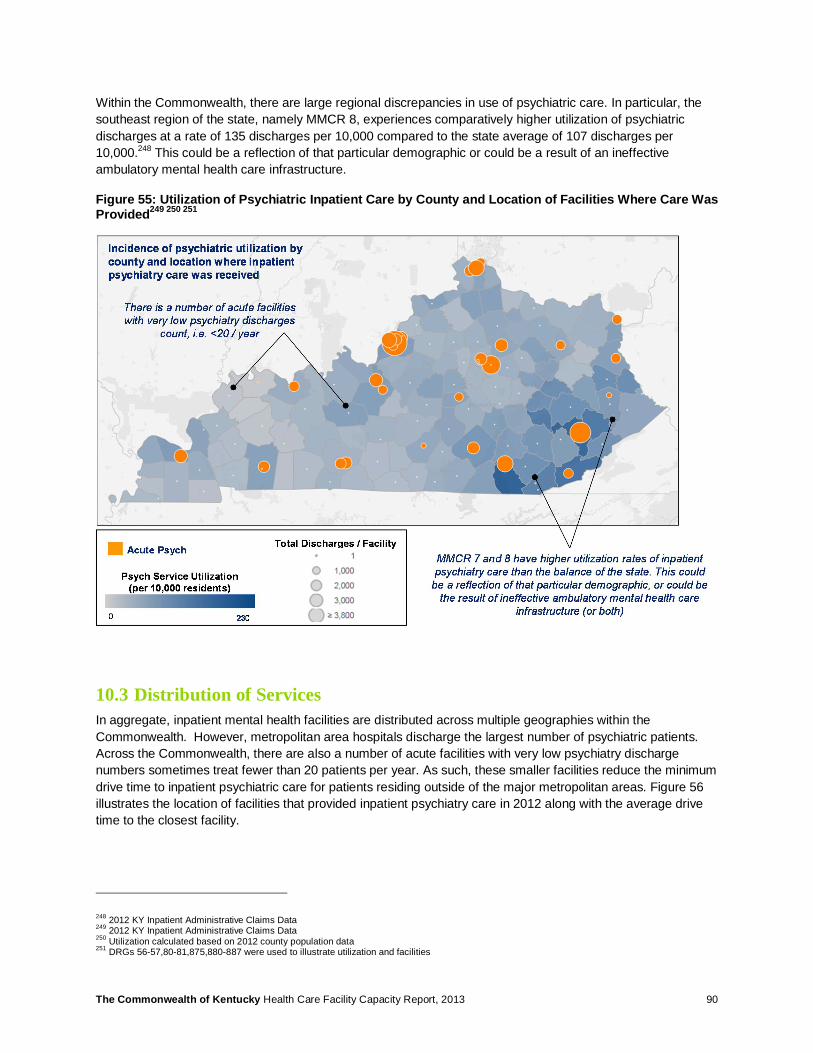
The Commonwealth of Kentucky Health Care Facility Capacity Report, 2013 90
Within the Commonwealth, there are large regional discrepancies in use of psychiatric care. In particular, the southeast region of the state, namely MMCR 8, experiences comparatively higher utilization of psychiatric discharges at a rate of 135 discharges per 10,000 compared to the state average of 107 discharges per 10,000.248 This could be a reflection of that particular demographic or could be a result of an ineffective ambulatory mental health care infrastructure.
Figure 55: Utilization of Psychiatric Inpatient Care by County and Location of Facilities Where Care Was Provided249 250 251
10.3 Distribution of Services In aggregate, inpatient mental health facilities are distributed across multiple geographies within the Commonwealth. However, metropolitan area hospitals discharge the largest number of psychiatric patients. Across the Commonwealth, there are also a number of acute facilities with very low psychiatry discharge numbers sometimes treat fewer than 20 patients per year. As such, these smaller facilities reduce the minimum drive time to inpatient psychiatric care for patients residing outside of the major metropolitan areas. Figure 56 illustrates the location of facilities that provided inpatient psychiatry care in 2012 along with the average drive time to the closest facility.
248 2012 KY Inpatient Administrative Claims Data 249 2012 KY Inpatient Administrative Claims Data 250 Utilization calculated based on 2012 county population data 251 DRGs 56-57,80-81,875,880-887 were used to illustrate utilization and facilities
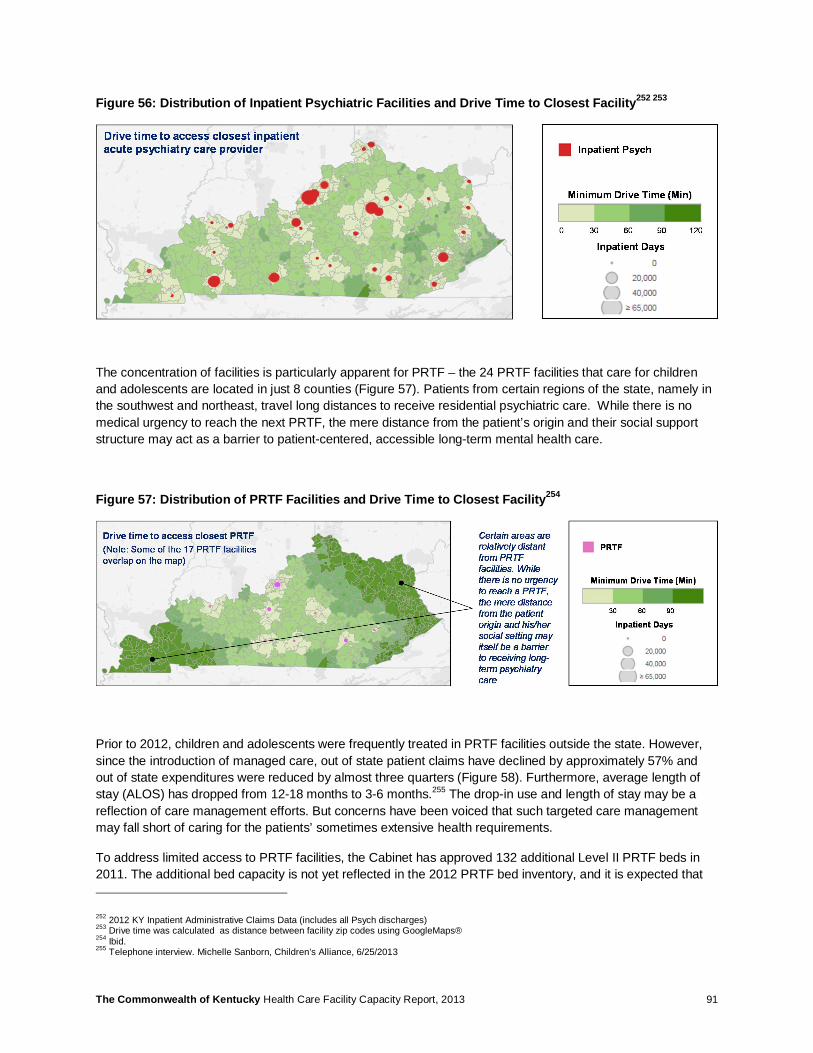
The Commonwealth of Kentucky Health Care Facility Capacity Report, 2013 91
Figure 56: Distribution of Inpatient Psychiatric Facilities and Drive Time to Closest Facility252 253
The concentration of facilities is particularly apparent for PRTF – the 24 PRTF facilities that care for children and adolescents are located in just 8 counties (Figure 57). Patients from certain regions of the state, namely in the southwest and northeast, travel long distances to receive residential psychiatric care. While there is no medical urgency to reach the next PRTF, the mere distance from the patient’s origin and their social support structure may act as a barrier to patient-centered, accessible long-term mental health care.
Figure 57: Distribution of PRTF Facilities and Drive Time to Closest Facility254
Prior to 2012, children and adolescents were frequently treated in PRTF facilities outside the state. However, since the introduction of managed care, out of state patient claims have declined by approximately 57% and out of state expenditures were reduced by almost three quarters (Figure 58). Furthermore, average length of stay (ALOS) has dropped from 12-18 months to 3-6 months.255 The drop-in use and length of stay may be a reflection of care management efforts. But concerns have been voiced that such targeted care management may fall short of caring for the patients’ sometimes extensive health requirements.
To address limited access to PRTF facilities, the Cabinet has approved 132 additional Level II PRTF beds in 2011. The additional bed capacity is not yet reflected in the 2012 PRTF bed inventory, and it is expected that
252 2012 KY Inpatient Administrative Claims Data (includes all Psych discharges) 253 Drive time was calculated as distance between facility zip codes using GoogleMaps® 254 Ibid. 255 Telephone interview. Michelle Sanborn, Children’s Alliance, 6/25/2013

The Commonwealth of Kentucky Health Care Facility Capacity Report, 2013 92
staffing and usage of the additional capacity will be delayed due to unfavorable economics of operating PRTF beds. Managed care organizations (MCOs) are reluctant to pay for Level II beds while also requiring a 1:1 nurse to bed ratio, which is considered unsustainable given current reimbursement levels. 256
Figure 58: Claims Volume and Expenses for Out-Of-State PRTF Care257
10.4 Economics Related to Mental Health Care Kentucky has the lowest commercial allowances for Mental Health Hospital services compared to contiguous states at $4,977 per discharge. As illustrated in Figure 59 below, facilities in states such as Illinois and Virginia are reimbursed on average between 45% and 50% more than facilities located in Kentucky.258
As such, it is believed that low rates of reimbursement may incentivize rapid – and potentially premature – discharges from inpatient psychiatry care. This may result in frequent re-hospitalizations (‘revolving door’), especially if the regional ambulatory mental health network is not structured to provide supportive post-discharge follow-up care.
Kentucky also has the lowest commercial cost allowance for mental health providers compared to contiguous states at $68 per average visit. As illustrated in Figure 60, mental health professionals in Illinois are reimbursed by commercial payers at almost double the rate in Kentucky. 259 (Note: These commercial cost allowances are based on benchmark data and reflect reimbursement per average visit. Actual reimbursement varies by type of intervention).
256 Ibid 257 Kentucky Medicaid Out of State EPSDT Placements Report (2010 – 2012) 258 MarketScan Benchmark Data. (2011). Medical Commercial Claims Data; CMS’ Table 4A.--Proposed Wage Index And Capital Geographic Adjustment Factor (GAF) For Urban Areas By CBSA And By State -FY 2012 259 MarketScan Benchmark Data, (2011) Medical Commercial Claims Data; CMS’ Table 4A. – Proposed Wage Index And Capital Geographic Adjustment Factor (GAF) For Urban Areas By CBSA And By State – FY 2012
3,523
2,713
1,508
$13M
$12M
$3M
2010 2011 2012
Claims VolumeMedicaid Expense
Year
Clai
ms
Volu
me
Medicaid Expense
Claims for patients treated outside the Commonwealth have been halved and total expenditures cut by three quarters

The Commonwealth of Kentucky Health Care Facility Capacity Report, 2013 93
Figure 59: Commercial Cost Allowance for Inpatient Psychiatry Care260 261
ACA’s provision for essential health benefits will require commercial payers to provide reimbursement for certain mental health services. This coverage expansion could particularly benefit Community Mental Health Centers, which have traditionally served primarily public payer patients. This could be the first step in developing an integrated ambulatory care system accessible to the broader population of patients with mental health conditions.
Figure 60: Commercial Cost Allowance for Mental Health Professional Services262 263
260 Actual Cost per Unit (surgery) Allowed, Wage Adjusted. Commercial reimbursement selected as proxy for overall reimbursement levels 261 Each state’s cost per unit was wage adjusted using a calculated state-level wage index (the weighted average of MSA wage indices and MSA population, using FFY12 data) 262 Actual Cost per Unit (surgery) Allowed, Wage Adjusted. Commercial reimbursement selected as proxy for overall reimbursement levels 263 Each state’s cost per unit was wage adjusted using a calculated state-level wage index (the weighted average of MSA wage indices and MSA population, using FFY12 data)
IL2,3
+50%
IN2,3
+5%
KY $4,977
MO2,3
+6%
OH2,3
+26%
TN2,3
+19%
VA2,3
+45%
WV2,3
+16%
Kentucky has the lowest commercial cost allowance for Mental Health Hospital Inpatient Services compared to the contiguous states.
IL+98%
IN+5%
KY $68
MO+15%
OH+11%
TN +8%
VA+16%
WV+45%
Kentucky has the lowest commercial cost allowance for professional Mental Health Hospital Inpatient Services compared to the contiguous states

The Commonwealth of Kentucky Health Care Facility Capacity Report, 2013 94
10.5 Behavioral Health Workforce Kentucky is recognized as a Health Professional Shortage Area (HPSA) with 61 of Kentucky’s 120 counties contributing to a total shortage of 154 psychiatrists in 2013 – an issue that is likely perpetuated by the low levels of reimbursement for mental health facilities and providers.264 A recent workforce study for the Commonwealth estimated the shortage of mental health providers (MHP) across specific disciplines to be 1,638 FTEs (19% of supply).265
While benchmarks are not widely reported for many of these groups, on aggregate Kentucky appears to have a higher ratio of MHPs per patient population at 194 per 100,000 versus 182 per 100,000, as reported in a benchmark study published in Clinical Psychology Review.266 However, as illustrated in Figure 61, Kentucky is experiencing shortages in select counties. More specifically, over 80% of the counties in Kentucky have a workforce supply gap for MHPs with 10% of counties needing at least 25 FTEs largely located in rural regions of the Commonwealth.267
Figure 61: Rural Kentucky Mental Health Professionals Need (2012)268
Table 17: Supply of various types of mental health providers within Kentucky269
Mental Health Provider (MHP) Types270 Current Supply Themes
Psychiatrists 462 • Overall need for MHPs is 1,638 FTEs (excluding surpluses) or 19% of
supply to meet current Commonwealth demand • Over 80% of the counties in Kentucky have a workforce supply gap for
MHPs with 10% of counties needing at least 25 FTEs • 70% of the current need (1,154 FTEs) is located in rural counties. • MHPs are a widely recognized need in the uninsured/Medicaid
population
Psychologists 1,330
Licensed Clinical Social Workers (LCSWs) 4,067
264 Health Professional Shortage Area (HSPH), Health Resources Services Administration, Online tool accessed 07/20/2013 265 Deloitte Consulting. “The Commonwealth of Kentucky Health Care Workforce Capacity Report.” (2013). 266 Robiner, W. N. (2006). The mental health professions: Workforce Issues and challenges. Clinical Psychology Review, 26, 600-625. 267 Deloitte Consulting. “The Commonwealth of Kentucky Health Care Workforce Capacity Report.” (2013). 268 Ibid 269 Ibid 270 MHPs do not include licensed APRNs who may have a behavioral health certification

The Commonwealth of Kentucky Health Care Facility Capacity Report, 2013 95
Licensed Professional Counselors (LPCs) 1,516 • Quality and accuracy of licensing databases were problematic and
missing current practice locations • Some professionals may practice in more than one location or county
and/or may have more than one professional degree or type of license for which clinical efforts vary which makes careful headcount and benchmarking difficult
• Benchmarks are not as widely reported for many of these groups
Marriage and Family Therapists (MFTs) 436
Alcohol and Drug Counselors (ADCs) 727
Figure 62 points toward a correspondence between community MHP shortage and use of inpatient facilities: Communities that are experiencing comparatively greater shortage of mental health professionals (darker red), such as Christian, Laurel, Floyd, and Pike, are also experiencing higher occupancy levels for psychiatry facilities (darker purple). These high occupancy levels could reflect insufficient outpatient resources for psychiatric patients who, in turn, utilize the inpatient psychiatric systems more frequently.
Figure 62: Comparison of Inpatient Utilization Against Workforce Shortages271 272
271 2012 KY Inpatient Administrative Claims Data Report; Utilization rate based on 2012 population 272 Map derived from The Commonwealth of Kentucky Health Care Workforce Capacity Report (2013); Health Providers (MHPs) include Psychologists, Licensed Clinical Social Workers (LCSWs), Licensed Professional Counselors (LPCs), Marriage and Family Therapists (MFTs), Alcohol and Drug Counselors (ADCs)
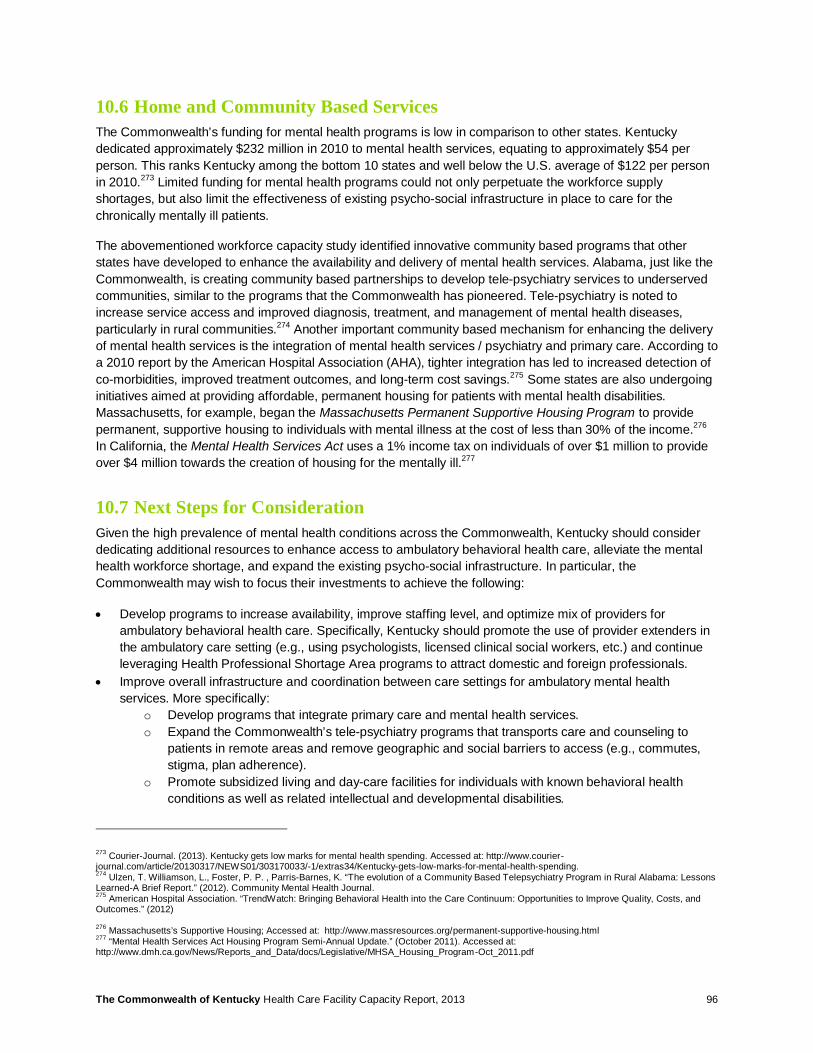
The Commonwealth of Kentucky Health Care Facility Capacity Report, 2013 96
10.6 Home and Community Based Services The Commonwealth’s funding for mental health programs is low in comparison to other states. Kentucky dedicated approximately $232 million in 2010 to mental health services, equating to approximately $54 per person. This ranks Kentucky among the bottom 10 states and well below the U.S. average of $122 per person in 2010.273 Limited funding for mental health programs could not only perpetuate the workforce supply shortages, but also limit the effectiveness of existing psycho-social infrastructure in place to care for the chronically mentally ill patients.
The abovementioned workforce capacity study identified innovative community based programs that other states have developed to enhance the availability and delivery of mental health services. Alabama, just like the Commonwealth, is creating community based partnerships to develop tele-psychiatry services to underserved communities, similar to the programs that the Commonwealth has pioneered. Tele-psychiatry is noted to increase service access and improved diagnosis, treatment, and management of mental health diseases, particularly in rural communities.274 Another important community based mechanism for enhancing the delivery of mental health services is the integration of mental health services / psychiatry and primary care. According to a 2010 report by the American Hospital Association (AHA), tighter integration has led to increased detection of co-morbidities, improved treatment outcomes, and long-term cost savings.275 Some states are also undergoing initiatives aimed at providing affordable, permanent housing for patients with mental health disabilities. Massachusetts, for example, began the Massachusetts Permanent Supportive Housing Program to provide permanent, supportive housing to individuals with mental illness at the cost of less than 30% of the income.276 In California, the Mental Health Services Act uses a 1% income tax on individuals of over $1 million to provide over $4 million towards the creation of housing for the mentally ill.277
10.7 Next Steps for Consideration Given the high prevalence of mental health conditions across the Commonwealth, Kentucky should consider dedicating additional resources to enhance access to ambulatory behavioral health care, alleviate the mental health workforce shortage, and expand the existing psycho-social infrastructure. In particular, the Commonwealth may wish to focus their investments to achieve the following:
• Develop programs to increase availability, improve staffing level, and optimize mix of providers for ambulatory behavioral health care. Specifically, Kentucky should promote the use of provider extenders in the ambulatory care setting (e.g., using psychologists, licensed clinical social workers, etc.) and continue leveraging Health Professional Shortage Area programs to attract domestic and foreign professionals.
• Improve overall infrastructure and coordination between care settings for ambulatory mental health services. More specifically:
o Develop programs that integrate primary care and mental health services. o Expand the Commonwealth’s tele-psychiatry programs that transports care and counseling to
patients in remote areas and remove geographic and social barriers to access (e.g., commutes, stigma, plan adherence).
o Promote subsidized living and day-care facilities for individuals with known behavioral health conditions as well as related intellectual and developmental disabilities.
273 Courier-Journal. (2013). Kentucky gets low marks for mental health spending. Accessed at: http://www.courier-journal.com/article/20130317/NEWS01/303170033/-1/extras34/Kentucky-gets-low-marks-for-mental-health-spending. 274 Ulzen, T. Williamson, L., Foster, P. P. , Parris-Barnes, K. “The evolution of a Community Based Telepsychiatry Program in Rural Alabama: Lessons Learned-A Brief Report.” (2012). Community Mental Health Journal. 275 American Hospital Association. “TrendWatch: Bringing Behavioral Health into the Care Continuum: Opportunities to Improve Quality, Costs, and Outcomes.” (2012) 276 Massachusetts’s Supportive Housing; Accessed at: http://www.massresources.org/permanent-supportive-housing.html 277 “Mental Health Services Act Housing Program Semi-Annual Update.” (October 2011). Accessed at: http://www.dmh.ca.gov/News/Reports_and_Data/docs/Legislative/MHSA_Housing_Program-Oct_2011.pdf
The Commonwealth of Kentucky Health Care Facility Capacity Report, 2013 97
o Expand support for non-profit / faith-based organizations in their efforts to manage vulnerable populations, including chronic mental health and substance abuse patients.
• Examine use of economic levers to improve balance between inpatient and outpatient delivery of care. More specifically:
o Evaluate reimbursement for inpatient care and specify discharge criteria for acute mental health cases in order to avoid premature discharges that lead to unnecessary readmissions.
o Assess appropriateness of professional fees for mental health professionals. o Consider development of accountable care models specific to psychiatry care in metro areas (i.e.,
a mental health provider receives bundled payments to manage the continuum of a patient’s inpatient and ambulatory care episode).
• Consider promoting Psychiatric Residential Treatment Facilities (PRTF) for young adults and adolescents through economic incentives that provide reimbursement that is commensurate with the cost of providing the service. Improving the delivery economic will incent providers to bring online more rapidly the recently approved PRTF beds.
10.8 Potential Challenges However, the Commonwealth will also need to consider the innate complexity associated with the provision of mental health services, such as:
• Developing broad community mental health services in certain rural areas could pose operational challenges. Achieving the required scale for programs and developing a broad supporting infrastructure may be too complex for individual counties to attempt on their own. The Cabinet for Health and Family Services has recently contracted for a Behavioral Health Assessment. The study will take a continuum view of mental health services and review inpatient services, community based services, and workforce implications.
• Developing an integrated model that combines management of chronic mental health conditions and substance abuse treatment may be complicated by the fact that many services are provided by community based / non-profit organizations which are not regulated by the Cabinet.
• Many states continue to be challenged in managing mental health – leading practices are emerging but not universally applied.
The Commonwealth of Kentucky Health Care Facility Capacity Report, 2013 98
11 Imaging: MRI, PET
11.1 Summary Imaging services have grown to represent a major source of revenue for healthcare providers; however, these services are reportedly often over used and can represent potentially avoidable health care expenditures. The Commonwealth’s Certificate of Need Requirement, which establishes a minimum utilization threshold for imaging equipment, is aimed at controlling supply and thus reducing excess utilization and unnecessary health care costs.
An analysis of the Commonwealth’s imaging services for MRI and PET indicated that utilization levels are comparable to national and contiguous state benchmarks, but there is excess MRI imaging capacity across the Commonwealth. Physician-owned MRI facilities are not subject to CON, and the minimum capital thresholds for new devices is high at $2.7M. Applications for new MRI and PET devices have slowed down in recent years with just 14 MRI and 1 PET applications approved since 2008. The CON program may therefore no longer be effective at regulating supply and may even be impeding competition.
These findings suggest that a shift in legislative focus from supply management to demand management should be considered. The pre-approval process has been considered an effective tool to manage demand, and the Commonwealth has already implemented such demand management policies for its Medicaid population. Even so, the Commonwealth’s penetration of managed care plans / HMO models in the commercial insured population remains comparatively low at approximately 10%. There may, therefore, be an opportunity to expand health management practices related to imaging services to commercial patients.
11.2 Imaging Utilization The Commonwealth’s utilization of MRI services is comparable to the national benchmark; however, excess capacity exists across all Medicaid Managed Care Regions (MMCRs) relative to the minimum procedure volume for new applicants set forth by the State Health Plan. The State Health Plan threshold requires demonstration of need for 2,500 and 1,850 imaging procedures per year for fixed installations and mobile devices, respectively.278 Figure 63 shows the 2012 and 2017 projected demand for MRI services and compares these to the current MRI capacity.
278 2013-2015 Kentucky State Health Plan, Certificate of Need Review Standards, Kentucky Cabinet for Health and Family Services
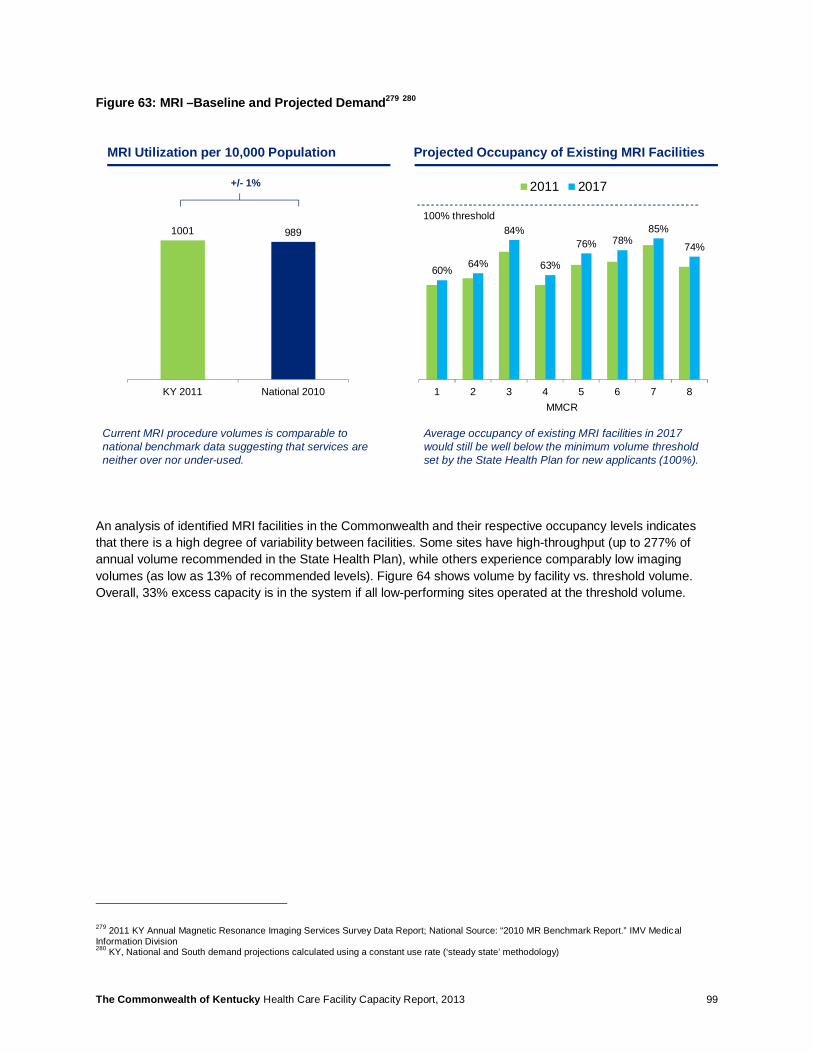
The Commonwealth of Kentucky Health Care Facility Capacity Report, 2013 99
Figure 63: MRI –Baseline and Projected Demand279 280
An analysis of identified MRI facilities in the Commonwealth and their respective occupancy levels indicates that there is a high degree of variability between facilities. Some sites have high-throughput (up to 277% of annual volume recommended in the State Health Plan), while others experience comparably low imaging volumes (as low as 13% of recommended levels). Figure 64 shows volume by facility vs. threshold volume. Overall, 33% excess capacity is in the system if all low-performing sites operated at the threshold volume.
279 2011 KY Annual Magnetic Resonance Imaging Services Survey Data Report; National Source: “2010 MR Benchmark Report.” IMV Medical Information Division 280 KY, National and South demand projections calculated using a constant use rate (‘steady state’ methodology)
Current MRI procedure volumes is comparable to national benchmark data suggesting that services are neither over nor under-used.
60% 64%
84%
63%
76% 78%85%
74%
1 2 3 4 5 6 7 8
2011 2017
MMCR
100% threshold1001 989
KY 2011 National 2010
MRI Utilization per 10,000 Population Projected Occupancy of Existing MRI Facilities
Average occupancy of existing MRI facilities in 2017 would still be well below the minimum volume threshold set by the State Health Plan for new applicants (100%).
+/- 1%
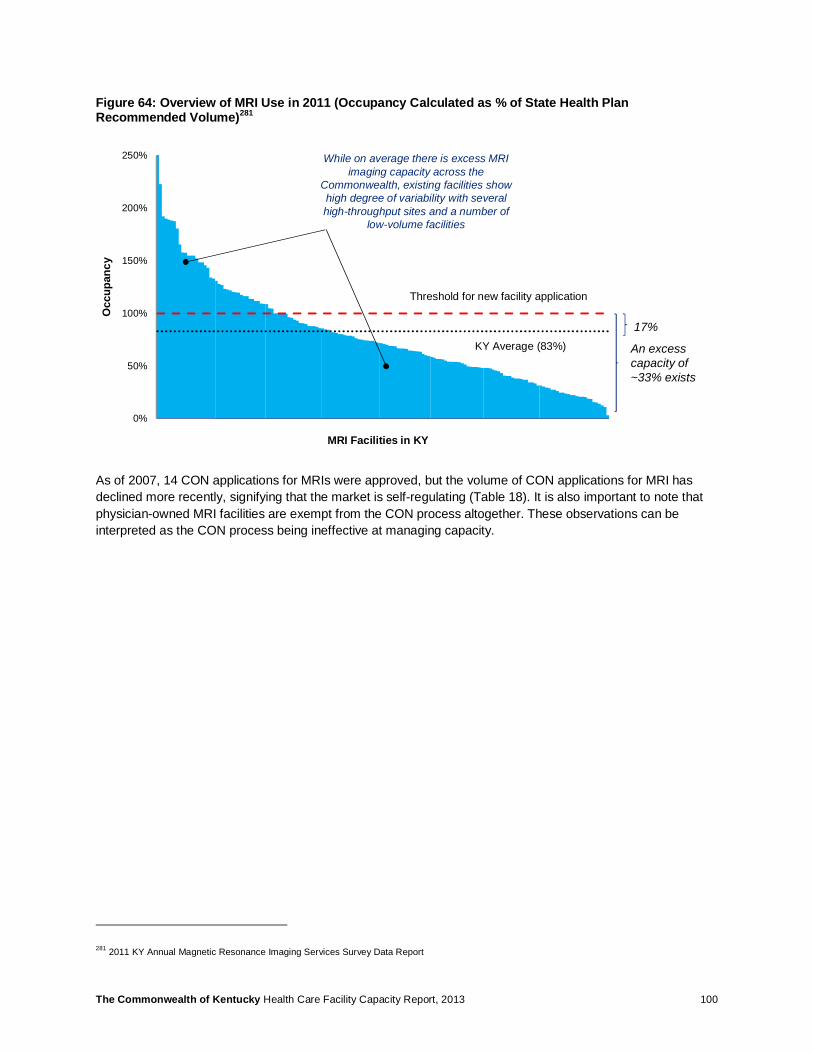
The Commonwealth of Kentucky Health Care Facility Capacity Report, 2013 100
Figure 64: Overview of MRI Use in 2011 (Occupancy Calculated as % of State Health Plan Recommended Volume)281
As of 2007, 14 CON applications for MRIs were approved, but the volume of CON applications for MRI has declined more recently, signifying that the market is self-regulating (Table 18). It is also important to note that physician-owned MRI facilities are exempt from the CON process altogether. These observations can be interpreted as the CON process being ineffective at managing capacity.
281 2011 KY Annual Magnetic Resonance Imaging Services Survey Data Report
0%
50%
100%
150%
200%
250%
MRI Facilities in KY
Threshold for new facility application
KY Average (83%) An excess capacity of ~33% exists
Occ
upan
cy
17%
While on average there is excess MRI imaging capacity across the
Commonwealth, existing facilities show high degree of variability with several high-throughput sites and a number of
low-volume facilities
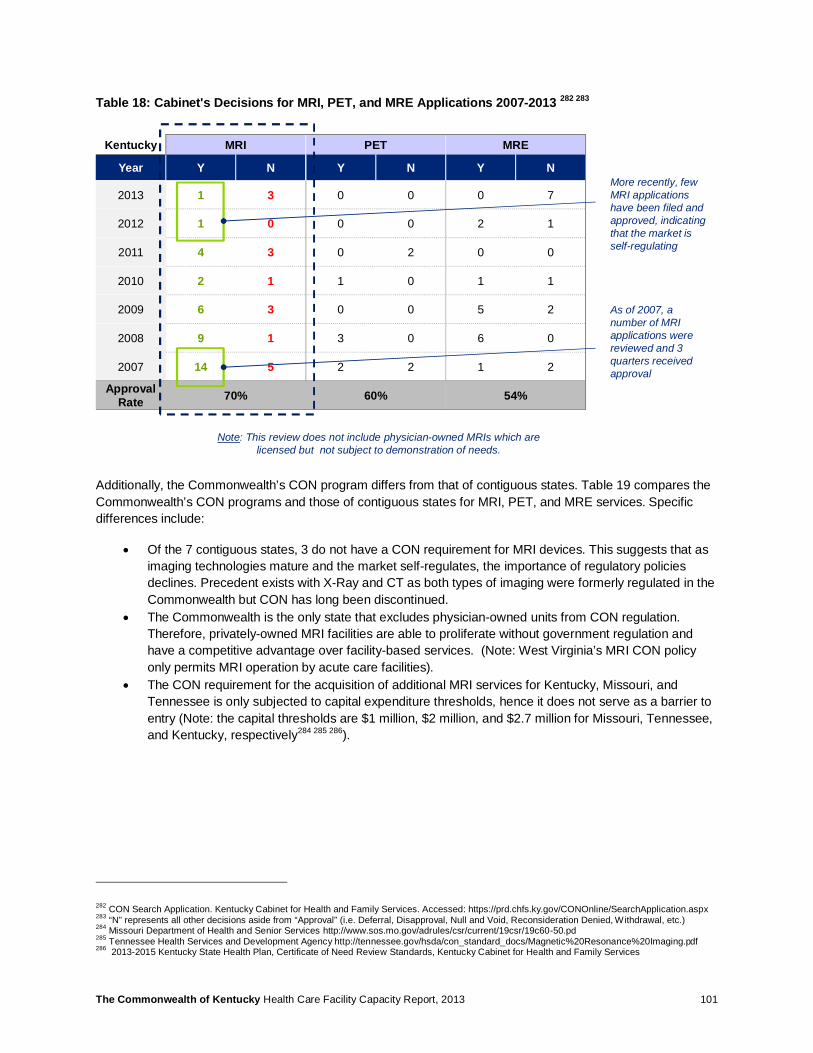
The Commonwealth of Kentucky Health Care Facility Capacity Report, 2013 101
Table 18: Cabinet's Decisions for MRI, PET, and MRE Applications 2007-2013 282 283
Additionally, the Commonwealth’s CON program differs from that of contiguous states. Table 19 compares the Commonwealth’s CON programs and those of contiguous states for MRI, PET, and MRE services. Specific differences include:
• Of the 7 contiguous states, 3 do not have a CON requirement for MRI devices. This suggests that as imaging technologies mature and the market self-regulates, the importance of regulatory policies declines. Precedent exists with X-Ray and CT as both types of imaging were formerly regulated in the Commonwealth but CON has long been discontinued.
• The Commonwealth is the only state that excludes physician-owned units from CON regulation. Therefore, privately-owned MRI facilities are able to proliferate without government regulation and have a competitive advantage over facility-based services. (Note: West Virginia’s MRI CON policy only permits MRI operation by acute care facilities).
• The CON requirement for the acquisition of additional MRI services for Kentucky, Missouri, and Tennessee is only subjected to capital expenditure thresholds, hence it does not serve as a barrier to entry (Note: the capital thresholds are $1 million, $2 million, and $2.7 million for Missouri, Tennessee, and Kentucky, respectively284 285 286).
282 CON Search Application. Kentucky Cabinet for Health and Family Services. Accessed: https://prd.chfs.ky.gov/CONOnline/SearchApplication.aspx 283 “N” represents all other decisions aside from “Approval” (i.e. Deferral, Disapproval, Null and Void, Reconsideration Denied, Withdrawal, etc.) 284 Missouri Department of Health and Senior Services http://www.sos.mo.gov/adrules/csr/current/19csr/19c60-50.pd 285 Tennessee Health Services and Development Agency http://tennessee.gov/hsda/con_standard_docs/Magnetic%20Resonance%20Imaging.pdf 286 2013-2015 Kentucky State Health Plan, Certificate of Need Review Standards, Kentucky Cabinet for Health and Family Services
Kentucky MRI PET MRE
Year Y N Y N Y N
2013 1 3 0 0 0 7
2012 1 0 0 0 2 1
2011 4 3 0 2 0 0
2010 2 1 1 0 1 1
2009 6 3 0 0 5 2
2008 9 1 3 0 6 0
2007 14 5 2 2 1 2
ApprovalRate 70% 60% 54%
Note: This review does not include physician-owned MRIs which are licensed but not subject to demonstration of needs.
More recently, few MRI applications have been filed and approved, indicating that the market is self-regulating
As of 2007, a number of MRI applications were reviewed and 3 quarters received approval
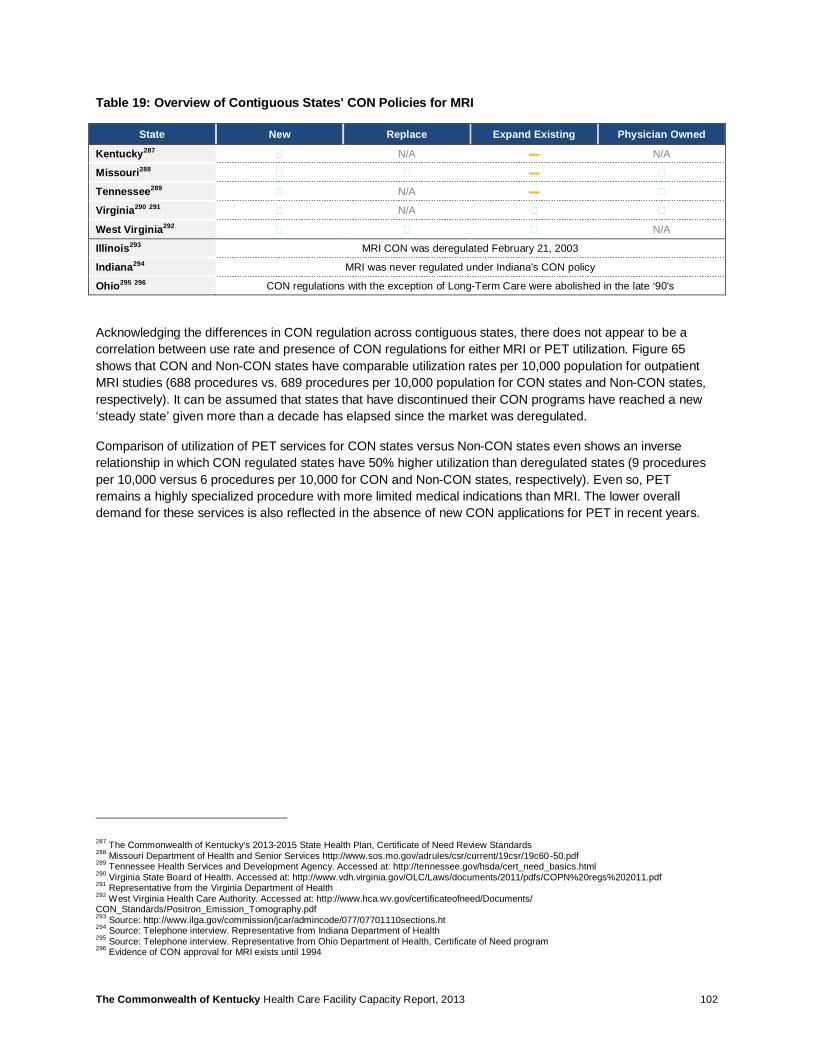
The Commonwealth of Kentucky Health Care Facility Capacity Report, 2013 102
Table 19: Overview of Contiguous States' CON Policies for MRI
State New Replace Expand Existing Physician Owned
Kentucky287 N/A ▬ N/A
Missouri288 ▬
Tennessee289 N/A ▬
Virginia290 291 N/A
West Virginia292 N/A
Illinois293 MRI CON was deregulated February 21, 2003
Indiana294 MRI was never regulated under Indiana's CON policy
Ohio295 296 CON regulations with the exception of Long-Term Care were abolished in the late ‘90's
Acknowledging the differences in CON regulation across contiguous states, there does not appear to be a correlation between use rate and presence of CON regulations for either MRI or PET utilization. Figure 65 shows that CON and Non-CON states have comparable utilization rates per 10,000 population for outpatient MRI studies (688 procedures vs. 689 procedures per 10,000 population for CON states and Non-CON states, respectively). It can be assumed that states that have discontinued their CON programs have reached a new ‘steady state’ given more than a decade has elapsed since the market was deregulated.
Comparison of utilization of PET services for CON states versus Non-CON states even shows an inverse relationship in which CON regulated states have 50% higher utilization than deregulated states (9 procedures per 10,000 versus 6 procedures per 10,000 for CON and Non-CON states, respectively). Even so, PET remains a highly specialized procedure with more limited medical indications than MRI. The lower overall demand for these services is also reflected in the absence of new CON applications for PET in recent years.
287 The Commonwealth of Kentucky’s 2013-2015 State Health Plan, Certificate of Need Review Standards 288 Missouri Department of Health and Senior Services http://www.sos.mo.gov/adrules/csr/current/19csr/19c60-50.pdf 289 Tennessee Health Services and Development Agency. Accessed at: http://tennessee.gov/hsda/cert_need_basics.html 290 Virginia State Board of Health. Accessed at: http://www.vdh.virginia.gov/OLC/Laws/documents/2011/pdfs/COPN%20regs%202011.pdf 291 Representative from the Virginia Department of Health 292 West Virginia Health Care Authority. Accessed at: http://www.hca.wv.gov/certificateofneed/Documents/ CON_Standards/Positron_Emission_Tomography.pdf 293 Source: http://www.ilga.gov/commission/jcar/admincode/077/07701110sections.ht 294 Source: Telephone interview. Representative from Indiana Department of Health 295 Source: Telephone interview. Representative from Ohio Department of Health, Certificate of Need program 296 Evidence of CON approval for MRI exists until 1994
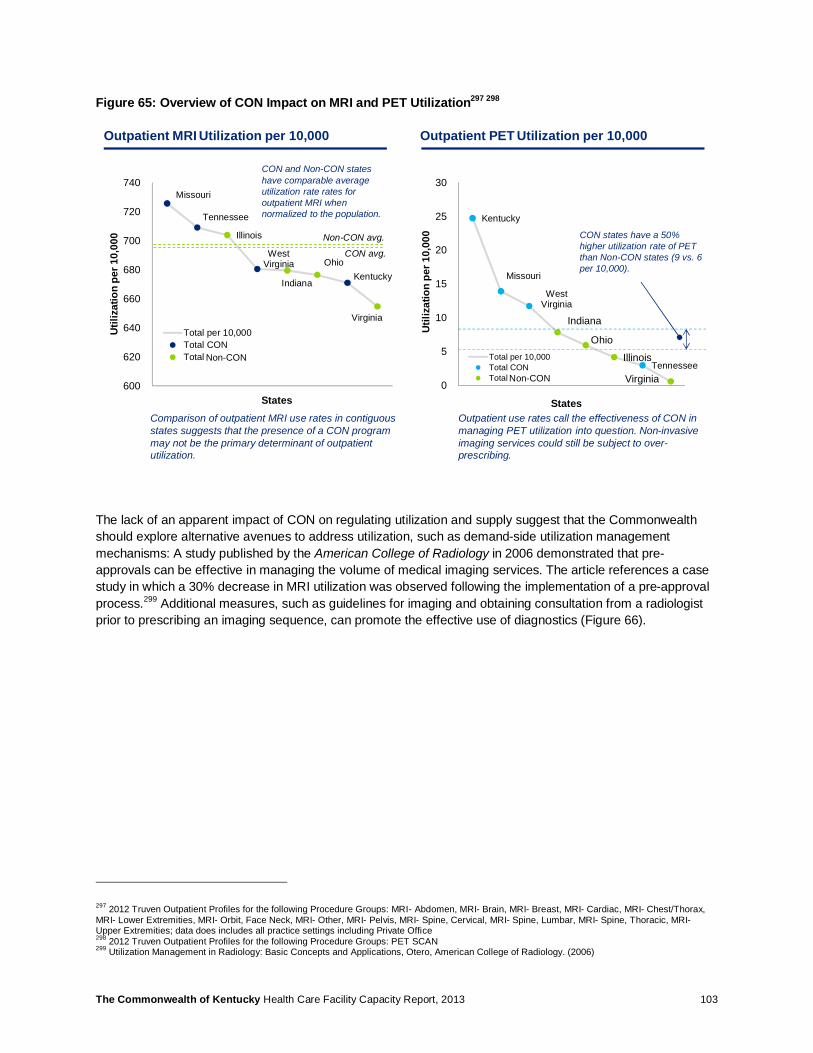
The Commonwealth of Kentucky Health Care Facility Capacity Report, 2013 103
Figure 65: Overview of CON Impact on MRI and PET Utilization297 298
The lack of an apparent impact of CON on regulating utilization and supply suggest that the Commonwealth should explore alternative avenues to address utilization, such as demand-side utilization management mechanisms: A study published by the American College of Radiology in 2006 demonstrated that pre-approvals can be effective in managing the volume of medical imaging services. The article references a case study in which a 30% decrease in MRI utilization was observed following the implementation of a pre-approval process.299 Additional measures, such as guidelines for imaging and obtaining consultation from a radiologist prior to prescribing an imaging sequence, can promote the effective use of diagnostics (Figure 66).
297 2012 Truven Outpatient Profiles for the following Procedure Groups: MRI- Abdomen, MRI- Brain, MRI- Breast, MRI- Cardiac, MRI- Chest/Thorax, MRI- Lower Extremities, MRI- Orbit, Face Neck, MRI- Other, MRI- Pelvis, MRI- Spine, Cervical, MRI- Spine, Lumbar, MRI- Spine, Thoracic, MRI- Upper Extremities; data does includes all practice settings including Private Office 298 2012 Truven Outpatient Profiles for the following Procedure Groups: PET SCAN 299 Utilization Management in Radiology: Basic Concepts and Applications, Otero, American College of Radiology. (2006)
Kentucky
Missouri
West Virginia
Tennessee
Indiana
Ohio
Illinois
Virginia0
5
10
15
20
25
30
Total per 10,000Total CONTotal No CON
States
Util
izat
ion
per 1
0,00
0 CON states have a 50% higher utilization rate of PET than Non-CON states (9 vs. 6 per 10,000).
Outpatient MRI Utilization per 10,000 Outpatient PET Utilization per 10,000
Outpatient use rates call the effectiveness of CON in managing PET utilization into question. Non-invasive imaging services could still be subject to over-prescribing.
Missouri
Tennessee
West Virginia
Kentucky
Illinois
Indiana
Ohio
Virginia
600
620
640
660
680
700
720
740
Total per 10,000Total CONTotal No CON
States
Util
izat
ion
per 1
0,00
0 Non-CON avg.
CON avg.
CON and Non-CON states have comparable average utilization rate rates for outpatient MRI when normalized to the population.
Comparison of outpatient MRI use rates in contiguous states suggests that the presence of a CON program may not be the primary determinant of outpatient utilization.
Non-CON
Non-CON
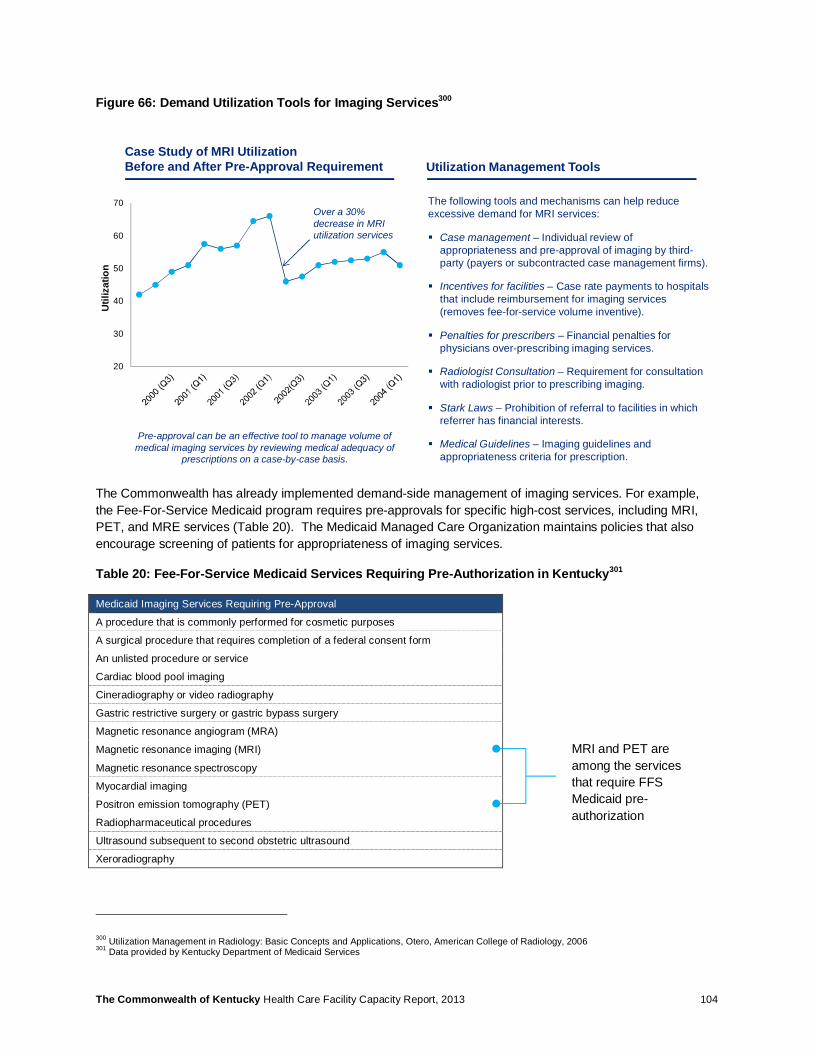
The Commonwealth of Kentucky Health Care Facility Capacity Report, 2013 104
Figure 66: Demand Utilization Tools for Imaging Services300
The Commonwealth has already implemented demand-side management of imaging services. For example, the Fee-For-Service Medicaid program requires pre-approvals for specific high-cost services, including MRI, PET, and MRE services (Table 20). The Medicaid Managed Care Organization maintains policies that also encourage screening of patients for appropriateness of imaging services.
Table 20: Fee-For-Service Medicaid Services Requiring Pre-Authorization in Kentucky301
Medicaid Imaging Services Requiring Pre-Approval
A procedure that is commonly performed for cosmetic purposes
A surgical procedure that requires completion of a federal consent form
An unlisted procedure or service
Cardiac blood pool imaging
Cineradiography or video radiography
Gastric restrictive surgery or gastric bypass surgery
Magnetic resonance angiogram (MRA)
Magnetic resonance imaging (MRI)
Magnetic resonance spectroscopy
Myocardial imaging
Positron emission tomography (PET)
Radiopharmaceutical procedures
Ultrasound subsequent to second obstetric ultrasound
Xeroradiography
300 Utilization Management in Radiology: Basic Concepts and Applications, Otero, American College of Radiology, 2006 301 Data provided by Kentucky Department of Medicaid Services
The following tools and mechanisms can help reduce excessive demand for MRI services:
§ Case management – Individual review of appropriateness and pre-approval of imaging by third-party (payers or subcontracted case management firms).
§ Incentives for facilities – Case rate payments to hospitals that include reimbursement for imaging services (removes fee-for-service volume inventive).
§ Penalties for prescribers – Financial penalties for physicians over-prescribing imaging services.
§ Radiologist Consultation – Requirement for consultation with radiologist prior to prescribing imaging.
§ Stark Laws – Prohibition of referral to facilities in which referrer has financial interests.
§ Medical Guidelines – Imaging guidelines and appropriateness criteria for prescription.
20
30
40
50
60
70Over a 30% decrease in MRI utilization services
Case Study of MRI Utilization Before and After Pre-Approval Requirement Utilization Management Tools
Pre-approval can be an effective tool to manage volume of medical imaging services by reviewing medical adequacy of
prescriptions on a case-by-case basis.
Util
izat
ion
MRI and PET are among the services that require FFS Medicaid pre-authorization
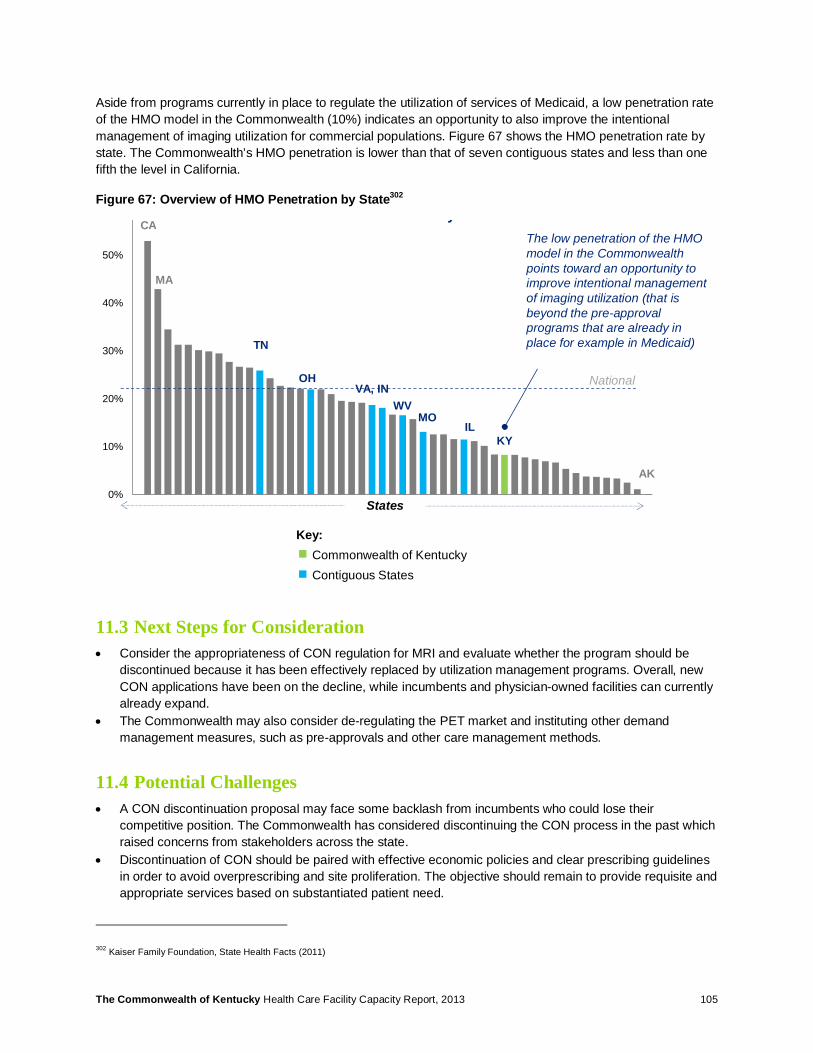
The Commonwealth of Kentucky Health Care Facility Capacity Report, 2013 105
Aside from programs currently in place to regulate the utilization of services of Medicaid, a low penetration rate of the HMO model in the Commonwealth (10%) indicates an opportunity to also improve the intentional management of imaging utilization for commercial populations. Figure 67 shows the HMO penetration rate by state. The Commonwealth’s HMO penetration is lower than that of seven contiguous states and less than one fifth the level in California.
Figure 67: Overview of HMO Penetration by State302
11.3 Next Steps for Consideration • Consider the appropriateness of CON regulation for MRI and evaluate whether the program should be
discontinued because it has been effectively replaced by utilization management programs. Overall, new CON applications have been on the decline, while incumbents and physician-owned facilities can currently already expand.
• The Commonwealth may also consider de-regulating the PET market and instituting other demand management measures, such as pre-approvals and other care management methods.
11.4 Potential Challenges • A CON discontinuation proposal may face some backlash from incumbents who could lose their
competitive position. The Commonwealth has considered discontinuing the CON process in the past which raised concerns from stakeholders across the state.
• Discontinuation of CON should be paired with effective economic policies and clear prescribing guidelines in order to avoid overprescribing and site proliferation. The objective should remain to provide requisite and appropriate services based on substantiated patient need.
302 Kaiser Family Foundation, State Health Facts (2011)
0%
10%
20%
30%
40%
50%
HMO Penetration Rate by State
States
Key:Commonwealth of KentuckyContiguous States
National
The low penetration of the HMO model in the Commonwealth points toward an opportunity to improve intentional management of imaging utilization (that is beyond the pre-approval programs that are already in place for example in Medicaid)TN
OHVA, IN
WVMO
IL
CA
MA
AK
KY
The Commonwealth of Kentucky Health Care Facility Capacity Report, 2013 106
12 Ambulatory Surgical Centers
12.1 Summary Nationally, the overall trend is to transition patients from hospital-based surgery to ambulatory surgery wherever possible in order to reduce cost and avoid complications. Ambulatory surgical procedures can be conducted either in existing hospital operating rooms (ORs) or in free-standing ambulatory surgical centers. Currently, supply appears acceptable when reviewed at the statewide level. However, distribution of services is uneven, with some MMCRs’ occupancy up to twice the State Health Plan’s minimum volume threshold of 2,205 hours of operations per ambulatory surgery OR. Use rate comparison against national benchmark indicates that ambulatory surgeries are 56% less frequently utilized in the Commonwealth (or 1,055 vs. 1,643 national benchmark per 10,000 population). One potential explanation for the lower use rate could be an intermediate level of reimbursement for ambulatory surgical procedures, which could in turn create incentives to charge procedures using inpatient reimbursement codes instead. The demand for ambulatory surgical care may therefore be higher than measured by actual procedures conducted.
12.2 ASC Utilization Generally, the Commonwealth’s occupancy for ambulatory surgery operating rooms is high across all MMCR’s relative to the minimum volume threshold set forth in the State Health Plan for ambulatory ORs in hospitals and freestanding ASC303 304. Some MMCRs are experiencing occupancy rates double the threshold. A potential shortage in ambulatory surgery care is reflected in close to 20% of patients from MMCR’s 4, 7, and 9 traveling outside of their region to receive ASC services. Projected 2017 utilization indicates that current capacity constraints will accentuate going forward for all MMCRs (Figure 68).
The utilization analysis was based on major and minor ambulatory surgeries identified at the CPT code level as defined by Truven Outpatient Profiles.305 Surgeries do not include cystoscopy or other minimally-invasive procedures. When comparing utilization rates for surgeries against Truven Outpatient Profiles data, the Commonwealth utilizes ASCs at approximately two-thirds the national and southern peer group rate. As the Commonwealth does not collect physician practice data, the Truven benchmark were standardized to exclude physician practice utilization as well.
303 2013-2015 Kentucky State Health Plan, Certificate of Need Review Standards, Kentucky Cabinet for Health and Family Services 304 Utilization is calculated by ((Total inpatient operations * 2.0 hours)+(Total Outpatient operations* 1.2 hours)/((Existing and Approved Hospital Operation Rooms+ ASC operating Rooms)*2,205)) 305 Truven Outpatient Profiles identifies procedure volume at the CPT code level for Major or Minor Surgeries in its Ambulatory Technical Group; a total of 4,043 CPT codes are included in the two combined categories
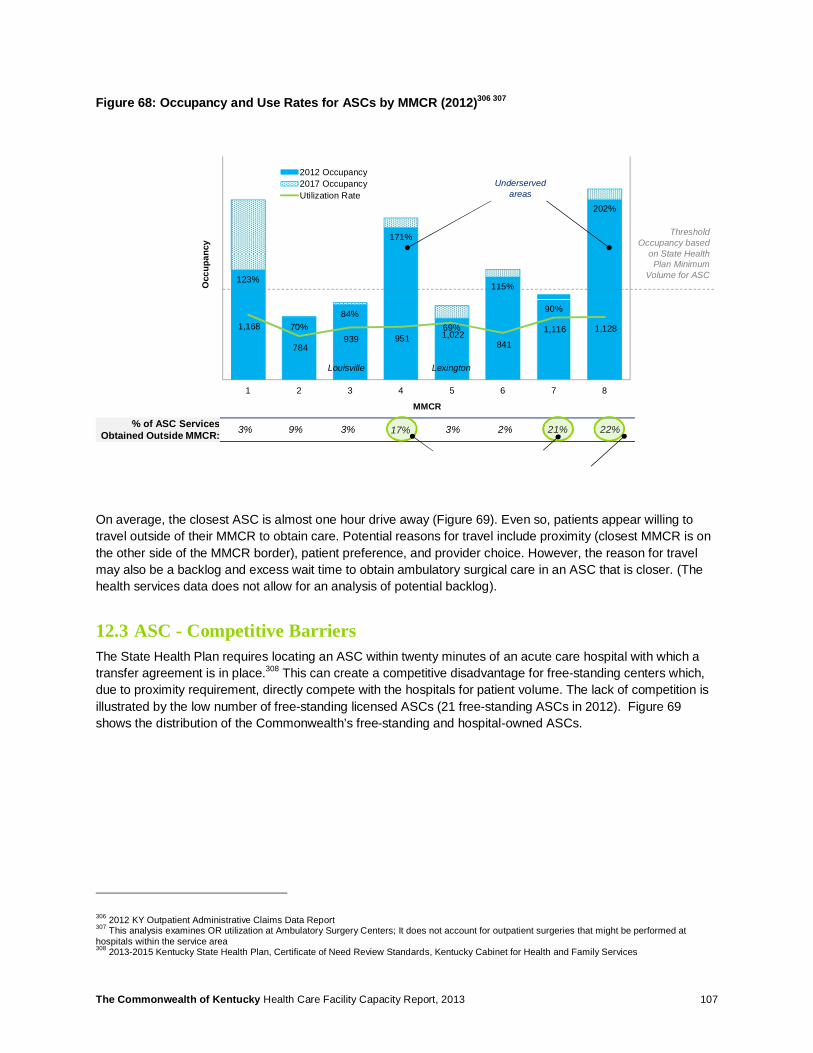
The Commonwealth of Kentucky Health Care Facility Capacity Report, 2013 107
Figure 68: Occupancy and Use Rates for ASCs by MMCR (2012)306 307
On average, the closest ASC is almost one hour drive away (Figure 69). Even so, patients appear willing to travel outside of their MMCR to obtain care. Potential reasons for travel include proximity (closest MMCR is on the other side of the MMCR border), patient preference, and provider choice. However, the reason for travel may also be a backlog and excess wait time to obtain ambulatory surgical care in an ASC that is closer. (The health services data does not allow for an analysis of potential backlog).
12.3 ASC - Competitive Barriers The State Health Plan requires locating an ASC within twenty minutes of an acute care hospital with which a transfer agreement is in place.308 This can create a competitive disadvantage for free-standing centers which, due to proximity requirement, directly compete with the hospitals for patient volume. The lack of competition is illustrated by the low number of free-standing licensed ASCs (21 free-standing ASCs in 2012). Figure 69 shows the distribution of the Commonwealth’s free-standing and hospital-owned ASCs.
306 2012 KY Outpatient Administrative Claims Data Report 307 This analysis examines OR utilization at Ambulatory Surgery Centers; It does not account for outpatient surgeries that might be performed at hospitals within the service area 308 2013-2015 Kentucky State Health Plan, Certificate of Need Review Standards, Kentucky Cabinet for Health and Family Services
123%
70%84%
171%
69%
115%
90%
202%
1,168
784 939 951 1,022
841
1,116 1,128
1 2 3 4 5 6 7 8
2012 Occupancy2017 OccupancyUtilization Rate
MMCR
Occ
upan
cy
Threshold Occupancy based
on State Health Plan Minimum
Volume for ASC
Louisville Lexington
Underserved areas
% of ASC Services Obtained Outside MMCR: 3% 9% 3% 17% 3% 2% 21% 22%

The Commonwealth of Kentucky Health Care Facility Capacity Report, 2013 108
Figure 69: Distribution of Ambulatory Surgery Facilities and Drive Time to Closest Facility309 310
The status of CON applications may further indicate barriers to entry for free-standing ASCs. Since January 1, 2003, 43 ASC applications have been submitted. Of the 43 applications, none were approved based on meeting the planning area surgical utilization requirements of the State Health Plan. Applications that were approved were based on non-substantive review for relocation or cost escalation.311 Besides the minimum volume thresholds, the requirement of a transfer agreement with an acute care hospital creates additional barriers for new entrants. This may be reflected in the number of deferred and withdrawn applications among providers wishing to “establish” an ASC (15 submitted between 2003 and 2013). These factors, coupled with a historic challenge in obtaining state certification to apply for Medicare reimbursement, have created effective barriers to entry for free-standing ASCs.
An analysis of Kentucky’s commercial insurance cost allowance for ASC reimbursement indicates that reimbursement in the Commonwealth is just below average relative to contiguous states (Figure 70). This intermediate level of reimbursement by commercial payers may skew incentives toward treating patients in the hospital rather than an ambulatory setting.
In summary, the current ASC market may be facing competitive market distortion, which may be slowing the pace at which care is transitioned to more cost-effective ambulatory settings.
309 2012 KY Annual Ambulatory Surgical Center Services Survey Data Report; includes all ASC surgeries conducted in 2012 310 Drive time was calculated as distance between facility zip codes using GoogleMaps® 311 Kentucky Cabinet for Health and Family Services, CON Search Application. Accessed at: https://prd.chfs.ky.gov/CONOnline/SearchApplication.aspx
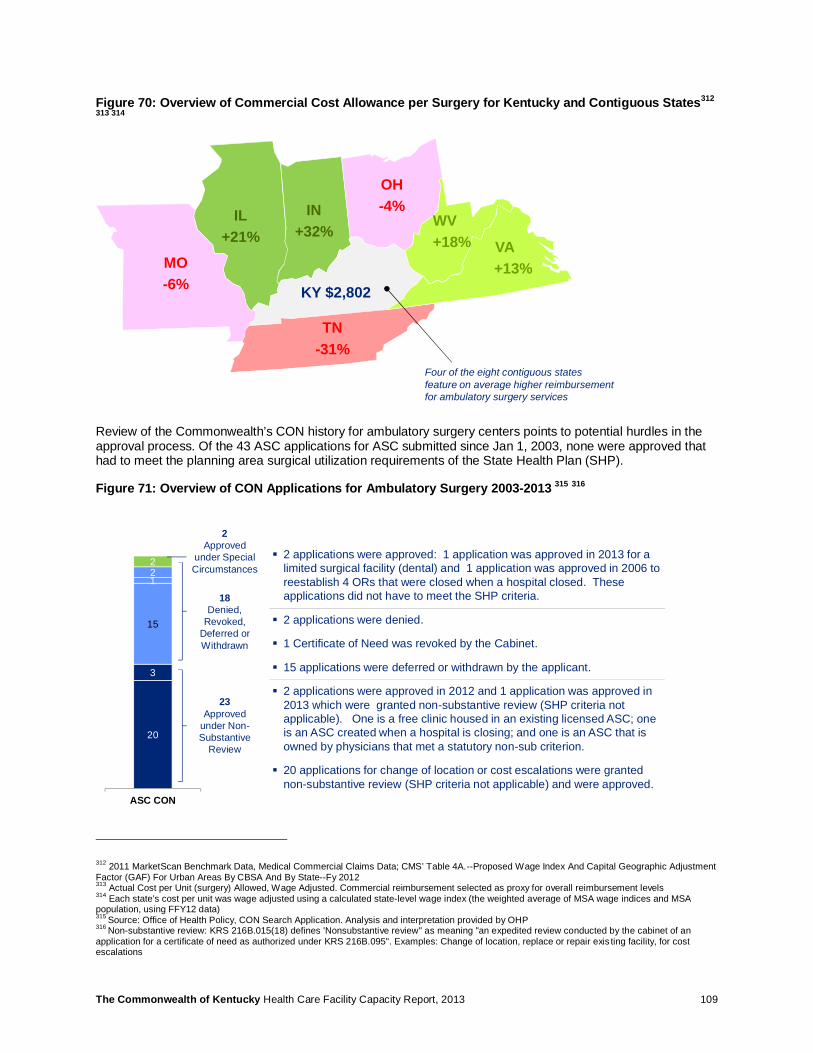
The Commonwealth of Kentucky Health Care Facility Capacity Report, 2013 109
Figure 70: Overview of Commercial Cost Allowance per Surgery for Kentucky and Contiguous States312
313 314
Review of the Commonwealth’s CON history for ambulatory surgery centers points to potential hurdles in the approval process. Of the 43 ASC applications for ASC submitted since Jan 1, 2003, none were approved that had to meet the planning area surgical utilization requirements of the State Health Plan (SHP).
Figure 71: Overview of CON Applications for Ambulatory Surgery 2003-2013 315 316
312 2011 MarketScan Benchmark Data, Medical Commercial Claims Data; CMS’ Table 4A.--Proposed Wage Index And Capital Geographic Adjustment Factor (GAF) For Urban Areas By CBSA And By State--Fy 2012 313 Actual Cost per Unit (surgery) Allowed, Wage Adjusted. Commercial reimbursement selected as proxy for overall reimbursement levels 314 Each state’s cost per unit was wage adjusted using a calculated state-level wage index (the weighted average of MSA wage indices and MSA population, using FFY12 data) 315 Source: Office of Health Policy, CON Search Application. Analysis and interpretation provided by OHP 316 Non-substantive review: KRS 216B.015(18) defines 'Nonsubstantive review" as meaning "an expedited review conducted by the cabinet of an application for a certificate of need as authorized under KRS 216B.095". Examples: Change of location, replace or repair exis ting facility, for cost escalations
IL+21%
IN+32%
KY $2,802
MO-6%
OH-4%
TN-31%
VA+13%
WV+18%
Four of the eight contiguous states feature on average higher reimbursement for ambulatory surgery services
§ 2 applications were approved: 1 application was approved in 2013 for a limited surgical facility (dental) and 1 application was approved in 2006 to reestablish 4 ORs that were closed when a hospital closed. These applications did not have to meet the SHP criteria.
§ 2 applications were denied.
§ 1 Certificate of Need was revoked by the Cabinet.
§ 15 applications were deferred or withdrawn by the applicant.
§ 2 applications were approved in 2012 and 1 application was approved in 2013 which were granted non-substantive review (SHP criteria not applicable). One is a free clinic housed in an existing licensed ASC; one is an ASC created when a hospital is closing; and one is an ASC that is owned by physicians that met a statutory non-sub criterion.
§ 20 applications for change of location or cost escalations were granted non-substantive review (SHP criteria not applicable) and were approved.
20
3
15
122
ASC CON
23Approved
under Non-Substantive
Review
2Approved
under Special Circumstances
18Denied,
Revoked,Deferred or Withdrawn

The Commonwealth of Kentucky Health Care Facility Capacity Report, 2013 110
12.4 Next Steps for Consideration • Temporarily cease CON process for ASCs in order to allow more freestanding ASCs to come online. This
will increase market competition and provide consumers with viable alternatives to hospital-based care. Consider relaxing the proximity requirement stipulating 20-minute drive time to closest backup acute care hospital. The proximity requirement may not be medically warranted for smaller ambulatory surgery procedures. In comparison, for cardiac cath, the State Health Plan does not set a proximity requirement but requires a 24x7 consultation service.
• Use reimbursement for ambulatory surgeries as economic lever to further encourage conducting surgical procedures in an outpatient setting rather than by admitting patients to hospitals.
12.5 Potential Challenges • The reimbursement analysis presented above is based on Commercial insurance cost allowance. Public
payer programs, which are under the purview of the legislator, may be subject to different reimbursement dynamics.
• Relaxing CON or increasing reimbursement may lead to initial volume increases caused by potentially pent-up demand for ambulatory surgery services. This effect may cause a temporary increase in total spend on surgical care until a new balance of ambulatory vs. inpatient surgery is achieved.
• If they proliferate, privately owned ASCs could ‘cherry pick’ attractive cases. If this occurs, this could increase the economic burden on public hospitals which continue to care for the remaining sicker and potentially less well reimbursed patients.
• Achieving good surgical outcomes when transitioning care to ambulatory settings requires appropriate supporting infrastructure and post-surgical care. For more complex procedures, a health system and its established network may be better suited at coordinating the continuum of a surgical episode than an ambulatory surgical facility.
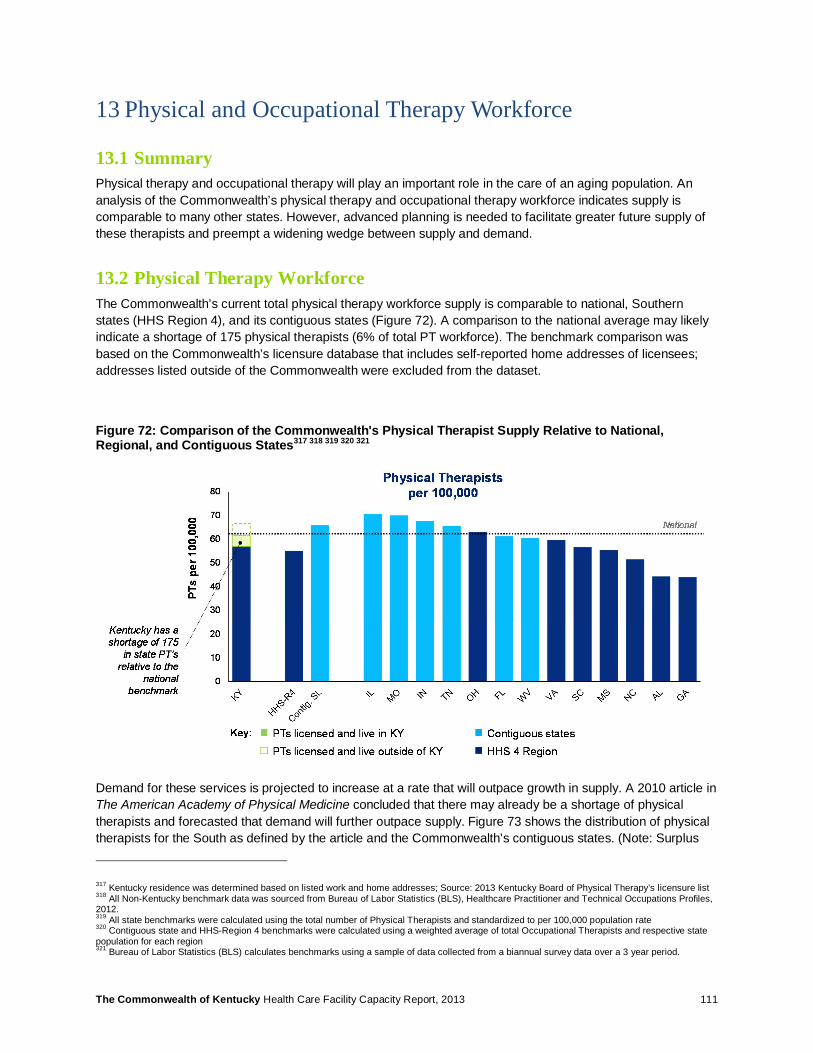
The Commonwealth of Kentucky Health Care Facility Capacity Report, 2013 111
13 Physical and Occupational Therapy Workforce
13.1 Summary Physical therapy and occupational therapy will play an important role in the care of an aging population. An analysis of the Commonwealth’s physical therapy and occupational therapy workforce indicates supply is comparable to many other states. However, advanced planning is needed to facilitate greater future supply of these therapists and preempt a widening wedge between supply and demand.
13.2 Physical Therapy Workforce The Commonwealth’s current total physical therapy workforce supply is comparable to national, Southern states (HHS Region 4), and its contiguous states (Figure 72). A comparison to the national average may likely indicate a shortage of 175 physical therapists (6% of total PT workforce). The benchmark comparison was based on the Commonwealth’s licensure database that includes self-reported home addresses of licensees; addresses listed outside of the Commonwealth were excluded from the dataset.
Figure 72: Comparison of the Commonwealth's Physical Therapist Supply Relative to National, Regional, and Contiguous States317 318 319 320 321
Demand for these services is projected to increase at a rate that will outpace growth in supply. A 2010 article in The American Academy of Physical Medicine concluded that there may already be a shortage of physical therapists and forecasted that demand will further outpace supply. Figure 73 shows the distribution of physical therapists for the South as defined by the article and the Commonwealth’s contiguous states. (Note: Surplus
317 Kentucky residence was determined based on listed work and home addresses; Source: 2013 Kentucky Board of Physical Therapy’s licensure list 318 All Non-Kentucky benchmark data was sourced from Bureau of Labor Statistics (BLS), Healthcare Practitioner and Technical Occupations Profiles, 2012. 319 All state benchmarks were calculated using the total number of Physical Therapists and standardized to per 100,000 population rate 320 Contiguous state and HHS-Region 4 benchmarks were calculated using a weighted average of total Occupational Therapists and respective state population for each region 321 Bureau of Labor Statistics (BLS) calculates benchmarks using a sample of data collected from a biannual survey data over a 3 year period.

The Commonwealth of Kentucky Health Care Facility Capacity Report, 2013 112
and deficit values were determined based on 2008 supply for each respective state relative to the national supply baseline). Projections based on the 2008 supply indicate that the southern region is projected to grow more promptly compared to other regions of the country which may pose an even greater future physical therapy workforce constraint for the Commonwealth.
Figure 73: Physical Therapy Projections- 2008 and Beyond322 323
13.3 Occupational Therapy Workforce Similar to Physical Therapists workforce, the Commonwealth’s current Occupational Therapist workforce appears sufficient when compared to national, regional, and contiguous state benchmarks (Figure 74). Currently, the Commonwealth has an estimated surplus of 307 OT’s or 15% of total OT workforce. (Note: The large discrepancy between Kentucky’s reported occupational workforce compared to the statistic sourced from the Bureau of Labor Statistics (BLS) may be due to BLS’s extrapolation methodology).
322 Figure 1, Zimbelman, J. “Physical therapy workforce in the United States: Forecasting Nationwide Shortages.” The American Academy of Physical Medicine and Rehabilitation. (2010). pg. 1025; Figure 2, pg. 1026 323 PT Shortage based on 2008 data and calculated using: [(PT Demand-PT Supply)/Population]*104. Refer to source for PT Supply and PT Demand methodology

The Commonwealth of Kentucky Health Care Facility Capacity Report, 2013 113
Figure 74: Comparison of the Commonwealth's Occupational Therapy Supply versus National, Regional, and Contiguous States324 325 326 327 328
Notwithstanding a current potential surplus of occupational therapists, trends in occupational therapy may indicate a potential shortfall of occupational therapists in the future. An article by the American Occupational Therapy Association surveyed healthcare facilities that currently employ occupational therapists to gain a better understanding of workforce supply trends.329 The study reported that vacancies for occupational therapists existed across the nation, with the greater job vacancies occurring in the West (Table 21). The report projected that current vacancies may likely perpetuate and cited shortage of qualified occupational therapists as the primary cause for vacancies.
Table 21: OT Vacancies Percentage vs. Budgeted FTE Positions
Vacancies Percentage vs. Budgeted FTE330 331
Region332 Occupational Therapists Occupational Therapy Assistants
U.S Sample 8.9% 7.7% Northeast 6.5% 8.7% South 8.3% 11.3%
Midwest 8.7% 4.3% West 11.9% 5.5%
324 Kentucky residence was determined based on licensing state; Source: 2013 Kentucky Board of Occupational Therapists licensure list 325 All Non-Kentucky benchmark data was sourced from Bureau of Labor Statistics (BLS), Healthcare Practitioner and Technical Occupations Profiles, 2012. 326 All state benchmarks were calculated using the total number of Occupational Therapists and standardized to per 100,000 population rate 327 Contiguous state and HHS-Region 4 benchmarks were calculated using a weighted average of total Occupational Therapists and respective state population for each region 328 Bureau of Labor Statistics (BLS) calculates benchmarks using a sample of data collected from a biannual survey data over a 3 year period. 329 Powell, J.M., Kanny, E. M., & Ciol, M.A. “State of the occupational therapy workforce: Results of a national study. American Journal of Occupational Therapy.” (2008) pp. 62, 97-105. 330 Table 2, Powell, J.M., Kanny, E. M., & Ciol, M.A. “State of the occupational therapy workforce: Results of a national study.” American Journal of Occupational Therapy. (2008) pp. 62, 97-105. Table 2 pg. 100. 331 Vacancy= (# of FTE equivalent vacant positions/ #FTE budgeted positions) 332 Regions based on the US Census Bureau Regional Definitions
A 2010 study by the American Occupational Therapy Association indicates current vacancies in occupational therapy positions that are predicted to remain in the long run
Powell, J.M., Kanny, E. M., & Ciol, M.A., 2008
The Commonwealth of Kentucky Health Care Facility Capacity Report, 2013 114
Job vacancies and projections reported in this survey may be related to overall trends observed in the occupational therapy workforce. The American Association of Occupational Therapy’s 2010-2011 Academic Programs Annual Data Report indicates that despite a current enrollment of 93% in occupational therapy programs, the number of accredited occupational therapy programs has decreased consistently over the last 5 years.333 Furthermore, according to the Bureau of Labor Statistics, there may be up to a 33% projected increase in the demand for Occupational Therapists by the year 2020.334 The projected increase in demand coupled with a shrinking number of accredited occupational therapy programs may accentuate the workforce situation across the nation and, specifically, also impact the Commonwealth’s occupational therapy workforce.
13.4 Next Steps for Consideration Given the aging population requiring services rendered by physical and occupational therapists as well as the projected increase in demand for those providers, the Commonwealth should consider workforce measures to accommodate for potential future capacity constraints. Specific workforce measures could include:
• Increase reimbursement for PT and OT to attract more professionals and increase attractiveness of training
• Consider loan forgiveness programs for PT and OT graduates in order to lessen the financial burden of entering the field
• Further increase availability of and/or develop advanced degree programs (e.g., Doctor in Physical Therapy, DPT) to increase the profession’s status and attract graduate level talent to the Commonwealth
• Recruit candidates nationally and internationally to fill vacancies, potentially leveraging a Health Professionals Shortage Area model
13.5 Potential Challenges • There may not be an immediate urgency to accommodate for future shortages in occupational
therapists and physical therapists, given the Commonwealth’s current supply appears in line with the national benchmark. Anticipatory measures for PT and OT may therefore be deprioritized relative to more urgent workforce tasks.
• Some of the recommended measures to bolster the PT and OT workforce may be beyond the purview of the Cabinet (e.g., increasing commercial or Medicare reimbursement, developing academic programs, etc.) Therefore, these measures will require collaboration between different government entities and governing bodies of PT and OT.
333 American Occupational Therapy Association, 2010-2011 Academic Programs Annual Data Report, “Trends in Accredited Programs.” Accessed at: http://www.aota.org/~/media/Corporate/Files/EducationCareers/Accredit/47682/2010-2011-Annual-Data-Report.ashx 334 Bureau of Labor Statistics, Occupational Therapist Profile. Accessed at: http://www.bls.gov/ooh/healthcare/occupational-therapists.htm
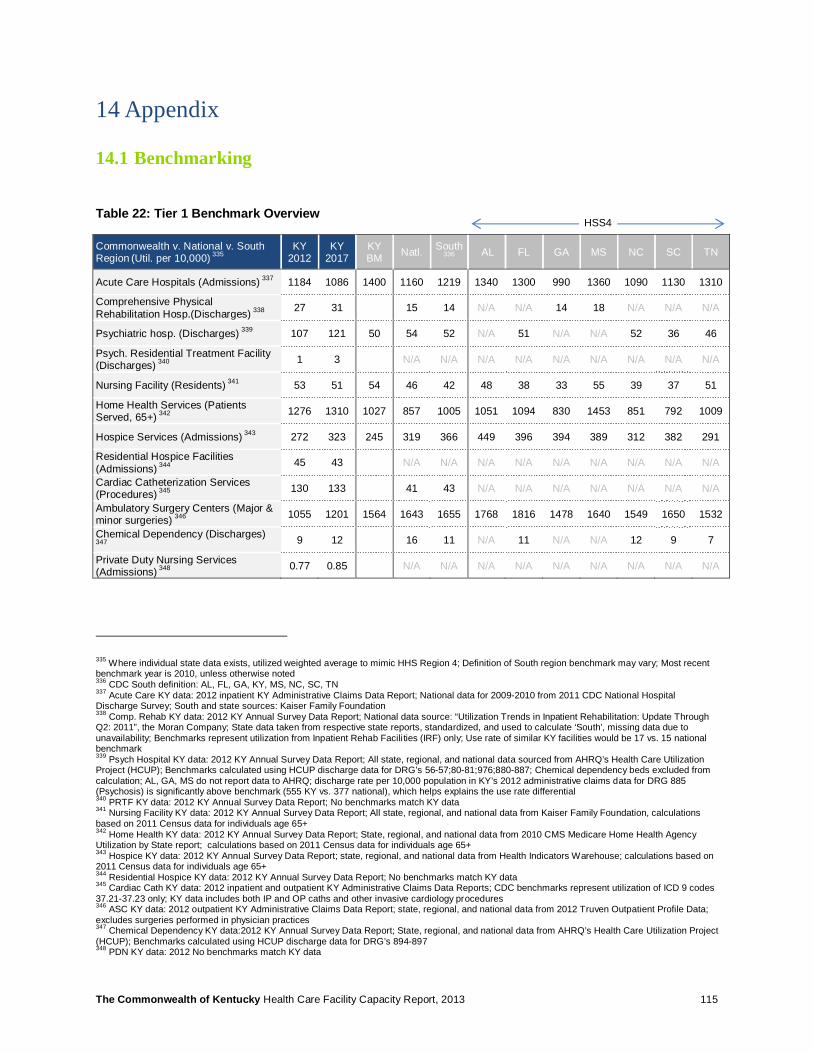
The Commonwealth of Kentucky Health Care Facility Capacity Report, 2013 115
14 Appendix
14.1 Benchmarking
Table 22: Tier 1 Benchmark Overview
Commonwealth v. National v. South Region
(Util. per 10,000) 335
KY 2012
KY 2017
KY BM Natl. South
336 AL FL GA MS NC SC TN
Acute Care Hospitals (Admissions) 337 1184 1086 1400 1160 1219 1340 1300 990 1360 1090 1130 1310
Comprehensive Physical Rehabilitation Hosp.(Discharges) 338 27 31 15 14 N/A N/A 14 18 N/A N/A N/A
Psychiatric hosp. (Discharges) 339 107 121 50 54 52 N/A 51 N/A N/A 52 36 46
Psych. Residential Treatment Facility (Discharges) 340 1 3 N/A N/A N/A N/A N/A N/A N/A N/A N/A
Nursing Facility (Residents) 341 53 51 54 46 42 48 38 33 55 39 37 51
Home Health Services (Patients Served, 65+)
342 1276 1310 1027 857 1005 1051 1094 830 1453 851 792 1009
Hospice Services (Admissions) 343 272 323 245 319 366 449 396 394 389 312 382 291
Residential Hospice Facilities (Admissions) 344 45 43 N/A N/A N/A N/A N/A N/A N/A N/A N/A
Cardiac Catheterization Services (Procedures) 345 130 133 41 43 N/A N/A N/A N/A N/A N/A N/A
Ambulatory Surgery Centers (Major & minor surgeries) 346 1055 1201 1564 1643 1655 1768 1816 1478 1640 1549 1650 1532
Chemical Dependency (Discharges)
347 9 12 16 11 N/A 11 N/A N/A 12 9 7
Private Duty Nursing Services (Admissions) 348 0.77 0.85 N/A N/A N/A N/A N/A N/A N/A N/A N/A
335 Where individual state data exists, utilized weighted average to mimic HHS Region 4; Definition of South region benchmark may vary; Most recent benchmark year is 2010, unless otherwise noted 336 CDC South definition: AL, FL, GA, KY, MS, NC, SC, TN 337 Acute Care KY data: 2012 inpatient KY Administrative Claims Data Report; National data for 2009-2010 from 2011 CDC National Hospital Discharge Survey; South and state sources: Kaiser Family Foundation 338 Comp. Rehab KY data: 2012 KY Annual Survey Data Report; National data source: “Utilization Trends in Inpatient Rehabilitation: Update Through Q2: 2011”, the Moran Company; State data taken from respective state reports, standardized, and used to calculate ‘South’, missing data due to unavailability; Benchmarks represent utilization from Inpatient Rehab Facili ties (IRF) only; Use rate of similar KY facilities would be 17 vs. 15 national benchmark 339 Psych Hospital KY data: 2012 KY Annual Survey Data Report; All state, regional, and national data sourced from AHRQ’s Health Care Utilization Project (HCUP); Benchmarks calculated using HCUP discharge data for DRG’s 56-57;80-81;976;880-887; Chemical dependency beds excluded from calculation; AL, GA, MS do not report data to AHRQ; discharge rate per 10,000 population in KY’s 2012 administrative claims data for DRG 885 (Psychosis) is significantly above benchmark (555 KY vs. 377 national), which helps explains the use rate differential 340 PRTF KY data: 2012 KY Annual Survey Data Report; No benchmarks match KY data 341 Nursing Facility KY data: 2012 KY Annual Survey Data Report; All state, regional, and national data from Kaiser Family Foundation, calculations based on 2011 Census data for individuals age 65+ 342 Home Health KY data: 2012 KY Annual Survey Data Report; State, regional, and national data from 2010 CMS Medicare Home Health Agency Utilization by State report; calculations based on 2011 Census data for individuals age 65+ 343 Hospice KY data: 2012 KY Annual Survey Data Report; state, regional, and national data from Health Indicators Warehouse; calculations based on 2011 Census data for individuals age 65+ 344 Residential Hospice KY data: 2012 KY Annual Survey Data Report; No benchmarks match KY data 345 Cardiac Cath KY data: 2012 inpatient and outpatient KY Administrative Claims Data Reports; CDC benchmarks represent utilization of ICD 9 codes 37.21-37.23 only; KY data includes both IP and OP caths and other invasive cardiology procedures 346 ASC KY data: 2012 outpatient KY Administrative Claims Data Report; state, regional, and national data from 2012 Truven Outpatient Profile Data; excludes surgeries performed in physician practices 347 Chemical Dependency KY data:2012 KY Annual Survey Data Report; State, regional, and national data from AHRQ’s Health Care Utilization Project (HCUP); Benchmarks calculated using HCUP discharge data for DRG’s 894-897 348 PDN KY data: 2012 No benchmarks match KY data
HSS4
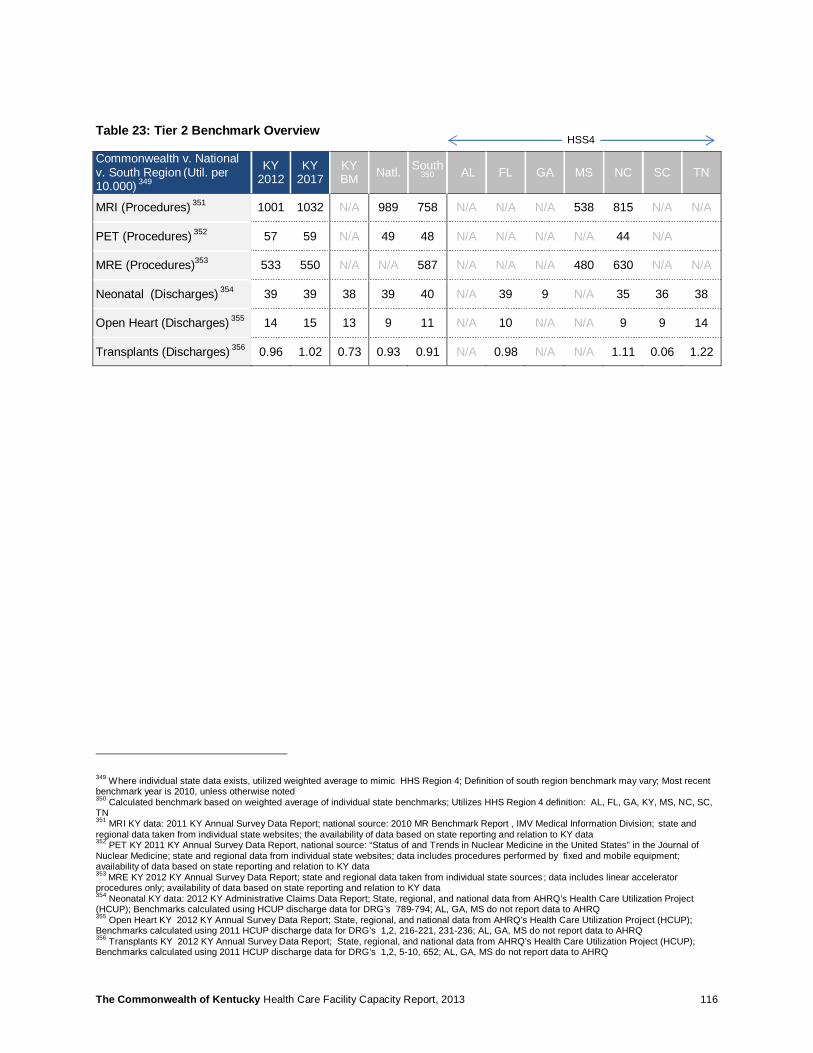
The Commonwealth of Kentucky Health Care Facility Capacity Report, 2013 116
Table 23: Tier 2 Benchmark Overview
Commonwealth v. National v. South Region
(Util. per
10.000) 349
KY 2012
KY 2017
KY BM Natl. South
350 AL FL GA MS NC SC TN
MRI (Procedures) 351 1001 1032 N/A 989 758 N/A N/A N/A 538 815 N/A N/A
PET (Procedures) 352 57 59 N/A 49 48 N/A N/A N/A N/A 44 N/A
MRE (Procedures)353 533 550 N/A N/A 587 N/A N/A N/A 480 630 N/A N/A
Neonatal (Discharges) 354 39 39 38 39 40 N/A 39 9 N/A 35 36 38
Open Heart (Discharges) 355 14 15 13 9 11 N/A 10 N/A N/A 9 9 14
Transplants (Discharges) 356 0.96 1.02 0.73 0.93 0.91 N/A 0.98 N/A N/A 1.11 0.06 1.22
349 Where individual state data exists, utilized weighted average to mimic HHS Region 4; Definition of south region benchmark may vary; Most recent benchmark year is 2010, unless otherwise noted 350 Calculated benchmark based on weighted average of individual state benchmarks; Utilizes HHS Region 4 definition: AL, FL, GA, KY, MS, NC, SC, TN 351 MRI KY data: 2011 KY Annual Survey Data Report; national source: 2010 MR Benchmark Report , IMV Medical Information Division; state and regional data taken from individual state websites; the availability of data based on state reporting and relation to KY data 352
PET KY 2011 KY Annual Survey Data Report, national source: “Status of and Trends in Nuclear Medicine in the United States” in the Journal of Nuclear Medicine; state and regional data from individual state websites; data includes procedures performed by fixed and mobile equipment; availability of data based on state reporting and relation to KY data 353 MRE KY 2012 KY Annual Survey Data Report; state and regional data taken from individual state sources ; data includes linear accelerator procedures only; availability of data based on state reporting and relation to KY data 354 Neonatal KY data: 2012 KY Administrative Claims Data Report; State, regional, and national data from AHRQ’s Health Care Utilization Project (HCUP); Benchmarks calculated using HCUP discharge data for DRG’s 789-794; AL, GA, MS do not report data to AHRQ 355 Open Heart KY 2012 KY Annual Survey Data Report; State, regional, and national data from AHRQ’s Health Care Utilization Project (HCUP); Benchmarks calculated using 2011 HCUP discharge data for DRG’s 1,2, 216-221, 231-236; AL, GA, MS do not report data to AHRQ 356 Transplants KY 2012 KY Annual Survey Data Report; State, regional, and national data from AHRQ’s Health Care Utilization Project (HCUP); Benchmarks calculated using 2011 HCUP discharge data for DRG’s 1,2, 5-10, 652; AL, GA, MS do not report data to AHRQ
HSS4
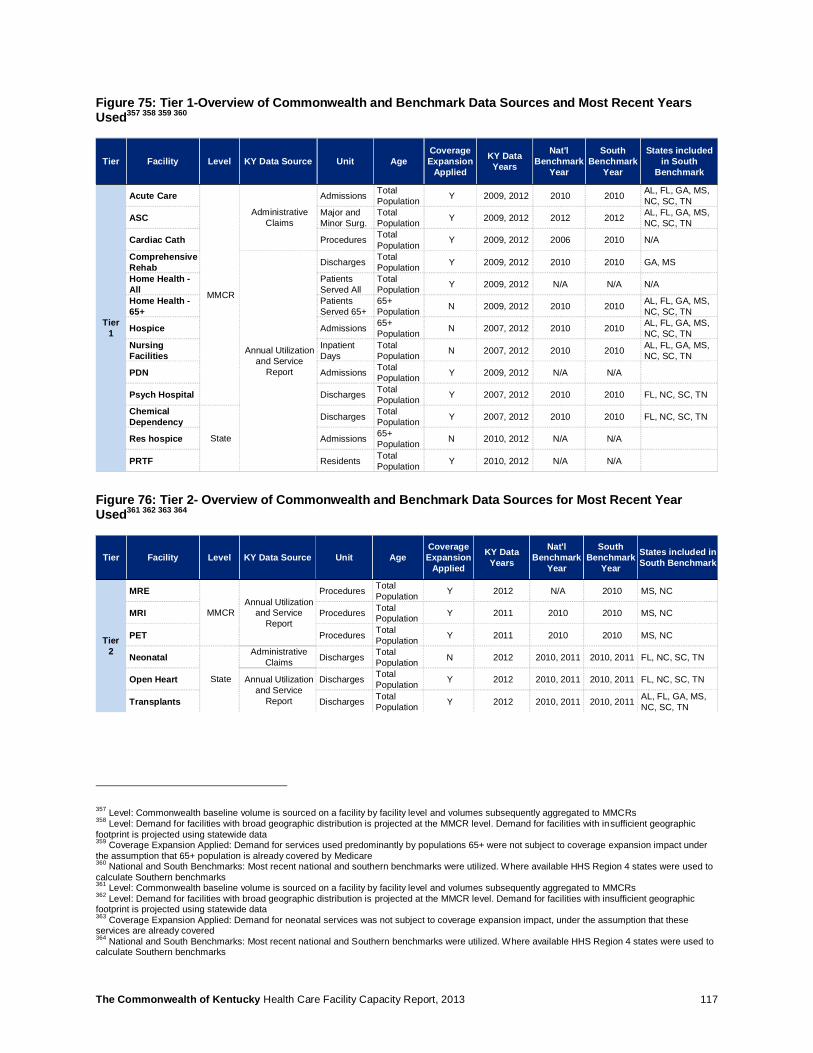
The Commonwealth of Kentucky Health Care Facility Capacity Report, 2013 117
Figure 75: Tier 1-Overview of Commonwealth and Benchmark Data Sources and Most Recent Years Used357 358 359 360
Figure 76: Tier 2- Overview of Commonwealth and Benchmark Data Sources for Most Recent Year Used361 362 363 364
357 Level: Commonwealth baseline volume is sourced on a facility by facility level and volumes subsequently aggregated to MMCRs 358 Level: Demand for facilities with broad geographic distribution is projected at the MMCR level. Demand for facilities with insufficient geographic footprint is projected using statewide data 359 Coverage Expansion Applied: Demand for services used predominantly by populations 65+ were not subject to coverage expansion impact under the assumption that 65+ population is already covered by Medicare 360 National and South Benchmarks: Most recent national and southern benchmarks were utilized. Where available HHS Region 4 states were used to calculate Southern benchmarks 361 Level: Commonwealth baseline volume is sourced on a facility by facility level and volumes subsequently aggregated to MMCRs 362 Level: Demand for facilities with broad geographic distribution is projected at the MMCR level. Demand for facilities with insufficient geographic footprint is projected using statewide data 363 Coverage Expansion Applied: Demand for neonatal services was not subject to coverage expansion impact, under the assumption that these services are already covered 364 National and South Benchmarks: Most recent national and Southern benchmarks were utilized. Where available HHS Region 4 states were used to calculate Southern benchmarks
Tier Facility Level KY Data Source Unit AgeCoverage Expansion
Applied
KY Data Years
Nat'l Benchmark
Year
South Benchmark
Year
States included in South
Benchmark
Tier1
Acute Care
MMCR
Administrative Claims
Admissions Total Population Y 2009, 2012 2010 2010 AL, FL, GA, MS,
NC, SC, TN
ASC Major and Minor Surg.
Total Population Y 2009, 2012 2012 2012 AL, FL, GA, MS,
NC, SC, TN
Cardiac Cath Procedures Total Population Y 2009, 2012 2006 2010 N/A
Comprehensive Rehab
Annual Utilization and Service
Report
Discharges Total Population Y 2009, 2012 2010 2010 GA, MS
Home Health -All
Patients Served All
Total Population Y 2009, 2012 N/A N/A N/A
Home Health -65+
Patients Served 65+
65+ Population N 2009, 2012 2010 2010 AL, FL, GA, MS,
NC, SC, TN
Hospice Admissions 65+ Population N 2007, 2012 2010 2010 AL, FL, GA, MS,
NC, SC, TNNursing Facilities
Inpatient Days
Total Population N 2007, 2012 2010 2010 AL, FL, GA, MS,
NC, SC, TN
PDN Admissions Total Population Y 2009, 2012 N/A N/A
Psych Hospital Discharges Total Population Y 2007, 2012 2010 2010 FL, NC, SC, TN
Chemical Dependency
State
Discharges Total Population Y 2007, 2012 2010 2010 FL, NC, SC, TN
Res hospice Admissions 65+ Population N 2010, 2012 N/A N/A
PRTF Residents Total Population Y 2010, 2012 N/A N/A
Tier Facility Level KY Data Source Unit AgeCoverage Expansion
Applied
KY Data Years
Nat'l Benchmark
Year
South Benchmark
Year
States included in South Benchmark
Tier 2
MRE
MMCRAnnual Utilization
and Service Report
Procedures Total Population Y 2012 N/A 2010 MS, NC
MRI Procedures Total Population Y 2011 2010 2010 MS, NC
PET Procedures Total Population Y 2011 2010 2010 MS, NC
Neonatal
State
Administrative Claims Discharges Total
Population N 2012 2010, 2011 2010, 2011 FL, NC, SC, TN
Open Heart Annual Utilization and Service
Report
Discharges Total Population Y 2012 2010, 2011 2010, 2011 FL, NC, SC, TN
Transplants Discharges Total Population Y 2012 2010, 2011 2010, 2011 AL, FL, GA, MS,
NC, SC, TN
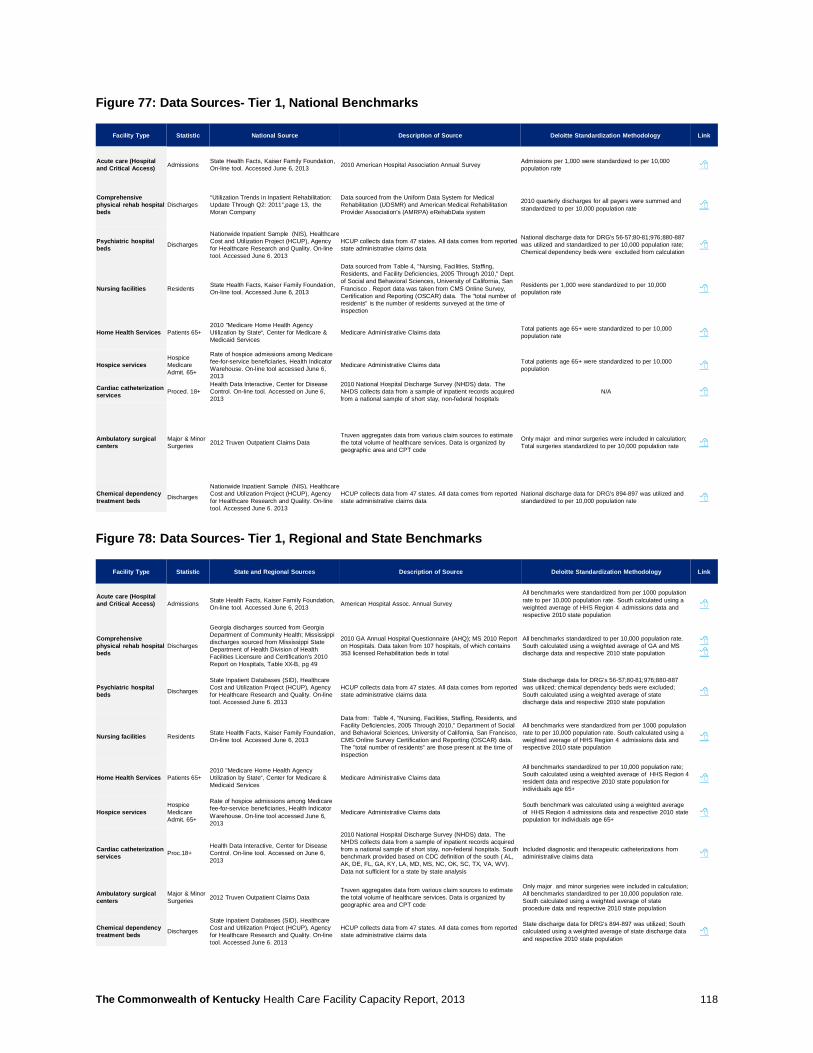
The Commonwealth of Kentucky Health Care Facility Capacity Report, 2013 118
Figure 77: Data Sources- Tier 1, National Benchmarks
Figure 78: Data Sources- Tier 1, Regional and State Benchmarks
Facility Type Statistic National Source Description of Source Deloitte Standardization Methodology Link
Acute care (Hospital and Critical Access) Admissions State Health Facts, Kaiser Family Foundation,
On-line tool. Accessed June 6, 2013 2010 American Hospital Association Annual Survey Admissions per 1,000 were standardized to per 10,000 population rate 8
Comprehensive physical rehab hospital beds
Discharges“Utilization Trends in Inpatient Rehabilitation: Update Through Q2: 2011”,page 13, the Moran Company
Data sourced from the Uniform Data System for Medical Rehabilitation (UDSMR) and American Medical Rehabilitation Provider Association's (AMRPA) eRehabData system
2010 quarterly discharges for all payers were summed and standardized to per 10,000 population rate 8
Psychiatric hospital beds Discharges
Nationwide Inpatient Sample (NIS), Healthcare Cost and Utilization Project (HCUP), Agency for Healthcare Research and Quality. On-line tool. Accessed June 6. 2013
HCUP collects data from 47 states. All data comes from reported state administrative claims data
National discharge data for DRG's 56-57;80-81;976;880-887 was utilized and standardized to per 10,000 population rate; Chemical dependency beds were excluded from calculation
8
Nursing facilities Residents State Health Facts, Kaiser Family Foundation, On-line tool. Accessed June 6, 2013
Data sourced from Table 4, "Nursing, Facilities, Staffing, Residents, and Facility Deficiencies, 2005 Through 2010," Dept. of Social and Behavioral Sciences, University of California, San Francisco . Report data was taken from CMS Online Survey, Certification and Reporting (OSCAR) data. The "total number of residents" is the number of residents surveyed at the time of inspection
Residents per 1,000 were standardized to per 10,000 population rate 8
Home Health Services Patients 65+2010 "Medicare Home Health Agency Utilization by State“, Center for Medicare & Medicaid Services
Medicare Administrative Claims data Total patients age 65+ were standardized to per 10,000 population rate 8
Hospice servicesHospice Medicare Admit. 65+
Rate of hospice admissions among Medicare fee-for-service beneficiaries, Health Indicator Warehouse. On-line tool accessed June 6, 2013
Medicare Administrative Claims data Total patients age 65+ were standardized to per 10,000 population 8
Cardiac catheterization services Proced. 18+
Health Data Interactive, Center for Disease Control. On-line tool. Accessed on June 6, 2013
2010 National Hospital Discharge Survey (NHDS) data. The NHDS collects data from a sample of inpatient records acquired from a national sample of short stay, non-federal hospitals
N/A 8
Ambulatory surgical centers
Major & Minor Surgeries 2012 Truven Outpatient Claims Data
Truven aggregates data from various claim sources to estimate the total volume of healthcare services. Data is organized by geographic area and CPT code
Only major and minor surgeries were included in calculation; Total surgeries standardized to per 10,000 population rate 8
Chemical dependency treatment beds Discharges
Nationwide Inpatient Sample (NIS), Healthcare Cost and Utilization Project (HCUP), Agency for Healthcare Research and Quality. On-line tool. Accessed June 6. 2013
HCUP collects data from 47 states. All data comes from reported state administrative claims data
National discharge data for DRG's 894-897 was utilized and standardized to per 10,000 population rate 8
Facility Type Statistic State and Regional Sources Description of Source Deloitte Standardization Methodology Link
Acute care (Hospital and Critical Access) Admissions State Health Facts, Kaiser Family Foundation,
On-line tool. Accessed June 6, 2013 American Hospital Assoc. Annual Survey
All benchmarks were standardized from per 1000 population rate to per 10,000 population rate. South calculated using a weighted average of HHS Region 4 admissions data and respective 2010 state population
8
Comprehensive physical rehab hospital beds
Discharges
Georgia discharges sourced from Georgia Department of Community Health; Mississippi discharges sourced from Mississippi State Department of Health Division of Health Facilities Licensure and Certification's 2010 Report on Hospitals, Table XX-B, pg 49
2010 GA Annual Hospital Questionnaire (AHQ); MS 2010 Report on Hospitals. Data taken from 107 hospitals, of which contains 353 licensed Rehabilitation beds in total
All benchmarks standardized to per 10,000 population rate. South calculated using a weighted average of GA and MS discharge data and respective 2010 state population
88
Psychiatric hospital beds Discharges
State Inpatient Databases (SID), Healthcare Cost and Utilization Project (HCUP), Agency for Healthcare Research and Quality. On-line tool. Accessed June 6. 2013
HCUP collects data from 47 states. All data comes from reported state administrative claims data
State discharge data for DRG's 56-57;80-81;976;880-887 was utilized; chemical dependency beds were excluded; South calculated using a weighted average of state discharge data and respective 2010 state population
8
Nursing facilities Residents State Health Facts, Kaiser Family Foundation, On-line tool. Accessed June 6, 2013
Data from: Table 4, "Nursing, Facilities, Staffing, Residents, and Facility Deficiencies, 2005 Through 2010," Department of Social and Behavioral Sciences, University of California, San Francisco, CMS Online Survey Certification and Reporting (OSCAR) data. The "total number of residents” are those present at the time of inspection
All benchmarks were standardized from per 1000 population rate to per 10,000 population rate. South calculated using a weighted average of HHS Region 4 admissions data and respective 2010 state population
8
Home Health Services Patients 65+2010 "Medicare Home Health Agency Utilization by State“, Center for Medicare & Medicaid Services
Medicare Administrative Claims data
All benchmarks standardized to per 10,000 population rate; South calculated using a weighted average of HHS Region 4 resident data and respective 2010 state population for individuals age 65+
8
Hospice servicesHospice Medicare Admit. 65+
Rate of hospice admissions among Medicare fee-for-service beneficiaries, Health Indicator Warehouse. On-line tool accessed June 6, 2013
Medicare Administrative Claims data South benchmark was calculated using a weighted average of HHS Region 4 admissions data and respective 2010 state population for individuals age 65+
8
Cardiac catheterization services Proc.18+
Health Data Interactive, Center for Disease Control. On-line tool. Accessed on June 6, 2013
2010 National Hospital Discharge Survey (NHDS) data. The NHDS collects data from a sample of inpatient records acquired from a national sample of short stay, non-federal hospitals. South benchmark provided based on CDC definition of the south ( AL, AK, DE, FL, GA, KY, LA, MD, MS, NC, OK, SC, TX, VA, WV). Data not sufficient for a state by state analysis
Included diagnostic and therapeutic catheterizations from administrative claims data 8
Ambulatory surgical centers
Major & Minor Surgeries 2012 Truven Outpatient Claims Data
Truven aggregates data from various claim sources to estimate the total volume of healthcare services. Data is organized by geographic area and CPT code
Only major and minor surgeries were included in calculation; All benchmarks standardized to per 10,000 population rate. South calculated using a weighted average of state procedure data and respective 2010 state population
Chemical dependency treatment beds Discharges
State Inpatient Databases (SID), Healthcare Cost and Utilization Project (HCUP), Agency for Healthcare Research and Quality. On-line tool. Accessed June 6. 2013
HCUP collects data from 47 states. All data comes from reported state administrative claims data
State discharge data for DRG's 894-897 was utilized; South calculated using a weighted average of state discharge data and respective 2010 state population
8
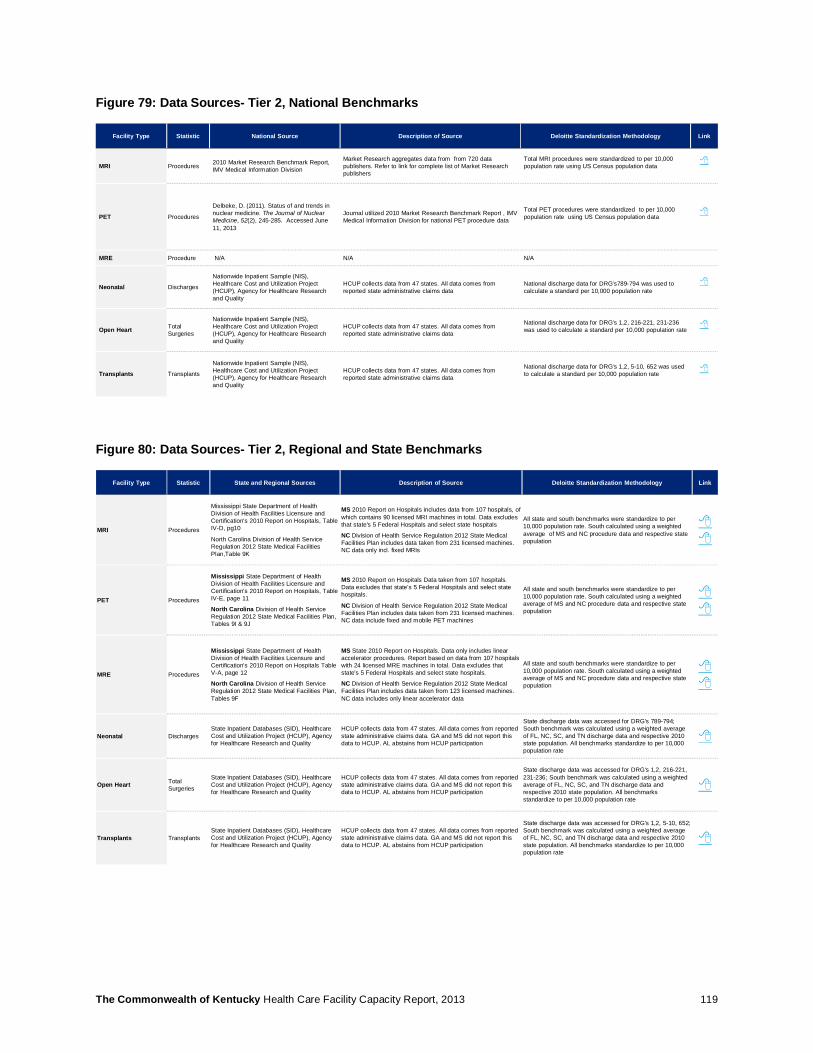
The Commonwealth of Kentucky Health Care Facility Capacity Report, 2013 119
Figure 79: Data Sources- Tier 2, National Benchmarks
Figure 80: Data Sources- Tier 2, Regional and State Benchmarks
Facility Type Statistic National Source Description of Source Deloitte Standardization Methodology Link
MRI Procedures 2010 Market Research Benchmark Report, IMV Medical Information Division
Market Research aggregates data from from 720 data publishers. Refer to link for complete list of Market Research publishers
Total MRI procedures were standardized to per 10,000 population rate using US Census population data
8
PET Procedures
Delbeke, D. (2011). Status of and trends in nuclear medicine. The Journal of Nuclear Medicine, 52(2), 245-285. Accessed June 11, 2013
Journal utilized 2010 Market Research Benchmark Report , IMV Medical Information Division for national PET procedure data
Total PET procedures were standardized to per 10,000 population rate using US Census population data
8
MRE Procedure N/A N/A N/A
Neonatal Discharges
Nationwide Inpatient Sample (NIS), Healthcare Cost and Utilization Project (HCUP), Agency for Healthcare Research and Quality
HCUP collects data from 47 states. All data comes from reported state administrative claims data
National discharge data for DRG's789-794 was used to calculate a standard per 10,000 population rate
8
Open Heart Total Surgeries
Nationwide Inpatient Sample (NIS), Healthcare Cost and Utilization Project (HCUP), Agency for Healthcare Research and Quality
HCUP collects data from 47 states. All data comes from reported state administrative claims data
National discharge data for DRG's 1,2, 216-221, 231-236 was used to calculate a standard per 10,000 population rate
8
Transplants Transplants
Nationwide Inpatient Sample (NIS), Healthcare Cost and Utilization Project (HCUP), Agency for Healthcare Research and Quality
HCUP collects data from 47 states. All data comes from reported state administrative claims data
National discharge data for DRG's 1,2, 5-10, 652 was used to calculate a standard per 10,000 population rate
8
Facility Type Statistic State and Regional Sources Description of Source Deloitte Standardization Methodology Link
MRI Procedures
Mississippi State Department of Health Division of Health Facilities Licensure and Certification's 2010 Report on Hospitals, Table IV-D, pg10
North Carolina Division of Health Service Regulation 2012 State Medical Facilities Plan,Table 9K
MS 2010 Report on Hospitals includes data from 107 hospitals, of which contains 90 licensed MRI machines in total. Data excludes that state's 5 Federal Hospitals and select state hospitals
NC Division of Health Service Regulation 2012 State Medical Facilities Plan includes data taken from 231 licensed machines. NC data only incl. fixed MRIs
All state and south benchmarks were standardize to per 10,000 population rate. South calculated using a weighted average of MS and NC procedure data and respective state population
88
PET Procedures
Mississippi State Department of Health Division of Health Facilities Licensure and Certification's 2010 Report on Hospitals, TableIV-E, page 11
North Carolina Division of Health Service Regulation 2012 State Medical Facilities Plan, Tables 9I & 9J
MS 2010 Report on Hospitals Data taken from 107 hospitals. Data excludes that state's 5 Federal Hospitals and select state hospitals.
NC Division of Health Service Regulation 2012 State Medical Facilities Plan includes data taken from 231 licensed machines. NC data include fixed and mobile PET machines
All state and south benchmarks were standardize to per 10,000 population rate. South calculated using a weighted average of MS and NC procedure data and respective state population
88
MRE Procedures
Mississippi State Department of Health Division of Health Facilities Licensure and Certification's 2010 Report on Hospitals Table V-A, page 12
North Carolina Division of Health Service Regulation 2012 State Medical Facilities Plan,Tables 9F
MS State 2010 Report on Hospitals. Data only includes linear accelerator procedures. Report based on data from 107 hospitalswith 24 licensed MRE machines in total. Data excludes that state's 5 Federal Hospitals and select state hospitals.
NC Division of Health Service Regulation 2012 State Medical Facilities Plan includes data taken from 123 licensed machines. NC data includes only linear accelerator data
All state and south benchmarks were standardize to per 10,000 population rate. South calculated using a weighted average of MS and NC procedure data and respective state population
88
Neonatal DischargesState Inpatient Databases (SID), Healthcare Cost and Utilization Project (HCUP), Agency for Healthcare Research and Quality
HCUP collects data from 47 states. All data comes from reported state administrative claims data. GA and MS did not report this data to HCUP. AL abstains from HCUP participation
State discharge data was accessed for DRG's 789-794; South benchmark was calculated using a weighted average of FL, NC, SC, and TN discharge data and respective 2010state population. All benchmarks standardize to per 10,000 population rate
8
Open Heart Total Surgeries
State Inpatient Databases (SID), Healthcare Cost and Utilization Project (HCUP), Agency for Healthcare Research and Quality
HCUP collects data from 47 states. All data comes from reported state administrative claims data. GA and MS did not report this data to HCUP. AL abstains from HCUP participation
State discharge data was accessed for DRG's 1,2, 216-221, 231-236; South benchmark was calculated using a weighted average of FL, NC, SC, and TN discharge data and respective 2010 state population. All benchmarks standardize to per 10,000 population rate
8
Transplants TransplantsState Inpatient Databases (SID), Healthcare Cost and Utilization Project (HCUP), Agency for Healthcare Research and Quality
HCUP collects data from 47 states. All data comes from reported state administrative claims data. GA and MS did not report this data to HCUP. AL abstains from HCUP participation
State discharge data was accessed for DRG's 1,2, 5-10, 652; South benchmark was calculated using a weighted average of FL, NC, SC, and TN discharge data and respective 2010state population. All benchmarks standardize to per 10,000 population rate
8

The Commonwealth of Kentucky Health Care Facility Capacity Report, 2013 120
14.2 Acknowledgments Special thanks to the members of the Office of Kentucky Health Benefit Exchange, the Office of Health Policy, the Department of Medicaid Services, the Division of Behavioral Health, and the Department for Public Health who contributed to the development and review of this report.
About Deloitte Deloitte refers to one or more of Deloitte Touche Tohmatsu Limited, a UK private company limited by guarantee, and its network of member firms, each of which is a legally separate and independent entity. Please see www.deloitte.com/about for a detailed description of the legal structure of Deloitte Touche Tohmatsu Limited and its member firms. Please see www.deloitte.com/us/about for a detailed description of the legal structure of Deloitte LLP and its subsidiaries. Certain services may not be available to attest clients under the rules and regulations of public accounting.
Copyright © 2013 Deloitte Development LLC. All rights reserved. Member of Deloitte Touche Tohmatsu Limited