theme: industrial pollution and policy eerc working … ntpc, dadri and iffco, phulpur, and the...
TRANSCRIPT

EERC
Internalisation of Wastes in Industrial Plants: A Study of the Techno Economic Scope of Two Plants
Bhaskar Mujumder
GB Pant Institute of Social Science, Allahabad
Theme: Industrial Pollution and PolicyEERC Working Paper Series: IPP-9
MOEF IGIDR WORLD BANK
Internalisation of Wastes in Industrial Plants: A Study of the Techno Economic Scope of Two Plants
Bhaskar Mujumder
GB Pant Institute of Social Science, Allahabad
Prepared for ENVIRONMENTAL ECONOMICS RESEARCH COMMITTEE
Under The World Bank Aided
“India: Environmental Management Capacity Building Technical Assistance Project”
Ministry of Environment and Forests
Indira Gandhi Institute of Development Research Goregaon (East), Mumbai - 400065 (India)

iii
Contents Project Team ivPreface vAcknowledgement vi List of Tables viii List of Boxes x List of Figures xi List of Photographs xii List of Location Maps xiii Executive Summary xiv Chapter 1 Industrialization: Some Environment-Related Issues 1-6 Chapter 2 Generation of Industrial Wastes: Disposal and Dumping of Fly Ash 7-16 Chapter 3 Internalization of Industrial Wastes: The Case of Fly Ash 17-30 Chapter 4 Internalization of Fly Ash: A Study of IFFCO, Phulpur Unit,
Allahabad, Uttar Pradesh 31-63
Chapter 5 Internalization of Fly Ash: A Study of NTPC, Dadri Unit, Gautam Buddha Nagar, Uttar Pradesh
64-103
Chapter 6 Fly Ash: Generation, Management, Utilization, and Possibility of Reduction of Ash Content in Selected Plants
104-114
Chapter 7 Cost-Benefit Analysis on Retaining Fly Ash vis-a-vis its Alternative Uses
115-125
Chapter 8 Policy Recommendations 126-128 References 129-130 Appendix 1 Notification, MOE & F, GOI. 131-133 Appendix 2 Table: Crop Pattern in Selected Villages, Adjoining Area of IFFCO,
Phulpur 134
iv
Project Team
Principal Investigator
Bhaskar Majumder
Team Members
Sri. M.G. Gupta
Sri. Gyan Nath Jha Sri. Ashok Kumar Dwivedi
Sri. Sandip Kumar Jaiswal
Consultants
Prof. Alok Gupta, University of Allahabad, Allahabad
Prof. B.K. Dutta, University of Calcutta, Calcutta
v
Preface
The Final Report on the project “Internalization of Wastes in Industrial Plants, A
Study of the Techno-Economic Scope in Two Plants” that we are going the submit to
the Core Unit, “Indira Gandhi Institute of Development Research”, is a project under
“India : Environmental Management Capacity Building Technical Assistance Project”.
This Report is only a part of a bigger project, namely, EMCaB of the Ministry of
Environment and Forests, Government of India, aided by the World Bank. The final
Report that we are going to submit, thus, has been supported at multi levels, in terms
of time allowed for the study, and budget sanctioned for the study. We covered in
this study only two plants. We, however, hope that the findings, the suggestions, and
the recommendations of this study will have macro implications for the national
economy.
The collection of information had been really a difficult task to fulfill the objectives
and purpose of the study. The collection of data would not have been possible
without the untiring efforts of the project team meant for this purpose. The members
of the project team took all the pains to tabulate and present data collected from the
field in accordance with the objectives of the study. The errors in interpretation of
data, and policy recommendations that followed, rest with me.
We are thankful to a number of authorities and experts on the subject that we chose
to study in this Project. At the stage of presentation of Proposal in July 15, 2000, I
got suggestions for improvement from Dr. O.P. Mathur and Dr. Usha Raghupathi, the
experts meant especially for this proposed study at that period. I am especially
grateful to Prof. Kirit Parikh of IGIDR, Mumbai, who had been expert of my Project
since it got the green signal for take off. I express my gratitude to Dr. (Mrs.) Jyoti
Parikh who had been kind enough to encourage me in pursuing this study and
allowing me time to complete it in the shape as it is now. I feel it is necessary to
mention the names of experts who offered positive suggestions for improvement of
the Report, while it was presented in July, 2000 at IGIDR, Mumbai, and in June,
2001 at Jammu University, Jammu, and in March 2002, at IGIDR, Mumbai. Among
others, they are Prof. P. Appasamy, Prof. R. Mukherjee, Prof. U. Shankar, Prof. S.
Ayengar and Sri K.K. Narang.
vi
In addition to the long list of persons and institutions mentioned in the page on
“Acknowledgment” in this Report, it will be my duty to mention the names of two
consultants appointed for the quality improvement of the Report. They are Prof. Alok
Gupta of Allahabad University and Prof. B.K. Datta of Calcutta University.
We are especially thankful to the target people as respondents to our questionnaire,
like the persons in brick plants, cement plants, the personnel in the selected plants,
namely, NTPC, Dadri and IFFCO, Phulpur, and the people settled in the adjoining
areas of the selected two plants, and also external experts. The recommendations
that we have offered in this Report relied heavily on the facts and ideas brought to
light by these target people and plants.
We are thankful to TIFAC, DST, Delhi, particularly for the kind of information that it
revealed to us. For collection of secondary data, we also relied on the Library of the
Indian Statistical Institute, Calcutta, in addition to the Library of my own Institute. The
Institute provided all the infrastructural and manpower facilities for getting the Report
complete.
May we be excused if we forget to mention the valuable services of persons and
institutions in conducting this study.
On behalf of the Project Team, I submit the Final Report of the study to the Core
Unit, the Indira Gandhi Institute of Development Research, Mumbai, for acceptance.
October 2002
G.B. Pant Social Science Institute, Allahabad – Bhaskar Majumder
vii
Acknowledgement Technical Division, IFFCO, Phulpur. Library, IFFCO, Phulpur. P.K. Kundu, General Manager, IFFCO, Phulpur. Diwakar Mishra, IFFCO, Phulpur. Librarian, IFFCO, Phulpur. V.B. Singh Chief Manager (Technical Service), IFFCO, Phulpur. A.K. Sinha, Documentation Officer, IFFCO, Phulpur. V.K. Srivastava, General Manager, NTPC, Dadri. A.K. Atrea, Sr. Manager, AU Cell, NTPC, Dadri. S.S. Malik, Manager, AU Cell, NTPC, Dadri. S.K. Shengal, Adl. Engineer, AU Cell, NTPC, Dadri. Rakesh Kumar, Sr. Manager (Env.- R&R), NTPC, Noida. Engineering Office Complex, NTPC, Noida. A.K. Mathur, Sr. Manager(Technical), AU Division, NTPC, SCOPE Complex, New Delhi. G.P. Singh, Executive Director (ED.), Northern Region, NTPC. T.S. Rajpoot, Nodal Officer, NTPC, PICUP Bhawan, Lucknow. Dr. Vimal Kumar, Director, TIFAC, New Delhi. Fly Ash Mission, New Delhi. Col. S.M. Mehta (Rtd.), Registrar, Indian School of Mines, Dhanbad. Rekha Ghose, Indian School of Mines, Dhanbad. Central Fuel Research Institute, Dhanbad. Central Mines Research Institute, Dhanbad. Mr. A.K. Jain, Chief Engineer, U.P. Pollution Control Board. Directorate of Environment, Lucknow, U.P. District Board, Allahabad. Land Reforms Department, Allahabad. Forest Ranger Office, Phulpur, Allahabad. District Board, Ghaziabad. District Board, Gautam Buddha Nagar. Environmental Unit, Satna Cement Work, Satna, M.P. J.P. Rewa Cement,Rewa, M.P. Diamond Cement, Jhansi, U.P. Pulver Ash Projects Ltd., Tribeni, West Bengal.
viii
List of Tables
2.1 Actual and Estimated Consumption of Coal and Generation of Fly Ash in Thermal Power Plants in India, 1990-2020
14
4.1 Inputs and Output of IFFCO, Phulpur, Uttar Pradesh 32 4.2 Use of Coal by IFFCO, Phulpur 32 4.3 Coal: Use and Ash Content, Fly Ash: Generation and Utilization,
IFFCO, Phulpur 35
4.4 Selected Conventional Clay Brick Plants 40 4.5 Conventional Clay Brick Plants, Selected Indicators 41 4.6 Land Price and Ownership pattern of Land Acquired by
Conventional Clay Brick Plants 41
4.7 Type and Use of Land Acquired by Conventional Clay Brick Plants 42 4.8 Seasonality, Stability and Capacity of Conventional Clay Brick
Plants 42
4.9 Use of Fly Ash in Conventional Clay Brick Plants: Awareness of the Owners of Plants
44
4.10 Mode of Transport and Transport Cost of Fly Ash 45 4.11 Conventional Clay Bricks and Fly Ash Mixed Clay Bricks: Some
Cost-Benefit Projections 46
4.12 Projections Based on Major Observations of Brick Plants 48 4.13 J.P. Rewa Cement, Rewa, M.P. (Fly Ash User): A Profile 51 4.14 Satna Cement Works, Satna, M.P. (Fly Ash User): A Profile 53 4.15 Direction-wise Settlement of Households, Adjoining Area of IFFCO,
Phulpur 55
4.16 Occupation-wise Classification of Households in the Adjoining Area of IFFCO, Phulpur
56
4.17 Education-wise Classification of Households in the Adjoining Area of IFFCO, Phulpur
59
4.18 Direction-wise Effect of Spread of Fly Ash on Agricultural Land 59 4.19 Households Surveyed in Terms of Distance from Fly Ash Dumping
Area 59
4.20 Land Quality in Areas Adjoining IFFCO, Phulpur 61 4.21 Plantations Inside IFFCO, Phulpur Through Forest Department,
Govt. of U.P. 61
5.1 Profile of NTPC, Dadri 64 5.2 Coal: Use and Ash Content, Fly Ash: Generation, Utilization, and
Dumping, NTPC, Dadri 65
5.3 Fly Ash Utilization by NTPC, Dadri 66 5.4 Infrastructure and Operating Cost for Ash Handling at NTPC, Dadri 67 5.5 Utilization of Fly Ash in Different Sectors 68 5.6 Major Fly Ash Products Produced Inside NTPC, Dadri, in 2000-01 70 5.7 Utilization of Accumulated Fly Ash (Up to March 2001), NTPC,
Dadri 70
5.8 Selected Conventional Clay Brick Plants 72
ix
5.9 Conventional Clay Brick Plants: Selected Indicators 72 5.10 Land Price and Ownership Pattern of Land Acquired by
Conventional Clay Brick Plants 73
5.11 Type and Use of Land Acquired by Conventional Clay Brick Plants 73 5.12 Seasonality, Stability, and Capacity of Conventional Clay Brick
Plants 74
5.13 Mode of Transport and Transport Cost of Fly Ash 75 5.14 Conventional Clay Bricks and Fly Ash Mixed Clay Bricks: Some
Cost-Benefit Projections 77
5.15 Projections Based on Major Observations of Brick Plants 79 5.16 Selected Fly Ash Brick Plants: A Profile 81 5.17 Fly Ash Brick Plants (Selected Indicators) 83 5.18 Raw Materials for Manufacturing Fly Ash Bricks: Sources of Raw
Materials 84
5.19 Ratios of Raw Materials Practiced for Manufacturing Fly Ash Bricks 84 5.20 Mode of Transport and Transportation Cost of Fly Ash 85 5.21 Input Cost on Raw Materials, Labour Cost, and Land Rent 85 5.22 Cost of Production of Fly Ash-Sand-Lime-Gypsum Bricks 87 5.23 Cost of Production and Market Price of Clay Bricks and Fly Ash
Bricks, Districts Allahabad and Ghaziabad, U.P. 88
5.24 Conventional Clay bricks and Fly Ash-Sand-Lime-Gypsum Bricks in Ghaziabad District: Comparison of Benefits
90
5.25 Diamond Cement, Jhansi, U.P. (Fly Ash User): A Profile 93 5.26 Households Surveyed in Terms of Distance from Fly Ash Dumping
Area 95
5.27 Direction-wise Settlement of Households, Adjoining Areas of NTPC, Dadri
95
5.28 Occupation-wise Distribution of Households in the Adjoining Areas of NTPC, Dadri
96
5.29 Education-wise Distribution of the Households in the Adjoining Areas of NTPC, Dadri
96
5.30 Direction-wise Effect of Fly Ash on Agricultural Land, Adjoining Areas of NTPC, Dadri
97
5.31 Ash Mound, NTPC, Dadri (Basic Information) 100 6.1 Major Indicators based on Utilization of Fly Ash: IFFCO, Phulpur,
and NTPC, Dadri 105
7.1 Private Cost of Disposal of Fly Ash in NTPC, Dadri 120 7.2 Social Benefits Calculated on the Basis of Dumping Areas
Acquired by NTPC, Dadri 120
7.3 Cost-Benefit Analysis of Use of Fly Ash in OPC and PPC 121 7.4 Economic Benefits in Use of Fly Ash Generated Per Year in NTPC,
Dadri: The Case of Cement Plant 122
7.5 Fly Ash Utilization in Brick Plants, Allahabad and Ghaziabad, UP 124
x
List of Boxes
2.1 Problems of Disposal of Fly Ash 12 2.2 Factors Determining Quality and Quantity of Fly Ash 13 2.3 Problems of Non-Use of Fly Ash 14 2.4 Products from Utilization of Fly Ash: Some Possibilities 16 3.1 Technology and Economy of Fly Ash Brick Production, CFRI,
Dhanbad, India 23
3.2 Utilization of Fly Ash in India 25 3.3 Relative Benefits of Fly Ash Concrete 29 4.1 Use of Fly Ash in Clay Bricks: Problems 43 4.2 Ranking of Time/Season in terms of Adverse Effect of spread of Fly
Ash in the Adjoining Area of IFFCO, Phulpur 55
4.3 Effect of Spread of Fly Ash in the Adjoining Area of IFFCO, Phulpur: Human Health
58
4.4 Agricultural Crops Which Failed to Grow in the Adjoining Area of IFFCO, Phulpur
58
4.5 Plantations in the Adjoining Area of IFFCO, Phulpur: Possibilities 58 4.6 Effect of Spread of Fly Ash in the Adjoining Area of IFFCO,
Phulpur: Human Health 59
4.7 Effect of Spread of Fly Ash in the Adjoining Area of IFFCO, Phulpur: Human Health
59
4.8 Effect of Spread of Fly Ash on Domestic Animals in the Adjoining Area of IFFCO, Phulpur
60
4.9 Diseases found in the Adjoining Area of IFFCO, Phulpur 60 4.10 Required Health Facilities for Prevention of Diseases in the
Adjoining Area of IFFCO, Phulpur 62
4.11 Suggestions for Prevention of Water-borne Adverse Effect in the Adjoining Area of IFFCO, Phulpur
62
5.1 Advantages of Dry Ash Disposal Relative to Wet Ash Disposal 69 5.2 Ash-Based Products Produced inside NTPC, Dadri (2000-2001) 69 5.3 Buyers of Fly Ash Products Produced by NTPC, Dadri 69 5.4 Non-use of Fly Ash in Conventional Clay Bricks: Reasons 75 5.5 Fly Ash Bricks: Quality (As Conveyed by Brick Plant Owners in
Areas Adjoining NTPC, Dadri) 90
5.6 Marketing of Fly Ash Bricks: Problems 91 5.7 Utilization of Fly Ash in Manufacturing Bricks: Suggestions 91 5.8 Ranking of Time/Season in Terms of Adverse Effect of Spread of
Fly Ash in the Adjoining Area of NTPC, Dadri 95
5.9 Crops Experiencing Decelerating Growth of Output 97 5.10 Effect of Spread of Fly Ash on Crop Area and Plantations, Areas
Adjoining NTPC, Dadri 97
5.11 Households Affected by Spread of Fly Ash in the Adjoining Area of NTPC, Dadri
98
5.12 Households Affected by Spread of Fly Ash in the Adjoining Area of NTPC, Dadri
98
5.13 Prevention of Diseases in the Adjoining Area of NTPC, Dadri 99 5.14 Diseases found in the Adjoining Area of NTPC, Dadri 99 5.15 Plantations on the Adjoining Areas of Ash Mound: Possibilities 99 5.16 Planning Pollution Control at the Time of Construction of Ash
Mound, NTPC, Dadri 101
5.17 Existing Measures to Minimize Dust Emissions, NTPC, Dadri 101
xi
List of Figures
4.1a Use of Coal, and Generation, Utilization and Dumping of Ash, IFFCO, Phulpur
36
4.1b Ash Content in Coal, Utilization and Dumping of Ash, IFFCO, Phulpur
36
4.2a Soil Cutting Area and Possibility of Agricultural Land that can be Saved by Using Fly Ash, District Allahabad
47
4.2b Soil Cutting by Volume and Possibility of Land that can be Saved by Using Fly Ash, District Allahabad
47
4.2c Land Value of Destroyed Land and Land Value that can be Saved by Using Fly Ash, District Allahabad
50
4.3a Raw Materials Used in PPC by J.P. Cement, Rewa, M.P. 53 4.3b Cement Production in J.P. Cement, Rewa 54 5.1a Use of Coal, and Generation, Utilization and Dumping of Fly Ash in
NTPC, Dadri 65
5.1b Ash Content in Coal and Utilization and Dumping of Ash in NTPC, Dadri
66
5.2a Fly Ash Utilization in NTPC, Dadri 67 5.2b Fly Ash Utilization in NTPC, Dadri 68 5.3 Utilization of Fly Ash in Different Sectors 71 5.4a Soil Cutting Area and Possibility of Land that can be Saved by
Using Fly Ash, District Ghaziabad 76
5.4b Soil Cutting by Volume and Possibility of Land that can be Saved by Using Fly Ash, District Ghaziabad
77
5.4c Land Value of Destroyed Land and Land Value that can be Saved by Using Fly Ash, District Ghaziabad
78
5.5 Ratios of Raw Materials Practiced for Manufacturing Fly Ash Bricks 84 5.6a Average Input Cost of Raw Materials (Excluding labour cost) 86 5.6b Average Input Cost of Raw Materials (Including labour cost) 86 5.7 Raw Materials Required for Manufacturing PPC, Diamond Cement,
Jhansi, U.P. 94
xii
List of Photographs
4.1 IFFCO, Phulpur, Green Belt 33 4.2 Ash disposal pipe from boiler to ash pond 34 4.3 Ash Pond of IFFCO, Phulpur 36 4.4 Ash loading for cement plant at ash pond, IFFCO, Phulpur 37 4.5 Construction of boundary wall using fly ash bricks inside IFFCO,
Phulpur 38
4.6 House made of fly ash bricks inside IFFCO, Phulpur 39 4.7 Ash loaded truck for cement plant, from IFFCO, Phulpur 50 4.8 Ash Pond of IFFCO, Phulpur 62 4.9 Plantations at Ash Pond of IFFCO, Phulpur 63 4.10 Ash Loading in Ash Pond of IFFCO, Phulpur, for Cement Plants 63 5.1a House made of Fly Ash Bricks, Constructed in 1998, by Ganga
Brick Factory 79
5.1b House made of Fly Ash Bricks, Constructed in 1998, by Ganga Brick Factory
82
5.2 Mixer Machine with gypsum and fly ash 82 5.3 Mixer Machine for manufacturing Fly Ash Bricks (with sand-lime-
gypsum) 85
5.4 Compress Machine used to manufacture fly ash bricks (with sand-lime-gypsum)
89
5.5 Manufactured Fly Ash Bricks on Display 89 5.6 Ash Mound, NTPC, Dadri 102 5.7 Ash Mound, NTPC, Dadri 103 5.8 Plantations in NTPC, Dadri 103
xiii
List of Location Maps
1 IFFCO, Phulpur, Location Map
2 Location Map of Conventional Brick Plants, IFFCO, Phulpur
3 NTPC, Dadri, Location Map
4 Location Map of Conventional Brick Plants, NTPC, Dadri
5 Location Map of Fly Ash-Sand-Lime-Gypsum Brick Plants, NTPC, Dadri

xiv
Executive Summary
I. Background of the Study: Internalization of Industrial Wastes
Conventionally, an economy is a system that links inputs and outputs. Environment
is the physical domain that offers the economy the scope to develop. Either because
of the type of inputs used or because of the technology applied for production of
output, physical wastes are generated by the industry.
We assume that the industry itself takes the role to internalize wastes either within
the plant where it is generated, or works in an inter-industry frame to internalize
wastes. The internalization of wastes in industries is shown in Flow Chart 1.3 (Chapter 1, p. 4).
Flow Chart 1.3 Management and Use of Wastes
Value Addition (in a different product)
Reuse of Wastes
(as resources)
Nature Replenished
? Technology (Processing of
Materials, use of Machines etc.)
Wastes, Emissions (Affecting Land, Air,
Water)
Nature Exhausted
Use of Nature (Materials) by Human
Labour
Economic System (Products Produced
and Consumed)
Effect on Human
Health and Animal Life
Benefits for Mankind
(Material goods, and leisure)
Costs for Mankind (Trash and
Garbage goods)
Environment Affected in General (Agricultural land,
Crops, Eco-system)

xv
The type of waste in our study refers to the wastes generated at the level of the
plant, given the optimality in use of resources (machine-man-material, time, energy
etc.). We concentrate on fly ash as a solid waste. The fly ash is generated in any
coal using plant. The fly ash that the plant piles up imposes environmental costs on
the society. The government can come forward to impose tax per unit (volume on
weight basis) of fly ash so stored by the plant. This may compel the ash generating
plant to either reuse and recycle the stored ash or transport it at its own cost to other
users of fly ash. This leads to internalization of environmental cost of fly ash. Our
analysis rests essentially on reuse of wastes. This re-use can convert a liability into
an asset.
II. Objectives of the Study
We will study two industrial plants located in two districts, Allahabad and Ghaziabad,
of Uttar Pradesh, India. The plants are selected such that coal happens to be the
basic input for production of their respective final products. Use (burning) of coal
leads to generation of fly ash. We will examine the techno-economic possibilities of
converting ‘fly ash’ into economic ‘goods’, through internalization of fly ash within the
industrial plants. The objectives of our study will be to examine
• How the generation of fly ash by the chosen industrial plants can be reduced per
unit of final output;
• How ‘fly ash’ generated in one industrial plant is transformed into final product
within the same or in another industrial plant;
• How are the adjoining areas, like those for human settlements, crop fields etc.
affected by generation of fly ash in the industrial plant;
• What type of alternative products and technologies can be thought of to ensure
long-term internalization of fly ash.
III. Coverage of the Study
One of the two plants that we select is the Phulpur Unit of the Indian Farmers
Fertilizers Cooperative Ltd. (IFFCO), in the district of Allahabad, Uttar Pradesh. The
xvi
second plant is the Dadri unit of the National Thermal Power Corporation (NTPC) in
the district of Ghaziabad, Uttar Pradesh.
The Phulpur Unit of IFFCO is a fertilizer plant that uses coal as a basic physical input
and produces fertilizer as the final output. In addition to coal, the Unit uses naphtha,
fuel oil, water, and electricity as other physical inputs (Chapter 4, Table 4.1, p. 20).
In the production process, fly ash is generated. We will examine if, and how far, this
Unit internalizes ‘fly ash’.
The Dadri Unit of the NTPC generates electricity with an installed capacity of 840
MW. In the Thermal unit of the Dadri power plant, fly ash is generated as a
byproduct (Chapter 5, Table 5.1, and 5.2, p. 47, 48). We will examine the scope of
ash utilization by the Dadri Unit.
In both the cases, we will examine the nature and cost of disposal of fly ash, and the
net benefits from utilization of fly ash. We will also examine the cost-benefit
implications of utilization of fly ash.
IV. Methodology of the Study
We will study the methods the selected plants have been using to control and reuse
fly ash. In addition to collecting data from the Reports and Records of these Units,
we will collect primary data from the R&D personnel of the selected plants.
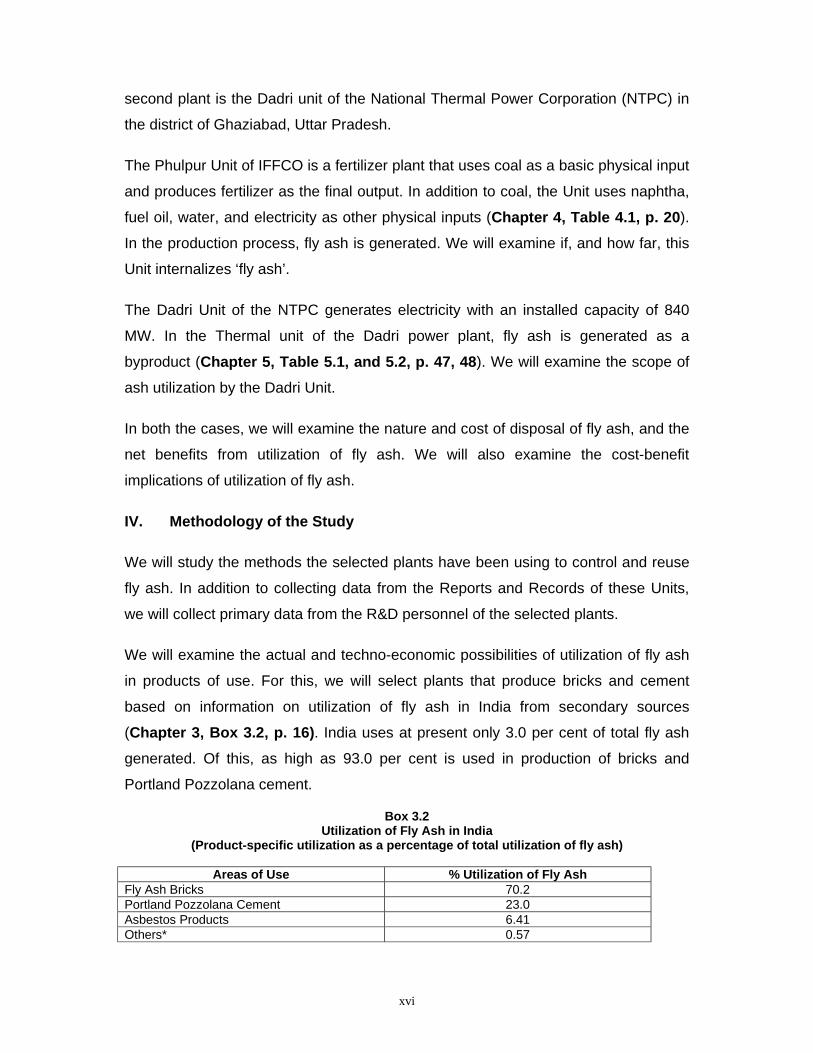
We will examine the actual and techno-economic possibilities of utilization of fly ash
in products of use. For this, we will select plants that produce bricks and cement
based on information on utilization of fly ash in India from secondary sources
(Chapter 3, Box 3.2, p. 16). India uses at present only 3.0 per cent of total fly ash
generated. Of this, as high as 93.0 per cent is used in production of bricks and
Portland Pozzolana cement.
Box 3.2 Utilization of Fly Ash in India
(Product-specific utilization as a percentage of total utilization of fly ash)
Areas of Use % Utilization of Fly Ash Fly Ash Bricks 70.2 Portland Pozzolana Cement 23.0 Asbestos Products 6.41 Others* 0.57
xvii
Note: * Include Underground Fills, Hydraulic structures, Ash Ponds and Dykes, Agriculture and Soil Amendment.
In selection of manufacturing units, we will follow the Notification dated 14 Sept., 1999, of the Ministry of Environment and Forests, GOI.
We will use structured schedules for collection of information from the brick and
cement plants, located adjacent to the selected IFFCO and NTPC plants, in
accordance with the Notification of the MOE&F, GOI, 1999. We will use structured
schedules for interviewing people affected in the areas adjoining the selected
industrial plants that generate and dispose of fly ash. We will use questionnaire to
get ideas from experts on utilization of fly ash.
V. Data Analysis:
Fly Ash: Generation, Management, Utilization, and Reduction of Ash Content in Coal Used in Selected Plants
V.1 Major Observations: IFFCO, Phulpur, and NTPC, Dadri
IFFCO, Phulpur
IFFCO, Phulpur, has installed necessary equipments for controlling the quality of
liquid effluents and of gaseous emissions. Liquid effluents are treated before being
discharged into the main effluent nallah outside the plant premises. The quality of the
effluent lies within the standard laid down by the Pollution Control Board, U.P.
The dumping of fly ash by IFFCO, Phulpur, in the form of Ash Pond may not exhaust
the area required outside the plant as the ash is being supplied regularly to cement
manufacturers. The plant has shifted since April 2000 from wet ash disposal in the
ash pond formed in the adjoining area to supplying dry ash. The rate of utilization of
fly ash exceeds the rate of generation so that on a span of less than ten years from
year 2000, the plant can plan to utilize all fly ash generated. This utilization covers
both internal and external uses.
NTPC, Dadri
Coal for NTPC, Dadri, comes from North Karanpura Coalfields in Bihar (now in
Jharkhand). Before 1998, the ash content in coal used by Dadri was 40.0 per cent
that came down to around 35.0 per cent after 1998. However, the source of coal has

xviii
remained unchanged. The NTPC, Dadri has formed an Ash Mound inside the plant
premises for storage of fly ash. In addition, it supplies fly ash that it generates to
cement and asbestos industries.
The NTPC, Dadri, supplies dry ash. Since the beginning of commercial production in
August 1992 till the end of March 2001, around 22.0 per cent of fly ash generated by
the unit has been utilized. Almost 16.0 per cent of this have gone for filling low-lying
areas and embankments. The rest 6.0 per cent has gone for manufacturing bricks,
blocks, cement, and asbestos. Around 78.0 per cent of the accumulated ash
generated, thus, are dumped in Ash Mound (Chapter 6, Table 6.1, p. 84).
The reason why IFFCO, Phulpur, can utilize cent per cent fly ash generated is zero
transportation cost when it supplies fly ash to cement manufactures. The reason why
NTPC, Dadri, does not attempt to utilize fly ash above 20.0 per cent on average is
that it has already incurred huge fixed cost for carrying fly ash from the boiler to the
ash mound.
V.2 Conventional Clay Brick Plants (located within 50-km. radius from IFFCO, Phulpur, and NTPC, Dadri): Reasons for Non-Utilization of Fly Ash
! The R&D laboratory of IFFCO, Phulpur, has developed a project for
utilization of fly ash in brick manufacturing. These bricks are both internally
and externally used.
! NTPC, Dadri, produces fly ash bricks on a regular basis primarily for
internal use.
! We did not find any record of the number of conventional clay brick plants
within a radius of 50 km. from IFFCO, Phulpur, and NTPC, Dadri.
We selected a total of ten clay brick plants within the 50-km. radius from IFFCO,
Phulpur, and NTPC, Dadri, to capture the major problems and possibilities of
utilization of fly ash.
V2.1 Non-Utilization of Fly Ash in Conventional Clay Bricks: General Reasons
♦ Land for conventional clay brick plant is easily available (purchase or
lease-in) in the Districts, Allahabad and Ghaziabad.

xix
♦ The price of land is within reach (purchase or lease-in) of the brick plant
owners in both the Districts.
♦ The technique of production of conventional clay bricks is known.
♦ Conventional clay brick plant owners do not know the technology of mixing
fly ash in clay bricks.
♦ The transportation cost of fly ash from ash generating plant is high relative
to the cost of land leased in.
♦ There are no problems of marketing of conventional clay bricks.
♦ Reliability of conventional clay bricks in the market is high.
♦ The clay bricks ensure stable benefits for conventional brick plant owners.
V.3 Fly Ash-Sand-Lime-Gypsum Brick Plants Located within 50-km. Radius from IFFCO, Phulpur, and NTPC, Dadri: Observations Regarding Actual and Possible Use of Fly Ash
We did not find any fly ash-sand-lime-gypsum brick plants within the radius of 50-km.
from IFFCO, Phulpur. In addition, we did not find any record of the number of fly ash-
sand-lime-gypsum brick plants within a radius of 50 km. from NTPC, Dadri. We could
locate as high as seven functioning fly ash-sand-lime-gypsum brick plants located
within 50-km. radius from NTPC, Dadri, that use fly ash generated by the latter.
There is no supply constraint so far as availability of raw materials for manufacturing
fly ash bricks in these plants are concerned. All the seven fly ash brick plants
reported that they got technology for manufacturing fly ash-sand-lime-gypsum bricks
from NTPC, Dadri. NTPC, Dadri is ready to provide technological support to any
potential entrepreneur willing to set up a fly ash brick plant.
Since market price of fly ash-sand-lime-gypsum brick is higher than cost of
production per unit, hence the producers of such bricks can market these bricks,
even with positive transportation cost of fly ash (Chapter 5, Table 5.22, p. 67). There is also positive price-differential between clay bricks and fly ash bricks
(Chapter 5, Table 5.24, p. 69). Manufacturing and marketing fly ash bricks, thus,
require steps for relative cost reductions.
xx
V.4 Cement Plants, which receive Fly Ash from IFFCO, Phulpur, and NTPC, Dadri: Utilization of Fly Ash
Cement Plants as Users of Fly Ash from IFFCO, Phulpur
The permissible percentage of fly ash that can be used in Portland Pozzolana
Cement (PPC), as reported by the users of fly ash varies from a minimum at 25.0 to
a maximum at 35.0. Based on the survey of a number of cement plants, we
observed that there is no dearth of demand for fly ash from the cement
manufacturers. It is difficult to locate all the cement plants as buyers of fly ash
generated in IFFCO, Phulpur, because of operation of intermediaries (truck
operators). Neither the IFFCO, Phulpur, nor the cement manufacturers incur any
transportation cost for carrying fly ash from IFFCO to cement plants.
Cement Plants as Users of Fly Ash from NTPC, Dadri
The cement manufacturers are the main external users of fly ash supplied by NTPC,
Dadri. We could locate the Diamond Cement, Jhansi, UP, that takes only 15.0 per
cent of its required fly ash per day from NTPC, Dadri. The technical ratio in which fly
ash is mixed is given as Fly Ash: Clinker: Gypsum as 38:55:07 for producing
Portland Pozzolana Cement. NTPC, Dadri, has remote chance of increasing supply
of fly ash to Diamond Cement, unless the transport cost is borne by NTPC, Dadri.
V.5 Effect of Spread of Fly Ash in the Areas Adjoining IFFCO, Phulpur, and NTPC, Dadri
In the Areas Adjoining IFFCO, Phulpur
IFFCO, Phulpur, is reported to take care of areas within a radius of 3 km. from its
own location (plant boundary). We surveyed seven villages and 65 households
settled within 2000 meter from the Plant, following pilot survey. The exact number of
the households settled within the radius of three km. from IFFCO, Phulpur is not
known. We selected the households in a dispersed manner within each village.
Almost all the households from all the villages reported to have been experiencing
adverse effect of spread of fly ash disposed by IFFCO on agricultural land. They
also reported about the air and water-borne diseases because of spread of fly ash.
xxi
The Directorate of Environment, UP, and the Pollution Control Board, Government of
UP, do not keep any record of the quality of air and water in the areas inhabited by
people adjoining IFFCO, Phulpur. We did not find any registered medical practitioner
who could confirm the health-related problems conveyed by the people in the
adjoining area.
In the Areas Adjoining NTPC, Dadri
We selected seven villages following pilot survey and sixty-five households in the
areas adjoining NTPC, Dadri. The selection of households followed what we did in
case of surveying areas adjoining IFFCO, Phulpur, in the district of Allahabad. The
households reported adverse effects of spread of fly ash on agricultural land. They
also complained about air-borne diseases because of spread of fly ash. We did not
find any registered medical practitioner staying in the adjoining areas that we
surveyed. The Directorate of Environment, UP, and the Pollution Control Board,
Government of UP, do not keep any record of the quality of air and water in the
areas inhabited by people adjoining NTPC, Dadri.
V.6 Reduction of Ash Content in Coal Combustion: Possibilities in IFFCO, Phulpur, and NTPC, Dadri
In India, 70.0 per cent of extraction of coal comes from open cast mines at present
and the underground mines contribute the balance. Both the quality of coal and the
method of combustion determine the effluents produced during combustion of coal.
The heat value of the fuel is determined by
UHV = 8900 – 138(A+M),
where,
UHV = Useful Heat Value,
A = Ash Content in percentage
M = Moisture Content in percentage.
xxii
Coal available from different sources is graded in terms of the UHV. Using this
technique, available coal in India has been classified into seven grades, A to G. For
superior grades (A, B, C), the (A+M) percentage is less than 30.0 while for inferior
grades (E, F, G), it is more than 30.0. In between lies the intermediate grade, D. The
inferior grade coal constitutes around 70.0 per cent of total usable coal available in
India.
Use of clean coal also leads to higher useful heat value (UHV) because it generates
lower ash content by percentage and total quantity per unit of generation of
electricity. NTPC, Dadri, reported using clean (washed) coal since 1998 for reduction
in ash content. The source of coal has remained unchanged. The coal used by
IFFCO, Phulpur, has an ash content of 40.0 per cent at the minimum and 48.0 per
cent at the maximum. IFFCO, Phulpur, has no plan to change the source of coal that
it receives and its R&D (laboratory) does not have any plan to go for clean (washed)
coal to reduce ash content.
VI. Results
Based on our study of two selected plants, IFFCO, Phulpur, and NTPC, Dadri, we
offer the following results. The policy recommendations follow from the results:
VI.1 Cost (Fixed and Recurring) for Disposal of Fly Ash by IFFCO, Phulpur, and NTPC, Dadri
The fixed cost for dry ash disposal (on setting pipelines etc.) for IFFCO, Phulpur,
was around Rs. 2.5 crores. The recurring cost of dry ash disposal is virtually nil
except that certain utilities like Instrument Air and Electric Power is provided to dry
ash system. If accounted, the recurring cost will not exceed Rs. 0.15 per tonne of
ash. The land area that remains covered as on Dec. 31, 2001 with ash filled during
the earlier period is around five acres outside the plant area.
The distance of the ash mound from the ash generating point at NTPC, Dadri, is
four-km. For carrying ash from the boiler to the ash mound, fixed cost incurred was
Rs. 137 crore. The recurring cost (ash handling cost per MT) is Rs. 30. Quantity of
dumping of ash per day is 3556 MT for the Dadri Unit for which average

xxiii
handling/dumping cost per day comes to be a little more than Rs. one lakh (Chapter 5,Table 5.4, p. 50).
VI.2 Land Cost for Land Leased-in: The Case of Brick Plants Adjoining IFFCO, Phulpur, and NTPC, Dadri
Most of the brick plant owners within 50-km radius of IFFCO, Phulpur, and NTPC,
Dadri, use lease-in land for digging purposes. Of the total land being used by the
brick plants adjoining IFFCO, Phulpur, around 80.0 per cent are on lease. Of the
total land being used by the brick plants adjoining NTPC, Dadri, around 60.0 per cent
are on lease.
Average land price per acre at the market for brick plant owners who leased-in land
within 50-km radius of IFFCO, Phulpur, is Rs. 89,000. The average land price comes
to be Rs. 1,41,000 for the brick plants located within 50-km radius of NTPC, Dadri.
The availability of abundant and low cost topsoil helps in using clay as and when
required. Absence of initiatives and incentives from the Government helps in
continuing production of clay bricks without mixing fly ash by any percentage.
VI.3 Land Saving (Area, Volume, and Value) by Replacing Clay by Fly Ash
Soil cutting area (sq. metre) in any year for all the brick plants in the District of
Allahabad is 316.84 acres of which agricultural land constitutes 73.48 per cent.
Assuming soil cutting destroys topsoil, the total value of land that is destroyed comes
to be around Rs. three crore for the whole district covering all clay brick plants (on
the basis of average land price existing at present). Given the quantum of soil cutting
per year, we calculate the quantity of fly ash that can replace 30.0 per cent
(maximum) clay. Thus, we calculate maximum agricultural land that can be saved by
using fly ash (maximum 30.0 per cent) as replacement of clay (weight-to-weight
basis). As we see, out of a total of 232 acre of agricultural land, as high as 25.0 per
cent can be saved (Chapter 4, Table 4.12, p. 32).
Soil cutting area (sq. metre) in any year for all the brick plants in the District of
Ghaziabad is 1155.6 acres, of which agricultural land constitutes 100.0 per cent. The
total value of land that is destroyed by soil cutting comes to be more than Rs. sixteen
xxiv
crore for the whole district covering all clay brick plants (on the basis of average land
price existing in 2001). Given the quantum of soil cutting per year, we calculate the
quantity of fly ash that can replace 30.0 per cent (maximum) clay. Thus, we calculate
maximum agricultural land that can be saved by using fly ash (maximum 30.0 per
cent) as replacement of clay (weight to weight basis). As we see, out of a total of
1155.6 acre of agricultural land, as high as 25.0 per cent can be saved (Chapter 5, Table 5.15, p. 60).
VI.4 Cost-Benefit Projections for Conventional Clay Bricks and Fly Ash Mixed Clay Bricks
We now concentrate on cost-benefit projections for conventional clay bricks and fly
ash mixed clay bricks. We cover the districts, Allahabad and Ghaziabad, for
encompassing IFFCO, Phulpur, and NTPC, Dadri. For both the districts, bricks are
more or less similar by quality (size and weight). For the district of Allahabad, the
total number of conventional clay brick plants at the time of survey was 356, while for
the district of Ghaziabad it was 360. We selected ten such brick plants located within
the 50-km. radius of each of the ash generating plants, IFFCO, Phulpur, and NTPC,
Dadri. There is no record of the number of conventional clay brick plants within the
specified radius. Thus, we relied on district level data to arrive at some projections.
For the district Allahabad, average digging depth for clay bricks is much higher.
Average land price for the district Ghaziabad is much higher relative to that of
Allahabad. The average distance of the clay brick plants from the ash generating
plant is same for both the districts. This is because of selection of clay brick plants
within the radius of 50 km. in accordance with the Notification of the GOI, 1999. The
average transportation cost for carrying fly ash (per 16 MT) is much higher for
Ghaziabad. Both the average cost of production per 1000 bricks and average market
price for Ghaziabad are higher relative to those of Allahabad (Chapter 4, Table 4.11 Part-A, p. 31, and Chapter 5, Table 5.14, Part-A, p. 58). There is variation in
quantity of soil that is exhausted (used) between the districts for brick manufacturing
because of variations in digging depth. The quantity of soil used (in cubic metre) is
more in case of district Allahabad relative to Ghaziabad. Naturally, the number of
clay bricks that can be manufactured per acre (sq. metre) of land is much higher for
district Allahabad relative to Ghaziabad. On the assumption of 25.0 per cent clay
xxv
replaced by fly ash (on weight-to-weight basis), the quantity (volume) of fly ash that
can be used, thus, is higher for Allahabad relative to Ghaziabad. For this ratio-
specific utilization of fly ash (75:25), the transport cost of fly ash from the ash
generating plant is lower for the district Allahabad.
The cost of production of fly ash mixed clay bricks per 1000 is marginally more when
25.0 per cent of clay is replaced by fly ash, for both the districts. Per 1000 bricks, the
cost-difference is Rs.27 for Allahabad, and Rs. 42 for Ghaziabad. As percentage of
cost of production of clay bricks in the respective districts, these are 3.33 and 4.47
(Chapter 4, able 4.11 Part-B, p. 31, and Chapter 5, Table 5.14, Part-B, p. 58, Chapter 7, p. 95).
VI.5 Net Benefits (Total Benefits – Total Cost) for Utilization of Fly Ash in Conventional Clay Brick Plants and Fly Ash-Sand-Lime-Gypsum Brick Plants
While production of conventional clay bricks increasingly exhausts agricultural land
as we observed, production of fly ash bricks saves agricultural land (by both area
and volume). However, both cost of production per unit and market price per unit are
higher in case of fly ash-sand-lime-gypsum bricks. While net surplus (Revenue –
Cost) is positive for both types of brick plants, it is much higher for clay bricks per
plant based on annual production level (Chapter 5, Table 5.23, p. 78). Since plant
size is much higher (by capacity production) for clay bricks, hence clay brick plants
record on average higher net benefits. Calculated over 1000 pieces of bricks, fly ash-
sand-lime-gypsum brick plant shows more net benefits. Thus, there are reasons to
promote fly ash brick plants.
On the assumption of 25.0 per cent clay replaced by fly ash (on weight-to-weight
basis), the quantity (volume) of fly ash that can be used is higher for district
Allahabad relative to district Ghaziabad. The transport cost of fly ash from ash
generating plant is lower for the district Allahabad.
VII. Policy Recommendations
The purpose of this study is to prevent and minimize generation of waste, and
maximize reuse and recycling. The study also aims to production of reusable goods
from waste and saving scarce resources assisted by the participation of government

xxvi
authorities and other stakeholders. The study concentrates on fly ash as a waste
generated in coal-using industrial plants. Saving topsoil by utilization of fly ash in
possible value-added goods requires a number of measures. These measures
include:
Measures Recommended for Ash Generating Plants
⇒ planned disposal and dumping of ash by the ash management/utilization cell
of the ash generating plant,
⇒ identification and selection of the site for dumping fly ash in advance so that
human settlements are not displaced, nor is there any adverse effect on
agricultural land,
⇒ transparency in disclosure of fly ash generated per plant per year and hence
accountability of fly ash generator,
⇒ public announcement regarding the quality of ash being generated, the
receivers of fly ash who utilize the ash generated by the plant, the quantity of
accumulated ash up to date,
⇒ shouldering of transportation cost of fly ash from the ash generating unit to the
ash utilization unit.
Measures Recommended for Government ⇒ announcement through Notification or G.O. what the ash generating plants
will have to do regarding dumping and disposal of fly ash, before these ash
generating units are given license to setup these plants,
⇒ identifying the location of ash generating plants at a safe distance from
existing human settlements and plantation areas,
⇒ soil testing of the brick plants to examine its possible mixing with fly ash
generated by the coal-based plants within 50-km radius, testing to be done
free of cost for the brick plants (may be by MOE&F, GOI),
⇒ circulating Notification including amendments, if any, regarding utilization of fly
ash among micro level public bodies and public administration,
⇒ maintaining a record of quality of soil, air, and water within a reasonable area
adjoining ash generating plants (may be by the Pollution Control Board, GOI,
xxvii
and also by the State Pollution Control Board and Directorate of
Environment),
⇒ imposing tax per unit (volume on weight basis) of fly ash stored by the ash
generating plant,
⇒ reducing rate of tax per unit or total tax exemption on fly ash mixed clay
bricks, so that it has an encouraging effect on production of fly ash mixed clay
bricks,
⇒ reducing/exempting tax on fly ash users for productive purposes,
⇒ documenting quality of fly ash products and its dissemination by Government/
appropriate authority,
⇒ eco-labeling fly ash bricks, e.g, fixing logo on the environmentally safe fly ash
bricks,
⇒ maintaining a record of the number of conventional clay brick plants within the
radius of 50-km from major fly ash generating plants, (may by MOE&F, GOI),
⇒ being a buyer of clay-mixed fly ash bricks, and fly ash-sand-lime-gypsum
bricks,
⇒ fixing the price per unit of fly ash bricks, both clay-mixed fly ash bricks and fly
ash-sand-lime-gypsum bricks on the basis of input cost,
⇒ announcing the price of fly ash bricks fixed per unit for both the buyers and
producers of such bricks.
⇒ filling mine and land, keeping in mind transportation cost of fly ash from the
point of generation to the site (land and mine),
⇒ importing coal with lower ash content on a selective basis, in the context of
exhausting superior grade coal in India.
Measures Recommended in General
⇒ supplying technology to the potential users of fly ash for manufacturing value-
added goods,
⇒ providing cost-free training to the managers and workers in general engaged
in utilizing fly ash in value-added goods,
xxviii
⇒ providing information on alternative products and technologies through public
media for utilization of fly ash,
⇒ circulating/publicizing the results of soil testing to the actual and potential
users of fly ash.
The suggestions that we have offered center on brick plants. We found no problems
for the cement plants so far as utilization of fly ash in clinker and gypsum for
manufacturing cement is concerned. The alternative products where fly ash can be
utilized for value-addition of products have been discussed in Chapter 2 (Box 2.4, p. 10).
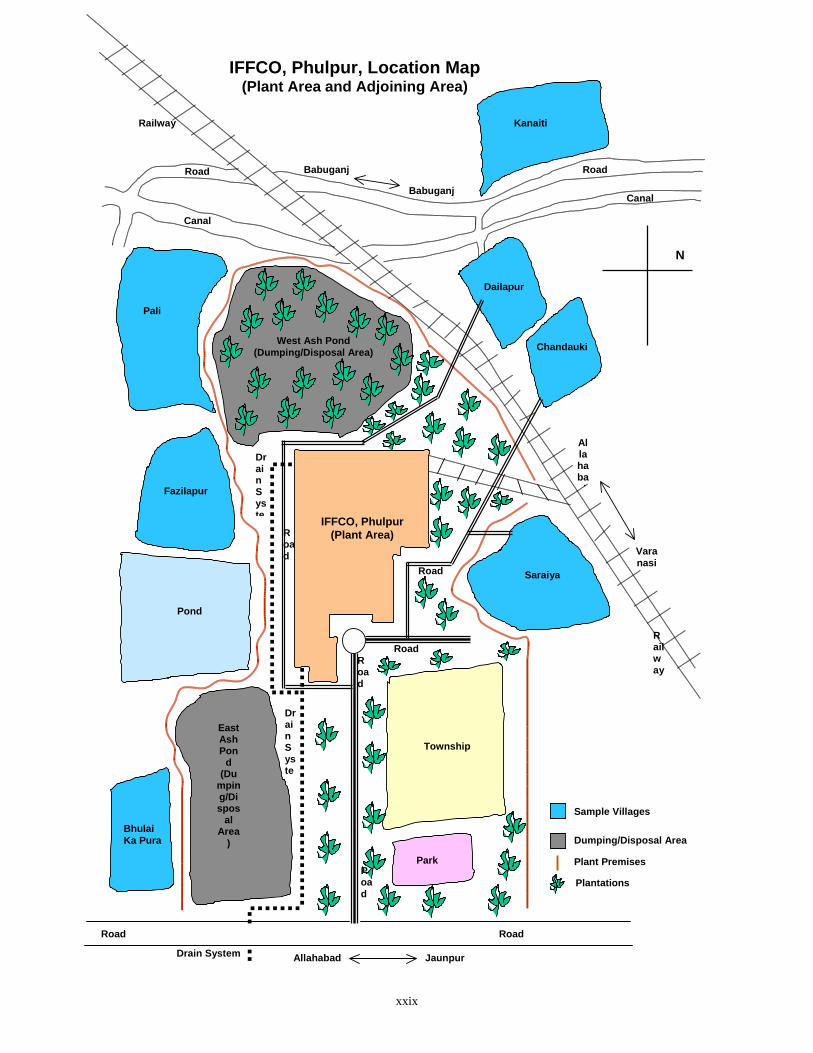
xxix
N
Kanaiti
Dailapur
Chandauki
Pali
Saraiya
Pond
Fazilapur
West Ash Pond (Dumping/Disposal Area)
Township East Ash Pon
d (Du
mping/Dispos
al Area
) Bhulai Ka Pura
Park
Canal
Canal
Road Road Babuganj Babuganj
Allahabad
Varanasi
Road Road
Allahabad Jaunpur
Road
Road
Road
Road
Road
IFFCO, Phulpur (Plant Area)
Drain Syste
Drain Syste
Drain System
Railway
Railway
Sample Villages
Dumping/Disposal Area
Plantations
IFFCO, Phulpur, Location Map (Plant Area and Adjoining Area)
Plant Premises

xxx
25 km. 50 km.
N
IFFCO Phulpur Plant
Location of Conventional Clay Brick Plans
Note: The study team could not get the number of conventional brick plants located within a radius of 50 km. From IFFCO, Phulpur.
1. NHS Brick Factory 2. Milendra Brick Factory 3. Ahuja Brick Factory 4. Sakti Brick Factory 5. KMM Brick Factory 6. Raj Brick Industry 7. Ram Bihari Brick Industry 8. Mishra Brick Factory 9. Jaiswal Brick Industry 10. D.K. Jaiswal Brick Factory
76
10
9
1
32
4 5 1,964 sp.km.
5,893 sp.km.
Area
Selected Plants
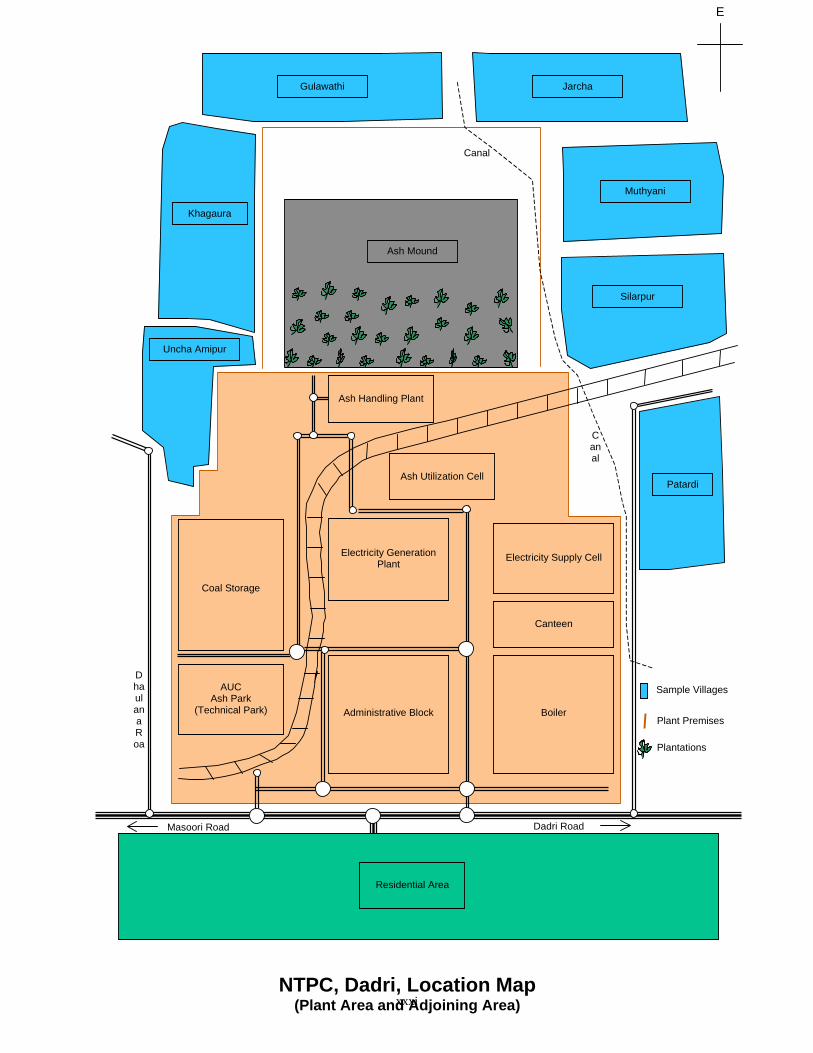
xxxiNTPC, Dadri, Location Map
(Plant Area and Adjoining Area)
AUC
Ash Park (Technical Park)
Administrative Block
Coal Storage
Boiler
Canteen
Electricity Supply Cell
Electricity Generation Plant
Ash Utilization Cell
Ash Handling Plant
Residential Area
Ash Mound
Silarpur
Patardi
Muthyani
Jarcha Gulawathi
Khagaura
Uncha Amipur
Sample Villages
Plantations
Masoori Road Dadri Road
Plant Premises
E
Canal
Canal
Dhaulana Roa
xxxiii
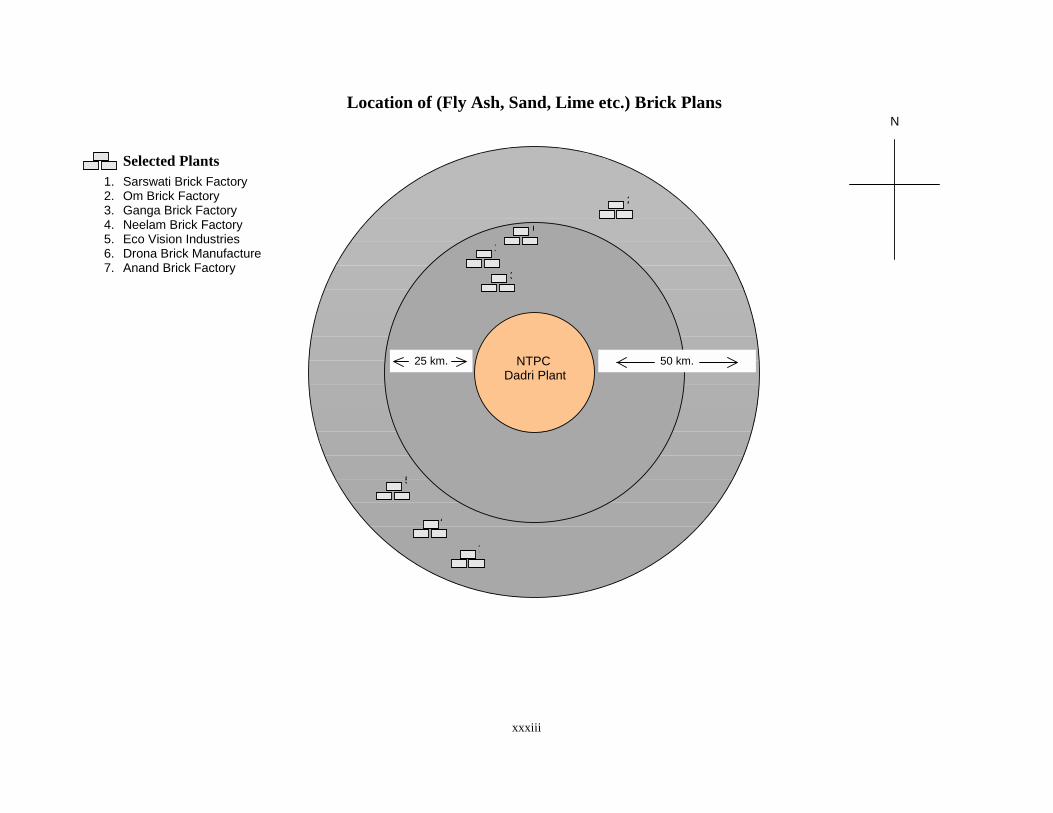
25 km. 50 km.
N
NTPC Dadri Plant
Location of (Fly Ash, Sand, Lime etc.) Brick Plans
1. Sarswati Brick Factory 2. Om Brick Factory 3. Ganga Brick Factory 4. Neelam Brick Factory 5. Eco Vision Industries 6. Drona Brick Manufacture 7. Anand Brick Factory
2
Selected Plants
7
4
5
3
1
6

xxxiv
1. Jagpal Brick Factory 2. Indian Brick Industries 3. Janta Brick Field 4. Raj Brick Factory 5. Surya Brick Factory 6. Rajesh Brick Plant 7. R. K. Brick Factory 8. Geet Brick Factory 9. Silngh Brick Factory 10. Beer Brick Field
25 km. 50 km.
E
NTPC Dadri Plant
Location of Conventional Clay Brick Plans
Note: The study team could not get the number of conventional brick plants located within a radius of 50 km. from NTPC, Dadri.
9
7
6
10
8
1
3
2
4
5
1,964 sp.km.
5,893 sp.km.
Area
Selected Plants
1
Chapter 1 : Industrialization: Some Environment-Related Issues
1.1 The Environment-Related Problems of Industrialization
The relevance of nature or natural resources to man lies in its transformation by
man. This transformation is what we call production whereby commodities come into
being. This commodity production accompanies with it continuous development in
technologies, the latter changing the nature of the product itself. The change is from
lower order low-technology product to higher order high-technology product. This
brings about industrialization.
Of late, it is being argued that this transformation of natural resources is
accompanied by serious environmental degradation (The World Resources Institute,
1998, p. 51). Economic activities involve transformation of resources from natural
forms and locations to where these are used as final products. The economy as a
'guest' develops at the cost of the 'host', viz., the earth's ecosystem. The
development of the economy conventionally relies on (i) a dynamic shift from
agriculture to industry, and (ii) the growth of industries. Both these dimensions,
namely, the structural transformation and the growth in industries, takes man far
from nature in its original form and fractures nature. It seems to be a fact that when
the transformation of nature by man, instead of showing a symbiotic relationship
between man and nature, shows a man-centric effort to conquer nature and
ultimately overpower it, the economy is itself stressed. The transformation of natural
resources generates wastes at different stages. The 'environment is used as a
repository of waste products' (Mehta, Mundle, Sankar, 1997, p. 53). Because of
growth in industries, industrial wastes are growing in quantity and becoming more
difficult to dispose of or degrade (The World Resources Institute, 1998, p. 51).
Historically the foundation of industrial economies was use of nature as direct
sources of materials and energy. For the same reason, the economic prosperity or
wealth of nations has been identified as the volume of produced goods and their
consumption. The problem is that 'industrial economies eventually excrete as waste
most of the raw materials they devour. This refuse presents a massive disposal
problem' (Young, 1991, p. 40). The industries emit massive air, water, and solid
pollutants, contributing to smog, build up of heavy metals, organic water pollution,

2
hazardous solid waste, and many other sources of damage to communities and
ecosystems (World Bank, 2000a, p. 10). The scale and variety of industrial waste
with industrialization have been 'incompatible with continued reliance on landfills, the
traditional method of disposal' (Young, 1991, p. 44). This is because the top surface
of land is scarce while there is a limit to digging the topsoil to accommodate wastes.
Even if the wastes are put inside the depth of soil up to the permissible limit, it will
have a tendency to leak, releasing wastes into ground water.
Use of natural resources for industrial purposes has not only endangered the need to
maintain the long-run capacity of the earth, but has also endangered the short-run
capacity of agriculture. What is meant by this capacity? 'The carrying capacity of an
eco-system is the maximum stress it is capable of absorbing without it changing to a
vastly different state. Eco-systems are endemically subject to natural shocks and
surprises... The self-reorganizing ability of eco-systems determines its capacity to
respond to the perturbations they are continually subjected to' (Dasgupta and Maler,
1997, p. 4). The carrying capacity degrades by 'environmental deterioration
including soil erosion, aquifer depletion, rangeland deterioration, air pollution' etc
(Brown and Mitchell, 1998, p. 168). We would like to examine the possibility of
sustainable industrialization that does not lead to continuous erosion of the long-run
capacity of the earth, and that helps maintain the carrying capacity of the eco-
system. Thus, we will examine the possibility of how these wastes can be reused in
an intra-plant and inter-industry frame, and planned dumping of these wastes, if
there remains any residue after planned internalization of wastes.
1.2 Industrial Wastes as Seen by Industries in Countries
During the pre-independence period, the concern for environmental problems in
India was least because of both small size of population and absence of
industrialization (Sankar, 1998, p.3). The concern for waste management through re-
use and recycling drew attention with accelerating industrialization. A waste is considered as a discarded material, which has no immediate value to the consumer who is abandoning it (Cointreau, 1982, p. 4). Fuel burning residuals is
one of the many wastes that come from operation of industrial plants. In the
developing countries, generally the responsibility of tackling industrial wastes lies
with the municipalities. This is unlike in the developed countries like the US where
3
'industrial refuse is not treated as part of municipal refuse' (Cointreau, 1982, p. 7).
While the former attitude may lead to resource removal, the latter leads to resource
recovery if properly planned by the industry itself, which generates fuel-burning
wastes in the course of production. Generation of industrial wastes is seen 'as a side effect of production and consumption in the economy -- this side effect (or externality) is a form of social cost that is not borne by the agent who is its source. The theoretical analysis leads to a straightforward prescription to correct the
misallocation of resources that results from these side effects on the environment: a
unit tax on the polluting activity that is equal to the marginal social damage of the
pollution. Such a Pigouvian tax has the potential to "internalize" the external cost and
can lead to socially efficient levels of environmental protection (Oates, 1996, p. 198).
In some studies it is assumed that waste management is the responsibility of the
public administration by removal of waste as early as possible and by destruction of
waste (Mesoli, 1980). Later, the focus shifted to utilization of wastes like other non-
waste resources utilized for productive purposes. In a less industrialized economy, a
government can not credibly threaten to shut down the plant if the firm does not
comply with the environmental standards. Instead, the firm will threaten to shut down
the plant if it does not obtain a lenient license. The threat by the firm controlling the
plant is likely to be effective because the economic benefits of the plant are
concentrated at a local level, and the benefits of governmental actions or the
environmental benefits are spread across a large geographic area (Digkstra, 1999,
p. 93-94). Thus, the government has to listen to the views of polluters, in our context,
the firms before taking any direct action. The Government, or Pollution Control Board
on its behalf, can rely on guiding the plants through suggestions for adoption of
appropriate technologies. This approach stresses on resource recovery (Bever,
1976; Heidenstem, 1977). In some studies, minimizing the costs of collection and
disposal of wastes through operation of vehicles and route of transport within the
municipal budget has been focused while considering solid waste management
(Oates, 1996, p. 207; Gerlagh, 1999). There are alternative ways of looking at waste
management. One is with respect to industrial purposes where waste management
rests on techno-economic considerations, while another is with respect to
environmental degradation and preserving nature by non-use or replenishment
(Beukering et al, 1999). In our study, we will consider reuse of an industrial waste
that covers the second aspect also.
4
1.3 Society-Economy-Environment Linkages: The Background of the Study
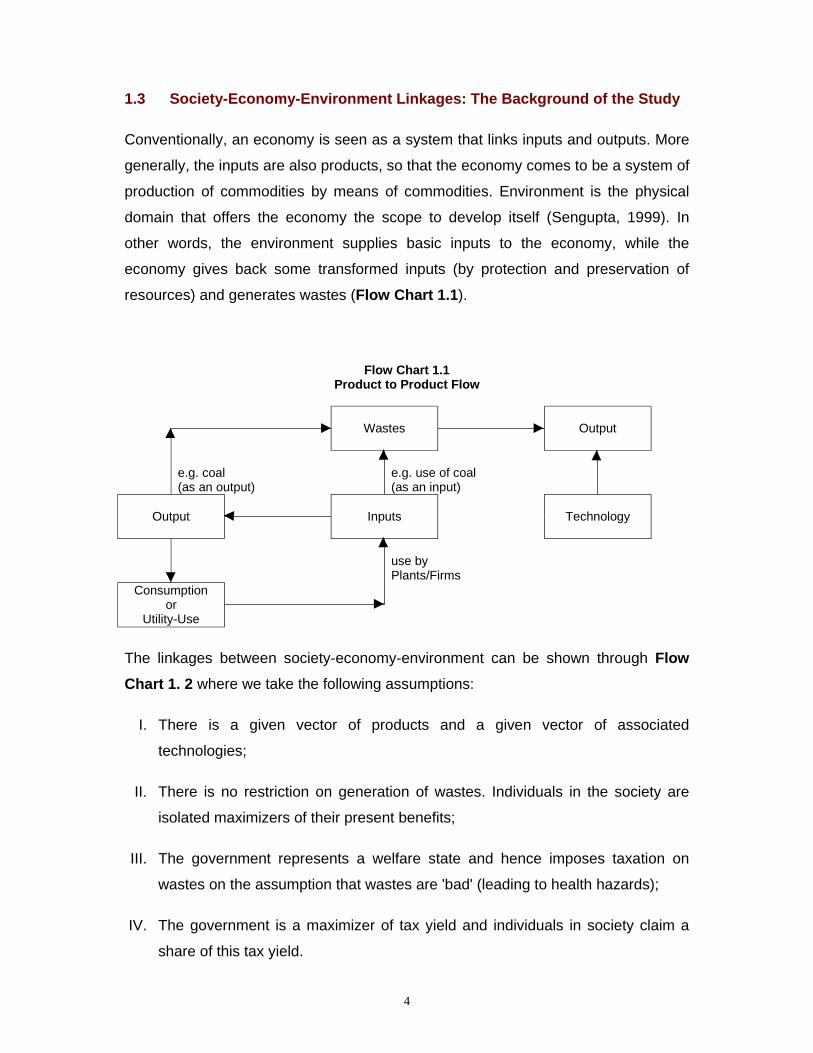
Conventionally, an economy is seen as a system that links inputs and outputs. More
generally, the inputs are also products, so that the economy comes to be a system of
production of commodities by means of commodities. Environment is the physical
domain that offers the economy the scope to develop itself (Sengupta, 1999). In
other words, the environment supplies basic inputs to the economy, while the
economy gives back some transformed inputs (by protection and preservation of
resources) and generates wastes (Flow Chart 1.1).
Flow Chart 1.1 Product to Product Flow
Wastes
Output
e.g. coal (as an output)
e.g. use of coal (as an input)
Output
Inputs
Technology
use by Plants/Firms
Consumption or
Utility-Use
The linkages between society-economy-environment can be shown through Flow Chart 1. 2 where we take the following assumptions:
I. There is a given vector of products and a given vector of associated
technologies;
II. There is no restriction on generation of wastes. Individuals in the society are
isolated maximizers of their present benefits;
III. The government represents a welfare state and hence imposes taxation on
wastes on the assumption that wastes are 'bad' (leading to health hazards);
IV. The government is a maximizer of tax yield and individuals in society claim a
share of this tax yield.

5
The Flow Chart 1.2 will then look like the following: Flow Chart 1. 2
Society-Economy-Environment Linkages
Physical Output
Price of goods Commodities Labour etc.
Wages etc.
Society
Industry
Involuntary receipt
Compensation
Government Tax on pollution
Physical Waste
Individuals constitute a society and go to the industry as isolated productive agents
to produce physical output. These individuals voluntarily participate in the process of
exchange: controllers of technology running the industry sell commodities while
sellers of labour power buy those commodities. Either because of the type of inputs
used or because of the nature of technology applied for production of this output,
physical wastes are generated by the industry. Individuals in society are affected
adversely by these wastes.
The government in such an economy is assumed to represent a welfare state and
hence imposes taxation on industry. The individuals claim a share of the tax yield in
the form of 'compensation'. Thus, the tax yield may be distributed among the
individuals in society. The society is compensated by the industry for generating
wastes, the government is the link between the society and the industry.
1.4 Internalization of Industrial Wastes in the Economic System
We can relax assumption (iii) without disturbing the essential features of a welfare
state. We assume that the state does not impose taxation on the industry generating
wastes. The industry itself takes the role to internalize wastes either within the plant
where it is generated, or works in an inter-industry frame to internalize wastes. The
internalization of wastes in industries may be shown in Flow Chart 1.3.
6
Flow Chart 1.3 Management and Use of Wastes
Value Addition (in a different product)
Reuse of Wastes
(as resources)
Nature Replenished
? Technology (Processing of
Materials, use of Machines etc.)
Wastes, Emissions (Affecting Land, Air,
Water)
Nature Exhausted
Use of Nature (Materials) by Human
Labour
Economic System (Products Produced
and Consumed)
Effect on Human
Health and Animal Life
Benefits for Mankind
(Material goods, and leisure)
Costs for Mankind (Trash and
Garbage goods)
Environment Affected in General (Agricultural land,
Crops, Eco-system)
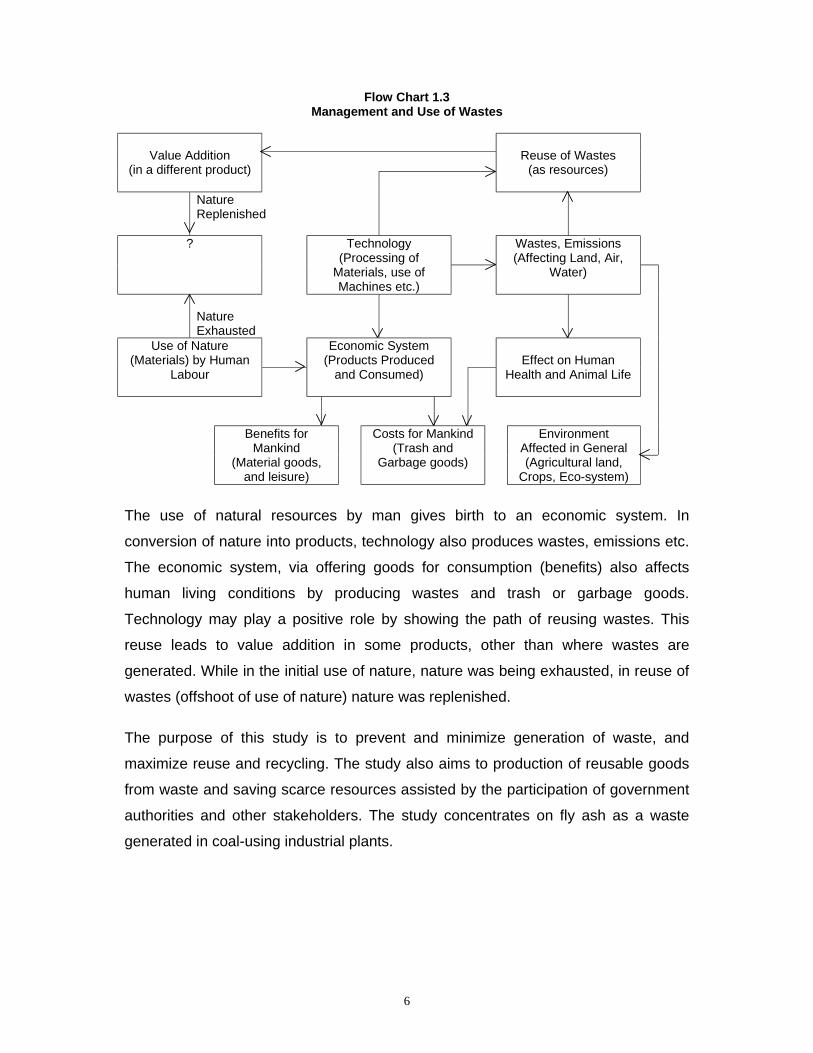
The use of natural resources by man gives birth to an economic system. In
conversion of nature into products, technology also produces wastes, emissions etc.
The economic system, via offering goods for consumption (benefits) also affects
human living conditions by producing wastes and trash or garbage goods.
Technology may play a positive role by showing the path of reusing wastes. This
reuse leads to value addition in some products, other than where wastes are
generated. While in the initial use of nature, nature was being exhausted, in reuse of
wastes (offshoot of use of nature) nature was replenished.
The purpose of this study is to prevent and minimize generation of waste, and
maximize reuse and recycling. The study also aims to production of reusable goods
from waste and saving scarce resources assisted by the participation of government
authorities and other stakeholders. The study concentrates on fly ash as a waste
generated in coal-using industrial plants.
7
Chapter 2 : Generation of Industrial Wastes: Disposal and Dumping of Fly Ash
2.1 Wastes: Definition and Type
A plant as a production unit uses some products considered as inputs. Whether or
not the inputs are blended in an optimal ratio (ratio determined technologically in the
sense of maximizing output per period per unit of composite input), there remains
some residue. This residue is seen generally as an excess of inputs used over what
is required for optimality (Gupta and Kashikar, 1997, p. 462). This definition of waste
as an excess of inputs used over what (optimum) is required is relevant for
combination of inputs like machine-power and man-hour, energy and time spent, etc.
The inputs are required for producing final output of a product in a particular plant,
given the state of technology chosen by the plant.
The type of waste in our study refers to the wastes generated at the level of the plant, given the optimality in use of resources (machine-man-material, time, energy etc.), We concentrate on solid wastes. The fly ash is generated in a Thermal Power Plant or any coal using plant. Generation of this type of waste, as a component of solid waste, is not to be understood as reflections of technological limitations, underproduction, or non-application of scale economies in production, lack of planning or improper planning at the plant level, managerial inefficiency etc. These wastes are a natural outcome of the inputs used. We assume that there is no perfect substitute of these inputs being
used at present or in the foreseeable medium-term period. The context is thus
production of electricity in a Thermal Power Plant or use of coal as energy input in a
fertilizer plant, and the problem is generation of inescapable wastes (for example, fly
ash). Generally, these solid wastes from industries are disposed off by discharging
the wastes on the heaps that occupy land (GOI, DST, TIFAC, 1990, Nov. p.1). We assume that the task is not to consider elimination of wastes, but to plan for its re-use. This re-use can convert a liability into an asset.
2.1.1 Industrial Wastes: Types
A waste in a plant becomes hazardous depending on both the product and the inputs
used. The intensity of hazard depends also on the location of the plant, the mode of
8
transport for carrying the product/inputs etc. If these factors, namely location and
transport, are planned (in the sense of elimination of risk/failure at both the levels,
inside the plant and outside for human settlements), then also the effect of industrial
waste is felt, e.g, on water, air, land etc. (Mattew and Unnikrishnan, 1997, p. 603).
This effect is felt by disposal and dumping of wastes. This may be shown by the
Flow Chart 2.1.
2.2 Fly Ash: Definition and Types
Fly ash is 'the finely divided residue resulting from the combustion of ground or powered coal which is transported from the firebox through the boiler by flue gases'. Fly ash is the mineral matter in coal that is left behind after combustion of coal. This is known in UK as pulverized fuel ash (pfa). Pulverized
fuel combustion is in operation for the last half a century. Most of the large boilers in
industrial plants use this technique. 'Formation of ash is the outcome of the
combustion of coal in the boiler at temperatures in the range of 1300ºC — 1450ºC in
presence of nearly 20 % excess air. In pulverized coal fired boilers, not only is
residence time of particles in the furnace of the order of only a couple of seconds,
but the mineral matter of coal thus released is finely dispersed on account of the
fineness of the pulverized coal itself. ... Moving upwards with high velocity, some of
the fine particles of ash get agglomerated into coarser yet fine particles, which
become highly destructive during their passage through the connective zone of the
boiler' (GOI, DST, TIFAC, 1995, August, p. 21-22). The effluents produced during
coal combustion are determined both by the composition of the fuel and by the
method of combustion. The elements that make up the fuel and the oxidant in which
it is burnt, are ultimately discharged to the environment with consequent
environmental effects (Chadwick, Highton, and Lindman, 1987, p. 81). In case of
pulverized fuel (coal) combustion 'the oxidant stream is greater than the force of
gravity on the particles, and coal powder (< 200 µm in diameter) or pulverized fuel is
blown into the furnace which has a number of burners. The pulverized fuel is
combusted in suspension. A small fraction of the ash falls to the bottom of the furnace (bottom ash) where it can be removed. However, the major part is carried
away as particulate in the flue gas (pulverized fuel ash or PFA)' (Chadwick, Highton,
and Lindman, 1987, p. 83). Fly ash possesses pozzolanic properties similar to

9
naturally occurring pozzolanic materials, primarily of volcanic or sedimentary origin.
About 2000 years ago the Romans mixed volcanic ash, called pulvis puteolanus
(later changed to 'pozzolana') with lime to produce mortar and concrete. A pozzolan
is a siliceous or siliceous and aluminous material, which in itself possesses little or
no cementitious value but will in finely divided form and in the presence of moisture,
chemically react with calcium hydroxide at ordinary temperatures to form compounds
possessing cementitious properties (ACI 226.3R-87, p. 9).
Flow Chart 2.1: Disposal and Dumping of Industrial Wastes
Disposal by Surface
Transport etc.
Plant Producing Wastes
Dumping of Wastes
Effect on Infrastructure and
Public Life
Effect on Air, Water, Land etc.
Effect on Green Environment
(Plantations, e.g.)
Effect on Crop Area and Natural Resources
Effect on Human Health
There are two types of ash found in a coal-using plant. Generally, this ash is
associated with Power Plants, though other plants using coal as energy also
generate ash. The types of ash thus generated are bottom ash and fly ash (NTPC,
1999, Oct., p. 31).
Bottom Ash: Bottom ash is found at the bottom of Boiler furnace following burning
of coal for generation of energy. This ash has relatively higher carbon content and
lower fineness.
Fly (Dry) Ash: This ash is very fine, found in powder form. The size of one particle of
this ash varies from about one micron to 300 microns. This ash is collected from
different fields of Electro-Static Precipitators (ESP) in dry form. 'The design of ESP
depends upon the electrical and physical characteristics of fly ash as well as
capacity of the furnace and the stack height. Free escape of fly ash into the
10
atmosphere is prevented as the furnace gases are made to pass through
electrostatic precipitators, a pair of electrodes, sometimes in association with
mechanical arresters. There is a discharge electrode at high potential, and a
grounded collecting electrode. The gas ions in the corona are attracted towards the
collecting electrode. The fly ash thus gets deposited. The fly ash is collected in
hoppers and disposed off' (GOI, DST, TIFAC, 1995, August, p. 23-24). This ash is
characterized by relatively lower carbon content and higher fineness. Fineness of fly
ash becomes more in subsequent fields of ESP as compared to initial fields. The ash in dry form has pozzolanic properties, which helps it to react with free lime to be fit for being a useful construction material.
2.3 Disposal of Fly Ash
There are three main methods of disposal of fly ash by the ash generating plant. The
first one is selecting a nearby area and disposing fly ash in that area (generally on
land), the second one is mixing fly ash with water and discharging the slurry into
planned ash pond located inside the ash generating plant or outside, the third is
discharging fly ash in ravines in close proximity to the ash generating plant. The first
choice is not feasible unless it is a deserted area. The soft choice for fly ash disposal
is ash pond, because it happens to be the easiest and cheapest method for the ash
generating plant. Usually ash is sluiced to a lagoon near the plant with water
maintained in the lagoon. The existing small size or declining availability of land near
the plant and continuous water discharge may restrict this easy method of disposal
of fly ash. The problems of leaching along with ponding of wastes draw attention to
selection of a pond site, its size, lining of the pond, possible height of the pond and
treatment of the sludge discharged to reduce its porosity and permeability. Also,
continual removal of the surface layer of water that develops in the pond from
rainwater or other runoff is necessary (Congressional Office of Technology
Assessment, n.d., p. 242).
2.4 Dumping of Fly Ash
The problems and limitations associated with disposal of fly ash by ash ponding may
encourage the ash generating plants to ash dumping. The dumping takes mainly the
nature of landfill. For landfill purposes the ash is collected dry and the sludge is

11
dewatered and/or treated to improve its structural properties. In this form, the wastes
are more easily transportable than the wet sludge. This allows the landfill site to be
away from the ash generating plant. The site selected for dumping is a matter of
concern. Probably it is a less valuable location. However, there is no fixed value of
any particular site. The other factor is transportation cost of dried and treated sludge.
Because of the problems associated with both disposal and dumping of fly ash, the
apparently soft choices are not feasible. The alternative thus lies in utilization of
these wastes.
Dumping of fly ash is generally planned in the sense that the dumping authority
knows the location, size and shape of the dumping of ash by quantity known at
present and estimated for future. This dumping till date has taken two shapes for
industries functioning in India, one is Ash Pond, and the other is Ash Mountain.
Ash Pond: The ash generated in coal-using plants is accumulated over time, the
rate of generation being higher than the current rate of utilization. The unutilized ash
is mixed with water to form slurry and is pumped either to develop low lying areas or
pumped to the designated ash dumping areas. The ash mixed with water to form
slurry in a specially constructed ash dump area is known as Ash Pond. Ash pond is a
mixture of bottom ash and fly ash. While ash is mixed with water to form slurry, the
pozzolanic properties of dry ash are reduced.
Ash Mountain: It is a system of collection and storage of dry fly ash. This is Ash
Mountain, as different from the slurry mode of ash collection and disposal.
2.5 Cost of Disposal of Fly Ash for the Ash Generating Plant
For disposal of fly ash, the plant needs to incur both capital and recurring costs. The
capital costs include expenditure on civil works like setting of pipes, and pumps.
Since fly ash is highly abrasive, the installed pipes and pumps are subjected to high
depreciation costs. There comes thus recurring expenditure on maintenance of ash
pond pipe line. The recurring expenditure comes also on treatment of ash pond
effluents and recycling or partial recycling of water. There comes also administrative
expenditure on operation of ash-slurry disposal system. These are over and above
construction and development of ash ponds.
12
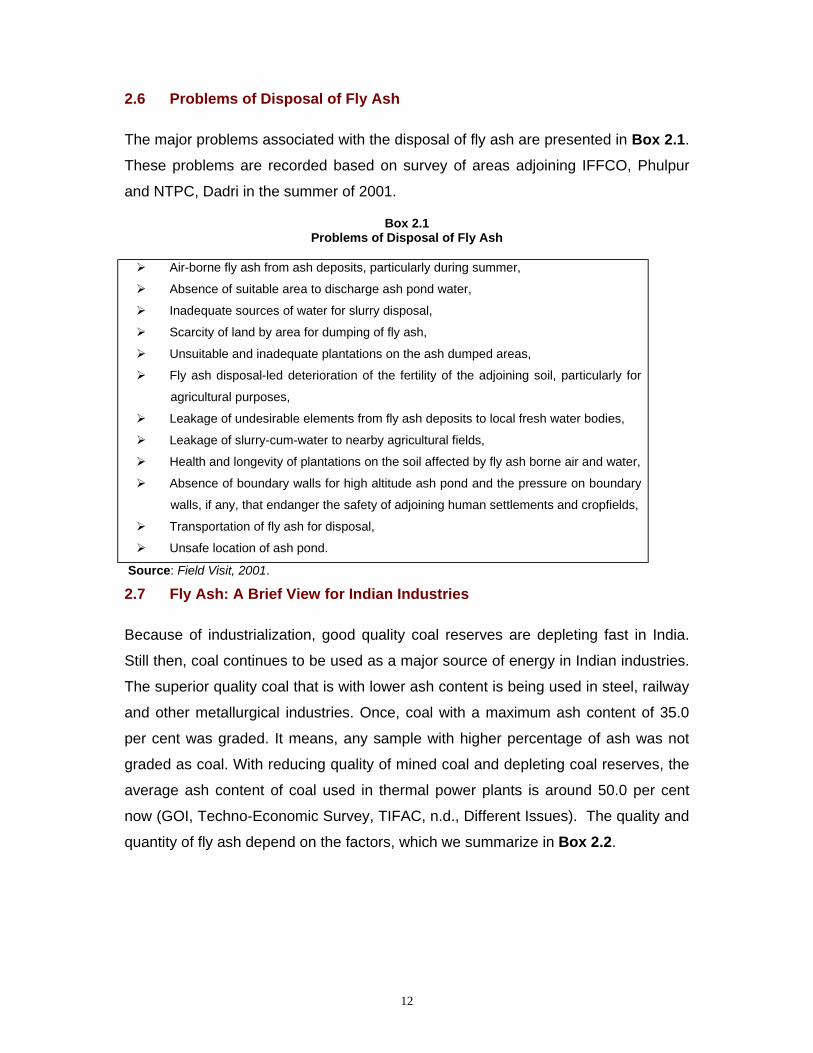
2.6 Problems of Disposal of Fly Ash
The major problems associated with the disposal of fly ash are presented in Box 2.1.
These problems are recorded based on survey of areas adjoining IFFCO, Phulpur
and NTPC, Dadri in the summer of 2001.
Box 2.1 Problems of Disposal of Fly Ash
! Air-borne fly ash from ash deposits, particularly during summer,
! Absence of suitable area to discharge ash pond water,
! Inadequate sources of water for slurry disposal,
! Scarcity of land by area for dumping of fly ash,
! Unsuitable and inadequate plantations on the ash dumped areas,
! Fly ash disposal-led deterioration of the fertility of the adjoining soil, particularly for
agricultural purposes,
! Leakage of undesirable elements from fly ash deposits to local fresh water bodies,
! Leakage of slurry-cum-water to nearby agricultural fields,
! Health and longevity of plantations on the soil affected by fly ash borne air and water,
! Absence of boundary walls for high altitude ash pond and the pressure on boundary
walls, if any, that endanger the safety of adjoining human settlements and cropfields,
! Transportation of fly ash for disposal,
! Unsafe location of ash pond.
Source: Field Visit, 2001.
2.7 Fly Ash: A Brief View for Indian Industries
Because of industrialization, good quality coal reserves are depleting fast in India.
Still then, coal continues to be used as a major source of energy in Indian industries.
The superior quality coal that is with lower ash content is being used in steel, railway
and other metallurgical industries. Once, coal with a maximum ash content of 35.0
per cent was graded. It means, any sample with higher percentage of ash was not
graded as coal. With reducing quality of mined coal and depleting coal reserves, the
average ash content of coal used in thermal power plants is around 50.0 per cent
now (GOI, Techno-Economic Survey, TIFAC, n.d., Different Issues). The quality and
quantity of fly ash depend on the factors, which we summarize in Box 2.2.
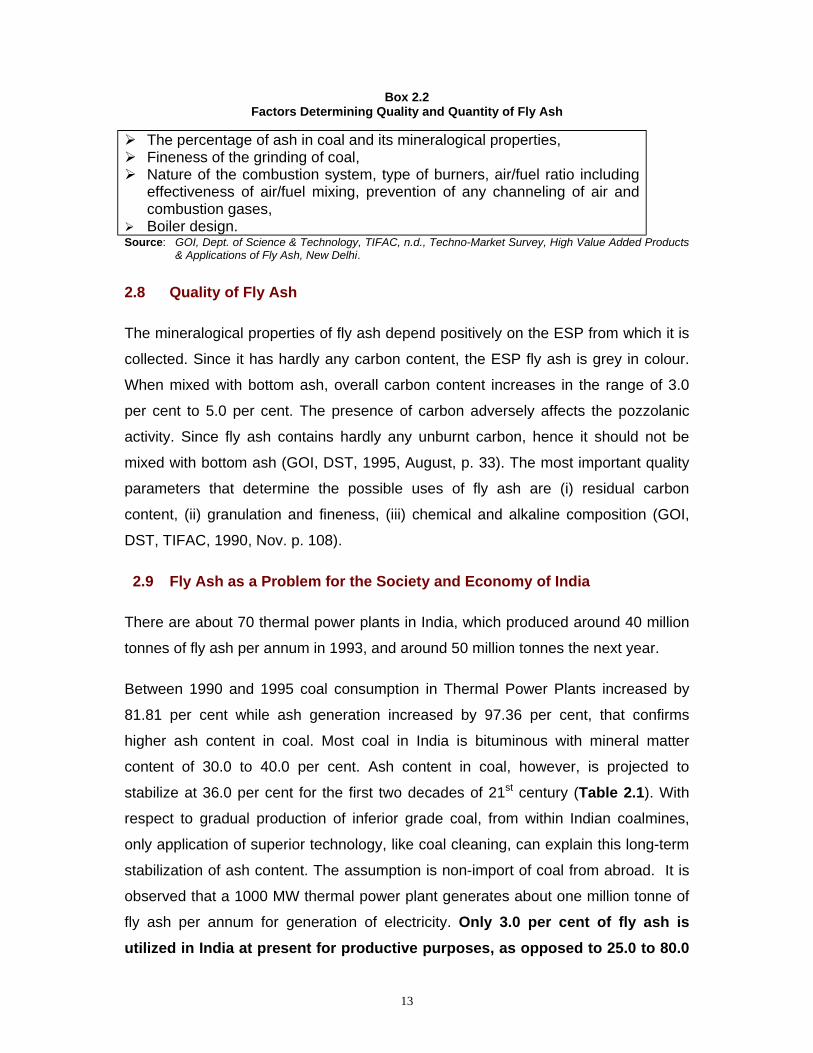
13
Box 2.2 Factors Determining Quality and Quantity of Fly Ash
! The percentage of ash in coal and its mineralogical properties, ! Fineness of the grinding of coal, ! Nature of the combustion system, type of burners, air/fuel ratio including
effectiveness of air/fuel mixing, prevention of any channeling of air and combustion gases,
! Boiler design. Source: GOI, Dept. of Science & Technology, TIFAC, n.d., Techno-Market Survey, High Value Added Products
& Applications of Fly Ash, New Delhi.
2.8 Quality of Fly Ash
The mineralogical properties of fly ash depend positively on the ESP from which it is
collected. Since it has hardly any carbon content, the ESP fly ash is grey in colour.
When mixed with bottom ash, overall carbon content increases in the range of 3.0
per cent to 5.0 per cent. The presence of carbon adversely affects the pozzolanic
activity. Since fly ash contains hardly any unburnt carbon, hence it should not be
mixed with bottom ash (GOI, DST, 1995, August, p. 33). The most important quality
parameters that determine the possible uses of fly ash are (i) residual carbon
content, (ii) granulation and fineness, (iii) chemical and alkaline composition (GOI,
DST, TIFAC, 1990, Nov. p. 108).
2.9 Fly Ash as a Problem for the Society and Economy of India
There are about 70 thermal power plants in India, which produced around 40 million
tonnes of fly ash per annum in 1993, and around 50 million tonnes the next year.
Between 1990 and 1995 coal consumption in Thermal Power Plants increased by
81.81 per cent while ash generation increased by 97.36 per cent, that confirms
higher ash content in coal. Most coal in India is bituminous with mineral matter
content of 30.0 to 40.0 per cent. Ash content in coal, however, is projected to
stabilize at 36.0 per cent for the first two decades of 21st century (Table 2.1). With
respect to gradual production of inferior grade coal, from within Indian coalmines,
only application of superior technology, like coal cleaning, can explain this long-term
stabilization of ash content. The assumption is non-import of coal from abroad. It is
observed that a 1000 MW thermal power plant generates about one million tonne of
fly ash per annum for generation of electricity. Only 3.0 per cent of fly ash is utilized in India at present for productive purposes, as opposed to 25.0 to 80.0
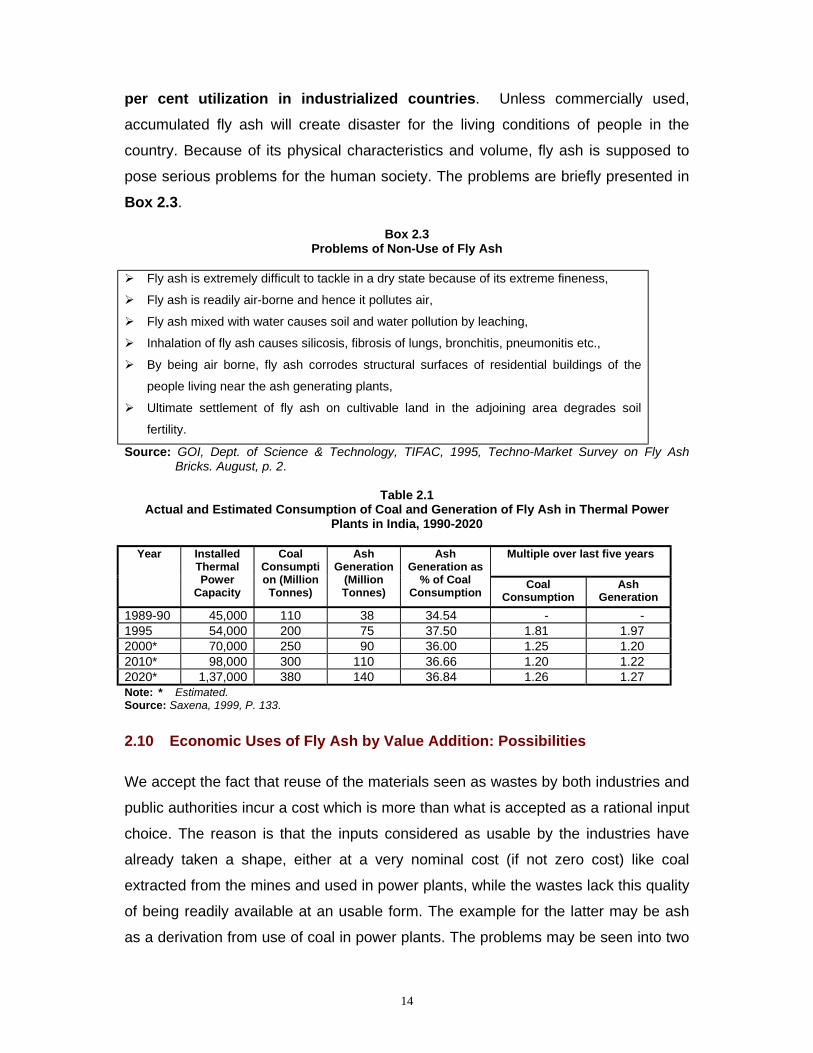
14
per cent utilization in industrialized countries. Unless commercially used,
accumulated fly ash will create disaster for the living conditions of people in the
country. Because of its physical characteristics and volume, fly ash is supposed to
pose serious problems for the human society. The problems are briefly presented in
Box 2.3.
Box 2.3 Problems of Non-Use of Fly Ash
! Fly ash is extremely difficult to tackle in a dry state because of its extreme fineness,
! Fly ash is readily air-borne and hence it pollutes air,
! Fly ash mixed with water causes soil and water pollution by leaching,
! Inhalation of fly ash causes silicosis, fibrosis of lungs, bronchitis, pneumonitis etc.,
! By being air borne, fly ash corrodes structural surfaces of residential buildings of the
people living near the ash generating plants,
! Ultimate settlement of fly ash on cultivable land in the adjoining area degrades soil
fertility.
Source: GOI, Dept. of Science & Technology, TIFAC, 1995, Techno-Market Survey on Fly Ash Bricks. August, p. 2.
Table 2.1
Actual and Estimated Consumption of Coal and Generation of Fly Ash in Thermal Power Plants in India, 1990-2020
Multiple over last five years Year Installed
Thermal Power
Capacity
Coal Consumption (Million Tonnes)
Ash Generation
(Million Tonnes)
Ash Generation as
% of Coal Consumption
Coal Consumption
Ash Generation
1989-90 45,000 110 38 34.54 - - 1995 54,000 200 75 37.50 1.81 1.97 2000* 70,000 250 90 36.00 1.25 1.20 2010* 98,000 300 110 36.66 1.20 1.22 2020* 1,37,000 380 140 36.84 1.26 1.27 Note: * Estimated. Source: Saxena, 1999, P. 133.
2.10 Economic Uses of Fly Ash by Value Addition: Possibilities
We accept the fact that reuse of the materials seen as wastes by both industries and
public authorities incur a cost which is more than what is accepted as a rational input
choice. The reason is that the inputs considered as usable by the industries have
already taken a shape, either at a very nominal cost (if not zero cost) like coal
extracted from the mines and used in power plants, while the wastes lack this quality
of being readily available at an usable form. The example for the latter may be ash
as a derivation from use of coal in power plants. The problems may be seen into two
15
parts, one being discovering substitutes of coal as an energy in the industrial sector
or finding superior grade coal to produce lesser fly ash per unit of generation of
electricity, the other being utilizing coal as it is and trying to reuse the fly ash
generated from coal-burning. Discovering substitutes of coal is a long-term task. We
concentrate on reuse and internalization of fly ash generated from utilization of coal.
We make a distinction between reuse and internalization of wastes in the industrial
sector. Reuse implies that wastes generated in industries are possible materials of
use anywhere, while internalization implies utilization of the industrial wastes in an
inter-industrial frame. In application, however, this distinction is often blurred. The
example may be the reuse of fly ash in surface transport. The inter-industrial use of
fly ash is also often unplanned, both with respect to quantity of the waste used in a
separate plant and timing of setting up of the second plant that absorbs a part of the
fly ash generated in the first plant.
The Geotechnical Properties of fly ash allow it to be used in construction of roads
and embankments, structural fills etc. The Pozzolanic Properties of fly ash allow it to
be used in manufacture of cement, concrete and its products, building materials etc.
The physical and chemical properties of fly ash are similar to those of soil, implying
that essential plant nutrients are present in fly ash also. These physio-chemical
properties of fly ash allow it to be used in agriculture/soil amendment (NTPC Guide,
Oct., 1999, p. 41).
By economic uses of fly ash, we mean use of technologies and production of
commodities that add to the value to the final user of the products. The fly ash
products may be for both private and public uses. The value addition may be low,
medium, and high. In Box 2.4 we enlist some of the possibilities for value-addition in
fly ash products.

16
Box 2.4 Products from Utilization of Fly Ash: Some Possibilities
! Extraction of minerals from fly ash
- Extraction of alumina
- Extraction of magnetite
- Extraction of cenospheres
! Manufacturing of cement
- Fly ash-lime- calcined gypsum (FaL-G) cement
- Fly ash slag cement
- Portland pozzolana cement
! Fly ash bricks and blocks
! Road surfacing and pavement construction
! Mine fill and embankments
! Fly ash as soil stabilizer and fertilizer agent
! Fly ash as a base material for building distempers
! Fly ash as domestic cleaning material
! Fly Ash as partial replacement of cement in prefabricated structures. Source: GOI, DST, TIFAC, 1995, Techno-Market Survey on Fly-Ash Bricks, August, p. 36-43.
GOI, DST, TIFAC, 1990, Techno-Market Survey on Technologies for Disposal of Thermal Power Station Fly Ash, Nov. p. 98-99.
GOI, DST, TIFAC, n.d.(2), Techno-Market Survey on Fly Ash Prefabrication, Technology and Market, p. 20, 25, 27.
In terms of productive use, fly ash is seen as a raw material or as a filling material.
As a filling material, it may be used for wasteland reclamation and purification of
polluted water in pond. As a raw material, it may be used in cement and bricks,
substituting for stone and clay. By extension, the fly ash bricks and cement may be
used in construction purposes (roads, dams, tunnels, railway sleepers and other
infrastructure). Fly ash as filler may substitute sand, soil and gravel for road and
pavement construction. These uses are very much confirmed from experiences of
uses of fly ash across the developed countries in the world (GOI, DST, TIFAC, 1990,
Nov., p. 101-123).
17
Chapter3 : Internalization of Industrial Wastes: The Case of Fly Ash
Fly ash is a waste generated by coal combustion facilities from particulate control
devices, the bottom ash and slag from the boilers, and the sludge from flue-gas
desulfurization (FGD) systems. 'The ash is an alkaline material consisting of
insoluble inorganic elements (most of which are enriched in concentration compared
to their natural abundance), as well as elevated levels of radionuclides'
(Congressional Office of Technology Assessment, n.d., p. 240). Fly ash consists of
water-soluble species, mainly calcium, magnesium, potassium, sulfate, and chloride.
These species cover a maximum of ten per cent of the ash. The presence of these
materials may lead to leaching of ash components into surface and ground waters
unless the ash is disposed in a planned manner. The materials like calcium sulfate or
calcium sulfite consists of small and thin crystals that settle so slowly as to make the
sludge difficult to dewater and thus contributing to its physical instability. The
disposal methods will show if the undesirable elements in FGD wastes enter surface
or ground water. The disposal methods that are in practice are ash ponds, landfill,
and utilization for productive purposes (Congressional Office of Technology
Assessment, n.d., p. 241).
3.1 Fly Ash: An Industrial Waste or an Intermediate Product?
Generally, the governments in the developing countries see industrial wastes as
materials to get rid of. Hence, comes the question of management of these wastes in
terms of disposal and dumping. The questions of how to reduce these wastes at the
technology-cum- production point and how to reuse the wastes remain unnoticed.
The industries as autonomous decision-makers in selection of products and
technologies can thus bypass the problems that grow out of disposal and dumping of
wastes. It is known that planned final product(s) at the level of any plant also
produces garbage and trash. These market-delinked wastes can well be market-
linked if the apparent wastes are seen either by its originator or by some sister
concern as intermediate products or inputs. The problem can be seen specifically
from two sides, one being the technological side of reducing the wastes by selection
of substitute products of material-saving technologies for the same product and the
other being reuse of the wastes. We center on an inter-industrial frame for
18
internalization of industrial wastes. This internalization rests on the productive uses
of wastes.
Many of the problems regarding disposal and dumping of fly ash need addressing a
number of suggestions, and programme actions. Rather than trying to respond to all
the problems of disposal and dumping of fly ash, we concentrate on reuse of fly ash.
In case of possibility of reuse of fly ash, the problems of disposal and dumping
remain planned and generally of short-duration in nature. By reuse, the adverse
effects of spread of fly ash on environment is also reduced when the emissions from
unwanted disposal are avoided, and resources are saved. The reuse leads to value
addition when the ash is transformed into some other exchange-based products
(Cornelissen, dr. ir, Hans, 1999, p. 24).
3.2 Objectives of the Study
We will study two industrial plants located in two districts of Uttar Pradesh, India.
These selected districts are Allahabad and Ghaziabad. The plants are selected such
that coal happens to be the basic input for production of their respective final
products. Use (burning) of coal leads to fly ash. This coal-converted ‘fly ash’ may be
considered as a natural physical waste. We will examine the techno-economic
feasibility of converting ‘fly ash’ into economic ‘goods’, through internalization of fly
ash within the industrial plants. This may also show the path of resource recovery.
Thus, the objectives of our study will be to examine
(i) How the generation of fly ash by the chosen industrial plants can be reduced
per unit of final output;
(ii) How ‘fly ash’ generated in one industrial plant is transformed into final product
within the same or in another industrial plant;
(iii) How are the adjoining areas, like those for human settlements, crop fields etc.
affected by generation of fly ash in the industrial plant;
(vi) What type of alternative products and technologies can be thought of to
ensure long-term internalization of fly ash.

19
The study will concentrate on both the possibility of reducing the generation of fly
ash and find out the ways of using fly ash. Thus, we will study the techno-economic
possibilities of internalizing fly ash through reuse. An analysis of the effects of fly ash
on the environment will be a part of the study.
3.3 Coverage of the Study
One of the two plants that we select is the Phulpur Unit of the Indian Farmers
Fertilizers Cooperative Ltd. (IFFCO), in the district of Allahabad, Uttar Pradesh. The
second plant that we select is the Dadri unit of the NTPC (National Thermal Power
Corporation) in the district of Ghaziabad, Uttar Pradesh.
The Phulpur Unit of IFFCO is a fertilizer plant that uses coal as a basic physical input
and produces fertilizer as the final output. In the production process, fly ash is
generated. Our purpose will be to examine management of ‘fly ash’, a waste that can
also be seen as a byproduct. The Phulpur Unit of IFFCO is a modern fertilizer
complex having a 900 tons per day Ammonia plant and 1500 tons per day Urea
plant. In addition to coal, the Unit uses naphtha, fuel oil, water and electricity as other
physical inputs. Coal happens to be the main fuel for boilers, and a small quantity of
fuel oil is used as support fuel for proper combustion of coal. We will examine if, and
how far, this Unit internalizes ‘fly ash’. We will see if it uses fly ash inside its own
plant premises in producing products like bricks, or if it controls fly ash by converting
it into an ash pond or ash mountain. We will also see if the Unit sells fly ash to some
other plants.
The Dadri Unit of the NTPC generates electricity with an installed capacity of 840
MW. It operates using both coal and gas as basic inputs. In the Thermal unit of the
Dadri power plant, fly ash is generated as a byproduct. We will examine the scope of
ash utilization by the Dadri Unit. We will see if the Unit controls fly ash as ash pond,
or as ash mountain, and if it utilizes fly ash inside the plant for producing products
like bricks, or if it sells fly ash to some other firms.
In both the cases, we will examine the nature and cost of disposal of fly ash, and the
net benefits from utilization of fly ash. In both the cases, we will examine the cost-
benefit implications of utilization of fly ash.
20
3.4 Methodology of the Study
We will study the methods the selected plants have been using to control and reuse
fly ash. In addition to collecting data from the Reports and Records of these Units,
we will collect primary data through observations and conversation with the R&D
personnel of the selected plants.
We will examine the actual and techno-economic possibilities of utilization of fly ash
in products of use. For this, we will select a number of economic activities in the
manufacturing sector based on information on utilization of fly ash in India from
secondary sources (Box 3.2). These activities will be manufacturing bricks and
cement though we are aware that there are other areas of utilization of fly ash. In
selection of manufacturing units we will follow the Notification dated 14 Sept., 1999
of the Ministry of Environment and Forests (MOE&F), Government of India (NTPC
Guide, Oct., 1999, p. 7). We will use structured schedules for collection of
information from the brick and cement plants, located adjacent to the selected
IFFCO and NTPC plants, in accordance with the Notification of the MOE&F, GOI,
1999. We will use structured schedules for interviewing people affected in the areas
adjoining the selected industrial plants that generate and dispose of fly ash. We will
use questionnaire to get ideas from experts on utilization of fly ash.
3.5 Manufacturing Bricks: The Technological Possibilities of Utilizing Fly Ash
We deal here with the question of brick manufacturing technologies that allow mixing
of fly ash. One such possibility of manufacturing fly ash bricks starts with a
homogeneous mixing of raw materials, namely, fly ash, sand, and lime. Some
technologies also take help of chemicals like gypsum. In a technologically fixed ratio,
the raw materials are mixed in the brick plant to manufacture green bricks. The
'steam method or watering method' cure the green bricks. The method of curing may
differ, for example, from water curing to steam curing at low pressure or autoclaving
at 10-14 kg/cm2 (NTPC Guide, Oct. 1999, p. 46). The second is mixing of fly ash with
clays. However, not all clays and fly ashes are suitable for manufacturing bricks. 'In
alluvial clays where clay fraction (particles less than 0.005 mm) is below 15 % and
coarser particles (more than 0.02 mm) above 50 %, fly ash can only be pushed to
21
the extent of 20 %. The clay fraction provides plasticity to clay-fly ash-water system
and facilitates smooth moulding. It bonds fly ash particles and is responsible for
green and dry strength of bricks. Hence, addition of larger proportions of fly ash in
clays having poor clay fractions presents problems during moulding and drying.
Black cotton clays, on the other hand, are quite plastic even at a lower clay fraction.
This is due to montmorillonitic clay mineral present in them. These clays can,
therefore, be incorporated with larger amounts of fly ash for brick manufacture’ (GOI,
DST, TIFAC, 1995, Aug. p. 78-79). For fly ash bricks, it is desirable that the oxide
composition should be similar to ordinary brick clays – the silica content should be
over 40.0 per cent, aluminium oxide not less than 15.0 per cent, iron oxide not less
than 5.0 per cent and sulphide and soluble sulphite content insignificant (GOI, DST,
TIFAC, 1995, Aug, p. 79).
3.6 Manufacturing Fly Ash-Sand-Lime Bricks: Availability of Technologies in India
If the general climate is characterized by presence of moisture, then fly ash will react
with lime at an ordinary temperature and will develop a compound possessing
cementitious properties. 'After reactions between lime and fly ash, calcium silicate
hydrates are produced which are responsible for the high strength of the compound'.
Bricks made by mixing lime and fly ash thus become 'chemically bonded bricks'
(NTPC, Oct. 1999, p. 44).
A number of organizations/institutes in India have developed technologies for
manufacturing fly ash-sand-lime bricks. Some of them are the Central Fuel Research
Institute (CFRI), Dhanbad, National Council for Cement and Building Materials
(NCBM), Ballabhgarh, Central Building Research Institute (CBRI), Roorkee,
Ahmedabad Electricity Co. Ltd., Ahmedabad, INSWAREB, Visakhapatnam Fal-G
Technology (NTPC Guide, Oct. 1999, p. 46). We present here the fly ash brick
technology developed by CFRI, Dhanbad. We cover here the technique of
production in brief, the properties of the final product, the economy or market-
viability. The technique involves mixing of fly ash, sand, and lime in a technologically
fixed proportion with specific quantity of water and a small quantity of accelerator.
The raw mix is molded in hydraulic press. The process yields green bricks. The
22
green bricks are dried for a reasonable period and then cured in steam in low
pressure. The technique, the properties etc. are shown in Box 3.1.
The Central Power Research Institute (CPRI) has developed the technology to
manufacture acid resistant bricks using fly ash to the extent of 25.0 to 35.0 per cent.
It is also reported that semi-insulating bricks may be produced from fly ash using
china clay, saw dust, and molasses or spent lye as binder (GOI, DST, TIFAC, 1990,
Nov. p. 97).
3.6.1 Use (Utility) of Fly Ash-Sand-Lime Bricks
As are conventional clay bricks, the fly ash-sand-lime bricks are also suitable for
construction of concrete buildings and other masonry works. The fly ash bricks have
the potentialities for better use than the use of conventional clay bricks. The reasons
for this better use are the following:
(i) Fly ash bricks possess crushing strength more than that of market-tested
clay bricks; thus, fly ash bricks are fit for bearing load.
(ii) Fly ash bricks require no plastering for construction of buildings, these
bricks being uniform in shape and smooth in finish.
(iii) The weight of each fly ash brick (of equal size as the conventional bricks)
is less than each conventional (clay) brick.
(iv) Fly ash bricks are less porous than common clay bricks.
(v) Fly ash bricks satisfy the specifications of Bureau of Indian Standards
(BIS) regarding quality of such bricks.
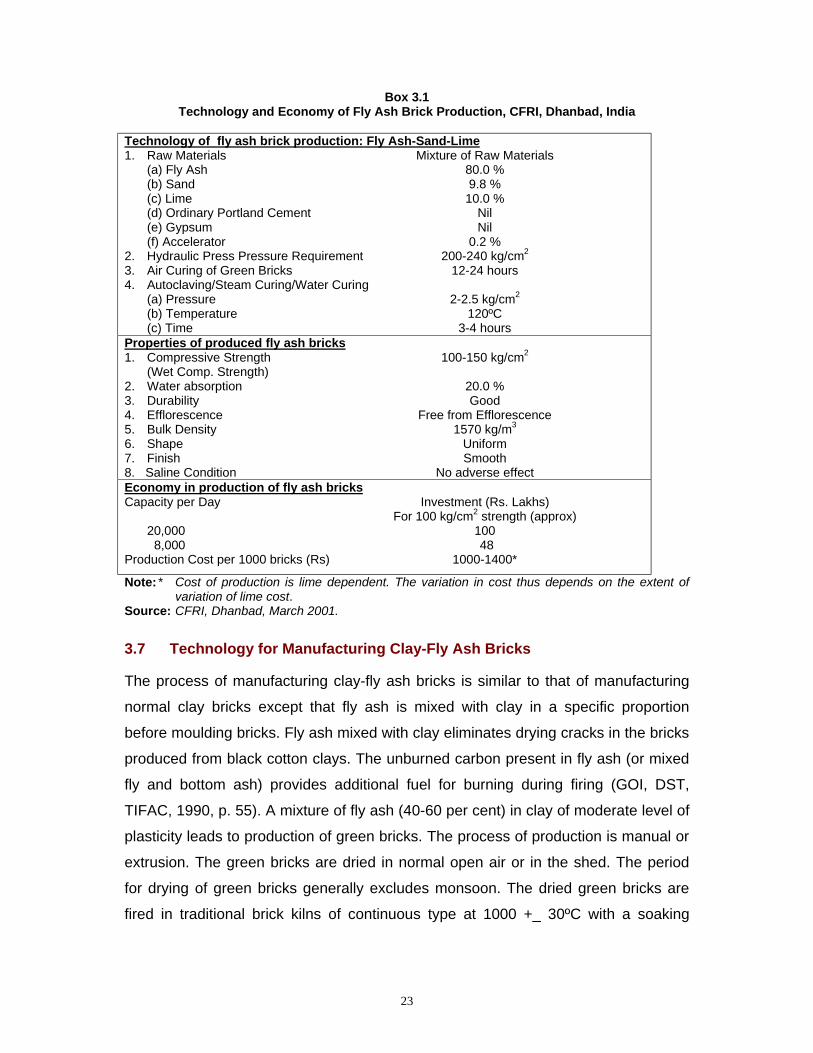
23
Box 3.1 Technology and Economy of Fly Ash Brick Production, CFRI, Dhanbad, India
Technology of fly ash brick production: Fly Ash-Sand-Lime 1. Raw Materials Mixture of Raw Materials (a) Fly Ash 80.0 % (b) Sand 9.8 % (c) Lime 10.0 % (d) Ordinary Portland Cement Nil (e) Gypsum Nil (f) Accelerator 0.2 % 2. Hydraulic Press Pressure Requirement 200-240 kg/cm2 3. Air Curing of Green Bricks 12-24 hours 4. Autoclaving/Steam Curing/Water Curing (a) Pressure 2-2.5 kg/cm2 (b) Temperature 120ºC (c) Time 3-4 hours Properties of produced fly ash bricks 1. Compressive Strength 100-150 kg/cm2 (Wet Comp. Strength) 2. Water absorption 20.0 % 3. Durability Good 4. Efflorescence Free from Efflorescence 5. Bulk Density 1570 kg/m3 6. Shape Uniform 7. Finish Smooth 8. Saline Condition No adverse effect Economy in production of fly ash bricks Capacity per Day Investment (Rs. Lakhs) For 100 kg/cm2 strength (approx) 20,000 100 8,000 48 Production Cost per 1000 bricks (Rs) 1000-1400*
Note: * Cost of production is lime dependent. The variation in cost thus depends on the extent of variation of lime cost.
Source: CFRI, Dhanbad, March 2001.
3.7 Technology for Manufacturing Clay-Fly Ash Bricks
The process of manufacturing clay-fly ash bricks is similar to that of manufacturing
normal clay bricks except that fly ash is mixed with clay in a specific proportion
before moulding bricks. Fly ash mixed with clay eliminates drying cracks in the bricks
produced from black cotton clays. The unburned carbon present in fly ash (or mixed
fly and bottom ash) provides additional fuel for burning during firing (GOI, DST,
TIFAC, 1990, p. 55). A mixture of fly ash (40-60 per cent) in clay of moderate level of
plasticity leads to production of green bricks. The process of production is manual or
extrusion. The green bricks are dried in normal open air or in the shed. The period
for drying of green bricks generally excludes monsoon. The dried green bricks are
fired in traditional brick kilns of continuous type at 1000 +_ 30ºC with a soaking

24
period of 5 to 7 hours. This yields red clay bricks. This technology was invented and
developed in Poland. The first such plant was commissioned in Poland in 1985.
3.7.1 Use (Utility) of Clay-Fly Ash Bricks
The major properties of fly ash that makes it useable for production of clay-fly ash
bricks are the following:
(i) Fly ash has physical, chemical and mineralogical properties similar to
those of clay (soil).
(ii) Unburned carbon in fly ash improves firing and reduces fuel requirement.
This leads to saving thermal energy up to 30 per cent during firing
process.
(iii) Fly ash mixture in clay has the ability to modify the drying behaviour of
sensitive plastic clays.
(iv) The mixture of fly ash in clay not only reduces excavation of precious
(scarce) top soil, but also reduces consumption of coal that would have
been required in conventional brick making.
(v) The technology requires minor changes in existing arrangement at kiln
sites. The production of mixed bricks is also not much susceptible to
quality of ash (NTPC Guideline, Oct., 1999, p. 43-44).
3.8 Utilization of Fly Ash: Practices and Possibilities
Almost all the industrialized countries utilize fly ash as much as possible. Fly ash
utilization is as high as 80.0 per cent in West Germany, 70.0 per cent in Netherlands,
65.0 per cent in Denmark, France, and Belgium, and 55.0 per cent in UK and
Poland. Denmark even imports fly ash and exports its value-added products.
Incidentally, there are no coal mines in Denmark. In Denmark, fly ash is used as filler
for stabilization of sand and gravel in road building. In case of fly ash being used as
filling material under dwellings, the Ministry of Health, Government of Denmark, has
recommended that a top layer of sand or gravel of at least 20 cm should be arranged
as protection against radioactive radiation from the ash (Jensen, 1999, p. 7). In
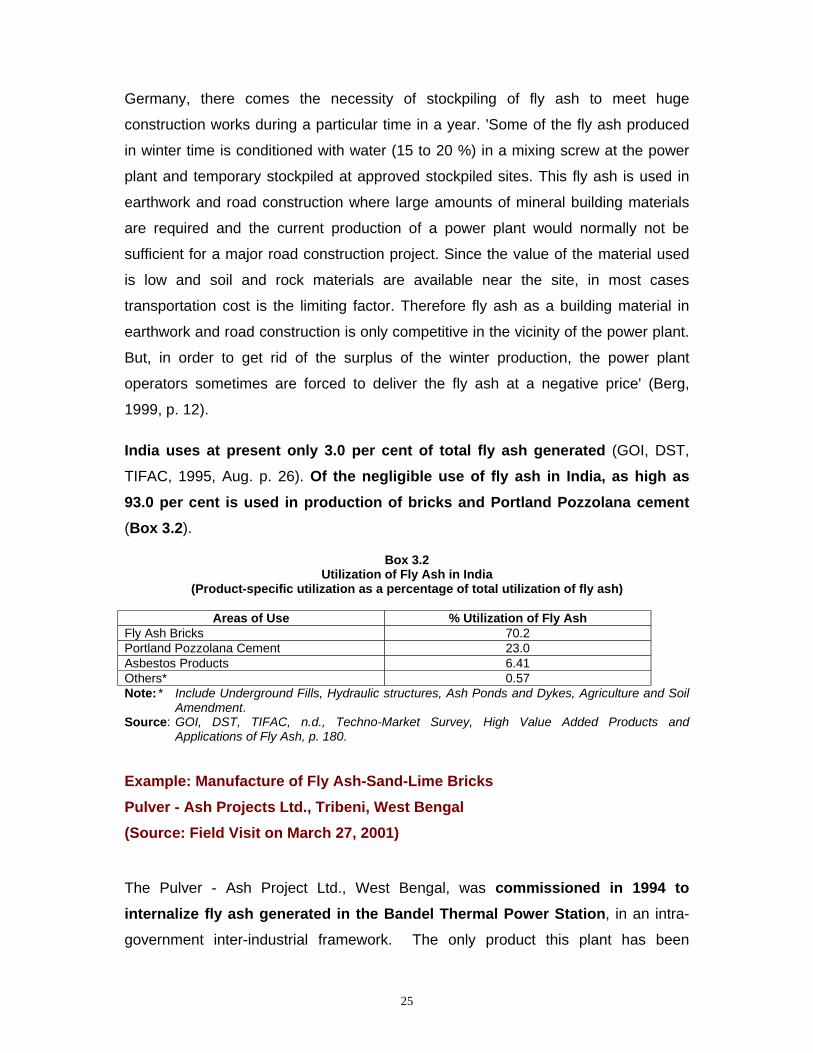
25
Germany, there comes the necessity of stockpiling of fly ash to meet huge
construction works during a particular time in a year. 'Some of the fly ash produced
in winter time is conditioned with water (15 to 20 %) in a mixing screw at the power
plant and temporary stockpiled at approved stockpiled sites. This fly ash is used in
earthwork and road construction where large amounts of mineral building materials
are required and the current production of a power plant would normally not be
sufficient for a major road construction project. Since the value of the material used
is low and soil and rock materials are available near the site, in most cases
transportation cost is the limiting factor. Therefore fly ash as a building material in
earthwork and road construction is only competitive in the vicinity of the power plant.
But, in order to get rid of the surplus of the winter production, the power plant
operators sometimes are forced to deliver the fly ash at a negative price' (Berg,
1999, p. 12).
India uses at present only 3.0 per cent of total fly ash generated (GOI, DST,
TIFAC, 1995, Aug. p. 26). Of the negligible use of fly ash in India, as high as 93.0 per cent is used in production of bricks and Portland Pozzolana cement (Box 3.2).
Box 3.2 Utilization of Fly Ash in India
(Product-specific utilization as a percentage of total utilization of fly ash)
Areas of Use % Utilization of Fly Ash Fly Ash Bricks 70.2 Portland Pozzolana Cement 23.0 Asbestos Products 6.41 Others* 0.57 Note: * Include Underground Fills, Hydraulic structures, Ash Ponds and Dykes, Agriculture and Soil
Amendment. Source: GOI, DST, TIFAC, n.d., Techno-Market Survey, High Value Added Products and
Applications of Fly Ash, p. 180. Example: Manufacture of Fly Ash-Sand-Lime Bricks Pulver - Ash Projects Ltd., Tribeni, West Bengal (Source: Field Visit on March 27, 2001)
The Pulver - Ash Project Ltd., West Bengal, was commissioned in 1994 to internalize fly ash generated in the Bandel Thermal Power Station, in an intra-
government inter-industrial framework. The only product this plant has been
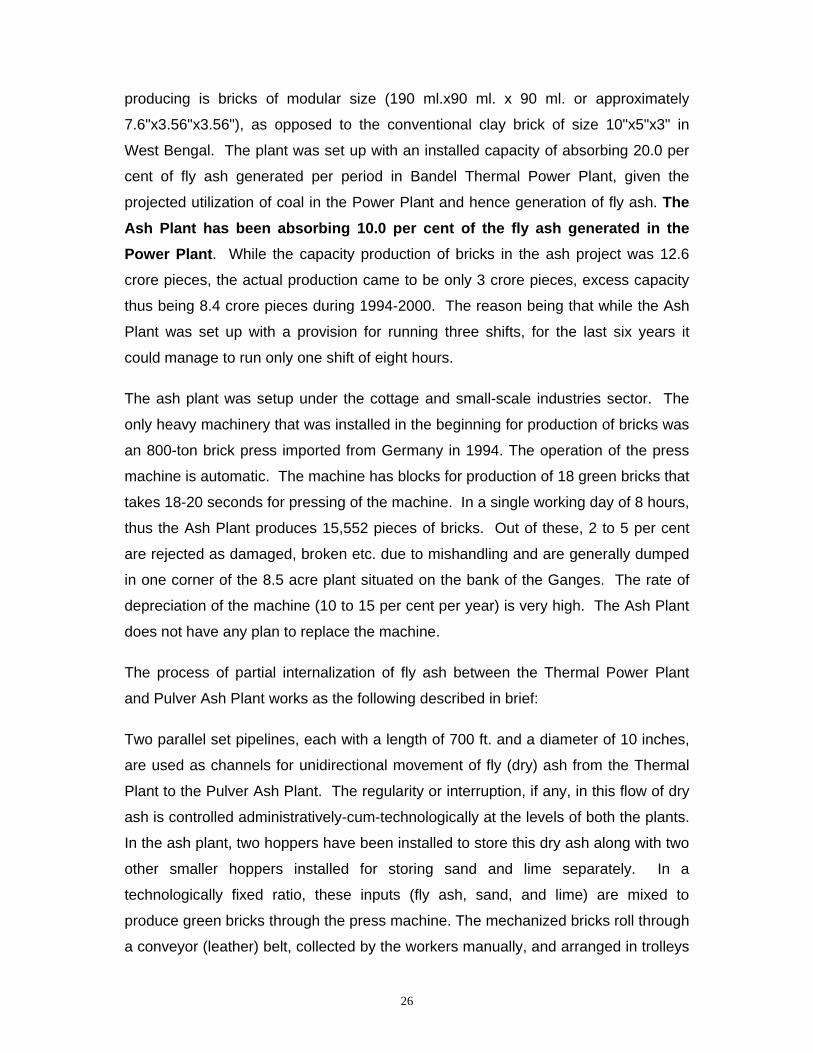
26
producing is bricks of modular size (190 ml.x90 ml. x 90 ml. or approximately
7.6"x3.56"x3.56"), as opposed to the conventional clay brick of size 10"x5"x3" in
West Bengal. The plant was set up with an installed capacity of absorbing 20.0 per
cent of fly ash generated per period in Bandel Thermal Power Plant, given the
projected utilization of coal in the Power Plant and hence generation of fly ash. The Ash Plant has been absorbing 10.0 per cent of the fly ash generated in the Power Plant. While the capacity production of bricks in the ash project was 12.6
crore pieces, the actual production came to be only 3 crore pieces, excess capacity
thus being 8.4 crore pieces during 1994-2000. The reason being that while the Ash
Plant was set up with a provision for running three shifts, for the last six years it
could manage to run only one shift of eight hours.
The ash plant was setup under the cottage and small-scale industries sector. The
only heavy machinery that was installed in the beginning for production of bricks was
an 800-ton brick press imported from Germany in 1994. The operation of the press
machine is automatic. The machine has blocks for production of 18 green bricks that
takes 18-20 seconds for pressing of the machine. In a single working day of 8 hours,
thus the Ash Plant produces 15,552 pieces of bricks. Out of these, 2 to 5 per cent
are rejected as damaged, broken etc. due to mishandling and are generally dumped
in one corner of the 8.5 acre plant situated on the bank of the Ganges. The rate of
depreciation of the machine (10 to 15 per cent per year) is very high. The Ash Plant
does not have any plan to replace the machine.
The process of partial internalization of fly ash between the Thermal Power Plant
and Pulver Ash Plant works as the following described in brief:
Two parallel set pipelines, each with a length of 700 ft. and a diameter of 10 inches,
are used as channels for unidirectional movement of fly (dry) ash from the Thermal
Plant to the Pulver Ash Plant. The regularity or interruption, if any, in this flow of dry
ash is controlled administratively-cum-technologically at the levels of both the plants.
In the ash plant, two hoppers have been installed to store this dry ash along with two
other smaller hoppers installed for storing sand and lime separately. In a
technologically fixed ratio, these inputs (fly ash, sand, and lime) are mixed to
produce green bricks through the press machine. The mechanized bricks roll through
a conveyor (leather) belt, collected by the workers manually, and arranged in trolleys
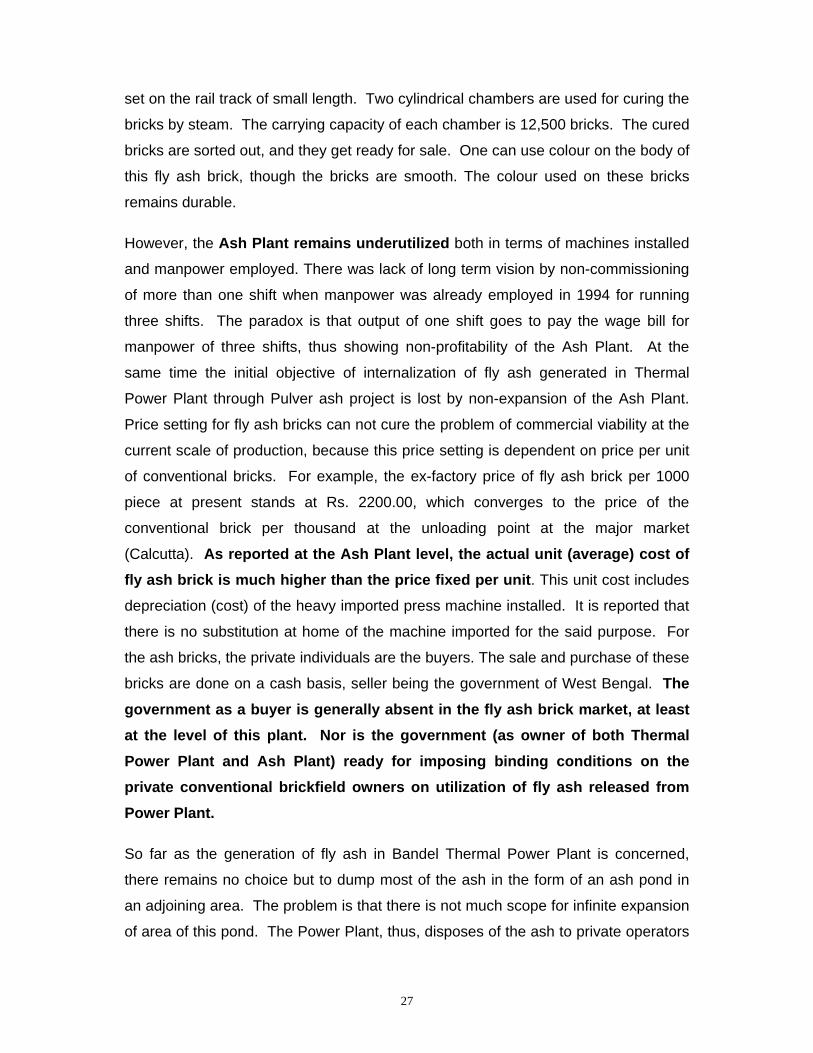
27
set on the rail track of small length. Two cylindrical chambers are used for curing the
bricks by steam. The carrying capacity of each chamber is 12,500 bricks. The cured
bricks are sorted out, and they get ready for sale. One can use colour on the body of
this fly ash brick, though the bricks are smooth. The colour used on these bricks
remains durable.
However, the Ash Plant remains underutilized both in terms of machines installed
and manpower employed. There was lack of long term vision by non-commissioning
of more than one shift when manpower was already employed in 1994 for running
three shifts. The paradox is that output of one shift goes to pay the wage bill for
manpower of three shifts, thus showing non-profitability of the Ash Plant. At the
same time the initial objective of internalization of fly ash generated in Thermal
Power Plant through Pulver ash project is lost by non-expansion of the Ash Plant.
Price setting for fly ash bricks can not cure the problem of commercial viability at the
current scale of production, because this price setting is dependent on price per unit
of conventional bricks. For example, the ex-factory price of fly ash brick per 1000
piece at present stands at Rs. 2200.00, which converges to the price of the
conventional brick per thousand at the unloading point at the major market
(Calcutta). As reported at the Ash Plant level, the actual unit (average) cost of fly ash brick is much higher than the price fixed per unit. This unit cost includes
depreciation (cost) of the heavy imported press machine installed. It is reported that
there is no substitution at home of the machine imported for the said purpose. For
the ash bricks, the private individuals are the buyers. The sale and purchase of these
bricks are done on a cash basis, seller being the government of West Bengal. The government as a buyer is generally absent in the fly ash brick market, at least at the level of this plant. Nor is the government (as owner of both Thermal Power Plant and Ash Plant) ready for imposing binding conditions on the private conventional brickfield owners on utilization of fly ash released from Power Plant.
So far as the generation of fly ash in Bandel Thermal Power Plant is concerned,
there remains no choice but to dump most of the ash in the form of an ash pond in
an adjoining area. The problem is that there is not much scope for infinite expansion
of area of this pond. The Power Plant, thus, disposes of the ash to private operators

28
through inviting public tender. For this disposal, the Power Plant pays subsidy to
private operators, that is, free supply of fly ash at the gate plus a percent of the
carrying cost. This is contrary to the interest of the Pulver Ash Project, which pays a
price to the Power Plant for buying fly (dry) ash. There is thus point in supplying
cost-free ash to the Pulver Ash Project also, and by the same process, allow the
utilization of installed capacity of the Ash Plant. The argument of capacity utilization
stands when the high capacity machine is already imported and installed and
manpower is employed for running three shifts a day. The capacity utilization also
depends on the price per unit of the product and steady sale.
3.9 Manufacture of Cement Concrete and Mortar: Technological Possibilities of Mixture of Fly Ash
Fly ash is used in manufacturing of cement concrete in the industrialized countries
like UK, and US. Technologically, the difference between fly ash and Portland
cement becomes apparent under a microscope. Fly ash particles are spherical in
shape, allowing these to flow freely and blend in mixtures. This property makes fly
ash a desirable admixture for concrete. During the period when fly ash is blend with
cement concrete, lime is liberated. The fly ash mixed with cement concrete reacts
with the lime and forms additional cementitious material. For concrete work, the ratio
at which Portland cement may vary range from 15.0 per cent to 25.0 per cent. 'Indian
Standard (IS): 456-1999 code of practice for plain and reinforced concrete allows the
use of fly ash as part replacement of Ordinary Portland Cement conforming to IS:
269. It also allows the use of fly ash as admixture and part replacement of fine
aggregates. IS: 2250 -1981 code of practice for preparation and use of masonry
mortars also specifies the use of fly ash in cement mortar/lime mortar mix' (NTPC
Guide, Oct. 1999, p. 63).
3.9.1 Benefits of Mixed Cement Concrete
The 'ball-bearing' effect of fly ash particles creates a lubricating action when concrete
is in its plastic state. This creates benefits in use of mixed fly ash cement, which are
described in Box 3.3.
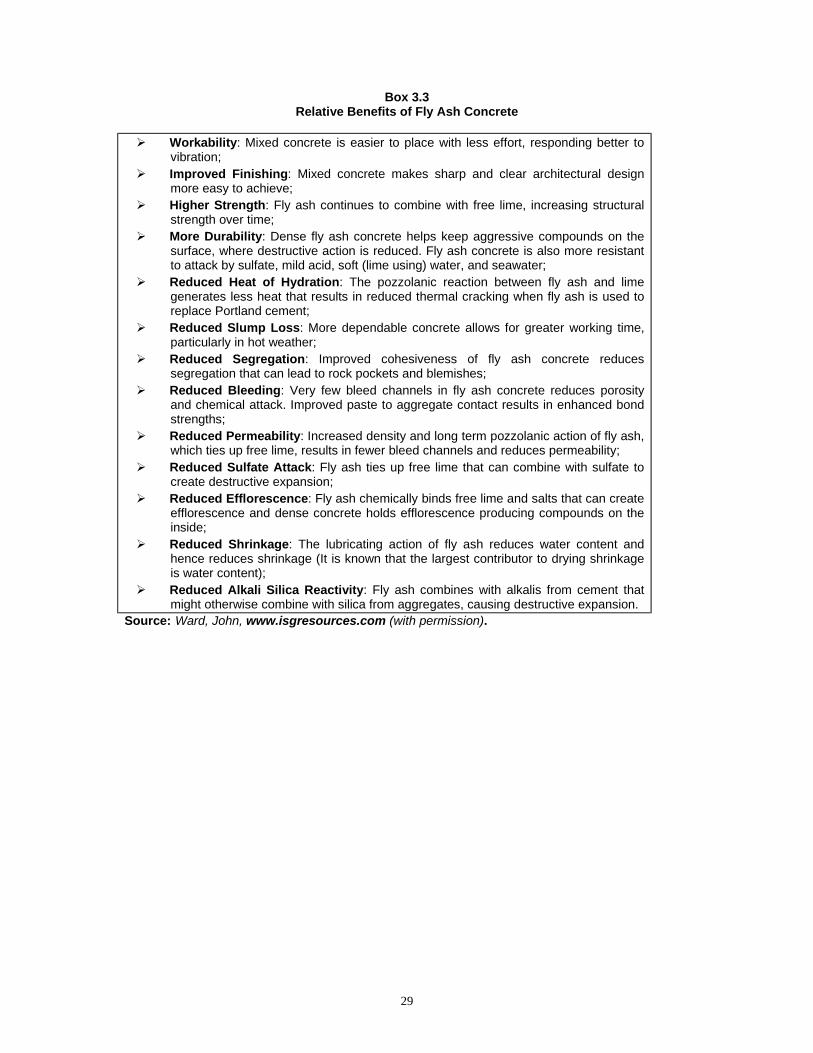
29
Box 3.3 Relative Benefits of Fly Ash Concrete
! Workability: Mixed concrete is easier to place with less effort, responding better to
vibration; ! Improved Finishing: Mixed concrete makes sharp and clear architectural design
more easy to achieve; ! Higher Strength: Fly ash continues to combine with free lime, increasing structural
strength over time; ! More Durability: Dense fly ash concrete helps keep aggressive compounds on the
surface, where destructive action is reduced. Fly ash concrete is also more resistant to attack by sulfate, mild acid, soft (lime using) water, and seawater;
! Reduced Heat of Hydration: The pozzolanic reaction between fly ash and lime generates less heat that results in reduced thermal cracking when fly ash is used to replace Portland cement;
! Reduced Slump Loss: More dependable concrete allows for greater working time, particularly in hot weather;
! Reduced Segregation: Improved cohesiveness of fly ash concrete reduces segregation that can lead to rock pockets and blemishes;
! Reduced Bleeding: Very few bleed channels in fly ash concrete reduces porosity and chemical attack. Improved paste to aggregate contact results in enhanced bond strengths;
! Reduced Permeability: Increased density and long term pozzolanic action of fly ash, which ties up free lime, results in fewer bleed channels and reduces permeability;
! Reduced Sulfate Attack: Fly ash ties up free lime that can combine with sulfate to create destructive expansion;
! Reduced Efflorescence: Fly ash chemically binds free lime and salts that can create efflorescence and dense concrete holds efflorescence producing compounds on the inside;
! Reduced Shrinkage: The lubricating action of fly ash reduces water content and hence reduces shrinkage (It is known that the largest contributor to drying shrinkage is water content);
! Reduced Alkali Silica Reactivity: Fly ash combines with alkalis from cement that might otherwise combine with silica from aggregates, causing destructive expansion.
Source: Ward, John, www.isgresources.com (with permission).

30
3.10 Methodology with Study Frame
Methodology
with Study Frame
Management and Use of Fly Ash
Reduction of Rate of Generation of Fly Ash
Effects on Adjoining Areas
Technology for Long Term Internalization
of Fly Ash
Disposal and Dumping
Use of Fly Ash Selected Plants Secondary Information
Human Settlement
Environmental Effects
Agricultural Effect Data Analysis Suggestions Collected from Field Survey
Plan
ned
Unp
lann
ed
Inte
rnal
Use
Exte
rnal
Use
Study Sources - R & D Units of
Plants - Ash Utilization
Cell of the Plant - Ash Handling
Plant
Study Sources - Fly Ash
Mission, Delhi - Literature
Review - Experts
Reports
Study Sources - Field Survey of
Adjoining Area
Study Sources - Directorate of
Environment, Lucknow
- U.P. Pollution Control Board, Lucknow
- Forest Department
- Land Reforms Department
- Sub Divisional Office
Study Sources - Information Collected
Through Primary and Secondary Sources
Study Sources Selected Plants - IFFCO, Phulpur - NTPC, Dadri
Selected Plants - IFFCO, Phulpur - NTPC, Dadri
- Conventional Brick Plants
- Cement Plants - Fly Ash Brick
Plants & Blocks etc.
Study Sources
- NTPC, Dadri - IFFCO, Phulpur - Field Survey and
Interview

31
Chapter 4 : Internalization of Fly Ash: A Study of IFFCO, Phulpur Unit, Allahabad, Uttar Pradesh
4.1 Production Networking of IFFCO, Phulpur
Indian Farmers Fertilizer Cooperative Limited (IFFCO) was set up on November 3,
1967. IFFCO is a federation of over 30,444 societies, most of them being village
cooperatives, spread over 18 states and 3 Union territories in India. IFFCO at
present owns four giant fertilizer units. These units are the Kalol and Kandla units in
Gujarat, and Phulpur and Aonla units in Uttar Pradesh.
The fertilizer complex located at Phulpur, Allahabad, was conceived in 1974 and built
at a cost of Rs. 205 crores. The total area acquired by the plant is 1068 acres,
including the area under the plant that is 321 acres. The rest of the area, that is, 747
acres, covers township, cordet, agricultural farms, green belt, ash ponds, roads, and
open space (www.iffco.nic.in). IFFCO, Phulpur unit has a production capacity of 900 Tonnes Per Day (TPD) ammonia and 1500 TPD urea. The Plant started commercial production in March 1981. The Plant includes steam and power plant,
water treatment plant, cooling towers, inert gas generation, instrument and plant air
system, naphtha and fuel oil handling system, ammonia storage and handling, urea
storage and bagging, coal and ash handling, effluent treatment plants. IFFCO,
Phulpur unit is a naphtha-based fertilizer unit. The main inputs of the plant are
naphtha, fuel oil, coal, water, and electricity (Table 4.1). Indian Oil Corporation
through Rail tankers supplies the feed stock, naphtha and fuel oil. The power plant receives coal from Central Coalfield Ltd. and Coalfields of Rajhara, Patratu, and North Ramgarh (Chaudhudy et al, 1999). For this, the mode of transport is railways. Raw water is pumped from Borewells located around the factory and
township. Electricity is mainly generated in the power plant captivated, but a
part of the electricity required is received from the UP State Electricity Board
(UPSEB).

32
Table 4.1 Inputs and Output of IFFCO, Phulpur, Uttar Pradesh
Plant Output (TPD) Name of Inputs
Used Quantity of Inputs Used
(MT per day) Naphtha 850 Fuel Oil 60 Coal 1000 Water 24,000
IFFCO, Phulpur
Ammonia, 900 Urea, 1500
Electricity* Note: * 1 MW (Megawatts), TPD: Tonnes per day Source: IFFCO, Phulpur, Plant Documents, n.d.(Documents collected in 2000).
4.1.1 Coal Specifications of IFFCO, Phulpur
IFFCO, Phulpur uses grade E/F non-coking coal. Collieries of Central Coalfields
Ltd. such as North Ramgarh and central Saunda are the sources of supply of coal.
Electricity generated in turbogenerated sets is internally used. Annual coal
consumption for the plant ranges from 3.4 to 4.0 lakh MT. Annual ash generation
ranges from 1.5 to 1.8 lakh MT. It means the ash content in coal used varies from 40.0 to 45.0 per cent. On the basis of Proximate Analysis (chemical and physical
properties of coal used in IFFCO, Phulpur), total moisture (TM) in coal used ranges
from 3.0 to 4.0 per cent, and volatile moisture (VM) ranges from 18.0 to 20.0 per
cent. Air-dried moisture ranges from 1.0 to 1.5 per cent. The plant can not use very
high VM coal (>25.0 per cent) which will form slagging and bummer damage in the
boiler. The possibility of reducing ash generation in the plant depends on availability
and use of low ash- content coal (Table 4.2).
Table 4.2 Use of Coal by IFFCO, Phulpur (By quantity and cost)
Year Use of Coal (Quantity in Lakh MT) Cost of Coal (Rs. crs, Approx.) 1998 3.85 44.0 1999 3.40 39.0 2000 4.05 46.6
Source: IFFCO, Phulpur, Allahabad.
4.1.2 Steam and Power Plant: Operations
Three coal-fired boilers have been installed to cope with the steam and power
requirements of ammonia and urea plants in IFFCO, Phulpur. Each boiler, supplied
by the BHEL, generates high-pressure steam at 110 kg/cm2g, 4650 C with a capacity
of 125 tonnes per hour. The installed boilers have been designed for fully automatic operation incorporating modern control systems. For ensuring thermal efficiency, the maximum heat recovery from the flue gas is
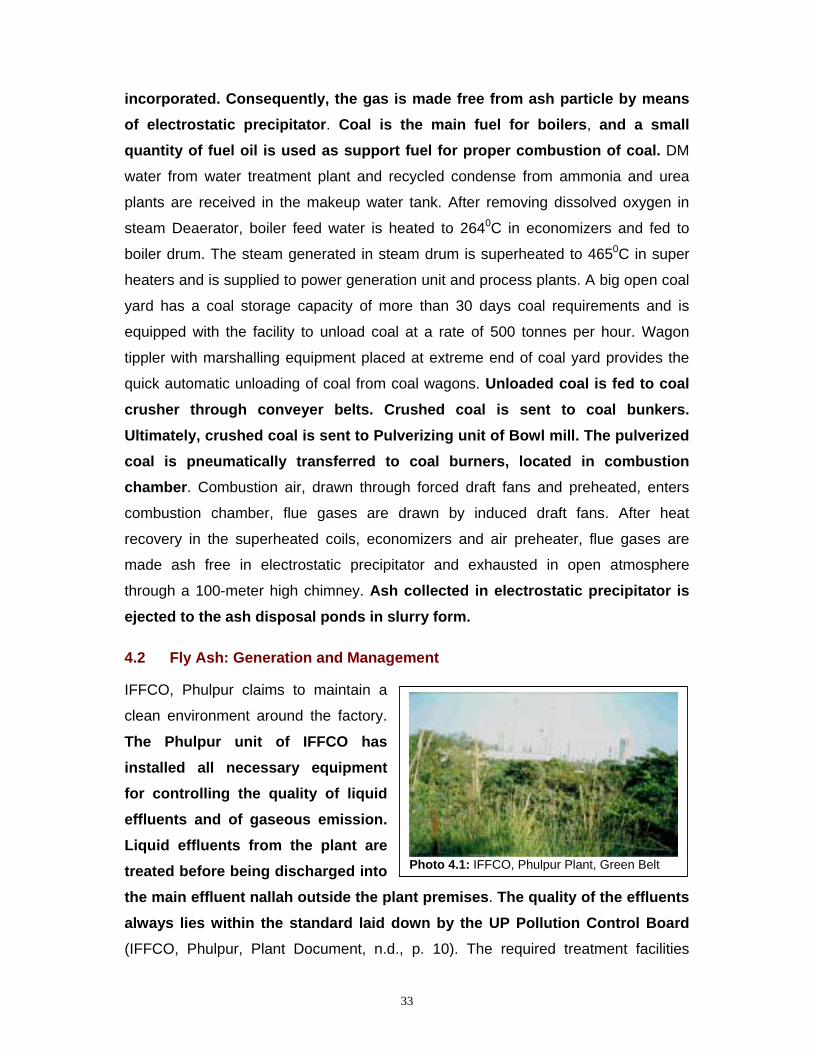
33
incorporated. Consequently, the gas is made free from ash particle by means of electrostatic precipitator. Coal is the main fuel for boilers, and a small quantity of fuel oil is used as support fuel for proper combustion of coal. DM
water from water treatment plant and recycled condense from ammonia and urea
plants are received in the makeup water tank. After removing dissolved oxygen in
steam Deaerator, boiler feed water is heated to 2640C in economizers and fed to
boiler drum. The steam generated in steam drum is superheated to 4650C in super
heaters and is supplied to power generation unit and process plants. A big open coal
yard has a coal storage capacity of more than 30 days coal requirements and is
equipped with the facility to unload coal at a rate of 500 tonnes per hour. Wagon
tippler with marshalling equipment placed at extreme end of coal yard provides the
quick automatic unloading of coal from coal wagons. Unloaded coal is fed to coal crusher through conveyer belts. Crushed coal is sent to coal bunkers. Ultimately, crushed coal is sent to Pulverizing unit of Bowl mill. The pulverized coal is pneumatically transferred to coal burners, located in combustion chamber. Combustion air, drawn through forced draft fans and preheated, enters
combustion chamber, flue gases are drawn by induced draft fans. After heat
recovery in the superheated coils, economizers and air preheater, flue gases are
made ash free in electrostatic precipitator and exhausted in open atmosphere
through a 100-meter high chimney. Ash collected in electrostatic precipitator is ejected to the ash disposal ponds in slurry form.
4.2 Fly Ash: Generation and Management
IFFCO, Phulpur claims to maintain a
clean environment around the factory.
The Phulpur unit of IFFCO has installed all necessary equipment for controlling the quality of liquid effluents and of gaseous emission. Liquid effluents from the plant are treated before being discharged into the main effluent nallah outside the plant premises. The quality of the effluents always lies within the standard laid down by the UP Pollution Control Board (IFFCO, Phulpur, Plant Document, n.d., p. 10). The required treatment facilities
Photo 4.1: IFFCO, Phulpur Plant, Green Belt

34
comprise of neutralization system for acidic and alkaline effluents, chromate
treatment plant and sludge settling system for cooling tower blowdown water, gravity
oil separators for oil recovery, ammonia distillation column for treating the amonical
effluents, ash ponds to separate the coal ash from the ash water slurry and lime
sludge, oxidation ponds using water hyacinth for domestic sewage and finally guard
ponds.
Disposal systems for dry ash and wet ash are independent. Generation of bottom
ash in the plant is 30 MT per day per boiler. For the disposal of wet bottom ash,
water consumption is 1000 M3 per boiler per day. The source of this water is
recycled effluent/drain water. The accumulated quantity of ash in ash pond is about
15.0 lakh tonnes at present. Acquiring additional land for construction of ash pond in
the neighbouring area is not possible due to socio-economic constraints. The plant
can hope to reduce the generation of
fly ash by reducing the unburned coal
and increasing the boiler efficiency.
The plant till date has no technology/technique to reduce the rate of generation of fly ash. Its
R&D (laboratory) have no role in
reducing the generation of fly ash
(Technical Division, IFFCO, Phulpur,
May 2001).
The area allotted for storage of ash (bottom, dry, and pond) inside the plant is nil,
while 70.0 per cent of the area outside the plant has already been covered for
storage of ash. The storage capacity of ash pond of the plant is 23 lakh MT of ash.
The dumping of fly ash is going not to exhaust the area that is acquired outside the plant as the ash is being supplied regularly to cement manufacturers. The rate of supply of ash far exceeds the rate of current generation of ash in the plant (Table 4.3 and Fig. 3.1a, 3.1b). For 2000-2001, the
rate of supply of fly ash was 168.0 per cent of ash generation (www.iffco.nic.in,
04.12.2001).
Photo 4.2: Ash disposal pipe from boiler to ashpond.
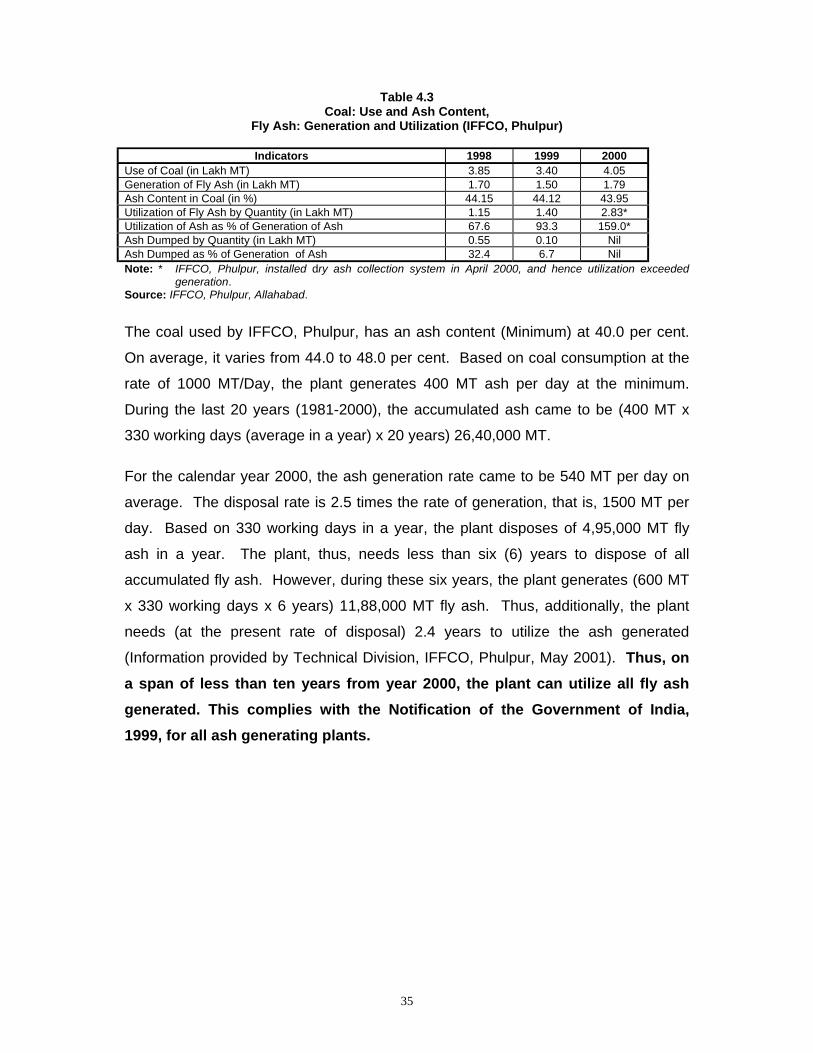
35
Table 4.3 Coal: Use and Ash Content,
Fly Ash: Generation and Utilization (IFFCO, Phulpur)
Indicators 1998 1999 2000 Use of Coal (in Lakh MT) 3.85 3.40 4.05 Generation of Fly Ash (in Lakh MT) 1.70 1.50 1.79 Ash Content in Coal (in %) 44.15 44.12 43.95 Utilization of Fly Ash by Quantity (in Lakh MT) 1.15 1.40 2.83* Utilization of Ash as % of Generation of Ash 67.6 93.3 159.0* Ash Dumped by Quantity (in Lakh MT) 0.55 0.10 Nil Ash Dumped as % of Generation of Ash 32.4 6.7 Nil Note: * IFFCO, Phulpur, installed dry ash collection system in April 2000, and hence utilization exceeded
generation. Source: IFFCO, Phulpur, Allahabad.
The coal used by IFFCO, Phulpur, has an ash content (Minimum) at 40.0 per cent.
On average, it varies from 44.0 to 48.0 per cent. Based on coal consumption at the
rate of 1000 MT/Day, the plant generates 400 MT ash per day at the minimum.
During the last 20 years (1981-2000), the accumulated ash came to be (400 MT x
330 working days (average in a year) x 20 years) 26,40,000 MT.
For the calendar year 2000, the ash generation rate came to be 540 MT per day on
average. The disposal rate is 2.5 times the rate of generation, that is, 1500 MT per
day. Based on 330 working days in a year, the plant disposes of 4,95,000 MT fly
ash in a year. The plant, thus, needs less than six (6) years to dispose of all
accumulated fly ash. However, during these six years, the plant generates (600 MT
x 330 working days x 6 years) 11,88,000 MT fly ash. Thus, additionally, the plant
needs (at the present rate of disposal) 2.4 years to utilize the ash generated
(Information provided by Technical Division, IFFCO, Phulpur, May 2001). Thus, on a span of less than ten years from year 2000, the plant can utilize all fly ash generated. This complies with the Notification of the Government of India, 1999, for all ash generating plants.
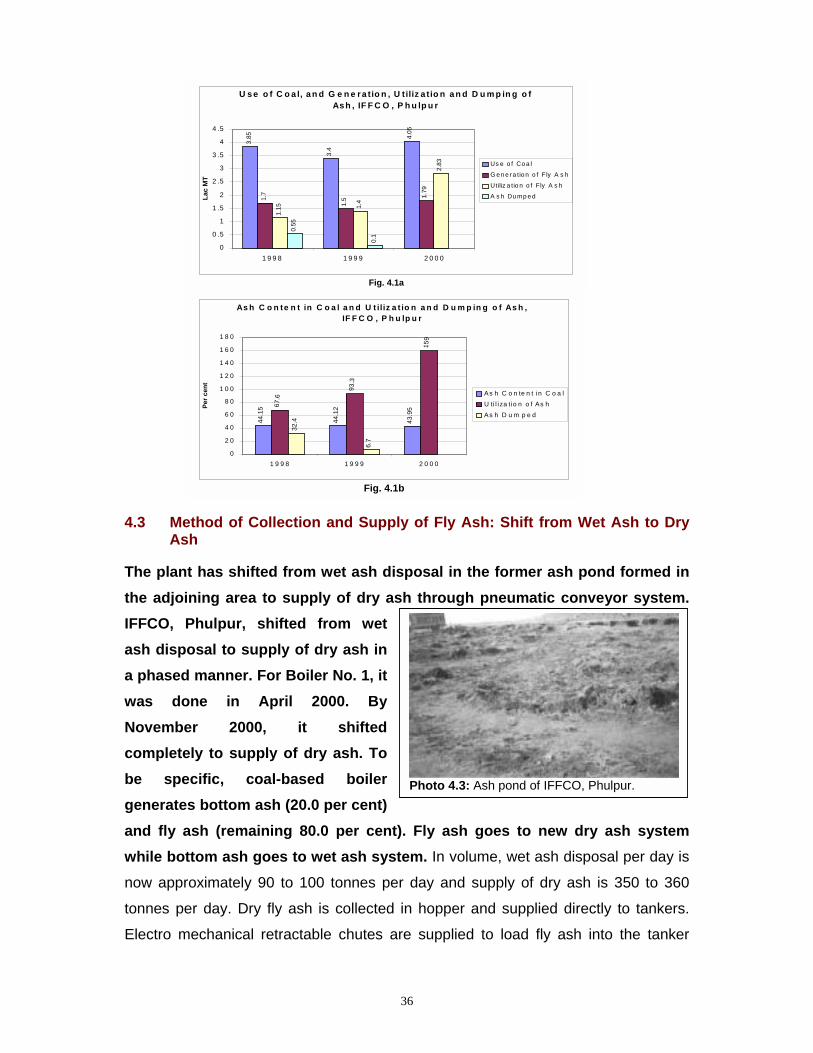
36
4.3 Method of Collection and Supply of Fly Ash: Shift from Wet Ash to Dry Ash
The plant has shifted from wet ash disposal in the former ash pond formed in the adjoining area to supply of dry ash through pneumatic conveyor system. IFFCO, Phulpur, shifted from wet ash disposal to supply of dry ash in a phased manner. For Boiler No. 1, it was done in April 2000. By November 2000, it shifted completely to supply of dry ash. To be specific, coal-based boiler generates bottom ash (20.0 per cent) and fly ash (remaining 80.0 per cent). Fly ash goes to new dry ash system while bottom ash goes to wet ash system. In volume, wet ash disposal per day is
now approximately 90 to 100 tonnes per day and supply of dry ash is 350 to 360
tonnes per day. Dry fly ash is collected in hopper and supplied directly to tankers.
Electro mechanical retractable chutes are supplied to load fly ash into the tanker
Photo 4.3: Ash pond of IFFCO, Phulpur.
U s e o f C o a l, a n d G e n e ra tio n , U tiliz a t io n a n d D u m p in g o f Ash , IF F C O , P h u lp u r
3.85
3.4
4.05
1.7
1.5 1.
79
1.15 1.
4
2.83
0.55
0.1
0
0 .5
1
1 .5
2
2 .5
3
3 .5
4
4 .5
1 9 9 8 1 9 9 9 2 0 0 0
Lac
MT
Us e o f Co a l
G e n e ra tio n o f Fly A s h
Utiliz a tio n o f Fly A s h
A s h Du mp e d
Fig. 4.1a
As h C o n te n t in C o a l a n d U t iliz a t io n a n d D u m p in g o f As h ,IF F C O , P h u lp u r
44.1
5
44.1
2
43.9
567.6
93.3
159
32.4
6.7
0
2 0
4 0
6 0
8 0
1 0 0
1 2 0
1 4 0
1 6 0
1 8 0
1 9 9 8 1 9 9 9 2 0 0 0
Per c
ent
As h C o n te n t in C o a lU ti l iza tio n o f As hAs h D u m p e d
Fig. 4.1b
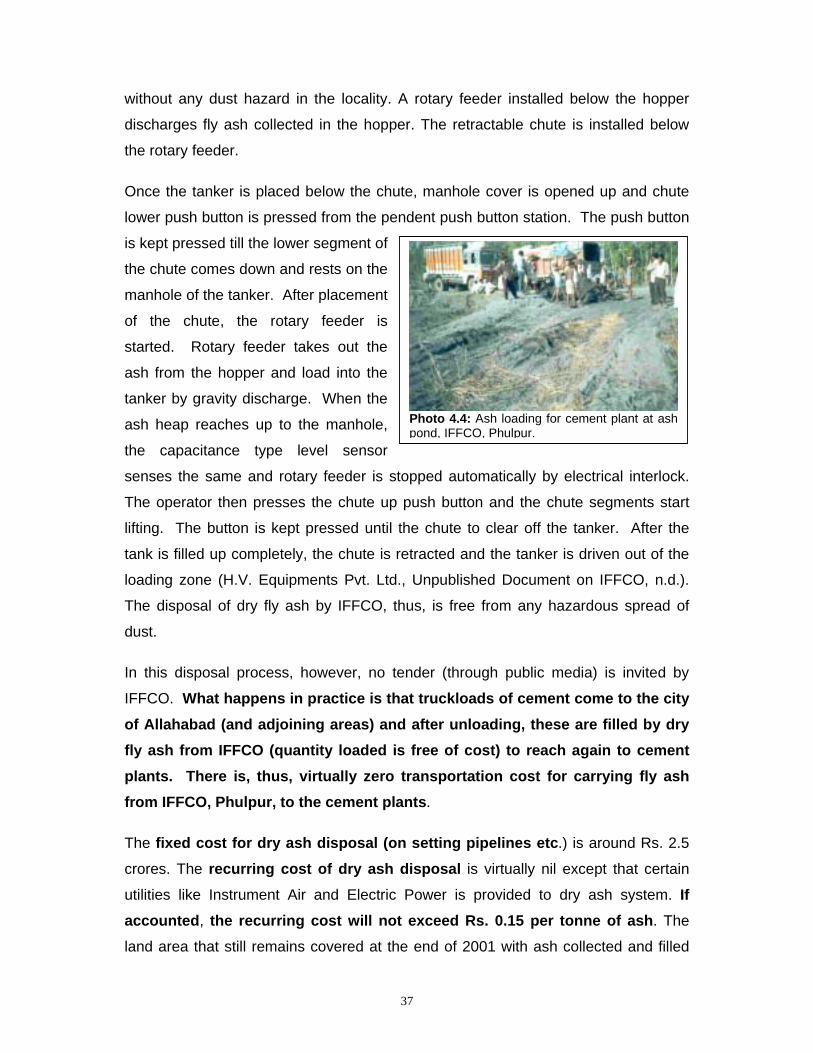
37
without any dust hazard in the locality. A rotary feeder installed below the hopper
discharges fly ash collected in the hopper. The retractable chute is installed below
the rotary feeder.
Once the tanker is placed below the chute, manhole cover is opened up and chute
lower push button is pressed from the pendent push button station. The push button
is kept pressed till the lower segment of
the chute comes down and rests on the
manhole of the tanker. After placement
of the chute, the rotary feeder is
started. Rotary feeder takes out the
ash from the hopper and load into the
tanker by gravity discharge. When the
ash heap reaches up to the manhole,
the capacitance type level sensor
senses the same and rotary feeder is stopped automatically by electrical interlock.
The operator then presses the chute up push button and the chute segments start
lifting. The button is kept pressed until the chute to clear off the tanker. After the
tank is filled up completely, the chute is retracted and the tanker is driven out of the
loading zone (H.V. Equipments Pvt. Ltd., Unpublished Document on IFFCO, n.d.).
The disposal of dry fly ash by IFFCO, thus, is free from any hazardous spread of
dust.
In this disposal process, however, no tender (through public media) is invited by
IFFCO. What happens in practice is that truckloads of cement come to the city of Allahabad (and adjoining areas) and after unloading, these are filled by dry fly ash from IFFCO (quantity loaded is free of cost) to reach again to cement plants. There is, thus, virtually zero transportation cost for carrying fly ash from IFFCO, Phulpur, to the cement plants.
The fixed cost for dry ash disposal (on setting pipelines etc.) is around Rs. 2.5
crores. The recurring cost of dry ash disposal is virtually nil except that certain
utilities like Instrument Air and Electric Power is provided to dry ash system. If accounted, the recurring cost will not exceed Rs. 0.15 per tonne of ash. The
land area that still remains covered at the end of 2001 with ash collected and filled
Photo 4.4: Ash loading for cement plant at ash pond, IFFCO, Phulpur.
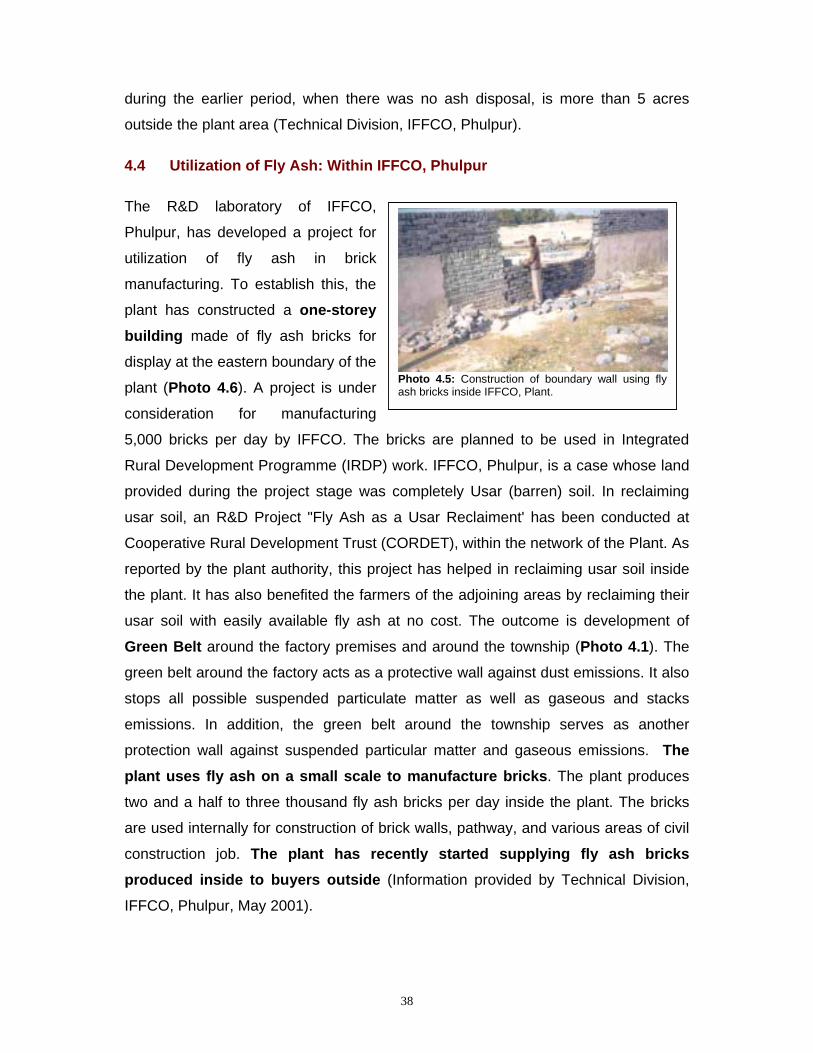
38
during the earlier period, when there was no ash disposal, is more than 5 acres
outside the plant area (Technical Division, IFFCO, Phulpur).
4.4 Utilization of Fly Ash: Within IFFCO, Phulpur
The R&D laboratory of IFFCO,
Phulpur, has developed a project for
utilization of fly ash in brick
manufacturing. To establish this, the
plant has constructed a one-storey building made of fly ash bricks for
display at the eastern boundary of the
plant (Photo 4.6). A project is under
consideration for manufacturing
5,000 bricks per day by IFFCO. The bricks are planned to be used in Integrated
Rural Development Programme (IRDP) work. IFFCO, Phulpur, is a case whose land
provided during the project stage was completely Usar (barren) soil. In reclaiming
usar soil, an R&D Project "Fly Ash as a Usar Reclaiment' has been conducted at
Cooperative Rural Development Trust (CORDET), within the network of the Plant. As
reported by the plant authority, this project has helped in reclaiming usar soil inside
the plant. It has also benefited the farmers of the adjoining areas by reclaiming their
usar soil with easily available fly ash at no cost. The outcome is development of
Green Belt around the factory premises and around the township (Photo 4.1). The
green belt around the factory acts as a protective wall against dust emissions. It also
stops all possible suspended particulate matter as well as gaseous and stacks
emissions. In addition, the green belt around the township serves as another
protection wall against suspended particular matter and gaseous emissions. The plant uses fly ash on a small scale to manufacture bricks. The plant produces
two and a half to three thousand fly ash bricks per day inside the plant. The bricks
are used internally for construction of brick walls, pathway, and various areas of civil
construction job. The plant has recently started supplying fly ash bricks produced inside to buyers outside (Information provided by Technical Division,
IFFCO, Phulpur, May 2001).
Photo 4.5: Construction of boundary wall using fly ash bricks inside IFFCO, Plant.
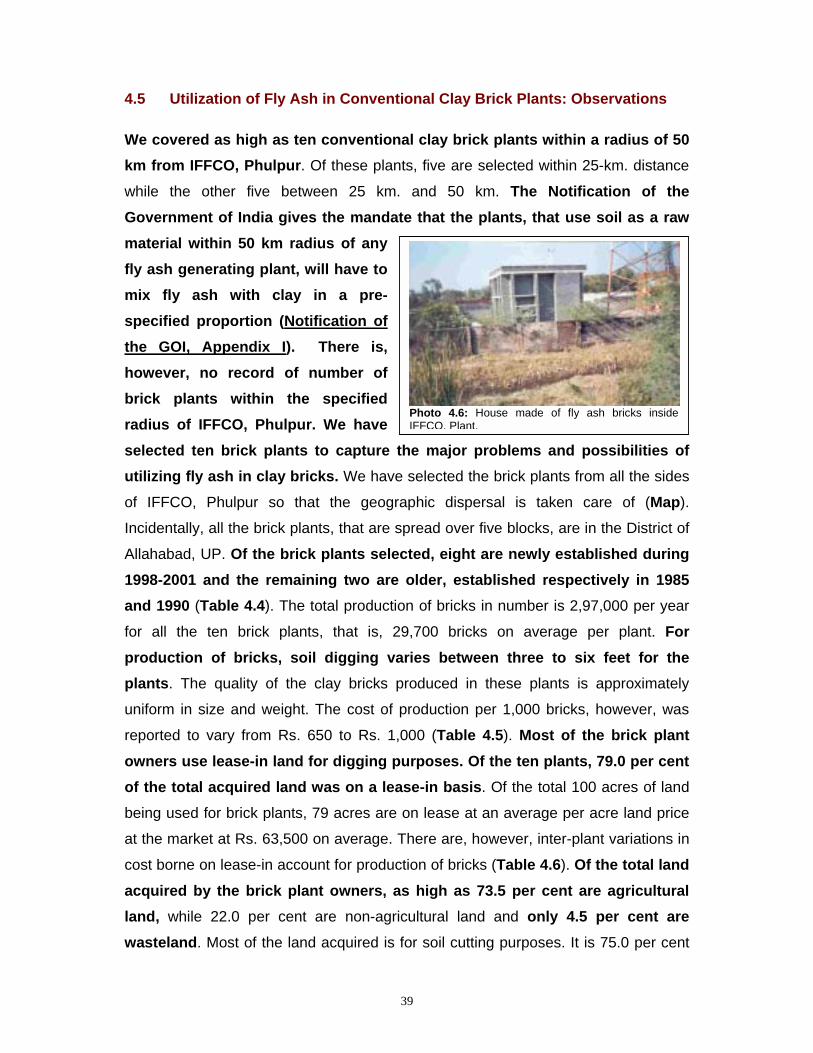
39
4.5 Utilization of Fly Ash in Conventional Clay Brick Plants: Observations
We covered as high as ten conventional clay brick plants within a radius of 50 km from IFFCO, Phulpur. Of these plants, five are selected within 25-km. distance
while the other five between 25 km. and 50 km. The Notification of the Government of India gives the mandate that the plants, that use soil as a raw material within 50 km radius of any fly ash generating plant, will have to mix fly ash with clay in a pre-specified proportion (Notification of the GOI, Appendix I). There is, however, no record of number of brick plants within the specified radius of IFFCO, Phulpur. We have selected ten brick plants to capture the major problems and possibilities of utilizing fly ash in clay bricks. We have selected the brick plants from all the sides
of IFFCO, Phulpur so that the geographic dispersal is taken care of (Map).
Incidentally, all the brick plants, that are spread over five blocks, are in the District of
Allahabad, UP. Of the brick plants selected, eight are newly established during 1998-2001 and the remaining two are older, established respectively in 1985 and 1990 (Table 4.4). The total production of bricks in number is 2,97,000 per year
for all the ten brick plants, that is, 29,700 bricks on average per plant. For production of bricks, soil digging varies between three to six feet for the plants. The quality of the clay bricks produced in these plants is approximately
uniform in size and weight. The cost of production per 1,000 bricks, however, was
reported to vary from Rs. 650 to Rs. 1,000 (Table 4.5). Most of the brick plant owners use lease-in land for digging purposes. Of the ten plants, 79.0 per cent of the total acquired land was on a lease-in basis. Of the total 100 acres of land
being used for brick plants, 79 acres are on lease at an average per acre land price
at the market at Rs. 63,500 on average. There are, however, inter-plant variations in
cost borne on lease-in account for production of bricks (Table 4.6). Of the total land acquired by the brick plant owners, as high as 73.5 per cent are agricultural land, while 22.0 per cent are non-agricultural land and only 4.5 per cent are wasteland. Most of the land acquired is for soil cutting purposes. It is 75.0 per cent
Photo 4.6: House made of fly ash bricks insideIFFCO, Plant.
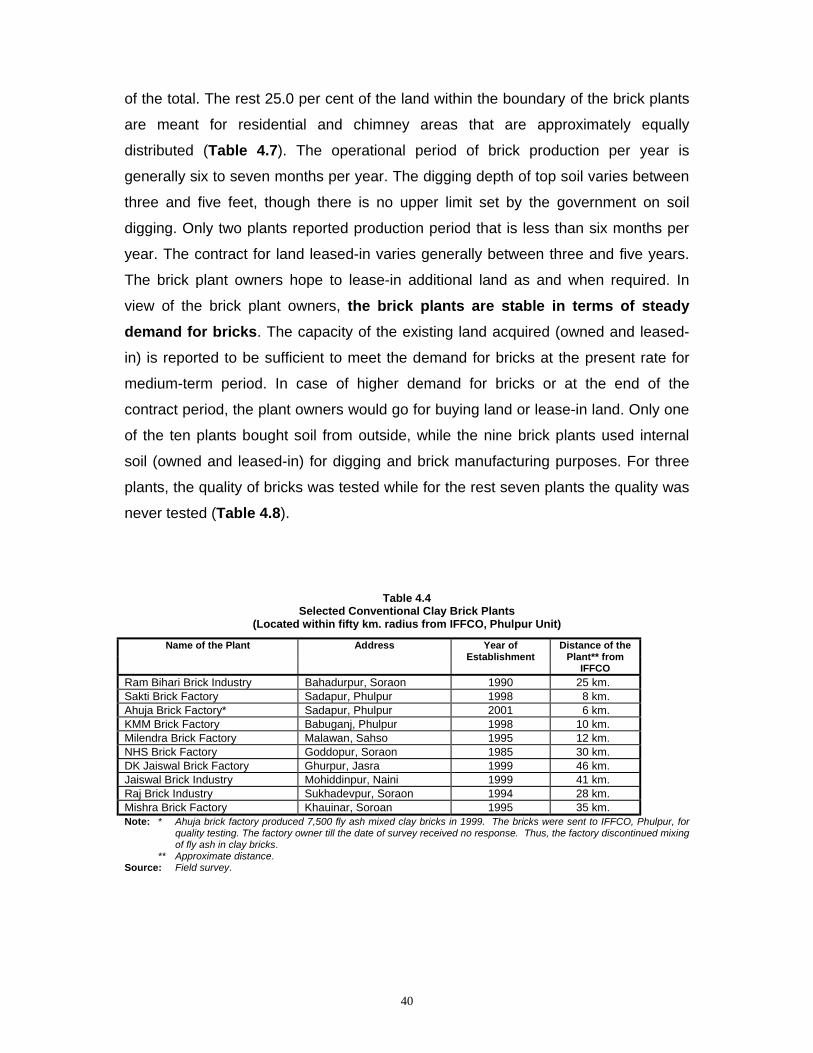
40
of the total. The rest 25.0 per cent of the land within the boundary of the brick plants
are meant for residential and chimney areas that are approximately equally
distributed (Table 4.7). The operational period of brick production per year is
generally six to seven months per year. The digging depth of top soil varies between
three and five feet, though there is no upper limit set by the government on soil
digging. Only two plants reported production period that is less than six months per
year. The contract for land leased-in varies generally between three and five years.
The brick plant owners hope to lease-in additional land as and when required. In
view of the brick plant owners, the brick plants are stable in terms of steady demand for bricks. The capacity of the existing land acquired (owned and leased-
in) is reported to be sufficient to meet the demand for bricks at the present rate for
medium-term period. In case of higher demand for bricks or at the end of the
contract period, the plant owners would go for buying land or lease-in land. Only one
of the ten plants bought soil from outside, while the nine brick plants used internal
soil (owned and leased-in) for digging and brick manufacturing purposes. For three
plants, the quality of bricks was tested while for the rest seven plants the quality was
never tested (Table 4.8).
Table 4.4
Selected Conventional Clay Brick Plants (Located within fifty km. radius from IFFCO, Phulpur Unit)
Name of the Plant Address Year of Establishment
Distance of the Plant** from
IFFCO Ram Bihari Brick Industry Bahadurpur, Soraon 1990 25 km. Sakti Brick Factory Sadapur, Phulpur 1998 8 km. Ahuja Brick Factory* Sadapur, Phulpur 2001 6 km. KMM Brick Factory Babuganj, Phulpur 1998 10 km. Milendra Brick Factory Malawan, Sahso 1995 12 km. NHS Brick Factory Goddopur, Soraon 1985 30 km. DK Jaiswal Brick Factory Ghurpur, Jasra 1999 46 km. Jaiswal Brick Industry Mohiddinpur, Naini 1999 41 km. Raj Brick Industry Sukhadevpur, Soraon 1994 28 km. Mishra Brick Factory Khauinar, Soroan 1995 35 km. Note: * Ahuja brick factory produced 7,500 fly ash mixed clay bricks in 1999. The bricks were sent to IFFCO, Phulpur, for
quality testing. The factory owner till the date of survey received no response. Thus, the factory discontinued mixing of fly ash in clay bricks.
** Approximate distance. Source: Field survey.
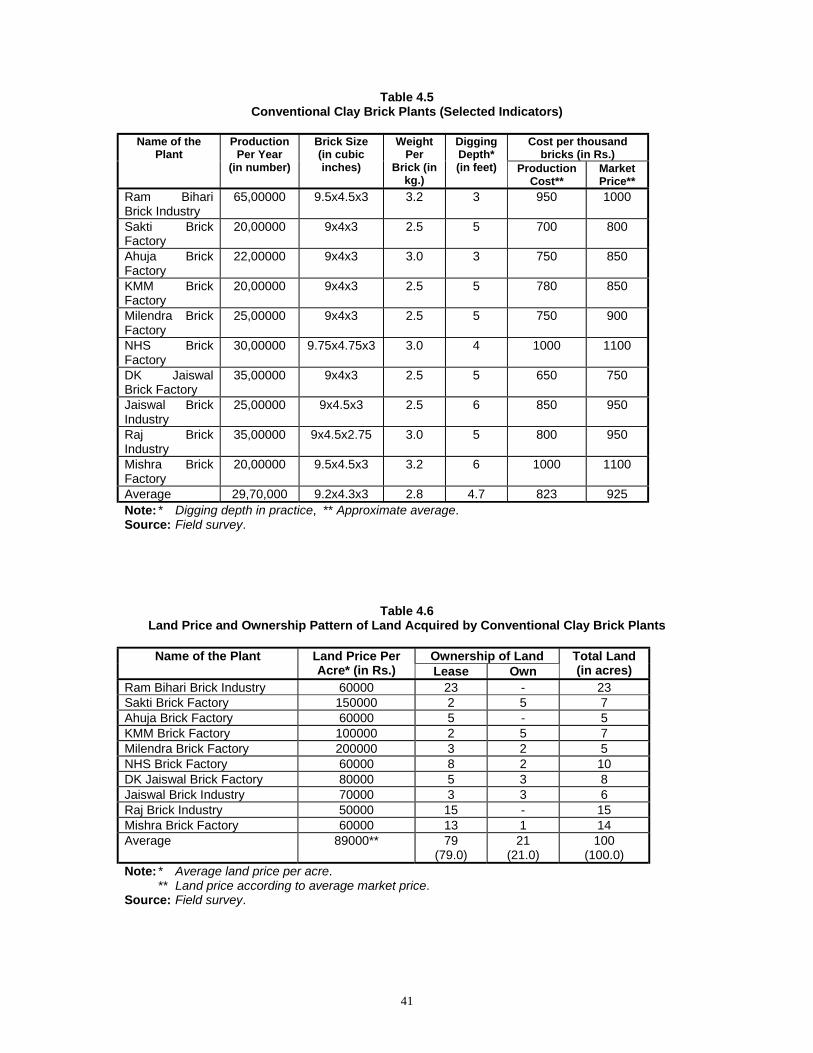
41
Table 4.5 Conventional Clay Brick Plants (Selected Indicators)
Cost per thousand
bricks (in Rs.) Name of the
Plant Production
Per Year (in number)
Brick Size (in cubic inches)
Weight Per
Brick (in kg.)
Digging Depth* (in feet) Production
Cost** Market Price**
Ram Bihari Brick Industry
65,00000 9.5x4.5x3 3.2 3 950 1000
Sakti Brick Factory
20,00000 9x4x3 2.5 5 700 800
Ahuja Brick Factory
22,00000 9x4x3 3.0 3 750 850
KMM Brick Factory
20,00000 9x4x3 2.5 5 780 850
Milendra Brick Factory
25,00000 9x4x3 2.5 5 750 900
NHS Brick Factory
30,00000 9.75x4.75x3 3.0 4 1000 1100
DK Jaiswal Brick Factory
35,00000 9x4x3 2.5 5 650 750
Jaiswal Brick Industry
25,00000 9x4.5x3 2.5 6 850 950
Raj Brick Industry
35,00000 9x4.5x2.75 3.0 5 800 950
Mishra Brick Factory
20,00000 9.5x4.5x3 3.2 6 1000 1100
Average 29,70,000 9.2x4.3x3 2.8 4.7 823 925 Note: * Digging depth in practice, ** Approximate average. Source: Field survey.
Table 4.6 Land Price and Ownership Pattern of Land Acquired by Conventional Clay Brick Plants
Ownership of Land Name of the Plant Land Price Per
Acre* (in Rs.) Lease Own Total Land (in acres)
Ram Bihari Brick Industry 60000 23 - 23 Sakti Brick Factory 150000 2 5 7 Ahuja Brick Factory 60000 5 - 5 KMM Brick Factory 100000 2 5 7 Milendra Brick Factory 200000 3 2 5 NHS Brick Factory 60000 8 2 10 DK Jaiswal Brick Factory 80000 5 3 8 Jaiswal Brick Industry 70000 3 3 6 Raj Brick Industry 50000 15 - 15 Mishra Brick Factory 60000 13 1 14 Average 89000** 79
(79.0) 21
(21.0) 100
(100.0) Note: * Average land price per acre. ** Land price according to average market price. Source: Field survey.
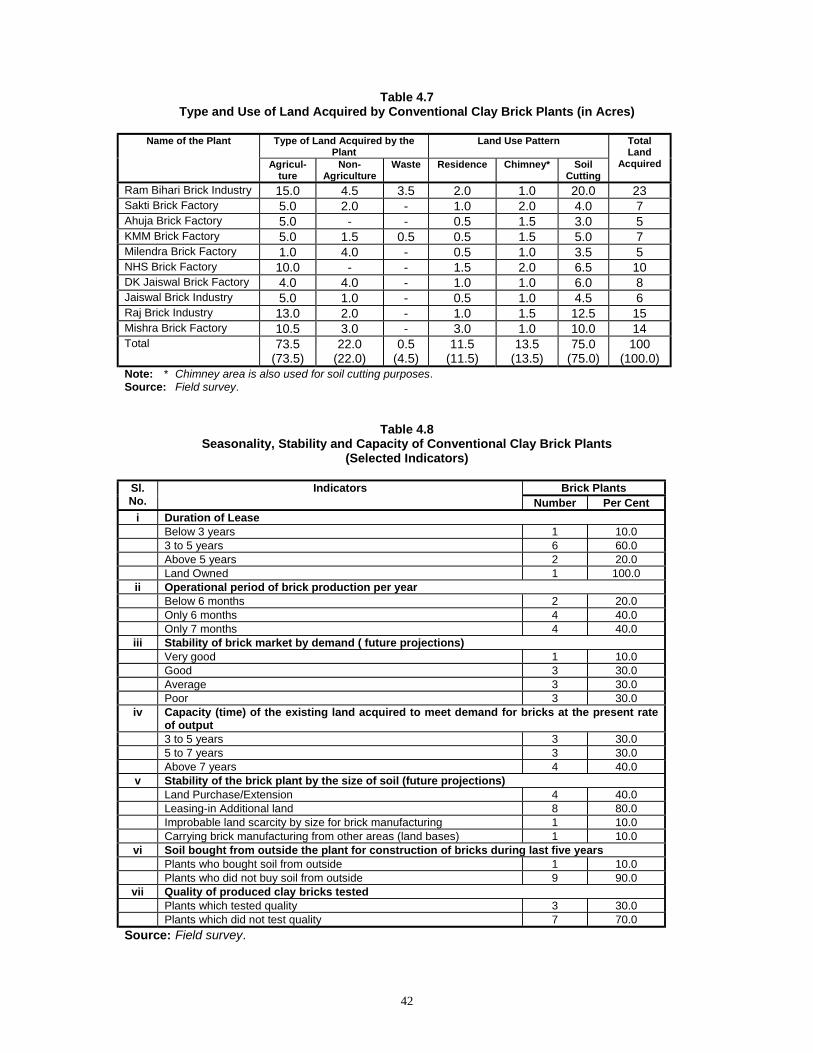
42
Table 4.7 Type and Use of Land Acquired by Conventional Clay Brick Plants (in Acres)
Type of Land Acquired by the
Plant Land Use Pattern Name of the Plant
Agricul-ture
Non-Agriculture
Waste Residence Chimney* Soil Cutting
Total Land
Acquired
Ram Bihari Brick Industry 15.0 4.5 3.5 2.0 1.0 20.0 23 Sakti Brick Factory 5.0 2.0 - 1.0 2.0 4.0 7 Ahuja Brick Factory 5.0 - - 0.5 1.5 3.0 5 KMM Brick Factory 5.0 1.5 0.5 0.5 1.5 5.0 7 Milendra Brick Factory 1.0 4.0 - 0.5 1.0 3.5 5 NHS Brick Factory 10.0 - - 1.5 2.0 6.5 10 DK Jaiswal Brick Factory 4.0 4.0 - 1.0 1.0 6.0 8 Jaiswal Brick Industry 5.0 1.0 - 0.5 1.0 4.5 6 Raj Brick Industry 13.0 2.0 - 1.0 1.5 12.5 15 Mishra Brick Factory 10.5 3.0 - 3.0 1.0 10.0 14 Total 73.5
(73.5) 22.0
(22.0) 0.5
(4.5) 11.5
(11.5) 13.5
(13.5) 75.0
(75.0) 100
(100.0) Note: * Chimney area is also used for soil cutting purposes. Source: Field survey.
Table 4.8
Seasonality, Stability and Capacity of Conventional Clay Brick Plants (Selected Indicators)
Brick Plants Sl.
No. Indicators
Number Per Cent i Duration of Lease Below 3 years 1 10.0 3 to 5 years 6 60.0 Above 5 years 2 20.0 Land Owned 1 100.0 ii Operational period of brick production per year Below 6 months 2 20.0 Only 6 months 4 40.0 Only 7 months 4 40.0
iii Stability of brick market by demand ( future projections) Very good 1 10.0 Good 3 30.0 Average 3 30.0 Poor 3 30.0
iv Capacity (time) of the existing land acquired to meet demand for bricks at the present rate of output
3 to 5 years 3 30.0 5 to 7 years 3 30.0 Above 7 years 4 40.0 v Stability of the brick plant by the size of soil (future projections) Land Purchase/Extension 4 40.0 Leasing-in Additional land 8 80.0 Improbable land scarcity by size for brick manufacturing 1 10.0 Carrying brick manufacturing from other areas (land bases) 1 10.0
vi Soil bought from outside the plant for construction of bricks during last five years Plants who bought soil from outside 1 10.0 Plants who did not buy soil from outside 9 90.0
vii Quality of produced clay bricks tested Plants which tested quality 3 30.0 Plants which did not test quality 7 70.0
Source: Field survey.
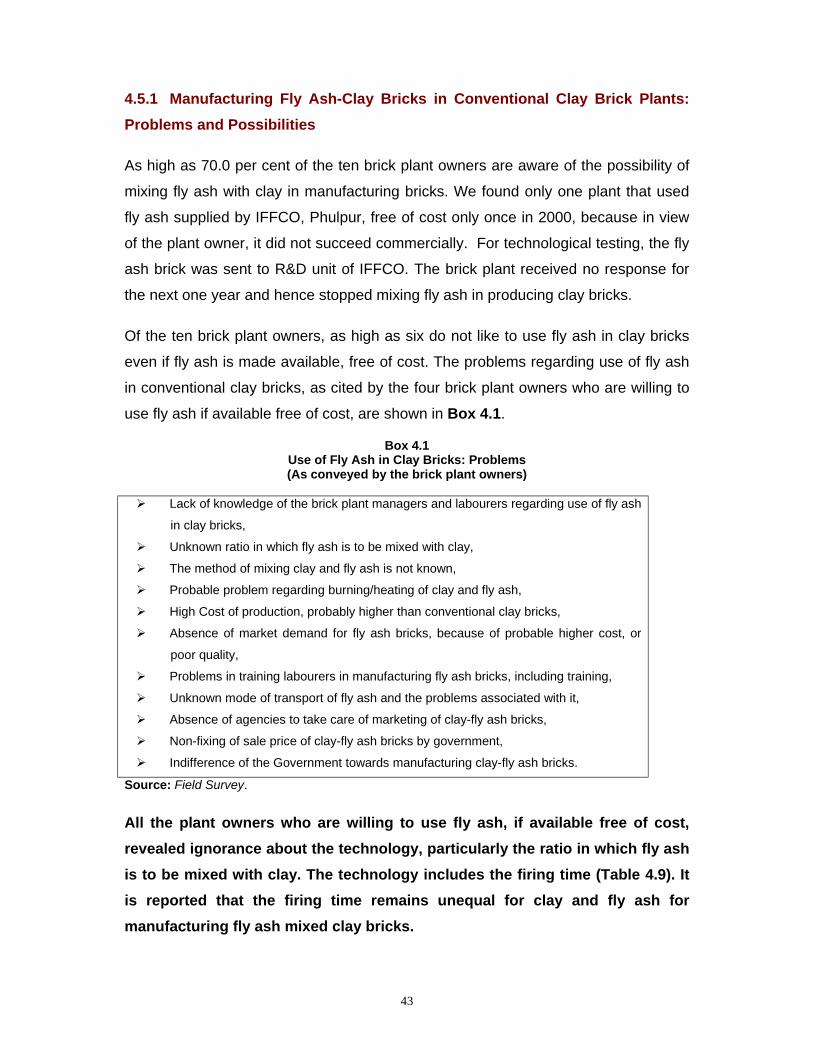
43
4.5.1 Manufacturing Fly Ash-Clay Bricks in Conventional Clay Brick Plants: Problems and Possibilities
As high as 70.0 per cent of the ten brick plant owners are aware of the possibility of
mixing fly ash with clay in manufacturing bricks. We found only one plant that used
fly ash supplied by IFFCO, Phulpur, free of cost only once in 2000, because in view
of the plant owner, it did not succeed commercially. For technological testing, the fly
ash brick was sent to R&D unit of IFFCO. The brick plant received no response for
the next one year and hence stopped mixing fly ash in producing clay bricks.
Of the ten brick plant owners, as high as six do not like to use fly ash in clay bricks
even if fly ash is made available, free of cost. The problems regarding use of fly ash
in conventional clay bricks, as cited by the four brick plant owners who are willing to
use fly ash if available free of cost, are shown in Box 4.1.
Box 4.1 Use of Fly Ash in Clay Bricks: Problems (As conveyed by the brick plant owners)
! Lack of knowledge of the brick plant managers and labourers regarding use of fly ash
in clay bricks,
! Unknown ratio in which fly ash is to be mixed with clay,
! The method of mixing clay and fly ash is not known,
! Probable problem regarding burning/heating of clay and fly ash,
! High Cost of production, probably higher than conventional clay bricks,
! Absence of market demand for fly ash bricks, because of probable higher cost, or
poor quality,
! Problems in training labourers in manufacturing fly ash bricks, including training,
! Unknown mode of transport of fly ash and the problems associated with it,
! Absence of agencies to take care of marketing of clay-fly ash bricks,
! Non-fixing of sale price of clay-fly ash bricks by government,
! Indifference of the Government towards manufacturing clay-fly ash bricks.
Source: Field Survey.
All the plant owners who are willing to use fly ash, if available free of cost, revealed ignorance about the technology, particularly the ratio in which fly ash is to be mixed with clay. The technology includes the firing time (Table 4.9). It is reported that the firing time remains unequal for clay and fly ash for manufacturing fly ash mixed clay bricks.
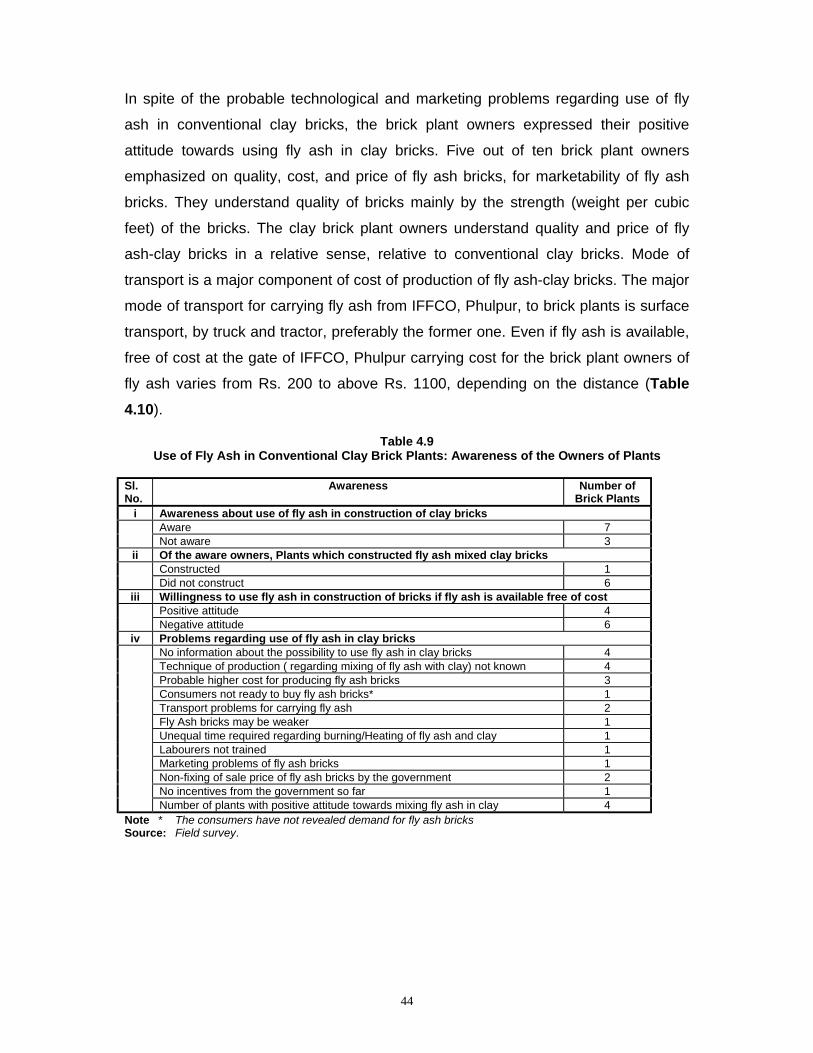
44
In spite of the probable technological and marketing problems regarding use of fly
ash in conventional clay bricks, the brick plant owners expressed their positive
attitude towards using fly ash in clay bricks. Five out of ten brick plant owners
emphasized on quality, cost, and price of fly ash bricks, for marketability of fly ash
bricks. They understand quality of bricks mainly by the strength (weight per cubic
feet) of the bricks. The clay brick plant owners understand quality and price of fly
ash-clay bricks in a relative sense, relative to conventional clay bricks. Mode of
transport is a major component of cost of production of fly ash-clay bricks. The major
mode of transport for carrying fly ash from IFFCO, Phulpur, to brick plants is surface
transport, by truck and tractor, preferably the former one. Even if fly ash is available,
free of cost at the gate of IFFCO, Phulpur carrying cost for the brick plant owners of
fly ash varies from Rs. 200 to above Rs. 1100, depending on the distance (Table 4.10).
Table 4.9 Use of Fly Ash in Conventional Clay Brick Plants: Awareness of the Owners of Plants
Sl. No.
Awareness Number of Brick Plants
i Awareness about use of fly ash in construction of clay bricks Aware 7 Not aware 3
ii Of the aware owners, Plants which constructed fly ash mixed clay bricks Constructed 1 Did not construct 6
iii Willingness to use fly ash in construction of bricks if fly ash is available free of cost Positive attitude 4 Negative attitude 6
iv Problems regarding use of fly ash in clay bricks No information about the possibility to use fly ash in clay bricks 4 Technique of production ( regarding mixing of fly ash with clay) not known 4 Probable higher cost for producing fly ash bricks 3 Consumers not ready to buy fly ash bricks* 1 Transport problems for carrying fly ash 2 Fly Ash bricks may be weaker 1 Unequal time required regarding burning/Heating of fly ash and clay 1 Labourers not trained 1 Marketing problems of fly ash bricks 1 Non-fixing of sale price of fly ash bricks by the government 2 No incentives from the government so far 1
Number of plants with positive attitude towards mixing fly ash in clay 4 Note * The consumers have not revealed demand for fly ash bricks Source: Field survey.

45
Table 4.10 Mode of Transport and Transport Cost of Fly Ash (From IFFCO, Phulpur, to Selected Brick Plants)
Mode of Transport
Truck Tractor Cost per Trip on Road
(16 Tonnes of Fly Ash per trip) Number Per Cent Number Per Cent
Rs. 200 to Rs. 500 3 30.0 2 20.0 Rs. 500 to Rs. 800 2 20.0 - - Rs. 800 to Rs. 1100 3 30.0 - - Above Rs. 1100 2 20.0 - - Total 10 100.0 10 100.0
Source: Field survey.
Soil cutting and formation of pits come as natural problems in the brick plants. The
brick plant owners opine that these pits can be efficiently used as ponds and hence
for fisheries, and for cultivation (Field Survey, April 2001). In general, we found
non-use and reluctance to use fly ash in conventional clay brick plants owned by
individual entrepreneurs.
4.5.2 Non-utilization of Fly Ash in Conventional Clay Brick Plants: Reasons
Based on our observations of the selected brick plants within 50-km. radius of
IFFCO, Phulpur, we briefly enlist the factors responsible for non-utilization of fly ash
in conventional clay brick plants.
i) Availability of abundant and low cost top soil, either on ownership basis or on
lease.
ii) Non-availability of dry fly ash.
iii) High cost of transportation of fly ash.
iv) Absence of assured market for fly ash bricks.
v) Absence of technology or problems in shift of technology from conventional
clay bricks to fly ash mixed clay bricks.
vi) Unequal time required in burning of clay and fly ash in existing technology in
conventional clay brick plants.
vii) Absence or inadequate executions of government policies/guidelines for
utilization of fly ash even when there is technological permission.
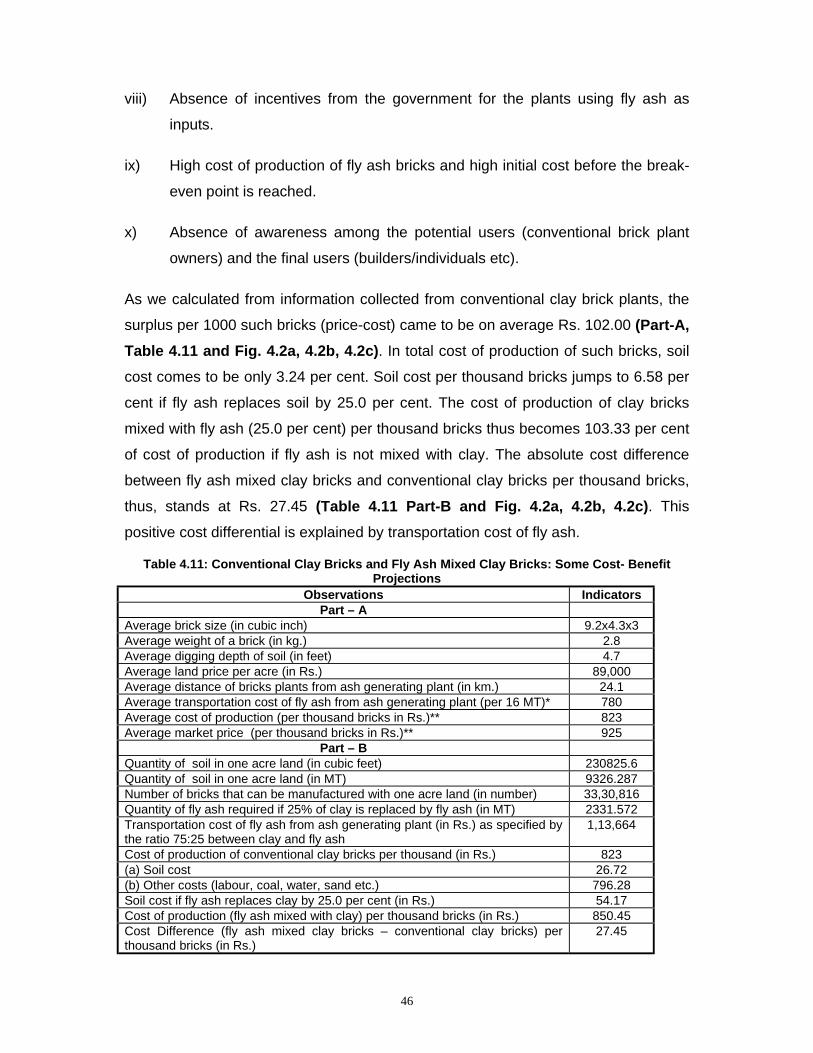
46
viii) Absence of incentives from the government for the plants using fly ash as
inputs.
ix) High cost of production of fly ash bricks and high initial cost before the break-
even point is reached.
x) Absence of awareness among the potential users (conventional brick plant
owners) and the final users (builders/individuals etc).
As we calculated from information collected from conventional clay brick plants, the
surplus per 1000 such bricks (price-cost) came to be on average Rs. 102.00 (Part-A, Table 4.11 and Fig. 4.2a, 4.2b, 4.2c). In total cost of production of such bricks, soil
cost comes to be only 3.24 per cent. Soil cost per thousand bricks jumps to 6.58 per
cent if fly ash replaces soil by 25.0 per cent. The cost of production of clay bricks
mixed with fly ash (25.0 per cent) per thousand bricks thus becomes 103.33 per cent
of cost of production if fly ash is not mixed with clay. The absolute cost difference
between fly ash mixed clay bricks and conventional clay bricks per thousand bricks,
thus, stands at Rs. 27.45 (Table 4.11 Part-B and Fig. 4.2a, 4.2b, 4.2c). This
positive cost differential is explained by transportation cost of fly ash.
Table 4.11: Conventional Clay Bricks and Fly Ash Mixed Clay Bricks: Some Cost- Benefit Projections
Observations Indicators Part – A
Average brick size (in cubic inch) 9.2x4.3x3 Average weight of a brick (in kg.) 2.8 Average digging depth of soil (in feet) 4.7 Average land price per acre (in Rs.) 89,000 Average distance of bricks plants from ash generating plant (in km.) 24.1 Average transportation cost of fly ash from ash generating plant (per 16 MT)* 780 Average cost of production (per thousand bricks in Rs.)** 823 Average market price (per thousand bricks in Rs.)** 925
Part – B Quantity of soil in one acre land (in cubic feet) 230825.6 Quantity of soil in one acre land (in MT) 9326.287 Number of bricks that can be manufactured with one acre land (in number) 33,30,816 Quantity of fly ash required if 25% of clay is replaced by fly ash (in MT) 2331.572 Transportation cost of fly ash from ash generating plant (in Rs.) as specified by the ratio 75:25 between clay and fly ash
1,13,664
Cost of production of conventional clay bricks per thousand (in Rs.) 823 (a) Soil cost 26.72 (b) Other costs (labour, coal, water, sand etc.) 796.28 Soil cost if fly ash replaces clay by 25.0 per cent (in Rs.) 54.17 Cost of production (fly ash mixed with clay) per thousand bricks (in Rs.) 850.45 Cost Difference (fly ash mixed clay bricks – conventional clay bricks) per thousand bricks (in Rs.)
27.45
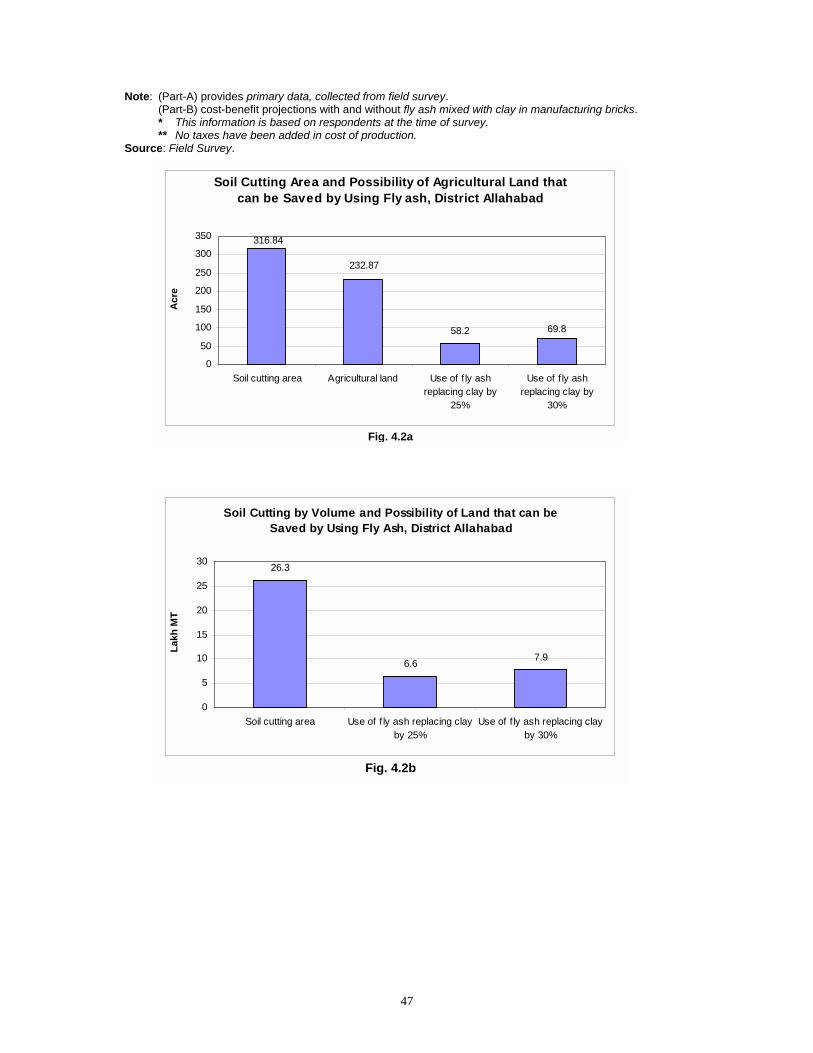
47
Note: (Part-A) provides primary data, collected from field survey. (Part-B) cost-benefit projections with and without fly ash mixed with clay in manufacturing bricks. * This information is based on respondents at the time of survey. ** No taxes have been added in cost of production. Source: Field Survey.
Soil Cutting Area and Possibility of Agricultural Land that can be Saved by Using Fly ash, District Allahabad
58.2 69.8
232.87
316.84
0
50
100
150
200
250
300
350
Soil cutting area Agricultural land Use of f ly ashreplacing clay by
25%
Use of f ly ashreplacing clay by
30%
Acr
e
Fig. 4.2a
Soil Cutting by Volume and Possibility of Land that can be Saved by Using Fly Ash, District Allahabad
26.3
6.6 7.9
0
5
10
15
20
25
30
Soil cutting area Use of f ly ash replacing clayby 25%
Use of f ly ash replacing clayby 30%
Lakh
MT
Fig. 4.2b
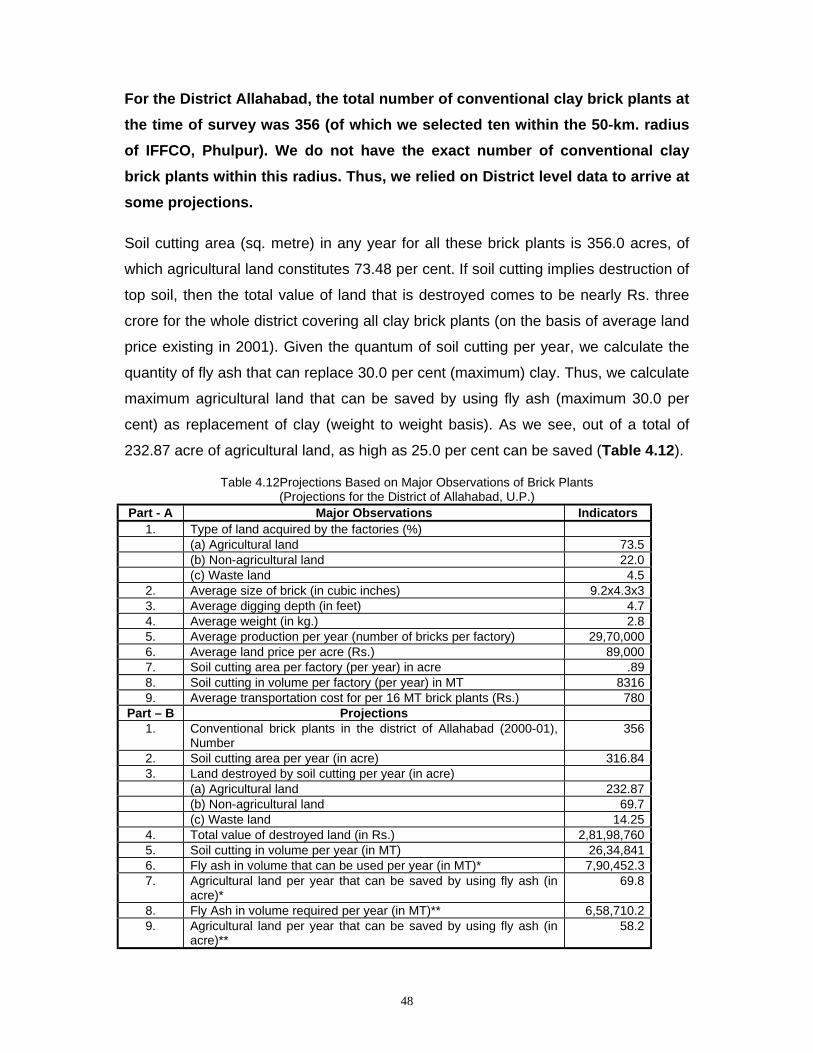
48
For the District Allahabad, the total number of conventional clay brick plants at the time of survey was 356 (of which we selected ten within the 50-km. radius of IFFCO, Phulpur). We do not have the exact number of conventional clay brick plants within this radius. Thus, we relied on District level data to arrive at some projections.
Soil cutting area (sq. metre) in any year for all these brick plants is 356.0 acres, of
which agricultural land constitutes 73.48 per cent. If soil cutting implies destruction of
top soil, then the total value of land that is destroyed comes to be nearly Rs. three
crore for the whole district covering all clay brick plants (on the basis of average land
price existing in 2001). Given the quantum of soil cutting per year, we calculate the
quantity of fly ash that can replace 30.0 per cent (maximum) clay. Thus, we calculate
maximum agricultural land that can be saved by using fly ash (maximum 30.0 per
cent) as replacement of clay (weight to weight basis). As we see, out of a total of
232.87 acre of agricultural land, as high as 25.0 per cent can be saved (Table 4.12).
Table 4.12Projections Based on Major Observations of Brick Plants (Projections for the District of Allahabad, U.P.)
Part - A Major Observations Indicators 1. Type of land acquired by the factories (%) (a) Agricultural land 73.5 (b) Non-agricultural land 22.0 (c) Waste land 4.5
2. Average size of brick (in cubic inches) 9.2x4.3x3 3. Average digging depth (in feet) 4.7 4. Average weight (in kg.) 2.8 5. Average production per year (number of bricks per factory) 29,70,000 6. Average land price per acre (Rs.) 89,000 7. Soil cutting area per factory (per year) in acre .89 8. Soil cutting in volume per factory (per year) in MT 8316 9. Average transportation cost for per 16 MT brick plants (Rs.) 780
Part – B Projections 1. Conventional brick plants in the district of Allahabad (2000-01),
Number 356
2. Soil cutting area per year (in acre) 316.84 3. Land destroyed by soil cutting per year (in acre) (a) Agricultural land 232.87 (b) Non-agricultural land 69.7 (c) Waste land 14.25
4. Total value of destroyed land (in Rs.) 2,81,98,760 5. Soil cutting in volume per year (in MT) 26,34,841 6. Fly ash in volume that can be used per year (in MT)* 7,90,452.3 7. Agricultural land per year that can be saved by using fly ash (in
acre)* 69.8
8. Fly Ash in volume required per year (in MT)** 6,58,710.2 9. Agricultural land per year that can be saved by using fly ash (in
acre)** 58.2
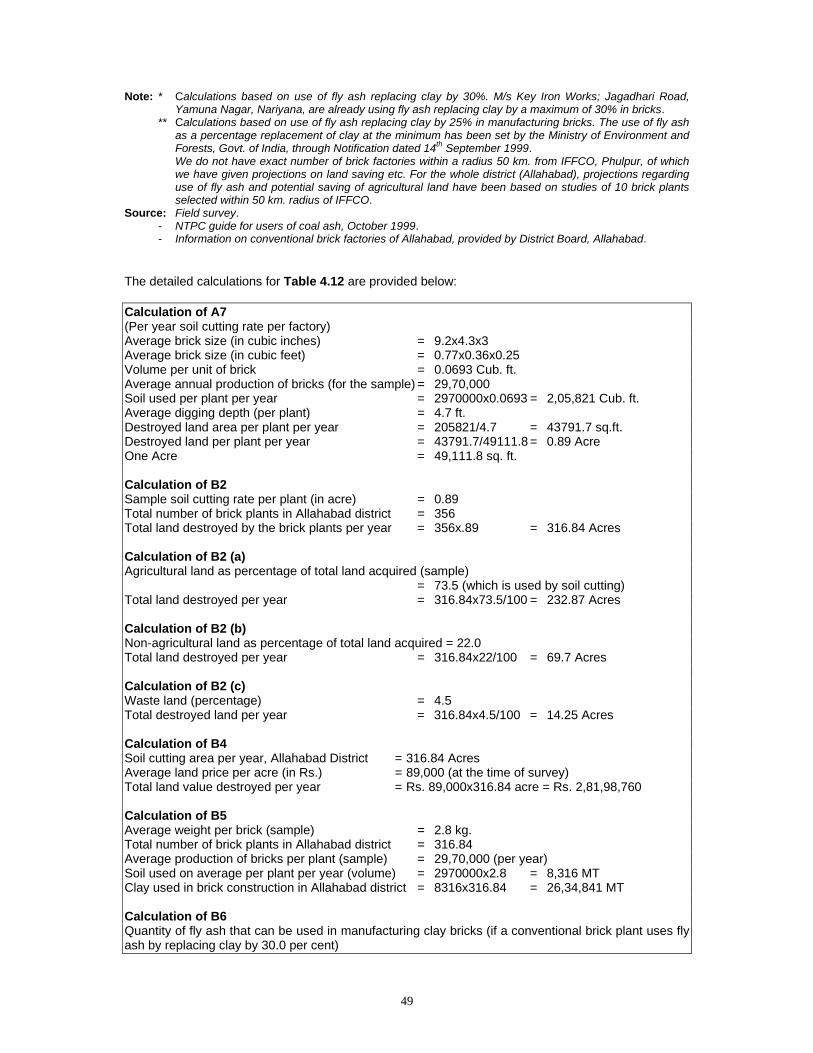
49
Note: * Calculations based on use of fly ash replacing clay by 30%. M/s Key Iron Works; Jagadhari Road, Yamuna Nagar, Nariyana, are already using fly ash replacing clay by a maximum of 30% in bricks.
** Calculations based on use of fly ash replacing clay by 25% in manufacturing bricks. The use of fly ash as a percentage replacement of clay at the minimum has been set by the Ministry of Environment and Forests, Govt. of India, through Notification dated 14th September 1999.
We do not have exact number of brick factories within a radius 50 km. from IFFCO, Phulpur, of which we have given projections on land saving etc. For the whole district (Allahabad), projections regarding use of fly ash and potential saving of agricultural land have been based on studies of 10 brick plants selected within 50 km. radius of IFFCO.
Source: Field survey. - NTPC guide for users of coal ash, October 1999. - Information on conventional brick factories of Allahabad, provided by District Board, Allahabad. The detailed calculations for Table 4.12 are provided below:
Calculation of A7 (Per year soil cutting rate per factory) Average brick size (in cubic inches) = 9.2x4.3x3 Average brick size (in cubic feet) = 0.77x0.36x0.25 Volume per unit of brick = 0.0693 Cub. ft. Average annual production of bricks (for the sample) = 29,70,000 Soil used per plant per year = 2970000x0.0693 = 2,05,821 Cub. ft. Average digging depth (per plant) = 4.7 ft. Destroyed land area per plant per year = 205821/4.7 = 43791.7 sq.ft. Destroyed land per plant per year = 43791.7/49111.8 = 0.89 Acre One Acre = 49,111.8 sq. ft. Calculation of B2 Sample soil cutting rate per plant (in acre) = 0.89 Total number of brick plants in Allahabad district = 356 Total land destroyed by the brick plants per year = 356x.89 = 316.84 Acres Calculation of B2 (a) Agricultural land as percentage of total land acquired (sample) = 73.5 (which is used by soil cutting) Total land destroyed per year = 316.84x73.5/100 = 232.87 Acres Calculation of B2 (b) Non-agricultural land as percentage of total land acquired = 22.0 Total land destroyed per year = 316.84x22/100 = 69.7 Acres Calculation of B2 (c) Waste land (percentage) = 4.5 Total destroyed land per year = 316.84x4.5/100 = 14.25 Acres Calculation of B4 Soil cutting area per year, Allahabad District = 316.84 Acres Average land price per acre (in Rs.) = 89,000 (at the time of survey) Total land value destroyed per year = Rs. 89,000x316.84 acre = Rs. 2,81,98,760 Calculation of B5 Average weight per brick (sample) = 2.8 kg. Total number of brick plants in Allahabad district = 316.84 Average production of bricks per plant (sample) = 29,70,000 (per year) Soil used on average per plant per year (volume) = 2970000x2.8 = 8,316 MT Clay used in brick construction in Allahabad district = 8316x316.84 = 26,34,841 MT Calculation of B6 Quantity of fly ash that can be used in manufacturing clay bricks (if a conventional brick plant uses fly ash by replacing clay by 30.0 per cent)
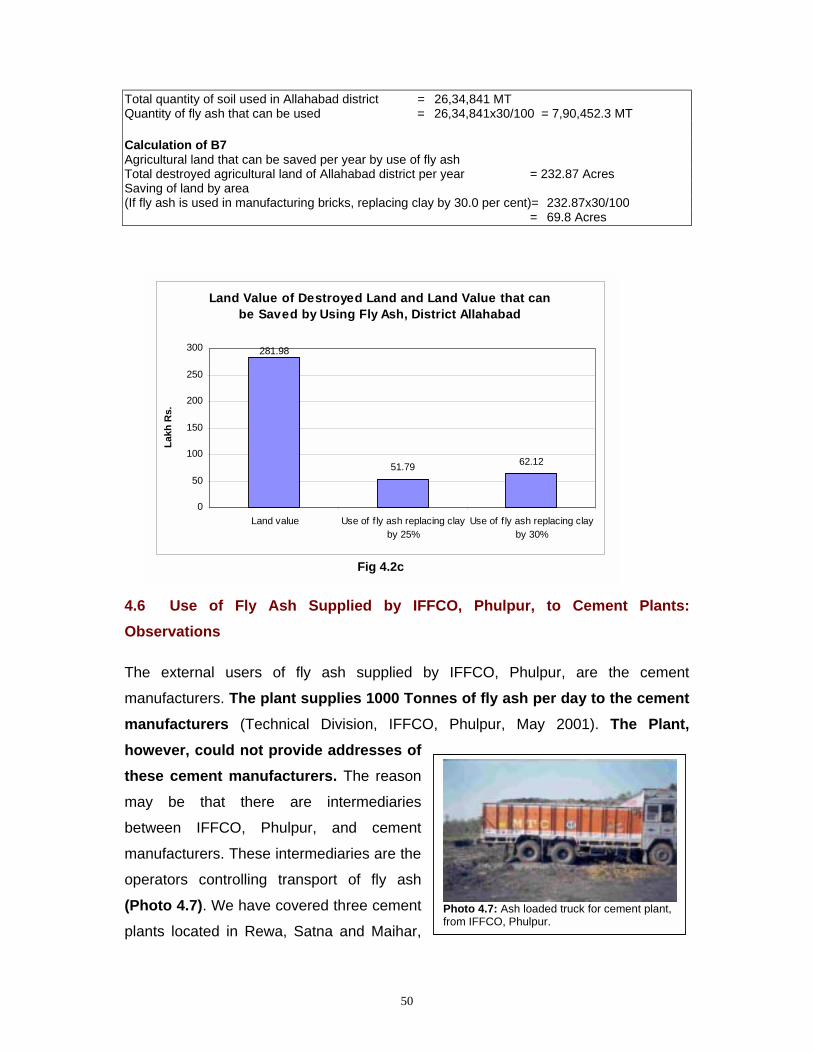
50
Total quantity of soil used in Allahabad district = 26,34,841 MT Quantity of fly ash that can be used = 26,34,841x30/100 = 7,90,452.3 MT Calculation of B7 Agricultural land that can be saved per year by use of fly ash Total destroyed agricultural land of Allahabad district per year = 232.87 Acres Saving of land by area (If fly ash is used in manufacturing bricks, replacing clay by 30.0 per cent)= 232.87x30/100 = 69.8 Acres
4.6 Use of Fly Ash Supplied by IFFCO, Phulpur, to Cement Plants: Observations
The external users of fly ash supplied by IFFCO, Phulpur, are the cement
manufacturers. The plant supplies 1000 Tonnes of fly ash per day to the cement manufacturers (Technical Division, IFFCO, Phulpur, May 2001). The Plant, however, could not provide addresses of these cement manufacturers. The reason
may be that there are intermediaries
between IFFCO, Phulpur, and cement
manufacturers. These intermediaries are the
operators controlling transport of fly ash
(Photo 4.7). We have covered three cement
plants located in Rewa, Satna and Maihar,
Land Value of Destroyed Land and Land Value that can be Saved by Using Fly Ash, District Allahabad
51.79 62.12
281.98
0
50
100
150
200
250
300
Land value Use of f ly ash replacing clayby 25%
Use of f ly ash replacing clayby 30%
Lakh
Rs.
Fig 4.2c
Photo 4.7: Ash loaded truck for cement plant, from IFFCO, Phulpur.
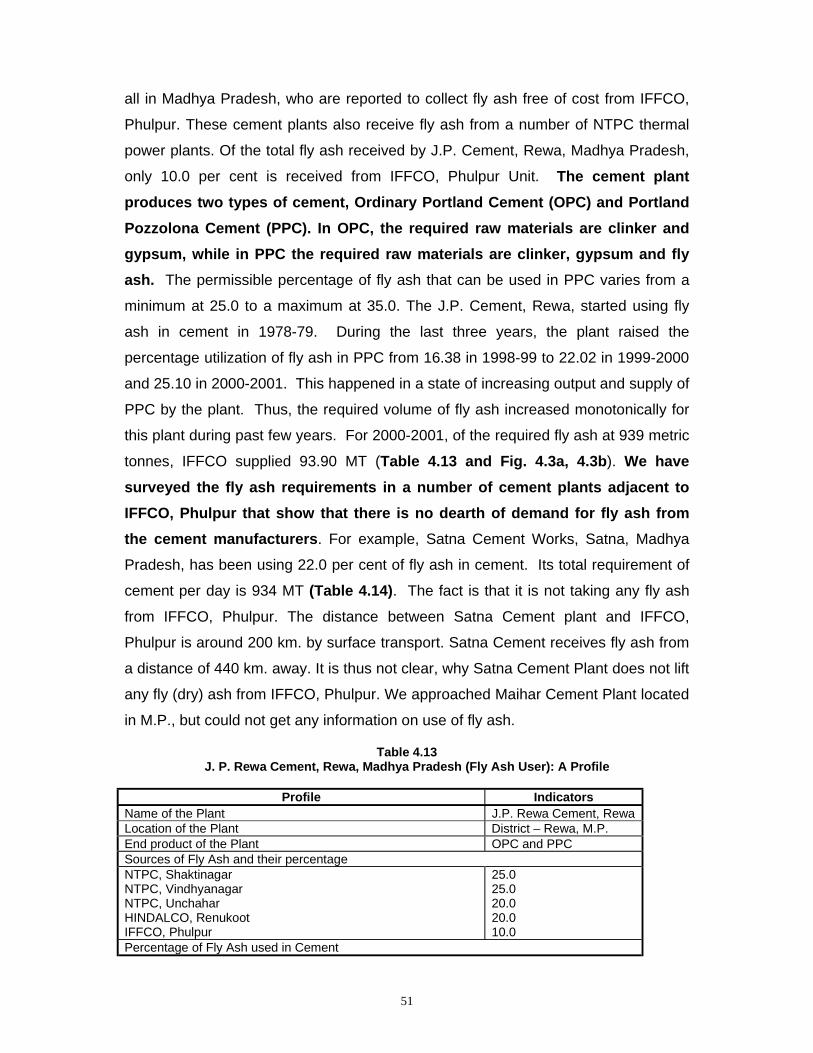
51
all in Madhya Pradesh, who are reported to collect fly ash free of cost from IFFCO,
Phulpur. These cement plants also receive fly ash from a number of NTPC thermal
power plants. Of the total fly ash received by J.P. Cement, Rewa, Madhya Pradesh,
only 10.0 per cent is received from IFFCO, Phulpur Unit. The cement plant produces two types of cement, Ordinary Portland Cement (OPC) and Portland Pozzolona Cement (PPC). In OPC, the required raw materials are clinker and gypsum, while in PPC the required raw materials are clinker, gypsum and fly ash. The permissible percentage of fly ash that can be used in PPC varies from a
minimum at 25.0 to a maximum at 35.0. The J.P. Cement, Rewa, started using fly
ash in cement in 1978-79. During the last three years, the plant raised the
percentage utilization of fly ash in PPC from 16.38 in 1998-99 to 22.02 in 1999-2000
and 25.10 in 2000-2001. This happened in a state of increasing output and supply of
PPC by the plant. Thus, the required volume of fly ash increased monotonically for
this plant during past few years. For 2000-2001, of the required fly ash at 939 metric
tonnes, IFFCO supplied 93.90 MT (Table 4.13 and Fig. 4.3a, 4.3b). We have surveyed the fly ash requirements in a number of cement plants adjacent to IFFCO, Phulpur that show that there is no dearth of demand for fly ash from the cement manufacturers. For example, Satna Cement Works, Satna, Madhya
Pradesh, has been using 22.0 per cent of fly ash in cement. Its total requirement of
cement per day is 934 MT (Table 4.14). The fact is that it is not taking any fly ash
from IFFCO, Phulpur. The distance between Satna Cement plant and IFFCO,
Phulpur is around 200 km. by surface transport. Satna Cement receives fly ash from
a distance of 440 km. away. It is thus not clear, why Satna Cement Plant does not lift
any fly (dry) ash from IFFCO, Phulpur. We approached Maihar Cement Plant located
in M.P., but could not get any information on use of fly ash.
Table 4.13 J. P. Rewa Cement, Rewa, Madhya Pradesh (Fly Ash User): A Profile
Profile Indicators
Name of the Plant J.P. Rewa Cement, Rewa Location of the Plant District – Rewa, M.P. End product of the Plant OPC and PPC Sources of Fly Ash and their percentage NTPC, Shaktinagar NTPC, Vindhyanagar NTPC, Unchahar HINDALCO, Renukoot IFFCO, Phulpur
25.0 25.0 20.0 20.0 10.0
Percentage of Fly Ash used in Cement
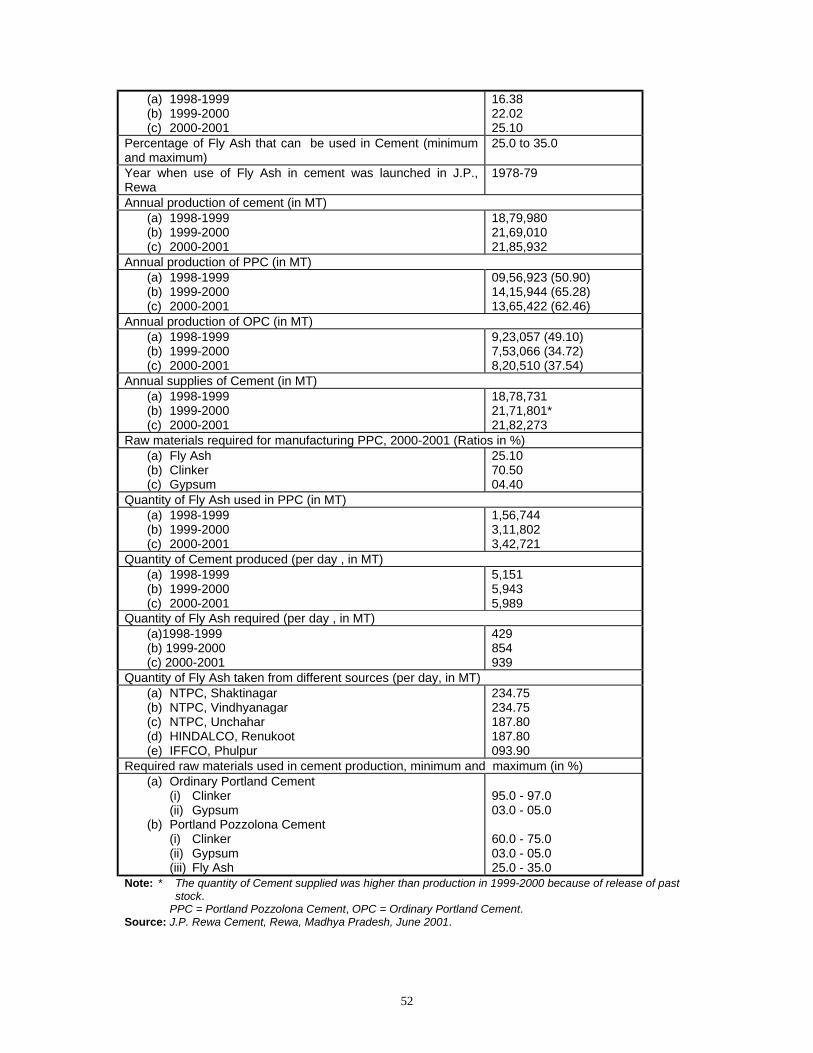
52
(a) 1998-1999 (b) 1999-2000 (c) 2000-2001
16.38 22.02 25.10
Percentage of Fly Ash that can be used in Cement (minimum and maximum)
25.0 to 35.0
Year when use of Fly Ash in cement was launched in J.P., Rewa
1978-79
Annual production of cement (in MT) (a) 1998-1999 (b) 1999-2000 (c) 2000-2001
18,79,980 21,69,010 21,85,932
Annual production of PPC (in MT) (a) 1998-1999 (b) 1999-2000 (c) 2000-2001
09,56,923 (50.90) 14,15,944 (65.28) 13,65,422 (62.46)
Annual production of OPC (in MT) (a) 1998-1999 (b) 1999-2000 (c) 2000-2001
9,23,057 (49.10) 7,53,066 (34.72) 8,20,510 (37.54)
Annual supplies of Cement (in MT) (a) 1998-1999 (b) 1999-2000 (c) 2000-2001
18,78,731 21,71,801* 21,82,273
Raw materials required for manufacturing PPC, 2000-2001 (Ratios in %) (a) Fly Ash (b) Clinker (c) Gypsum
25.10 70.50 04.40
Quantity of Fly Ash used in PPC (in MT) (a) 1998-1999 (b) 1999-2000 (c) 2000-2001
1,56,744 3,11,802 3,42,721
Quantity of Cement produced (per day , in MT) (a) 1998-1999 (b) 1999-2000 (c) 2000-2001
5,151 5,943 5,989
Quantity of Fly Ash required (per day , in MT) (a)1998-1999 (b) 1999-2000 (c) 2000-2001
429 854 939
Quantity of Fly Ash taken from different sources (per day, in MT) (a) NTPC, Shaktinagar (b) NTPC, Vindhyanagar (c) NTPC, Unchahar (d) HINDALCO, Renukoot (e) IFFCO, Phulpur
234.75 234.75 187.80 187.80 093.90
Required raw materials used in cement production, minimum and maximum (in %) (a) Ordinary Portland Cement
(i) Clinker (ii) Gypsum
(b) Portland Pozzolona Cement (i) Clinker (ii) Gypsum (iii) Fly Ash
95.0 - 97.0 03.0 - 05.0 60.0 - 75.0 03.0 - 05.0 25.0 - 35.0
Note: * The quantity of Cement supplied was higher than production in 1999-2000 because of release of past stock.
PPC = Portland Pozzolona Cement, OPC = Ordinary Portland Cement. Source: J.P. Rewa Cement, Rewa, Madhya Pradesh, June 2001.
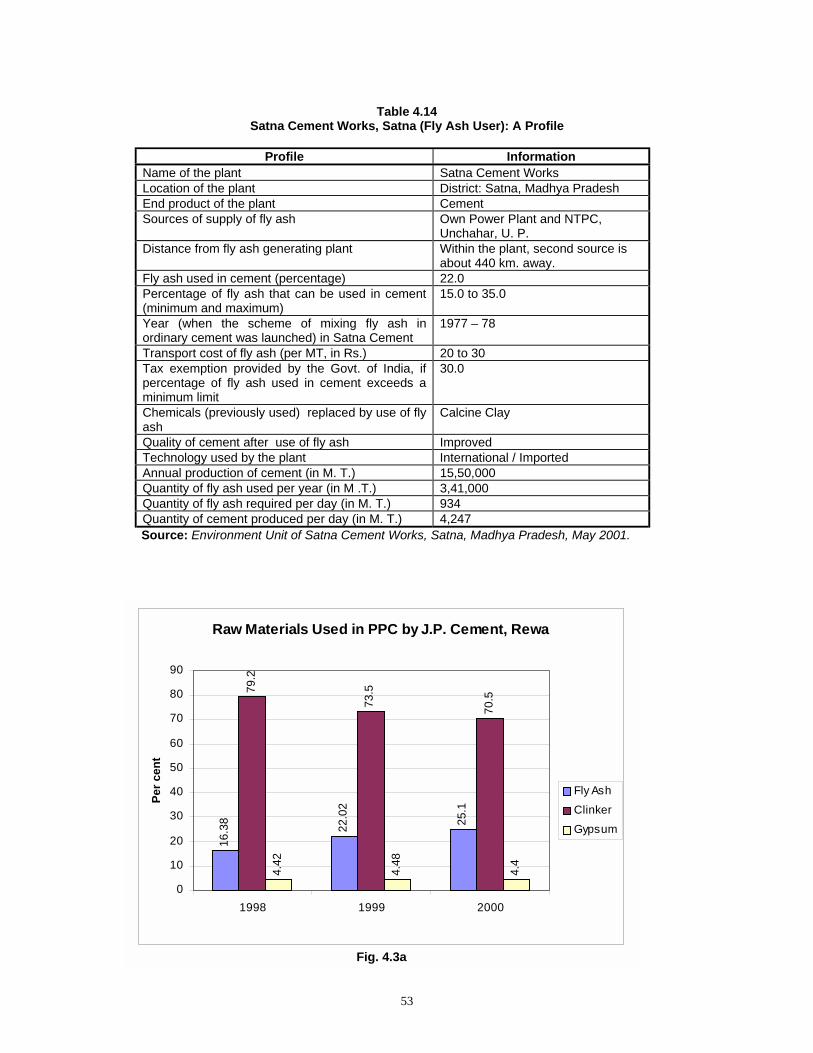
53
Table 4.14
Satna Cement Works, Satna (Fly Ash User): A Profile
Profile Information Name of the plant Satna Cement Works Location of the plant District: Satna, Madhya Pradesh End product of the plant Cement Sources of supply of fly ash Own Power Plant and NTPC,
Unchahar, U. P. Distance from fly ash generating plant Within the plant, second source is
about 440 km. away. Fly ash used in cement (percentage) 22.0 Percentage of fly ash that can be used in cement (minimum and maximum)
15.0 to 35.0
Year (when the scheme of mixing fly ash in ordinary cement was launched) in Satna Cement
1977 – 78
Transport cost of fly ash (per MT, in Rs.) 20 to 30 Tax exemption provided by the Govt. of India, if percentage of fly ash used in cement exceeds a minimum limit
30.0
Chemicals (previously used) replaced by use of fly ash
Calcine Clay
Quality of cement after use of fly ash Improved Technology used by the plant International / Imported Annual production of cement (in M. T.) 15,50,000 Quantity of fly ash used per year (in M .T.) 3,41,000 Quantity of fly ash required per day (in M. T.) 934 Quantity of cement produced per day (in M. T.) 4,247 Source: Environment Unit of Satna Cement Works, Satna, Madhya Pradesh, May 2001.
Raw Materials Used in PPC by J.P. Cement, Rewa
16.3
8
22.0
2
25.1
79.2
73.5
70.5
4.42
4.48
4.4
0
10
20
30
40
50
60
70
80
90
1998 1999 2000
Per c
ent
Fly AshClinkerGypsum
Fig. 4.3a

54
4.7 Fly Ash Dumping in the Areas Adjoining IFFCO, Phulpur: Effects
Because of the location and selection of area for dumping of fly ash generated by
IFFCO, Phulpur, we found no effect of spread of fly ash, either air-borne, or water-
borne, in the east of the plant. Hence, we selected villages in the west, south, and
north sides of the plant within a radius of three km. from the plant. The plant is reported to take care of areas within a radius of three km. from its own location. We selected seven villages, which are reported to be affected by the spread of fly ash. The selection of villages follows the pilot survey of the adjoining area. We covered 65 households in these seven villages of which, three
are located in the west, three in the south, and one in the north. Twenty-six
households are surveyed from the villages in the west, twenty-nine households from
the villages in the south, and ten from the north. (Table 4.15). We tried to cover as
many households as possible from the selected villages. As reported by the
households in these villages, the adverse effect of spread of fly ash is most during the summer of each year (Box 4.2). Therefore, we conducted the field
survey during the month of May 2001.
Cement Production in J.P. Cement, Rewa
50.9
65.2
8
62.4
6
49.1
34.7
2
37.5
4
0
10
20
30
40
50
60
70
1998 1999 2000
Per c
ent PPC
OPC
Fig. 4.3b
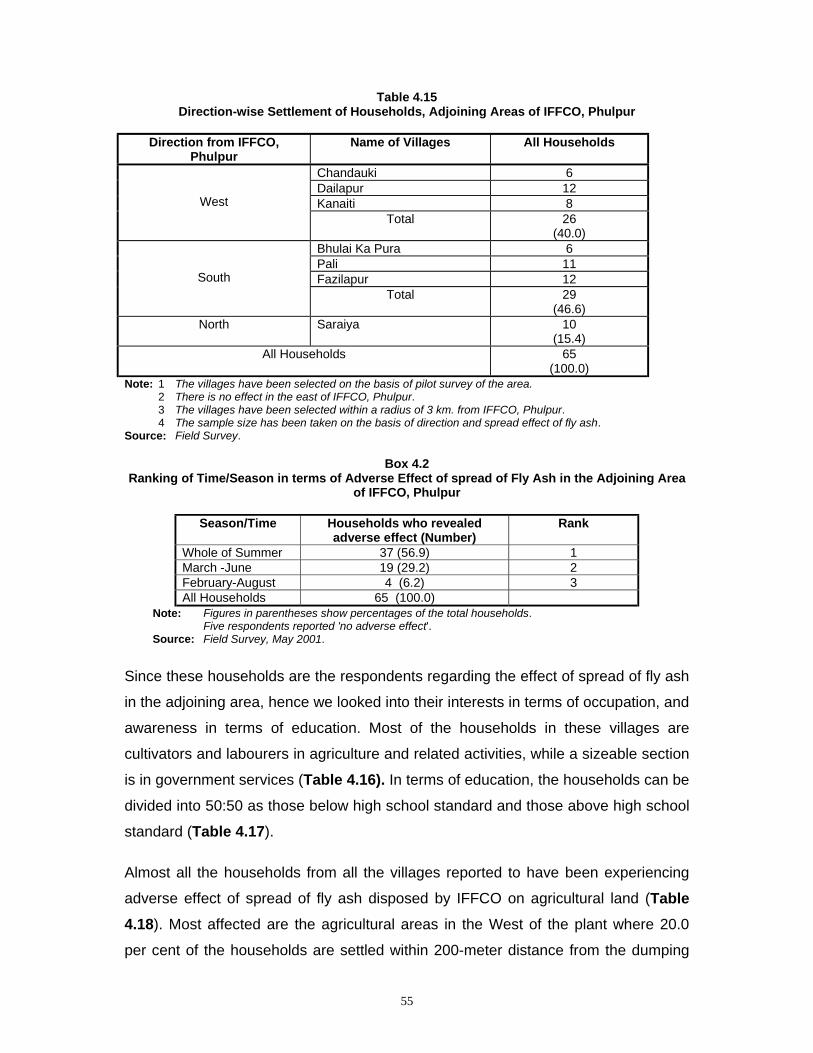
55
Table 4.15 Direction-wise Settlement of Households, Adjoining Areas of IFFCO, Phulpur
Direction from IFFCO,
Phulpur Name of Villages All Households
Chandauki 6 Dailapur 12 Kanaiti 8
West Total 26
(40.0) Bhulai Ka Pura 6 Pali 11 Fazilapur 12
South Total 29
(46.6) North Saraiya 10
(15.4) All Households 65
(100.0) Note: 1 The villages have been selected on the basis of pilot survey of the area. 2 There is no effect in the east of IFFCO, Phulpur. 3 The villages have been selected within a radius of 3 km. from IFFCO, Phulpur. 4 The sample size has been taken on the basis of direction and spread effect of fly ash. Source: Field Survey.
Box 4.2 Ranking of Time/Season in terms of Adverse Effect of spread of Fly Ash in the Adjoining Area
of IFFCO, Phulpur
Season/Time Households who revealed adverse effect (Number)
Rank
Whole of Summer 37 (56.9) 1 March -June 19 (29.2) 2 February-August 4 (6.2) 3 All Households 65 (100.0)
Note: Figures in parentheses show percentages of the total households. Five respondents reported 'no adverse effect'. Source: Field Survey, May 2001.
Since these households are the respondents regarding the effect of spread of fly ash
in the adjoining area, hence we looked into their interests in terms of occupation, and
awareness in terms of education. Most of the households in these villages are
cultivators and labourers in agriculture and related activities, while a sizeable section
is in government services (Table 4.16). In terms of education, the households can be
divided into 50:50 as those below high school standard and those above high school
standard (Table 4.17).
Almost all the households from all the villages reported to have been experiencing
adverse effect of spread of fly ash disposed by IFFCO on agricultural land (Table 4.18). Most affected are the agricultural areas in the West of the plant where 20.0
per cent of the households are settled within 200-meter distance from the dumping
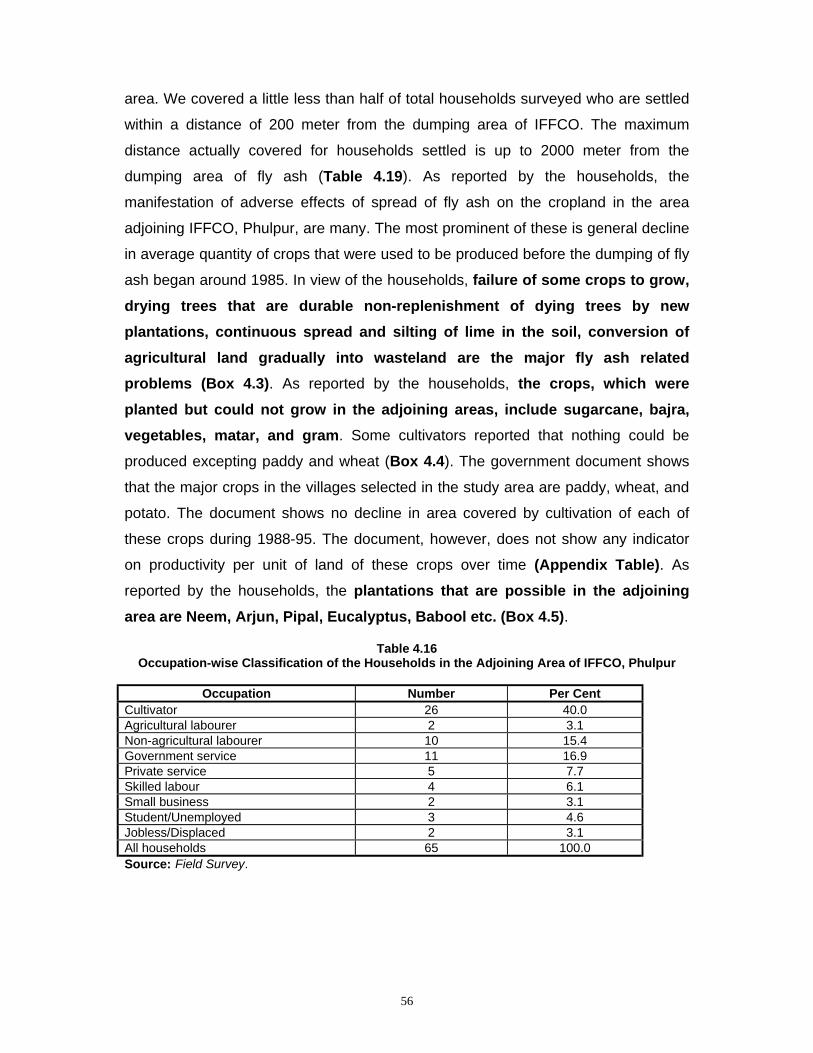
56
area. We covered a little less than half of total households surveyed who are settled
within a distance of 200 meter from the dumping area of IFFCO. The maximum
distance actually covered for households settled is up to 2000 meter from the
dumping area of fly ash (Table 4.19). As reported by the households, the
manifestation of adverse effects of spread of fly ash on the cropland in the area
adjoining IFFCO, Phulpur, are many. The most prominent of these is general decline
in average quantity of crops that were used to be produced before the dumping of fly
ash began around 1985. In view of the households, failure of some crops to grow, drying trees that are durable non-replenishment of dying trees by new plantations, continuous spread and silting of lime in the soil, conversion of agricultural land gradually into wasteland are the major fly ash related problems (Box 4.3). As reported by the households, the crops, which were planted but could not grow in the adjoining areas, include sugarcane, bajra, vegetables, matar, and gram. Some cultivators reported that nothing could be
produced excepting paddy and wheat (Box 4.4). The government document shows
that the major crops in the villages selected in the study area are paddy, wheat, and
potato. The document shows no decline in area covered by cultivation of each of
these crops during 1988-95. The document, however, does not show any indicator
on productivity per unit of land of these crops over time (Appendix Table). As
reported by the households, the plantations that are possible in the adjoining area are Neem, Arjun, Pipal, Eucalyptus, Babool etc. (Box 4.5).
Table 4.16 Occupation-wise Classification of the Households in the Adjoining Area of IFFCO, Phulpur
Occupation Number Per Cent
Cultivator 26 40.0 Agricultural labourer 2 3.1 Non-agricultural labourer 10 15.4 Government service 11 16.9 Private service 5 7.7 Skilled labour 4 6.1 Small business 2 3.1 Student/Unemployed 3 4.6 Jobless/Displaced 2 3.1 All households 65 100.0 Source: Field Survey.

57
Table 4.17 Educational Level of the Respondents of the Households in the Adjoining Area of IFFCO,
Phulpur
Educational Level Number Per Cent Illiterate 10 15.4 Literate 9 13.8 Up to Primary 12 18.5 Up to Junior High School 7 10.8 Up to High School 15 23.1 Up to Intermediate 6 9.2 Higher Education 4 6.1 Technical Education 2 3.1 All households 65 100.0 Source: Field Survey.
Table 4.18 Direction-wise Effect of Spread of Fly Ash on Agricultural Land
Effect on Agricultural Land Direction from
IFFCO, Phulpur Name of Villages
Adverse No Effect All
Households Chandauki 6 - 6 Dailapur 12 - 12 Kanaiti 7 1 8
West Total 25
(39.7) 1 (50.0) 26
(40.0) Bhulai Ka Pura 6 - 6 Pali 11 - 11 Fazilapur 12 - 12
South Total 29
(46.0) - 29
(46.6) North Saraiya 9
(14.3) 1
(50.0) 10
(15.4) All Households 63
(100) 2
(100) 65
(100) Source: Field Survey.
Table 4.19 Households Surveyed in Terms of Distance from Fly Ash Dumping Area
Distance from Dumping Area
(meter) West North South All
Households Below 200 13
(50.0) 1
(10.0) 14
(48.3) 28
(43.1) 200 to 400 1
(3.8) - 3
(10.3) 4
(6.2) 400 to 1,000 3
(11.5) 2
(20.0) 10
(34.5) 15
(23.0) 1,000 to 1,500 4
(15.4) 6
(60.0) 2
(6.9) 12
(18.5) 1,500 to 2,000 5
(19.2) 1
(10.0) - 6
(9.2) All households 26
(100.0) 10
(100.0) 29
(100.0) 65
(100.0) Source: Field Survey.
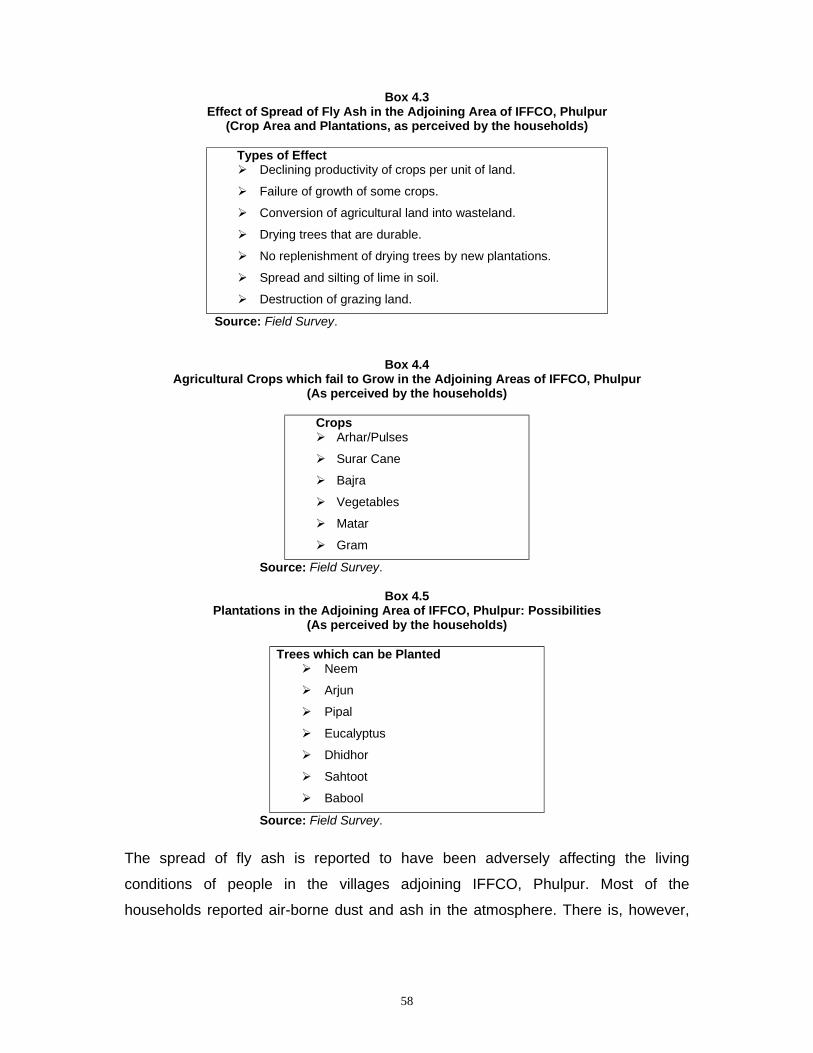
58
Box 4.3 Effect of Spread of Fly Ash in the Adjoining Area of IFFCO, Phulpur
(Crop Area and Plantations, as perceived by the households)
Types of Effect ! Declining productivity of crops per unit of land.
! Failure of growth of some crops.
! Conversion of agricultural land into wasteland.
! Drying trees that are durable.
! No replenishment of drying trees by new plantations.
! Spread and silting of lime in soil.
! Destruction of grazing land. Source: Field Survey.
Box 4.4 Agricultural Crops which fail to Grow in the Adjoining Areas of IFFCO, Phulpur
(As perceived by the households)
Crops ! Arhar/Pulses
! Surar Cane
! Bajra
! Vegetables
! Matar
! Gram Source: Field Survey.
Box 4.5 Plantations in the Adjoining Area of IFFCO, Phulpur: Possibilities
(As perceived by the households)
Trees which can be Planted ! Neem
! Arjun
! Pipal
! Eucalyptus
! Dhidhor
! Sahtoot
! Babool Source: Field Survey.
The spread of fly ash is reported to have been adversely affecting the living
conditions of people in the villages adjoining IFFCO, Phulpur. Most of the
households reported air-borne dust and ash in the atmosphere. There is, however,
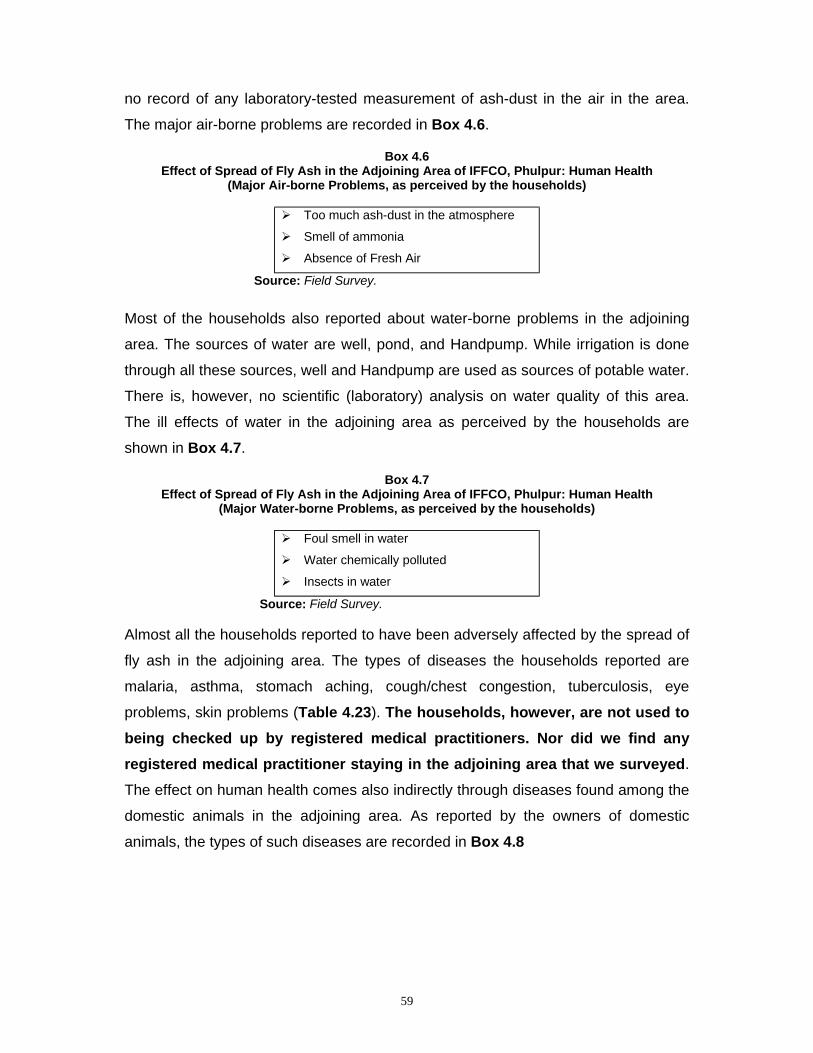
59
no record of any laboratory-tested measurement of ash-dust in the air in the area.
The major air-borne problems are recorded in Box 4.6.
Box 4.6 Effect of Spread of Fly Ash in the Adjoining Area of IFFCO, Phulpur: Human Health
(Major Air-borne Problems, as perceived by the households)
! Too much ash-dust in the atmosphere
! Smell of ammonia
! Absence of Fresh Air
Source: Field Survey.
Most of the households also reported about water-borne problems in the adjoining
area. The sources of water are well, pond, and Handpump. While irrigation is done
through all these sources, well and Handpump are used as sources of potable water.
There is, however, no scientific (laboratory) analysis on water quality of this area.
The ill effects of water in the adjoining area as perceived by the households are
shown in Box 4.7.
Box 4.7 Effect of Spread of Fly Ash in the Adjoining Area of IFFCO, Phulpur: Human Health
(Major Water-borne Problems, as perceived by the households)
! Foul smell in water
! Water chemically polluted
! Insects in water
Source: Field Survey.
Almost all the households reported to have been adversely affected by the spread of
fly ash in the adjoining area. The types of diseases the households reported are
malaria, asthma, stomach aching, cough/chest congestion, tuberculosis, eye
problems, skin problems (Table 4.23). The households, however, are not used to being checked up by registered medical practitioners. Nor did we find any registered medical practitioner staying in the adjoining area that we surveyed.
The effect on human health comes also indirectly through diseases found among the
domestic animals in the adjoining area. As reported by the owners of domestic
animals, the types of such diseases are recorded in Box 4.8
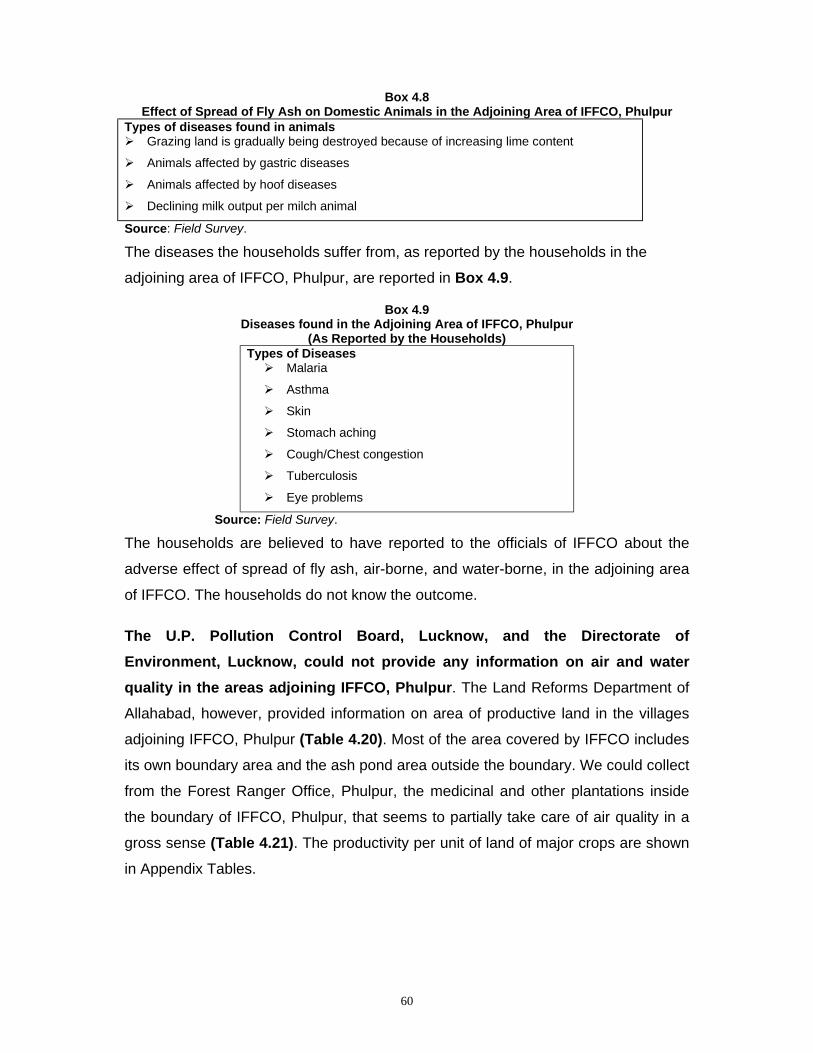
60
Box 4.8 Effect of Spread of Fly Ash on Domestic Animals in the Adjoining Area of IFFCO, Phulpur
Types of diseases found in animals ! Grazing land is gradually being destroyed because of increasing lime content
! Animals affected by gastric diseases
! Animals affected by hoof diseases
! Declining milk output per milch animal
Source: Field Survey.
The diseases the households suffer from, as reported by the households in the
adjoining area of IFFCO, Phulpur, are reported in Box 4.9.
Box 4.9 Diseases found in the Adjoining Area of IFFCO, Phulpur
(As Reported by the Households) Types of Diseases ! Malaria
! Asthma
! Skin
! Stomach aching
! Cough/Chest congestion
! Tuberculosis
! Eye problems Source: Field Survey.
The households are believed to have reported to the officials of IFFCO about the
adverse effect of spread of fly ash, air-borne, and water-borne, in the adjoining area
of IFFCO. The households do not know the outcome.
The U.P. Pollution Control Board, Lucknow, and the Directorate of Environment, Lucknow, could not provide any information on air and water quality in the areas adjoining IFFCO, Phulpur. The Land Reforms Department of
Allahabad, however, provided information on area of productive land in the villages
adjoining IFFCO, Phulpur (Table 4.20). Most of the area covered by IFFCO includes
its own boundary area and the ash pond area outside the boundary. We could collect
from the Forest Ranger Office, Phulpur, the medicinal and other plantations inside
the boundary of IFFCO, Phulpur, that seems to partially take care of air quality in a
gross sense (Table 4.21). The productivity per unit of land of major crops are shown
in Appendix Tables.
61
Table 4.20
Land Quality in Areas Adjoining IFFCO, Phulpur
C Land Name of Village B+ Land** (In Hect.)
B Land*** Area Ph.* Value
Total
Chandouki and Dailapur
8.010 (18.67)
22.491 (52.42)
12.405 (28.91)
9.10-10.20 42.906 (100.0)
Kanehati 5.860 (14.27)
19.239 (46.85)
15.963 (38.88)
9.0-10.10 41.062 (100.0)
Total 13.870 (16.52)
41.730 (49.70)
28.368 (33.78)
83.968 (100.0)
Note: * Denotes Land Productive Value (Less than 8.5 Ph. = Productive Land & More than or Equal to 8.5 Ph. = Waste/Usar Land, **B + Land = Double Crop Land, ***B Land = Single Crop Land, C Land = Waste/Usar Land) Land Reforms Departments Land Reforms Programmes Progress in 40 Villages of Phulpur. Among these Villages, 3 are the Sample Villages of the Study.
Source: Land Reforms Department, Allahabad
Table 4.21 Plantations Inside IFFCO, Phulpur Through Forest Department, Government of U.P.
Year Plantation Area
(in Hect.) No. of Trees Types of Plantations (trees)
1998-99 4.8 (13.6)
1600 (2.98)
1999-00 21.0 (59.5)
33000 (61.57)
2000-01 4.0 (13.3)
8000 (14.93)
2001-02* 5.5 (15.6)
11000 (20.52)
Total 35.3 (100.0)
53600 (100.0)
(I) Medicinal (II) Fruit-yielding (III) Decorative (IV) Furniture and Fuel-based Major Trees (Arjun, Kanjee, Shisham, Mango, Jamun, Aonla, Praspiece, Sagon, Jangal Jalebi, Kesia Arikuli Farmish etc.)
Note: * Up to December 2001. Plantation in Senhuadih, Mubarakpur and Vidyut Parishad near Dhokri Village after Land Reforms By Land Reforms Department through Fly Ash.
Source: Forest Ranger Office, Phulpur, Allahabad.
4.8 Suggestions Offered by the People Affected by spread of Fly Ash in the Adjoining Area
Human Health-Related Facilities
For prevention of diseases in the adjoining area of IFFCO, Phulpur, the households
suggested some measures, which are listed in Box 4.10.

62
Box 4.10 Required Health Facilities for Prevention of Diseases in the Adjoining Area of IFFCO, Phulpur (As
perceived by the households)
! There has to be provision for regular medical check up of health for the people in the
adjoining area, to be done by IFFCO,
! Necessary medicines should be distributed by IFFCO, if necessary, free of cost for the
local residents,
! Measures should be taken by IFFCO to stop air-borne and water-borne pollution and
diseases which is fly-ash-led,
! Measures should be taken by IFFCO to stop foul smell of ammonia and other gaseous
smell.
Source: Field Survey.
The households offered suggestions for ensuring safe potable water and water for
irrigation purposes in the adjoining area. The suggestions ask for shouldering
responsibility by both IFFCO and local public bodies. The suggestions are shown in
Box 4.11.
Box 4.11 Suggestions for Prevention of Water-borne Adverse Effect in the Adjoining Area
(As perceived by the households) ! Dumping area and dumped ash should be at an altitude lower than the height of ground
level of crop area,
! Proper drainage system should be made for flow of foul water,
! Water logging in the ash dumping area should be cleared on a regular basis,
! Dumping area should be relocated at a safer distance,
! Potable water should be clinically tested,
! Hand Pumps need deep boring for drinking purposes.
Source: Field Survey.
Photo 4.8: Ash Pond of IFFCO, Phulpur.
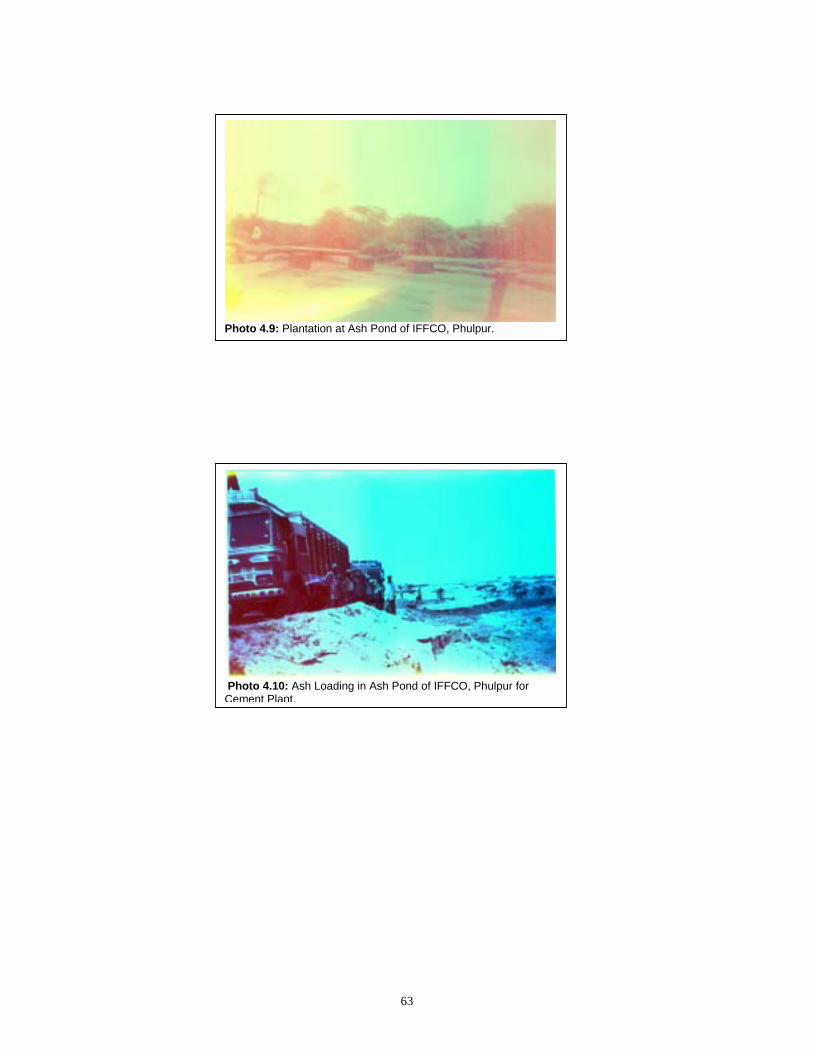
63
Photo 4.9: Plantation at Ash Pond of IFFCO, Phulpur.
Photo 4.10: Ash Loading in Ash Pond of IFFCO, Phulpur for Cement Plant.
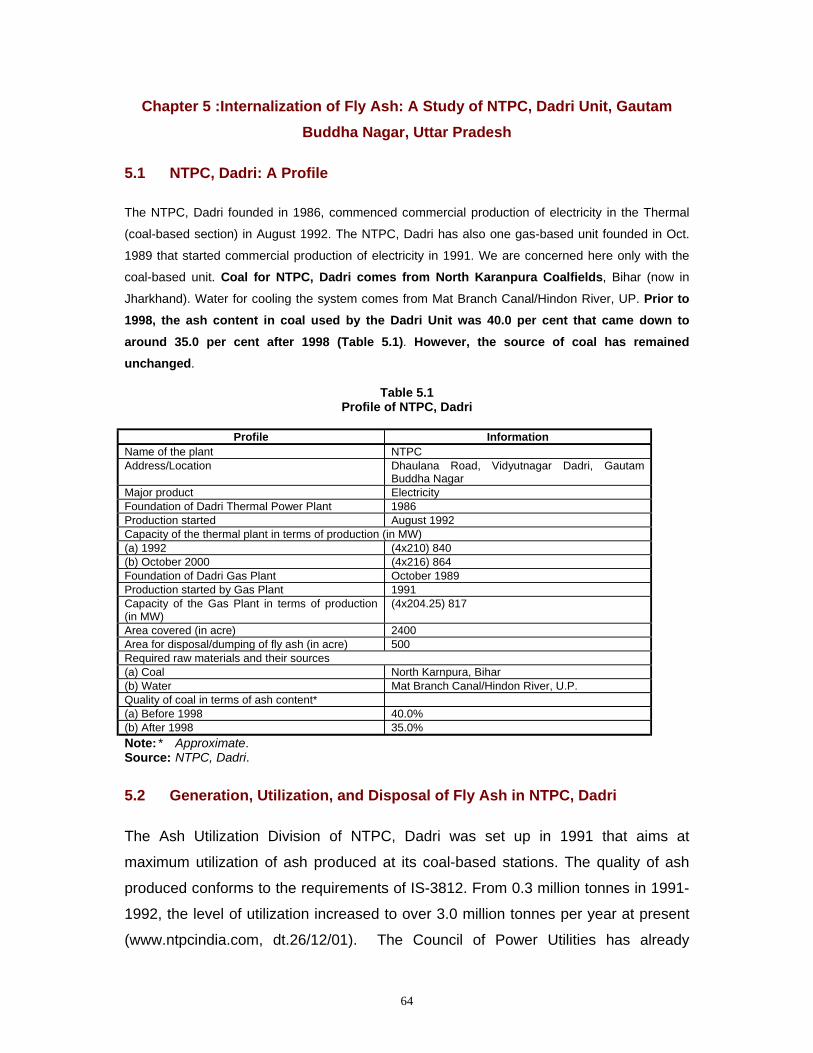
64
Chapter 5 :Internalization of Fly Ash: A Study of NTPC, Dadri Unit, Gautam Buddha Nagar, Uttar Pradesh
5.1 NTPC, Dadri: A Profile
The NTPC, Dadri founded in 1986, commenced commercial production of electricity in the Thermal
(coal-based section) in August 1992. The NTPC, Dadri has also one gas-based unit founded in Oct.
1989 that started commercial production of electricity in 1991. We are concerned here only with the
coal-based unit. Coal for NTPC, Dadri comes from North Karanpura Coalfields, Bihar (now in
Jharkhand). Water for cooling the system comes from Mat Branch Canal/Hindon River, UP. Prior to 1998, the ash content in coal used by the Dadri Unit was 40.0 per cent that came down to around 35.0 per cent after 1998 (Table 5.1). However, the source of coal has remained
unchanged.
Table 5.1 Profile of NTPC, Dadri
Profile Information
Name of the plant NTPC Address/Location Dhaulana Road, Vidyutnagar Dadri, Gautam
Buddha Nagar Major product Electricity Foundation of Dadri Thermal Power Plant 1986 Production started August 1992 Capacity of the thermal plant in terms of production (in MW) (a) 1992 (4x210) 840 (b) October 2000 (4x216) 864 Foundation of Dadri Gas Plant October 1989 Production started by Gas Plant 1991 Capacity of the Gas Plant in terms of production (in MW)
(4x204.25) 817
Area covered (in acre) 2400 Area for disposal/dumping of fly ash (in acre) 500 Required raw materials and their sources (a) Coal North Karnpura, Bihar (b) Water Mat Branch Canal/Hindon River, U.P. Quality of coal in terms of ash content* (a) Before 1998 40.0% (b) After 1998 35.0% Note: * Approximate. Source: NTPC, Dadri.
5.2 Generation, Utilization, and Disposal of Fly Ash in NTPC, Dadri
The Ash Utilization Division of NTPC, Dadri was set up in 1991 that aims at
maximum utilization of ash produced at its coal-based stations. The quality of ash
produced conforms to the requirements of IS-3812. From 0.3 million tonnes in 1991-
1992, the level of utilization increased to over 3.0 million tonnes per year at present
(www.ntpcindia.com, dt.26/12/01). The Council of Power Utilities has already
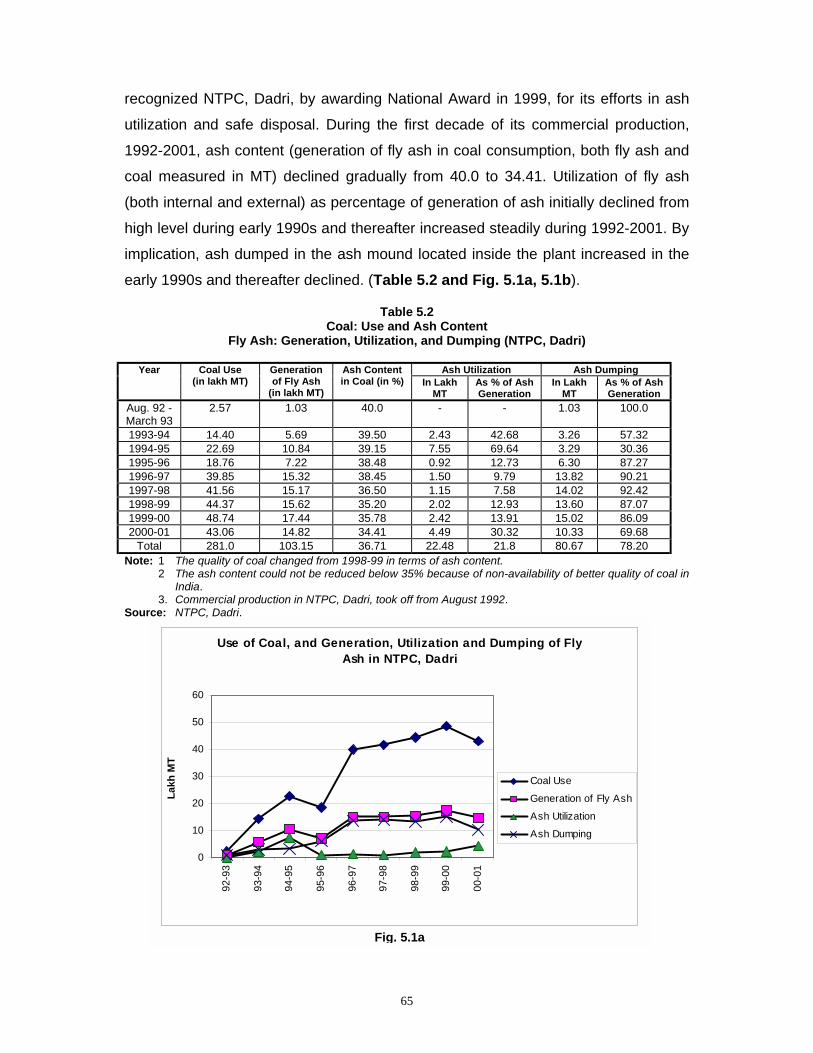
65
recognized NTPC, Dadri, by awarding National Award in 1999, for its efforts in ash
utilization and safe disposal. During the first decade of its commercial production,
1992-2001, ash content (generation of fly ash in coal consumption, both fly ash and
coal measured in MT) declined gradually from 40.0 to 34.41. Utilization of fly ash
(both internal and external) as percentage of generation of ash initially declined from
high level during early 1990s and thereafter increased steadily during 1992-2001. By
implication, ash dumped in the ash mound located inside the plant increased in the
early 1990s and thereafter declined. (Table 5.2 and Fig. 5.1a, 5.1b).
Table 5.2 Coal: Use and Ash Content
Fly Ash: Generation, Utilization, and Dumping (NTPC, Dadri)
Ash Utilization Ash Dumping Year Coal Use (in lakh MT)
Generation of Fly Ash
(in lakh MT)
Ash Content in Coal (in %) In Lakh
MT As % of Ash Generation
In Lakh MT
As % of Ash Generation
Aug. 92 -March 93
2.57 1.03 40.0 - - 1.03 100.0
1993-94 14.40 5.69 39.50 2.43 42.68 3.26 57.32 1994-95 22.69 10.84 39.15 7.55 69.64 3.29 30.36 1995-96 18.76 7.22 38.48 0.92 12.73 6.30 87.27 1996-97 39.85 15.32 38.45 1.50 9.79 13.82 90.21 1997-98 41.56 15.17 36.50 1.15 7.58 14.02 92.42 1998-99 44.37 15.62 35.20 2.02 12.93 13.60 87.07 1999-00 48.74 17.44 35.78 2.42 13.91 15.02 86.09 2000-01 43.06 14.82 34.41 4.49 30.32 10.33 69.68
Total 281.0 103.15 36.71 22.48 21.8 80.67 78.20 Note: 1 The quality of coal changed from 1998-99 in terms of ash content. 2 The ash content could not be reduced below 35% because of non-availability of better quality of coal in
India. 3. Commercial production in NTPC, Dadri, took off from August 1992. Source: NTPC, Dadri.
Use of Coal, and Generation, Utilization and Dumping of Fly Ash in NTPC, Dadri
0
10
20
30
40
50
60
92-9
3
93-9
4
94-9
5
95-9
6
96-9
7
97-9
8
98-9
9
99-0
0
00-0
1
Lakh
MT
Coal Use
Generation of Fly Ash
Ash Utilization
Ash Dumping
Fig. 5.1a
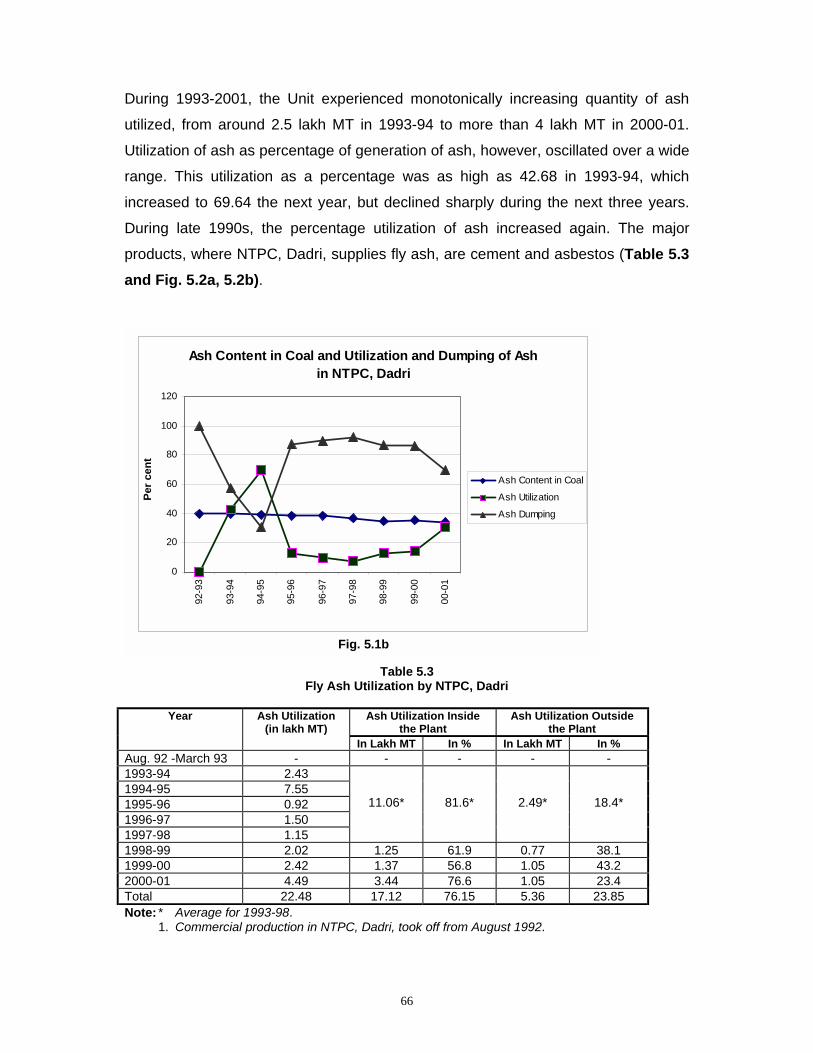
66
During 1993-2001, the Unit experienced monotonically increasing quantity of ash
utilized, from around 2.5 lakh MT in 1993-94 to more than 4 lakh MT in 2000-01.
Utilization of ash as percentage of generation of ash, however, oscillated over a wide
range. This utilization as a percentage was as high as 42.68 in 1993-94, which
increased to 69.64 the next year, but declined sharply during the next three years.
During late 1990s, the percentage utilization of ash increased again. The major
products, where NTPC, Dadri, supplies fly ash, are cement and asbestos (Table 5.3 and Fig. 5.2a, 5.2b).
Table 5.3 Fly Ash Utilization by NTPC, Dadri
Ash Utilization Inside
the Plant Ash Utilization Outside
the Plant Year Ash Utilization
(in lakh MT) In Lakh MT In % In Lakh MT In %
Aug. 92 -March 93 - - - - - 1993-94 2.43 1994-95 7.55 1995-96 0.92 1996-97 1.50 1997-98 1.15
11.06*
81.6*
2.49*
18.4*
1998-99 2.02 1.25 61.9 0.77 38.1 1999-00 2.42 1.37 56.8 1.05 43.2 2000-01 4.49 3.44 76.6 1.05 23.4 Total 22.48 17.12 76.15 5.36 23.85 Note: * Average for 1993-98. 1. Commercial production in NTPC, Dadri, took off from August 1992.
Ash Content in Coal and Utilization and Dumping of Ash in NTPC, Dadri
0
20
40
60
80
100
120
92-9
3
93-9
4
94-9
5
95-9
6
96-9
7
97-9
8
98-9
9
99-0
0
00-0
1
Per c
ent
Ash Content in Coal
Ash Utilization
Ash Dumping
Fig. 5.1b
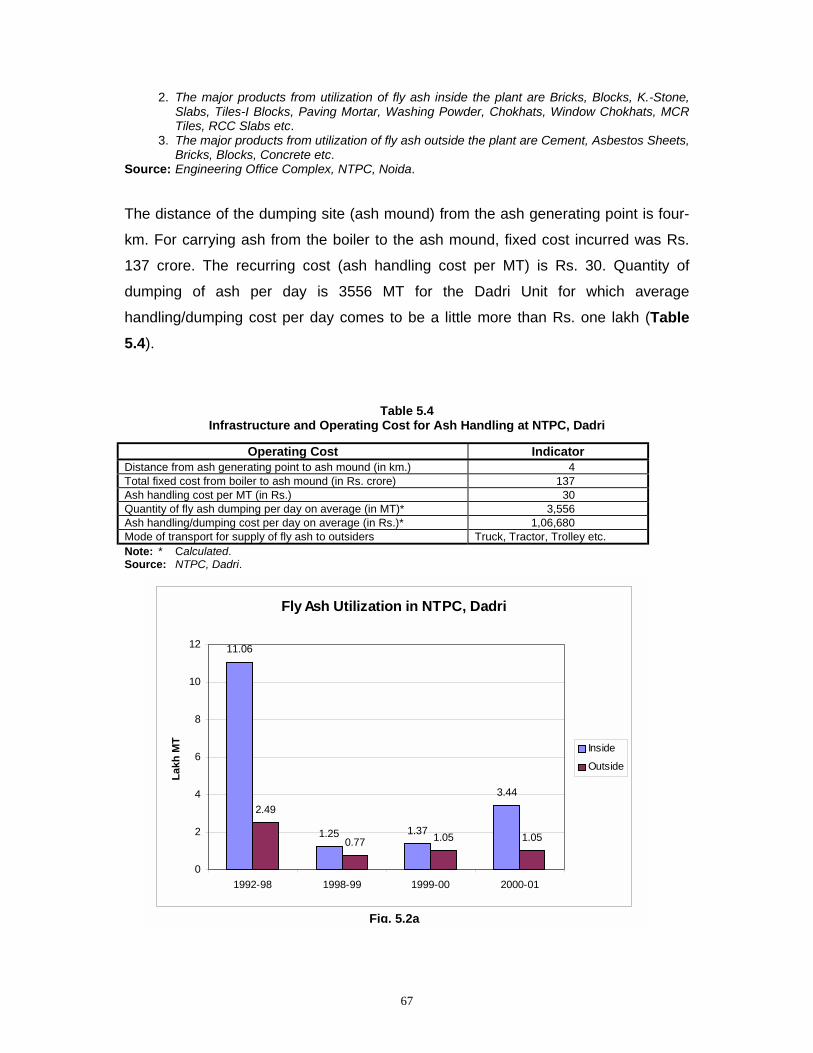
67
2. The major products from utilization of fly ash inside the plant are Bricks, Blocks, K.-Stone, Slabs, Tiles-I Blocks, Paving Mortar, Washing Powder, Chokhats, Window Chokhats, MCR Tiles, RCC Slabs etc.
3. The major products from utilization of fly ash outside the plant are Cement, Asbestos Sheets, Bricks, Blocks, Concrete etc.
Source: Engineering Office Complex, NTPC, Noida. The distance of the dumping site (ash mound) from the ash generating point is four-
km. For carrying ash from the boiler to the ash mound, fixed cost incurred was Rs.
137 crore. The recurring cost (ash handling cost per MT) is Rs. 30. Quantity of
dumping of ash per day is 3556 MT for the Dadri Unit for which average
handling/dumping cost per day comes to be a little more than Rs. one lakh (Table 5.4).
Table 5.4 Infrastructure and Operating Cost for Ash Handling at NTPC, Dadri
Operating Cost Indicator Distance from ash generating point to ash mound (in km.) 4 Total fixed cost from boiler to ash mound (in Rs. crore) 137 Ash handling cost per MT (in Rs.) 30 Quantity of fly ash dumping per day on average (in MT)* 3,556 Ash handling/dumping cost per day on average (in Rs.)* 1,06,680 Mode of transport for supply of fly ash to outsiders Truck, Tractor, Trolley etc. Note: * Calculated. Source: NTPC, Dadri.
Fly Ash Utilization in NTPC, Dadri
11.06
1.25 1.37
3.442.49
0.77 1.05 1.05
0
2
4
6
8
10
12
1992-98 1998-99 1999-00 2000-01
Lakh
MT
Inside
Outside
Fig. 5.2a

68
The major area where fly ash generated by NTPC, Dadri, is used is filling of low lying
areas, including surfacing of roads, and embankments. During the last five years,
1996-2001, the supply of fly ash for external uses in brick manufacturing and ash-
based building products was less than 10.0 per cent, excepting 1997-98 (Table 5.5).
Table 5.5 Utilization of Fly Ash in Different Sectors (in MT)
Year 1996-97 1997-98 1998-99 1999-2000 2000-01
Ash utilization for filling (Road/Embankment)
111206 (73.99)
53000 (46.01)
125155 (61.95)
137956 (56.85)
344130 (76.85)
Ash issued for entrepreneurs for use in Asbestos and Ash based building Products
39075 (26.01)
59125 (51.32)
62742 (31.05)
82560 (34.02)
79693 (17.73)
Ash issued for manufacture of ash bricks and ash based buildings products
- 3075 (2.67)
14123 (6.99)
22130 (9.12)
25537 (5.68)
Total 150281 (100.0)
115200 (100.0)
202020 (100.0)
242646 (100.0)
449360 (100.0)
Source: NTPC, Ash Utilization Cell, Dadri.
The NTPC, Dadri disposes dry ash, as opposed to wet ash. The benefits of disposal
of dry ash are recorded in Box 5.1.
Fly Ash Utilization in NTPC, Dadri
81.6
61.956.8
76.6
18.4
38.143.2
23.4
0
10
20
30
40
50
60
70
80
90
1992-98 1998-99 1999-00 2000-01
Per c
ent
Inside
Outside
Fig. 5.2b
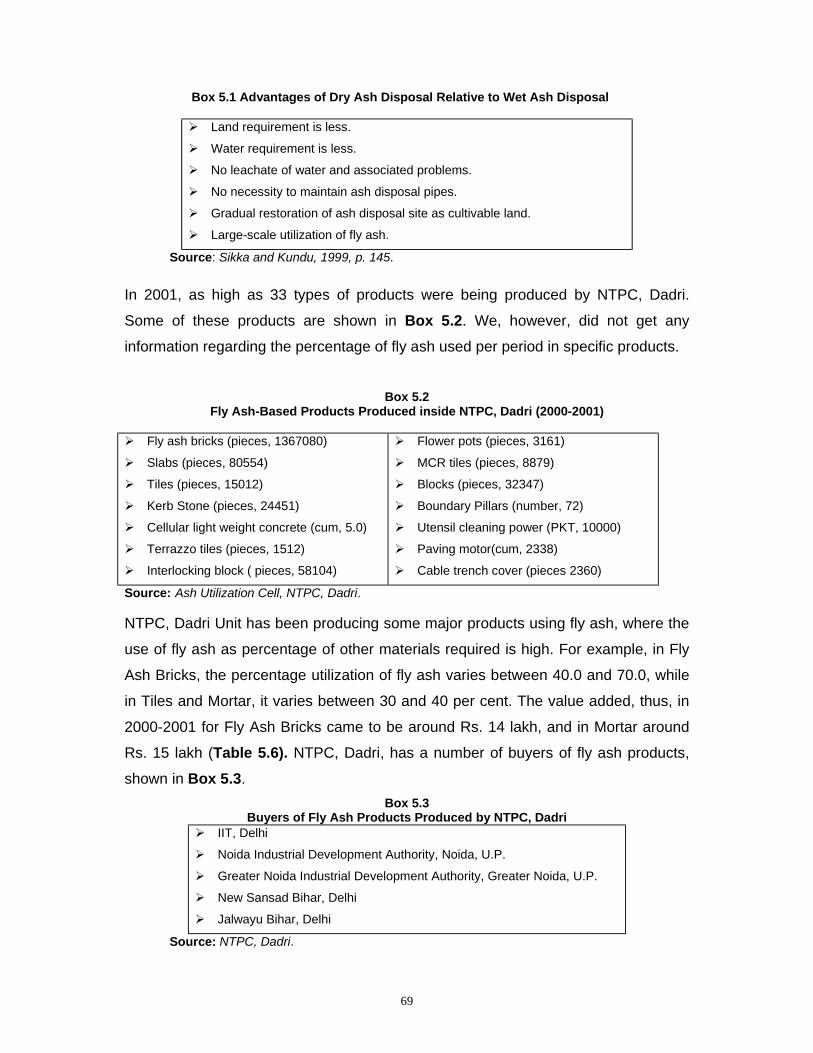
69
Box 5.1 Advantages of Dry Ash Disposal Relative to Wet Ash Disposal
! Land requirement is less.
! Water requirement is less.
! No leachate of water and associated problems.
! No necessity to maintain ash disposal pipes.
! Gradual restoration of ash disposal site as cultivable land.
! Large-scale utilization of fly ash.
Source: Sikka and Kundu, 1999, p. 145.
In 2001, as high as 33 types of products were being produced by NTPC, Dadri.
Some of these products are shown in Box 5.2. We, however, did not get any
information regarding the percentage of fly ash used per period in specific products.
Box 5.2
Fly Ash-Based Products Produced inside NTPC, Dadri (2000-2001) ! Fly ash bricks (pieces, 1367080)
! Slabs (pieces, 80554)
! Tiles (pieces, 15012)
! Kerb Stone (pieces, 24451)
! Cellular light weight concrete (cum, 5.0)
! Terrazzo tiles (pieces, 1512)
! Interlocking block ( pieces, 58104)
! Flower pots (pieces, 3161)
! MCR tiles (pieces, 8879)
! Blocks (pieces, 32347)
! Boundary Pillars (number, 72)
! Utensil cleaning power (PKT, 10000)
! Paving motor(cum, 2338)
! Cable trench cover (pieces 2360)
Source: Ash Utilization Cell, NTPC, Dadri. NTPC, Dadri Unit has been producing some major products using fly ash, where the
use of fly ash as percentage of other materials required is high. For example, in Fly
Ash Bricks, the percentage utilization of fly ash varies between 40.0 and 70.0, while
in Tiles and Mortar, it varies between 30 and 40 per cent. The value added, thus, in
2000-2001 for Fly Ash Bricks came to be around Rs. 14 lakh, and in Mortar around
Rs. 15 lakh (Table 5.6). NTPC, Dadri, has a number of buyers of fly ash products,
shown in Box 5.3. Box 5.3
Buyers of Fly Ash Products Produced by NTPC, Dadri ! IIT, Delhi
! Noida Industrial Development Authority, Noida, U.P.
! Greater Noida Industrial Development Authority, Greater Noida, U.P.
! New Sansad Bihar, Delhi
! Jalwayu Bihar, Delhi
Source: NTPC, Dadri.
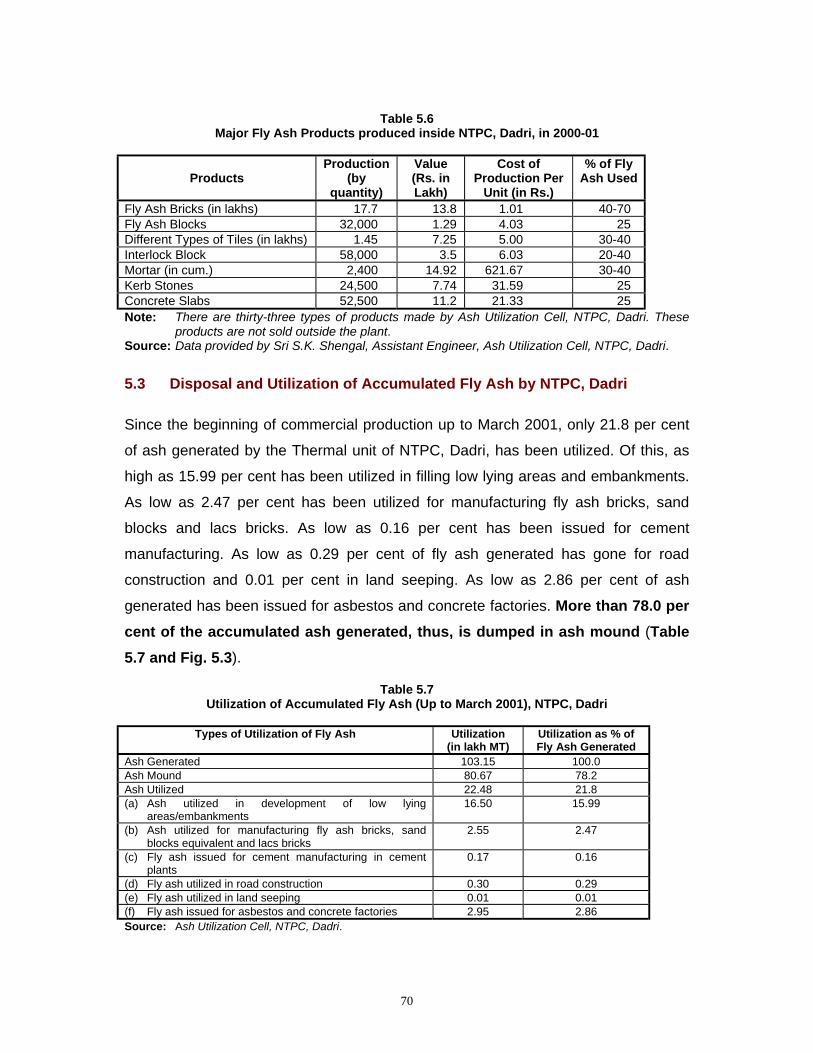
70
Table 5.6 Major Fly Ash Products produced inside NTPC, Dadri, in 2000-01
Products Production
(by quantity)
Value (Rs. in Lakh)
Cost of Production Per
Unit (in Rs.)
% of Fly Ash Used
Fly Ash Bricks (in lakhs) 17.7 13.8 1.01 40-70 Fly Ash Blocks 32,000 1.29 4.03 25 Different Types of Tiles (in lakhs) 1.45 7.25 5.00 30-40 Interlock Block 58,000 3.5 6.03 20-40 Mortar (in cum.) 2,400 14.92 621.67 30-40 Kerb Stones 24,500 7.74 31.59 25 Concrete Slabs 52,500 11.2 21.33 25 Note: There are thirty-three types of products made by Ash Utilization Cell, NTPC, Dadri. These
products are not sold outside the plant. Source: Data provided by Sri S.K. Shengal, Assistant Engineer, Ash Utilization Cell, NTPC, Dadri.
5.3 Disposal and Utilization of Accumulated Fly Ash by NTPC, Dadri
Since the beginning of commercial production up to March 2001, only 21.8 per cent
of ash generated by the Thermal unit of NTPC, Dadri, has been utilized. Of this, as
high as 15.99 per cent has been utilized in filling low lying areas and embankments.
As low as 2.47 per cent has been utilized for manufacturing fly ash bricks, sand
blocks and lacs bricks. As low as 0.16 per cent has been issued for cement
manufacturing. As low as 0.29 per cent of fly ash generated has gone for road
construction and 0.01 per cent in land seeping. As low as 2.86 per cent of ash
generated has been issued for asbestos and concrete factories. More than 78.0 per cent of the accumulated ash generated, thus, is dumped in ash mound (Table 5.7 and Fig. 5.3).
Table 5.7 Utilization of Accumulated Fly Ash (Up to March 2001), NTPC, Dadri
Types of Utilization of Fly Ash Utilization
(in lakh MT) Utilization as % of Fly Ash Generated
Ash Generated 103.15 100.0 Ash Mound 80.67 78.2 Ash Utilized 22.48 21.8 (a) Ash utilized in development of low lying
areas/embankments 16.50 15.99
(b) Ash utilized for manufacturing fly ash bricks, sand blocks equivalent and lacs bricks
2.55 2.47
(c) Fly ash issued for cement manufacturing in cement plants
0.17 0.16
(d) Fly ash utilized in road construction 0.30 0.29 (e) Fly ash utilized in land seeping 0.01 0.01 (f) Fly ash issued for asbestos and concrete factories 2.95 2.86 Source: Ash Utilization Cell, NTPC, Dadri.

71
Export of fly ash from NTPC, Dadri to Nepal started by installing a bagging plant
below soil and is being used in biggest Dam project on “Kali Gandhki River, Nepal”.
Till 31 March 1999, approximately 3500 MT fly ash was exported to Nepal.
5.4 Utilization of Fly Ash in Conventional Clay Brick Plants: Observations
We covered ten conventional clay brick plants within a radius of 50-km. from NTPC,
Dadri located in the District Gautam Buddha Nagar and Ghaziabad, UP. Of these
plants, five are selected within a distance of 25-km. radius while the other five
between 25 and 50 km. This selection follows the Notification, September 1999, of
the Ministry of Environment & Forests, Government of India. However, there is no record of the number of conventional clay brick plants within a radius of 50-km. from the ash generating NTPC plant. It is, thus, not possible to say the exact basis of the sample drawn. We selected a total of ten clay brick plants within the required radius on the assumption that it would represent the problems and possibilities of utilization of fly ash. We selected the conventional
clay brick plants from all the sides of the NTPC, Dadri so that geographic dispersal is
taken care of (Map). It happened that out of the ten brick plants selected, seven are
in the District of Ghaziabad and three are in Gautam Buddha Nagar. Excepting one
Utilization of Fly Ash in Different Sectors
73.4
11.34
0.75 1.33 0.05
13.13
0
10
20
30
40
50
60
70
80
1 2 3 4 5 6
Per c
ent
Note: 1 - Ash utilized in development of low lying areas/embankments, 2 - Ash utilized for manufacturing flyash bricks, sand blocks equivalent and lacs bricks, 3 - Fly ash issued for cement manufacturing incement plants, 4 - Fly ash utilized in road construction, 5 - Fly ash utilized in land seeping, & 6 - Flyash issued for asbestos and concrete factories.
Fig. 5.3

72
brick plant that was set up in 1988, all the plants studied were established in the 1990s (Table 5.8).
The capacity of the plants varies in terms of production of bricks per year. This
variation in production ranges from 17 lakh pieces at the minimum to one and a half
crore at the maximum by a single plant, the average size and weight per brick being
approximately the same for all the plants. For production of clay bricks, soil digging
varies between three and four feet for the plants. The cost of production per 1,000
bricks was reported to vary from Rs. 800 to Rs. 1,000 (Table 5.9).
Table 5.8: Selected Conventional Clay Brick Plants (Located within fifty km. radius from NTPC, Dadri)
Name of the Plant Address Year of
Establishment Distance (in km.)*
Jagpal Brick Factory Kherea, Dhaulana, Ghaziabad 1996 15 Indian Brick Industries Dhaulana, Ghaziabad 1992 24 Janta Brick Field Awal Mor, Pilkua, Dhaulana, Ghaziabad 1990 18 Raj Brick Factory Sikhera Road, Ghaziabad 1999 14 Surya Brick Factory Bathera Mor, Pilkua, Ghaziabad 1996 15 Rajesh Brick Plant Moor, Dadri Gautam Budh Nagar 1990 30 R.K. Brick Factory Near Rajnagar, Ghaziabad 1988 32 Jeet Brick Factory Bypass Road, Ghaziabad 1998 28 Singh Brick Factory Dadri, Gautam Budh Nagar 1995 32 Bear Brick Field Moor, Dadri, Gautam Budh Nagar 1996 30 Note: * From brick plant to NTPC, Dadri. Source: Field survey. Table 5.9 : Conventional Clay Brick Plants: Selected Indicators (Source:Field survey.)
Cost per thousand bricks (in Rs.)
Name of the Plant
Production Per Year
Brick Size (in cubic inches)
Weight Per
Brick (in kg.)
Digging Depth
(in feet) Production Cost
Market Price
Jagpal Brick Factory
47,00000 9x4x3 2.5 3.0 800 1100
Indian Brick Industries
1,00,00000 9x4.5x2.5 2.75 3.5 1000 1300
Janta Brick Field
52,00000 9x4.5x3 2.75 4.0 900 1000
Raj Brick Factory
32,00,000 9x4.5x3 2.7 3.0 950 1200
Surya Brick Factory
1,08,00,000 9x4.5x3 2.75 3.0 900 1000
Rajesh Brick Plant
85,00,000 9x4.5x2.5 2.5 3.0 925 1250
R.K. Brick Factory
1,50,00,000 9x4.5x3 2.75 3.0 1000 1200
Jeet Brick Factory
17,00,000 9x4.5x3 2.5 3.0 1000 1300
Singh Brick Factory
65,00,000 9x4.5x2.5 2.5 3.0 925 1300
Beer Brick Field
45,00,000 9x4.5x2.5 2.5 3.2 1000 1200
Average 70,10,000 9x4.45x2.8 2.6 3.2 940 1185
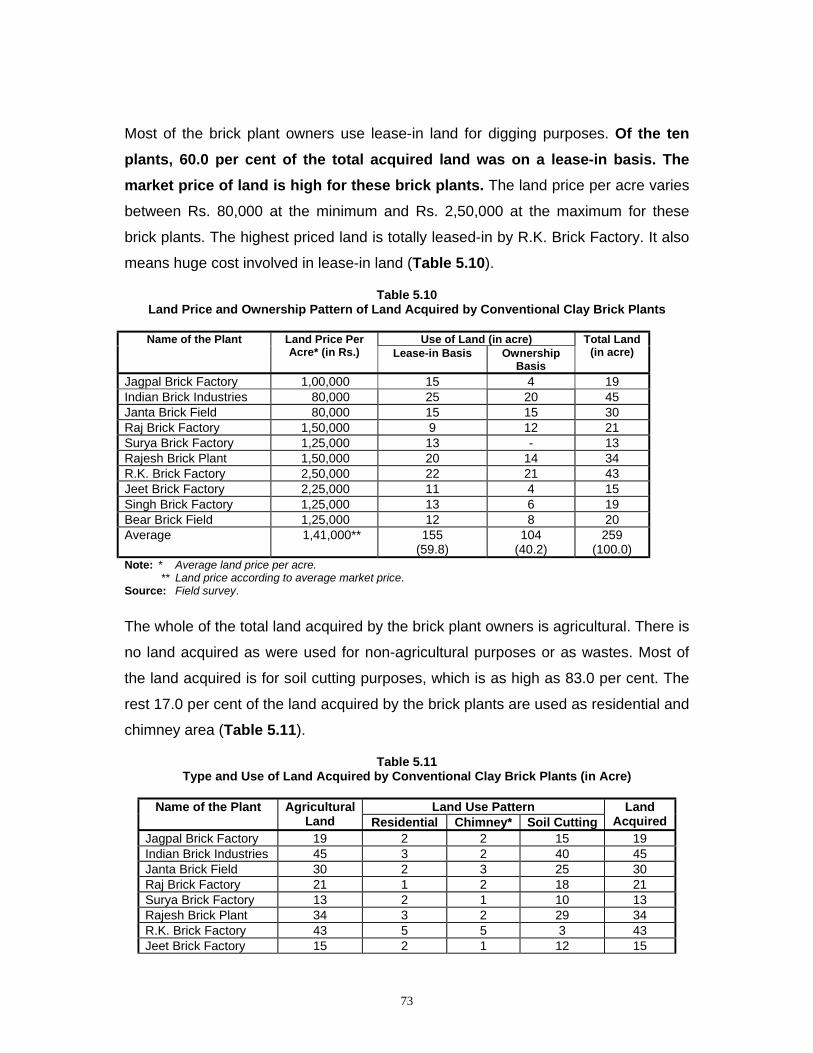
73
Most of the brick plant owners use lease-in land for digging purposes. Of the ten plants, 60.0 per cent of the total acquired land was on a lease-in basis. The market price of land is high for these brick plants. The land price per acre varies
between Rs. 80,000 at the minimum and Rs. 2,50,000 at the maximum for these
brick plants. The highest priced land is totally leased-in by R.K. Brick Factory. It also
means huge cost involved in lease-in land (Table 5.10).
Table 5.10 Land Price and Ownership Pattern of Land Acquired by Conventional Clay Brick Plants
Use of Land (in acre) Name of the Plant Land Price Per
Acre* (in Rs.) Lease-in Basis Ownership Basis
Total Land (in acre)
Jagpal Brick Factory 1,00,000 15 4 19 Indian Brick Industries 80,000 25 20 45 Janta Brick Field 80,000 15 15 30 Raj Brick Factory 1,50,000 9 12 21 Surya Brick Factory 1,25,000 13 - 13 Rajesh Brick Plant 1,50,000 20 14 34 R.K. Brick Factory 2,50,000 22 21 43 Jeet Brick Factory 2,25,000 11 4 15 Singh Brick Factory 1,25,000 13 6 19 Bear Brick Field 1,25,000 12 8 20 Average 1,41,000** 155
(59.8) 104
(40.2) 259
(100.0) Note: * Average land price per acre. ** Land price according to average market price. Source: Field survey.
The whole of the total land acquired by the brick plant owners is agricultural. There is
no land acquired as were used for non-agricultural purposes or as wastes. Most of
the land acquired is for soil cutting purposes, which is as high as 83.0 per cent. The
rest 17.0 per cent of the land acquired by the brick plants are used as residential and
chimney area (Table 5.11).
Table 5.11 Type and Use of Land Acquired by Conventional Clay Brick Plants (in Acre)
Land Use Pattern Name of the Plant Agricultural
Land Residential Chimney* Soil Cutting Land
Acquired Jagpal Brick Factory 19 2 2 15 19 Indian Brick Industries 45 3 2 40 45 Janta Brick Field 30 2 3 25 30 Raj Brick Factory 21 1 2 18 21 Surya Brick Factory 13 2 1 10 13 Rajesh Brick Plant 34 3 2 29 34 R.K. Brick Factory 43 5 5 3 43 Jeet Brick Factory 15 2 1 12 15

74
Singh Brick Factory 19 2 2 15 19 Bear Brick Field 20 3 1 16 20 Total 259
(100.0) 25
(9.7) 19
(7.3) 215
(83.0) 259
(100.0) Note: * Chimney area is also used for soil cutting purposes. Source: Field survey.
The operational period of brick production per year is generally six months or less.
Only three plants out of ten reported production period more than six months. In view
of the plant owners, the brick market (final demand) is stable for future, given the
current rate of production. The capacity of the existing land (owned and leased-in) is
reported by the plant owners as sufficient to meet market demand at the present rate
(price per one thousand piece). Though the contract for land leased-in varies
generally between 3 and 5 years, the brick plant owners hope to lease-in additional
land as and when required. The existing price of land per acre is not a barrier for
them to lease-in additional land. For most of the brick plants, quality of bricks was
not tested in any laboratory (Table 5.12).
Table 5.12 Seasonality, Stability, and Capacity of Conventional Clay Brick Plants
(Selected Indicators)
Brick Plants Sl. No.
Indicators Number Per cent
Duration of Lease Below 3 years 3 30.0 3 to 5 years 4 40.0
i
Above 5 years 3 30.0 Operational period of brick production per year Below 6 months 2 20.0 Only 6 months 5 50.0
ii
Above 6 months 3 30.0 Stability of brick market by demand (future projections) Very good - - Good 3 30.0 Average 7 70.0
iii
Poor - - Stability of the brick plant by the size of soil (future projections) Use land owned 4 40.0 Purchase land 2 20.0
iv
Leasing-in additional land 9 90.0 Clay bought from outside the plant for construction of bricks during last five years
v
Plant which did not buy clay from outside 1 100.0 Quality of produced clay bricks tested Plants which tested quality 2 20.0
vi
Plants which did not test quality 8 80.0 Source: Field survey.
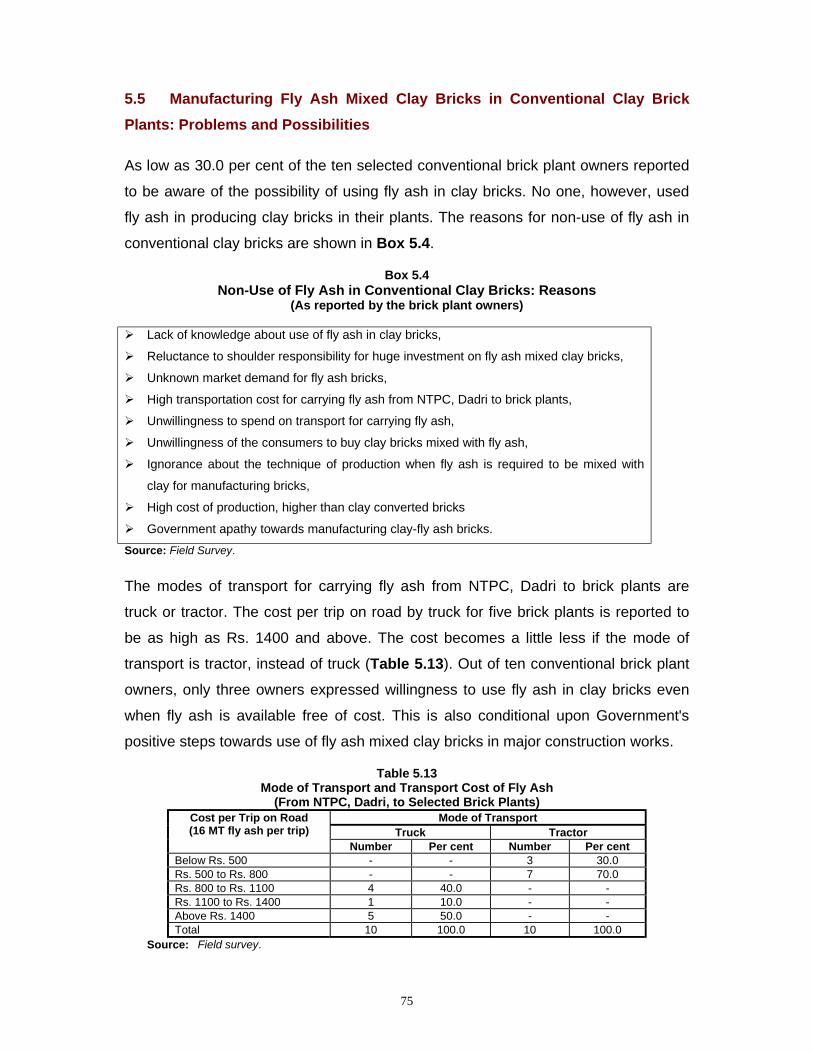
75
5.5 Manufacturing Fly Ash Mixed Clay Bricks in Conventional Clay Brick Plants: Problems and Possibilities
As low as 30.0 per cent of the ten selected conventional brick plant owners reported
to be aware of the possibility of using fly ash in clay bricks. No one, however, used
fly ash in producing clay bricks in their plants. The reasons for non-use of fly ash in
conventional clay bricks are shown in Box 5.4.
Box 5.4 Non-Use of Fly Ash in Conventional Clay Bricks: Reasons
(As reported by the brick plant owners) ! Lack of knowledge about use of fly ash in clay bricks,
! Reluctance to shoulder responsibility for huge investment on fly ash mixed clay bricks,
! Unknown market demand for fly ash bricks,
! High transportation cost for carrying fly ash from NTPC, Dadri to brick plants,
! Unwillingness to spend on transport for carrying fly ash,
! Unwillingness of the consumers to buy clay bricks mixed with fly ash,
! Ignorance about the technique of production when fly ash is required to be mixed with
clay for manufacturing bricks,
! High cost of production, higher than clay converted bricks
! Government apathy towards manufacturing clay-fly ash bricks. Source: Field Survey.
The modes of transport for carrying fly ash from NTPC, Dadri to brick plants are
truck or tractor. The cost per trip on road by truck for five brick plants is reported to
be as high as Rs. 1400 and above. The cost becomes a little less if the mode of
transport is tractor, instead of truck (Table 5.13). Out of ten conventional brick plant
owners, only three owners expressed willingness to use fly ash in clay bricks even
when fly ash is available free of cost. This is also conditional upon Government's
positive steps towards use of fly ash mixed clay bricks in major construction works.
Table 5.13 Mode of Transport and Transport Cost of Fly Ash
(From NTPC, Dadri, to Selected Brick Plants) Mode of Transport
Truck Tractor Cost per Trip on Road (16 MT fly ash per trip)
Number Per cent Number Per cent Below Rs. 500 - - 3 30.0 Rs. 500 to Rs. 800 - - 7 70.0 Rs. 800 to Rs. 1100 4 40.0 - - Rs. 1100 to Rs. 1400 1 10.0 - - Above Rs. 1400 5 50.0 - - Total 10 100.0 10 100.0
Source: Field survey.

76
In general, we found short-run vision of the conventional brick plant owners, be it in
leasing-in land or in investment decisions. The availability of abundant and low cost topsoil helps also in using clay as and when required. Absence of initiatives and incentives from the Government helps in continuing production of clay bricks without mixing fly ash by any percentage. It seems that the
conventional brick plant owners will be willing to use fly ash in manufacturing clay
bricks if they get support from the government, know the technology, get fly ash free
of cost at the gate of the brick plant. The government support includes both purchase
of fly ash mixed clay bricks and fiscal incentives.
As we calculated from information collected from conventional clay brick plants, the
surplus per 1000 such bricks (price – cost) came to be on average Rs. 245.00 (Part-A, Table 5.14 and Fig. 5.4a, 5.4b, 5.4c). In cost of production of such bricks, soil
cost comes to be only 6.86 per cent. Soil cost per thousand bricks jumps to 11.34
per cent if fly ash replaces soil by 25.0 per cent. The cost of production of clay bricks
mixed with fly ash (25.0 per cent) per thousand, thus, becomes 104.47 per cent of
cost of production if fly ash is not mixed with clay. The absolute cost difference
between fly ash mixed clay bricks and conventional clay bricks per thousand bricks,
thus, stands at Rs. 42.09 (Table 5.14 Part-B and Fig. 5.4a, 5.4b, 5.4c). This
positive cost differential is explained by transportation cost of fly ash.
Soil Cutting Area and Possibility of Land that can be Saved by Using Fly Ash, District Ghaziabad
1155.6
288.9364.6
0
200
400
600
800
1000
1200
1400
Soil cutting area Use of fly ash replacingclay by 25%
Use of fly ash replacingclay by 30%
Acr
e
Fig. 5.4a

77
Table 5.14 Conventional Clay Bricks and Fly Ash Mixed Clay Bricks: Some Cost- Benefit Projections
Observations Indicators Part – A
Average brick size (in cubic inch) 9x4.45x2.8 Average weight of a brick (in kg.) 2.6 Average digging depth of soil (in feet) 3.2 Average land price per acre (in Rs.) 1,41,000 Average distance from ash generating plant (in km.) 23.8 Average transportation cost of fly ash from ash generating plant (per 16 MT)* 1433 Average cost of production (per thousand bricks in Rs.)** 940 Average market price (per thousand bricks in Rs.)** 1185
Part – B Quantity of soil in one acre land (in cubic feet) 139366.4 Quantity of soil in one acre land (in MT) 5679.508 Number of bricks that can be manufactured with one acre land (in number) 21,84,426 Quantity of fly ash if 25% of clay is replaced by fly ash (in MT) 1419.877 Transportation cost of fly ash from ash generating plant (in Rs.) as specified by the ratio 75:25 between clay and fly ash
1,27,168
Cost of production of conventional clay bricks per thousand (in Rs.) 940 (a) Soil cost 64.54 (b) Other costs (labour, coal, water, sand etc.) 875.46 Soil cost if fly ash replaces clay by 25.0 per cent (in Rs.) 106.63 Cost of production (fly ash mixed with clay) per thousand bricks (in Rs.) 982.09 Cost difference (fly ash mixed with clay – conventional clay bricks) per thousand bricks (in Rs.)
42.09
Note: (Part-A) provides primary data, collected from field survey. (Part-B) cost-benefit projections with and without fly ash mixed with clay in manufacturing
bricks. * This information is based on respondents at the time of survey. ** No taxes have been added in cost of production. Source: Field Survey.
Soil Cutting by Volume and Possibility of Land that can be Saved by Using Fly Ash, District Ghaziabad
210.6
52.6 63.2
0
50
100
150
200
250
Soil cutting area Use of fly ash replacingclay by 25%
Use of fly ash replacingclay by 30%
Lakh
MT
Fig. 5.4b
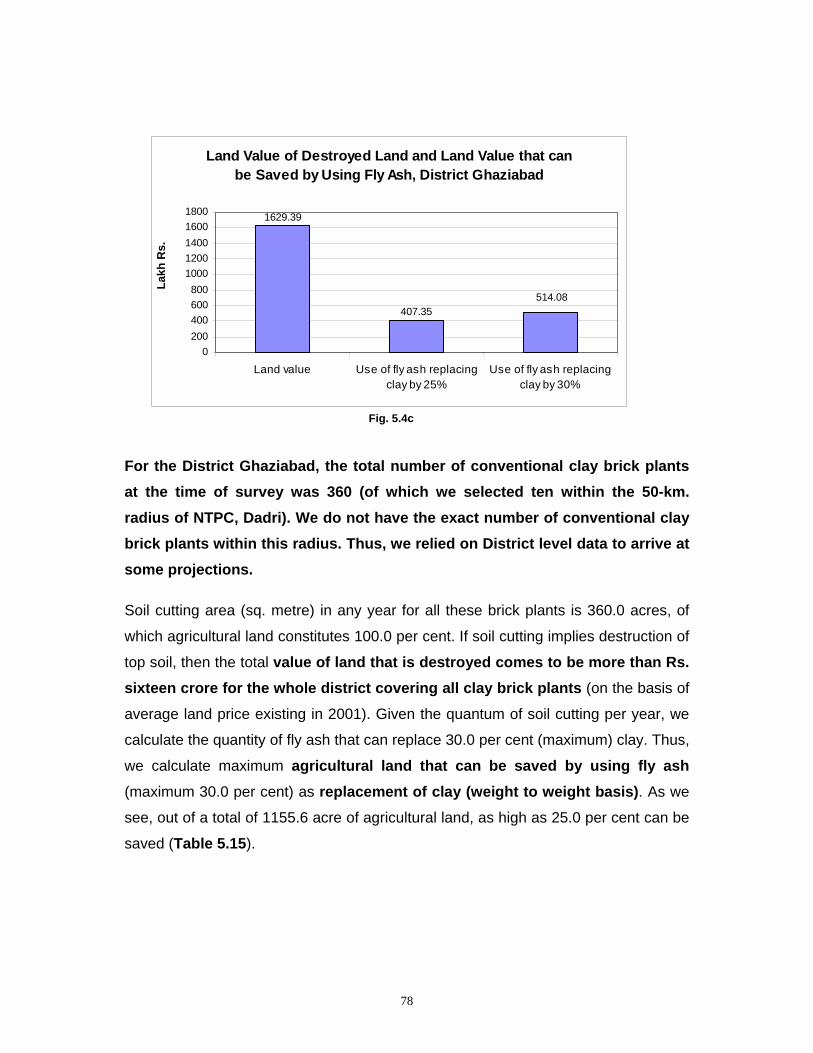
78
For the District Ghaziabad, the total number of conventional clay brick plants at the time of survey was 360 (of which we selected ten within the 50-km. radius of NTPC, Dadri). We do not have the exact number of conventional clay brick plants within this radius. Thus, we relied on District level data to arrive at some projections.
Soil cutting area (sq. metre) in any year for all these brick plants is 360.0 acres, of
which agricultural land constitutes 100.0 per cent. If soil cutting implies destruction of
top soil, then the total value of land that is destroyed comes to be more than Rs. sixteen crore for the whole district covering all clay brick plants (on the basis of
average land price existing in 2001). Given the quantum of soil cutting per year, we
calculate the quantity of fly ash that can replace 30.0 per cent (maximum) clay. Thus,
we calculate maximum agricultural land that can be saved by using fly ash
(maximum 30.0 per cent) as replacement of clay (weight to weight basis). As we
see, out of a total of 1155.6 acre of agricultural land, as high as 25.0 per cent can be
saved (Table 5.15).
Land Value of Destroyed Land and Land Value that can be Saved by Using Fly Ash, District Ghaziabad
407.35
1629.39
514.08
0200400600800
10001200140016001800
Land value Use of fly ash replacingclay by 25%
Use of fly ash replacingclay by 30%
Lakh
Rs.
Fig. 5.4c
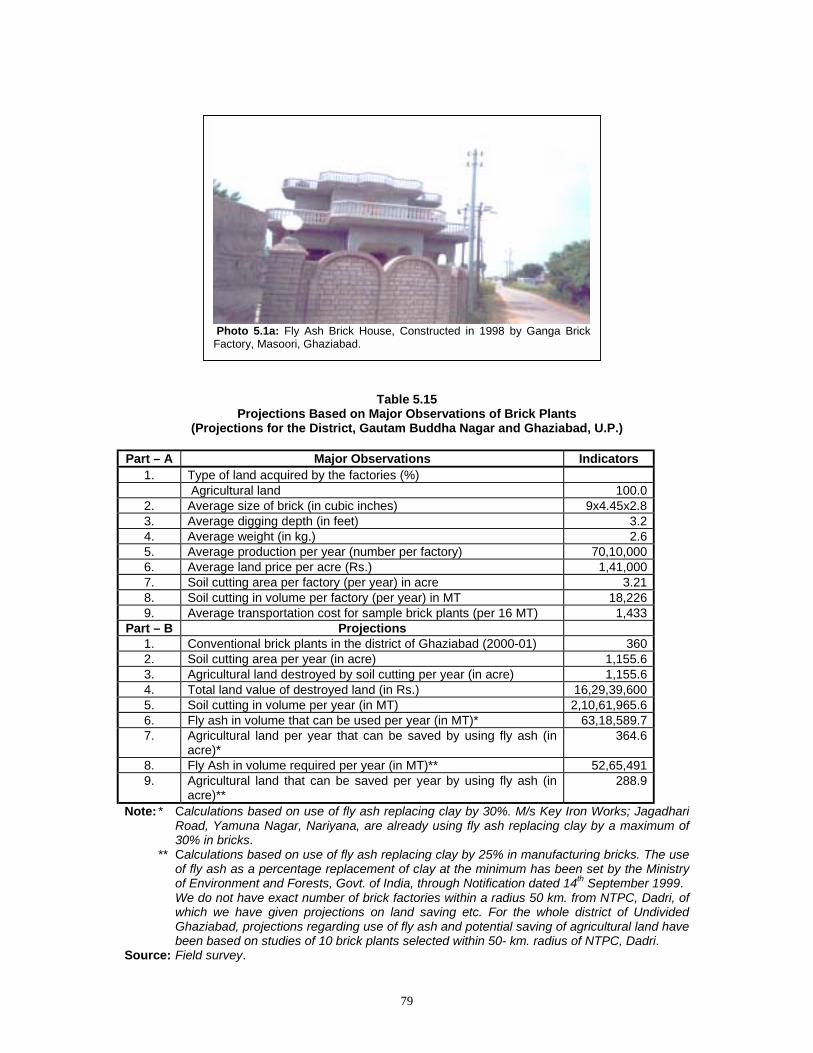
79
Table 5.15 Projections Based on Major Observations of Brick Plants
(Projections for the District, Gautam Buddha Nagar and Ghaziabad, U.P.) Part – A Major Observations Indicators
1. Type of land acquired by the factories (%) Agricultural land 100.0
2. Average size of brick (in cubic inches) 9x4.45x2.8 3. Average digging depth (in feet) 3.2 4. Average weight (in kg.) 2.6 5. Average production per year (number per factory) 70,10,000 6. Average land price per acre (Rs.) 1,41,000 7. Soil cutting area per factory (per year) in acre 3.21 8. Soil cutting in volume per factory (per year) in MT 18,226 9. Average transportation cost for sample brick plants (per 16 MT) 1,433
Part – B Projections 1. Conventional brick plants in the district of Ghaziabad (2000-01) 360 2. Soil cutting area per year (in acre) 1,155.6 3. Agricultural land destroyed by soil cutting per year (in acre) 1,155.6 4. Total land value of destroyed land (in Rs.) 16,29,39,600 5. Soil cutting in volume per year (in MT) 2,10,61,965.6 6. Fly ash in volume that can be used per year (in MT)* 63,18,589.7 7. Agricultural land per year that can be saved by using fly ash (in
acre)* 364.6
8. Fly Ash in volume required per year (in MT)** 52,65,491 9. Agricultural land that can be saved per year by using fly ash (in
acre)** 288.9
Note: * Calculations based on use of fly ash replacing clay by 30%. M/s Key Iron Works; Jagadhari Road, Yamuna Nagar, Nariyana, are already using fly ash replacing clay by a maximum of 30% in bricks.
** Calculations based on use of fly ash replacing clay by 25% in manufacturing bricks. The use of fly ash as a percentage replacement of clay at the minimum has been set by the Ministry of Environment and Forests, Govt. of India, through Notification dated 14th September 1999.
We do not have exact number of brick factories within a radius 50 km. from NTPC, Dadri, of which we have given projections on land saving etc. For the whole district of Undivided Ghaziabad, projections regarding use of fly ash and potential saving of agricultural land have been based on studies of 10 brick plants selected within 50- km. radius of NTPC, Dadri.
Source: Field survey.
Photo 5.1a: Fly Ash Brick House, Constructed in 1998 by Ganga BrickFactory, Masoori, Ghaziabad.
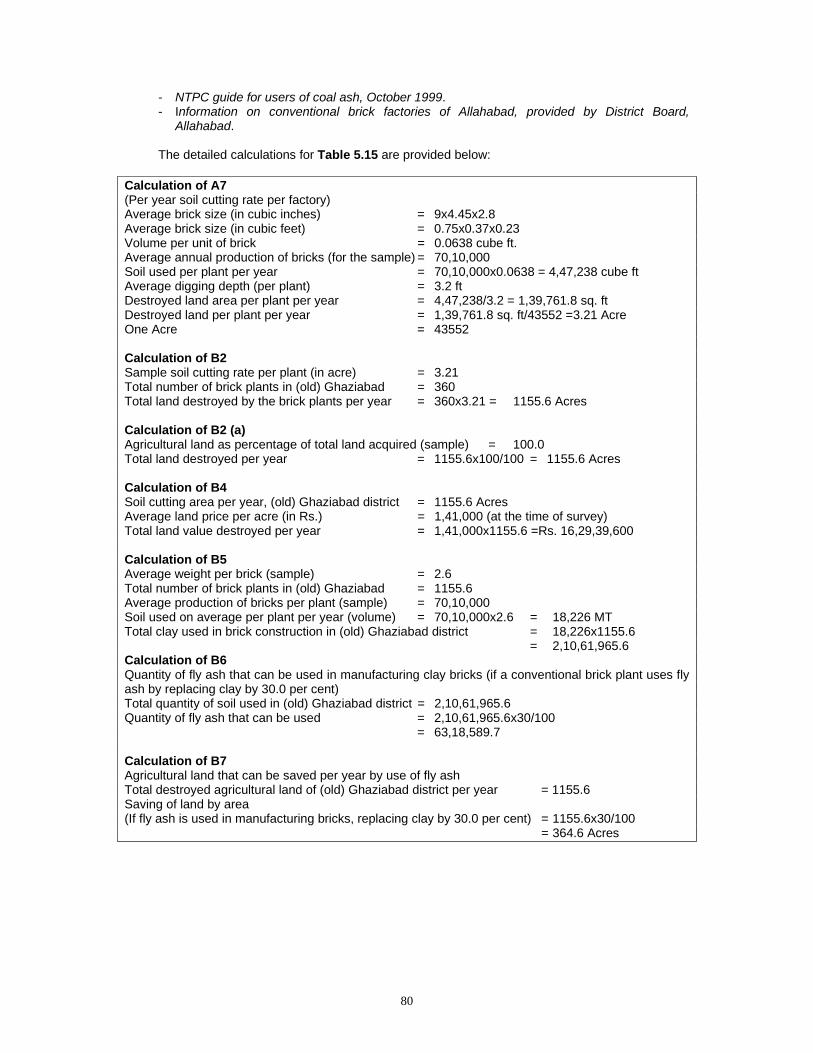
80
- NTPC guide for users of coal ash, October 1999. - Information on conventional brick factories of Allahabad, provided by District Board,
Allahabad. The detailed calculations for Table 5.15 are provided below: Calculation of A7 (Per year soil cutting rate per factory) Average brick size (in cubic inches) = 9x4.45x2.8 Average brick size (in cubic feet) = 0.75x0.37x0.23 Volume per unit of brick = 0.0638 cube ft. Average annual production of bricks (for the sample) = 70,10,000 Soil used per plant per year = 70,10,000x0.0638 = 4,47,238 cube ft Average digging depth (per plant) = 3.2 ft Destroyed land area per plant per year = 4,47,238/3.2 = 1,39,761.8 sq. ft Destroyed land per plant per year = 1,39,761.8 sq. ft/43552 =3.21 Acre One Acre = 43552 Calculation of B2 Sample soil cutting rate per plant (in acre) = 3.21 Total number of brick plants in (old) Ghaziabad = 360 Total land destroyed by the brick plants per year = 360x3.21 = 1155.6 Acres Calculation of B2 (a) Agricultural land as percentage of total land acquired (sample) = 100.0 Total land destroyed per year = 1155.6x100/100 = 1155.6 Acres Calculation of B4 Soil cutting area per year, (old) Ghaziabad district = 1155.6 Acres Average land price per acre (in Rs.) = 1,41,000 (at the time of survey) Total land value destroyed per year = 1,41,000x1155.6 =Rs. 16,29,39,600 Calculation of B5 Average weight per brick (sample) = 2.6 Total number of brick plants in (old) Ghaziabad = 1155.6 Average production of bricks per plant (sample) = 70,10,000 Soil used on average per plant per year (volume) = 70,10,000x2.6 = 18,226 MT Total clay used in brick construction in (old) Ghaziabad district = 18,226x1155.6 = 2,10,61,965.6 Calculation of B6 Quantity of fly ash that can be used in manufacturing clay bricks (if a conventional brick plant uses fly ash by replacing clay by 30.0 per cent) Total quantity of soil used in (old) Ghaziabad district = 2,10,61,965.6 Quantity of fly ash that can be used = 2,10,61,965.6x30/100 = 63,18,589.7 Calculation of B7 Agricultural land that can be saved per year by use of fly ash Total destroyed agricultural land of (old) Ghaziabad district per year = 1155.6 Saving of land by area (If fly ash is used in manufacturing bricks, replacing clay by 30.0 per cent) = 1155.6x30/100 = 364.6 Acres
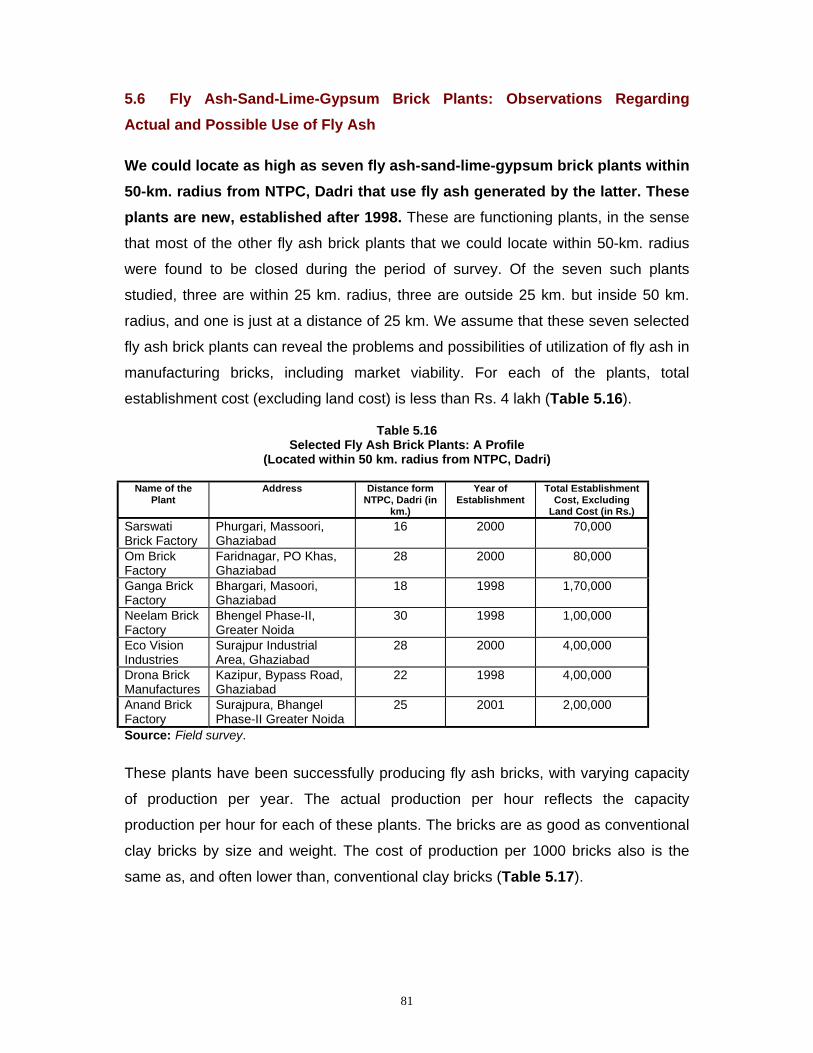
81
5.6 Fly Ash-Sand-Lime-Gypsum Brick Plants: Observations Regarding Actual and Possible Use of Fly Ash
We could locate as high as seven fly ash-sand-lime-gypsum brick plants within 50-km. radius from NTPC, Dadri that use fly ash generated by the latter. These plants are new, established after 1998. These are functioning plants, in the sense
that most of the other fly ash brick plants that we could locate within 50-km. radius
were found to be closed during the period of survey. Of the seven such plants
studied, three are within 25 km. radius, three are outside 25 km. but inside 50 km.
radius, and one is just at a distance of 25 km. We assume that these seven selected
fly ash brick plants can reveal the problems and possibilities of utilization of fly ash in
manufacturing bricks, including market viability. For each of the plants, total
establishment cost (excluding land cost) is less than Rs. 4 lakh (Table 5.16).
Table 5.16 Selected Fly Ash Brick Plants: A Profile
(Located within 50 km. radius from NTPC, Dadri)
Name of the Plant
Address Distance form NTPC, Dadri (in
km.)
Year of Establishment
Total Establishment Cost, Excluding
Land Cost (in Rs.) Sarswati Brick Factory
Phurgari, Massoori, Ghaziabad
16 2000 70,000
Om Brick Factory
Faridnagar, PO Khas, Ghaziabad
28 2000 80,000
Ganga Brick Factory
Bhargari, Masoori, Ghaziabad
18 1998 1,70,000
Neelam Brick Factory
Bhengel Phase-II, Greater Noida
30 1998 1,00,000
Eco Vision Industries
Surajpur Industrial Area, Ghaziabad
28 2000 4,00,000
Drona Brick Manufactures
Kazipur, Bypass Road, Ghaziabad
22 1998 4,00,000
Anand Brick Factory
Surajpura, Bhangel Phase-II Greater Noida
25 2001 2,00,000
Source: Field survey.
These plants have been successfully producing fly ash bricks, with varying capacity
of production per year. The actual production per hour reflects the capacity
production per hour for each of these plants. The bricks are as good as conventional
clay bricks by size and weight. The cost of production per 1000 bricks also is the
same as, and often lower than, conventional clay bricks (Table 5.17).
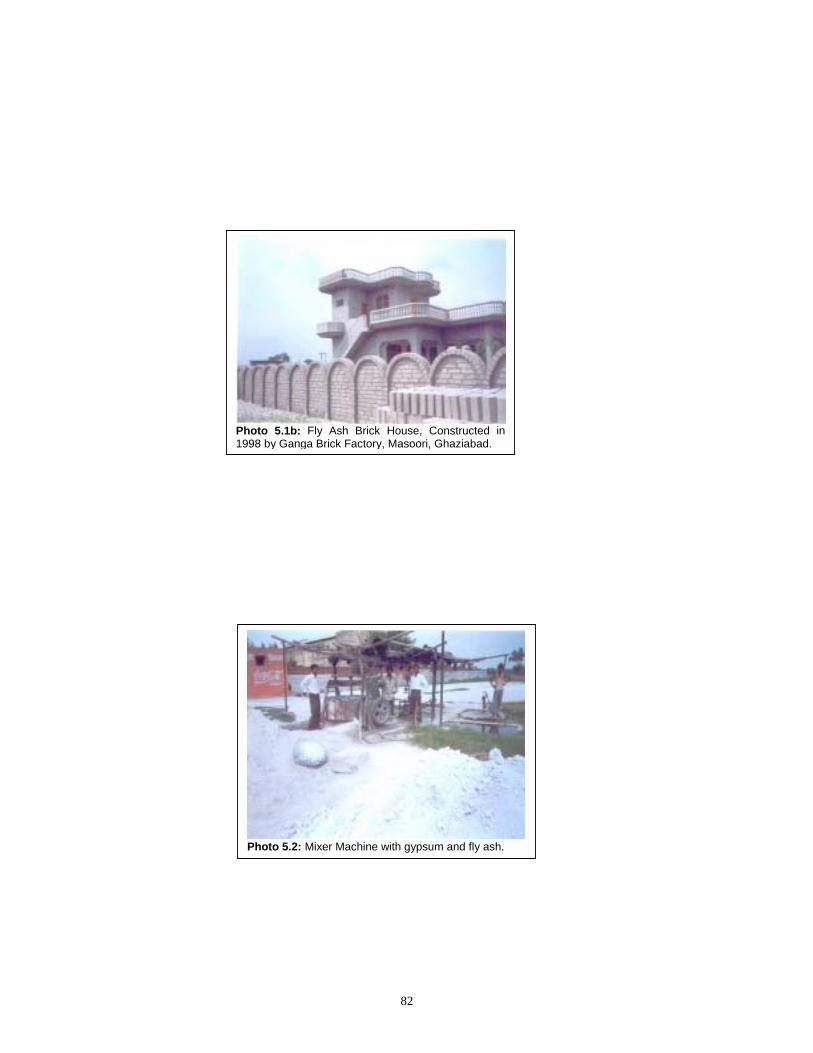
82
Photo 5.1b: Fly Ash Brick House, Constructed in1998 by Ganga Brick Factory, Masoori, Ghaziabad.
Photo 5.2: Mixer Machine with gypsum and fly ash.
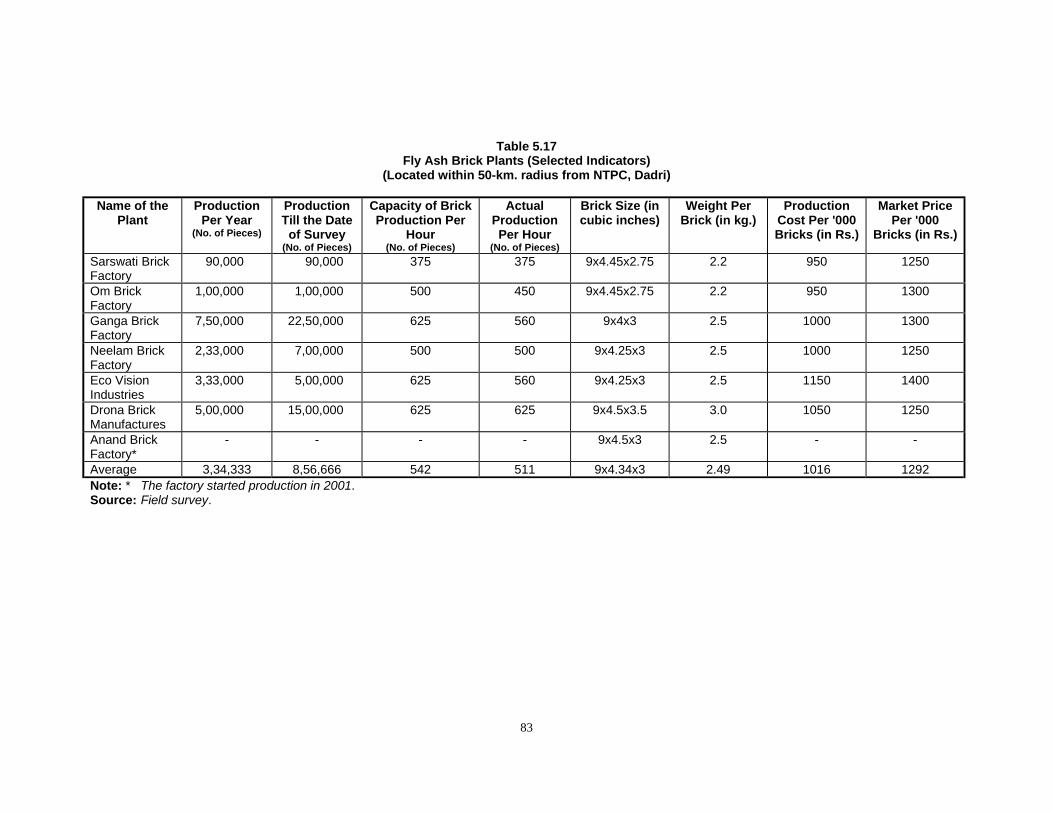
83
Table 5.17
Fly Ash Brick Plants (Selected Indicators) (Located within 50-km. radius from NTPC, Dadri)
Name of the
Plant Production
Per Year (No. of Pieces)
Production Till the Date
of Survey (No. of Pieces)
Capacity of Brick Production Per
Hour (No. of Pieces)
Actual Production Per Hour
(No. of Pieces)
Brick Size (in cubic inches)
Weight Per Brick (in kg.)
Production Cost Per '000 Bricks (in Rs.)
Market Price Per '000
Bricks (in Rs.)
Sarswati Brick Factory
90,000 90,000 375 375 9x4.45x2.75 2.2 950 1250
Om Brick Factory
1,00,000 1,00,000 500 450 9x4.45x2.75 2.2 950 1300
Ganga Brick Factory
7,50,000 22,50,000 625 560 9x4x3 2.5 1000 1300
Neelam Brick Factory
2,33,000 7,00,000 500 500 9x4.25x3 2.5 1000 1250
Eco Vision Industries
3,33,000 5,00,000 625 560 9x4.25x3 2.5 1150 1400
Drona Brick Manufactures
5,00,000 15,00,000 625 625 9x4.5x3.5 3.0 1050 1250
Anand Brick Factory*
- - - - 9x4.5x3 2.5 - -
Average 3,34,333 8,56,666 542 511 9x4.34x3 2.49 1016 1292 Note: * The factory started production in 2001. Source: Field survey.
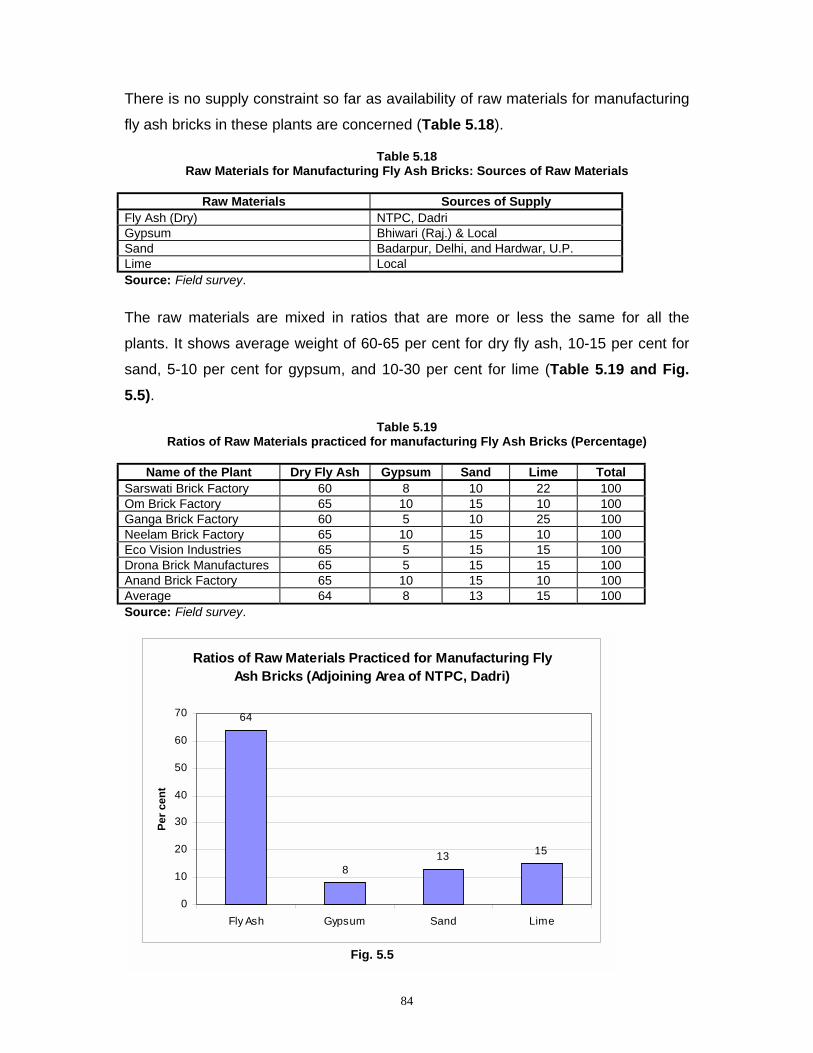
84
There is no supply constraint so far as availability of raw materials for manufacturing
fly ash bricks in these plants are concerned (Table 5.18).
Table 5.18 Raw Materials for Manufacturing Fly Ash Bricks: Sources of Raw Materials
Raw Materials Sources of Supply
Fly Ash (Dry) NTPC, Dadri Gypsum Bhiwari (Raj.) & Local Sand Badarpur, Delhi, and Hardwar, U.P. Lime Local Source: Field survey.
The raw materials are mixed in ratios that are more or less the same for all the
plants. It shows average weight of 60-65 per cent for dry fly ash, 10-15 per cent for
sand, 5-10 per cent for gypsum, and 10-30 per cent for lime (Table 5.19 and Fig. 5.5).
Table 5.19 Ratios of Raw Materials practiced for manufacturing Fly Ash Bricks (Percentage)
Name of the Plant Dry Fly Ash Gypsum Sand Lime Total
Sarswati Brick Factory 60 8 10 22 100 Om Brick Factory 65 10 15 10 100 Ganga Brick Factory 60 5 10 25 100 Neelam Brick Factory 65 10 15 10 100 Eco Vision Industries 65 5 15 15 100 Drona Brick Manufactures 65 5 15 15 100 Anand Brick Factory 65 10 15 10 100 Average 64 8 13 15 100 Source: Field survey.
Ratios of Raw Materials Practiced for Manufacturing Fly Ash Bricks (Adjoining Area of NTPC, Dadri)
64
813 15
0
10
20
30
40
50
60
70
Fly Ash Gypsum Sand Lime
Per c
ent
Fig. 5.5
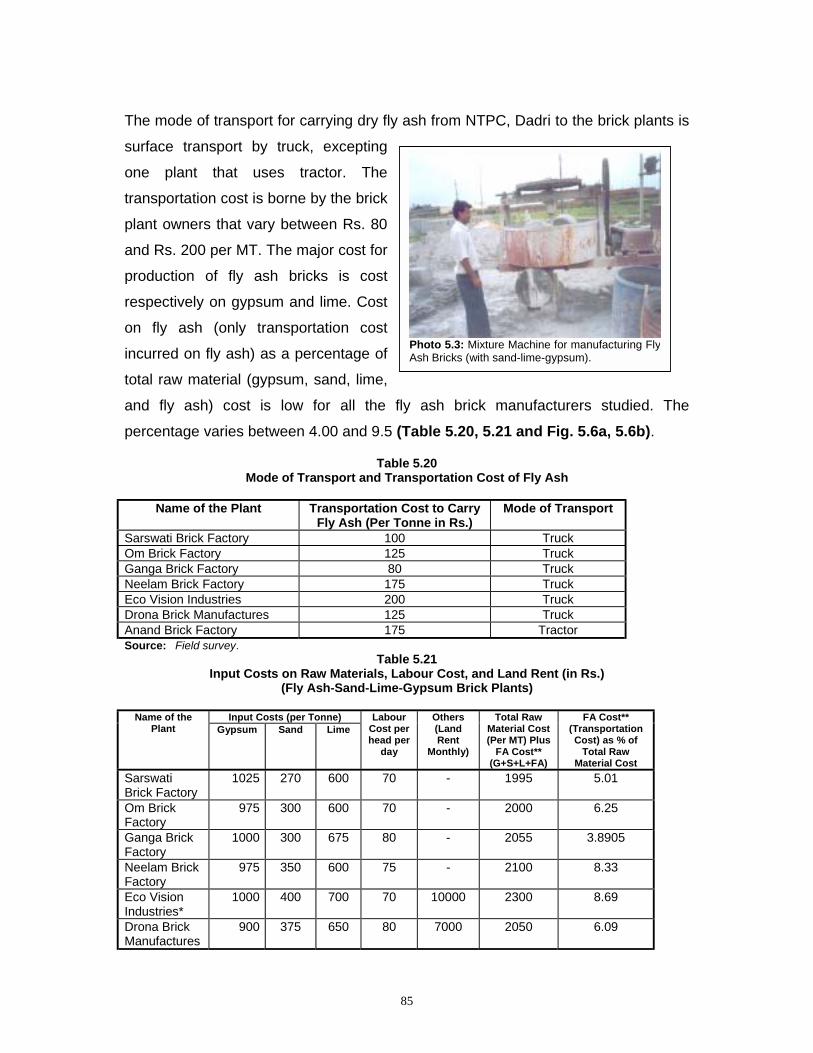
85
The mode of transport for carrying dry fly ash from NTPC, Dadri to the brick plants is
surface transport by truck, excepting
one plant that uses tractor. The
transportation cost is borne by the brick
plant owners that vary between Rs. 80
and Rs. 200 per MT. The major cost for
production of fly ash bricks is cost
respectively on gypsum and lime. Cost
on fly ash (only transportation cost
incurred on fly ash) as a percentage of
total raw material (gypsum, sand, lime,
and fly ash) cost is low for all the fly ash brick manufacturers studied. The
percentage varies between 4.00 and 9.5 (Table 5.20, 5.21 and Fig. 5.6a, 5.6b).
Table 5.20 Mode of Transport and Transportation Cost of Fly Ash
Name of the Plant Transportation Cost to Carry
Fly Ash (Per Tonne in Rs.) Mode of Transport
Sarswati Brick Factory 100 Truck Om Brick Factory 125 Truck Ganga Brick Factory 80 Truck Neelam Brick Factory 175 Truck Eco Vision Industries 200 Truck Drona Brick Manufactures 125 Truck Anand Brick Factory 175 Tractor Source: Field survey.
Table 5.21 Input Costs on Raw Materials, Labour Cost, and Land Rent (in Rs.)
(Fly Ash-Sand-Lime-Gypsum Brick Plants)
Input Costs (per Tonne) Name of the Plant Gypsum Sand Lime
Labour Cost per head per
day
Others (Land Rent
Monthly)
Total Raw Material Cost (Per MT) Plus
FA Cost** (G+S+L+FA)
FA Cost** (Transportation Cost) as % of
Total Raw Material Cost
Sarswati Brick Factory
1025 270 600 70 - 1995 5.01
Om Brick Factory
975 300 600 70 - 2000 6.25
Ganga Brick Factory
1000 300 675 80 - 2055 3.8905
Neelam Brick Factory
975 350 600 75 - 2100 8.33
Eco Vision Industries*
1000 400 700 70 10000 2300 8.69
Drona Brick Manufactures
900 375 650 80 7000 2050 6.09
Photo 5.3: Mixture Machine for manufacturing FlyAsh Bricks (with sand-lime-gypsum).
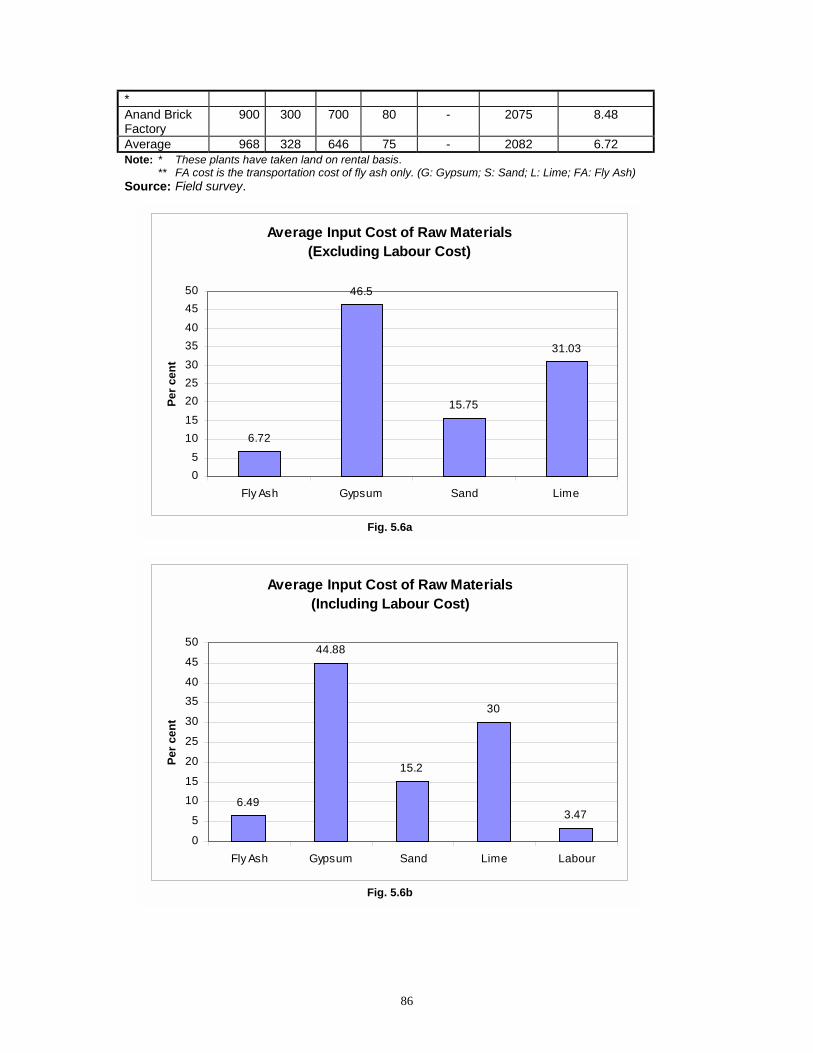
86
* Anand Brick Factory
900 300 700 80 - 2075 8.48
Average 968 328 646 75 - 2082 6.72 Note: * These plants have taken land on rental basis. ** FA cost is the transportation cost of fly ash only. (G: Gypsum; S: Sand; L: Lime; FA: Fly Ash) Source: Field survey.
Average Input Cost of Raw Materials(Excluding Labour Cost)
6.72
46.5
15.75
31.03
05
101520253035404550
Fly Ash Gypsum Sand Lime
Per c
ent
Fig. 5.6a
Average Input Cost of Raw Materials (Including Labour Cost)
6.49
44.88
15.2
30
3.47
0
5
1015
20
25
30
3540
45
50
Fly Ash Gypsum Sand Lime Labour
Per c
ent
Fig. 5.6b
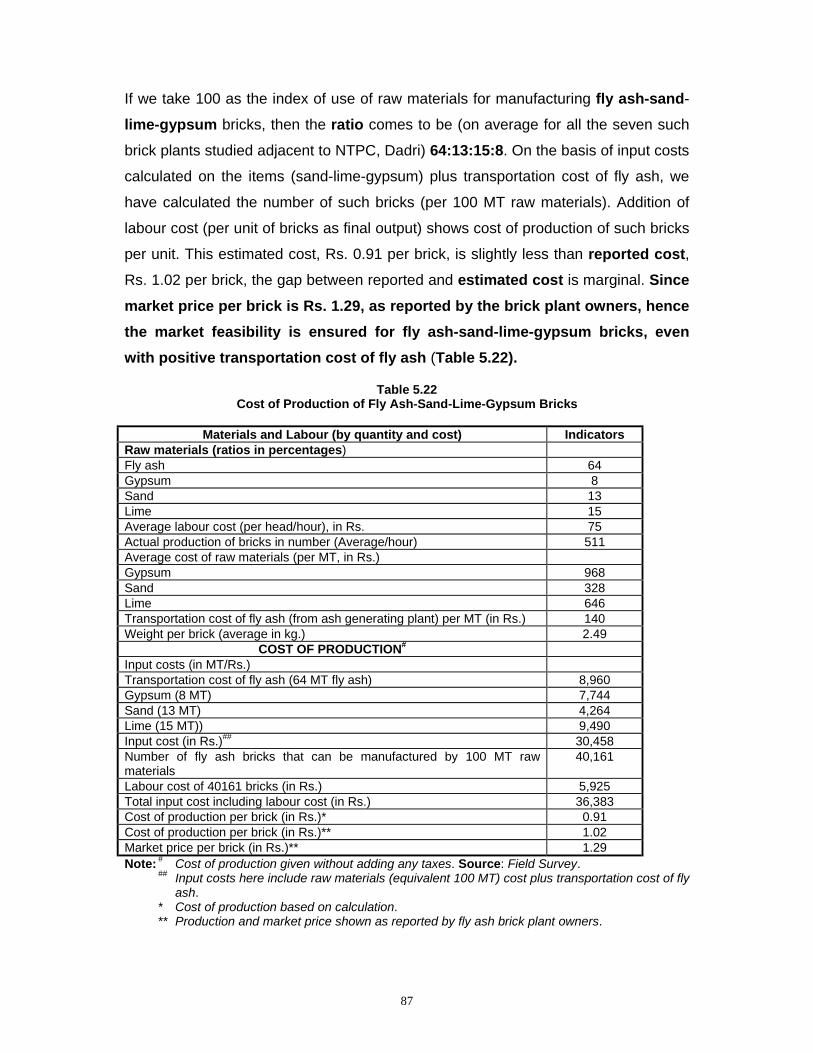
87
If we take 100 as the index of use of raw materials for manufacturing fly ash-sand-
lime-gypsum bricks, then the ratio comes to be (on average for all the seven such
brick plants studied adjacent to NTPC, Dadri) 64:13:15:8. On the basis of input costs
calculated on the items (sand-lime-gypsum) plus transportation cost of fly ash, we
have calculated the number of such bricks (per 100 MT raw materials). Addition of
labour cost (per unit of bricks as final output) shows cost of production of such bricks
per unit. This estimated cost, Rs. 0.91 per brick, is slightly less than reported cost, Rs. 1.02 per brick, the gap between reported and estimated cost is marginal. Since market price per brick is Rs. 1.29, as reported by the brick plant owners, hence the market feasibility is ensured for fly ash-sand-lime-gypsum bricks, even with positive transportation cost of fly ash (Table 5.22).
Table 5.22 Cost of Production of Fly Ash-Sand-Lime-Gypsum Bricks
Materials and Labour (by quantity and cost) Indicators
Raw materials (ratios in percentages) Fly ash 64 Gypsum 8 Sand 13 Lime 15 Average labour cost (per head/hour), in Rs. 75 Actual production of bricks in number (Average/hour) 511 Average cost of raw materials (per MT, in Rs.) Gypsum 968 Sand 328 Lime 646 Transportation cost of fly ash (from ash generating plant) per MT (in Rs.) 140 Weight per brick (average in kg.) 2.49
COST OF PRODUCTION# Input costs (in MT/Rs.) Transportation cost of fly ash (64 MT fly ash) 8,960 Gypsum (8 MT) 7,744 Sand (13 MT) 4,264 Lime (15 MT)) 9,490 Input cost (in Rs.)## 30,458 Number of fly ash bricks that can be manufactured by 100 MT raw materials
40,161
Labour cost of 40161 bricks (in Rs.) 5,925 Total input cost including labour cost (in Rs.) 36,383 Cost of production per brick (in Rs.)* 0.91 Cost of production per brick (in Rs.)** 1.02 Market price per brick (in Rs.)** 1.29 Note: # Cost of production given without adding any taxes. Source: Field Survey. ## Input costs here include raw materials (equivalent 100 MT) cost plus transportation cost of fly
ash. * Cost of production based on calculation. ** Production and market price shown as reported by fly ash brick plant owners.
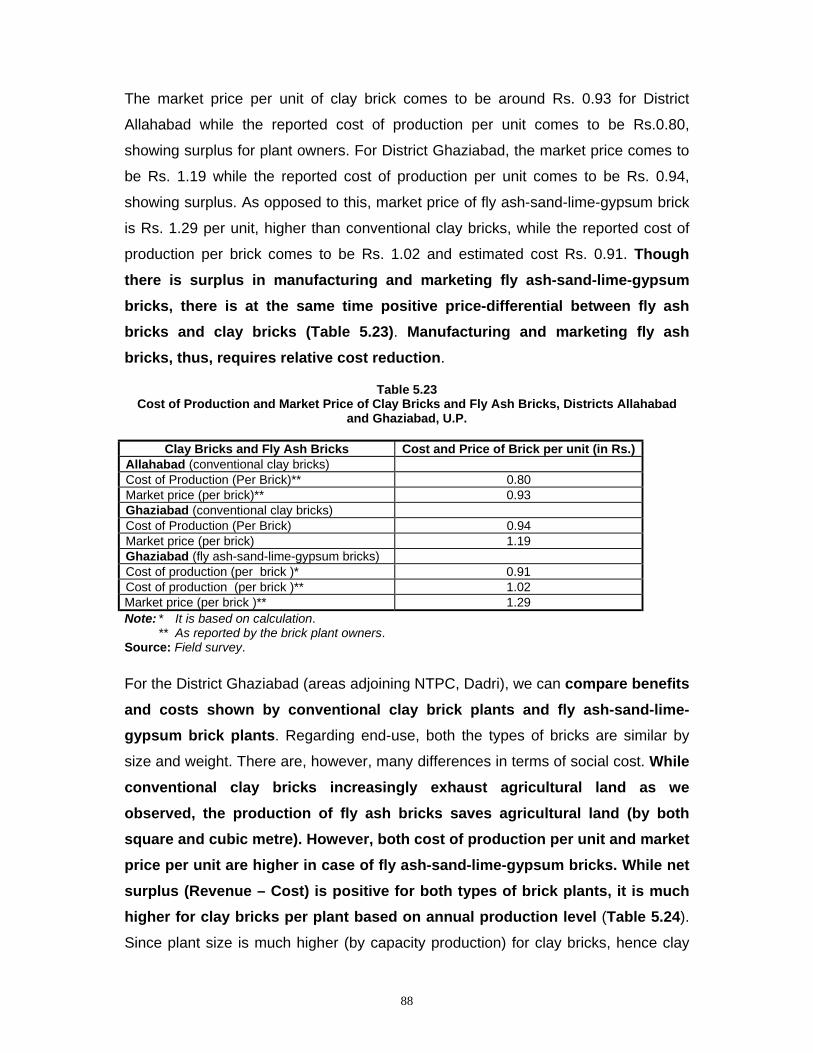
88
The market price per unit of clay brick comes to be around Rs. 0.93 for District
Allahabad while the reported cost of production per unit comes to be Rs.0.80,
showing surplus for plant owners. For District Ghaziabad, the market price comes to
be Rs. 1.19 while the reported cost of production per unit comes to be Rs. 0.94,
showing surplus. As opposed to this, market price of fly ash-sand-lime-gypsum brick
is Rs. 1.29 per unit, higher than conventional clay bricks, while the reported cost of
production per brick comes to be Rs. 1.02 and estimated cost Rs. 0.91. Though there is surplus in manufacturing and marketing fly ash-sand-lime-gypsum bricks, there is at the same time positive price-differential between fly ash bricks and clay bricks (Table 5.23). Manufacturing and marketing fly ash bricks, thus, requires relative cost reduction.
Table 5.23 Cost of Production and Market Price of Clay Bricks and Fly Ash Bricks, Districts Allahabad
and Ghaziabad, U.P.
Clay Bricks and Fly Ash Bricks Cost and Price of Brick per unit (in Rs.) Allahabad (conventional clay bricks) Cost of Production (Per Brick)** 0.80 Market price (per brick)** 0.93 Ghaziabad (conventional clay bricks) Cost of Production (Per Brick) 0.94 Market price (per brick) 1.19 Ghaziabad (fly ash-sand-lime-gypsum bricks) Cost of production (per brick )* 0.91 Cost of production (per brick )** 1.02 Market price (per brick )** 1.29 Note: * It is based on calculation. ** As reported by the brick plant owners. Source: Field survey.
For the District Ghaziabad (areas adjoining NTPC, Dadri), we can compare benefits and costs shown by conventional clay brick plants and fly ash-sand-lime-gypsum brick plants. Regarding end-use, both the types of bricks are similar by
size and weight. There are, however, many differences in terms of social cost. While conventional clay bricks increasingly exhaust agricultural land as we observed, the production of fly ash bricks saves agricultural land (by both square and cubic metre). However, both cost of production per unit and market price per unit are higher in case of fly ash-sand-lime-gypsum bricks. While net surplus (Revenue – Cost) is positive for both types of brick plants, it is much higher for clay bricks per plant based on annual production level (Table 5.24).
Since plant size is much higher (by capacity production) for clay bricks, hence clay
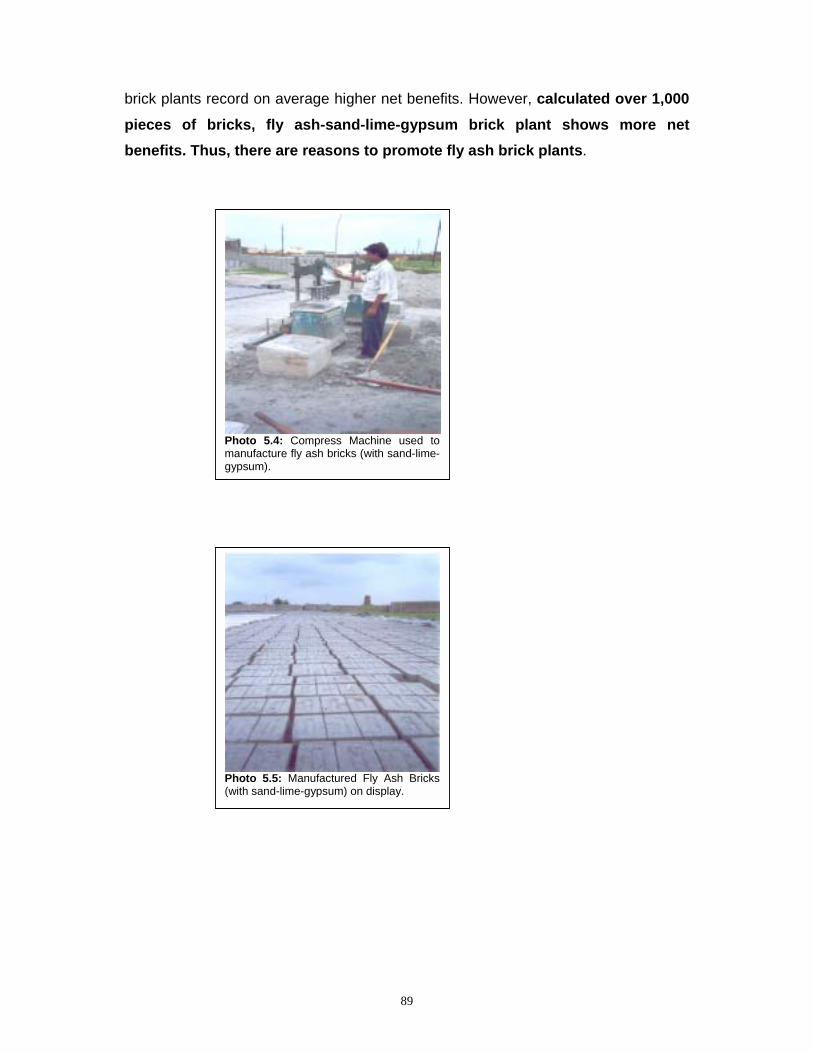
89
Photo 5.5: Manufactured Fly Ash Bricks(with sand-lime-gypsum) on display.
Photo 5.4: Compress Machine used tomanufacture fly ash bricks (with sand-lime-gypsum).
brick plants record on average higher net benefits. However, calculated over 1,000 pieces of bricks, fly ash-sand-lime-gypsum brick plant shows more net benefits. Thus, there are reasons to promote fly ash brick plants.
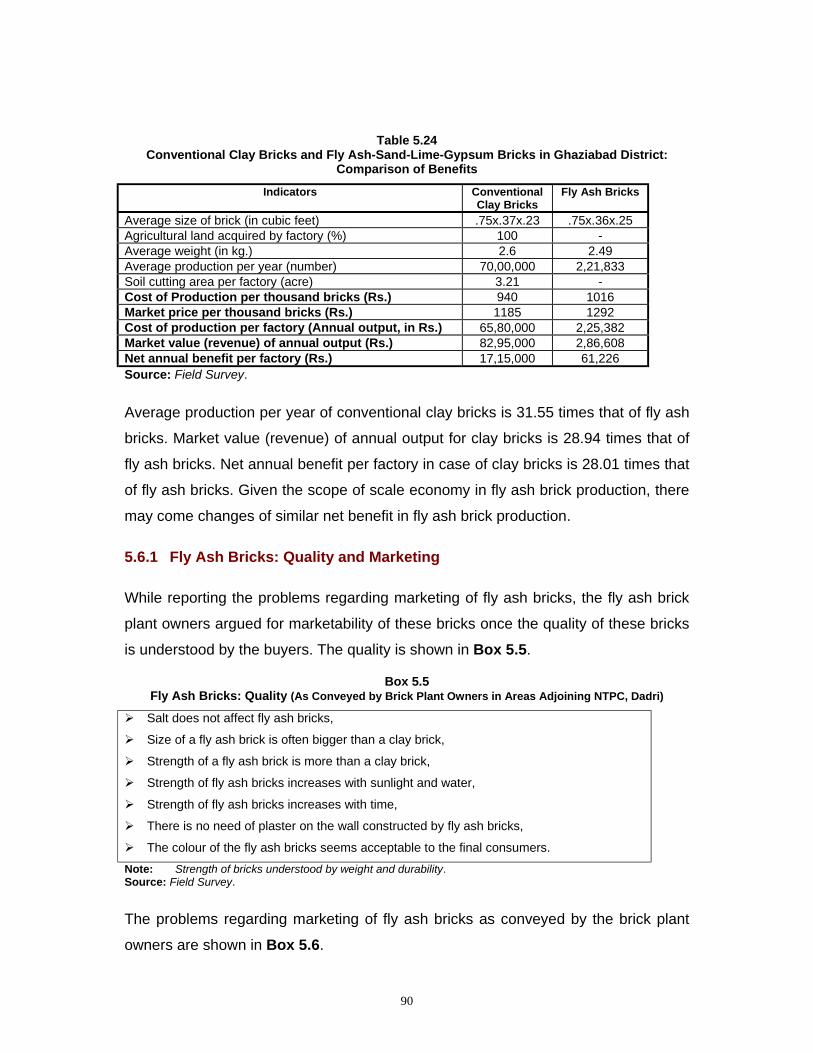
90
Table 5.24 Conventional Clay Bricks and Fly Ash-Sand-Lime-Gypsum Bricks in Ghaziabad District:
Comparison of Benefits
Indicators Conventional Clay Bricks
Fly Ash Bricks
Average size of brick (in cubic feet) .75x.37x.23 .75x.36x.25 Agricultural land acquired by factory (%) 100 - Average weight (in kg.) 2.6 2.49 Average production per year (number) 70,00,000 2,21,833 Soil cutting area per factory (acre) 3.21 - Cost of Production per thousand bricks (Rs.) 940 1016 Market price per thousand bricks (Rs.) 1185 1292 Cost of production per factory (Annual output, in Rs.) 65,80,000 2,25,382 Market value (revenue) of annual output (Rs.) 82,95,000 2,86,608 Net annual benefit per factory (Rs.) 17,15,000 61,226 Source: Field Survey.
Average production per year of conventional clay bricks is 31.55 times that of fly ash
bricks. Market value (revenue) of annual output for clay bricks is 28.94 times that of
fly ash bricks. Net annual benefit per factory in case of clay bricks is 28.01 times that
of fly ash bricks. Given the scope of scale economy in fly ash brick production, there
may come changes of similar net benefit in fly ash brick production.
5.6.1 Fly Ash Bricks: Quality and Marketing
While reporting the problems regarding marketing of fly ash bricks, the fly ash brick
plant owners argued for marketability of these bricks once the quality of these bricks
is understood by the buyers. The quality is shown in Box 5.5.
Box 5.5 Fly Ash Bricks: Quality (As Conveyed by Brick Plant Owners in Areas Adjoining NTPC, Dadri)
! Salt does not affect fly ash bricks,
! Size of a fly ash brick is often bigger than a clay brick,
! Strength of a fly ash brick is more than a clay brick,
! Strength of fly ash bricks increases with sunlight and water,
! Strength of fly ash bricks increases with time,
! There is no need of plaster on the wall constructed by fly ash bricks,
! The colour of the fly ash bricks seems acceptable to the final consumers. Note: Strength of bricks understood by weight and durability. Source: Field Survey.
The problems regarding marketing of fly ash bricks as conveyed by the brick plant
owners are shown in Box 5.6.

91
Box 5.6 Marketing of Fly Ash Bricks: Problems
(As Conveyed by Brick Plant Owners in Areas Adjoining NTPC, Dadri)
! Consumers' ignorance about fly ash bricks,
! Ignorance about the technology for manufacturing fly ash bricks,
! Absence of Government as a buyer of fly ash bricks,
! Absence of any support from local public administration for marketing of fly ash bricks,
! Absence of publicity about the quality of fly ash bricks in the market,
! Price of fly ash bricks not yet fixed by the government,
! No protection or support from the government for encouraging production of fly ash
bricks.
Source: Field Survey.
5.7 Utilization of Fly Ash in Manufacturing Bricks: Suggestions
The suggestions offered by the fly ash brick producers for use of fly ash in brick
production are presented in Box 5.7.
Box 5.7 Utilization of Fly Ash in Manufacturing Bricks: Suggestions
! Government should arrange for testing of fly ash bricks,
! Government should publicize the strength and other qualities of fly ash bricks,
! Government should come forward as the first and biggest buyer of fly ash bricks,
! Government should provide technology (knowledge and training) free of cost to the brick
plant owners,
! Technology Office/Park should be established at each District for access of the brick plant
owners to the technology,
! Government should not impose Excise duties on machines for manufacture of fly ash
bricks,
! Transportation cost of fly ash should be the responsibility of the supplier of fly ash,
! In case transportation cost is borne by the brick manufacturer, the Government has to
subsidize the cost,
! There has to be sales tax rebate on volume and value of fly ash bricks,
! The price of fly ash bricks has to be fixed by the Government.
Source: Field Survey.
5.7.1 Fly Ash-Sand-Lime-Gypsum Brick Plants Located Adjacent to NTPC, Dadri: Availability of Technology
All the selected brick plants reported that they got the technology for manufacturing fly ash mixed bricks from NTPC, Dadri. Only one brick plant (ECO
92
Vision Industries) reported to have taken support from Central Building Research
Institute (CBRI), Roorkee. Ash utilization cell of NTPC, Dadri, reported that its ash
utilization unit has different types of machines, understood in terms of their capacity
of production per period. The value of these machines ranges from rupees thirty
thousand to four lakh at the time of study. The NTPC is reported to be ready to provide total technological support to any potential entrepreneur willing to set up a fly ash brick plant like technique of production, input ratio (fly ash, sand, lime, and gypsum) and dissemination of information in this regard. However, no formal training has so far been organized by the NTPC, Dadri, in this regard.
We got information about availability of two types of machines for manufacturing fly
ash bricks. These are mixing machine and pressure machine, available in
Ghaziabad, Delhi and Hyderabad. The ash utilization cell of NTPC also has a
module room, where all types of products are available for display to the potential
consumers and manufacturers of fly ash bricks.
5.8 Use of Fly Ash Supplied by NTPC, Dadri, in Cement Plants: Observations
The cement manufacturers are the main external users of fly ash supplied by NTPC,
Dadri. We could locate the Diamond cement, Jhansi, UP, that takes 11.4 MT of fly
ash per day from NTPC, Dadri. The distance between NTPC, Dadri, and Diamond
Cement, Jhansi, is around 350 km. This is the reason why the Diamond Cement,
Jhansi, takes most of its required fly ash from UP Electricity Board, Parichha, to the
tune of 64.6 MT per day, that is located at a distance of 5 km. from the cement plant.
The cement plant began using fly ash in cement production in 1986. The technical
ratio in which fly ash is mixed is given as Fly Ash: Clinker: Gypsum as 38:55:07 for
producing Portland Pozzolana Cement. During 1998-2001, the percentage use of fly
ash increased steadily from 36.0 per cent to 38.0 per cent (Fig. 5.7). Of the total fly
ash required by Diamond Cement, 15.0 per cent comes from NTPC, Dadri, and
remaining 85.0 per cent from UP Electricity Board, Parichha. The annual production
of cement, however, has remained fixed, targeted and actual. The transportation
cost of fly ash, that is total fly ash cost, stands at Rs. 2,500 per MT for NTPC, Dadri
while only Rs. 500 for UP Electricity Board (Table 5.25). NTPC, Dadri, thus, has
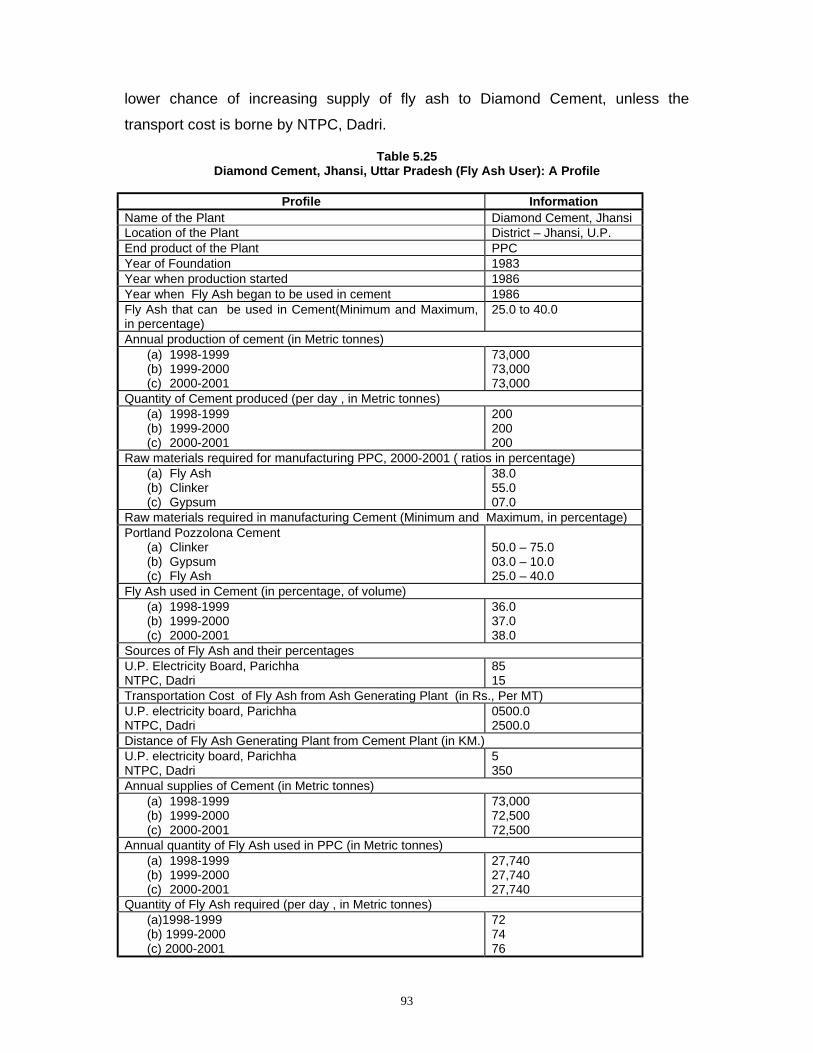
93
lower chance of increasing supply of fly ash to Diamond Cement, unless the
transport cost is borne by NTPC, Dadri.
Table 5.25 Diamond Cement, Jhansi, Uttar Pradesh (Fly Ash User): A Profile
Profile Information
Name of the Plant Diamond Cement, Jhansi Location of the Plant District – Jhansi, U.P. End product of the Plant PPC Year of Foundation 1983 Year when production started 1986 Year when Fly Ash began to be used in cement 1986 Fly Ash that can be used in Cement(Minimum and Maximum, in percentage)
25.0 to 40.0
Annual production of cement (in Metric tonnes) (a) 1998-1999 (b) 1999-2000 (c) 2000-2001
73,000 73,000 73,000
Quantity of Cement produced (per day , in Metric tonnes) (a) 1998-1999 (b) 1999-2000 (c) 2000-2001
200 200 200
Raw materials required for manufacturing PPC, 2000-2001 ( ratios in percentage) (a) Fly Ash (b) Clinker (c) Gypsum
38.0 55.0 07.0
Raw materials required in manufacturing Cement (Minimum and Maximum, in percentage) Portland Pozzolona Cement
(a) Clinker (b) Gypsum (c) Fly Ash
50.0 – 75.0 03.0 – 10.0 25.0 – 40.0
Fly Ash used in Cement (in percentage, of volume) (a) 1998-1999 (b) 1999-2000 (c) 2000-2001
36.0 37.0 38.0
Sources of Fly Ash and their percentages U.P. Electricity Board, Parichha NTPC, Dadri
85 15
Transportation Cost of Fly Ash from Ash Generating Plant (in Rs., Per MT) U.P. electricity board, Parichha NTPC, Dadri
0500.0 2500.0
Distance of Fly Ash Generating Plant from Cement Plant (in KM.) U.P. electricity board, Parichha NTPC, Dadri
5 350
Annual supplies of Cement (in Metric tonnes) (a) 1998-1999 (b) 1999-2000 (c) 2000-2001
73,000 72,500 72,500
Annual quantity of Fly Ash used in PPC (in Metric tonnes) (a) 1998-1999 (b) 1999-2000 (c) 2000-2001
27,740 27,740 27,740
Quantity of Fly Ash required (per day , in Metric tonnes) (a)1998-1999 (b) 1999-2000 (c) 2000-2001
72 74 76
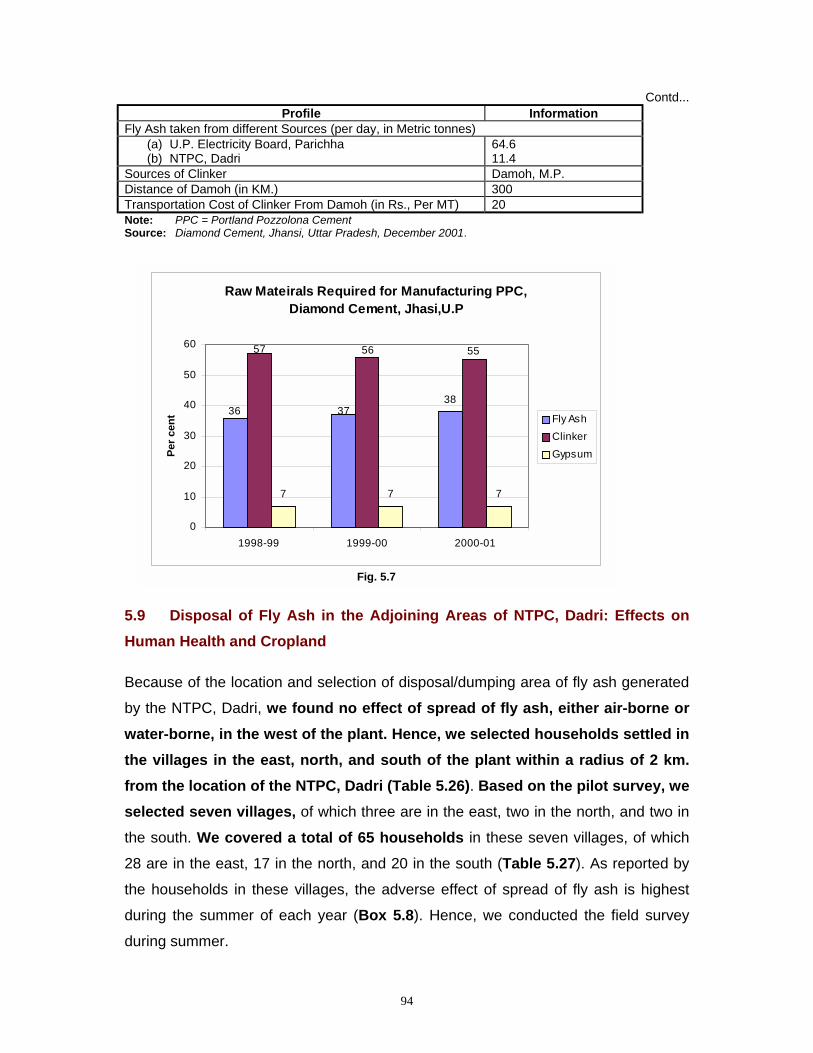
94
Contd... Profile Information
Fly Ash taken from different Sources (per day, in Metric tonnes) (a) U.P. Electricity Board, Parichha (b) NTPC, Dadri
64.6 11.4
Sources of Clinker Damoh, M.P. Distance of Damoh (in KM.) 300 Transportation Cost of Clinker From Damoh (in Rs., Per MT) 20 Note: PPC = Portland Pozzolona Cement Source: Diamond Cement, Jhansi, Uttar Pradesh, December 2001.
5.9 Disposal of Fly Ash in the Adjoining Areas of NTPC, Dadri: Effects on Human Health and Cropland
Because of the location and selection of disposal/dumping area of fly ash generated
by the NTPC, Dadri, we found no effect of spread of fly ash, either air-borne or water-borne, in the west of the plant. Hence, we selected households settled in the villages in the east, north, and south of the plant within a radius of 2 km. from the location of the NTPC, Dadri (Table 5.26). Based on the pilot survey, we selected seven villages, of which three are in the east, two in the north, and two in
the south. We covered a total of 65 households in these seven villages, of which
28 are in the east, 17 in the north, and 20 in the south (Table 5.27). As reported by
the households in these villages, the adverse effect of spread of fly ash is highest
during the summer of each year (Box 5.8). Hence, we conducted the field survey
during summer.
Raw Mateirals Required for Manufacturing PPC, Diamond Cement, Jhasi,U.P
38
7 7 7
36 37
57 56 55
0
10
20
30
40
50
60
1998-99 1999-00 2000-01
Per c
ent Fly Ash
ClinkerGypsum
Fig. 5.7
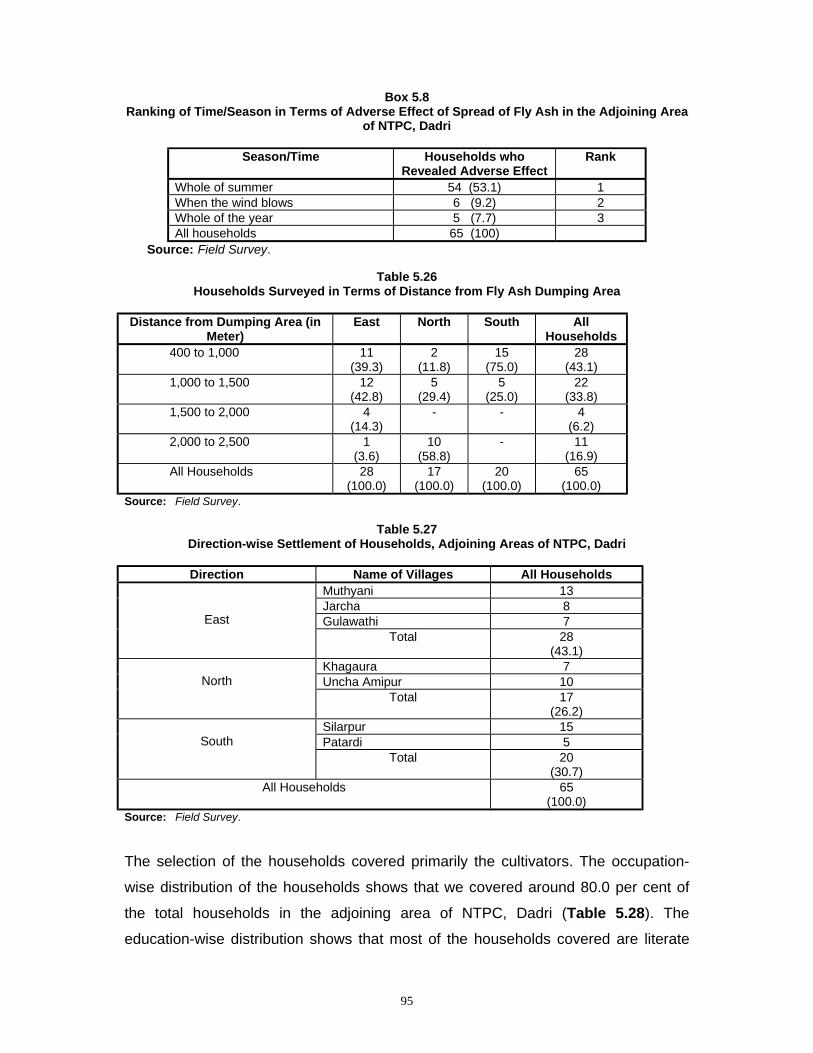
95
Box 5.8 Ranking of Time/Season in Terms of Adverse Effect of Spread of Fly Ash in the Adjoining Area
of NTPC, Dadri
Season/Time Households who Revealed Adverse Effect
Rank
Whole of summer 54 (53.1) 1 When the wind blows 6 (9.2) 2 Whole of the year 5 (7.7) 3 All households 65 (100)
Source: Field Survey.
Table 5.26 Households Surveyed in Terms of Distance from Fly Ash Dumping Area
Distance from Dumping Area (in
Meter) East North South All
Households 400 to 1,000 11
(39.3) 2
(11.8) 15
(75.0) 28
(43.1) 1,000 to 1,500 12
(42.8) 5
(29.4) 5
(25.0) 22
(33.8) 1,500 to 2,000 4
(14.3) - - 4
(6.2) 2,000 to 2,500 1
(3.6) 10
(58.8) - 11
(16.9) All Households 28
(100.0) 17
(100.0) 20
(100.0) 65
(100.0) Source: Field Survey.
Table 5.27 Direction-wise Settlement of Households, Adjoining Areas of NTPC, Dadri
Direction Name of Villages All Households
Muthyani 13 Jarcha 8 Gulawathi 7
East Total 28
(43.1) Khagaura 7 Uncha Amipur 10
North
Total 17 (26.2)
Silarpur 15 Patardi 5
South
Total 20 (30.7)
All Households 65 (100.0)
Source: Field Survey.
The selection of the households covered primarily the cultivators. The occupation-
wise distribution of the households shows that we covered around 80.0 per cent of
the total households in the adjoining area of NTPC, Dadri (Table 5.28). The
education-wise distribution shows that most of the households covered are literate
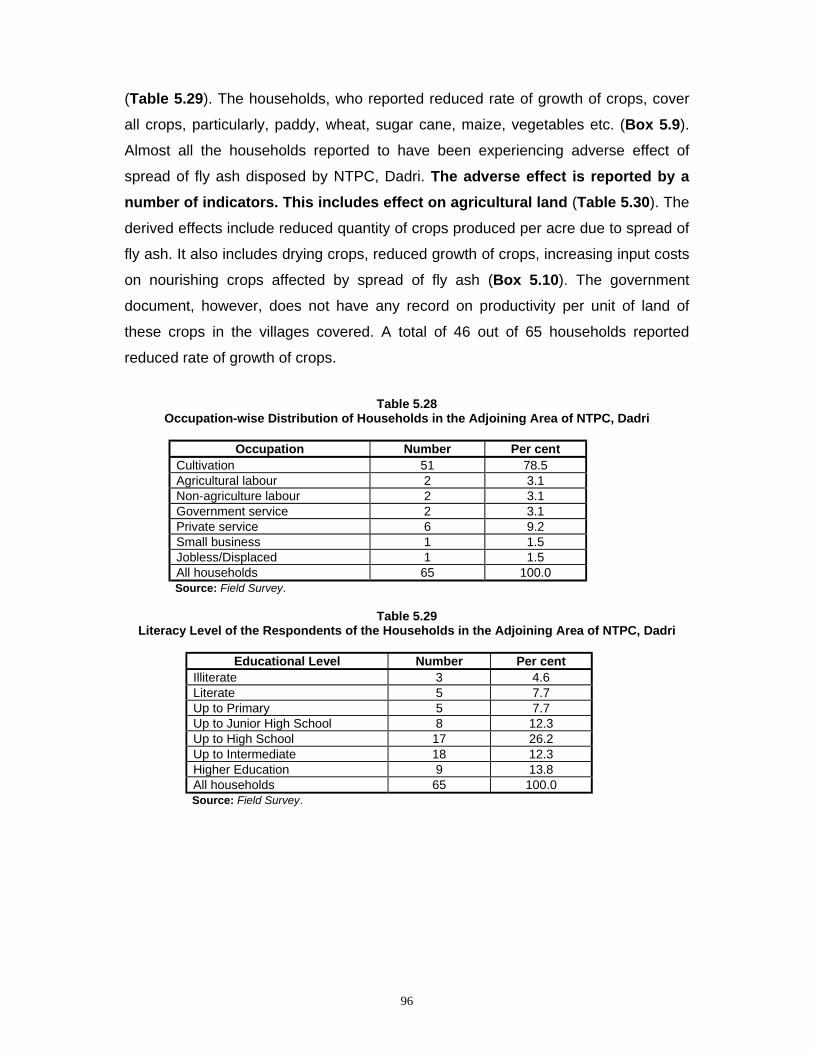
96
(Table 5.29). The households, who reported reduced rate of growth of crops, cover
all crops, particularly, paddy, wheat, sugar cane, maize, vegetables etc. (Box 5.9).
Almost all the households reported to have been experiencing adverse effect of
spread of fly ash disposed by NTPC, Dadri. The adverse effect is reported by a number of indicators. This includes effect on agricultural land (Table 5.30). The
derived effects include reduced quantity of crops produced per acre due to spread of
fly ash. It also includes drying crops, reduced growth of crops, increasing input costs
on nourishing crops affected by spread of fly ash (Box 5.10). The government
document, however, does not have any record on productivity per unit of land of
these crops in the villages covered. A total of 46 out of 65 households reported
reduced rate of growth of crops.
Table 5.28
Occupation-wise Distribution of Households in the Adjoining Area of NTPC, Dadri
Occupation Number Per cent Cultivation 51 78.5 Agricultural labour 2 3.1 Non-agriculture labour 2 3.1 Government service 2 3.1 Private service 6 9.2 Small business 1 1.5 Jobless/Displaced 1 1.5 All households 65 100.0 Source: Field Survey.
Table 5.29
Literacy Level of the Respondents of the Households in the Adjoining Area of NTPC, Dadri
Educational Level Number Per cent Illiterate 3 4.6 Literate 5 7.7 Up to Primary 5 7.7 Up to Junior High School 8 12.3 Up to High School 17 26.2 Up to Intermediate 18 12.3 Higher Education 9 13.8 All households 65 100.0 Source: Field Survey.

97
Box 5.9
Crops experiencing decelerating growth of Output
! Paddy
! Wheat
! Sugar cane
! Mustard
! Potato
! Maize
! Vegetables
Source: Field Survey.
Table 5.30 Direction-wise Effect of Fly Ash on Agricultural Land adjoining NTPC, Dadri
Effect on Agricultural Land Direction from the NPTC, Dadri
Name of Villages Adverse No Effect
All Households
Muthyani 11 2 13 Jarcha 8 - 8 Gulawathi 6 1 7
East Total 25 (46.3) 3 (27.3) 28 (43.0)
Khagaura 7 - 7 Uncha Amipur 2 8 10
North
Total 9 (16.7) 8 (72.7) 17 (26.2) Silarpur 15 - 15 Patardi 5 - 5
South
Total 20 (37.0) - 20 (30.8) All households 63 (100.0) 11 (100.0) 65 (100.0)
Source: Field Survey.
Box 5.10 Effect of Spread of Fly Ash on Crop Area and Plantations Adjoining NTPC, Dadri
(Perception of the Households)
! Declining crop production per acre
! Diseases found in crops
! Working problems in crop field
! Drying crops
! Reduced growth of crops
! Increased input costs on nourishing crops Source: Field Survey.
The major air-borne problems in the villages are reported to be too much ash dust in
the atmosphere, breathing problems due to absence of fresh air, too much heat due
to power plant operations, and accumulation of ash in the ash mound (Box 5.11).
Thus, the households complained about their health being adversely affected by air-borne spread of fly ash. The major water-borne problems in these villages
98
are foul smell in water in the wells and dust/ash mixed in water in wells, which are
generally consumed by people in these villages (Box 5.12). There are no resident registered medical practitioners to give report on medical check up of the households. There is also no record of any scientific measurement (laboratory) of air and water quality for the area.
Box 5.11 Households Affected by Spread of Fly Ash in the Adjoining Area of NTPC, Dadri
(Major Air-Borne Problems, as perceived by the households)
! Too much ash dust in the atmosphere,
! Breathing problems due to absence of fresh air,
! Too much heat due to power plant operations and ash mound,
! Health adversely affected by spread of fly ash.
Source: Field Survey.
Box 5.12 Households Affected by Spread of Fly Ash in the Adjoining Area of NTPC, Dadri
(Major Water–Borne Problems, as perceived by the households)
! Foul smell in well water, ! Too much dust/ash in well water.
Source: Field Survey.
The types of diseases that the households reported to have been suffering from
include eye-related problems, tuberculosis, asthma, cough and chest congestion,
cholera, malaria, breathing problems, stomach-aching etc. (Box 5.14). Suggestions
offered by the households, affected by the spread of fly ash, include provision for
regular medical check up of health and supply of necessary medicines and
arrangement for medical treatment for the people at the cost of NTPC, Dadri. The
suggestions also include measures, to be initiated by the Dadri Unit, to stop air-
borne pollution in the adjoining area, through plantations (Box 5.15). The
suggestions also include educating people about how to prevent diseases that
emerge from drinking of ash-mixed water, and inhaling ash-mixed dust (Box 5.13).
99
Box 5.13 Prevention of Diseases in the Adjoining Areas of NTPC, Dadri
(Required Health Facilities, as perceived by the people affected) ! There has to be provision for regular medical check up of health for the people in the
adjoining area, at the cost of NTPC,
! Necessary medicines and treatment should be shouldered by NTPC free of cost,
! The NTPC, Dadri, has to educate the people of adjoining area about prevention of
diseases,
! Measures should be taken by NTPC, Dadri, to stop air-borne pollution in adjoining areas,
! NTPC, Dadri, should develop proper plantations on all sides of ash mound.
Source: Field Survey. Box 5.14
Diseases found in the Adjoining Areas of NTPC, Dadri (As Reported by the Households)
! Eye problems
! Tuberculosis
! Asthma
! Cough/Chest congestion
! Cholera
! Malaria
! Problems in breathing
! Stomach aching/pain Source: Field Survey.
Box 5.15 Plantations on Adjoining Areas of Ash Mound: Possibilities
(Perception of the Households)
! Babool
! Useful trees
! All trees (with more care)
! No trees can be planted near ash mound
! Trees planted but are drying Source: Field Survey.
5.10 Effect of the Ash Mound on the Adjoining Area as Perceived by NTPC, Dadri
As planned by the Dadri Unit of NTPC, the ash mound will have a final height of 55.0
meter and a volume of 5,30,00,000 cubic meter, covering an area of 375 acres
(Table 5.31). The side slope of ash mound are 1 in 4.5 for the lowest slope and
subsequent slopes with a gradient of 1 in 4 with three beams 10.0 meter wide at a

100
height interval of 15.0 meter for access and to assist erosion control. The stability
analysis has determined that for designed permanent slopes, the factor of safety for
ash mound is greater than 2. This factor of safety is reduced to 1.35 when a
horizontal seismic component of acceleration of 0.05 is taken into account (Sikka
and Kundu, 1999, p. 147). Ash is planned to be dumped in the Ash Mound
depending upon the functioning of the system and weather conditions. During
monsoon or system non-availability (like during horizontal shifting of field conveyor),
ash is dumped in 'Temporary Ash Storage Area' from where ash is transferred to
permanent ash mound area through reclaimer machines. A drainage blanket under
the ash mound allows water to flow freely to the perimeter ditch and helps to
maintain the strength of the deposited ash. It also protects the ground water from the
toxic leachate contamination.
Table 5.31 Ash Mound, NTPC, Dadri (Basic Information)
Ash Dumping Area, in acre (Bottom Circumference of Ash Mound) 500 Height of Ash Mound, (in Meter)
(i) Upper Limit (ii) Present Height
55 30
Target Duration of Dumping in Ash Mound (forty years) 1993-2033 Accumulated Ash, up to March 2001 (in lakh MT) 84 Distance of Ash Mound from Ash Generation Plant (in km.) 04 Total Fixed Cost of Ash movement to Ash Mound from Boiler (Rs. crs.) 137 Ash Handling Cost per MT (in Rs.) 30 Average Dumping Quantity per day (in MT) 3556 Ash Handling/Dumping Cost per day (in Rs.) 10,6680 Source: NTPC, Dadri.
The determinants that show probable pollution from ash mound are either air-borne
or water-borne. These problems were kept in mind when the mound was constructed
at the Dadri Unit. Box 5.16 shows what were designed for pollution control when the
mound was constructed.

101
Box 5.16
Planning Pollution Control at the Time of Construction of Ash Mound, NTPC, Dadri ! FBA and PFA are never mixed; they are handled separately. Ashes are put in pre-
selected areas to give shape to the final mound form.
! Only conditioned PFA (15.0 to 20.0 per cent moisture by weight) is handled to control the
fugitive dust. The initial compaction is from dropping the ash from the spreader,
movement of bulldozers.
! After deposition of ash by Boom spreader, mobile equipment is required to spread and
roll the ashes in desired profiles.
! After a sufficient area is available for ash formation, a vibratory roller is employed to firm
up the surface and increase the resistance of the ash to dust blow.
! Mound construction will follow a construction sequence at multi-layers to ensure the
stability of the ash mound.
Source: Sikka and Kundu, 1999, p.148.
The method of handling ash is eco-friendly in the sense that it aims at eliminating
dust emissions. The methods by which the Plant minimizes dust emissions and
hence air pollution are shown in Box 5.17. Box 5.17
Existing Measures to Minimize Dust Emissions, NTPC, Dadri
Measures Purpose Belt Conveyors Before being discharged into conveyors from the silos, fly ash will
be conditioned with water with the help of hydro mix dust conditioner (HMDC). Each conveyor transfer point is fitted with water sprays, fixed sprinklers are also used at a number of points along the conveyors in order to dampen the ash. This is particularly needed if the ash shows signs of being dried during transportation.
Ash Moving Equipment Relative to dust nuisance created by transportation of ash to ash mound, the very construction of ash mound by ash moving equipment is dustier. The plant takes care of this problem by judicious use of mobile equipment.
Wind Erosion Stabilization of top and intermediate surface is done by application of water or spraying chemicals like polymer to control air-borne dust, particularly during summer. For short-term management of air-borne pollution, spreading of cut grass on the top surface helps, while for long-term control and surface stabilization, the mound needs adequate and appropriate vegetation.
Site Traffic Permanent roads inside the plant are planned to be surfaced and cleaned and sprayed with water (by Bowser) as and when necessary. Vehicle speed is restricted.
Source: Sikka and Kundu, 1999, p. 148.
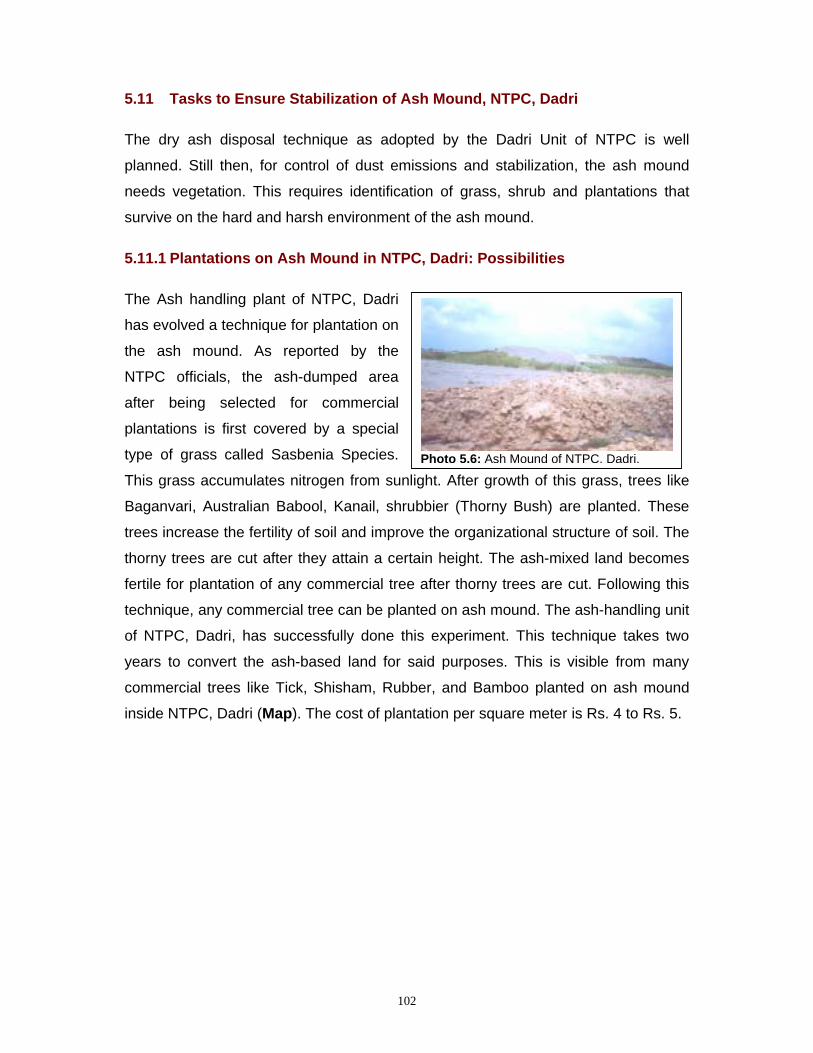
102
5.11 Tasks to Ensure Stabilization of Ash Mound, NTPC, Dadri
The dry ash disposal technique as adopted by the Dadri Unit of NTPC is well
planned. Still then, for control of dust emissions and stabilization, the ash mound
needs vegetation. This requires identification of grass, shrub and plantations that
survive on the hard and harsh environment of the ash mound.
5.11.1 Plantations on Ash Mound in NTPC, Dadri: Possibilities
The Ash handling plant of NTPC, Dadri
has evolved a technique for plantation on
the ash mound. As reported by the
NTPC officials, the ash-dumped area
after being selected for commercial
plantations is first covered by a special
type of grass called Sasbenia Species.
This grass accumulates nitrogen from sunlight. After growth of this grass, trees like
Baganvari, Australian Babool, Kanail, shrubbier (Thorny Bush) are planted. These
trees increase the fertility of soil and improve the organizational structure of soil. The
thorny trees are cut after they attain a certain height. The ash-mixed land becomes
fertile for plantation of any commercial tree after thorny trees are cut. Following this
technique, any commercial tree can be planted on ash mound. The ash-handling unit
of NTPC, Dadri, has successfully done this experiment. This technique takes two
years to convert the ash-based land for said purposes. This is visible from many
commercial trees like Tick, Shisham, Rubber, and Bamboo planted on ash mound
inside NTPC, Dadri (Map). The cost of plantation per square meter is Rs. 4 to Rs. 5.
Photo 5.6: Ash Mound of NTPC, Dadri.
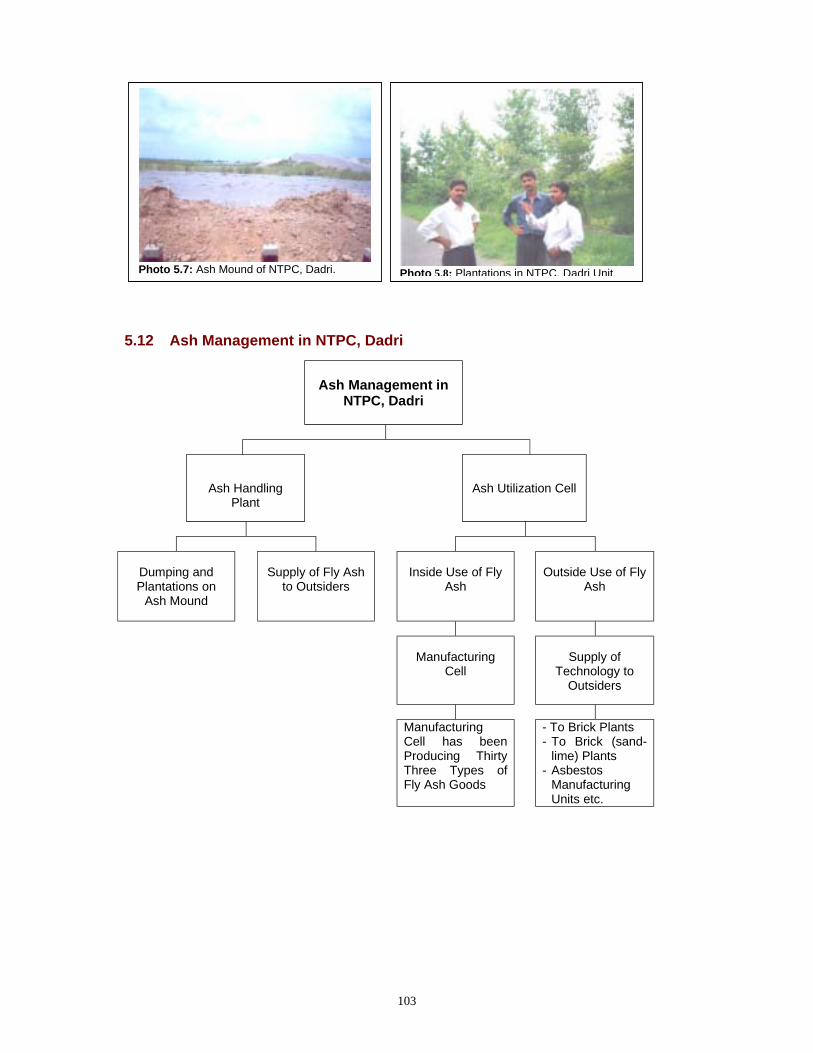
103
5.12 Ash Management in NTPC, Dadri
Ash Management in
NTPC, Dadri
Ash Handling Plant
Ash Utilization Cell
Dumping and Plantations on
Ash Mound
Supply of Fly Ash
to Outsiders
Inside Use of Fly
Ash
Outside Use of Fly
Ash
Manufacturing Cell
Supply of
Technology to Outsiders
Manufacturing
Cell has been Producing Thirty Three Types of Fly Ash Goods
- To Brick Plants - To Brick (sand-
lime) Plants - Asbestos
Manufacturing Units etc.
Photo 5.7: Ash Mound of NTPC, Dadri. Photo 5.8: Plantations in NTPC, Dadri Unit.
104
Chapter 6: Fly Ash: Generation, Management, Utilization, and Possibility of Reduction of Ash Content in Selected Plants
6.1 Major Observations: IFFCO, Phulpur, and NTPC, Dadri
IFFCO, Phulpur
IFFCO, Phulpur, has installed necessary equipments for controlling the quality of
liquid effluents and of gaseous emissions. Liquid effluents are treated before being
discharged into the main effluent nallah outside the plant premises. The quality of the
effluent lies within the standard laid down by the Pollution Control Board, U.P.
The dumping of fly ash by IFFCO, Phulpur, in the form of Ash Pond may not exhaust
the area required outside the plant as the ash is being supplied regularly to cement
manufacturers. The rate of utilization of fly ash exceeds the rate of generation so that
on a span of less than ten years from year 2000, the plant can plan to utilize all fly
ash generated. This utilization covers both internal and external uses.
The plant has shifted completely from wet ash disposal in the ash pond formed in the
adjoining area to supply dry ash through pneumatic conveyor system. This shift has
occurred in two phases, the first phase began in April 2000, and the second phase in
November 2000. Dry fly ash is collected in hopper and supplied directly to tankers.
Electro mechanical retractable chutes are supplied to load fly ash into the tanker
without any dust hazard in the locality.
NTPC, Dadri
Coal for NTPC, Dadri, comes from North Karanpura Coalfields in Bihar (now in
Jharkhand). Before 1998, the ash content in coal used by Dadri was 40.0 per cent
that came down to around 35.0 per cent after 1998. However, the source of coal has
remained unchanged. The NTPC, Dadri has formed an Ash Mound inside the plant
premises for storage of fly ash. In addition, it supplies fly ash that it generates to
cement and asbestos plants.
The NTPC, Dadri, supplies dry ash, and not wet ash. Since the beginning of
commercial production in August 1992 till the end of March 2001, around 22.0 per
cent of fly ash generated by the unit has been utilized. Almost 16.0 per cent of this
has gone for filling low-lying areas and embankments. The rest 6.0 per cent has
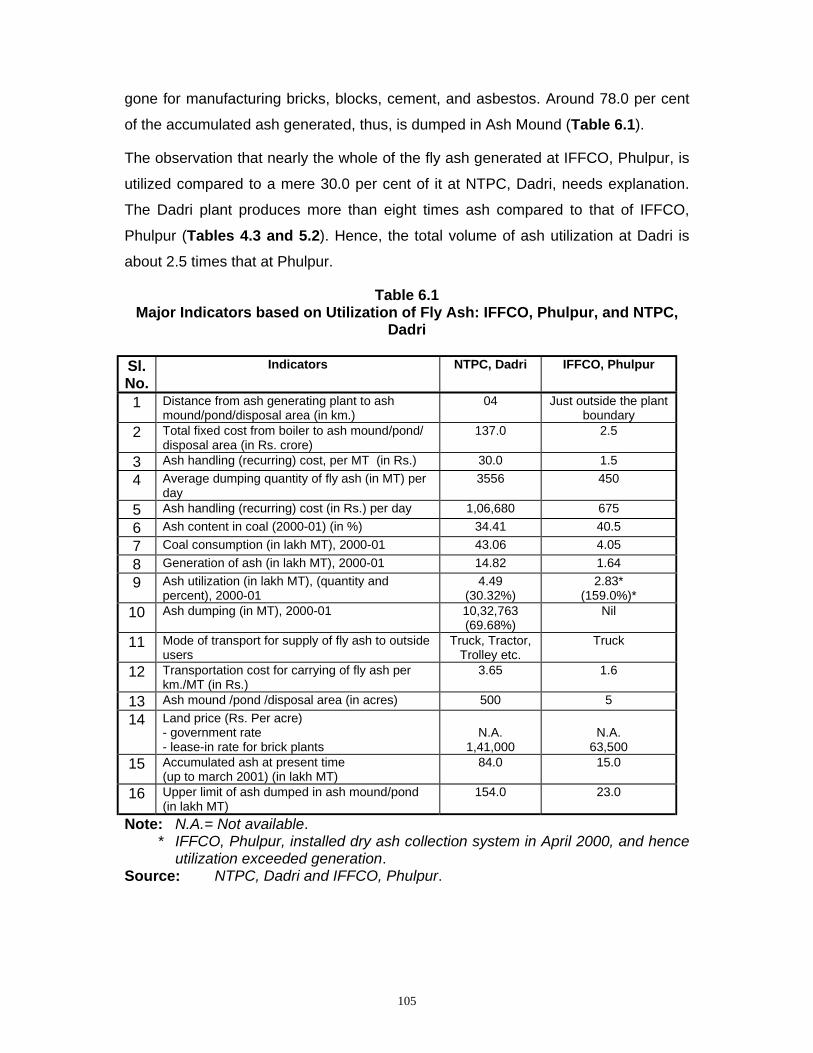
105
gone for manufacturing bricks, blocks, cement, and asbestos. Around 78.0 per cent
of the accumulated ash generated, thus, is dumped in Ash Mound (Table 6.1).
The observation that nearly the whole of the fly ash generated at IFFCO, Phulpur, is
utilized compared to a mere 30.0 per cent of it at NTPC, Dadri, needs explanation.
The Dadri plant produces more than eight times ash compared to that of IFFCO,
Phulpur (Tables 4.3 and 5.2). Hence, the total volume of ash utilization at Dadri is
about 2.5 times that at Phulpur.
Table 6.1 Major Indicators based on Utilization of Fly Ash: IFFCO, Phulpur, and NTPC,
Dadri Sl. No.
Indicators NTPC, Dadri IFFCO, Phulpur
1 Distance from ash generating plant to ash mound/pond/disposal area (in km.)
04 Just outside the plant boundary
2 Total fixed cost from boiler to ash mound/pond/ disposal area (in Rs. crore)
137.0 2.5
3 Ash handling (recurring) cost, per MT (in Rs.) 30.0 1.5 4 Average dumping quantity of fly ash (in MT) per
day 3556 450
5 Ash handling (recurring) cost (in Rs.) per day 1,06,680 675 6 Ash content in coal (2000-01) (in %) 34.41 40.5 7 Coal consumption (in lakh MT), 2000-01 43.06 4.05 8 Generation of ash (in lakh MT), 2000-01 14.82 1.64 9 Ash utilization (in lakh MT), (quantity and
percent), 2000-01 4.49
(30.32%) 2.83*
(159.0%)* 10 Ash dumping (in MT), 2000-01 10,32,763
(69.68%) Nil
11 Mode of transport for supply of fly ash to outside users
Truck, Tractor, Trolley etc.
Truck
12 Transportation cost for carrying of fly ash per km./MT (in Rs.)
3.65 1.6
13 Ash mound /pond /disposal area (in acres) 500 5 14 Land price (Rs. Per acre)
- government rate - lease-in rate for brick plants
N.A.
1,41,000
N.A.
63,500 15 Accumulated ash at present time
(up to march 2001) (in lakh MT) 84.0 15.0
16 Upper limit of ash dumped in ash mound/pond (in lakh MT)
154.0 23.0
Note: N.A.= Not available. * IFFCO, Phulpur, installed dry ash collection system in April 2000, and hence
utilization exceeded generation. Source: NTPC, Dadri and IFFCO, Phulpur.

106
6.2 Conventional Clay Brick Plants (located within 50-km. radius from IFFCO, Phulpur, and NTPC, Dadri): Reasons for Non-Utilization of Fly Ash
! The Notification of the MOE&F, GOI, Sept., 1999, says that it will be
mandatory for clay users in conventional brick plants located within a
radius of 50-km. of any ash generating plant to mix fly ash with clay in a
pre-specified proportion.
! The R&D laboratory of IFFCO, Phulpur, has developed a project for
utilization of fly ash in brick manufacturing. These bricks are used both
internally and externally.
! We did not find any record of the number of conventional clay brick plants
within a radius of 50 km. from IFFCO, Phulpur, and NTPC, Dadri.
We selected a total of ten clay brick plants within the radius, as per GOI Notification,
1999, to capture the major problems and possibilities of utilization of fly ash.

107
6.2.1 Non-Utilization of Fly Ash in Conventional Clay Bricks: General Reasons (Brick Plants located within 50-km. radius of IFFCO, Phulpur, and NTPC, Dadri)
Positive Reasons Negative Reasons
Land for conventional clay brick plant is easily available (purchase or lease-in) in the districts, Allahabad and Ghaziabad.
- The price of land is within reach (purchase or lease-in) of the brick plant owners in both the districts.
- The brick plant owners lease-in land on easy terms and conditions (like extendable tenure of contract, no upper limit on digging of top soil fixed by Government etc.).
- Landowners with large agricultural land like to lease-out land at low rent.
- The technique of production of conventional clay bricks is known.
- Skilled labour is easily available for conventional clay brick plants at a low wage.
- It is difficult to assess the actual level of output in conventional clay brick plants. Thus, the plant owners can conceal the benefits that they derive via avoidance in terms of taxes etc.
- There are no problems of marketing of conventional clay bricks.
- The organizational and administrative formalities (registration etc.) to set up a conventional clay brick plant are easy.
- Reliability of conventional clay bricks in the market is high.
- The clay bricks ensure stable benefits for conventional brick plant owners
- Conventional clay brick plant owners do not know the technology of mixing fly ash in clay bricks. There is no compulsion imposed by the government on use of fly ash in clay bricks.
- The transportation cost of fly ash from ash generating plant is high relative to cost for land leased-in.
- The private consumers believe that the strength of fly ash mixed clay bricks is less relative to clay bricks.
- The labourers already employed in conventional clay brick plants are not trained for manufacturing fly ash mixed clay bricks.
- The conventional clay brick plant owners do not know the raw materials and infrastructure requirements for manufacturing fly ash-mixed clay bricks.
- The conventional clay brick plant owners do not know the ‘technology supplying agency’ for manufacturing fly ash mixed bricks.
- The conventional clay brick plant owners do not know the market demand for fly ash mixed clay bricks.
- The consumers are not aware about fly ash mixed clay bricks.
- The conventional clay brick plant owners do not know the method of receiving fly ash from the ash generating plants.
- Subsidy is yet to be provided to those plants which want to mix fly ash in clay to produce bricks.
- The government is not using fly ash-mixed bricks in public sector. Thus, reliability of fly ash bricks remains questionable to private final consumers.

108
6.3 Fly Ash-Sand-Lime-Gypsum Brick Plants Located within 50-km. Radius from IFFCO, Phulpur, and NTPC, Dadri: Observations Regarding Actual and Possible Use of Fly Ash
We did not find any fly ash-sand-lime-gypsum brick plants within the radius of 50-km. from IFFCO, Phulpur. In addition, we did not find any record of number of fly ash-sand-lime-gypsum brick plants within a radius of 50 km. from NTPC, Dadri. We could locate as high as seven functioning fly ash-sand-lime-gypsum brick plants located within 50-km. radius from NTPC, Dadri, that use fly ash generated by the latter. There is no supply constraint so far as availability of raw
materials for manufacturing fly ash bricks in these plants are concerned. All the
seven fly ash brick plants reported that they got technology for manufacturing fly
ash-sand-lime-gypsum bricks from NTPC, Dadri. NTPC, Dadri is ready to provide
total technological support to any potential entrepreneur willing to set up a fly ash
brick plant. This technological support includes information on technique of
production, input ratio (fly ash, sand, lime, and gypsum) and dissemination of
information in this regard. However, no formal training has so far been organized by
NTPC, Dadri, in this regard.
Since market price per unit of fly ash-sand-lime-gypsum brick is Rs. 1.29, as
reported by the brick plant owners, hence the market feasibility is ensured for such
bricks plants, even with positive transportation cost of fly ash (Table 5.22, p. 67). Though there is surplus in manufacturing and marketing fly ash-sand-lime-gypsum
bricks, there is at the same time positive price-differential between fly ash bricks and
clay bricks. Manufacturing and marketing fly ash bricks, thus, require steps for
relative cost reductions.
6.4 Cement Plants, which receive Fly Ash from IFFCO, Phulpur, and NTPC, Dadri: Utilization of Fly Ash
Cement Plants as Users of Fly Ash from IFFCO, Phulpur
The permissible percentage of fly ash that can be used in Portland Pozzolana
Cement (PPC), as reported by the users of fly ash varies from a minimum at 25.0 to
a maximum at 35.0. Based on the survey of a number of cement plants like J.P.
Cement, Rewa, and Satna Cement, Satna, we observed that there is no dearth of
109
demand for fly ash from the cement manufacturers. J.P. Cement is taking only 10.0
per cent of its total requirements of fly ash from IFFCO, Phulpur.
It is difficult to locate all the cement plants as buyers of fly ash generated in IFFCO,
Phulpur, because of operation of intermediaries (truck operators). IFFCO, Phulpur,
could not provide addresses of cement plants, which are users of fly ash that it
generates and supplies.
Neither the IFFCO, Phulpur, nor the cement manufacturers incur any transportation cost for carrying fly ash from IFFCO to cement plants.
Cement Plants as Users of Fly Ash from NTPC, Dadri
The cement manufacturers are the main external users of fly ash supplied by NTPC,
Dadri. We could locate the Diamond cement, Jhansi, UP, that takes 11.4 MT of fly
ash per day from NTPC, Dadri. The distance between NTPC, Dadri, and Diamond
Cement, Jhansi, is around 350 km. This is the reason why the Diamond Cement,
Jhansi, takes most of its required fly ash from UP Electricity Board, Parichha, around
64.6 MT per day, which is located at a distance of 5 km. from the cement plant. The
cement plant began using fly ash in cement production in 1986. The technical ratio in
which fly ash is mixed is given as Fly Ash: Clinker: Gypsum as 38:55:07 for
producing Portland Pozzolana Cement. During 1998-2001, the percentage use of fly
ash increased steadily from 36.0 per cent to 38.0 per cent. Of the total fly ash
required by Diamond Cement, 15.0 per cent comes from NTPC, Dadri, and
remaining 85.0 per cent from UP Electricity Board, Parichha. The annual production
of cement, however, has remained fixed, targeted and actual.
The transportation cost of fly ash, that is total fly ash cost, stands at Rs. 25 per MT
for NTPC, Dadri while only Rs. five for UP Electricity Board (Table 5.25, p. 71-72). NTPC, Dadri, thus, has lower chance of increasing supply of fly ash to Diamond
Cement, unless the transport cost is borne by NTPC, Dadri.
6.5 Effect of Spread of Fly Ash in the Areas Adjoining IFFCO, Phulpur, and NTPC, Dadri
In the Areas Adjoining IFFCO, Phulpur
IFFCO, Phulpur, is reported to take care of areas within a radius of 3 km. from its
own location (plant boundary). We surveyed seven villages and 65 households
110
settled within 2000 meter from the Plant, following pilot survey. The exact number of
the households settled within the radius of three km. from IFFCO, Phulpur is not
known. We selected the households in the villages in a manner such that the
categories of households by occupation and literacy are taken care of. We selected
these households in a dispersed manner within each village. Half of the households
surveyed are settled within a radius of 200 meter (from the dumping area, it being
just outside the boundary of the plant). Almost all the households from all the villages
reported to have been experiencing adverse effect of spread of fly ash disposed by
IFFCO on agricultural land through leachate. The human health problems are
reported to be related with quality of air and water.
The Directorate of Environment, UP, and the Pollution Control Board, Government of
UP, could not provide any record of the quality of air and water in the areas inhabited
by people adjoining IFFCO, Phulpur. We did not find any registered medical
practitioner who could confirm the health-related problems conveyed by the people
in the adjoining area.
In the Areas Adjoining NTPC, Dadri
We selected seven villages following pilot survey and sixty-five households in the
areas adjoining NTPC, Dadri. The selection of households followed what we did in
case of surveying areas adjoining IFFCO, Phulpur, in the district of Allahabad. The
households reported adverse effect in terms of a number of indicators. This includes
adverse effect on agricultural land. The households also complained about their
health being adversely affected by air-borne spread of fly ash. We did not find any
resident registered medical practitioners to give medical reports of the households
affected by spread of fly ash. The Directorate of Environment, UP, and the Pollution
Control Board, Government of UP, could not provide any record of the quality of air
and water in the areas inhabited by people adjoining NTPC, Dadri.
6.6 Reduction of Ash Content in Coal Combustion: Possibilities in IFFCO, Phulpur, and NTPC, Dadri
In 1991-92, coal and lignite accounted for around 55.0 per cent of the total primary
energy consumption in India. Of the total coal consumed in India, the electricity-
generating sector consumes around 67.0 per cent. Coal reserves in India is around
1.0 per cent of global proven coal reserves (GOI, DST, TIFAC, 1995, Oct., p. 4-5, 7).
111
In India, 70.0 per cent of extraction of coal comes from open cast mines at present
and the underground mines contribute the balance (GOI, DST, TIFAC, 1995, Oct., p.
9). Both the quality of coal and the method of combustion determine the effluents
produced during combustion of coal. The heat value of the fuel is determined by
UHV = 8900 -- 138(A+M),
where,
UHV = Useful Heat Value,
A = Ash Content in percentage
M = Moisture Content in percentage.
Coal available from different sources is graded in terms of the UHV. Using this
technique, available coal in India has been classified into seven grades, A to G. For
superior grades (A, B, C), the (A+M) percentage is less than 30.0 while for inferior
grades (E, F, G), the (A+M) percentage is more than 30.0. In between lies the
intermediate grade, D. The inferior grade coal constitutes around 70.0 per cent of
total usable coal available in India (GOI, DST, TIFAC, 1995, Oct., p. 59-60).
The elements that make up coal as a fuel, and the oxidant including other gases
present with the oxidant, in which it is burnt, will ultimately be discharged into the
environment. The nature of the effluents will be influenced by the combustion
conditions. While emissions of carbon dioxide will be largely determined by the
characteristics of the fuel, SO2 emissions will depend on both the sulphur content of
coal and on the combustion system employed (GOI, DST, TIFAC, 1995, Oct., p.11).
The need for supplying cleaner coal to the coal using plants, particularly thermal
power stations, assumes critical importance in terms of better utilization of power
systems and significant reduction in environmental degradation. Use of clean coal
also leads to higher useful heat value (UHV) because it generates lower ash content
by percentage and total quantity per unit of generation of electricity.
NTPC, Dadri, reported using clean (washed) coal since 1998 for reduction in ash content. The source of coal has remained unchanged (As reported by Atrea, A.K., Sr. Manager, Ash Utilization Cell, NTPC, Dadri). The coal used by IFFCO, Phulpur, has an ash content of 40.0 per cent at the minimum and 48.0 per cent at the maximum. IFFCO, Phulpur, has no plan to change the source of

112
coal that it receives nor its R&D (laboratory) has any plan to go for clean (washed) coal to reduce ash content (As reported by Misra, D., Dy. Manager, IFFCO, Phulpur).
6.6.1 Clean Coal Technology: Meaning
Following the definition of United Nations, clean coal technology comprises all
technological innovations, which reduce environmental impacts throughout the coal-
fuel cycle. In general, clean coal technology include
i) technologies to control air pollution, like SOx and NOx, particulate matter, and
toxic elements;
ii) systems for producing power and other coal based industries much more
efficiently, cleanly and economically than conventional technologies;
iii) technologies that open up new markets in the transportation, industrial and
domestic sectors (GOI, DST, TIFAC, 1995, Oct., p. 73).
Availability of clean coal at the consumer end would depend upon a number of
factors in the chain of activities from coal mine planning, mining, stacking/reclaiming
handling, preparation/beneficiation, transport, blending etc.. The physical and
chemical characteristics of coal constitute the basic determinants of availability of
clean coal (GOI, DST, TIFAC, 1995, Oct. p. 32).
In India, while there was no report of production of inferior grade coal in 1947, the
production of inferior grade coal as percentage of total coal production was 9.0 per
cent in 1972-73, 18.0 per cent in 1980-81, 29.0 per cent in 1984-85, 56.7 per cent in
1989-90. The problem is projected to increase to 79.0 per cent in 2004-2005 (GOI,
DST, TIFAC, 1995, Oct. p. 33).
6.6.2 Coal Cleaning: Method
'Coal cleaning aims at reducing both the sulphur content and the mineral trace
elements in the organic coal material and hence their emission to the atmosphere. At
the same time the resulting coal has a higher heating value and there is a lower ash
load on the boiler. The emissions of sulphur and trace elements, as well as the
amount of ash and particulates, are linked to the composition of coal (Chadwick,
Highton, and Lindman, 1987, p. 98). Sulphur may be removed during coal cleaning
by physical and chemical means, or a combination of both. If coal has substantial
113
organic sulphur content or if ash levels of less than 10 per cent are required, then
physical methods must be replaced or supplemented by chemical ones. Coal may be
treated with aqueous solvents (alkaline or acid solutions) or by encouraging limited
hydrogenation. Both treatments aim at breaking the chemical bonds between the
sulphur and the rest of the coal molecule. A chemical method (the Mayer Method) of
removing iron pyrites utilizes a solution of iron sulphate to finally precipitate
elemental sulphur. Iron pyrites, as one of the main forms of sulphur, is not a part of
the coal molecule, it forms in cleats and remains relatively stable. The other forms of
sulphur in coal are organic sulphur, sulphates and sulphides. Since physical
methods of coal cleaning are not efficient in reducing the sulphur content, hence
plants frequently adopt chemical methods to limit hazardous environmental effluents
(Chadwick, Highton, and Lindman, 1987, p. 99).
6.6.3 Clean Coal for Power Sector: Problems
In India, of the total coal resource of around 196.8 BT, the Coking Coal constitute
29.3 BT, the balance 157.5 BT being Non-Coking Coal. In Non-Coking Coals, the
inferior coal constitutes 70.0 per cent of the total. Regarding depth wise (by digging)
occurrence of the coals, the coals broadly amenable to open cast mining 0-300
metre depth range constitute 69.0 per cent of the total Non-Coking coals (GOI, DST,
TIFAC, 1995, Oct., p. 75-76). In Non-Coking coal, there are opportunities of washing
coal to various ash levels, for example, for power sector the ash content could come
down to 34.0 --35.0 per cent. Washed coal is required for the power sector (long
distance units), in addition to some other sectors.
In India, the principal non-coking coal users in 1993-94 were, power (60.0 per cent),
cement (4.0 per cent), and railways (0.7 per cent). In the 'others' category (that
includes more than 20,000 users), it is 23.0 per cent (GOI, DST, TIFAC, 1995, Oct.,
p. 81). In the power sector, the old and the small units are designed to use superior
grades of coal, while the large capacity units (210 MW, 500 MW) in operation and
planning in future are designed to operate with high ash coal (for example, in NTPC,
Dadri, the ash content is now 35.0 per cent). The constraint is meagre resources of
coking coal and the need to restrict imports of coking coal to the extent possible.
Pulverized fuel combustion is a preferred technique because of its relative
insensitivity to quality of coal, the short residence time of the fuel in the furnace, so
114
the furnace regulation becomes relatively easy. It also becomes possible to perform
high degree of uniform fuel combustion at a high temperature. The requirement for
reducing the ash content in coal, thus, lies in grinding of coal to reasonable tolerance
limits. The disadvantage of this technique lies in sulphur emissions. Sulphur
emissions depend upon the sulphur content of the coal.
6.6.4 Super Clean Coal – Organo Refining: Possibilities
Coal can be beneficiated by such techniques as physical beneficiation, chemical
leaching, solvent refining (SRC), organosolvo-refining and chemical and thermo-
mechanical conversions. The physical techniques have limitations in ash. The
chemical leaching techniques involve the use of corrosive and costly acids and
alkalis, the recovery of which is difficult so that they may act as pollutants. The SRC
process involves cost of hydrogen and the requirement of high-pressure reactors
and equipments, erosion and corrosion of walls, valves and pipes. The chemical and
thermo-mechanical coversion techniques such as carbonisation, hydro-
carbonisation, gastification, hydro-gastification, hydrogenation and liquifaction etc.
require high temperatures and pressures making the operations cost-intensive. It is
in this context that organosolvo-refining for production of super clean coal at milder
conditions of temperature (below 365ºC) and ambient pressure was conceived by
IIT, Delhi. The super clean coal obtained through experiments has higher calorific
value (8,000 Kcal/kg approx) and has higher volatile matter contents (40-45 per cent
approximately). This is an almost zero ash coal (GOI, DST, TIFAC, 1995, Oct., p.
151-152).
6.6.5 Plant Expansion and Reduction of Relative Ash Content
As we observed, generation of fly ash increased at a rate higher than the rate of coal
consumption at the national level. This is because of exhaustion of superior grade
coal or gradual increase in use of inferior grade coal. Even if, thus, at the level of a
particular plant the ash content is reduced by using clean coal, the possibility of
reducing ash content will be limited at the national level for all the coal using plants.
The assumption is that the economy is not going to import coal with lesser ash
content.

115
Chapter 7 : Cost-Benefit Analysis on Retaining Fly Ash vis-a-vis its Alternative Uses
Based on the study of two selected plants, IFFCO, Phulpur, and NTPC, Dadri,
respectively located in the districts, Allahabad and Ghaziabad, Uttar Pradesh,
we calculate the costs and the benefits on retaining fly ash vis-a-vis its
alternative uses.
7.1 Cost (Fixed and Recurring) for Disposal of Fly Ash by IFFCO, Phulpur, and NTPC, Dadri
The fixed cost for dry ash disposal (on setting pipelines etc.) for IFFCO, Phulpur, was around Rs. 2.5 crores. The recurring cost of dry ash disposal is virtually nil except that certain utilities like Instrument Air and
Electric Power is provided to dry ash system. If accounted, the recurring cost
will not exceed Rs. 0.15 per tonne of ash. The land area that still remains
covered at present with ash collected and filled during the earlier period, when
there was no ash disposal, is more than 5 acres outside the plant area
(Technical Division, IFFCO, Phulpur).
The distance of the ash mound from the ash generating point at NTPC, Dadri,
is four-km. For carrying ash from the boiler to the ash mound, fixed cost incurred was Rs. 137 crore. The recurring cost (ash handling cost per MT) is Rs. 30. Quantity of dumping of ash per day is 3556 MT for the Dadri
Unit for which average handling/dumping cost per day comes to be a little
more than Rs. one lakh (Table 5.4, p. 50).
7.2 Land Cost for Land Leased-in: The Case of Brick Plants Adjoining IFFCO, Phulpur, and NTPC, Dadri
Most of the brick plant owners within 50-km radius of IFFCO, Phulpur, and
NTPC, Dadri, use lease-in land for digging purposes. Of the total land being
used by the brick plants adjoining IFFCO, Phulpur, around 80.0 per cent are
on lease. Of the total land being used by the brick plants adjoining NTPC,
Dadri, around 60.0 per cent are on lease.
116
Average land price per acre at the market for brick plant owners who leased-
in land within 50-km radius of IFFCO, Phulpur, is Rs. 89,000. There are inter-
plant variations in cost borne on lease-in account for production of bricks. The
land price per acre varies between Rs. 80,000 at the minimum and Rs.
2,50,000 at the maximum for the brick plants located within 50-km radius of
NTPC, Dadri. The average land price, thus, comes to be Rs. 1,41,000.
The availability of abundant and low cost topsoil helps in using clay as and when required. Absence of initiatives and incentives from the Government helps in continuing production of clay bricks without mixing fly ash by any percentage. It seems, the conventional brick plant
owners will be willing to use fly ash in manufacturing clay bricks if they get
fiscal benefits from the government, know the technology, get fly ash free of
cost at the gate of the brick plant. The government support also includes
purchase of fly ash mixed clay bricks by the Government at a specified price.
7.3 Land Saving (Area, Volume, and Value) by Replacing Clay by Fly Ash
Soil cutting area (sq. metre) in any year for all the brick plants within 50-km.
radius of IFFCO, Phulpur is 316.84 acres of which agricultural land constitutes
73.48 per cent. Assuming soil cutting destroys topsoil, the total value of land
that is destroyed comes to be around Rs. three crore for the whole district
covering all clay brick plants (on the basis of average land price existing at
present). Given the quantum of soil cutting per year, we calculate the quantity
of fly ash that can replace 30.0 per cent (maximum) clay. Thus, we calculate
maximum agricultural land that can be saved by using fly ash (maximum 30.0
per cent) as replacement of clay (weight-to-weight basis). As we see, out of a
total of 232 acre of agricultural land, as high as 25.0 per cent can be saved
(Table 4.12, p. 32).
Soil cutting area (sq. metre) in any year for all the brick plants within 50-km.
radius of NTPC, Dadri, is 1155.6 acres, of which agricultural land constitutes
100.0 per cent. If soil cutting implies destruction of top soil, then the total
value of land that is destroyed comes to be more than Rs. sixteen crore for
the whole district covering all clay brick plants (on the basis of average land
117
price existing in 2001). Given the quantum of soil cutting per year, we
calculate the quantity of fly ash that can replace 30.0 per cent (maximum)
clay. Thus, we calculate maximum agricultural land that can be saved by
using fly ash (maximum 30.0 per cent) as replacement of clay (weight-to-
weight basis). As we see, out of a total of 1155.6 acre of agricultural land, as
high as 25.0 per cent can be saved (Table 5.15, p. 60).
7.4 Cost-Benefit Analysis on Retaining Fly Ash vis-a-vis its Alternative Uses
The purpose is to estimate costs of retaining fly ash and alternative ways
(uses) of disposing it in terms of opportunity costs. The opportunity cost of the
current use of fly ash is its worth in some alternative use. We think of
opportunity cost in terms of particular alternatives. In the context of alternative
use, the question is whether the alternative use will affect a potential Pareto
improvement as compared with the existing situation. It is the uses to which
fly ash would be put in the absence of ash pond/ash mountain that become
the relevant alternatives for the measurement of opportunity costs (Mishan,
1981, p. 65).
• Cost for Disposal of fly ash in Ash Pond/Ash Mountain = Private Cost +
Social Cost.
• Private Cost = Fixed Cost + Recurring Cost of the Plant, for disposal of
fly ash.
• Recurring cost has to cover transport cost for carrying fly ash to the
users.
• Social Cost = Damage of adjoining crop area + Non-Use of topsoil
covered by fly ash + Health Effect on man and animals.
• Benefits in use of Fly ash in bricks/cement = Private Benefits + Social
Benefits.
• Private Benefits = Value Addition in fly ash bricks.
• Social Benefits = Saving topsoil (by the proportion of fly ash mixed with
clay in bricks/cement) + Saving fertility of crop area.
118
• Cost in use of fly ash in bricks/cement = Transportation cost* + cost on
bringing technology/training of manpower + other infrastructure cost
like installing machines/chimney etc.
* If the brick/cement plant owner is to bear transportation cost of fly ash.
Cost-Benefit Information on Dumping and Possible Management of Fly Ash
Plant: NTPC, Dadri
Fixed Cost = Rs. 137. Crs.
Recurring Cost = Rs. 30 per MT
Ash Generation = 11.78 Lakh MT per year
Total Recurring Cost (for disposal of fly ash generated per year) =
(Recurring Cost x Ash Generation) = Rs. (30 x 11.78 lakh MT) = Rs.
353.4 Lakh
Total Dumping Area (Ash Mound) = 500 Acres = 202.43 Hectare
Average Annual Production of Wheat in Ghaziabad District = 29.99
Quintal per Hectare
Production Loss per year due to Ash Mound Area = 202.43x29.99 =
6070.87 Quintal
Price of Wheat per Quintal* = Rs. 620.00
Production Loss = Rs. 620x6070.87 = Rs. 37,63,943.00
Average Annual Production of Rice per Hectare in Ghaziabad District =
20.72 Quintal
Production Loss due to Ash Mound = 20.72x202.43 = 4194.35 Quintal
* Rate Fixed by Government of India.
Plant: IFFCO, Phulpur
Fixed Cost = Rs. 2.2 Crs.
Recurring Cost = Rs. 1.5 per MT
Ash Generation = 1.79 Lakh MT per year

119
Total Recurring Cost (for disposal of fly ash generated per year) =
(Recurring Cost x Ash Generation = Rs. (1.5 x 1.79 lakh MT) = Rs.
2.86 Lakh
Total Dumping Area (Ash Pond) = 5 Acres = 2.02 Hectare
Average Annual Production of Wheat in Allahabad District = 17.78
Quintal per Hectare
Production Loss per year due to Ash Pond Area = 17.78x2.02 = 35.91
Quintal
Price of Wheat per Quintal* = Rs. 620.00
Production Loss = Rs. 620x35.91 = Rs. 22,264.20
Average Annual Production of Rice per Hectare in Allahabad District =
17.23 Quintal
Production Loss due to Ash Pond = 17.23x2.02 = 34.80 Quintal
* Rate Fixed by Government of India.
Based on above information, we calculate the costs and benefits on account
of dumping and possible reuse of fly ash generated by the selected ash
generating plants. We offer this information in Tables 7.1, 7.2, 7.3 and 7.4.
Table 7.1 and Table 7.2 show that the land value (at current market price of
land) covered by NTPC, Dadri, for ash mound for dumping of fly ash comes to
be Rs. 7.05 crores. This would have been zero had the plant took the
measures to supply (dry) fly ash at the point of generation. The land area
covered also stops its alternative use in cultivation, the value of which, if
accounted, comes to be more than Rs. 67.0 Lakhs per year.
NTPC, Dadri, thus, can not only get rid of recurring cost of Rs. 353.4 lakhs per
year for dumping of ash on ash mound, but also can add to its benefits, by
sale or lease-out land covered for alternative uses.
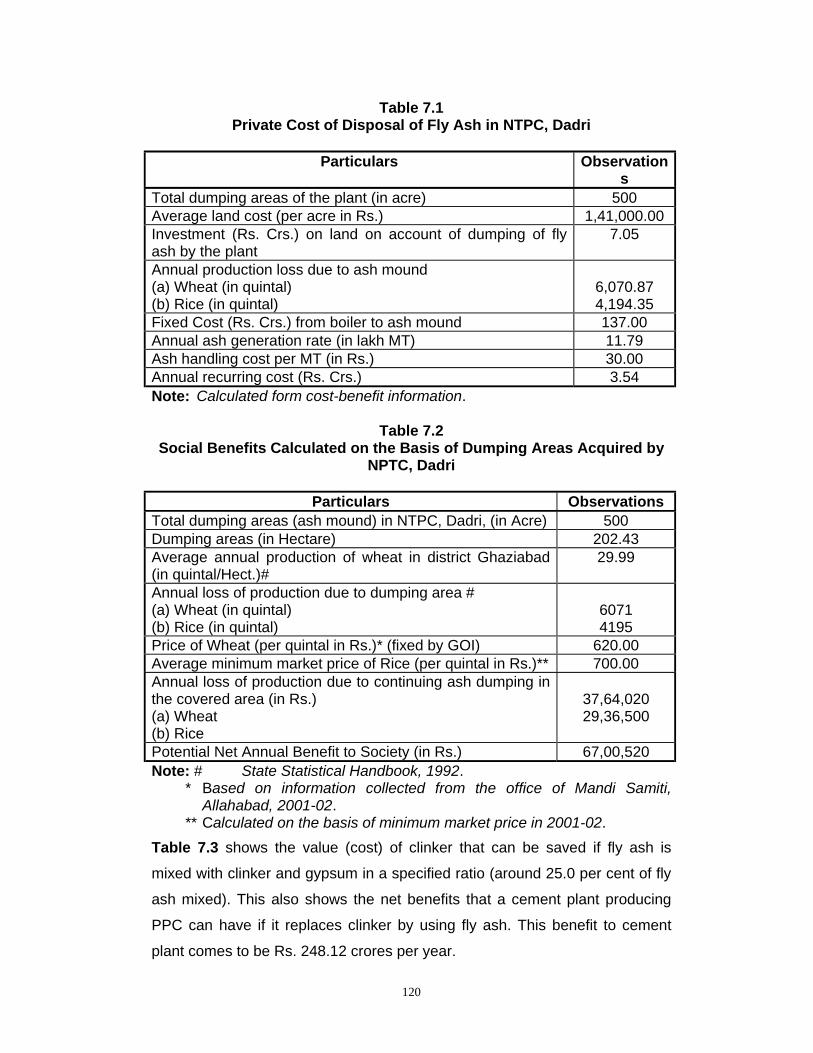
120
Table 7.1 Private Cost of Disposal of Fly Ash in NTPC, Dadri
Particulars Observation
s Total dumping areas of the plant (in acre) 500 Average land cost (per acre in Rs.) 1,41,000.00 Investment (Rs. Crs.) on land on account of dumping of fly ash by the plant
7.05
Annual production loss due to ash mound (a) Wheat (in quintal) (b) Rice (in quintal)
6,070.87 4,194.35
Fixed Cost (Rs. Crs.) from boiler to ash mound 137.00 Annual ash generation rate (in lakh MT) 11.79 Ash handling cost per MT (in Rs.) 30.00 Annual recurring cost (Rs. Crs.) 3.54 Note: Calculated form cost-benefit information.
Table 7.2 Social Benefits Calculated on the Basis of Dumping Areas Acquired by
NPTC, Dadri
Particulars Observations Total dumping areas (ash mound) in NTPC, Dadri, (in Acre) 500 Dumping areas (in Hectare) 202.43 Average annual production of wheat in district Ghaziabad (in quintal/Hect.)#
29.99
Annual loss of production due to dumping area # (a) Wheat (in quintal) (b) Rice (in quintal)
6071 4195
Price of Wheat (per quintal in Rs.)* (fixed by GOI) 620.00 Average minimum market price of Rice (per quintal in Rs.)** 700.00 Annual loss of production due to continuing ash dumping in the covered area (in Rs.) (a) Wheat (b) Rice
37,64,020 29,36,500
Potential Net Annual Benefit to Society (in Rs.) 67,00,520 Note: # State Statistical Handbook, 1992. * Based on information collected from the office of Mandi Samiti,
Allahabad, 2001-02. ** Calculated on the basis of minimum market price in 2001-02. Table 7.3 shows the value (cost) of clinker that can be saved if fly ash is
mixed with clinker and gypsum in a specified ratio (around 25.0 per cent of fly
ash mixed). This also shows the net benefits that a cement plant producing
PPC can have if it replaces clinker by using fly ash. This benefit to cement
plant comes to be Rs. 248.12 crores per year.
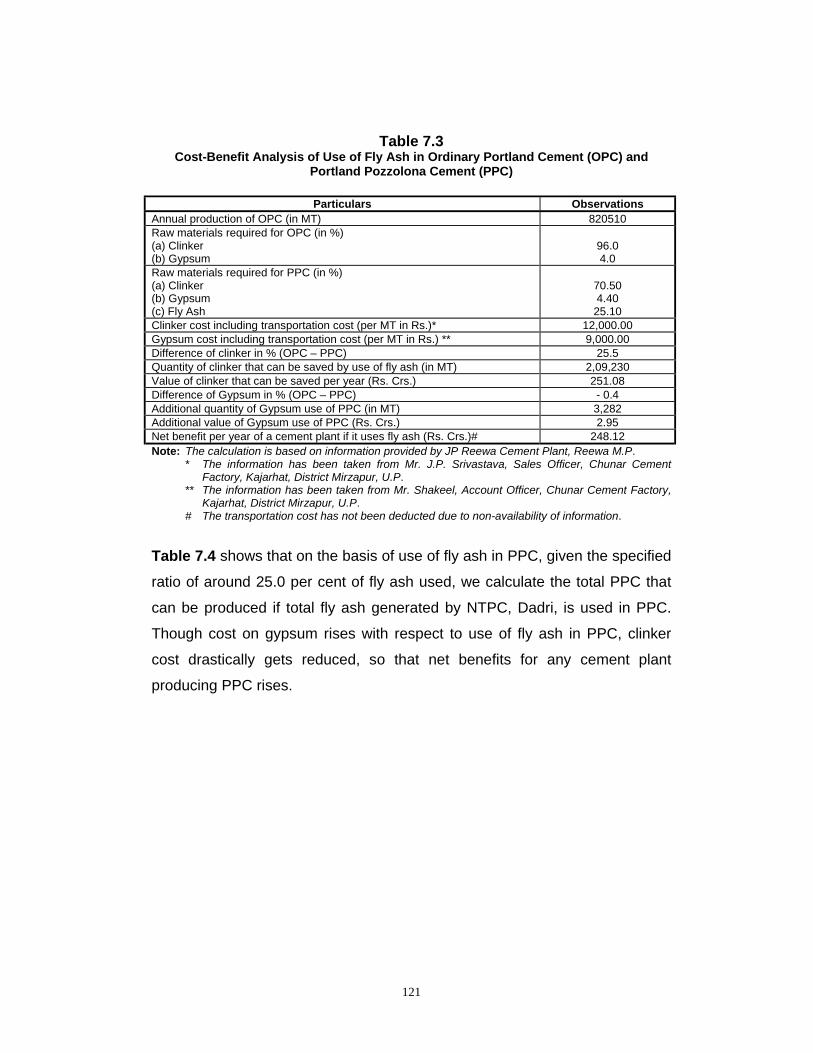
121
Table 7.3 Cost-Benefit Analysis of Use of Fly Ash in Ordinary Portland Cement (OPC) and
Portland Pozzolona Cement (PPC)
Particulars Observations Annual production of OPC (in MT) 820510 Raw materials required for OPC (in %) (a) Clinker (b) Gypsum
96.0 4.0
Raw materials required for PPC (in %) (a) Clinker (b) Gypsum (c) Fly Ash
70.50 4.40 25.10
Clinker cost including transportation cost (per MT in Rs.)* 12,000.00 Gypsum cost including transportation cost (per MT in Rs.) ** 9,000.00 Difference of clinker in % (OPC – PPC) 25.5 Quantity of clinker that can be saved by use of fly ash (in MT) 2,09,230 Value of clinker that can be saved per year (Rs. Crs.) 251.08 Difference of Gypsum in % (OPC – PPC) - 0.4 Additional quantity of Gypsum use of PPC (in MT) 3,282 Additional value of Gypsum use of PPC (Rs. Crs.) 2.95 Net benefit per year of a cement plant if it uses fly ash (Rs. Crs.)# 248.12 Note: The calculation is based on information provided by JP Reewa Cement Plant, Reewa M.P. * The information has been taken from Mr. J.P. Srivastava, Sales Officer, Chunar Cement
Factory, Kajarhat, District Mirzapur, U.P. ** The information has been taken from Mr. Shakeel, Account Officer, Chunar Cement Factory,
Kajarhat, District Mirzapur, U.P. # The transportation cost has not been deducted due to non-availability of information. Table 7.4 shows that on the basis of use of fly ash in PPC, given the specified
ratio of around 25.0 per cent of fly ash used, we calculate the total PPC that
can be produced if total fly ash generated by NTPC, Dadri, is used in PPC.
Though cost on gypsum rises with respect to use of fly ash in PPC, clinker
cost drastically gets reduced, so that net benefits for any cement plant
producing PPC rises.
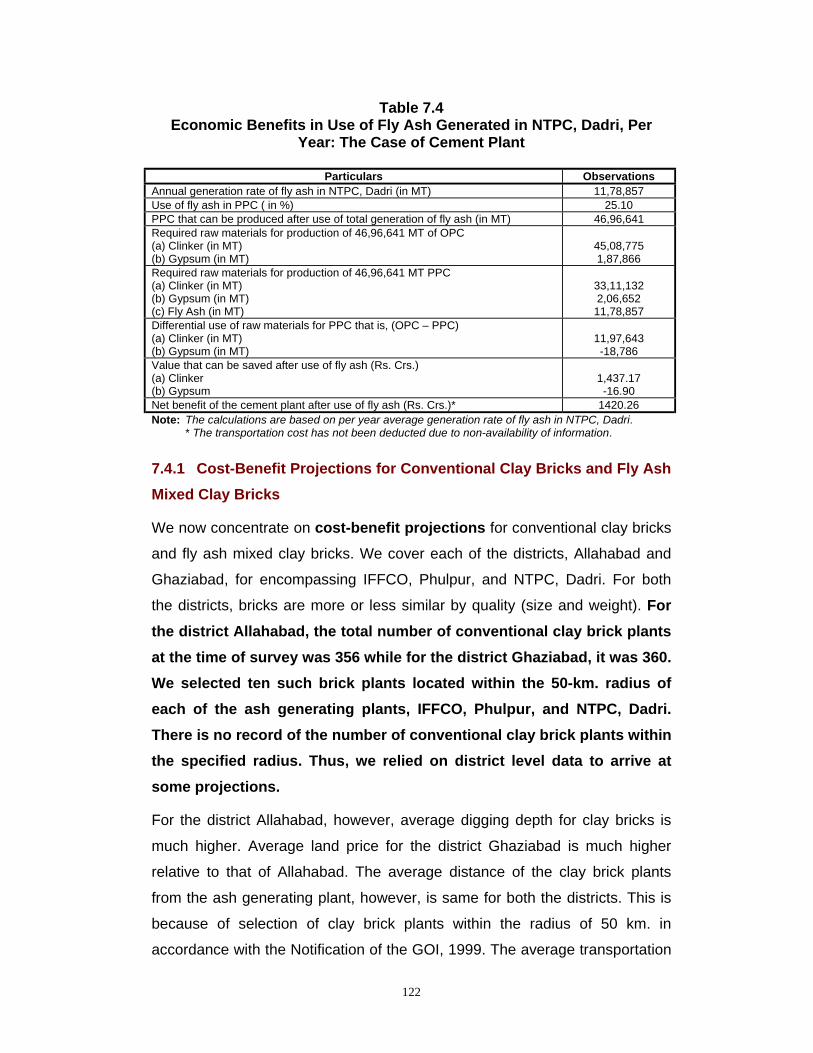
122
Table 7.4 Economic Benefits in Use of Fly Ash Generated in NTPC, Dadri, Per
Year: The Case of Cement Plant
Particulars Observations Annual generation rate of fly ash in NTPC, Dadri (in MT) 11,78,857 Use of fly ash in PPC ( in %) 25.10 PPC that can be produced after use of total generation of fly ash (in MT) 46,96,641 Required raw materials for production of 46,96,641 MT of OPC (a) Clinker (in MT) (b) Gypsum (in MT)
45,08,775 1,87,866
Required raw materials for production of 46,96,641 MT PPC (a) Clinker (in MT) (b) Gypsum (in MT) (c) Fly Ash (in MT)
33,11,132 2,06,652 11,78,857
Differential use of raw materials for PPC that is, (OPC – PPC) (a) Clinker (in MT) (b) Gypsum (in MT)
11,97,643 -18,786
Value that can be saved after use of fly ash (Rs. Crs.) (a) Clinker (b) Gypsum
1,437.17 -16.90
Net benefit of the cement plant after use of fly ash (Rs. Crs.)* 1420.26 Note: The calculations are based on per year average generation rate of fly ash in NTPC, Dadri. * The transportation cost has not been deducted due to non-availability of information.
7.4.1 Cost-Benefit Projections for Conventional Clay Bricks and Fly Ash Mixed Clay Bricks
We now concentrate on cost-benefit projections for conventional clay bricks
and fly ash mixed clay bricks. We cover each of the districts, Allahabad and
Ghaziabad, for encompassing IFFCO, Phulpur, and NTPC, Dadri. For both
the districts, bricks are more or less similar by quality (size and weight). For the district Allahabad, the total number of conventional clay brick plants at the time of survey was 356 while for the district Ghaziabad, it was 360. We selected ten such brick plants located within the 50-km. radius of each of the ash generating plants, IFFCO, Phulpur, and NTPC, Dadri. There is no record of the number of conventional clay brick plants within the specified radius. Thus, we relied on district level data to arrive at some projections.
For the district Allahabad, however, average digging depth for clay bricks is
much higher. Average land price for the district Ghaziabad is much higher
relative to that of Allahabad. The average distance of the clay brick plants
from the ash generating plant, however, is same for both the districts. This is
because of selection of clay brick plants within the radius of 50 km. in
accordance with the Notification of the GOI, 1999. The average transportation
123
cost for carrying fly ash (per 16 MT) is much higher for Ghaziabad; both the
average cost of production per 1000 bricks and average market price are
higher relative to those of Allahabad (Table 4.11 Part-A, p. 31, and Table 5.14, Part-A, p. 58). There is variation in quantity of soil that is exhausted
(used) between the districts for brick manufacturing because of variations in
digging depth. The quantity of soil used (in cubic metre) is more in case of
district Allahabad relative to Ghaziabad. Naturally, the number of clay bricks
that can be manufactured per acre (sq. metre) of land is much higher for
district Allahabad relative to Ghaziabad. On the assumption of 25.0 per cent clay replaced by fly ash (on weight-to-weight basis), the quantity (volume) of fly ash that can be used, thus, is higher for Allahabad relative to Ghaziabad. For this ratio-specific utilization of fly ash (75:25), the transport cost of fly ash from the ash generating plant is lower for the district Allahabad (Table 7.5).
The cost of production of fly ash mixed clay bricks per 1000 is marginally
more when 25.0 per cent of clay is replaced by fly ash, for both the districts.
Per 1000 bricks, the cost-difference is Rs.27 for Allahabad, and Rs. 42 for
Ghaziabad. As percentage of cost of production of clay bricks in the
respective districts, these are 3.33 and 4.47 (Table 4.11 Part-B, p. 31, and Table 5.14, Part-B, p. 58).
7.4.2 Net Benefits (Total Benefits – Total Cost) for Utilization of Fly Ash in Conventional Clay Brick Plants and Fly Ash-Sand-Lime-Gypsum Brick Plants
While production of conventional clay bricks increasingly exhausts agricultural
land as we observed, the production of fly ash bricks saves agricultural land
(by both area and volume). However, both cost of production per unit and
market price per unit are higher in case of fly ash-sand-lime-gypsum bricks.
While net surplus (Revenue – Cost) is positive for both types of brick plants, it
is much higher for clay bricks per plant based on annual production level
(Table 5.23, p. 68). Since plant size is much higher (by capacity production)
for clay bricks, hence clay brick plants record on average higher net benefits.
Calculated over 1,000 pieces of bricks, fly ash-sand-lime-gypsum brick plant
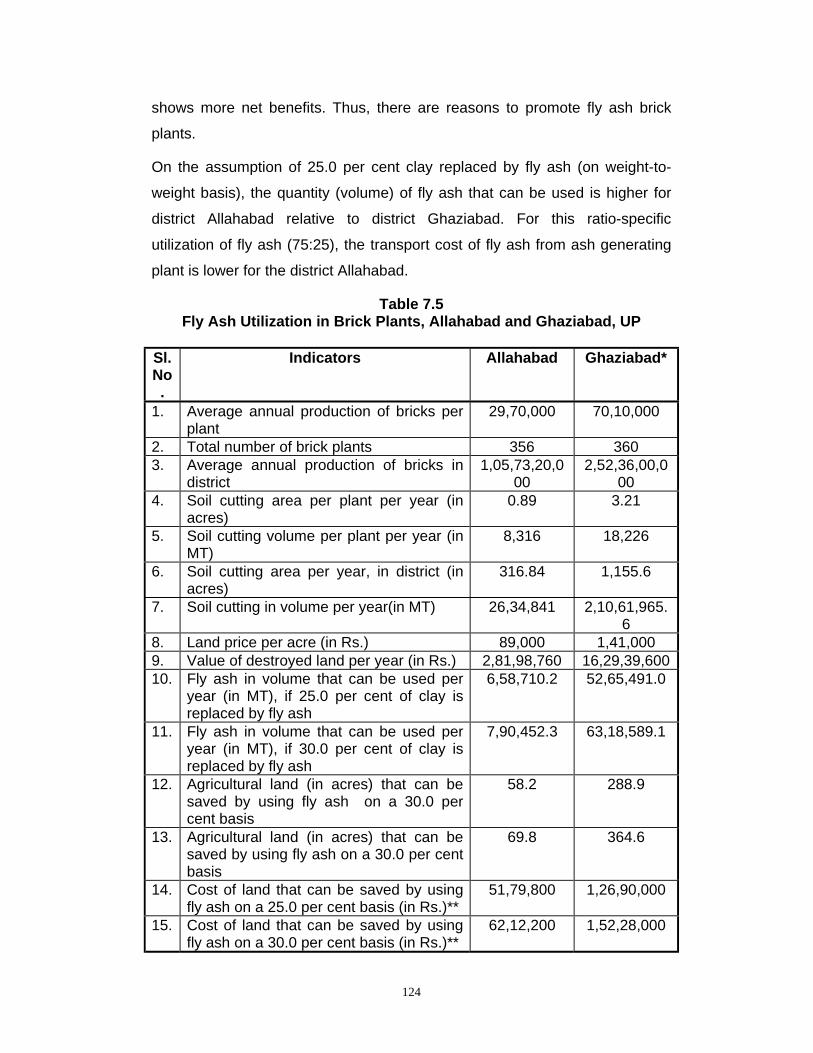
124
shows more net benefits. Thus, there are reasons to promote fly ash brick
plants.
On the assumption of 25.0 per cent clay replaced by fly ash (on weight-to-
weight basis), the quantity (volume) of fly ash that can be used is higher for
district Allahabad relative to district Ghaziabad. For this ratio-specific
utilization of fly ash (75:25), the transport cost of fly ash from ash generating
plant is lower for the district Allahabad.
Table 7.5 Fly Ash Utilization in Brick Plants, Allahabad and Ghaziabad, UP
Sl. No.
Indicators Allahabad Ghaziabad*
1. Average annual production of bricks per plant
29,70,000 70,10,000
2. Total number of brick plants 356 360 3. Average annual production of bricks in
district 1,05,73,20,0
00 2,52,36,00,0
00 4. Soil cutting area per plant per year (in
acres) 0.89 3.21
5. Soil cutting volume per plant per year (in MT)
8,316 18,226
6. Soil cutting area per year, in district (in acres)
316.84 1,155.6
7. Soil cutting in volume per year(in MT) 26,34,841 2,10,61,965.6
8. Land price per acre (in Rs.) 89,000 1,41,000 9. Value of destroyed land per year (in Rs.) 2,81,98,760 16,29,39,600 10. Fly ash in volume that can be used per
year (in MT), if 25.0 per cent of clay is replaced by fly ash
6,58,710.2 52,65,491.0
11. Fly ash in volume that can be used per year (in MT), if 30.0 per cent of clay is replaced by fly ash
7,90,452.3 63,18,589.1
12. Agricultural land (in acres) that can be saved by using fly ash on a 30.0 per cent basis
58.2 288.9
13. Agricultural land (in acres) that can be saved by using fly ash on a 30.0 per cent basis
69.8 364.6
14. Cost of land that can be saved by using fly ash on a 25.0 per cent basis (in Rs.)**
51,79,800 1,26,90,000
15. Cost of land that can be saved by using fly ash on a 30.0 per cent basis (in Rs.)**
62,12,200 1,52,28,000
125
Note: * Includes both the districts, Ghaziabad and Gautam Buddha Nagar. ** Cost on account of clay converted bricks can be saved more if fly ash is delivered to
production site of the brick plant free of cost by ash generating plant.
7.5 Tax on Volume of Fly Ash Stored
As explained, NTPC, Dadri, being the generator of fly ash, will have to
shoulder its reuse and recycling. As we calculated, the transportation cost per
truck, that caries on average 16 MT of fly ash per trip, comes to be Rs.
1,433.00 on average from NTPC, Dadri to the clay brick plants located with 50
km. radius of the Dadri plant. Either the NTPC, Dadri Unit shoulders this
transportation cost of fly ash, or the government of India as the fiscal authority
imposes tax on volume (in MT) of fly ash dumped so far, that is,
accumulated/stored, and on fly ash that is generated per period (day/year
etc.).
On the assumption that Rs. 1,433.00 per 16 MT is the total tax payable by the
ash generator on the said volume of fly ash, that is, 16 MT, the tax rate per
MT of fly ash comes to be Rs. 89.59. The assumption is based on the
transportation cost of fly ash.
Average dumping/storage of fly ash per day by NTPC, Dadri is 3,556 MT, so
that tax on volume of fly ash stored per day by NTPC, Dadri, comes to be Rs.
3,20,040.00, on the basis of Rs. 90.00 rate of tax per MT (tax rate taken in
round figure). Imposition of the tax rate at Rs. 90 per MT on the ash
generator, calculated at present rate of transport cost of fly ash etc., will
compel the ash generator to transport it free of cost to ash users (bricks plants
etc.) or pay taxes to the government.
126
Chapter 8 : Policy Recommendations
The purpose of this study is to prevent and minimize generation of waste, and
maximize reuse and recycling. The study also aims to production of reusable
goods from waste and saving scarce resources assisted by the participation
of government authorities and other stakeholders. The study concentrates on
fly ash as a waste generated in coal-using industrial plants. Saving topsoil by
utilization of fly ash in possible value-added goods requires a number of
measures. These measures include:
Recommendations for Ash Generating Plants
⇒ disposal and dumping of ash by the ash management/utilization cell of the
ash generating plant should be maintained in a planned way,
⇒ identification and selection of the site for dumping fly ash should be made
in advance so that human settlements are not displaced, nor is there any
adverse effect on agricultural land,
⇒ there has to be transparency in disclosure of fly ash generated per plant
per year and hence accountability of fly ash generator. It should also be
the responsibility of ash generating plant to make public announcement
regarding the quality of ash being generated, the receivers of fly ash who
utilize the ash generated by the plant, the quantity of accumulated ash up
to date,
⇒ transportation cost of fly ash from the ash generating unit to the ash
utilization unit to be imposed on the generator of ash,
⇒ soil testing of the brick plants to examine its possible mixing with fly ash
generated by the coal-based plants within 50-km radius, testing to be done
free of cost for the brick plants by MOE&F, GOI,
Recommendations for Government
⇒ the government will have to announce through Notification or G.O. what
the ash generating plants will have to do regarding dumping and disposal
of fly ash, before these ash generating units are given licenses to setup
these plants,

127
⇒ the location of such ash generating plants has to be at a safe distance
from existing human settlement and plantation area,
⇒ the government, or the appropriate authority on its behalf, will have to
circulate its Notification including amendment, if any, regarding utilization
of fly ash among micro level public bodies and public administration,
⇒ a record of quality of soil, air, and water within a reasonable area adjoining
ash generating plants should be maintained by the Pollution Control
Board, GOI, and also by the State Pollution Control Board and Directorate
of Environment,
⇒ imposing tax per unit (volume on weight basis) of fly ash stored by the ash
generating plant,
⇒ reducing rate of tax per unit or total tax exemption on fly ash mixed clay
bricks, so that it has an encouraging effect on production of fly ash mixed
clay bricks,
⇒ tax reduction/tax exemption on fly ash users for productive purposes,
⇒ documenting quality of fly ash products and its dissemination by
Government/ appropriate authority,
⇒ eco-labeling of fly ash bricks, e.g., fixing logo on the environmentally safe
fly ash bricks,
⇒ a record of the number of conventional clay brick plants within the radius
of 50-km from major fly ash generating plants, to be maintained by
MOE&F, GOI,
⇒ the government has to be a buyer of clay-mixed fly ash bricks, and fly ash-
sand-lime-gypsum bricks,
⇒ the price per unit of fly ash bricks, both clay-mixed fly ash bricks and fly
ash-sand-lime-gypsum bricks, should be fixed by the government on the
basis of input cost,
⇒ mine filling and land filling, keeping in mind transportation cost of fly ash
from the point of generation to the site (land and mine),

128
Recommendations in General
⇒ supplying technology to the potential users of fly ash for manufacturing
value-added goods,
⇒ providing cost-free training to the managers and manpower in general
engaged in utilizing fly ash in value-added goods,
⇒ providing information on alternative products and technologies through
public media for utilization of fly ash,
⇒ the results of soil testing be made known to the actual and potential users
of fly ash,
⇒ the price of bricks fixed per unit has to be known to both the buyers and
producers of fly ash mixed clay bricks.
Reducing ash-content in coal being utilized by the selected plants requires
coal cleaning or using washed coal, as explained in Chapter 6. Using clean
coal, however, involves cost of cleaning and search for non-inferior coal
(grade A, B, C). In the context of exhausting superior grade coal in India, the
major coal-users may have to depend on government intervention for ultimate
import of coal with lower ash content on a selective basis.
The suggestions that we have offered center on brick plants. We found no
problems for the cement plants so far as utilization of fly ash in clinker and
gypsum for manufacturing cement is concerned. We concentrated our study
on possibility of utilization of fly ash in manufacturing bricks and cement, as
these are the major areas of utilization of fly ash in India, as we explained in
Chapter 3 (Box 3.2, p. 16). The alternative products where fly ash can be
utilized for value-addition of products have been discussed in Chapter 2 (Box 2.4, p. 10).
129
References
1. ACI 226.3R – 87, Use of Fly Ash in Concrete, American Concrete Institute, Detroit, U.S.
2. Berg, W.V., 1999, 'Handling, Utilization and Safe Disposal of Coal Combustion in Germany', Indo-European Workshop on Handling and Utilization of Coal Combustion By-Products from Indian Power Stations, Guru Gobind Singh Super Thermal Plant, Ropar (Punjab), India.
3. Beukering, P.V. et al, 1999, ‘ Analysing Urban Solid Waste in Developing Countries: A Perspective on Bangalore, India’, Working Paper No. 24, CREED, March.
4. Bever, M.B., 1976, ‘ The Recycling of Metals: Ferrous Metals and Non-Ferrous Metals’, Conservation and Recycling, Vol. 1, No. 1.
5. Brown, Lester R. and Mitchell, Jennifer (1998), ”Building a New Economy”, in Brown, L.R. et al, New York.
6. Chadwick, M.J., Highton, N.H., and Lindman, N., 1987, 'Environmental Impacts of Coal Mining and Utilization', Pergamon Press, New York.
7. Chaudhary T.R. et al, 1999, Alkali Soil Reclamation by Fly Ash Application above or in combination with gypsum, presented in National Seminar on Utilization of Fly Ash in Agriculture and for Volume – added products, 15-16 November, organized by CFRI, Dhanbad.
8. Cointreau, S.J., 1982, 'Environmental Management of Urban Solid Wastes in Developing Countries', Urban Development Department, World Bank, Washington D.C., US.
9. Congressional Office of Technology Assessment, n.d., The Direct Use of Coal (Prospects and Provision of Production and Combustion), Ballinger Publishing Company, Cambridge, Mass.
10. Cornelissen, dr. ir. 1999, Hans, 'Use of Coal Ashes: Experience in the Netherlands', in Indo-European Workshop, Op Cit, India.
11. Dasgupta Partha and Maler, Karl-Goran (1997), “The resource basis of Production and Consumption: an Economic Analysis”, in Dasgupta, and Maler, K.G. (Ed.) “The Environment and Emerging Development issues”, Vol. 1, Clarendon Press, Oxford.
12. Dijkstra, Bouwe R., 1999, 'The Political Economy of Environmental Policy', Edward Elger, UK.
13. Gerlagh, R. et al, 1999, ‘ Integrated Modeling of Solid Waste in India’, Working Paper No. 26, March.
14. GOI, Department of Science and Technology, TIFAC, 1995, Pre-Combustion Clean Coal Technology Assessment, October.
15. GOI, Dept. of Science & Technology, TIFAC, 1990, Techno-Market Survey on Technologies for Disposal of Thermal Power Station Fly Ash, Nov.
16. GOI, Dept. of Science & Technology, TIFAC, 1995, Techno-Market Survey on Fly Ash Bricsk, August.
130
17. GOI, Dept. of Science & Technology, TIFAC, n.d., Techno-Market Survey, High Value Added Products and Applications of Fly Ash.
18. GOI, DST, TIFAC, n.d. (2), Techno-Market Survey on Fly Ash Prefabrication, Technology and Market.
19. Gupta, B.M. and Kashikar, S.S., 1977, 'Excellence in Manufacturing Through Waste Reduction', Productivity, Vol. 38, No. 3, Oct.-Dec. .
20. H.V. Equipments Pvt. Ltd., Operation Maintenance Manual for Dry Fly Ash Pneumatic Conveying System at M/s IFFCO, Phulpur Unit, Supplied by New Delhi (unpublished), n.d.
21. Heidenstem, O. von, 1977, ‘ Swedish Experience in Separation at Source of Solid Wastes’, Institute of Solid Waste Management, London.
22. IFFCO, Phulpur, Plant Documents, n.d. 23. Jensen, Svend Aage, 1999, 'The Situation of CCP-Utilization in Denmark',
Indo-European Workshop, Op Cit, India. 24. Mattew, Thomas and Unnikrishnan, Seema, 1997, Strategic Management of
Hazardous Wastes in India, Productivity, Vol. 37, No. 4, Jan.-March. 25. Mehta, S., Mundle, S., Sankar, U., 1997, Controlling Pollution, Incentives and
Regulations, Sage Pub., New Delhi. 26. Melosi, M.V., 1980, ‘ Garbage in the Cities: Refuse, Reform and the
Environment, 1880-1980’, Texas A & M Press, Texas. 27. Misan, E.J., 1981, Cost-Benefit Analysis, George Allen & Unwin, London. 28. NTPC, 1999, NTPC Guide for users of Coal Ash, Ash Utilization Division,
October. 29. Oates, W.E., 1996, 'Environment and Taxation: The Case of the United
States', in Oates, W.E. (Ed), 'The Economics of Environmental Regulation', Edward Elger, UK.
30. Sankar, U., 1998, ‘ Laws and Institutions relating to Environment Protection in India’, MSE Occasional Paper No. 2, Chennai, India.
31. Sengupta, Ramprasad, 1999, 'Ecology and Economics', and 'The Circular Economy', Papers presented in the Training Programme on Environmental Economics, Giri Institute of Development Studies, Lucknow, Dec. 3.
32. Sikka, P.K. and Kundu, D., 1999, 'Dry Ash Disposal at NTPC Dadri, An efficient Ecofriendly Way of Handling Ash', in Indo-European Workshop, Op Cit, India.
33. The Gazette of India : Extraordinary, Part II Sec. 3 (ii), MOE & F, Notification. 34. The World Resources Institute, 1998, 'World Resources' 1998-99, Oxford
University Press, New York. 35. World Bank, 2000a, 'Greening Industry: New Roles for Communities, Markets,
and Governments', Oxford Univ. Press, New York. 36. www.iffco.nic.in 37. Young, John E., 1991, Reducing Waste, Saving Materials', in Brown, Lester
R. et al (Ed), State of the World, W.W.Norton &Co., New York
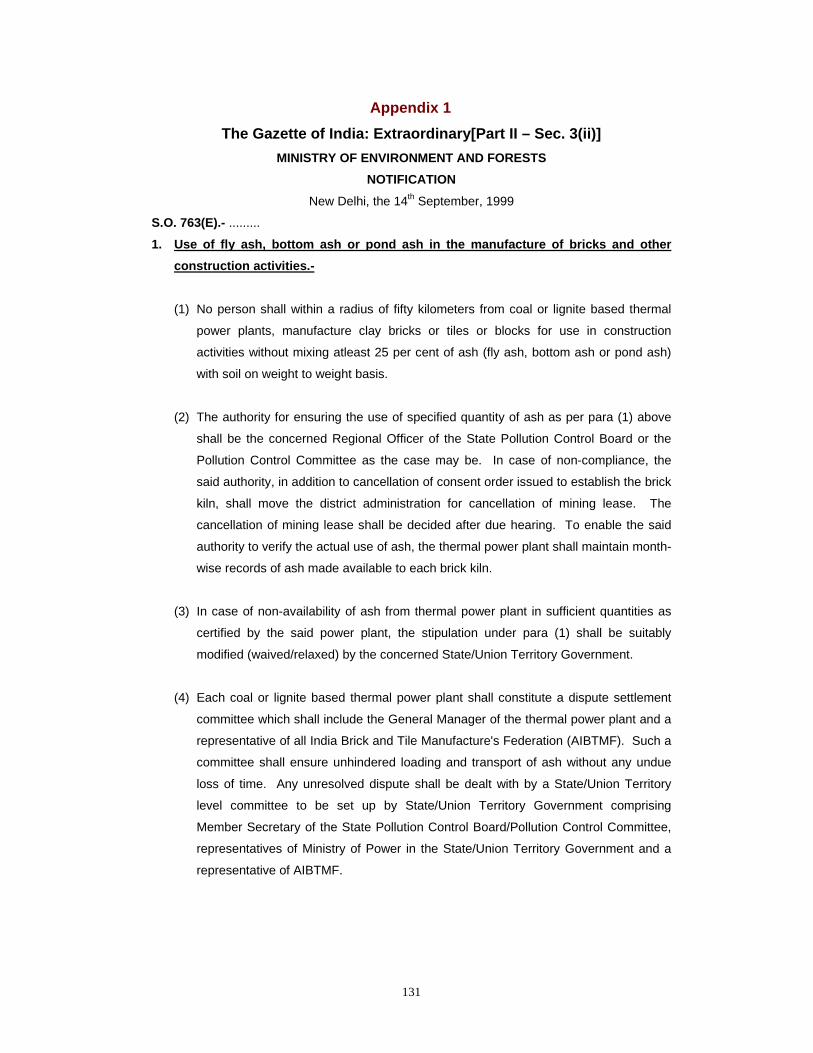
131
Appendix 1 The Gazette of India: Extraordinary[Part II – Sec. 3(ii)]
MINISTRY OF ENVIRONMENT AND FORESTS NOTIFICATION
New Delhi, the 14th September, 1999
S.O. 763(E).- ......... 1. Use of fly ash, bottom ash or pond ash in the manufacture of bricks and other
construction activities.-
(1) No person shall within a radius of fifty kilometers from coal or lignite based thermal
power plants, manufacture clay bricks or tiles or blocks for use in construction
activities without mixing atleast 25 per cent of ash (fly ash, bottom ash or pond ash)
with soil on weight to weight basis.
(2) The authority for ensuring the use of specified quantity of ash as per para (1) above
shall be the concerned Regional Officer of the State Pollution Control Board or the
Pollution Control Committee as the case may be. In case of non-compliance, the
said authority, in addition to cancellation of consent order issued to establish the brick
kiln, shall move the district administration for cancellation of mining lease. The
cancellation of mining lease shall be decided after due hearing. To enable the said
authority to verify the actual use of ash, the thermal power plant shall maintain month-
wise records of ash made available to each brick kiln.
(3) In case of non-availability of ash from thermal power plant in sufficient quantities as
certified by the said power plant, the stipulation under para (1) shall be suitably
modified (waived/relaxed) by the concerned State/Union Territory Government.
(4) Each coal or lignite based thermal power plant shall constitute a dispute settlement
committee which shall include the General Manager of the thermal power plant and a
representative of all India Brick and Tile Manufacture's Federation (AIBTMF). Such a
committee shall ensure unhindered loading and transport of ash without any undue
loss of time. Any unresolved dispute shall be dealt with by a State/Union Territory
level committee to be set up by State/Union Territory Government comprising
Member Secretary of the State Pollution Control Board/Pollution Control Committee,
representatives of Ministry of Power in the State/Union Territory Government and a
representative of AIBTMF.
132
2. Utilization of ash by Thermal Power Plants.-
All coal or lignite based thermal power plants shall utilize the ash generated in the
power plants as follows:-
(1) Every coal or lignite based thermal power plant shall make available ash, for at least
ten years from the date of publication of this notification, without any payment or any
other consideration, for the purpose of manufacturing ash-based products such as
cement, concrete blocks, bricks, panels or any other material or for construction of
roads, embankments, dams, dykes or for any other construction activity.
(2) Every coal or lignite based thermal power plant commissioned subject to
environmental clearance conditions stipulating the submission of an action plan for
full utilization of fly ash shall, within a period of nine years from the publication of this
notification, phase out the dumping and disposal of fly ash on land in accordance with
the plan. Such an action plan shall provide for thirty per cent of the fly ash utilization,
within three years from the publication of this notification with further increase in
utilization by atleast ten per cent points every year progressively for the next six years
to enable utilization of the entire fly ash generated in the power plant atleast by the
end of ninth year. Progress in this regard shall be received after five years.
(3) Every coal or lignite based thermal power plant not covered by para (2) above shall,
within a period of fifteen years from the data of publication of this notification, phase
out the utilization of fly ash in accordance with an action plan to be drawn up by the
power plants. Such action plan shall provide for twenty per cent of fly ash utilization
within three years from the date of publication of this notification, with further increase
in utilization every year progressively for the next twelve years to enable utilization of
the entire fly ash generated in the power plants.
(4) All action plans prepared by coal or lignite based thermal power plants in accordance
with sub-para (2) and (3) of para 2 of this notification, shall be submitted to the
Central Pollution Control Board, concerned State Pollution Control Board/Committee
and concerned regional office of the Ministry of Environment and Forests within a
period of six months from the date of publication of this notification.
(5) The Central and State Government Agencies, the State Electricity Boards, the
National Thermal Power Corporation and the management of the thermal power
plants shall facilitate in making available land, electricity and water for manufacturing
activities and provide access to the ash lifting area for promoting and setting up of
133
ash-based production units in the proximity of the area where as is generated by the
power plant.
(6) Annual implementation report providing information about he compliance of
provisions in this notification shall be submitted by the 30th day of April every year to
the Central Pollution Control Board, concerned State Pollution Control
Board/Committee and the concerned Regional Office of the Ministry of Environment
and Forests by the coal or lignite based thermal power plants.
3. Specification for use of ash-based products.-
(1) Manufacture of ash-based products such as cement, concrete blocks, bricks, panels
or any other material or the use of ash in construction activity such as in road laying
embankments or use as landfill to reclaim low lying areas including back filling in
abandoned mines or pitheads or for any other use shall be carried out in accordance
with specifications and guidelines laid down by the Bureau of Indian Standards,
Indian Bureau of Mines, Indian Road Congress, Central Building Research Institute,
Rookee, Central Road Research Institute, New Delhi, Building Materials and
Technology Promotion Council, New Delhi, Central Public Works Department, State
Public Works Departments and other Central and State Government agencies.
(2) The Central Public Works Department, Public Works Departments in the State/Union
Territory Governments, Development Authorities, Housing Boards, National Highway
Authority of India and other construction agencies including those in the private sector
shall also prescribe the use of ash and ash-based products in their respective
applications, including appropriate standards and codes of practice, within a period of
four months from the publication of this notification.
(3) All local authorities shall specify in their respective building by-laws and regulations
the use of ash and ash-based products and construction techniques in building
materials, roads, embankments or for any other use within a period of four months
from the date of publication of this notification.
[F.No. 16-2/95-HSMD]
V. RAJAGOPALAN, Jt. Secy.

134
Appendix 2
Table: Crop Pattern in Selected Villages, Adjoining Area of IFFCO, Phulpur
Year Fasali Year Wheat (Crop area in
Hectare) Paddy (Crop area
in Hectare) Potato (Crop area
in Hectare) Village: Bhulai Ka Pura
1986 1394 58.591 54.385 0.795 1987 1395 57.591 54.385 0.795 1988 1396 51.266 42.334 3.733 1989 1397 41.159 42.334 4.192 1990 1398 43.895 29.692 2.858 1991 1399 48.215 23.526 3.829 1992 1400 55.572 48.561 3.583 1993 1401 59.246 46.80 2.651 1994 1402 60.342 48.280 1.881 1995 1403 60.342 48.280 1.881
Village: Dailapur 1989 1397 39.003 24.000 7.295 1990 1398 37.092 22.358 1.781 1992 1400 36.551 20.442 1.363 1993 1401 35.896 18.021 4.310 1994 1402 34.956 19.392 2.319
Village: Kanehati 1995 1403 174.534 190.093 1.580 1996 1404 174.027 208.880 11.820 1997 1405 171.449 207.110 12.715 1998 1406 176.412 189.210 3.238 1999 1407 230.456 230.676 Not available
Village: Pali 1988 1396 98.215 75.296 4.564 1989 1397 95.334 6.716 1990 1398 94.144 90.673 7.817 1991 1399 86.340 83.613 7.205 1992 1400 88.224 78.150 6.055 1993 1401 99.018 77.225 4.754 1994 1402 100.225 80.122 4.785 1995 1403 100.225 80.122 4.785
Village: Fazilapur 1988 1396 20.139 18.255 0.440 1989 1397 19.078 18.585 0.588 1990 1398 19.072 18.585 0.186 1991 1399 19.556 20.972 0.832 1992 1400 19.803 21.584 0.687 1993 1401 21.245 20.203 0.652 1994 1402 20.411 20.585 0.685 1995 1403 20.411 20585 0.685
Village: Chandouki 1988 1396 130.420 129.450 Not available 1989 1397 110.890 134.374 1.180 1990 1398 112.268 135.917 1.159 1991 1399 Not available 141.629 Not available 1992 1400 113.268 134.616 1.583 1994 1402 129.859 129.835 Not available 1995 1403 109.872 126.628 3.930 1996 1404 109.872 126.628 3.930 1997 1405 116.398 126.628 4.330 1998 1406 138.460 142.362 3.453 1999 1407 134.753 136.279 0.551
Village: Saraiya 1988 1396 90.217 82.680 2.710 1989 1397 91.234 83.593 2.547 1990 1398 95.117 101.945 0.497 1991 1399 94.201 100.913 0.375 1992 1400 85.695 80.519 0.327 1993 1401 85.795 80.519 0.320 1994 1402 85.795 80.576 0.326 1995 1403 95.795 80.516 0.326 1996 1404 87.042 81.799 3.015 1997 1405 85.907 79.702 2.810 1998 1406 85.907 79.702 2.810
Source: Tehsil, Phulpur, Allahabad.