thermal and electrical performance evaluation of pv/t collectors in
TRANSCRIPT

Master of Science Thesis
KTH School of Industrial Engineering and Management
Energy Technology EGI-2013-037MSC
Division of Applied Thermodynamics and Refrigeration
SE-100 44 STOCKHOLM
Thermal and Electrical Performance
Evaluation of PV/T Collectors in UAE
Mustafa Kaya

-2-
Master of Science Thesis EGI 2013:037MSC
Thermal and Electrical Performance
Evaluation of PV/T Collectors in UAE
Mustafa Kaya
Approved
May 13, 2013
Examiner
Dr. Björn Palm
Supervisor
Dr. Björn Palm
Mr. Manoj Kumar Pokhrel
Contact person
Mustafa Kaya
Abstract
Photovoltaic Thermal/Hybrid collectors are an emerging technology that combines PV and solar thermal
collectors by producing heat and electricity simultaneously. In this paper, thermal and electrical
performance of PV/T collectors are analyzed and presented for the climate of RAK, UAE. Thermal
performance evaluation is done following the collector output model presented in European standard EN
12975-2 and electrical performance evaluation is done by analyzing the effect of water circulation on the
performance of PV/T collectors. Additionally, a PV/T system is designed for residential use in UAE and
simulated using simulation software Polysun. Power output and requirements of the system along with its
financial analysis is presented. Alternative solar energy systems to PV/T system are analyzed in terms of
power output, specific requirements and financial analyses. Finally, a study is made to reveal the impact of
incentives towards sustainable energy systems on the economic feasibility of PV/T systems for residential
use in UAE.

-3-
Table of Contents
Abstract ........................................................................................................................................................................... 2
Symbols and Units ......................................................................................................................................................... 4
1 Introduction .......................................................................................................................................................... 5
1.1 Objectives ..................................................................................................................................................... 6
1.2 Method of Attack ........................................................................................................................................ 7
2 Literature Review ................................................................................................................................................. 8
2.1 PV/T Collectors Overview ....................................................................................................................... 8
2.1.1 Liquid type Flat - PV/T Collectors ................................................................................................. 8
2.1.2 Air type Flat - PV/T Collectors....................................................................................................... 9
2.1.3 Ventilated PV with Heat Recovery ...............................................................................................10
2.1.4 Concentrating PV/T Collectors ....................................................................................................10
2.2 Standards for Evaluating the Performance of PV/T Collectors .......................................................11
3 Methodology .......................................................................................................................................................14
3.1 Thermal performance evaluation............................................................................................................14
3.1.1 Parts and Components ....................................................................................................................14
3.1.2 Instrumentation Accuracy ..............................................................................................................19
3.1.3 Measurements and Determination of Collector Model Coefficients ......................................19
3.2 Electrical performance evaluation ..........................................................................................................20
3.3 Simulation of a PV/T system for a villa in UAE .................................................................................21
4 Results and Discussion ......................................................................................................................................23
4.1 Thermal performance of the PV/T collector .......................................................................................23
4.2 Electrical performance of the PV/T collector .....................................................................................26
4.3 Performance and economic feasibility of the PV/T system for residential use in UAE ..............29
4.3.1 Electrical and thermal performance of the PV/T system .........................................................29
4.3.2 Economic feasibility of the PV/T system ...................................................................................31
5 Conclusion ...........................................................................................................................................................35
Bibliography .................................................................................................................................................................36
Annex A ........................................................................................................................................................................37
Annex B ........................................................................................................................................................................39
Annex C ........................................................................................................................................................................40

-4-
Symbols and Units
Tout : Collector outlet temperature [°C],
Tin : Collector inlet temperature [°C],
Tm : Collector mean temperature [°C],
Ta : Ambient temperature [°C],
is the useful power output, calculated as [W]
area of collector [m2]
Cp : Heat capacity for water = f(Tin),
: Mass flux of water = f(Tin, ) [kg/h],
: Volume flux of water [m3/h],
G : Irradiance on the collector surface [W/m2],
k1 : Heat transfer coefficient [W/(m2K)],
k2 : Heat transfer coefficient [W/(m2K2)]
collector efficiency factor
effective transmittance-absorptance product for direct solar radiation at normal incidence
incidence angle modifier for direct radiation
angle of incidence [degrees]
constant for the calculation of incident angle modifier
direct solar irradiance (beam irradiance) [W/m2]
incidence angle modifier for diffuse radiation
diffuse solar irradiance [W/m2]
global hemispherical solar irradiance [W/m2]
heat loss coefficient at (Tm - Ta)=0 [W/m2K]
temperature dependence of the heat loss coefficient [W/m2K2]
wind speed dependence of the heat loss coefficient [J/m3K]
sky temperature dependence of the heat loss coefficient [W/m2K]
effective thermal capacity [J/m2K]
wind dependence in the zero loss efficiency [s/m]
mean temperature of heat transfer fluid [°C]
ambient or surrounding air temperature [°C]
surrounding air speed [m/s]
longwave irradiance (λ >3μm) [W/m2]
Stefan-Boltzmann constant [W/m2K4]
ambient or surrounding air temperature [°C]
time [s]
hemispherical solar irradiance [W/m2]
is hemispherical emittance
is solar absorptance
is taken as 0.85 unless a different value is supplied by the manufacturer
is the collector efficiency
are the coefficients of the collector model

-5-
1 Introduction
The Sun is the source of all energy on Earth, the cause of weather and climate. The incoming solar
irradiance from the Sun to the Earth at any given time amounts to a tremendous value of 174 PW (1
Petawatt = 1015 Watts). (Smil, 1991) From this amount, approximately 1,069,444 PWh of energy is
absorbed by the Earth’s atmosphere, oceans and land masses throughout a year. (Smil, 2006) Taking into
account that yearly total primary energy supply of the world comes close to 143 PWh, energy absorbed
from the sun by our world corresponds to nearly 7500 times more than what the whole world needs in a
year. Efficient and economic harnessing of clean solar power may be very significant by fulfilling today’s
growing energy needs and tranquilizing climate concerns.
Developments in the technology in the last few decades enable extensive and efficient use of solar energy
by converting it to thermal energy and electricity. Although still not economically competitive with the
conventional energy conversion technologies, solar energy systems are being installed and used thanks to
encouragement, subsidies and incentives towards clean and renewable energy sources. It is expected in
near future that solar energy will be economically competitive and it will be feasible to invest in and install
solar systems even without subsidies and incentives. Altogether we can say that; as the efficiency and
economic competitiveness of solar systems increase every day, solar systems are becoming more and more
important to introduce a sustainable energy mix.
Systems that harness solar energy could be classified into two groups. First: systems that convert solar
energy to thermal energy and systems that convert solar energy to electricity. The first group can further
be classified into two: Systems that convert solar energy to thermal energy for heating purposes and
systems that convert solar energy to thermal energy for electricity generation purposes. With the
introduction of a third, hybrid type technology, a third group can be added to this figure, which is the
Photovoltaic/Hybrid technology. Photovoltaic/Hybrid collectors combine the two technologies by
offering thermal energy and electricity simultaneously from a single solar collector. Detailed classification
can be observed at Figure 1:
Solar Energy Systems
THERMAL ENERGY ELECTRICITY
Figure 1: Overview of solar energy systems
Solar thermal systems that convert solar energy to thermal energy for heating purposes are usually small
scale systems that aim to contribute partly –or completely– to heating demands of a building or facility.
There are several types of solar heating systems however they won’t be explained in detail since they are
not directly under the scope of this project. The basic working principle of solar collectors is that a fluid,
which can be water/water-mixture or air, is circulated through an absorber. The outlet temperature of the
fluid is higher than its inlet temperature and this temperature difference is utilized in terms of thermal
energy. In most of the applications, thermal energy is stored in an insulated container, such as a water
Solar Thermal
Systems
Photovoltaic
Systems
Photovoltaic/Thermal
Hybrid Systems

-6-
tank, although there are some applications that do not involve storing, such as air heating systems that
utilize solar energy to heat the cold air inside a building.
Solar systems that convert solar energy to thermal energy and then using this thermal energy to generate
electricity are usually large scale systems. They can involve parabolic trough collectors, Fresnel mirrors or
concentrating solar towers to redirect solar energy to a point and line and generate heat, which is later
used to increase the temperature of the running fluid. Then the heat inside the fluid is converted to
electricity using a steam turbine and generator.
Beside heat generation from solar power, other way of utilizing solar energy is to directly convert it to
electricity using photovoltaic modules. Photovoltaic modules have components which have chemical
properties that enable electricity generation directly from solar rays. Both small scale and large scale
applications of photovoltaic technology can be observed today.
An emerging technology, which combines the former two ways of harnessing solar power, is the point of
interest in this work: Photovoltaic/Thermal hybrid collectors, which are usually abbreviated as PV/T
collectors. This project investigates the performance and economics of Photovoltaic/Thermal hybrid
collectors that convert solar energy to both thermal energy and electricity simultaneously.
A Photovoltaic/Thermal hybrid collector consists of two layers: A glazed or unglazed PV layer at the top
and beneath it, an absorber layer, which absorbs heat from the PV layer. The absorber layer has an inlet
and outlet for fluid circulation. The fluid, which may be liquid (such as water or water-ethylene-glycol
mixture) or air, is circulated through the absorber material to extract heat from it. Below, a sample figure
of a PV/T collector can be observed:
Figure 2: Photovoltaic/Thermal hybrid collector (PV Catapult, 2006)
Usage of water-ethylene-glycol mixture instead of water prevents freezing of the fluid in cold temperatures
and thus protecting the collector of deformation problems due to freezing. On the other side, using air as
the circulated fluid through the collector is beneficial when there is a demand for heated air such as in air
heating systems.
1.1 Objectives
The main objective of this project is to investigate the thermal and electrical performance of an unglazed
liquid type flat plate PV/T collector under local climate and weather conditions in UAE.
To accomplish this objective, first, a literature survey about “PV/T collectors” and “performance
evaluation methods of flat plate collectors” is done. Literature about the PV/T collectors revealed
different types and properties of PV/T collectors, whereas literature about performance evaluation
methods enabled choosing the correct testing method to evaluate the thermal and electrical performance
of the PV/T collector. Since the project also involved physically building the test set-up, a major part of

-7-
the work was to determine required instruments to conduct the performance tests. After finding out
retailers that supply the required instruments and acquiring the items, a test set-up is built in the outdoor
research facility of CSEM-uae. Finally, after the test set-up is completely built, thermal and electrical
performance evaluation of the collectors is done by following certain steps in the selected methodology.
The secondary objective of the project is to give indications about the performance and economic
feasibility of PV/T systems in general under UAE conditions.
To complete this objective, a study is done by using Polysun simulation software. A scenario is created
where a PV/T system is used to cover certain percentage of one family’s energy needs. Using the technical
specification of the collectors and financial data collected from the suppliers, performance analysis and
economic feasibility of the PV/T system is evaluated. Comparisons to several other solar energy systems
are made highlight advantages and disadvantages of PV/T systems compared to other solar energy
systems.
1.2 Method of Attack
1. Literature survey about PV/T collectors and methods to evaluate thermal and electrical
performance of flat plate collectors
2. Selecting an appropriate and applicable method for evaluating collector performance
3. Determination of available and required items to build the test set-up
4. Determination of available suppliers for the required items
5. Procurement of required items
6. Building the test set-up in the solar outdoor research facility of CSEM-uae for testing the thermal
and electrical performance of the PV/T collector
7. Evaluation of test results
8. Designing a PV/T system for residential use in UAE and simulation in Polysun
9. Performance analysis and economic feasibility evaluation of the PV/T system
10. Comparison of PV/T system to other solar energy systems for residential use
11. Study of the effect of incentives on sustainable energy systems on the economic feasibility of
PV/T systems for residential use in UAE

-8-
2 Literature Review
2.1 PV/T Collectors Overview
A Photovoltaic/Thermal hybrid (abbreviated as PV/T) collector is the combination of a PV collector on
top and a thermal collector at the bottom. The idea behind combining these two can be explained as
follows: The performance of Photovoltaic collectors decreases as the temperature of the modules
increases. By circulating a fluid, which will extract heat from the PV modules, module temperature is
decreased and hence, performance of the PV modules increases. Furthermore, in cases where heating is
required, extracted heat from the PV modules serves as a second benefit along with the increased
performance of the PV module. Domestic hot water heating, air heating in ventilation systems, pool
heating can be counted among these cases, where combining a Photovoltaic and Thermal collector makes
most sense in terms of efficiency and performance.
Another advantage of combining the photovoltaic and thermal system is that total area requirement of a
PV/T collector is around 40% less (IEA, 2007) compared to photovoltaic and thermal collectors with the
same total capacity. In cases where available area is limited and maximum utilization of the available space
is desired, PV/T collectors shine as the better alternative. It is also suggested that PV/T collectors are
aesthetically more appealing compared to a combination of thermal and photovoltaic collectors.
(Photovoltaic thermal module concepts and their performance analysis: A review, 2010)
There are several types of PV/T collectors and they are classified with respect to the fluid used, shape of
the collector and whether it’s integrated into a building or not. Furthermore, existence of glazing on the
collector is another factor that distinguishes a PV/T collector’s characteristics. (PV Catapult, 2006)
Liquid type PV/T collectors, air type PV/T collectors, concentrating PV/T collectors and building
integrated PV/T collectors are the four different types of PV/T collectors. (Photovoltaic thermal (PV/T)
collectors: A review, 2006)
2.1.1 Liquid type Flat - PV/T Collectors
In this type of PV/T collectors, water or a mixture of water (i.e. water-ethylene-glycol) is circulated
through the collector to extract heat from it. Using a liquid-PV/T collector is advantageous if there is a
demand for hot water. Flat structure allows convenient integration on a building, usually rooftops.
Furthermore, hot water may be stored in an external tank for a period of time. Its drawback is that
leakages and freezing may occur in extreme conditions. (Photovoltaic thermal module concepts and their
performance analysis: A review, 2010) However, these can be prevented by robust construction and by
using water-ethylene-glycol mixture.
Liquid type Flat – PV/T collectors may either be glazed or unglazed. An extra layer of glass on top of the
photovoltaic cells results in less heat losses and greater thermal performance, whereby reducing electrical
performance by some extent due to the reason that photovoltaic cells perform worse in higher
temperatures. (Flat-plate PV-Thermal collectors and systems: A review, 2005) Unglazed Liquid type Flat –
PV/T collectors have higher electrical performance and lower thermal performance compared to glazed
ones because of greater heat losses and resultantly lower operating temperatures. (Hybrid Photovoltaic-
Thermal Collectors: A Review, 2010) It can be stated that in order to achieve higher thermal performance,
glazed- and for higher electrical performance, unglazed liquid type flat PV/T collectors will be the correct
choice. (PV Catapult, 2006)
Below, a figure representing a liquid type Flat – PV/T collector and two commercial collectors, one being
glazed and another unglazed, can be observed.

-9-
2.1.2 Air type Flat - PV/T Collectors
In air type flat – PV/T collectors, air is circulated through the collector instead of water. Using this type of
PV/T collectors makes sense if there is a demand for heated air. Advantages over liquid type are that air
type collectors have lower cost and there is no risk of freezing, boiling or any damage to the system in case
of a leakage. (A review on photovoltaic/thermal hybrid solar technology, 2009) On the other hand, there
are some major disadvantages of using air type PV/T collectors such as they have lower thermal
performance characteristics compared to liquid types. (A review on photovoltaic thermal collectors, 2009)
Lower heat capacity of the circulated fluid results in lower heat transfer. Furthermore, low density of air
causes the transfer volume to be significantly higher than in liquid types. Thus, pipes with higher volume
and greater bulk are needed which is not suitable for low area applications and is not aesthetically pleasing
as well. Finally, in case of a leakage, higher heat losses are observed in comparison to liquid type PV/T
collectors. Despite these disadvantages, air type flat – PV/T collectors are suitable choices where there is a
demand for heated air due to their lower cost. (Flat-plate PV-Thermal collectors and systems: A review,
2005) Below, a figure representing this type and a commercial collector can be observed:
Figure 3: Sample figure of a liquid type PV/T collector (PV Catapult, 2006)
Figure 4: Unglazed liquid type PV/T Collectors IIIIIII(Courtesy of WIOSUN GmbH & Co. KG)
Figure 5: Sample figure of an air type PV/T collector (PV Catapult, 2006)
Figure 6: An application of air-type PV/T collectors (PV Catapult, 2006)

-10-
2.1.3 Ventilated PV with Heat Recovery
Ventilated PV systems with heat recovery are basically building integrated PV systems that are docked into
a section of a wall or the rooftop on a building, which utilize the heat of the PV collectors through heat
recovery from a ventilated PV system by natural convection of air through PV facades or arrays on the
rooftops. The advantage of building integrated PV collectors is that they shield the building so that the
cooling load during summer decreases. Furthermore, they replace the cladding material and this way, the
cost of the cladding material is avoided, which counts into the project economic feasibility. (Photovoltaic
modules and their applications: A review on thermal modelling, 2011)
The drawback of building integrated PV collectors is that they are tailor based; have to be designed
separately for each specific building. (PV Catapult, 2006) They also need large pipes due to high volume
requirements, which may not be suitable for each application. Finally, due to exposed state of the PV
collectors and the nature of the air circulation through the collectors, high heat losses and low
temperatures are observed in building integrated PV collector applications. (Flat-plate PV-Thermal
collectors and systems: A review, 2005)
Below, two applications of building integrated PV collectors may be observed:
Figure 7 & 8: Applications of building integrated PV collectors on a rooftop and building façade (PV Catapult, 2006)
2.1.4 Concentrating PV/T Collectors
In concentrating PV/T collectors, solar rays are collected and reflected to a central point where the PV/T
module is situated. The advantage of concentrating PV/T collectors is that usage of reflector material,
which is less expensive than PV modules, allows using less PV modules compared to flat type PV/T
collectors. By doing so, expensive PV modules are replaced by less-expensive reflector material.
(Photovoltaic thermal module concepts and their performance analysis: A review, 2010) The drawback of
the concentrating PV/T collectors is that because of the high temperatures, stable cooling is required and
the system becomes problematic if thermal load (cooling) decreases. (A review on photovoltaic/thermal
hybrid solar technology, 2009) These systems also need tracking for better performance and due to their
bulky shape; they are less suitable for building integration compared to flat plate PV/T collectors. (Flat-
plate PV-Thermal collectors and systems: A review, 2005) Furthermore, because of the high working
temperatures, increased degradation of the materials is observed when compared to other types of PV/T
collectors. (Photovoltaic modules and their applications: A review on thermal modelling, 2011) Finally, the
performance of concentrating PV/T collectors is hindered comparatively more when exposed to sand and
dust. Their performance is affected more than flat plate PV/T collectors in sandy and dusty
environments. (Olsson, 2011) Below, a sample concentrating PV/T collector and an application of
concentrating PV/T collectors can be observed:

-11-
Figure 9: Concentrating PV/T Collector (Courtesy of Solarus)
Figure 10: An application of concentrating PV/T collectors (PV Catapult, 2006)
2.2 Standards for Evaluating the Performance of PV/T Collectors
Methods and procedures regarding performance testing of solar collectors are defined and published by
standardization institutions. In case of PV/T collectors, performance testing of PV/T collectors should
be separated into thermal and electrical performance testing because there is no standard defining and
detailing a procedure for simultaneous electrical and thermal performance testing of PV/T collectors.
PV/T collectors are rather a new type of technology than PV and thermal collectors, thus a standard that
defines simultaneous electrical and thermal performance tests has not yet constituted. This lack of a
globally recognized standard has been mentioned in the report of PV Catapult in 2006 (PV Catapult,
2006) and it still persists as today.
Thermal performance measurement of a solar collector was first standardized by ASHRAE in 1980 in the
standard ASHRAE 96-1980: Methods of testing to determine the thermal performance of unglazed flat-
plate liquid-type solar collectors. (Collector test method under quasi-dynamic conditions according to the
European Standard EN 12975-2, 2003) This standard proposes a collector model which relates collector
efficiency to irradiance, temperature differences and heat transfer coefficients. The collector model
proposed in ASHRAE is given below:
with:
Source: (Test Facility For Quasi Dynamic Collector Tests For The Characterization Of Thermal Solar
Collectors In Accordance With The International Norms, 2003)
This standard restricts performance testing of solar thermal collectors to unglazed-flat plate-liquid type
collectors. In other words, only unglazed-flat-plate-liquid type solar collectors can be tested using this
standard. (Roof Integrated Solar Absorbers The Measured Performance of “Invisible” Solar Collectors,
2001) More importantly, methods followed in this standard require steady state test conditions to proceed,
( 1 )
( 2 )
( 3 )
( 4 )

-12-
which do not tolerate changes in test conditions more than defined allowances. To be able to define a test
period as steady state test conditions, irradiance has to be between 650 and 750 W/m2 at all times.
Incidence angle of the beam irradiance should be less than 20°, diffuse fraction should be less than 30°,
temperature of the surrounding air should not vary more than 1 °K, speed of the surrounding air should
be between 2 and 4 m/s and collector inlet temperature should not vary more than 0.1 °K. (Collector test
method under quasi-dynamic conditions according to the European Standard EN 12975-2, 2003)
The restrictions regarding the steady state conditions and its obligation shorten the time span in a day that
can be used for outdoor performance tests. Since this project takes place in a solar outdoor facility, the
difficulties of maintaining steady state conditions during the test periods led to seeking another approach
that can be implemented more conveniently in the outdoor facility.
A second standard that gives a procedure to test the thermal performance of a solar collector is ISO 9806-
3:1995: Test methods for solar collectors - Part 3: Thermal performance of unglazed liquid heating
collectors. It can be used to measure thermal performance of unglazed-liquid type thermal collectors; the
scope is slightly widened compared to ASHRAE standard by removing flat-plate restriction. The
procedure suggested in this standard uses the same collector model as the ASHRAE standard by relating
collector efficiency to irradiance, temperature differences and heat transfer coefficients and it also requires
steady state conditions to conduct the performance tests. Because of the mentioned difficulties for doing a
thermal performance measurement test in the outdoor facility, this standard is not followed and led to
another standard which was constituted in 2006: EN 12975-2.
EN 12975-2: Thermal solar systems and components - Solar collectors - Test methods has a much wider
scope compared to ASHRAE and ISO standards and can be applied to a set of solar collector including
glazed/unglazed flat plate collectors, tube collectors and even concentrating solar collectors. (Collector
test method under quasi-dynamic conditions according to the European Standard EN 12975-2, 2003)
However, the main benefit of European Standard compared to previously mentioned ones is that it
introduces another method that diminishes restrictive constraints imposed by the steady state testing
obligation entailed by ASHRAE and ISO standards.
EN 12975-2 enables testing the performance of solar collectors under quasi dynamic test conditions,
which brings several advantages compared to steady state testing.
First of all, the range of irradiance values that are accepted for the performance test is much more than
the steady state conditions. In quasi dynamic testing, irradiance values between 300 and 1100 W/m2
qualify for testing; where in steady state testing, irradiance has to be between 650 and 750 W/m2. This
increases the available time that can be taken to proceed with performance tests and makes it possible to
perform the test throughout the day without eliminating low irradiance data, thus increasing eligible data
points and decreasing the time required to complete the tests. (Collector test method under quasi-dynamic
conditions according to the European Standard EN 12975-2, 2003)
Secondly, quasi dynamic testing method removes the restriction that the incidence angle should be within
+/- 20° variation from normal. As a result of it, it becomes possible to test in the morning and afternoon
hours, where inclination angle is outside the +/- 20° limit. (Solar thermal collector yield – experimental
validation of calculations based on steady-state and quasi-dynamic test methodologies, 2008) Quasi
dynamic testing method also removes the restriction that the ratio of diffuse irradiation to total irradiation
should be less than 30 percent. This way, it becomes possible to perform test during cloudy days as well.
(Collector test method under quasi-dynamic conditions according to the European Standard EN 12975-2,
2003)
Restrictions about the surrounding air temperature are removed as well. Surrounding air speed has to be
between 0 and 3.5 m/s for unglazed collectors and for glazed collectors, there is no restriction for
surrounding air speed. These extensions in the allowed test conditions enable performing tests much
easier in outdoor conditions. Finally, temperature variance of the collector inlet in the quasi-dynamic test
conditions is increased from 0.1 °K, which is the allowed variance in steady-state conditions, to 1 °K. This

-13-
change accommodates using less expensive temperature sensors and also inclusion of more data points,
which in turn results in shorter and comparatively less-expensive experiments. (Collector test method
under quasi-dynamic conditions according to the European Standard EN 12975-2, 2003)
Quasi-dynamic testing method introduced in EN 12975-2 uses a much more complex model compared to
the steady-state-condition model in order to accommodate the extended test conditions. The collector
model for quasi-dynamic testing according to EN 12975-2 is formulated as follows:
( )
with:
) for < 45°
for 0 °C < T < 60 °C
for 1% < RH < 100%
°C for 0 °C < < 50 °C (EN.12975-2, 2006)
The collector model at the end breaks down into two parts: values that have to be measured
experimentally and collector efficiency coefficients to be determined with enough experimental data. In
the below collector model, values to be measured are marked with regular font, where collector efficiency
coefficients to be determined are marked with blue color and bold font.
( )
According to the standard, a set of measurements is done to obtain a valid data set, which is then used to
determine collector efficiency coefficients by using Multiple Linear Regression (MLR) method.
( 5 )
( 6 )
( 7 )
( 8 )
( 9 )
( 10 )
( 11 )
( 5 )

-14-
3 Methodology
The project consists of two parts: Thermal and electrical performance evaluation of the PV/T collector
and designing a PV/T system for a villa in UAE. For the first part, solar outdoor facility of CSEM-uae is
used. Some items were present in the facility to do the thermal performance evaluation according
European standard EN 12975-2 and many others have been studied out and procured from related
suppliers. At the end, a complete test set-up has been built, which may also be used for testing other
collectors.
3.1 Thermal performance evaluation
The test set-up that is built for the purpose of thermal and electrical performance evaluation conforms to
the requirements in EN 12975-2 and can be observed in the below drawing:
Figure 11: Circuit drawing of the test set-up that is built in the solar outdoor facility
3.1.1 Parts and Components
Hot water tank was one of the items that were present in the facility. Two connections are made for the
inlet and outlet of the tank and ball valves are used to isolate the circuit at times when there is no need.
Copper pipes with inner diameter of ¾” are used for the connections between the circuit elements.
These are procured from local suppliers in UAE.
Y-Strainer is placed before pump and other elements to ensure that any particles are removed before
going into pump and causing possible damages. It is procured locally.
Filling and flossing unit is also placed before pump and other elements. In case the pressure in the
circuit rises to dangerous levels, water in the circuit can be extracted and if there is a need for additional

-15-
water, it can be supplied by using this unit. Filling and flossing unit was present in the facility and used for
this project’s purposes.
The pump that is used is Grundfos UP 20-60B 150. It operates for temperatures up to 95 °C and
pressures up to 10 bars. It has 3 levels of power, which are 40 W, 70 W and 115 W. The pump was
present in the solar outdoor facility and used for the project.
Figure 12: The pump that is used in the experiments
A non-return valve is placed at the outlet of the pump to secure that no backflow occurs, which may
damage the pump. It is procured from local suppliers.
Before going into flow elements, a line opens to pressure gauge, safety valve and expansion tank.
These series of circuit elements provide that in case the pressure in the circuit rises more than the setting
value, which is 2 bars, safety valve opens and water fills the expansion tank, reducing circuit pressure.
Pressure gauge and expansion tank are procured locally; safety valve is imported from Caleffi, an Italian
manufacturer.
A balancing valve is used to keep the flow at the desired level. It can set the water flow between 2 and 7
l/min, where the flow was set around 3.2 l/min for the experiments. The balancing valve is also acquired
from Caleffi.
Figure 13: Balancing valve
As flow meter, Grundfos VFS series are used. It measures flow rates between 2 and 12 l/min with an
accuracy of 1.5%. The measurements from the flow meter are collected through output signals to
connected data acquisition modules and stored in the computer.
Figure 14: Flow meter

-16-
PT-100 temperature sensors are used to measure the temperature of water at the collector inlet and
outlet. The accuracy of the temperature sensors are 1/10 DIN, i.e. 0.03 °K at 0 °C. They are connected to
data acquisition modules and the temperature values at the inlet and outlet are measured and recorded at
short time intervals. Temperature sensors are imported from Alpha Temp, a British manufacturer.
Figure 15: PT-100 Temperature sensor
Thermal and electrical performance evaluation has been done for two liquid-type, unglazed PV/T
collectors that are provided by Wiosun, a German manufacturer, for the purpose of this project. They are
connected in series and connected to the circuit according the circuit diagram. Technical specifications of
the PV/T collector can be observed in below table:
Type Wiosun PV-Therm
Model PVT 180
Collector area 1,31 m2
Pmax 184,26 W
Vmpp 23,91 V
Impp 7,71 A
Voc 29,46 V
Isc 8,28 A
Flow rate 30 to 100 l/h
Operating Temperature 10 to 60 °C
Stagnation Temperature 75 °C
Fluid Contents 5 l
Dimension 1315x1012x20 mm
Glass Thickness 3,2 mm
Weight 37 kg
*All Technical Data at STC
Table 1: Technical specifications of the PV/T collector
Finally, an automatic air vent is used just after the collector to ensure that the air contained in the circuit
liquid is released automatically. The air vent is acquired from Caleffi and may be observed in the below
figure:

-17-
Figure 16: Automatic air-vent
Two pyranometers that were present in the solar outdoor facility of CSEM-uae were used for the
purpose of the project. One of the pyranometers is placed on the collector plane just above the collectors
to measure global solar irradiation. The other pyranometer is used on another horizontal plane with a
shadow ring on it, to measure diffuse solar irradiation. Both of the measurements were done on short time
intervals and recorded in PC and used for the collector model analyses. Pyranometers that are used in the
experiments are manufactured by Kipp&Zonen and have an accuracy of 5 to 20 µV/W/m².
Figure 17: Pyranometer
A Shadow ring is used to create a shady area on the pyranometer and measure the diffuse irradiation that
is used in the collector model. It has a certain setting related with the location of the facility and provides
shadow on the pyranometer respectively. The shadow ring is imported from Kipp&Zonen for the
purpose of this project.
Figure 18: Shadow ring
An anemometer is placed just next to the PV/T collector to measure the wind speed on the collector
surface. It is mounted horizontally and connected to data acquisition modules to record the values of wind
speed in short time intervals. The anemometer has an accuracy of 0.5 m/s and is imported from
Wittich&Visser for the project.

-18-
Figure 19: Anemometer
Humidity and ambient temperature sensor is placed near the collectors in a shaded area to measure
and record ambient temperature and humidity. The accuracy for relative humidity is 0.8% and for the
temperature is 0.1 °K. The combined sensor is manufactured by Rotronic and imported from
Wittich&Visser.
Figure 20: Humidity and ambient temperature sensor
Three data acquisition modules are used for taking and recording the measurements. ADAM 4015, RTD
input module to record the measurements taken by the RTD temperature sensor; ADAM 4019+, analog
input module to record the measurements taken by the flow meter, pyranometers, anemometer, humidity
and temperature sensor; and ADAM 4080, to convert the inputs to recordable format in the PC. They are
set up thanks to the help of CSEM-uae colleague Mr. Dhanushka Prageeth Rathnasooriya. ADAM 4080
was present in CSEM-uae and used for the purpose of this project, ADAM 4015 and 4019+ are acquired
from local retailers.
Figure 21: Analog and RTD input data acquisition modules

-19-
3.1.2 Instrumentation Accuracy
Equipment that is used in the experiments is selected according to the accuracy requirements of European
Standard EN 12975-2. In the standard, required accuracy levels for each instrument are specified
explicitly. In order to determine the coefficients of the collector model accurately, instrument that is used
should conform to the specifications stated in the standard.
As per the confidence interval of the results; although the accuracy of the selected instruments do have a
direct effect on the results of the experiments, it is not possible to define a specific confidence interval
that will be valid for the determined collector parameters since the experimentation results are not used
straight forward in order to calculate the collector model coefficients. The results of the experiments are
used to calculate other parameters and a set of these parameters are given as an input to Multiple Linear
Regression, which incorporates statistical formulae in order to give appropriate coefficients for the
collector model. Due to the progressive nature of the methodology given in EN 12975, effect of
instrumentation accuracy is not stated explicitly. Instead, system results, i.e. calculated collector model
coefficients are regarded as valid results if the accuracy requirements are met. Accuracy levels of the
instrumentation that is used in the experiments are given below:
Instrument Accuracy
PT100 Temperature sensor for the inlet and outlet 1/10 DIN: ±0.03 °K at 0 °C
Temperature sensor for ambient temperature ±0.1 °K
Pyranometer 5 to 20 µV/W/m²
Flow meter ±1.5%
Humidity sensor ±0.8% RH
Anemometer ±0.5 m/s
Table 2: Accuracy levels of selected instruments
3.1.3 Measurements and Determination of Collector Model Coefficients
Measurements are done on 5 second intervals. Following parameters are measured: Inlet temperature of
the collector, outlet temperature of the collector, ambient temperature and relative humidity, wind speed
on the collector area, volumetric flow of the collector liquid –which is water in this project–, global
irradiation and diffuse irradiation. For the tilt angle of the collector, 35° is selected due to overall better
performance at the site location, which is on the 25° latitude. The measurements are done by using the
equipment and recorded to PC using data acquisition modules that are described in above section. The
measurements lasted 5 days in total. A set of measurements reflecting measured parameters can be
observed in below table:
Time T_in (°C)
T_out (°C)
T_amb (°C)
RH (%)
Wind Speed (m/s)
Volumetric Flow
(l/min)
Global Irradiation
(W/m2)
Diffuse Irradiation
(W/m2)
9:16:10 36.08 39.50 32.88 58.48 0.29 3.11 664.41 211.00
9:16:15 36.09 39.50 32.87 58.58 0.68 3.11 664.41 212.12
9:16:20 36.09 39.52 32.83 58.69 0.14 3.11 666.67 212.12
9:16:25 36.08 39.54 32.81 58.85 0.05 3.05 667.80 213.24
9:16:30 36.09 39.53 32.81 58.94 0.05 3.07 668.93 213.24
9:16:35 36.09 39.52 32.79 58.94 0.00 3.12 668.93 214.37
Table 3: Measured parameters and sampling interval
In order the data set to qualify as valid data points, certain criterion have to be met: mass flow rate should
be set at approximately 0.02 times the collector area, which is 2.62 m2 since two collectors are used in

-20-
series. (EN.12975-2, 2006) In the test set-up, flow rate is measured in terms of volumetric flow rate and
the conversion from volumetric flow rate to mass flow rate is done by using following formula:
(
) (McCutcheon, 1993)
where;
is the density [kg/m3]
is the temperature [°C]
The mass flow rate should be kept stable within +- 1% for each test period and should not vary more
than 10% between different test periods. Furthermore, data points where the difference between outlet
and inlet temperature is less than 1 °K are not taken into account. Average value of surrounding air should
lie between 0-3.5 m/s. additionally, inlet temperature should be kept within +- 1°K for each test period.
In order to approximate the long-wave irradiation, following formula is used:
) for < 45°
for 0 °C < T < 60 °C
for 1% < RH < 100%
°C for 0 °C < < 50 °C (EN.12975-2, 2006)
The relative humidity is measured on site using installed humidity sensor and the long wave irradiation is
calculated using above formulation.
Finally, is calculated as mass flow multiplied by the temperature difference between the inlet and outlet
temperature of the PV/T collector. Completing the collection of measurement points for the mentioned
variables is followed by application of Multiple Linear Regression method to determine the coefficients of
the collector model described in EN 12975-2. The coefficients to be determined can be observed in below
formula as blue colored and bold:
( )
To determine the coefficients of the collector model, a set of data points that qualify the requirements is
required. It is suggested that for the range of acceptable inlet temperatures, three temperatures are selected
so that these temperatures cover the working temperature range of the collector. For each temperature
level, it is suggested to use at least three data points in order to perform Multiple Linear Regression (PV
Catapult, 2005). For this purpose, a total of twenty four data points are selected; of which nine data points
for the lower temperature, nine data points for the medium temperature and six data points for the high
temperature. The data set may be observed in Annex A. Using this data set, MLR analysis is performed
and collector model coefficients are determined. Collector model coefficients, along with other results,
may be observed in Results section.
3.2 Electrical performance evaluation
For evaluating the electrical performance of the PV/T collector, the collector is connected to a PV-Tracer
that was present in the solar outdoor facility of CSEM-uae and power output of the collector along with
global irradiation and temperature on the collector have been recorded. The emphasis is given to
( 12 )
( 7 )
( 8 )
( 9 )
( 10 )
( 11 )
( 5 )

-21-
determine the effect of water circulation on the electrical performance, i.e. the advantage of PV/T
collectors over traditional PV collectors in terms of electrical performance. To distinguish this difference,
measurements are done with the pump being on and water circulating through the collector and the pump
being of with no water circulation through the collector. Data are collector for a total of five days with
one minute time intervals. Out of five days, two days have been selected that are comparable in terms of
solar irradiance levels. The difference in power output between selected days is underlined. The
parameters that are recorded can be observed in the following table:
Time Irradiance
[W/m²]
Temp pvt_1 [°C]
Volts pvt_1 [V]
Amps pvt_1 [A]
Power pvt_1 [W]
Temp pvt_2 [°C]
Volts pvt_2 [V]
Amps pvt_2 [A]
Power pvt_2 [W]
11:11:00 971.75 42.92 19.683 7.259 142.877 43.64 19.338 7.246 140.114
11:12:00 972.88 42.83 19.649 7.269 142.83 43.54 19.335 7.245 140.077
11:13:00 974.01 42.55 19.623 7.284 142.929 43.43 19.398 7.226 140.172
11:14:00 975.14 42.45 19.502 7.34 143.145 43.37 19.385 7.243 140.413
11:15:00 971.75 42.63 19.513 7.343 143.286 43.50 19.272 7.293 140.542
11:16:00 974.01 42.61 19.609 7.324 143.619 43.58 19.185 7.34 140.825
11:17:00 977.4 42.77 19.621 7.323 143.68 43.91 19.225 7.33 140.913
Table 4: Data collected and recorded by PV-Tracer
3.3 Simulation of a PV/T system for a villa in UAE
A separate part of the project consists of designing a PV/T system for a villa in UAE and evaluating its
thermal and electrical performances along with its economic feasibility. While doing this analysis, different
alternatives for a residential solar system are taken into consideration; such as a PV/T system with glazed
collectors, a PV/T system with unglazed collectors, a PV system and a solar thermal system. The
advantages and disadvantages of each configuration in terms of power output and system cost is
highlighted.
As a starting point, the PV/T system with unglazed collectors (the same collectors that are used in
experiments) is chosen. Simulation layout that is created in Polysun may be observed below:
Figure 22: Simulation layout that is used in Polysun

-22-
The simulation layout consists of a set of PV/T collectors, an inverter, water tank, external heater, pump,
mixing valve, a set of controllers, cold water supply and how water demand. According to Design
Guidelines for Residential and Commercial Buildings published by Sustainable Buildings and
Communities Program for Abu Dhabi, a building should cover 80% of how water demand from
renewable sources in order to classify as a green building. (Estidama, 2008) Thus, achieving 80% of hot
water demand is set as a goal for all simulations.
Local residents living in villas consume about 120 liters of water per day per person in UAE (Epp, 2010),
where the average number of people living in villas goes up to 10 person (UAE National Bureau of
Statistics, 2011). Thus, how water demand is set to 1200 liters/day following daily peaks load profile as
defined in Polysun.
First, the required number of PV/T collectors for supplying 80% of villa’s hot water demand is
determined. Then, the size of the water tank that is suitable for the planned PV/T system is chosen. A
sensitivity analysis is made afterwards to determine the optimum tilt angle of the collectors. Both for the
whole year and for each month, suggestions are given to set the collectors on specific tilt angles so that the
total output of the system is maximized on an annual and monthly basis, respectively.
After completing the technical aspect of the simulations, financial analysis is done to reveal economic
feasibility of PV/T systems in UAE. Costs for each system component as well as other costs like
installation and maintenance costs are collected from companies. Cost break-down of the PV/T system is
detailed. Inflation and interest rates, electricity unit price of UAE have been taken into account and
economic feasibility indicators such as payback period and net present value of the project have been
calculated and presented.
As the next step, PV/T system is compared to four different systems, in which different type of
technology is used: Examined cases include a system with glazed PV/T collectors, PV collector and solar
thermal collectors with different sizes. Thermal and electrical outputs of these different cases, as well as
certain aspects like the area requirements are calculated and compared to the PV/T system. Furthermore,
the same financial analysis that is made for the PV/T system is made for each different case and the
results are compared.
Finally, an investigation is made about how the economic feasibility of the PV/T system would differ if
there would be incentives on sustainable energy systems in UAE. Different levels of incentives have been
set and financial analysis is made for each incentive level. Payback periods and net present values are
calculated and compared to the actual case with no incentives.

-23-
4 Results and Discussion
4.1 Thermal performance of the PV/T collector
Multiple Linear Regression analysis is applied to find the coefficients of the collector model:
( )
with
; first factor divides into two parts and hence, collector model
becomes:
(
)
since the model is in form, coefficients can be calculated
using MLR. The result is given in the following table:
Coefficients
Intercept 0
0.529518899
1.310587637
0.290097846
3.970656132
1.355556954
-0.02015999
7.481726532
0.24121861
36089.82837
Table 5: Coefficients calculated by MLR
Using , and can be calculated separately. Hence, the collector model coefficients are
calculated as follows:
Coefficients
Intercept 0
0.529518899
2.475053561
0.547851733
3.970656132
1.355556954
-0.02015999
7.481726532
0.24121861
36089.82837
Table 6: Collector model coefficients
( 5 )
( 13 )

-24-
Using the collector model coefficients, power output of the collector vs. temperature difference
between the ambient temperature and mean collector fluid temperature can be produced:
Figure 23: Power output of the tested collector vs. tm-ta
As expected, power output of the collector decreases as the difference between mean collector
temperature and ambient temperature increases. In other words, as the temperature of the collector fluid
rises, thermal efficiency and thus, thermal output decreases. The rate of power output decrease is dictated
by the collector coefficients found in the previous step.
The PV/T collector that is provided by Wiosun for the purpose of this project has been tested at an
independent certification institution, however that time according to steady-state testing method of
unglazed collectors according to EN 12975-2. Steady-state testing method assumes a different model for
the collector efficiency, which is also a function of tm-ta, irradiance and surrounding wind speed:
with
Putting the collector model coefficients provided into the collector efficiency equation and using it for
calculating useful power output of the collector, power output vs. tm-ta graph for steady-state testing
method can be produced as well. Below, you may observe power output vs. tm-ta graphs for the same
collector but calculated using different methods (steady-state and quasi dynamic testing methods).
( 14 )
( 15 )
( 16 )

-25-
Figure 24: Power output vs. tm-ta graph for two different methods
It is observed that steady state test produces a linear graph of power output vs. tm-ta, whereas quasi
dynamic test produces a polynomial graph. This is due to the reason that in quasi dynamic method,
temperature dependency of the useful power output is a function of both tm-ta and (tm-ta)2, where in the
steady state method, collector efficiency is expressed as a function of tm-ta only, leaving (tm-ta)2 out of the
collector model. As a result of this, power output vs. tm-ta graph of quasi dynamic method assumes a
polynomial shape and the response of the collector model differences itself from the one of steady state
model in higher temperatures, taking a steeper slope when reaching tm-ta levels of 20 °C, where
stagnations occurs. At that point, useful power output of the collector equals zero.
Using the collector model coefficients found with the quasi dynamic testing method, useful power output
of the collector is calculated manually for three different data points from the actual experiments. For
parameters like irradiance, inlet and outlet fluid temperatures, relative humidity and ambient temperature;
real data from these three sample points are used. Collector coefficients found after applying MLR are
inserted into the collector model and useful power output is calculated. Calculated power output values
are compared to corresponding measurement values. Below, a graph comparing the calculated power
output vs. measured power output along with a table listing relevant data points may be observed:

-26-
Figure 25: Measured vs. calculated output using collector coefficients
Data point
Time T_in [°C]
T_out [°C]
T_amb [°C]
RH [%]
Global irradiance [W/m2]
Diffuse irradiance [W/m2]
Measured Output
[W]
Calculated Output
[W]
1 9:14 AM 36.1 38.4 32.8 58.93 664.75 187.01 196 204
2 2:53 PM 35.8 38.4 34.1 58.62 705.03 189.82 221 259
2 10:07 AM 35.1 39.1 33.6 56.78 835.37 196.22 329 324
Table 7: Selected data points and corresponding parameters
4.2 Electrical performance of the PV/T collector
Electrical power output of the collector coupled with the global irradiance on the collector plane and the
cell temperature of the collector is measured and recorded for different cases. Since the collectors are
connected in series, average temperature of the first collector, i.e. the collector at the cold inlet side, has
lower overall temperature compared to the second collector, the collector at the outlet side. Due to this
reason, electrical output of the first compared is observed to be slightly higher than the electrical output of
the second collector. First test and measurements were done while keeping the circuit fluid flow through
the collectors, thus decreasing average temperatures of both collectors while yielding higher electrical
performance. Below, electrical output of the first and second collector along with corresponding global
irradiance and temperature on the collector may be observed:

-27-
Figure 26: Power output of the first collector with flow
Figure 27: Power output of the second collector with flow
As expected, electrical power output of the first collector is slightly higher than the second collectors due
to the reason that it is situated where the cold water inlet is and thus has lower overall temperature, which
increases the electrical output of the collector.
A second test has been done with the same setup is used again, however this time with no flow through
the collectors. Since the temperature of the collectors increases when there is no water flow, electrical
output of both collectors is expected to fall. Below, graphs of electrical power outputs of two collectors
for this case may be observed:

-28-
Figure 28: Power output of the first collector without flow
Figure 29: Power output of the second collector without flow
It is observed that when there is no flow through the PV/T collectors, electrical power output of the
collectors drops by 7 to 8 percent even though the level of measured solar irradiation is slightly higher
than the case with flow. (820 W/m2 vs. 790 W/m2 average global irradiation throughout the day) This is
due to the reason that having a cold water circulation reduces the overall temperature of the collector and
leads to higher electrical efficiencies. Comparative analysis for each collector with and without flow may
be observed in two graphs added to Annex B.

-29-
4.3 Performance and economic feasibility of the PV/T system for
residential use in UAE
4.3.1 Electrical and thermal performance of the PV/T system
The hot water demand of the villa is defined as 1200 liters/day after investigating water consumption and
demographic patterns in UAE (Epp, 2010) (UAE National Bureau of Statistics, 2011). The goal is set to
cover 80% of hot water demand, which is the level determined by local authorities in order for a building
to qualify as green building (Estidama, 2008). Using 9 Wiosun 180p PV/T collectors (the same model that
is used in experiments) 76% of the hot water demand throughout a year can be covered. Increasing the
number of collectors to 10, it is possible to cover 80% of hot water demand. Below, figures detailing
thermal and electrical power outputs of 9 and 10 PV/T collectors and their total fraction with respect to
total hot water demand may be observed:
Figure 30: Thermal and electrical output of 9 and 10 collectors
Figure 31: Solar fraction of the PV/T system with 9 and 10 collectors
The size of the water tank has to be chosen so that it provides adequate storage volume for hot water in
order to fully utilize PV/T collectors. Using a water tank with a volume of 1000 liters falls short of
providing enough storage for hot water, where even with 10 PV/T collectors 80% solar fraction is not

-30-
reached. Increasing the volume of water tank to 1250 liters, overall power output of the PV/T system
increases and 80% solar fraction goal is fulfilled. However, increasing the volume to 1500 liters does not
provide the same benefit, where total power produced slightly increases. Thus, the size of the water tank is
selected as 1250 liters. Below, a figure showing annual thermal output of the PV/T system vs. selected
tank volume may be observed:
Figure 32: Thermal output of the PV/T system vs. selected tank volume
The thermal and electrical output of the PV/T collectors is tested at 19 different tilt angles ranging from
0° to 90°. It is found out that for maximizing electrical power output throughout a year, a tilt angle of 25°
gives the best result. On the other hand, for maximizing thermal power output throughout a year, 35°
should be selected as the tilt angle. From the perspective of maximizing total power output, 35° gives the
highest performance throughout a year:
Figure 33: Thermal and electrical performance of PV/T collectors vs. tilt angle

-31-
It is observed that the total annual thermal output vs. tilt angle curve does have several maxima instead of
having one maximum point as the electrical output curve vs. tilt angle curve. The reason for this is
considered to be related with specific characteristics of unglazed solar thermal collectors since similar
results are reproduced with different unglazed collectors in different locations, where glazed collectors did
not show the same pattern and had smoother curves with one maximum point.
Another analysis is made to reveal the optimum angle for each month. For various months, certain angles
result in better performance. If it is possible to adjust the tilt angle of the collectors on applications of
PV/T systems, then certain angles will give the maximum output for electrical, thermal and total output.
Below figure highlights optimum angles for each month for maximizing power output:
Figure 34: Optimum tilt angle for each month to maximize power output
The optimum tilt angle that is fixed to give the maximum total power output is 35° and hence the system is designed based on this tilt angle. Thermal and electrical power outputs of the system with respect to each month may be observed below:
Figure 35: Monthly thermal and electrical output of the PV/T system
4.3.2 Economic feasibility of the PV/T system
Designed PV/T system along with all its components such as collectors, hot water tank, inverter, pipes
and cables, accessories and workmanship costs around 11000 Euros. 10 PV/T collectors account for

-32-
more than half of the cost, where hot water tank accounts nearly quarter of total costs. Detailed cost
break-down of the system can be observed below:
Figure 36: Cost break-down of the PV/T system
Taking into account that the life span of the PV/T is 25 years, given the electricity unit price, inflation and
interest rates in UAE, payback period of the project comes out as 35, i.e. net present value of the project
is below zero. It is important to note that these financial indicators are calculated considering there are no
incentives towards sustainable energy technologies. Details may be observed below:
Purchase cost of total system 10977 Euro
Maintenance cost 36 Euro/year
Life span 25 years
Salvage value 3354 Euro
Inflation 2%
Interest rate 7%
Electricity inflation 2%
Electricity unit price 0.067 Euro/kWh
Annual fuel cost savings 533 Euro
Solar energy cost per kWh 0.1 Euro
Payback period 35 years
Net present value -1091 Euro
Table 8: Financial analysis of the PV/T system
A comparison of the PV/T system to alternative solar energy system for residential use in UAE is made.
PV/T system is defined as “base case” and alternatives are examined under four cases: Solar thermal
system that will supply the same power as the total power supplied (thermal + electrical) by PV/T system,
solar thermal system that will supply the same thermal power as PV/T system, A PV system with the
same number of collectors which have the same maximum power rate as the PV/T collectors, and a
glazed PV/T system that will supply the same power as the PV/T system. Power outputs, area
requirements and financial indicators of these different alternatives are evaluated. A summary of the cases
along with performance and financial indicators may be observed below:

-33-
Base case Unglazed PV/T system to cover 85% of hot water demand
Case 2 Solar thermal system to cover 85% of hot water demand
Case 3 Solar thermal system that will give the same thermal output as the base PV/T
system Case 4 PV system, same module type & size as the PV/T collectors
Case 5 Glazed PV/T system to cover 85% of hot water demand
Table 9: Examined alternatives to PV/T system
Base Case 2 Case 3 Case 4 Case 5
# of collectors: 10x180p 3xFM-S 1.5xFM-S 10x180p 8xPower-therm
Collector area: 13 m2 7.11 m2 3.56 m2 13 m2 11.1 m2
Tank size: 1250 l 1250 l 650 l - 1250 l
Thermal yield (kWh) : 4696 8270 4713 - 5887
Electrical yield (kWh) : 3007 - - 2987 1983
Total solar fraction: 84.9 % 86.7 % 51.3 % 33.6 % 85.4 %
CO2 savings/year : 4264 kg 4669 kg 2590 kg 1602 kg 4388 kg
Table 10: Performance results of examined cases
Base
case
Case 2 Case 3 Case 4 Case 5
Purchase cost (Euro) 10977 5980 3636 3986 8609
Maintenance cost / year (Euro) 36 30 15 27 28.8
Life span (years) 25 25 25 20 25
Salvage value (Euro) 3354 706 353 1024 1968
Inflation 2% 2% 2% 2% 2%
Interest rate 7% 7% 7% 7% 7%
Electricity inflation 2% 2% 2% 2% 2%
Electricity price/kWh 0.067 0.067 0.067 0.067 0.067
Annual fuel savings (Euro) 533.4 584.1 323.9 200.4 548.8
Solar energy cost/kWh 0.1 0.05 0.06 0.12 0.08
Payback period (years) 35 13 14 35 20
Net present value (Euro) -1091 4051 1934 -974 1218
Table 11: Financial analyses of examined cases
Due to higher costs compared to solar thermal collectors and PV collectors, PV/T collectors tend to be
economically disadvantageous under UAE climate and economic conditions. Solar thermal collectors are
the most favorable in terms of economic feasibility due to lower collector costs. PV collectors come as
second, where PV/T collectors are least economic type of collectors for residential use in UAE. In terms
of area requirements, solar thermal collectors are the most area intense alternative in terms of power
output vs. required area, where PV/T collectors come in behind and PV collectors came as last since they
are producing electrical power only while occupying the same area as PV/T collectors.

-34-
Figure 37: Cost/Output/Area comparison of the different systems
Annual total energy output vs. system cost along with required area for the collectors may be observed in
above figure. The size of the circles indicates total area required for the collectors.
No incentive 10% 25% 50%
Purchase cost (Euro) 10977 9879 8233 5489
Maintenance / year (Euro) 36 36 36 36
Life span (years) 25 25 25 25
Salvage value (Euro) 3354 3354 3354 3354
Inflation 2% 2% 2% 2%
Interest rate 7% 7% 7% 7%
Electricity inflation 2% 2% 2% 2%
Electricity price/kWh 0.067 0.067 0.067 0.067
Annual fuel savings (Euro) 533.4 533.4 533.4 533.4
Solar energy cost/kWh 0.1 0.09 0.08 0.05
Payback period (years) 35 25 18 7
Net present value (Euro) -1091 6.48 1653 4397
Table 12: Financial analysis of PV/T in presence of incentives
Given the unit electricity price in UAE and relatively high prices of PV/T collectors, investing in a PV/T
system doesn’t come out economically feasible under UAE conditions. However, if there would be
incentives on sustainable energy systems, the outcome of economical feasibility analysis would be
different. Only 10% percent incentive on the purchasing cost of the system makes it economically feasible,
where an incentive of 50% decreases the payback period to 7 years.
Base Case
Unglazed PV/T
(85% SF) Case 5
Glazed PV/T
(85% SF)
Case 2
Solar thermal
(85% SF) Case 3
Solar thermal
(50% SF)
Case 4
PV
(35% SF)
(SF: Solar Fraction)

-35-
5 Conclusion
A comprehensive study is made to reveal the characteristics of PV/T collectors and methods to evaluate
their performance. An important outcome of the project has been the completion of a test setup with all
necessary instruments to test the performance of PV/T collectors and determining guidelines for
evaluating the performance of PV/T collectors. Furthermore, the set up may also be used to perform
thermal performance analyses on other types of collectors with small modifications.
The thermal performance of the PV/T collector is put to test according to the methodology detailed in
EN 12975-2. Collector coefficients for the collector output model suggested in EN 12975-2 are
determined. These coefficients may be used to predict the thermal output of the collector by taking
different sets of ambient conditions such as the irradiance, ambient temperature, humidity, wind speed etc.
as inputs to the collector model. Since a standard is followed to evaluate the thermal performance of the
collector, specific climate effects, such as sand and dust accumulation on the collector, are not taken into
account. It would be proper to comment that the performance of any solar collector will decrease in time
due to sand accumulation on collector surface, if not maintained properly.
It is observed that by combining thermal and electrical aspects of solar panels, an increase in electrical
output is experienced due to the reason that the water circulation through the collector decreases the
overall temperature of solar cells, which lead to a performance increase in terms of electricity production.
This effect is experienced in the experiments that are conducted on the PV/T module, an increase in
electrical output is recorded when there is a flow through the collector in comparison to the case where
there is no flow through.
Simulations for a PV/T system designed for residential in UAE revealed that PV/T systems are cost-wise
less efficient than alternative solar energy systems given the ambient conditions and economic factors like
electricity unit price in UAE. However, this may change in the future due to the fact that PV/T systems
are a newer type of technology compared to other solar energy systems and like any other technological
product, production and market costs are subject to decrease as the technology matures and economies of
scale come into effect.
The benefits of PV/T systems are reaped most when there is a demand for both electricity and heat. It is
observed that the electricity output of a PV/T collector is already greater than a similar sized PV collector.
Adding the thermal output to that, having a PV/T system is most advantageous there is a demand for heat
as well besides the increased electricity output. If there is a demand for heat only, having a solar thermal
system would be more appropriate due to greater thermal performance and better economic feasibility of
solar thermal systems. In case of electricity demand only, designing a PV system would be more suitable
due to lower costs although PV/T systems offer better performance in electricity production.
Finally, it is noted that incentives towards sustainable energy systems significantly affect their economic
feasibility. Since sustainable energy systems do have an aspect strongly related to environmental and social
responsibility, policies toward encouragement of implementations of sustainable energy systems hold an
important value for extending their use. In that case, improvements in economic feasibility of sustainable
energy systems will be highly probable with the maturity of technology and economies of scale.
Acknowledgments: I would like to express my sincere gratitude to all individuals who have contributed
to this thesis work. I would like to thank my industrial supervisor Mr. Manoj Kumar Pokhrel for his
guidance and extensive support throughout the thesis period; my department supervisor Dr. Nabil
Kassem for his counseling and advisement; my friends Mr. Rajesh Reddy and Mr. Prageeth Rathnasooriya
for sharing their expertise and aiding me when needed. Special thanks to CSEM-uae for providing me
with technical and financial assistance and to Wiosun for providing the PV/T collectors that are used in
the experiments. Very special thanks to my wife, family and friends, who have been there for me and gave
invaluable support motivating me to complete the project. Any short comings here are, mine alone.

-36-
Bibliography
A review on photovoltaic thermal collectors. Singh, Baljir. 2009. s.l. : Journal of Renewable and Sustainable
Energy, 2009.
A review on photovoltaic/thermal hybrid solar technology. Chow, T.T. 2009. s.l. : Elsevier, 2009.
Collector test method under quasi-dynamic conditions according to the European Standard EN 12975-2. Fischer, S.
2003. 2003, Elsevier.
EN.12975-2. 2006. Thermal solar systems and components - Solar collectors - Part 2: Test methods.
Brussels : European Committee for Standardization, 2006.
Epp, Baerbel. 2010. Global Solar Thermal Energy Council. [Online] 2010.
http://solarthermalworld.org/content/hot-water-demand-120-litres-day-person.
Estidama, Sustainable Buildings and Communities Program for Abu Dhabi. 2008. Design Guidelines
for Residential and Commercial Buildings. Abu Dhabi : s.n., 2008.
Flat-plate PV-Thermal collectors and systems: A review. Zondag, H.A. 2005. s.l. : Elsevier, 2005.
Hybrid Photovoltaic-Thermal Collectors: A Review. Ramos, Figueiredo. 2010. s.l. : Polytechnic Institute of
Guarda, School of Technology and Management, Portugal, 2010.
IEA. 2007. solar heating and cooling programme. 2007.
McCutcheon, S.C., Martin, J.L, Barnwell, T.O. Jr. 1993. Handbook of Hydrology. New York : McGraw-
Hill, 1993.
Olsson, Olle. 2011. On concentrating PV/T collectors, Absolicon. Stockholm, February 2011.
Photovoltaic modules and their applications: A review on thermal modelling. Mishra, R.K. 2011. s.l. : Elsevier, 2011.
Photovoltaic thermal (PV/T) collectors: A review. Kalogirou, S.A. 2006. s.l. : Elsevier, 2006.
Photovoltaic thermal module concepts and their performance analysis: A review. Hasan, M. Arif. 2010. s.l. : Elsevier,
2010.
PV Catapult, D8-6. 2005. PVT performance measurement guidelines. s.l. : EU, 2005.
PV Catapult, EU 6th Framework. 2006. PV/T Roadmap. EU 6th Framework Programme. 2006.
Roof Integrated Solar Absorbers The Measured Performance of “Invisible” Solar Collectors. Colon, C.J. 2001.
Washington, D.C. : Solar Forum, 2001.
Smil, Vaclav. 2006. Energy at the Crossroads. Paris : OECD Global Science Forum Conference, 2006.
—. 1991. General Energetics Energy in the Biosphere and Civilization. New York : John Wiley, 1991.
Solar thermal collector yield – experimental validation of calculations based on steady-state and quasi-dynamic test
methodologies. Horta. 2008. Lisbon : Eurosun, 2008.
Test Facility For Quasi Dynamic Collector Tests For The Characterization Of Thermal Solar Collectors In Accordance
With The International Norms. Kratzenberg. 2003. Pernambuco : Metrologia, 2003.
—. Kratzenberg. 2003. Pernambuco : Metrologia 2003, 2003.
UAE National Bureau of Statistics. 2011. National Bureau of Statistics. [Online] 2011.
http://www.uaestatistics.gov.ae/.

-37-
Annex A
Selected data points for Multiple Linear Regression
DAY H M S T in T out T amb rel. humid wind v flow Global irr Diffuse irr d Tm/d t
262 8 57 8 36.0 37.6 32.4 59.93 0.23 3.14 601.07 183.10 0.00080
262 9 14 32 36.1 38.4 32.8 58.93 0.21 3.15 664.75 187.01 0.00048
262 14 53 5 35.8 38.4 34.1 58.62 0.66 3.15 705.03 189.82 -0.00004
262 9 44 52 35.2 38.7 33.3 57.75 0.68 3.16 772.90 190.73 -0.00026
262 10 7 43 35.1 39.1 33.6 56.78 0.23 3.16 835.37 196.22 0.00024
262 10 37 27 35.1 39.5 33.4 57.33 0.38 3.15 907.60 196.81 0.00037
262 11 5 13 35.1 39.9 33.6 57.92 0.85 3.16 963.52 198.55 0.00004
262 11 15 52 35.1 40.2 34.2 57.65 0.37 3.14 971.56 199.33 0.00041
262 11 48 48 35.1 40.3 34.2 57.41 1.22 3.14 1005.89 200.15 0.00004
264 9 26 31 49.3 50.3 38.5 20.97 0.60 3.18 720.88 184.87 0.00043
264 9 34 21 48.9 50.0 38.6 20.56 0.30 3.19 750.05 185.84 0.00065
264 9 43 42 49.3 50.4 39.0 19.30 0.31 3.20 779.70 186.07 0.00035
264 10 12 11 49.3 50.5 38.7 23.02 0.17 3.21 869.50 191.92 0.00039
264 11 1 21 49.4 50.8 38.9 23.82 0.58 3.20 971.69 197.06 0.00043
264 11 40 32 49.4 50.9 39.0 22.13 0.42 3.20 1018.16 195.85 0.00089
265 9 21 10 44.6 45.6 36.8 21.10 1.50 3.19 722.97 190.48 0.00009
265 9 36 9 44.6 46.3 37.7 18.77 1.09 3.20 770.41 192.18 0.00043
265 9 51 9 44.5 46.7 38.1 17.17 1.09 3.19 815.48 191.77 0.00035
265 10 11 9 44.5 46.9 39.2 15.58 1.48 3.21 864.75 191.85 0.00054
265 10 26 9 44.5 47.4 39.7 15.05 1.44 3.20 897.74 192.56 0.00011
265 10 56 34 44.5 47.9 38.6 21.86 0.37 3.19 946.17 196.00 0.00015
265 11 21 34 44.5 48.0 38.6 21.23 0.44 3.19 983.31 197.59 -0.00035
265 11 36 34 44.6 48.2 38.9 19.40 0.56 3.20 1002.07 196.76 0.00030
265 11 56 34 44.7 48.4 37.7 21.50 0.41 3.20 1024.16 194.22 0.00026
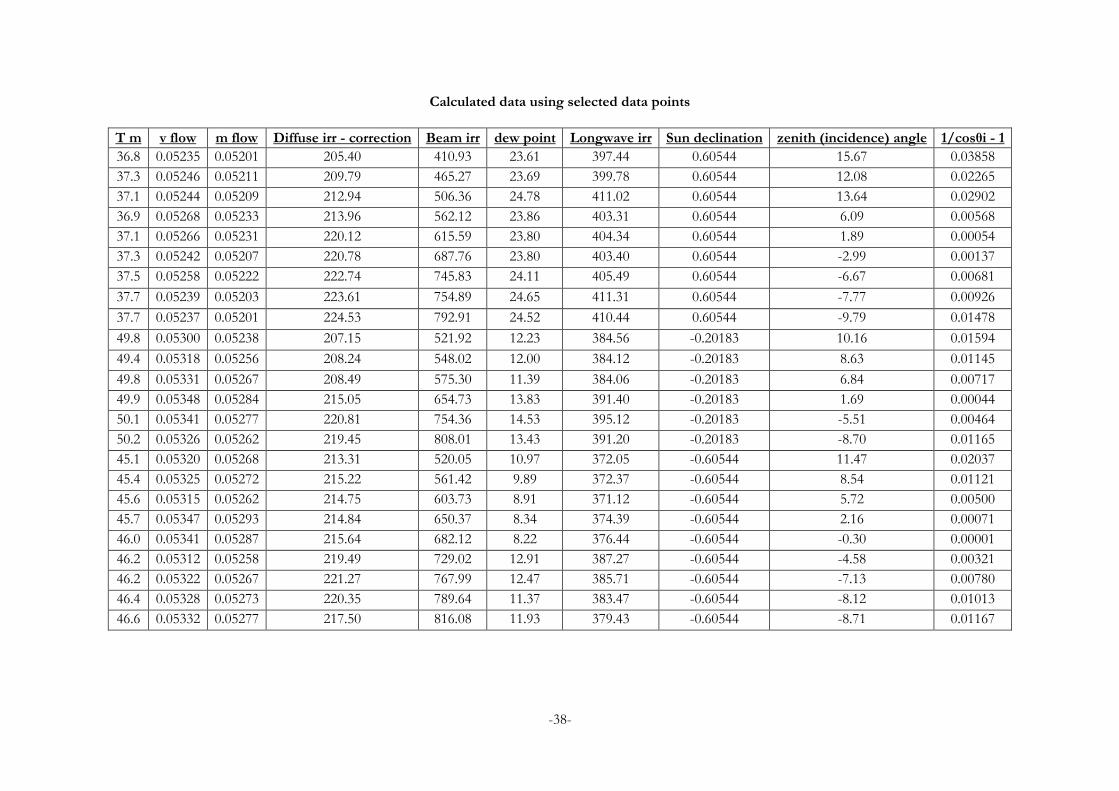
-38-
Calculated data using selected data points
T m v flow m flow Diffuse irr - correction Beam irr dew point Longwave irr Sun declination zenith (incidence) angle 1/cosθi - 1
36.8 0.05235 0.05201 205.40 410.93 23.61 397.44 0.60544 15.67 0.03858
37.3 0.05246 0.05211 209.79 465.27 23.69 399.78 0.60544 12.08 0.02265
37.1 0.05244 0.05209 212.94 506.36 24.78 411.02 0.60544 13.64 0.02902
36.9 0.05268 0.05233 213.96 562.12 23.86 403.31 0.60544 6.09 0.00568
37.1 0.05266 0.05231 220.12 615.59 23.80 404.34 0.60544 1.89 0.00054
37.3 0.05242 0.05207 220.78 687.76 23.80 403.40 0.60544 -2.99 0.00137
37.5 0.05258 0.05222 222.74 745.83 24.11 405.49 0.60544 -6.67 0.00681
37.7 0.05239 0.05203 223.61 754.89 24.65 411.31 0.60544 -7.77 0.00926
37.7 0.05237 0.05201 224.53 792.91 24.52 410.44 0.60544 -9.79 0.01478
49.8 0.05300 0.05238 207.15 521.92 12.23 384.56 -0.20183 10.16 0.01594
49.4 0.05318 0.05256 208.24 548.02 12.00 384.12 -0.20183 8.63 0.01145
49.8 0.05331 0.05267 208.49 575.30 11.39 384.06 -0.20183 6.84 0.00717
49.9 0.05348 0.05284 215.05 654.73 13.83 391.40 -0.20183 1.69 0.00044
50.1 0.05341 0.05277 220.81 754.36 14.53 395.12 -0.20183 -5.51 0.00464
50.2 0.05326 0.05262 219.45 808.01 13.43 391.20 -0.20183 -8.70 0.01165
45.1 0.05320 0.05268 213.31 520.05 10.97 372.05 -0.60544 11.47 0.02037
45.4 0.05325 0.05272 215.22 561.42 9.89 372.37 -0.60544 8.54 0.01121
45.6 0.05315 0.05262 214.75 603.73 8.91 371.12 -0.60544 5.72 0.00500
45.7 0.05347 0.05293 214.84 650.37 8.34 374.39 -0.60544 2.16 0.00071
46.0 0.05341 0.05287 215.64 682.12 8.22 376.44 -0.60544 -0.30 0.00001
46.2 0.05312 0.05258 219.49 729.02 12.91 387.27 -0.60544 -4.58 0.00321
46.2 0.05322 0.05267 221.27 767.99 12.47 385.71 -0.60544 -7.13 0.00780
46.4 0.05328 0.05273 220.35 789.64 11.37 383.47 -0.60544 -8.12 0.01013
46.6 0.05332 0.05277 217.50 816.08 11.93 379.43 -0.60544 -8.71 0.01167

-39-
Annex B
Electrical output of the 1st PV/T collector with and without water flow
Electrical output of the 2nd PV/T collector with and without water flow

-40-
Annex C
Polysun technical report for the designed PV/T system

-41-

-42-

-43-

-44-

-45-

-46-

-47-
Polysun financial report for the designed PV/T system

-48-

-49-

-50-

-51-

-52-

-53-

-54-