thermal barrier coatings – durability assessment and …643497/fulltext01.pdf · inconel 718...
TRANSCRIPT

Linköping Studies in Science and Technology.Dissertation No. 1527
Thermal Barrier Coatings– Durability Assessment and Life Prediction
Robert Eriksson
Department of Management and EngineeringLinköping University, 581 83, Linköping, Sweden
http://www.liu.se
Linköping, August 2013

During the course of the research underlying this thesis, Robert Eriksson wasenrolled in the graduate school Agora Materiae, a doctoral program within thefield of advanced and functional materials at Linköping University, Sweden.
Cover:Fractured plasma sprayed zirconia.
Printed by:LiU-Tryck, Linköping, Sweden, 2013ISBN 978-91-7519-569-8ISSN 0345-7524
Distributed by:Linköping UniversityDepartment of Management and Engineering581 83, Linköping, Sweden
© 2013 Robert ErikssonThis document was prepared with LATEX, August 20, 2013

Abstract
Thermal barrier coating (TBC) systems are coating systems containing a metal-lic bond coat and a ceramic top coat. TBCs are used in gas turbines for thermalinsulation and oxidation resistance. Life prediction of TBCs is important ashigh-temperature exposure degrades the coatings through mechanisms suchas thermal fatigue and the formation and growth of thermally grown oxides(TGOs). This thesis presents research on durability assessment and life pre-diction of air plasma sprayed TBCs.
The adhesion of thermal barrier coatings subjected to isothermal oxidation,thermal cycling fatigue and thermal shock was studied. The adhesion strengthand fracture characteristics were found to vary with heat treatment type.
The influence of interdiffusion between bond coat and substrate was stud-ied on TBCs deposited on two different substrates. The thermal fatigue life wasfound to differ between the two TBC systems. While fractography and nanoin-dentation revealed no differences between the TBC systems, the oxidation ki-netics was found to differ for non-alumina oxides.
The influence of bond coat/top coat interface roughness on the thermalfatigue life was studied; higher interface roughness promoted longer thermalfatigue life. Different interface geometries were tried in finite element crackgrowth simulations, and procedures for creating accurate interface models weresuggested.
The influence of water vapour and salt deposits on the oxidation/corrosionof a NiCoCrAlY coating and a TBC were studied. Salt deposits gave thicker TGOsand promoted an Y-rich phase. The effect of salt deposits was also evident forTBC coated specimens.
A microstructure-based life model was developed using the Thermo-Calcsoftware. The model included coupled oxidation-diffusion, as well as diffusionblocking due to the formation of internal oxides and pores. The model pre-dicted Al-depletion in acceptable agreement with experimental observations.
iii


Preface
This thesis summarises the work I have done during my time as a Ph.D. studentat Linköping University, 2008–2013. The thesis consists of two parts. The sec-ond part, which is the main part of the thesis, consists of seven scientific papersthat summarises my work during the research project. The first part of the the-sis gives background to the research and provides general information aboutthe topics studied more in detail in the appended papers. The first part alsogives the necessary knowledge for the non-specialist reader. The introductoryparts of this thesis is based on my licentiate thesis High-temperature degrada-tion of plasma sprayed thermal barrier coating systems from 2011.
Many thanks to my supervisor, Sten Johansson, and others involved in theresearch project, Håkan Brodin, Sören Sjöström, Xin-Hai Li and Lars Östergren,for their help and support over the years.
I would also like to thank my many colleagues at the Division of EngineeringMaterials for contributing to such a nice work environment full of creativity,intellect, curiosity and humour. I would especially like to thank Kang Yuan withwhom I have had the opportunity to cooperate during my last years as a Ph.D.student.
Robert Eriksson
v


List of papers
The thesis is based on the following papers:
I. R. Eriksson, H. Brodin, S. Johansson, L. Östergren, X.-H. Li, “Influence ofisothermal and cyclic heat treatments on the adhesion of plasma sprayedthermal barrier coatings”, Surf. Coat. Technol., vol. 205, pp. 5422–5429,2011.
II. R. Eriksson, H. Brodin, S. Johansson, L. Östergren, X.-H. Li, “Fractograph-ic and microstructural study of isothermally and cyclically heat treatedthermal barrier coatings”, Surf. Coat. Technol., in press.
III. R. Eriksson, S. Johansson, H. Brodin, E. Broitman, L. Östergren, X.-H.Li, “Influence of substrate material on the life of atmospheric plasmasprayed thermal barrier coatings”, Surf. Coat. Technol., in press.
IV. R. Eriksson, S. Sjöström, H. Brodin, S. Johansson, L. Östergren, X.-H. Li,“TBC bond coat-top coat interface roughness: influence on fatigue lifeand modelling aspects”, To be published.
V. R. Eriksson, H. Brodin, S. Johansson, L. Östergren, X.-H. Li, “Cyclic hotcorrosion of thermal barrier coatings and overlay coatings”, Proceedingsof the ASME Turbo Expo 2013.
VI. K. Yuan, R. Eriksson, R. Lin Peng, X.-H. Li, S. Johansson, Y.-D. Wang, “Mod-eling of microstructural evolution and lifetime prediction of MCrAlY coat-ings on nickel based superalloys during high temperature oxidation”, Surf.Coat. Technol., in press.
VII. R. Eriksson, K. Yuan, S. Johansson, R. Lin Peng, “Microstructure-basedlife prediction of thermal barrier coatings”, Presented at MSMF7, 2013,To appear in Key Engineering Materials.
vii


Acknowledgements
This research has been funded by the Swedish Energy Agency, Siemens Indus-trial Turbomachinery AB, GKN Aerospace Engine Systems, and the Royal Insti-tute of Technology through the Swedish research programme TURBO POWER,the support of which is gratefully acknowledged.
Kang Yuan, Mikael Segersäll, Jan Kanesund and Ru Lin Peng are acknowl-edged for contributing to Fig. 5, 6 and 7.
ix


Acronyms
APS air plasma sprayBC bond coatBRT burner rig testCTE coefficient of thermal expansionCVD chemical vapour depositionEB-PVD electron beam physical vapour depositionEBSD electron backscatter diffractionEDS energy dispersive spectroscopyFCT furnace cycle testFE finite elementFEA finite element analysisFEM finite element methodHVOF high-velocity oxy-fuel sprayInCF intrinsic chemical failureMICF mechanically induced chemical failurePBR Pilling-Bedworth ratioPS plasma sprayPVD physical vapour depositionRE reactive elementSEM scanning electron microscopeTBC thermal barrier coatingTC top coatTCF thermal cycling fatigueTCP topologically close-packedTET turbine entry temperatureTGO thermally grown oxideVPS vacuum plasma sprayWDS wavelength dispersive spectroscopyY-PSZ yttria partially stabilised zirconiaYAG yttrium aluminium garnetYAP yttrium aluminium perovskite
xi


Contents
Abstract iii
Preface v
List of papers vii
Acknowledgements ix
Acronyms xi
Contents xiii
Part I Background and theory 1
1 Introduction 31.1 Background . . . . . . . . . . . . . . . . . . . . . . . . . . . . . . . . 3
1.1.1 Gas turbine development towards higher efficiency . . . . . 31.1.2 The importance of coatings . . . . . . . . . . . . . . . . . . . 5
1.2 Aim of this work . . . . . . . . . . . . . . . . . . . . . . . . . . . . . . 7
2 Materials for high temperature applications 92.1 Physical metallurgy of systems containing Ni, Co, Fe, Cr and Al . . 9
2.1.1 Base materials . . . . . . . . . . . . . . . . . . . . . . . . . . . 92.1.2 Overlay coatings . . . . . . . . . . . . . . . . . . . . . . . . . 12
2.2 Thermal barrier coating systems . . . . . . . . . . . . . . . . . . . . 122.2.1 Top coat materials . . . . . . . . . . . . . . . . . . . . . . . . 152.2.2 Bond coat materials . . . . . . . . . . . . . . . . . . . . . . . 17
2.3 Manufacturing of TBCs . . . . . . . . . . . . . . . . . . . . . . . . . 192.3.1 Microstructure of thermal spray coatings . . . . . . . . . . . 20
xiii

3 Oxidation of coatings 233.1 Formation of a protective oxide scale . . . . . . . . . . . . . . . . . 233.2 The reactive element effect . . . . . . . . . . . . . . . . . . . . . . . 283.3 Breakdown of the protective oxide scale . . . . . . . . . . . . . . . . 29
4 Thermal fatigue of coatings 314.1 Crack nucleation mechanisms . . . . . . . . . . . . . . . . . . . . . 334.2 Crack growth mechanisms . . . . . . . . . . . . . . . . . . . . . . . 344.3 Coating life assessment . . . . . . . . . . . . . . . . . . . . . . . . . 36
4.3.1 Microstructure-based life models . . . . . . . . . . . . . . . 364.3.2 The NASA model . . . . . . . . . . . . . . . . . . . . . . . . . 374.3.3 Model suggested by Busso et al. . . . . . . . . . . . . . . . . 374.3.4 Model suggested by Brodin, Jinnestrand and Sjöström . . . 38
5 Experimental methods 415.1 Thermal fatigue . . . . . . . . . . . . . . . . . . . . . . . . . . . . . . 415.2 Corrosion test . . . . . . . . . . . . . . . . . . . . . . . . . . . . . . . 435.3 Adhesion test . . . . . . . . . . . . . . . . . . . . . . . . . . . . . . . 445.4 Microscopy . . . . . . . . . . . . . . . . . . . . . . . . . . . . . . . . . 46
5.4.1 Specimen preparation . . . . . . . . . . . . . . . . . . . . . . 465.4.2 Scanning electron microscopy . . . . . . . . . . . . . . . . . 46
5.5 Interface roughness measurement . . . . . . . . . . . . . . . . . . . 47
6 Discussion of appended papers 49
Bibliography 57
Part II Appended papers 67
Paper I: Influence of isothermal and cyclic heat treatments on the adhe-sion of plasma sprayed thermal barrier coatings 71
Paper II: Fractographic and microstructural study of isothermally and cy-clically heat treated thermal barrier coatings 81
Paper III: Influence of substrate material on the life of atmospheric plas-ma sprayed thermal barrier coatings 93
Paper IV: TBC bond coat-top coat interface roughness: influence on fa-tigue life and modelling aspects 105
xiv

Paper V: Cyclic hot corrosion of thermal barrier coatings and overlay coat-ings 127
Paper VI: Modeling of microstructural evolution and lifetime predictionof MCrAlY coatings on nickel based superalloys during high tempera-ture oxidation 137
Paper VII: Microstructure-based life prediction of thermal barrier coat-ings 151
xv


Part I
Background and theory


1Introduction
1.1 Background
The technology of gas turbines arose during the early to mid 1900s [1] and isnow commonly used for power production and aircraft propulsion. Gas tur-bines are closely integrated in today’s society and technology, and the develop-ment towards higher efficiency and fuel economy is naturally desirable [1–3].
Fig. 1 shows two examples of gas turbines: Fig. 1 a) shows a stationary gasturbine for power production, and Fig. 1 b) shows an aircraft engine. Fig. 1 alsomarks the major parts of a gas turbine: 1) the compressor, which compressesthe air, 2) the combustor, in which air and fuel are mixed and ignited, and 3)the turbine which drives the compressor and provides the power output for, forexample, electric power production. The latter two, combustor and turbine,operate in a very demanding high-temperature environment.
1.1.1 Gas turbine development towards higher efficiency
Since the performance of gas turbines depends on the temperature in the tur-bine part of the gas turbine [4], an increase in efficiency can be achieved by in-creasing combustion temperature [5–9]. Consequently, the development of gasturbines has driven the service temperature to higher and higher levels. Fig. 2shows an example from the aircraft industry where the turbine entry tempera-ture (TET) has kept increasing since the 1940s.
Increasing operating temperatures offer several challenges in the field of en-gineering materials. As the operating temperature is driven to higher levels,material issues such as oxidation, corrosion, creep and loss of strength are in-evitable [4, 9–12]. The state-of-the-art metallic materials for high temperatureapplications, the superalloys, are already operating at their maximum capacity
3

a) compressor combustor turbine
b) compressorcombustor turbine
Figure 1: Gas turbines for power production and aircraft propulsion. a) Land-based gas turbine, SGT 750, for power production, (courtesy of Siemens Indus-trial Turbomachinery). b) Aircraft engine RM 12, used in JAS 39 Gripen, (cour-tesy of Volvo Aero Corporation).
and further increase in operating temperature cannot be achieved by further al-loy development alone [4, 8, 10, 13–15]. This is illustrated in Fig. 2 which showsthe capability of typical superalloys compared to the TET; as seen, the TET nowexceeds the material capability.
Furthermore, the increasing demand for a more energy sustainable and en-vironmental friendly society has drawn attention to the use of bio-fuels in gasturbines [16]. The incorporation of bio-fuels in gas turbine technology maycause changes in the operating conditions in the turbine which may also haveconsequences for the metallic materials used there.
4

800
1000
1200
1400
1600
Tem
pera
ture
,°C
1940 1950 1960 1970 1980 1990 2000 2010Year
TETMaterial capability
air cooling
thermal barrier coatings
Figure 2: The increase in turbine entry temperature (TET) over time. The graphalso shows the temperature the material can withstand. Adapted from Reed [4].
The current and future research on gas turbine technology is therefore large-ly influenced by the striving for higher fuel efficiency, lower emissions and theability to use renewable fuels in gas turbines. The Swedish research programmeTURBO POWER, of which the research presented in this thesis is a part, aimsat achieving this. The programme is run as a collaboration between SiemensIndustrial Turbomachinery, GKN Aerospace Engine Systems, the Swedish En-ergy Agency and several Swedish universities. The research programme TURBOPOWER seeks to:
• Improve fuel efficiency of power-producing turbomachines, thereby re-ducing emissions and decreasing environmental strain.
• Improve fuel flexibility by making possible the use of alternative fuels.
• Reduce operating costs of power-producing turbomachines.
By developing technology and generating knowledge for university and in-dustry, TURBO POWER will contribute to a more sustainable and efficient en-ergy system in Sweden. The research aims at being applicable and governed byneeds.
1.1.2 The importance of coatings
As the temperature approaches the upper limit of material capability, phenom-ena such as creep, loss of mechanical properties, oxidation and corrosion occur
5

rapidly and limit the life of metallic materials [7, 9, 10, 13, 17–19]. As an exam-ple, Fig. 3 shows the variation of tensile strength with temperature for somecommon superalloys. As seen in Fig. 3, superalloys cannot maintain their ten-sile strength at temperatures typical in gas turbine combustors and turbines;the combustion temperature of gas turbines is even approaching the meltingtemperatures of the base-elements in superalloys (nickel, cobalt and iron), seeFig. 3.
0
200
400
600
800
1000
1200
1400
1600
1800
tens
ilest
reng
th,M
Pa
0 200 400 600 800 1000 1200 1400 1600temperature, ◦C
Haynes 230
Hastelloy X
Waspaloy
Inconel 718
Inconel 939
Inconel 738
melting temp. of Ni, Co and Fe
combustion temp.
precipitation hardenedsolid-solution strengthened
Figure 3: Tensile strength of some superalloys as function of temperature.
By lowering the temperature below the point at which the alloys lose theirengineering properties, they can still be used as structural materials. The highoperating temperatures of today’s gas turbines – and the even higher temper-atures of tomorrow’s gas turbines – are made possible by the use of air coolingand thermal insulation in the form of thermal barrier coatings (TBC) [4, 8, 10,13–15]. Air cooling, if too ample, has the disadvantage of reducing the achiev-able efficiency increase somewhat [13, 20] while thermal barrier coatings offeran effective mean to provide insulation and oxidation resistance [5–8, 14, 18].
Fig. 4 a) shows a schematic drawing of a thermal barrier coating system;the three parts of a thermal barrier system are: 1) substrate (component), 2)bond coat (BC), and 3) top coat (TC); with time at high temperature, a layerof thermally grown oxides (TGO) develops between the bond coat and the topcoat [7].
The top coat is made of a ceramic material with low heat conductivity andthus provides the necessary thermal insulation. The metallic bond coat en-sures good adhesion of the ceramic coating and provides oxidation resistance[12, 17]. The effect of applying a TBC system onto a gas turbine componentis illustrated in Fig. 4 b): the top coat introduces a temperature gradient and
6

a)
substrate (component)
bond coat thermally grown oxides
top coat
hot combustion gases oxygen b)
0
200
400
600
800
1000
1200
1400
tem
pera
ture
,◦ C
distance from surface
hot
com
bust
ion
gase
s
top
coat
bond
coat
subs
trat
e(c
ompo
nent
)
cool
ing
air
Figure 4: Thermal barrier coating system. a) The parts of a thermal barrier coat-ing system. b) The temperature through a coated component in a gas turbine.Based on Stöver and Funke [5].
hence enables high combustion temperatures while avoiding high temperaturedegradation of metallic parts.
The use of TBCs in gas turbines is, however, not entirely without its prob-lems. Since the ceramic top coat and metallic bond coat have different coeffi-cient of thermal expansion (CTE), stresses arise in the bond coat/top coat in-terface due to temperature variations (such as start and stop of the turbine).Stresses are also introduced in the interface due to growth of the TGO layer.The interface stresses eventually lead to failure of the TBC by spallation of thetop coat, which deprives the TBC system of its heat insulating capability.
1.2 Aim of this work
Thermal barrier coating systems currently offer an effective method for increas-ing gas turbine combustion temperature and thereby increasing efficiency [4,8, 10, 13, 14]. To fully utilise protective coatings in gas turbines, reliable life pre-diction of TBCs must be achieved [5, 14, 17]. TBCs are only beneficial as long asthey adhere to the metallic parts which they are meant to protect. Understand-ing of the failure mechanisms of TBCs and the development of life models aretherefore important areas of research [4, 5, 12, 17].
The current research project has involved studies that contributed to theunderstanding of: TBC durability, methods for evaluation of TBC life and dura-bility, and life modelling aspects. The performed research has aimed at devel-oping and improving life models for air plasma sprayed TBCs in gas turbines.For this purpose, the research project has involved testing of several differentcoating systems as well as the use of diverse testing methods.
7

Evaluation of durability of TBCs has included: isothermal oxidation, fur-nace cycling, burner rig test, corrosion test, adhesion tests on thermally de-graded specimens, nanoindentation as well as microscopy studies on micro-structure and oxide composition and growth kinetics. The study includes theinvestigation of several degrading mechanisms of TBCs during isothermal andcyclic high-temperature exposure: fatigue damage, interface TGO growth, in-fluence of substrate material on life, influence of BC/TC interface roughness onlife, and cracking and sintering of the top coat. Life prediction was tried bothfrom a fracture mechanics point of view and from an oxidation/interdiffusion-based point of view.
8

2Materials for high temperature
applications
High temperature materials are materials that can operate at temperatures clo-se to their melting temperatures while still maintaining many of the typicalroom temperature characteristics of engineering materials, such as high stre-ngth and microstructural stability [4, 10, 11].
The base material makes up the structural parts of the gas turbine and theirchemistry may often be chosen for good mechanical properties rather than re-sistance to environmental degradation, i.e. oxidation and corrosion [11]. Threeclasses of alloys: Ni-base, Co-base and Fe–Ni-base, collectively referred to assuperalloys, have shown to have good to excellent high temperature proper-ties and are widely used as base material for high temperature applications[4, 10, 11].
2.1 Physical metallurgy of systems containing Ni, Co,Fe, Cr and Al
2.1.1 Base materials
In superalloys, the solid-solution γ-Ni phase – which has the face centred cubic(FCC) atomic arrangement – constitutes the matrix phase. Ni-base superalloyscan be solid-solution strengthened, such as Haynes 230 and Hastelloy X, or pre-cipitation hardened, such as Waspaloy and Inconel 738, 939 and 718. As seenin Fig 3, precipitation strengthened alloys typically have higher strength thansolid-solution strengthen alloys and are used in more demanding high tem-perature environments [11]. Solid-solution strengthened materials have ad-
9

vantages when it comes to processing and have, for example, better weldabil-ity [11]; they can also be manufactured in complex geometries from powdersthrough laser melting techniques, see for example Saarimäki [21].
For solid-solution strengthened alloys, the alloying elements are chosen fr-om Fe, Co, Cr, Mo, W, Ti and Al [10]. Al, Cr, W and Mo are potent solid-solutionstrengtheners largely due to their different atomic radius compared to Ni [10].For precipitation hardened alloys the alloying elements are typically chosenfrom: Al, Ti, Ta, and sometimes Nb which promotes the formation of the γ′
or γ′′ precipitates in the γ-matrix [4, 10, 11], shown in Fig. 5. In addition, minoramounts of elements like Hf, Re, Zr, C and B may be added for various purposes.The compositions of some common Ni-base alloys are given in Table 1.
2 µm
a)
γ/γ′
γ′
2 µm
b)
γ γ′
TCP
Figure 5: Some microconstituents in Ni-base alloys. a) Inconel 792 showing γ′
precipitates in a matrix of γ with secondary γ′. b) CMSX-4 showing γ′ precipi-tates in a γ-matrix; some TCF phases can also be seen.
Table 1: Composition of some Ni-base alloys
Alloy Ni Co Fe Cr W Mo Al Ti Nb Ta Si C B
Haynes 230 57a 5b 3b 22 14 2 0.3 – – – 0.4 0.1 0.015b
Hastelloy X 47a 1.5 18 22 0.6 9 – – – – 1b 0.1 0.008b
Inconel 738 61.4a 8.5 – 16 2.6 1.75 3.4 3.4 0.9 1.75 – 0.17 0.01Inconel 939 47.3a 19 0.5b 22.5 2 – 1.9 3.7 1 1.4 0.2b 0.15 0.01Inconel 718 52.5 1b 18.4a 19 – 3.1 0.5 0.9 5.1 – 0.35b 0.08b 0.006b
Waspaloy 58a 13.5 2b 19 – 4.3 1.5 3 – – 0.15b 0.08 0.006
a balanceb maximum
The γ′ phase is an aluminide with formula Ni3(Al,Ti); the Al and Ti may besubstituted by Ta and Nb, and the Ni can, to some extent, be substituted by Co
10

or Fe [11]. The γ′ phase is an ordered phase with the L12 structure. The mor-phology of the γ′ precipitates depends on their mismatch with the surround-ing parent lattice and includes: cubical, small spherical particles and arraysof cubes [4, 11]. Modern precipitation hardened alloys may contain & 60 % γ′
[4, 11]. An interesting characteristic of γ′ is its increasing tensile strength withincreasing temperature [11].
For Ni–Fe alloys, such as Inconel 718, the addition of Nb may cause the pre-cipitation of γ′′-Ni3Nb [10, 11] which acts as the primary strengthening micro-constituent. Alloys that rely on the strengthening from γ′′-Ni3Nb are limitedto operating temperatures below ∼ 650 °C as the tetragonal γ′′-Ni3Nb other-wise will transform to a stable orthorhombic δ-Ni3Nb which does not add tostrength [11].
The addition of C and B enables the formation of carbides and borides.Carbide formers include Cr, Mo, W, Nb, Ti, Ta and Hf, which form carbides ofvarious stoichiometry, such as MC, M23C6 and M6C. Common boride formersare Cr and Mo, which form M3B2; boron tends to segregate to grain bound-aries [10, 11]. Carbon and boron performs an important role as grain bound-ary strengtheners and are consequently added in greater amounts to polycrys-talline alloys [4].
MC carbides typically form at high temperatures, for example during solid-ification and cooling in the manufacturing process, while M23C6 and M6C format lower temperatures: 750–1000 °C [10]. The MC carbide typically forms fromTi, Hf and Ta [4, 11], while the M23C6 is promoted by high Cr contents and theM6C is promoted by large fractions of W and Mo [10]. The MC carbide may formwithin grains as well as at grain boundaries; the M23C6 carbides are preferablyformed at grain boundaries.
The MC carbides may decompose to form M23C6 and M6C carbides duringhigh temperature exposure during operation or heat treatment [22, 23]. Thefollowing reactions have been suggested [10]:
MC+γ M23C6 +γ′ (A)
MC+γ M6C+γ′ (B)
A group of intermetallics generally considered harmful to Ni-base alloys,are the topologically close-packed (TCP) phases, such as the σ phase. Thesephases may form in alloys rich in Cr, Mo and W [4]. The σ phase has the generalformula (Cr,Mo)x(Ni,Co)y [10]; it may have a plate or needle-like morphologyand may appear in grain boundaries, sometimes nucleated from grain bound-ary carbides [10, 11].
11

2.1.2 Overlay coatings
Overlay coatings are deposited on top of the substrate without interacting muchwith the substrate [13, 24]. This can be contrasted to diffusion coatings whichare coatings that are formed through interdiffusion with the substrate and thecoating is formed as the coating elements interact with the substrate [13, 24].
Overlay coatings are deposited by methods such as plasma spraying (PS),electron beam physical deposition (EB-PVD) and high velocity oxy-fuel spray-ing (HVOF). These deposition methods use alloy feedstocks and the depositedcoating may therefore have a composition completely different from the sub-strate. Overlay coatings are often chosen from the MCrAlX family of alloyswhere M is either Ni, Co or Fe or a combination of them; X denotes additionsof reactive elements (RE), which in various ways improve the properties of thecoating.
As for the base material, MCrAlX coatings consist of a γ-matrix with thealuminium largely bound in aluminides. The γ′ aluminide may be present inthe microstructure, but for such large amounts of Al as are commonly used inMCrAlX alloys, another aluminide forms: β-NiAl [15, 25]. For MCrAlX coat-ings, most of the aluminium is bound in this phase and the two main micro-constituents of many MCrAlX coatings are γ and β. In addition, MCrAlX maycontain chromium rich σ−(Cr,Co) and α-Cr [25]. The latter may occasionallyprecipitate in the β phase [25, 26]. Thus, a typical MCrAlX alloy may have mi-crostructures such as: γ+β or γ/γ′+β/α both with the possible addition ofσ−(Cr,Co) [12, 27–29].
Fig. 6 shows the phases present at high temperature for the Ni–Cr–Al sys-tem with different additions of Co. Fig. 7 and 8 shows the microstructure of twoMCrAlX coatings which have been cooled in air from high temperature; the fig-ures show how electron backscatter diffraction (EBSD) and energy dispersivespectroscopy (EDS) can be used to identify the γ, γ′, β and σ phases.
2.2 Thermal barrier coating systems
A protective coating for high temperature applications must lower the temper-ature of the substrate and provide the oxidation and corrosion resistance whichthe base material lacks. The requirements on a protective coating can be sum-marised as [13]:
• The coating must have low thermal conductivity.
• The coating needs to have good oxidation and corrosion resistance.
12

• A protective coating must have high melting temperature and retain itsstructural integrity in the full interval of operating temperatures.
• The coating should have a coefficient of thermal expansion close to thesubstrate on which it is deposited to avoid thermal mismatch.
As no single material possesses all of those properties, protection of super-alloys is typically achieved by material systems containing an insulating coating(top coat) deposited on top of an oxidation resistant coating (bond coat). Thebond coat also provides adhesion of the top coat to the substrate. A TBC systemis shown in Fig. 9.
T=1100 oC10 wt.% Co
wt.% Al0 5 10 20 3015 25
wt.%
Cr
0
30
5
10
15
20
25
b)
γ
γ + β
βγ +
γ'
γ'γ' + β
γ + γ' + β
T=1100 oC20 wt.% Co
wt.% Al0 5 10 20 3015 25
wt.%
Cr
0
30
5
10
15
20
25
d)
γγ + β
β
γ +
γ'
γ'
γ' + β
γ +
γ' +
β
T=950 oC20 wt.% Co
wt.% Al0 5 10 20 3015 25
wt.%
Cr
0
30
5
10
15
20
25
c)
γ + β
β
β + σ
γ + β + σ
γ
γ +
γ'
γ'
γ' + β
γ + γ' +
β
T=950 oC10 wt.% Co
wt.% Al0 5 10 20 3015 25
wt.%
Cr
0
30
5
10
15
20
25
a)
γ
γ +
γ'
γ'γ' + β
γ + γ' +
βγ +
β
β
β + σ
γ + β + σ
Figure 6: Phase diagrams for some NiCoCrAl alloys established by Thermo-Calc. a) NiCrAl + 10 wt.% Co at 950 °C b) NiCrAl + 10 wt.% Co at 1100 °C c) NiCrAl+ 20 wt.% Co at 950 °C d) NiCrAl + 20 wt.% Co at 1100 °C
13

5 µm
a) b)
c) d)
γ
γ′β
BCC
FCC
Al Cr
Figure 7: Microstructure in a NiCoCrAlY coating analysed by EBSD and EDS: a)electron micrograph, b) EBSD results showing crystal structure, c) EDS resultsshowing Al content, and d) EDS results showing Cr content.
50 µm
a)
γβ
σ
b)
γβ
σ
Figure 8: Microstructure in a NiCoCrAlY coating analysed by EBSD: a) electronmicrograph, b) phases identified by EBSD.
14

μ100 msubstrate
BC
TGO
TC
Figure 9: The components in a thermal barrier system: substrate, bond coat(BC), thermally grown oxides (TGO) and top coat (TC).
2.2.1 Top coat materials
The top coat is the part of the TBC system that provides thermal insulation. Asany insulation, the top coat must be combined with internal cooling to keepthe temperature low in the substrate; the top coat only introduces a steep tem-perature gradient. The temperature drop in a top coat, 300µm in thickness, canbe as high as 200–250 °C [4, 7, 11, 13].
The 6–8 wt.% yttria partially-stabilised zirconia (Y-PSZ) has arisen as the in-dustry standard for top coat material [30]. This is largely due to its combinationof low thermal conductivity and relatively high coefficient of thermal expansion[7, 30]. The software CES provides a convenient tool for illustrating this; Fig. 10shows a diagram of thermal conductivity and thermal expansion for a numberof technical ceramics and some Ni-based alloys; it can be seen that zirconia hasthe desired combination of low thermal conductivity and high thermal expan-sion.
Pure zirconia (ZrO2) is allotropic: monoclinic up to 1170 °C, tetragonal inthe interval 1170–2370 °C and cubic up to the melting point at 2690 °C. The tet-ragonal to monoclinic transformation is martensitic in nature and involves a3–5 % volume increase that induces internal stresses which compromise thestructural integrity of the ceramic [13, 31]. The tetragonal–monoclinic trans-formation is problematic since it occurs in the range of the operating tempera-tures in gas turbines.
The detrimental phase transformation can be avoided by stabilising the tet-ragonal phase. Various oxides, such as CaO, MgO, Y2O3, CeO2, Sc2O3 and In2O3
15

Thermal expansion coefficient (µstrain/°C)0.2 0.5 1 2 5 10 20
Th
erm
al c
on
du
ctiv
ity
(W/m
.°C
)
1
10
100
aluminaberylliaboron carbide/nitridegraphitemagnesiamullitesapphiresilicasilicon carbide/nitridetungsten carbidesialon
zirconia
nickel alloys
Figure 10: Thermal conductivity and thermal expansion coefficient for zirconiacompared to some other ceramics and Ni-alloys. Chart from CES EduPack 2012,Granta Design Limited, Cambridge, UK, 2012.
[13, 15, 30], can be added to stabilise the tetragonal phase, but yttria has be-come the most common. The optimum amount of 6–8 wt.% of yttria is basedon the work of Stecura [32] who showed that TBCs with∼ 6 wt.% had the highestfatigue life in a thermal cycling test; see Fig. 11.
The phase being stabilised by the addition of 6–8 wt.% Y2O3 is the non-transformable tetragonal phase, t′, which is stable from room temperature toapproximately 1200 °C [4, 7, 30]. The t′ phase is formed by rapid cooling dur-ing coating deposition and is a metastable phase [30]. At high-temperature ex-posure, the t′ phase starts to transform to the equilibrium tetragonal and cu-bic phases. The t′ cubic+ tetragonal transformation occurs as the Y-PSZ isonly partially stabilised. The addition of & 11 wt.% Y2O3 would stabilise thecubic phase from room temperature to the melting temperature and thus en-able higher operating temperatures, but, as shown by Fig. 11, that would givea shorter fatigue life. The high-temperature transformation of t′ cubic +tetragonal enables the undesired tetragonal monoclinic transformation oncooling [33]. Hence, there exists an upper limit to the practical operating tem-perature of partially-stabilised zirconia.
16

50
100
150
200
250
300
350
400
Cyc
les
tofa
ilure
0 5 10 15 20 25wt.% Y2O3
Figure 11: The thermal fatigue life of yttria-stabilised zirconia as function ofyttria content. Adapted from Stecura [32]
2.2.2 Bond coat materials
While the Y-PSZ top coat provides the necessary thermal insulation, it does notoffer any protection against oxidation and corrosion. The Y-PSZ coating readilylets oxygen through and causes the underlying metal to oxidise [30]. To preventthe substrate from oxidising, an oxidation resistant bond coat is incorporatedbetween the substrate and the top coat. The bond coat is chosen from alloyswith excellent oxidation properties. Furthermore, the bond coat improves ad-hesion between the top coat and the substrate, particularly for plasma sprayedcoatings.
While bond coats can be made from diffusion coatings [34], overlay coatingsare probably the most used and most developed for use as bond coats. Overlaycoatings enable elaborate alloy design as overlay coatings are independent inchemistry from the substrate on which they are deposited; therefore, numerousvariations on the MCrAlX concept exist: Ni–(0–30 wt.% Co)–(10–30 wt.% Cr)–(5–20 wt.% Al)–(. 1 wt.% Y) covers the range of many bond coat compositions.Bond coat alloys contain the addition of one or several reactive elements. Thepurpose of the REs is often to improve oxide scale adhesion; even RE additionsin the order of ∼ 0.1 wt.% may increases adhesion of the Al oxide scale [35]. Yis the most widely used (typically . 1 wt.%) [7, 9, 12, 17, 30, 36, 37], but othercommon additions include: Ce, Hf, Zr, Si, La, Re and Ta [13, 22, 30, 36].
MCrAlY coatings achieve oxidation and corrosion resistance through the
17

formation of a protective oxide scale in the bond coat/top coat interface. Suchprotective scales need to be: stable at high temperatures, dense, slow-growingand exhibit good adhesion to the coating [15]. Three oxides, alumina (Al2O3),chromia (Cr2O3) and silica (SiO2), have the potential to fulfil these require-ments [15, 38]. At temperatures common in gas turbines, a continuous layerof alumina is usually the most beneficial for TBC life [11, 12].
The necessary ability to form a layer of protective alumina influences thechoice of chemistry for these alloys. The interfacial TGO is protective only aslong as it consists of predominantly Al2O3, and as long as it is intact and adher-ent to the bond coat. The chemistry of the bond coat must be chosen to assurethat: 1) aluminium is the preferred oxidising species, 2) the alumina has goodadherence to the bond coat and 3) the alumina is reformed if it is damaged.A prediction of what kind of oxides an alloy will form can be obtained by anoxide map, such as the one showed in Fig. 12 for the Ni–Cr–Al system. Thereexists a critical Al content below which alumina cannot be formed. For exam-ple, Fig. 12 shows that ∼ 20 wt.% Al, (∼ 35 at.% Al), is needed to ensure Al2O3growth in a Ni–Al system. However, the addition of Cr promotes the formationof a protective Al2O3 scale [15]; with the addition of 5 wt.% Cr, (∼ 5 at.%), thealloy can form Al2O3 at an Al content as low as ∼ 5 wt.%, (∼ 10 at.%).
0
10
20
30
40
40
10
0
20
30
60 70 80 90 100
at.%
Cr at.%
Al
at.% Ni
Al2O3
Cr2O3 NiO
Figure 12: Oxide map for the Ni–Cr–Al system at 1000 °C. Areas denoted Cr2O3and NiO may also give internal oxidation of Al2O3. Based on Wallwork and Hed[39].
Al and Cr are consequently added in amounts of ≥ 5 wt.% to improve oxida-tion and corrosion resistance by assuring the formation of a protective aluminascale. The composition of the bond coat must also be chosen to account for the
18

depletion of aluminium during high temperature exposure by consumption ofAl through oxidation and interdiffusion with the substrate; most bond coatsare consequently quite rich in Al [30]. As the Al content in the coating drops,the β and γ′ phases will dissolve [22]. Two possible decomposition routes are[11, 15, 26, 40]:
β γ (C)
β γ+γ′ γ (D)
2.3 Manufacturing of TBCs
TBC systems are manufactured by methods belonging to process families suchas thermal spraying, physical vapour deposition (PVD) and chemical vapourdeposition (CVD). The group of manufacturing methods collectively referredto as thermal spraying includes processes such as plasma spraying and high-velocity oxy-fuel spraying, both commonly used for manufacturing of TBC sys-tems [5, 7, 14, 19, 30]. Plasma spraying can be conducted in air or in vac-uum and is, accordingly, referred to as atmospheric plasma spraying (APS) andvacuum plasma spraying (VPS) or, alternatively, low pressure plasma spraying(LPPS).
The raw materials for manufacturing of bond coats and top coats are typi-cally in powder form. The plasma spray process uses a plasma jet to melt thefeedstock powder into droplets which are sprayed onto the substrate: powderis introduced by a carrier gas into the plasma jet, melted and propelled towardsthe substrate [19]. The characteristics of plasma sprayed coatings are largelyinfluenced by spraying conditions such as plasma jet velocity and the dropletdwell time in the plasma jet [19].
plasma gas cathode
cooling water
powder inlet
anodeplasma flame
spray stream
Figure 13: Schematic drawing of a plasma gun. Based on Ref. [41].
A schematic drawing of a plasma gun is shown in Fig. 13. The plasma gas, forexample argon, is brought into the plasma gun and led through an electric field
19

that ionises the gas to produce plasma; the plasma may reach temperatures ashigh as 20000 °C [19]. Due to the high temperature, the anode is water cooledand the cathode is typically made from tungsten which has a sufficiently highmelting temperature and is a good thermionic emitter [19].
2.3.1 Microstructure of thermal spray coatings
The plasma spraying process gives rise to a very characteristic microstructurewhere droplets from the spraying process can be discerned as flat, so called,splats. As the molten droplets impact on the substrate, they form thin disc-shaped splats which cool on impact and solidify rapidly; for metal coatings,with a speed of up to 106 K/s [19].
Atmospheric plasma sprayed metallic coatings have microstructures thatinclude constituents such as splats, oxide inclusions/stringers, pores and un-melted or partially melted particles. The microstructural characteristics of anAPS deposited bond coat are shown in Fig. 14 a) and can be contrasted to a VPSdeposited bond coat, shown in Fig. 14 b), whose characteristic features are theabsence of oxide stringers and lower porosity. The lower oxide fraction in VPScoatings are caused by the spraying being performed in vacuum. The HVOFprocess produces metallic coatings similar in appearance to the VPS coating.
For ceramic coatings, the rapid solidification typically causes a columnargrain structure within each splat [42, 43], shown in Fig. 15 a). The typical splat-on-splat structure is easily seen in Fig. 15 b) where it can also be seen that thesplats segment by forming a cracked-mud-like pattern of microcracks. Suchcracking is due to stresses caused by contraction during the rapid cooling ofthe splat [42]. Fig. 15 b) also shows interlamellar delaminations [30, 42, 44–46]. These crack-like voids are caused by the low area of contact between splatswhich may be as low as 20 %[47]. Both the splat microcracks and interlamellardelaminations can be readily seen on cross-sections, as shown in Fig. 15 c).The APS process also gives rise to porosity, see Fig. 15 d). In the top coat, suchporosity is desirable as it decreases the thermal conductivity of the coating [30].Porosity levels in TBCs typically lie in the interval 5–20 %.
20

μ μ50 m
a)
substrate
BC
TC
A
A
A
100 m
b)
substrate
BC
TC
Figure 14: Microstructure of plasma sprayed MCrAlY coatings. a) APS coat-ing showing oxide inclusions/stringers, arrows, and partially melted particles,marked by A. b) VPS coating without oxide stringers and with lower porosity.
μ μ
μ μ
1 m
a)
5 m
b)
A
B
C
5 m
c)
A
B
50 m
d)
D
Figure 15: Microstructural characteristics of an APS top coat. a) Columnar grainstructure in a splat. b) Fractured top coat showing the splat-on-splat structure,C; interlamellar delaminations, B; and cracking of the splats, A. c) Cross-sectionof a top coat showing interlamellar delaminations, B, and through-splat cracks,A. d) Cross-sectioned top coat showing porosity, D.
21


3Oxidation of coatings
The oxidation kinetics of high temperature alloys typically obey an Arrhenius-type equation [48]
k = k0e− QRT (1)
where k is the oxide growth rate constant, Q is the activation energy, T the tem-perature in K, R = 8.314 J/(mol K) is the gas constant and k0 is a constant. Oxi-dation rate consequently increases exponentially with temperature and oxida-tion at high temperatures may be very fast. The formation of a protective layerof BC/TC interface TGOs is essential for oxidation resistance but is a sacrificialprocess during which the coating is consumed. Oxidation is a degrading mech-anism that will eventually lead to the breakdown of the protective TGOs andmight induce failure of TBCs.
The oxidation of the BC can be divided into three stages, shown in Fig. 16:1) a transient stage of simultaneous oxidation of all oxide-forming species inthe bond coat, 2) a steady-state stage of formation and growth of a protectiveoxide scale, and 3) a breakaway stage of rapid oxidation and spallation [38].The second stage gives rise to a protective oxide scale whereas the third stagecauses failure of the TBC system.
3.1 Formation of a protective oxide scale
The transient stage is the stage of oxidation before a continuous oxide layer hasformed on the metal surface and during which all oxide-forming species in thealloy (Ni, Co, Cr, Al) might form oxides. The composition of the transient ox-ides is influenced by parameters such as: temperature, partial oxygen pressure,
23

transient steady-state
breakaway
high temperature exposure time
oxid
e sc
ale
thic
knes
s
Figure 16: Schematic drawing of the three stages of oxidation: short stage oftransient oxidation, steady-state oxidation, and breakaway oxidation. Based onHindam and Whittle [38].
coating composition and coating microstructure [49]; low partial oxygen pres-sure, for example, may promote the formation of alumina [50]. Each element’saffinity for oxygen will determine how it forms oxides. An Ellingham diagram,such as the one in Fig. 17, provides information at which oxygen partial pres-sure an oxide can form according to [51]:
pM/MxOy
O2= exp
∆G◦
RT(2)
This is the dissociation pressure of the oxide; the partial pressure of oxygenmust be higher than the dissociation pressure for the oxide to form. An Elling-ham diagram can be used to rank the order in which the oxides will form; asseen in Fig. 17, Al will oxidise at lower oxygen partial pressure and thus oxidisesmore easily than, for example, Ni and Co.
The transient stage is usually quite short, typically . 1 h for Ni–Cr–Al sys-tems oxidised at 1000–1200 °C [52, 53]. Transient oxides include Cr2O3, NiO,CoO, spinel type (Ni,Co)(Cr,Al)2O4 and various forms of alumina: γ-, θ-, α-Al2O3 [40, 49, 52–55].
The transition from transient oxidation to the slower steady-state stage ofgrowth occurs when a continuous oxide layer is formed and the oxidation ratebecomes controlled by the diffusion rate of oxygen and metal ions throughthe oxide layer. Such diffusion controlled oxidation is typically described bya power-law expression:
hTGO = h0 +kt1n (3)
where hTGO is the thickness, (or weight gain per area), of the formed oxide, h0 isthe thickness of the transient oxides, k is the growth rate constant and t is the
24

-1200
-1000
-800
-600
-400
-200
0
Fre
een
ergy
offo
rmat
ionΔG
◦ ,kJ
400 600 800 1000 1200 1400 1600 1800Temperature, K
2 Ni + O2= 2 NiO
2 Co + O2= CoO2
43
Cr + O2=
23
Cr2O3
Si + O2= SiO2
43
Al + O2=
23
Al2O3
Figure 17: Ellingham diagram showing the free energy of formation of commonoxides in coatings.
high temperature exposure time. The classical oxidation law is parabolic (n = 2)[56] but subparabolic models (1/n < 0.5) are also in use [12, 57–59]; particularlythe cubic law (n = 3) has become common.
Protective oxide scales can be provided by Al, Cr and Si which form Al2O3,Cr2O3 and SiO2 [11, 12, 38]. At high temperature, Al2O3 is usually the protec-tive oxide. The use of Cr2O3-forming coatings is restricted to somewhat lowertemperatures, (. 950 °C [11, 15]), as Cr2O3 may decompose to volatile CrO3 andevaporate according to [11, 12, 60]:
Cr2O3(solid)+ 32 O2(gas) 2CrO3(gas) (E)
The use of SiO2-forming coatings is also limited to lower temperatures as theymay form low-melting or brittle phases [15].
A protective layer of interface Al2O3 can be seen in Fig. 18; Fig. 18 a) shows afracture surface produced by tearing off the top coat, thus exposing the under-lying interface TGO, and Fig. 18 b) shows a polished cross-section of a layer ofinterfacial TGO.
Minor amounts of oxides other than Al2O3 may also form in the BC/TCinterface [61]. Such oxides may, for example, form as a chromium rich layer
25

μ μ2 m
a)
TC
Al2O3
BC
1 m
b) TC
Al2O3
BC
Figure 18: Protective layers of thermally grown Al2O3 in the BC/TC interface.a) A torn off top coat reveals the interfacial TGO. b) A cross-section showing alayer of Al2O3.
between the Al2O3 and TC or as bulky clusters containing a mixture of sev-eral types of oxides: (Al,Cr)2O3, Ni(Al,Cr)2O4 and NiO [61]. Such clusters ofchromia–spinel–nickel oxide may form quite early during oxidation, and formin greater quantities with higher temperature, but may remain fairly constantonce formed [61].
During oxidation, the oxide can form either internally, as a subscale, or asan external scale, explained in Fig. 19. In order for the oxide layer to be protec-tive, it must be external; hence, in a Ni–Cr–Al system, the formation of an exter-nal Al2O3 scale must be promoted. There are several factors that influence theability of the alloy to form external alumina: oxygen partial pressure, amountof solved O in the alloy, amount of aluminium in the alloy and the amount ofother alloying elements, most importantly Cr.
The effect of Al content and O concentration in the alloy surface can be un-derstood by the following equation which gives the thickness, x, of the subscaleat time t in s [11].
x =(
2NODO t
νNM
) 12
(4)
NO is the mole fraction of oxygen in the metal at the surface, DO is the diffusivityof oxygen in the alloy, ν is the ratio of oxygen to metal atoms of the formedoxide and NM is the mole fraction of the oxide forming element (Al in the Ni–Alsystem). Fig. 20 shows the internal oxidation depth at 1000 °C as function of Alcontent for different O concentrations at the alloy surface: max solubility of Oin Ni, and 50 %, 20 % and 5 % of full solubility [62]. As can be seen, the subscalethickness decreases with increasing Al and decreasing O in the alloy; eventually,
26

x
a) b)atmosphere
alloy
oxide
oxide
atmosphere
alloy
Figure 19: Two types of oxidation: a) Internal oxidation: formation of a non-protective subscale. b) External oxidation: formation of a protective oxidescale.
0 5 10 15 20 25 30 35 400
5
10
15
Al content, at.%
Inte
rnal
oxi
datio
n de
pth,
µm
max solubility of O50 % of max O solubility20 % of max O solubility5 % of max O solubilityinternal to external
Figure 20: Subscale thickness as function of Al and O content. The hypotheticaltransition from internal to external oxidation is also marked.
a shift to external oxidation will occur. For Ni–Al, the amount of Al needed tocause a shift from internal to external oxidation is & 17 wt.% [10] as evidentfrom Fig. 12. The transition from internal to external oxidation may occur for[51]
NM >√πg NODOVal loy
2νDM Voxi de(5)
where g is the fraction of formed oxide at which the internal subscale becomescontinuous and rate controlling, DM is the diffusivity of the oxidising element
27

Figure 21: The Al activity in a Ni–Cr–5 wt.% Al system as function of Cr content.Data from Thermo-Calc.
and Val loy and Voxi de are the molar volumes of the alloy and the oxide respec-tively. Fig. 20 shows hypothetical transitions from internal to external scaleswith g arbitrary set to g = 0.3 and DM taken as a rule-of-mixture mean of thediffusivity in γ with 30 % β.
The addition of Cr to the Ni–Al system may also promote the formation ofexternal Al2O3 through several mechanisms. As shown in Fig. 12, the additionof 5 wt.% Cr, (∼ 5 at.%) enables the alloy to form Al2O3 at an Al content as lowas ∼ 5 wt.%, (∼ 10 at.%). Chromium may, for example, act as a getter for oxygen[63] which lowers the O concentration at the alloy surface. As evident fromEq. 5 and Fig. 20, lowering NO makes it possible to form external Al2O3 at lowerAl contents. Another effect of Cr addition is its influence on Al activity. Thisis illustrated in Fig. 21 for a Ni–Cr–Al system with 5 wt.% Al at 1000 °C. The Alactivity has been calculated by Thermo-Calc as function of Cr content; it canbe seen that the addition of Cr increases Al activity.
3.2 The reactive element effect
Bond coat alloys contain minor additions of reactive elements, such as Y, Hf, Zr,Ce or La [13, 22, 30, 36]. REs are generally considered to improve the oxide scaleadhesion; several mechanisms have been suggested:
• REs tie up sulphur which would otherwise have segregated to the metal/-oxide interface and lowered the metal/oxide adhesion [30]. Lowering theS content in the alloy can have the same effect [64].
28

• REs may slow down oxidation by segregating to Al2O3 grain boundariesand slow down Al grain boundary diffusion [65]. REs thus alter the ox-ide growth mechanism from an outward growing to an inward growingoxide scale [35]. This also decreases spalling of the oxide by decreasinglateral growth of the oxide, which could have happened if simultaneouslyinward diffusion of O and outward diffusion of Al had occurred [35].
• REs may form oxides in the metal/oxide interface and mechanically pinthe oxide to the metal by so called pegging [49].
Y, which is the most common RE, readily forms oxides and may be found inthe Al2O3 scale as: yttria Y2O3, yttrium aluminium perovskite (YAP) YAlO3, andyttrium aluminium garnet (YAG) Y3Al5O12 [49].
3.3 Breakdown of the protective oxide scale
The TGO will remain protective only as long as the bond coat contains enoughAl to maintain a continuous alumina scale. During high-temperature expo-sure, aluminium will be depleted through oxidation and interdiffusion with thesubstrate [12, 37, 58]. An aluminium concentration of Ê3–5 wt.% is generallyenough to maintain the Al2O3 scale [10, 11, 66, 67]; for low Al contents, non-protective oxides may start to form in the BC/TC interface and the oxidationrate increases; this marks the onset of breakaway oxidation, or chemical fail-ure.
The chemical failure can be divided into two types: mechanically inducedchemical failure (MICF) and intrinsic chemical failure (InCF) [68]. MICF typi-cally occurs during thermal cycling where the protective oxide scale cracks oncooling and needs to be reformed; failure occurs when the Al content is too lowto heal/reform the protective alumina layer.
InCF occurs when the Al content beneath the oxide layer drops to such a lowlevel that the Al2O3 is no longer the thermodynamically preferred oxide. Thisoccurs at considerably lower Al contents then MICF. This results in the forma-tion of other oxides, either from the alloy or by decomposition of the aluminascale according to reactions such as [58]:
Al2O3 +2Cr Cr2O3 +2Al (F)
or
Al2O3 + 12 O2 +Ni NiAl2O4 (G)
The Al2O3 scale is thus replaced, or partially replaced, by a layer of chromia(Cr,Al)2O3, spinel (Ni,Co)(Cr,Al)2O4, nickel oxide and cobalt oxide [40, 50, 53,
29

69–71]. Internal oxidation of the remaining aluminium may also occur [69].These TGOs are not as protective as alumina and the layer of chromia andspinels has lower interfacial fracture resistance which may cause the top coatto spall on cooling [12, 40, 68, 69].
30

4Thermal fatigue of coatings
In addition to applied mechanical load, there are two sources for stresses in anAPS TBC system: 1) growth stresses in the interface TGO and 2) stresses thatdevelop on heating or cooling due to the mismatch in coefficient of thermal ex-pansion between the bond coat, interface TGO and top coat [30]. Both sourcesof stress act at the bond coat/top coat interface and failure of TBC systems con-sequently occurs by fracture in, or close to, the BC/TC interface [12].
Oxide growth stresses can partly be understood from the so called Pilling-Bedworth ratio, PBR, which is calculated as [72]
PBR = W d
wD(6)
where d and D are the densities of the metal and the oxide respectively, and wis the amount (weight) of metal necessary to produce the amount (weight) Wof oxide. A PBR < 1 gives tensile stresses in the oxide while a PBR > 1 givescompressive stresses (more so the higher the PBR). Table 2 shows the PBR forsome common oxides in coatings [51].
Table 2: PBR of some oxidescommon in coatings [51].
oxide PBR
Al2O3 1.28Cr2O3 2.07NiO 1.65CoO 1.86
Gas turbine starts and stops give cyclic variations in temperature and theresulting cyclic thermal stresses make the TBC system susceptible to fatigue.
31

The thermal mismatch stresses are often considered to be most harmful duringcooling [70, 73] as, during heating, stress relaxation may occur. During cool-ing, however, there is little time for stress relaxation and stresses develop in theBC/TC interface that depend on the temperature drop [70, 73]; for large tem-perature drops, the thermal mismatch stresses during cooling may dominateover the TGO growth stresses [30].
The stresses that develop due to thermal mismatch depend, in addition tothe temperature drop and the CTE mismatch, on BC/TC interface morphologyand the thickness of the interface TGOs [74]. The TGO thickness and composi-tion change as the TBC system is exposed to high temperature and thus affectthe BC/TC interface stresses.
A simplified description of the stresses that arise during thermal cycling ofa TBC system would be as follows [75]: When the TBC system is heated to hightemperature, stresses are introduced in the BC/TC interface due to the differ-ences in CTE between the bond coat and the top coat. These stresses are, partlyor entirely, reduced due to stress relaxation at high temperature [73]. Longhigh-temperature exposure causes the interface TGO to grow, resulting in TGOgrowth stresses, which may also relax at high temperature. At cooling, stressesare again introduced due to differences in the CTE, only now there is little timefor stress relaxation and stresses develop in the BC/TC interface.
In a rough BC/TC interface, with alternating peaks and valleys, thermal cy-cling would cause out-of-plane tensile stresses to form at the interface peaksand out-of-plane compressive stresses at interface valleys, as shown in Fig. 22 a).As the interface TGOs grow, the stress distribution will be affected as illustratedby Fig. 22 b) and c). A thicker layer of interface TGOs causes the compressivestresses at the valleys to shift to tensile stresses. Stresses formed through thismechanism will be able to propagate fatigue cracks in the vicinity of the BC/TCinterface, and, consequently, cause the TBC system to fail by fatigue.
as-sprayed
+- -
BC
TC
4 μm TGO
++
- -
BC
TC
8 μm TGO
+
-
+
-
BC
TCa) b) c)
Figure 22: Out-of-plane (vertical) stresses in the BC/TC interface. The com-pressive stresses at the valleys shift to tensile stresses as the TGO grow. Basedon Jinnestrand and Sjöström [75]
32

4.1 Crack nucleation mechanisms
The plasma spray process gives the top coat a very characteristic splat-on-splatstructure. The degree of inter-splat bonding can be rather modest which givesrise to many crack-like defects in the top coat, see Fig 15. These pre-existinginterlamellar delaminations in the top coat may act as crack embryos. Severalpapers have attributed crack nucleation to these pre-existing interlamellar de-laminations [50, 76–81].
Cracks have also been described to nucleate in the interfacial TGO duringcycling. Crack initiation in the BC/TC interface is most commonly attributedto peak and off-peak positions in the BC/TC interface [48, 82, 83]. There areseveral suggested explanations for this, such as:
1. Out-of-plane tensile stresses prevail at peak and off-peak positions.
2. During cycling, in-plane compressive growth stresses may cause the layerof interfacial Al2O3 to buckle and delaminate at peak positions. The TGOwill reform and the process is repeated. Such repeated delamination andregrowth will give rise to a layered TGO structure at peak positions, shownin Fig. 23 a), which may act as starting points for larger delaminationcracks [36, 82, 84, 85].
3. Cracks may nucleate in the TGO due to large growth stresses in the vo-luminous clusters of chromia and spinels, shown in Fig. 23 b), that mayform in addition to Al2O3 during high temperature exposure [50, 61, 80,81].
μ μ20 m
a) TC
BC
TGO
10 m
b) TC
BC TGO
Figure 23: Crack formation in the interfacial TGO. a) Repeated cracking andregrowth giving a layered structure in the TGO. b) Cracking in a cluster of chro-mia, spinels and nickel oxide.
33

4.2 Crack growth mechanisms
There are several micromechanic failure mechanisms described in literature;they differ in where the crack is assumed to have nucleated and the path ofthe growing crack, Fig. 24, 25 and 26 summarise some of these. Many of thesuggested failure mechanisms from the literature assume that crack nucleationand growth mechanisms act on a microscale, typically the scale of an interfacepeak and valley. It is then assumed that crack growth, as that on a microscale,occurs simultaneously throughout the BC/TC interface such that failure even-tually occurs by coalescence of microcracks causing the top coat to spall [12].It hence becomes sufficient to study crack growth only in a least representativecell. The BC/TC interface is often idealised as some periodic function, often asine wave, and the least representative cell typically includes a peak and a val-ley, similar to those shown in Fig. 24, 25 and 26.
The failure mode shown in Fig. 24 assumes crack initiation at peaks in asinusoidal BC/TC interface, Fig. 24 a). The crack path will then either follow theBC/TC interface, Fig. 24 b), or kink out in the TC, Fig. 24 c) [73, 86]. Such crackgrowth is assumed to occur at every peak in the BC/TC interface and failureoccurs when such microcracks meet and coalesce.
Fig. 25 shows a failure mode where crack nucleation occurs by opening ofthe pre-existing interlamellar delaminations in the top coat. Such crack em-bryos grow in the vicinity of BC/TC interface peaks and arrest as they encountera BC peak, Fig. 25 a). Meanwhile, the growth of the interface TGO will increasethe out-of-plane tensile stresses at off-peak positions, and when such stressesare high enough, cracks will nucleate in the TGO at peak positions, Fig. 25 b).The crack propagation then proceeds until several of these cracks coalesce andcause failure, Fig. 25 c) [76, 77].
Another mechanism, similarly, suggests that cracks initiate from pre-exist-ing delaminations in the top coat, but above the bond coat peak positions,Fig. 26 a). Such cracks initiate while the out-of-plane stresses are tensile at peakpositions but still compressive at valley positions, see Fig. 22 a). Since the crackscannot grow through the areas of compressive stresses at flank and valley po-sitions, the crack arrests until the growth of the TGO changes the compressiveflank and valley stresses to tensile stresses as illustrated by Fig. 22 b) and c).Crack growth occurs in the top coat and the failure occurs as these cracks coa-lesce, Fig. 26 b) [78, 79].
In addition to failure by the growth and coalescence of microcracks, failuremay also occur through growth of macrocracks from the edges of TBC coatedspecimens [87, 88]. Edge cracking occurs due to the stress concentration atthe TBC edge where the coating ends. Sjöström and Brodin [87] investigatedthe influence of the chamfer angle on the edge cracking of TBCs and found
34

bond coat
top coat
TGO
cracka)
bond coat
top coat
TGO
crackb)
bond coat
top coat
TGO
crackc)
Figure 24: Crack nucleation in the TGO, a), followed by either: b) crack growthin, or close to, the TGO, or c) crack growth by kinking out in the TC.
bond coat
top coat
TGO
cracka)
bond coat
top coat
TGO
crackb)
bond coat
top coat
TGO
crackc)
Figure 25: Crack nucleation in the top coat, a), followed by b) damage of TGOand c) crack growth.
bond coat
top coat
TGO
cracka)
bond coat
top coat
TGO
crackb)
Figure 26: Crack growth in the top coat: a) nucleation and b) growth.
chamfer angle0
o9060
o
bond coat
top coat
edge cracking
top coat
substrate
Figure 27: Edge cracking of TBCs.
35

that any chamfer angle larger than 60◦ gave essentially the same risk of edgecracking whereas an angle < 60◦ gave a lower risk of edge cracking, see Fig. 27.
The crack growth paths suggested in literature is evidently quite divers, rang-ing from entirely in the BC/TC interface to mixed interface/TC fracture to en-tirely in the TC. Fracture that occurs in the TC is referred to as white fractureand fracture that occurs in the BC/TC interface is called black fracture as thefracture surfaces will appear white and black respectively when examined op-tically. Fracture by cracks that grow partly in the BC/TC interface and partly inthe TC is referred to as mixed fracture.
Which failure mode, white, black or mixed, that results depends partly onthe thermal cycle. Trunova et al. [89] compared the fracture mode of TBC sys-tems subjected to thermal cycling with different dwell times. It was found thatlong dwell time gave mainly black fracture, intermediate dwell times gave mixedfracture and no dwell time gave white fracture. It was also noted that, as thedwell time decreases, the total number of cycles to failure increased and thecumulative high temperature exposure time decreased.
4.3 Coating life assessment
4.3.1 Microstructure-based life models
There are several microstructure- or composition-based life models for TBCs;they all rely on the tendency of TBC life to depend on TGO growth. Rabiei andEvans [77] showed, for example, that a TGO thickness in excess of ∼ 5.5µmcould be critical for TBCs. TBC life can thus be predicted from oxide growthmodelling.
Other models are in different way based on aluminium depletion of thebond coat. As the aluminium content reaches a critical value, the coating stopacting as an Al reservoir; the protective interface oxide layer can no longer bemaintained and chemical failure occurs [12, 39, 49, 66, 90–93]. By modellingoxidation and interdiffusion with the substrate, TBC life models have been es-tablished [66, 90, 92–99].
It is necessary to have a criterion for when the aluminium content becomestoo low. Since removal of Al from the coating causes dissolution of the β phase,the complete depletion ofβ phase, which can be observed from micrographs ofcross-sectioned specimens, can be used as a life criterion [12, 91–93]. In othercases, a critical Al content may be a more suitable criterion; Renusch et al. [66]suggested ∼ 3 wt.% as a critical Al content.
36

4.3.2 The NASA model
The NASA model [100] takes its starting point in a Coffin-Manson type expres-sion
N =(∆εi
∆ε f
)b
(7)
where N is cycles to failure, ∆εi is the inelastic strain range, ∆ε f is the inelasticstrain range that causes failure in one cycle and b is a constant. The effect ofhigh temperature exposure on life is included in∆ε f which is a function of TGOgrowth and the adhesion strength of the unoxidised TBC. The growth of theTGO influences life through the expression
∆ε f =∆ε f 0
(1− δ
δc
)c
+∆εi
(δ
δc
)d
(8)
where∆ε f 0 is the inelastic failure strain range for an unoxidised coating system,δc is the critical oxide layer for which the coating would fail in a single cycleand c and d are constants which are c ≈ d ≈ 1. The oxide thickness, δ, can beobtained from a power-law equation, see equation 3.
4.3.3 Model suggested by Busso et al.
Busso et al. [76] have suggested the following life model for APS TBCs:
dD = Dm(σmax
F
)pdN (9)
where 0 É D É 1 is a fatigue damage parameter such that D = 1 at failure, σmax
is the maximum out-of-plane interfacial stress, N is number of cycles and mand F are given by
m = 1−C
(σmax
σc0
)0.818p
(10)
and
F = F0 (1−F1σmax) (11)
37

where σc0 is the initial strength of the TBC and p, C , F0 and F1 are materialparameters that need to be calibrated to experimental data.
The fatigue damage is driven by the maximum out-of-plane stress, σmax,which is obtained from finite element analysis of a least representative cell of aTBC system. The σmax includes the combined stresses from the thermal cycle,oxide growth and sintering of the top coat according to [76, 101]
σmax =σtherm. +σox. +σsintr. (12)
whereσtherm.,σox. andσsintr. are functions of temperature cycle, cumulative ox-idation time and BC/TC interface morphology; they describe the out-of-planestress contributions from thermo-elastic and visco-plastic deformation, oxida-tion and sintering.
4.3.4 Model suggested by Brodin, Jinnestrand and Sjöström
Brodin, Jinnestrand and Sjöström [70, 73, 102] have developed a fracture me-chanics based life model using a Paris law type of equation:
dD
d N=C (λ∆G)n (13)
where G is the energy release rate and C and n are constants. D is a damageparameter which can contain contributions from cracks in the BC/TC interface,l TGO
i , in the top coat, l TCj , and cracks running partly in the top coat and in the
BC/TC interface, l TC/TGOk , according to
D =∑
i l TGOi +∑
j l TCj +∑
k l TC/TGOk
L(14)
where L is the total analysed length.The model involves cracks that partially, or completely, follow the BC/TC
interface; such cracks will grow in a mixed mode [73]. To account for mixedmode crack growth, G is multiplied by a mixed mode function, λ [103]:
λ= 1− (1−λ0)
(2
πtan−1
(∆K I I
∆K I
))m
(15)
where∆K I and∆K I I are the stress intensity factors in mode I and II, and λ0 andm are constants.
38

The influence of thermal loads, surface morphology and interface TGO gro-wth is included in the finite element calculation of ∆G and ∆KII/∆KI [73]. ∆Gis calculated by a virtual crack extension method. ∆KII/∆KI is calculated fromthe crack flank displacements using the theory of interface cracks suggested byHutchinson and Suo [103].
39

5Experimental methods
5.1 Thermal fatigue
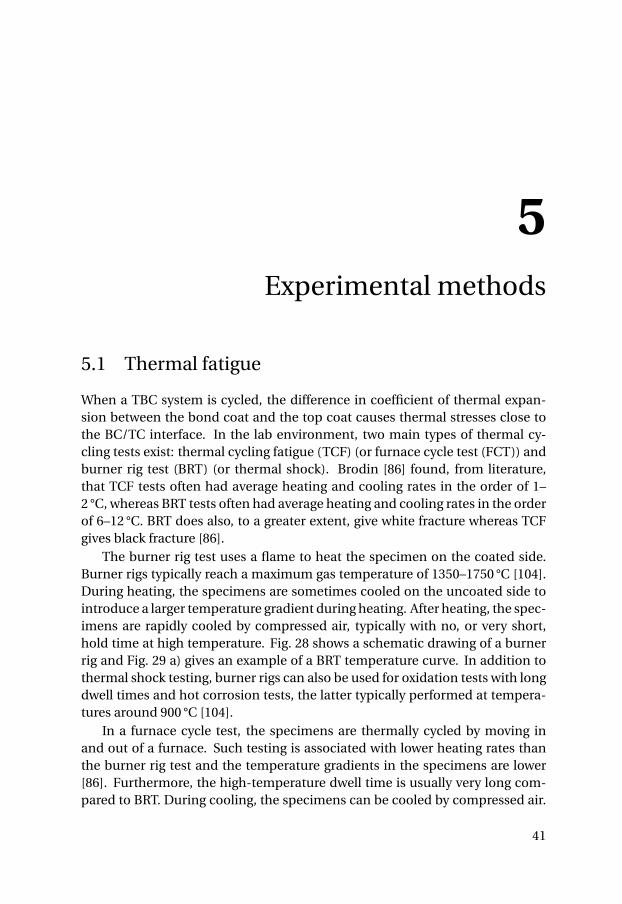
When a TBC system is cycled, the difference in coefficient of thermal expan-sion between the bond coat and the top coat causes thermal stresses close tothe BC/TC interface. In the lab environment, two main types of thermal cy-cling tests exist: thermal cycling fatigue (TCF) (or furnace cycle test (FCT)) andburner rig test (BRT) (or thermal shock). Brodin [86] found, from literature,that TCF tests often had average heating and cooling rates in the order of 1–2 °C, whereas BRT tests often had average heating and cooling rates in the orderof 6–12 °C. BRT does also, to a greater extent, give white fracture whereas TCFgives black fracture [86].
The burner rig test uses a flame to heat the specimen on the coated side.Burner rigs typically reach a maximum gas temperature of 1350–1750 °C [104].During heating, the specimens are sometimes cooled on the uncoated side tointroduce a larger temperature gradient during heating. After heating, the spec-imens are rapidly cooled by compressed air, typically with no, or very short,hold time at high temperature. Fig. 28 shows a schematic drawing of a burnerrig and Fig. 29 a) gives an example of a BRT temperature curve. In addition tothermal shock testing, burner rigs can also be used for oxidation tests with longdwell times and hot corrosion tests, the latter typically performed at tempera-tures around 900 °C [104].
In a furnace cycle test, the specimens are thermally cycled by moving inand out of a furnace. Such testing is associated with lower heating rates thanthe burner rig test and the temperature gradients in the specimens are lower[86]. Furthermore, the high-temperature dwell time is usually very long com-pared to BRT. During cooling, the specimens can be cooled by compressed air.
41

Fig. 30 shows a schematic drawing of furnace cycling and Fig. 29 b) shows atemperature curve.
airflow
flamefixture
TBCa)
airflow
fixture
TBCb)
Figure 28: Schematic drawing of a burner rig. a) Heating by a flame on thecoated side while cooling the uncoated side. b) The specimen is moved out ofthe flame and cooled by air.
a) b)
400
500
600
700
800
900
1000
1100
tem
pera
ture
,◦C
0 20 40 60 80 100 120 140 160time, s
heating
cooling
top coat temp.substrate temp.
0
200
400
600
800
1000
1200
tem
pera
ture
,◦C
0 10 20 30 40 50 60 70time, min
heating
cooling
Figure 29: Two thermal cycles. a) A burner rig cycle, based on Liu et al. [88]. b)A furnace cycle with forced air cooling.
furnace
specimens
a)
airflow
b)
Figure 30: Schematic drawing of a cyclic furnace. a) Dwelling in furnace duringthe hot part of the cycle. b) Cooling with air during the cold part of the cycle.
42

5.2 Corrosion test
Corrosion resistance evaluation of coatings may be conducted in many ways.Often, salt mixtures containing Na2SO4 are deposited onto the specimens inamounts of 0.075–5 mg/cm2 and in intervals of 20–100 h. Salt deposition canoccur with or without the addition of gaseous SO2 in the temperature interval700–1000 °C [105–111]. Table 3 summarises some of the corrosion conditionsencountered in literature for coatings [105–107, 110–112]. Water vapour hasalso shown to influence the corrosion rate. Testing conditions including 5–15 %water vapour at 800–1100 °C can be found in literature [64, 113–117].
A cyclic corrosion rig was built during the duration of the project to evalu-ate the corrosion properties of coatings. Fig. 31 shows the cyclic corrosion rigwhich operates by moving the furnace up and down. When in the lower posi-tion, the furnace covers the specimens; when in the upper position, the spec-imens are allowed to cool slowly in air; no forced airflow was used for cooling
furnace
moving lid
water inlet
specimens nozzles mov
ing
furn
ace
Figure 31: Cyclic corrosion rig.
43

Table 3: Some test parameters for corrosion, from literature [105–107,110–112].
Salt Amount salt,mg/cm2
Interval of saltdeposition, h
Total testduration, h
Temp.,°C
Na2SO4–20 mol% K2SO4 0.075–0.75 50 500 700–900Na2SO4–0–5 wt.% NaCl 2.5 24 168–312 900Na2SO4–50 wt.% V2O5 3–5 51 51 800Na2SO4–25 wt.% NaCl 2 20 100 900Na2SO4–K2SO4 1 100 300–500 950Na2SO4–10 wt.% NaCl 0.1 20 100–430 1000
47.6 47.8 48 48.2 48.4 48.6 48.8 49 49.20
100
200
300
400
500
600
700
800
Time, h
Tem
pera
ture
, ° C
Figure 32: A temperature cycle during cyclic corrosion; the sudden drop in tem-perature at the end of the cooling is due to salt-solution deposition.
in this rig. When the furnace is in its upper position, a lid closes to reduce heatloss in the furnace; attached to the lid are also a number of nozzles which spraysthe specimens with a corrosive substance. During the hot part of the cycle, theoption exists to spray water into the furnace which instantaneously evaporates.Fig. 32 shows the temperature curve measured on a specimen during a corro-sion cycle.
5.3 Adhesion test
A commonly used adhesion test procedure is to attach the coated and uncoatedsides of a button specimen to two bars, that can be mounted in a tensile testmachine, and load the coating until fracture. The set-up is schematically shownin Fig. 33. The tensile test machine must be equipped with universal joints toensure moment free mounting. The specimen is fastened to the bars by a suit-able adhesive, most commonly by epoxy which is cured at moderate temper-
44

atures (120–175 °C [19]). During curing, a slight compressive load is appliedto the bar/specimen/bar system to ensure good adhesion between fixture andspecimen. The method is described in ASTM C633 Standard test method foradhesion or cohesion strength of thermal spray coatings [118] as well as EN 582Thermal spraying – determination of tensile adhesive strength [119].
adhesive
coating
substrate
adhesive
bar
bar
Figure 33: Set-up for adhesion testing of TBCs. Based on Davis [19].
To ensure good results, the specimens need to be flat and the surfaces needto be clean and free from loose material; the coating may therefore have to beground or grit blasted. Furthermore, any coating overspray onto the sides ofthe button specimen, as well as beads of excessive adhesive at the joint, mustbe removed before testing. Even if great care is taken, some critical commentsto the method are [19]:
• Bending moments introduced by mounting in the tensile test machinewill give erroneous results. This is avoided by the use of a self-aligning fix-ture, as shown in Fig. 33, and by ensuring that the specimens are groundflat before bonding to the fixture.
• The type of adhesive will influence the result, as will the thickness of theadhesive film. In a porous coating, the penetration depth of the adhesivewill affect the results. These effects stress the importance of a consistentand repeatable curing procedure.
45

• The strength of the adhesive sets the upper limit for how strong coatingscan be tested.
• The tensile test is unsuitable for evaluation of very thin and very porouscoatings.
• Variation in coating thickness, distribution and size of defects in the coat-ing and residual stresses may give scattered data.
5.4 Microscopy
5.4.1 Specimen preparation
TBC systems are challenging to prepare for microscopy since the ceramic topcoat and TGOs may crack during polishing. Care must be taken not damage theceramic parts during specimen preparation since [19]:
1. Ceramic particles that come loose during polishing, pull-outs, may scra-tch the specimen.
2. Pull-outs in the top coat will make the top coat appear more porous, sothat the porosity of the top coat will be overestimated.
3. Cracking of the top coat and TGO during polishing makes it impossibleto determine the amount of damage that was caused by thermal cyclingof the TBC system.
To avoid damaging the TBC during specimen preparation, the TBC systemis infiltrated with epoxy in vacuum. The specimen is placed in vacuum andepoxy is poured over the specimen. The epoxy will penetrate the pores andcracks of the top coat and reduce the amount of damage introduced duringthe subsequent cutting, mounting and polishing. Would the top coat be dam-aged during the polishing, it is still possible to distinguish damage introducedby the thermal cycling as those cracks would be filled with epoxy and cracksintroduced during polishing would not.
5.4.2 Scanning electron microscopy
Scanning electron microscopy (SEM) offers, in addition to imaging, micro-a-nalysis tools such as energy dispersive spectroscopy (EDS) and wavelength dis-persive spectroscopy (WDS), as well as electron backscatter diffraction (EBSD),a tool for studying crystallographic structure and orientation.
46
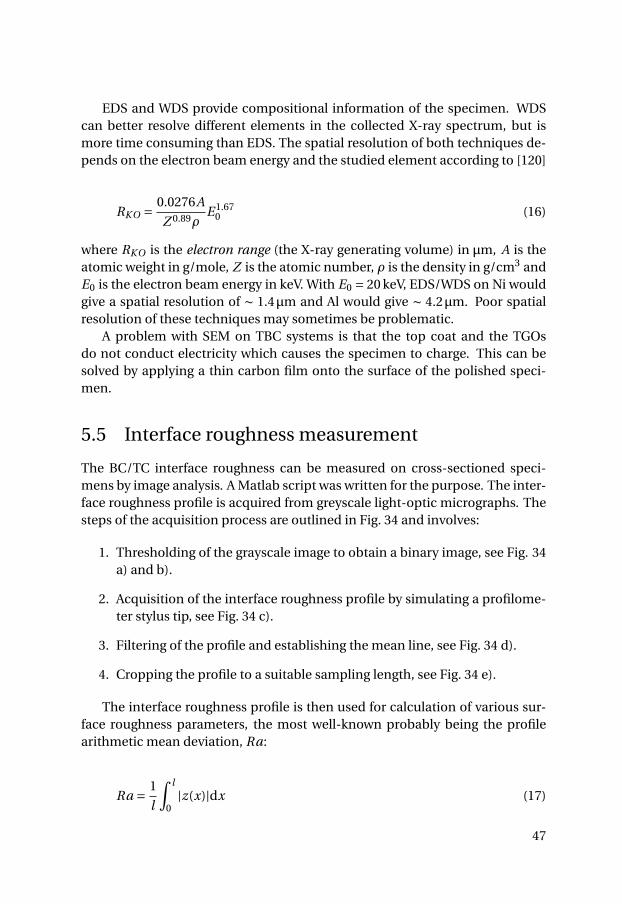
EDS and WDS provide compositional information of the specimen. WDScan better resolve different elements in the collected X-ray spectrum, but ismore time consuming than EDS. The spatial resolution of both techniques de-pends on the electron beam energy and the studied element according to [120]
RKO = 0.0276A
Z 0.89ρE 1.67
0 (16)
where RKO is the electron range (the X-ray generating volume) in µm, A is theatomic weight in g/mole, Z is the atomic number, ρ is the density in g/cm3 andE0 is the electron beam energy in keV. With E0 = 20 keV, EDS/WDS on Ni wouldgive a spatial resolution of ∼ 1.4µm and Al would give ∼ 4.2µm. Poor spatialresolution of these techniques may sometimes be problematic.
A problem with SEM on TBC systems is that the top coat and the TGOsdo not conduct electricity which causes the specimen to charge. This can besolved by applying a thin carbon film onto the surface of the polished speci-men.
5.5 Interface roughness measurement
The BC/TC interface roughness can be measured on cross-sectioned speci-mens by image analysis. A Matlab script was written for the purpose. The inter-face roughness profile is acquired from greyscale light-optic micrographs. Thesteps of the acquisition process are outlined in Fig. 34 and involves:
1. Thresholding of the grayscale image to obtain a binary image, see Fig. 34a) and b).
2. Acquisition of the interface roughness profile by simulating a profilome-ter stylus tip, see Fig. 34 c).
3. Filtering of the profile and establishing the mean line, see Fig. 34 d).
4. Cropping the profile to a suitable sampling length, see Fig. 34 e).
The interface roughness profile is then used for calculation of various sur-face roughness parameters, the most well-known probably being the profilearithmetic mean deviation, Ra:
Ra = 1
l
∫ l
0|z(x)|dx (17)
47

where l is the analysed length and z and x are explained by Fig. 34 e). A com-parison of Ra values, for some different surfaces, showed that the Ra valuesobtained by image analysis were in good agreement with those obtained by aprofilometer.
425 430 435 440 445 45085
90
95
100
105
0 100 200 300 400 500 600 700 800 90080
100
120
140
160
0 100 200 300 400 500 600 700 800 900−50
0
50
profilemean line
100 200 300 400 500 600 700 800−50
0
50
a)
b)
c)
d)
e)
stylus tipacquired profile
metal/ceramic interface
x, μm
x, μm
z, μ
mz,
μm
z, μ
m
z, μ
m
x, μm
x, μm
Figure 34: Roughness profile acquisition procedure: a) greyscale image, b) bi-nary image, c) stylus tip simulation, d) filtering and establishing mean line, ande) the obtained roughness profile.
48

6Discussion of appended papers
Paper I: Influence of isothermal and cyclic heat treat-ments on the adhesion of plasma sprayed thermal bar-rier coatings
The influence of different heat treatments on the adhesion properties of APSTBCs was studied with the aim of relating the adhesion strength of the TBC tohigh-temperature exposure and to the test method used. The studied TBC sys-tem consisted of a Hastelloy X substrate coated with an APS NiCoCrAlY bondcoat and APS Y-PSZ as top coat. The specimens were subjected to three differ-ent thermal treatments: isothermal oxidation, furnace cycling and burner rigtest; all at a temperature of ∼ 1100 °C. The adhesion of the coatings after ther-mal treatment was evaluated by the ASTM C633 method.
The differences between the thermal exposure conditions affected the mi-crostructure. Specimens subjected to the burner rig test developed a very thinTGO and were never depleted of the Al-rich β-phase. Furnace cycling andisothermal oxidation developed thicker TGO and were depleted of β-phase af-ter ∼ 100 h. Furnace cycling and isothermal oxidation also gave more pro-nounced interdiffusion with the substrate.
The adhesion of the isothermally heat treated specimens increased about50 % compared to specimens tested in the as-sprayed condition. Isothermallyoxidised specimens were also found to retain their adhesion strength with ox-idation time whereas the cyclic tests both decreased the adhesion with num-ber of cycles. The adhesion decrease of the two cyclic heat treatments was at-tributed to the fatigue damage introduced in the specimens during cycling.
The paper provides valuable information on how different test methods in-fluence the degradation of TBCs. If the decrease in adhesion is taken as an
49

indication of damage introduced in the TBC, then the tests, in increasing orderof severity, can be ranked as 1) isothermal oxidation, 2) furnace cycling and 3)burner rig test, for the same exposure time. However, the burner rig test gave aslower decrease of adhesion per cycle: ∼ 1.54 ·10−3 MPa/cycle, compared with∼ 20.44 · 10−3 MPa/cycle for furnace cycling. Hence, if the life is measured innumber of cycles, as opposed to time, the burner rig test gives longer lives thanfurnace cycling. This is consistent with the tendency for longer high tempera-ture dwell times to reduce the number of cycles to failure.
Paper II: Fractographic and microstructural study of is-othermally and cyclically heat treated thermal barriercoatings
A fractographic study was performed on fracture surfaces from adhesion testedTBC systems exposed to different heat treatments. The studied TBC systemconsisted of a Hastelloy X substrate coated with APS NiCoCrAlY and APS Y-PSZ. The coated specimens were heat treated at a temperature of ∼ 1100 °C byisothermal oxidation, furnace cycling and burner rig test. The top coats werepulled off the specimens in a tensile test machine and the resulting fracturesurfaces were studied.
The fracture occurred either almost entirely in the top coat or both in thetop coat and the BC/TC interface (mixed fracture); no specimen fractured en-tirely in the BC/TC interface. Isothermal oxidation gave fracture almost entirelyin the top coat while the two cyclic heat treatments gave mixed fracture. How-ever, even for cyclic heat treatment, > 80 % of the fracture occurred in the topcoat. The amount of BC/TC interface fracture did increase with number of cy-cles.
Regions where the fracture occurred in the top coat showed essentially thesame characteristics regardless of heat treatment; the fracture occurred mainlybetween the splats in the splat-on-splat structure typical for APS coatings. Thr-ough-splat fracture occurred sparingly and was often associated with disconti-nuities in the microstructure such as partially melted particles.
If the amount of interface fracture from the adhesion test is taken as an in-dication of the amount of interface damage in the specimen, isothermally ox-idised specimens were essentially undamaged at ∼ 300 h of exposure whereasthe furnace cycling test had developed some interface damage. The furnace cy-cle test had a larger increase in interface damage per cycle; it takes the burnerrig test ∼ 1000 cycles to reach the same damage as the furnace cycle test reachesin ∼ 300 cycles. Both cyclic tests reached the same amount of damage roughly
50
at the same fraction of their total lives; from experience, ∼ 300 cycles and ∼1000 cycles for TCF and BRT respectively corresponds to 30–50 % of the totallife. A microstructural study of the top coat also show that the short hold timesassociated with burner rig tests gave considerable less sintering of the top coat.
The study illuminates several of the degrading mechanisms of TBCs duringisothermal and cyclic high-temperature exposure: fatigue damage, interfaceTGO growth and sintering of the top coat. In particular, the study showed thedifference between isothermal and cyclic heat treatment. While the isothermaloxidation gave fracture entirely in the top coat, cyclic heat treatments gave in-creasing fractions of BC/TC fracture with number of cycles.
Paper III: Influence of substrate material on the life ofatmospheric plasma sprayed thermal barrier coatings
The substrate material on which the coating is deposited may influence the lifeof the TBC. Therefore, a study on the influence of substrate material on the lifeof APS TBCs was conducted. The specimens consisted of Hastelloy X (HX) andHaynes 230 (H230) substrates with an APS NiCoCrAlYSiTa bond coat and anAPS zirconia top coat. The specimens were exposed to both isothermal oxida-tion and thermal cycling at 1100 °C. The specimens were tested until failure andthe resulting fracture surfaces were studied. Cross-sections were also preparedand used for measurements of the interdiffusion between substrate and bondcoat by EDS, as well as to measure the Young’s moduli of the bond coat and thesubstrate by nanoindentation.
The H230 specimen had a thermal cycling life almost twice as long as the HXspecimen, 1070 cycles compared to ∼ 600 cycles. Investigation of the fracturesurface revealed that both the HX and H230 specimens had failed roughly atthe same fraction of black fracture, ∼ 40 %. The black fracture was also shownto have occurred mainly in the TGO/TC interface rather than within the TGO.During the isothermal oxidation test, the specimens were removed from thefurnace at regular intervals and the test was interrupted when the TBC spalledduring removal from the furnace. The HX specimen, again, had a shorter life,1000 h compared to 1650 h for H230.
EDS line scans on cross-sectioned specimens provided through-coating co-mpositional profiles; it was found that Fe, Mn, Mo and W from the substratediffused into the bond coat; the interdiffusion was more pronounced for theHX specimen. EDS on the fracture surfaces revealed that Mn and Fe from thesubstrate could be found in the oxide; Fe was present in very small amounts,whereas Mn appeared to easily form oxides in the BC/TC interface. EDS results
51
also revealed that the H230 specimen retained an Al reservoir in the bond coatcentre longer than the HX specimen.
TGO thickness measurements revealed that, while the growth rates of Al2O3were similar for both the HX and H230 specimens, there existed a difference inthe total TGO growth rate (the total TGO growth rate also included oxides suchas Cr2O3, spinels and NiO). The HX specimen had a faster total TGO growththan the H230 specimen. At the time of failure, the total TGO thickness wasrather similar for the two specimens: 16.5µm and 14.4µm for the HX and H230specimens respectively.
The Young’s moduli, measured by nanoindentation, were used together withCTE estimations, made by Thermo-Calc, in a finite element analysis of crackgrowth in the BC/TC interface. It was found that the small differences in Young’smodulus and CTE, which arose due to interdiffusion, did not cause any signif-icant differences in the crack driving force and could thus not explain the dif-ference in life. The difference in thermal cycling life of the two TBC systemswas considered to be due to differences in Al depletion and growth rate of non-Al2O3 oxides. The faster total TGO growth rate for the HX specimen was likelyto have caused a shorter life due to higher stresses in the interface and the factthat non-Al2O3 oxides tend to crack and cause additional damage to the BC/TCinterface. The study showed that the substrate material influences the life ofthe coating and that the growth kinetics of all oxides, not only Al2O3, may haveto be taken into account in life prediction of TBCs.
Paper IV: TBC bond coat-top coat interface roughness:influence on fatigue life and modelling aspects
A large number of studies on TBC life prediction and TBC durability rely on fi-nite element modelling of the stresses in the BC/TC interface. The influenceof BC/TC interface roughness on the thermal fatigue life of TBCs was there-fore studied. Four TBC systems, with varying BC/TC interface roughness, werethermally cycled to failure and their fatigue lives were correlated to their corre-sponding BC/TC interface roughness. Based on the results, a few different in-terface models for finite element analysis were developed. The specimens con-sisted of Haynes 230 coupons coated with VPS NiCrAlY and APS Y-PSZ whichwere thermally cycled until failure.
The results showed that a rougher interface increased the fatigue life of APSTBCs. It was found that a ∼ 50 % increase in Ra gave a ∼ 70 % increase in TCFlife. This increase in life was attributed to roughness, and not to oxidation ef-fects, since no major differences in oxidation composition and kinetics were
52

observed.A number of different roughness parameters were evaluated to establish
which parameters that best captured the characteristics of the interface. It wasfound that an amplitude parameter together with a slope parameter accuratelycaptured the main features of the interface. The two parameters chosen as ba-sis for interface model formulation were Rq and R∆q .
A number of interface models were created based on the selected interfaceroughness parameters. The interface models were evaluated by finite elementanalysis and by the life model suggested by Brodin, Jinnestrand and Sjöström,(described in section 4.3). The life model initially predicted the smoothest in-terface to have the longest life which contradicted experimental observations.It was concluded that the crack growth path must be adjusted for surface rough-ness effects; experimental observations suggested that higher roughness wouldshift the crack growth path so that the cracks to a greater extent grew in the topcoat as opposed to in the BC/TC interface. When the finite element model wasadjusted to agree with the observation, the life model was able to capture theexperimentally observed results of high roughness promoting longer lives.
The study illustrated the large influence of BC/TC interface roughness onthe fatigue life of TBCs, and stressed the importance of accurate interface mod-els in life prediction of TBCs. It was found that a sinusoidal interface modelbased on an amplitude parameter and a slope parameter may be sufficient formodelling of stresses in the interface.
Paper V: Cyclic hot corrosion of thermal barrier coat-ings and overlay coatings
Coatings in gas turbines may degrade due to corrosion. Testing was performedwith the aim of mapping the relative severity of: 1) oxidation in lab air, 2) oxida-tion in moist air, 3) corrosion with salt deposits in lab air, and 4) corrosion withsalt deposits in moist air. Both NiCoCrAlYSiTa coated and NiCoCrAlYSiTa + TBCcoated specimen were used. The testing was cyclic, including 48 h at 750 °C and30 min cooling to a minimum of∼ 100 °C. For the moist air condition, water wasinjected in intervals of a few minutes during the hot part of the cycle; and forsalt deposition, a salt–water solution was sprayed on the specimens automat-ically at the end of the cold part of the cycle. Prior to analysis, the specimenswere cleaned to remove the residues from the salt deposition.
For NiCoCrAlYSiTa coated specimens, salt deposition gave notably thickerTGOs. The TGOs of the salt exposed specimens also contained an Y-rich oxidewhich was not observed for oxidation in lab air or moist air. EDS on the oxi-
53

dised/corroded surfaces revealed that the TGOs on all specimens consisted ofpredominately Al2O3. Very low amounts of S were found on the surfaces indi-cating that there was little or no sulfidation; the presence of Na in the TGOs wasalso low. The apparent influence of water was to change the TGO morphology.
For TBC coated specimens, the salt penetrated the top coat and sped upoxidation/corrosion at the BC/TC interface. The salt exposed specimens de-veloped a, at least locally, thicker TGO and the metal–oxide front of attack wasconsiderably more uneven than for oxidation in lab air and moist air.
The performed corrosion test gave an overview of the relative influence ofwater vapour and salt deposits on the corrosion resistance of coatings. It alsoshowed that bond coat corrosion due to salt deposition may be present also forTBC coated specimens. While the performed corrosion test may be unsuitablefor careful corrosion kinetics measurements, the present test parameters couldbe used for screening and ranking of coatings.
Paper VI: Modeling of microstructural evolution andlifetime prediction of MCrAlY coatings on nickel basedsuperalloys during high temperature oxidation
Aluminium depletion based life models involve oxidation and interdiffusionmodelling; thermodynamics software such as Thermo-Calc and DICTRA showpromising results when used for such purposes. Therefore, DICTRA was usedfor the development of an Al depletion based life model for MCrAlY coatings.The modelling was based on HVOF CoNiCrAlYSi coatings deposited on sub-strates of Inconel 792. The specimens were subjected to isothermal oxidation at900–1100 °C and thermal cycling at 1100 °C. The interdiffusion simulation wasmade in DICTRA and the oxidation simulation was made by a Matlab scriptwritten for the purpose. The DICTRA script and Matlab script were alternatelyrun in an iterative process, the result of which was a coupled oxidation–inter-diffusion model for prediction of Al depletion in the coating. The aim of thestudy was to model the depletion of the β-phase, i.e. the decrease in thicknessof the β-containing zone in the middle of the coating. The end of the life of thecoating was taken to occur when the β-phase had been completely depleted.
The diffusion in a multi-phase system in DICTRA requires the calculationof an effective diffusivity which depends on the geometrical phase distribu-tion. Several geometrical phase distributions were tried, but a simple rule-of-mixture model was found appropriate. Included in the model was also a dif-fusion blocking effect. This occurred due to oxides, pores and grit residues atsplat boundaries and at the substrate/coating interface. The diffusion blocking
54

was introduced by correction of the diffusion time.The coating developed two β-depleted zones, an inner, due to interdiffu-
sion with the substrate, and an outer, due to oxidation. The inner and outerβ phase depletion occurred faster for higher oxidation temperatures. For theouter zone, thermal cycling was found to give faster depletion than isothermaloxidation at the same temperature. This was due to the faster oxidation ratecaused by oxide scale spalling associated with thermal cycling. The inner de-pletion zones were, however, similar for both thermal cycling and isothermaloxidation at 1100 °C. For the higher temperatures, ≥ 1000 °C, β phase could beobserved to form in the substrate due to interdiffusion.
The model was largely successful in predicting the main features of mi-crostructural development with high-temperature exposure and showed ac-ceptable agreement with experimentally established through-coating compo-sitional profiles. The β-depletion life of the coating was predicted to be ∼ 220 hand ∼ 3000 h for 1100 °C and 1000 °C respectively. For 900 °C, the life was inexcess of 10000 h, which was the maximum simulation time used.
The work provided an important complement to fatigue-based life predic-tion approaches. Whereas a fracture mechanics-based approach may be usefulfor thermal cycling, TGO growth and Al depletion based models may be moreappropriate for isothermal high-temperature exposure or thermal cycling withvery long hold times.
Paper VII: Microstructure-based life prediction of ther-mal barrier coatings
The research presented in this paper expands upon theβ-depletion based mod-el described in the paper Modeling of microstructural evolution and lifetimeprediction of MCrAlY coatings on nickel based superalloys during high temper-ature oxidation. The β-depletion based model was adapted to APS coatingswhich also meant that internal oxidation had to be considered due to the for-mation of oxide stringers in the bond coat. The studied specimens were TBCcoated while the original model was developed for MCrAlY coated specimens.The studied TBC system consisted of APS NiCoCrAlY and APS zirconia. Thespecimens were isothermally oxidised up to 2500 h at 900 °C and 980 °C. Thespecimens had not failed at the stop of the test and were still in very good con-dition. It could therefore only be concluded that the isothermal life of the coat-ing was À 2500 h.
The TGO thickness was measured on cross-sections and used as input forthe β-depletion based model. It was found that the amount of internal oxi-
55

dation, which was measured by image analysis, remained fairly constant onceformed; the amount of internal oxidation was higher for higher temperatures.Both interface TGO growth and internal TGO growth were assumed to follow apower-law type equation (see Eq. 3) with n = 3 for interface TGO growth andn = 5 for internal oxidation.
EDS was performed on a cross-sectioned as-sprayed specimen to get com-positional profiles for input into simulations. The DICTRA software was usedto model the size of the inner and outer β-depletion zones. The model re-sults agreed well with experimental observations for 980 °C but considerablyworse for 900 °C. The poor agreement between experimental and simulated β-depletion zone size occurred since the specimens oxidised at 900 °C developedγ/γ′ zones adjacent to the γ/β zone; DICTRA failed to predict this and, as aresult, underestimated the size of the β-depletion zone.
A few life criteria were tested for the specimen oxidised at 980 °C; based onliterature, the end of the life was considered to have been reached when 1) com-plete β-depletion had occurred, 2) the TGO thickness reached 5µm, or 3) theAl content in the bond coat had dropped to 3 wt.%. β-depletion occurred at∼ 600 h, the TGO-based criterion gave a life of ∼ 1450 h and the Al-depletionbased gave ∼ 2250 h based on simulation results and 3500–4200 h based on ex-trapolation from experimental data. The β-depletion based life criterion wasobviously too conservative, as was the TGO-based criterion. The Al-depletionbased life criterion appeared to give more reasonable results; however, the Aldepletion simulation in DICTRA overpredicted the Al depletion rate somewhatand gave a more conservative life than the experimental Al-depletion indicated.
The study improved the previously developed β-depletion based model byalso including internal oxidation; internal oxidation can be very pronounced inAPS bond coats.
56

Bibliography
[1] C. Soares, Gas Turbines - A Handbook of Air, Land, and Sea Applications.Butterworth-Heinemann, Elsevier, 2008.
[2] A. Maekawa, “Evolution and future trend of large frame gas turbine forpower generation”, J. Pow. Energy Syst., vol. 5, no. 2, pp. 161–170, 2011.
[3] L. Langston, “The adaptable gas turbine”, Am. Sci., vol. 101, pp. 264–267,2013.
[4] R. C. Reed, The superalloys: fundamentals and applications. CambridgeUniversity Press, 2006.
[5] D. Stöver and C. Funke, “Directions of the development of thermal bar-rier coatings in energy applications”, J. Mater. Process. Technol., vol. 92–93, pp. 195–202, 1999.
[6] D. Comassar, “Surface coatings technology for turbine engine applica-tions”, Met. Finish., vol. 89, no. 3, pp. 39–44, 1991.
[7] M. Belmonte, “Advanced ceramic materials for high temperature appli-cations”, Adv. Eng. Mater., vol. 8, no. 8, pp. 693–703, 2006.
[8] R. Miller, “Thermal barrier coatings for aircraft engines: history and di-rections”, J. Therm. Spray Technol., vol. 6, no. 1, pp. 35–42, 1997.
[9] J. DeMasi-Marcin and D. Gupta, “Protective coatings in the gas turbineengine”, Surf. Coat. Technol., vol. 68–69, pp. 1–9, 1994.
[10] C. Sims, N. Stoloff, and W. Hagel, Eds., Superalloys II. Wiley-intersience,1987.
[11] J. Davis, Ed., Heat-Resistant Materials. ASM International, 1999.[12] H. Evans and M. Taylor, “Oxidation of high-temperature coatings”, Proc.
IMechE, vol. 220, no. G, pp. 1–10, 2006.[13] S. Bose, High Temperature Coatings. Butterworth-Heinemann, 2007.[14] C. Levi, “Emerging materials and processes for thermal barrier systems”,
Curr. Opin. Solid State Mater. Sci., vol. 8, pp. 77–91, 2004.[15] R. Mévrel, “State of the art on high-temperature corrosion-resistant coat-
ings”, Mater. Sci. Eng., A, vol. 120, pp. 13–24, 1989.[16] K. Gupta, A. Rehman, and R. Sarviya, “Bio-fuels for the gas turbine: a
review”, Renew. Sustain. Energy Rev., vol. 14, pp. 2946–2955, 2010.
57

[17] W. Nelson and R. Orenstein, “TBC experience in land-based gas tur-bines”, J. Therm. Spray Technol., vol. 6, no. 2, pp. 176–180, 1997.
[18] A. Ray and B. Goswami, “Applications of thermal barrier coating systemin gas turbines – a review”, J. Metall. Mater. Sci., vol. 46, no. 1, pp. 1–22,2004.
[19] J. Davis, Ed., Handbook of thermal spray technology. ASM International,2004.
[20] D. Wortman, B. Nagaraj, and E. Duderstadt, “Thermal barrier coatings forgas turbine use”, Mater. Sci. Eng., A, vol. 121, pp. 433–440, 1989.
[21] J. Saarimäki, “The mechanical properties of lattice truss structures withloadbearing shells made of selectively laser melted Hastelloy X”, Master’sthesis, KTH Royal Institute of Technology, 2011, masters Degree Project2011:07, Ex-jobb 2011:476.
[22] K. Yuan, “Thermal and mechanical behavior of high temperature coat-ings”, LIU-TEK-LIC-2013:3, Linköping University, 2013, ISBN: 978-91-7519-708-1, ISSN: 0280-7971.
[23] J.-C. Zhao, M. Larsen, and V. Ravikumar, “Phase precipitation and time-temperature-transformation diagram of Hastelloy X”, Mater. Sci. Eng., A,vol. 293, pp. 112–119, 2000.
[24] S. Stekovic, “Low cycle fatigue and thermo-mechanical fatigue ofuncoated and coated nickel-base superalloys”, Ph.D. dissertation,Linköpings universitet, 2007.
[25] K. Ma and J. Schoenung, “Thermodynamic investigation into the equi-librium phases in the NiCoCrAl system at elevated temperatures”, Surf.Coat. Technol., vol. 205, pp. 2273–2280, 2010.
[26] M.M. Morra, R.R. Biederman and R.D. Sisson JR., “Microstructural char-acterization of metallic overlay coatings by high resolution analyticalelectron microscopy”, Thin Solid Films, vol. 119, pp. 383–394, 1984.
[27] B.G. Mendis, B. Tryon, T.M. Pollock, K.J. Hemker, “Microstructural obser-vations of as-prepared and thermal cycled NiCoCrAlY bond coats”, Surf.Coat. Technol., vol. 201, pp. 3918–3925, 2006.
[28] B. Baufeld and M. Schmücker, “Microstructural evolution of a NiCoCrAlYcoating on an IN100 substrate”, Surf. Coat. Technol., vol. 199, pp. 49–56,2005.
[29] D. Achar, R. Munoz-Arroyo, L. Singheiser, and W. Quadakkers, “Modellingof phase equilibria in MCrAlY coating systems”, Surf. Coat. Technol., vol.187, pp. 272–283, 2004.
[30] X. Zhao and P. Xiao, “Thermal barrier coatings on nickel superalloy sub-strates”, Mater. Sci. Forum, vol. 606, pp. 1–26, 2009.
[31] L. Chen, “Yttria-stabilized zirconia thermal barrier coatings – a review”,Surf. Rev. Lett., vol. 13, no. 5, pp. 535–544, 2006.
58
[32] S. Stecura, “Optimization of the Ni–Cr–Al–Y/ZrO2–Y2O3 thermal barriersystem”, Adv. Ceram. Mater., vol. 1, no. 1, pp. 68–76, 1986.
[33] X. Cao, R. Vaßen, and D. Stöver, “Ceramic materials for thermal barriercoatings”, J. Eur. Ceram. Soc., vol. 24, pp. 1–10, 2004.
[34] A. Scrivani and G. Rizzi, “Thermal barrier coatings: the basics”, Adv.Mater. Process., vol. 165, pp. 111–113, 2007.
[35] P. Choquet, C. Indrigo, and R. Mévrel, “Microstructure of oxide scalesformed on cyclically oxidized M–Cr–Al–Y coatings”, Mater. Sci. Eng.,vol. 88, pp. 97–101, 1987.
[36] J. A. Haynes, M. K. Ferber, W. D. Porter, and E. D. Rigney, “Characteriza-tion of alumina scales formed during isothermal and cyclic oxidation ofplasma-sprayed TBC systems at 1150◦C”, Oxid. Met., vol. 52, no. 1–2, pp.31–76, 1999.
[37] C. Burman, “Properties of plasma sprayed FeCrAlY coatings on high tem-perature alloys”, Ph.D. dissertation, Linköpings universitet, 1986.
[38] H. Hindam and D. Whittle, “Microstructure, adhesion and growth kinet-ics of protective scales on metals and alloys”, Oxid. Met., vol. 18, no. 5–6,pp. 245–284, 1982.
[39] G. Wallwork and A. Hed, “Some limiting factors in the use of alloys at hightemperatures”, Oxid. Met., vol. 3, no. 2, pp. 171–184, 1970.
[40] W. Brandl, H. Grabke, D. Toma, and J. Kruger, “The oxidation behaviourof sprayed MCrAlY coatings”, Surf. Coat. Technol., vol. 86–87, pp. 41–47,1996.
[41] EN 657:2005 Thermal spraying – Terminology, classification, EuropeanCommittee for Standardization, Avenue Marnix 17, B-1000 Brussels,2005.
[42] M. Friis, C. Persson, and J. Wigren, “Influence of particle in-flight char-acteristics on the microstructure of atmospheric plasma sprayed yttriastabilized ZrO2”, Surf. Coat. Technol., vol. 141, pp. 115–127, 2001.
[43] H. Liu, H. S. Jazi, M. Bussmann, and J. Mostaghimi, “Experiments andmodeling of rapid solidification of plasma-sprayed yttria-stabilized zir-conia”, Acta Mater., vol. 57, pp. 6013–6021, 2009.
[44] A. Nusair Khan, J. Lu, and H. Liao, “Heat treatment of thermal barriercoatings”, Mater. Sci. Eng., A, vol. 359, pp. 129–136, 2003.
[45] P. Bengtsson, “Microstructural, residual stress and thermal shock studiesof plasma sprayed ZrO2-based thermal barrier coatings”, Ph.D. disserta-tion, Linköpings universitet, 1997.
[46] N. Markocsan, P. Nylén, J. Wigren, X.-H. Li, and A. Tricoire, “Effect of ther-mal aging on microstructure and functional properties of zirconia-basethermal barrier coatings”, J. Therm. Spray Technol., vol. 18, no. 2, pp. 201–208, 2009.
59

[47] R. McPherson, “A review of microstructure and properties of plasmasprayed ceramic coatings”, Surf. Coat. Technol., vol. 39–40, pp. 173–181,1989.
[48] H. Echsler, D. Renusch, and M. Schütze, “Bond coat oxidation and its sig-nificance for life expectancy of thermal barrier coating systems”, Mater.Sci. Technol., vol. 20, pp. 307–318, 2004.
[49] W. Sloof and T. Nijdam, “On the high-temperature oxidation of MCrAlYcoatings”, Int. J. Mater. Res., vol. 100, no. 10, pp. 1318–1330, 2009.
[50] W. Chen, X. Wu, B. Marple, R. Lima, and P. Patnaik, “Pre-oxidation andTGO growth behaviour of an air-plasma-sprayed thermal barrier coat-ing”, Surf. Coat. Technol., vol. 202, pp. 3787–3796, 2008.
[51] N. Birks, G. Meier, and F. Pettit, Introduction to the high-temperature oxi-dation of metals. Cambridge University Press, 2006.
[52] C. Giggins and F. Pettit, “Oxidation of Ni–Cr–Al alloys between 1000 ◦Cand 1200 ◦C”, J. Electrochem. Soc., vol. 118, no. 11, pp. 1782–1790, 1971.
[53] J. A. Haynes, E. D. Rigney, M. K. Ferber, and W. D. Porter, “Oxidation anddegradation of a plasma-sprayed thermal barrier coating system”, Surf.Coat. Technol., vol. 86–87, pp. 102–108, 1996.
[54] R. Prescott and M. Graham, “The formation of aluminum oxide scales onhigh-temperature alloys”, Oxid. Met., vol. 38, no. 3–4, pp. 233–254, 1992.
[55] F. Stott, G. Wood, and J. Stringer, “The influence of alloying elementson the development and maintenance of protective scales”, Oxid. Met.,vol. 44, no. 1–2, pp. 113–145, 1995.
[56] C. Wagner, “Beitrag zur Theorie des Anlaufvorgangs”, Z. Phys. Chem., vol.B21, pp. 25–41, 1933.
[57] W. Quadakkers, D. Naumenko, E. Wessel, V. Kochubey, and L. Singheiser,“Growth rates of alumina scales on Fe–Cr–Al alloys”, Oxid. Met., vol. 61,no. 1–2, pp. 17–37, 2004.
[58] P. Niranatlumpong, C. Ponton, and H. Evans, “The failure of protec-tive oxides on plasma-sprayed NiCoCrAlY overlay coatings”, Oxid. Met.,vol. 53, no. 3–4, pp. 241–258, 2000.
[59] D. Naumenko, B. Gleeson, E. Wessel, L. Singheiser, and W. Quadakkers,“Correlation between the microstructure, growth mechanism, andqrowth kinetics of alumina scales on a FeCrAlY alloy”, Metall. Mater.Trans. A, vol. 38A, pp. 2974–2983, 2007.
[60] G. Wallwork and A. Hed, “The oxidation of Ni–20 wt.% Cr–2ThO2”, Oxid.Met., vol. 3, no. 3, pp. 229–241, 1971.
[61] W. Chen, X. Wu, B. Marple, and P. Patnaik, “Oxidation and crack nu-cleation/growth in an air-plasma-sprayed thermal barrier coating withNiCrAlY bond coat”, Surf. Coat. Technol., vol. 197, pp. 109–115, 2005.
[62] J.-W. Park and C. Altstetter, “The diffusion and solubility of oxygen in
60
solid nickel”, Metall. Trans. A, vol. 18, no. 1, pp. 43–50, 1987.[63] C. Wagner, “Passivity and inhibition during the oxidation of metals at el-
evated temperatures”, Corr. Sci., vol. 5, pp. 751–764, 1965.[64] C. Sarioglu, M. J. Stiger, J. R. Blachere, R. Janakiraman, E. Schumann,
A. Ashary, F. S. Pettit, and G. H. Meier, “The adhesion of alumina filmsto metallic alloys and coatings”, Mater. Corr., vol. 51, pp. 358–372, 2000.
[65] B. Pint, I. Wright, W. Lee, Y. Zhang, K. Prüssner, and K. Alexander, “Sub-strate and bond coat compositions: factors affecting alumina scale adhe-sion”, Mater. Sci. Eng., A, vol. 245, pp. 201–211, 1998.
[66] D. Renusch, M. Schorr, and M. Schütze, “The role that bond coat deple-tion of aluminum has on the lifetime of APS-TBC under oxidizing condi-tions”, Mater. Corr., vol. 59, no. 7, pp. 547–555, 2008.
[67] H. Evans and M. Taylor, “Diffusion cells and chemical failure of MCrAlYbond coats in thermal-barrier coating systems”, Oxid. Met., vol. 55, no.1–2, pp. 17–34, 2001.
[68] H. Evans, A. Donaldson, and T. Gilmour, “Mechanisms of breakaway ox-idation and application to a chromia-forming steel”, Oxid. Met., vol. 52,no. 5–6, pp. 379–402, 1999.
[69] E. Shillington and D. Clarke, “Spalling failure of a thermal barrier coat-ing associated with aluminum depletion in the bond-coat”, Acta Mater.,vol. 47, no. 4, pp. 1297–1305, 1999.
[70] H. Brodin and M. Eskner, “The influence of oxidation on mechanical andfracture behaviour of an air plasma-sprayed NiCoCrAlY bondcoat”, Surf.Coat. Technol., vol. 187, pp. 113–121, 2004.
[71] M. Ali, S. Song, and P. Xiao, “Degradation of thermal barrier coatings dueto thermal cycling up to 1150 ◦C”, J. Mater. Sci., vol. 37, pp. 2097–2102,2002.
[72] N. B. Pilling and R. E. Bedworth, “The oxidation of metals at high temper-ature”, J. Inst. Met., vol. 29, no. 1, pp. 529–582, 1923.
[73] M. Jinnestrand, “Delamination in APS applied thermal barrier coatings:life modelling”, Ph.D. dissertation, Linköpings universitet, 2004.
[74] P. Bednarz, “Finite element simulation of stress evolution in thermal bar-rier coating systems”, Ph.D. dissertation, RWTH Aachen University, 2006.
[75] M. Jinnestrand and S. Sjöström, “Investigation by 3D FE simulations ofdelamination crack initiation in TBC caused by alumina growth”, Surf.Coat. Technol., vol. 135, pp. 188–195, 2001.
[76] E. Busso, J. Lin, and S. Sakurai, “A mechanistic study of oxidation-induceddegradation in a plasma sprayed thermal barrier coating system. part II:life prediction model”, Acta Mater., vol. 49, pp. 1529–1536, 2001.
[77] A. Rabiei and A. Evans, “Failure mechanism associated with the thermallygrown oxide in plasma-sprayed thermal barrier coatings”, Acta Mater.,
61

vol. 48, pp. 3963–3976, 2000.[78] R. Vassen, G. Kerkhoff, and D. Stöver, “Development of a micromechan-
ical life prediction model for plasma sprayed thermal barrier coatings”,Mater. Sci. Eng., A, vol. 303, pp. 100–109, 2001.
[79] F. Traeger, M. Ahrens, R. Vaßen, and D. Stöver, “A life model for ceramicthermal barrier coatings”, Mater. Sci. Eng., A, vol. 358, pp. 255–265, 2003.
[80] W. Chen, X. Wu, B. Marple, and P. Patnaik, “The growth and influence ofthermally grown oxide in a thermal barrier coating”, Surf. Coat. Technol.,vol. 201, pp. 1074–1079, 2006.
[81] W. Chen, X. Wu, B. Marple, D. Nagy, and P. Patnaik, “TGO growth be-haviour in TBCs with APS and HVOF bond coats”, Surf. Coat. Technol.,vol. 202, pp. 2677–2683, 2008.
[82] D. Naumenko, V. Shemet, L. Singheiser, and W. Quadakkers, “Failuremechanisms of thermal berrier coatings on MCrAlY-type bondcoats as-sociated with the formation of the thermally grown oxide”, J. Mater. Sci.,vol. 44, pp. 1687–1703, 2009.
[83] H. Echsler, V. Shemet, M. Schütze, L. Singheiser, and W. Quadakkers,“Cracking in and around the thermally grown oxide in thermal barriercoatings: A comparison of isothermal and cyclic oxidation”, J. Mater. Sci.,vol. 41, pp. 1047–1058, 2006.
[84] F. Tang and J. Schoenung, “Local accumalation of thermally grown oxidein plasma-sprayed thermal barrier coatings with rough top-coat/bond-coat interfaces”, Scr. Mater., vol. 52, pp. 905–909, 2005.
[85] K. Schlichting, N. Padture, E. Jordan, and M. Gell, “Failure modes inplasma-sprayed thermal barrier coatings”, Mater. Sci. Eng., A, vol. 342,pp. 120–130, 2003.
[86] H. Brodin, “Failure of thermal barrier coatings under thermal and me-chanical fatigue loading: Microstructural observations and modelling as-pects”, Ph.D. dissertation, Linköpings universitet, 2004.
[87] S. Sjöström and H. Brodin, “Thermomechanical fatigue life of TBCs – ex-perimental and modelling aspects”, in Advanced Ceramic Coatings andInterfaces V, ser. Ceramic Engineering and Science Proceedings, D. Zhu,H.-T. Lin, S. Mathur, and T. Ohji, Eds., vol. 31, no. 3. Hoboken, NJ, USA:John Wiley & Sons, Inc., 2010.
[88] Y. Liu, C. Persson, and J. Wigren, “Experimental and numerical life pre-diction of thermally cycled thermal barrier coatings”, J. Therm. SprayTechnol., vol. 13, no. 3, pp. 415–424, 2004.
[89] O. Trunova, T. Beck, R. Herzog, R. W. Steinbrech, and L. Singheiser, “Dam-age mechanisms and lifetime behavior of plasma sprayed thermal barriercoating systems for gas turbines – part I: Experiments”, Surf. Coat. Tech-nol., vol. 202, pp. 5027–5032, 2008.
62

[90] M. Taylor, W. Pragnell, and H. Evans, “Evidence for the formation of al-rich reservoir phases resulting from interdiffusion between MCrAlY coat-ing and Ni-based substrate”, Mater. Sci. Forum, vol. 461-464, pp. 239–246,2004.
[91] R. Anton, J. Birkner, N. Czech, and W. Stamm, “Degradation of advancedMCrAlY coatings by oxidation and interdiffusion”, Mater. Sci. Forum, vol.369-372, pp. 719–726, 2001.
[92] E.Y. Lee, D.M. Chartier, R.R. Biederman and R.D. Sisson JR., “Modellingthe microstructural evolution and degradation of the M–Cr–Al–Y coat-ings during high temperature oxidation”, Surf. Coat. Technol., vol. 32, pp.19–39, 1987.
[93] T. Beck, M. Bialas, P. Bednarz, L. Singheiser, K. Bobzin, N. Bagcivan,D. Parkot, T. Kashko, I. Petkovic, B. Hallstedt, S. Nemna, and J. M.Schneider, “Modeling of coating process, phase changes, and damageof plasma sprayed thermal barrier coatings on ni-base superalloys”, Adv.Eng. Mater., vol. 12, no. 3, pp. 110–126, 2010.
[94] J. Nesbitt and R. Heckel, “Modeling degradation and failure of Ni–Cr–Aloverlay coatings”, Thin Solid Films, vol. 119, pp. 281–290, 1984.
[95] J. Nesbitt, E. Vinarcik, C. Barrett, and J. Doychak, “Diffusional transportand predicting oxidative failure during cyclic oxidation of β-NiAl alloys”,Mater. Sci. Eng., A, vol. 153, pp. 561–566, 1992.
[96] J. Hald, L. Korcakova, H. Danielsen, and K. Dahl, “Thermodynamic andkinetic modelling: creep resistant materials”, Mater. Sci. Technol., vol. 24,no. 2, pp. 149–158, 2008.
[97] T. Nijdam and W. Sloof, “Modelling of composition and phase changes inmultiphase alloys due to growth of an oxide layer”, Acta Mater., vol. 56,pp. 4972–4983, 2008.
[98] T. Nijdam, L. Jeurgens, and W. Sloof, “Modelling the thermal oxidation ofternary alloys-compositional changes in the alloy and the developmentof oxide phases”, Acta Mater., vol. 51, pp. 5295–5307, 2003.
[99] J. Nesbitt and R. Heckel, “Predicting Diffusion Paths and Interface Motionin γ/γ+β, Ni-Cr-Al Diffusion Couples”, Metall. Trans. A, vol. 18, pp. 2087–2094, 1987.
[100] J. DeMasi, K. Sheffler, and M. Ortiz, “Thermal barrier coating life predic-tion model development, phase I – final report”, NASA, NASA Lewis Re-search Center 21000 Brookpark Road Cleveland, Ohio 44135, Tech. Rep.Nasa-CR-182230, 1989.
[101] E. Busso, J. Lin, S. Sakurai, and M. Nakayama, “A mechanistic studyof oxidation-induced degradation in a plasma sprayed thermal barriercoating system. part I: model formulation”, Acta Mater., vol. 49, pp. 1515–1528, 2001.
63

[102] S. Sjöström and H. Brodin, “Influence of TBC end geometry on the TMFlife of an APS TBC”, in Procedia Engineering, P. Lukáš, Ed., vol. 2, 2010, pp.1363–1371.
[103] J. Hutchinson and Z. Suo, Advances in applied mechanics. Academicpress, 1992, vol. 29, ch. Mixed mode cracking in layered materials, pp.63–191.
[104] R. Vassen, F. Cernushi, G. Rizzi, A. Scrivani, N. Markocsan, L. Östergren,A. Kloosterman, R. Mevrel, J. Feist, and J. Nicholls, “Recent activities inthe field of thermal barrier coatings including burner rig testing in theeuropean union”, Adv. Eng. Mater., vol. 10, no. 10, pp. 907–921, 2008.
[105] N. Simms, A. Encinas-Oropesa, and J. Nicholls, “Hot corrosion of coatedand uncoated single crystal gas turbine materials”, Mater. Corr., vol. 59,no. 6, pp. 476–483, 2008.
[106] S. Pahlavanyali, A. Sabour, and M. Hirbod, “The hot corrosion behaviourof HVOF sprayed MCrAlX coatings under Na2SO4 (+NaCl) salt films”,Mater. Corr., vol. 54, no. 9, pp. 687–693, 2003.
[107] G. Sreedhar, M. Masroor Alam, and V. Raja, “Hot corrosion behaviour ofplasma sprayed YSZ/Al2O3 dispersed NiCrAlY coatings on inconel-718superalloy”, Surf. Coat. Technol., vol. 204, pp. 291–299, 2009.
[108] H. Singh, D. Puri, and S. Prakash, “Some studies on hot corrosion perfor-mance of plasma sprayed coatings on a Fe-based superalloy”, Surf. Coat.Technol., vol. 192, pp. 27–38, 2005.
[109] M. Frances, P. Steinmetz, J. Steinmetz, C. Duret, and R. Mevrel, “Hot cor-rosion behavior of low pressure plasma sprayed NiCoCrAlY+Ta coatingson nickel base superalloys”, J. Vac. Sci. Technol. A, vol. 3, no. 6, pp. 2537–2544, 1985.
[110] C. Leyens, I. Wright, and B. Pint, “Hot corrosion of an EB-PVD thermal-barrier coating system at 950 ◦C”, Oxid. Met., vol. 54, no. 5-6, pp. 401–424,2000.
[111] H. Guo, H. Murakami, and S. Kuroda, “Thermal cycling and hot-corrosion behaviors of plasma sprayed segmented thermal barrier coat-ings”, Mater. Sci. Forum, vol. 546-549, pp. 1713–1716, 2007.
[112] M. Shen, S. Zhu, L. Xin, and F. Wang, “Hot corrosion of a novel enamel-based thermal barrier coating”, Mater. Sci. Forum, vol. 654-656, pp. 1944–1947, 2010.
[113] Y. Wu and T. Narita, “Oxidation behavior of the single crystal Ni-basedsuperalloy at 900 ◦C in air and water vapor”, Surf. Coat. Technol., vol. 202,pp. 140–145, 2007.
[114] Y. Wu and T. Narita, “The cyclic oxidation behavior of the single crystaltms-82+ superalloy in humidified air”, Mater. Corr., vol. 60, no. 10, pp.781–787, 2009.
64

[115] C. Zhou, J. Yu, S. Gong, and H. Xu, “Influence of water vapor on theisothermal oxidation behavior of low pressure plasma sprayed NiCrAlYcoating at high temperature”, Surf. Coat. Technol., vol. 161, pp. 86–91,2002.
[116] C. Zhou, J. Yo, S. Gong, and H. Xu, “Influence of water vapor on the hightemperature oxidation behavior of thermal barrier coatings”, Mater. Sci.Eng., A, vol. 348, pp. 327–332, 2003.
[117] C. Zhou, H. Xu, and S. Gong, “Influence of water vapor on the cyclic-oxidation behavior of a low-pressure plasma-sprayed NiCrAlY coating”,Oxid. Met., vol. 62, no. 3-4, pp. 195–206, 2004.
[118] ASTM Standard C633 - 01(2008) Standard Test Method for Adhesion orCohesion Strength of Thermal Spray Coatings, ASTM International, WestConshohocken, PA, 2008.
[119] EN 582:1993 Thermal spraying – Determination of tensile adhesivestrength, European Committee for Standardization, Avenue Marnix 17,B-1000 Brussels, 1994.
[120] J. Goldstein, D. Newbury, D. Joy, C. Lyman, P. Echlin, E. Lifshin, L. Sawyer,and J. Michael, Scanning Electron Microscopy and X-Ray Microanalysis.Springer, 2003.
65