thermal design and verification of spherical scientific
TRANSCRIPT
Research ArticleThermal Design and Verification of Spherical ScientificSatellite Q-SAT
Yunhan He, Boxin Li, Zhaokui Wang , and Yulin Zhang
School of Aerospace Engineering, Tsinghua University, Beijing 100084, China
Correspondence should be addressed to Zhaokui Wang; [email protected]
Received 16 March 2021; Revised 9 August 2021; Accepted 26 August 2021; Published 17 September 2021
Academic Editor: Angelo Cervone
Copyright © 2021 He Yunhan et al. This is an open access article distributed under the Creative Commons Attribution License,which permits unrestricted use, distribution, and reproduction in any medium, provided the original work is properly cited.
Small satellites have gradually become an important mean of space scientific exploration. The Tsinghua University developed aspherical small satellite, Q-SAT, which is aimed at detecting the Earth gravity and atmosphere parameters. In the current paper,thermal control for Q-SAT is discussed. For heat exchange between the satellite and the environment, radiation plays the mainpart. Different from traditional cuboid satellites, the current spherical satellite has no individual heat input and output planewhich brings challenges to the thermal design of the satellite. In addition, the cost of small satellites is required to be as lowas possible. A passive thermal control solution based on integrated spherical structure is employed on the Q-SAT. Thecombination of two integrated hemispheres is designed to facilitate the heat conduction. Different materials are utilized tocontrol the heat transfer path. Firstly, a set of numerical simulations demonstrate that the current design can be welladapted to complex flight environment. Next, the thermal design is verified by thermal tests. As the traditional heatradiation lamps cannot meet the test requirements of the spherical satellite, an external heat flow test method which is basedon distributed heaters is proposed. Results from numerical simulations agree well with the experimental test results. Bothresults show that the thermal system can guarantee the functions of the satellite. Q-SAT was successfully launched into orbiton August 6, 2020. The telemetry data from Q-SAT verified the effectiveness of the satellite thermal system. The thermaldesign and test method proposed in present paper can potentially be adopted to other small scientific satellites as well.
1. Introduction
The background of this research is the small satellite devel-oped by the Tsinghua University, Q-SAT. The mission ofQ-SAT is upper atmospheric density and gravity field detec-tion in low Earth orbit (LEO) [1]. The main payload of Q-SAT is a GNSS receiver, and it can determine the positionof Q-SAT precisely. The precise orbit data can be used tocalculate the aerodynamic drag force of Q-SAT. The atmo-spheric parameter detection task requires that the area-to-mass ratio and aerodynamic drag coefficient of satellite havea high certainty to reduce the error of measurement. There-fore, Q-SAT is designed to be spherical to complete the mis-sion better, which is unique to common cuboid satellites.
Thermal control is necessary for satellites. The task ofthe satellite thermal control system is to guarantee the tem-perature of the components within its proper range when
the satellite is exposed to the outer space environment dur-ing the orbital mission [2, 3]. The main form of heatexchange between the satellite and the environment is radi-ation. The thermal characteristics of spherical satellite is dif-ferent from common polyhedral ones. Therefore, thethermal control system of Q-SAT needs to be designedspecifically.
Thermal design relies on active or passive temperaturecontrol devices. The active thermal control devices [4]include pumped loop systems, heaters, shape memory alloy(SMA) [5], and louvers [6]. Small satellites usually have lim-ited size and mass, so it is difficult to use active thermal con-trol devices widely [2, 7]. Passive thermal control systemrefers to the use of the conduction and radiation characteris-tics of materials to autonomously control the temperature.Materials often used for passive thermal control includemultilayer insulation, coatings/paints, mirror, radiating sur-
HindawiInternational Journal of Aerospace EngineeringVolume 2021, Article ID 9961432, 11 pageshttps://doi.org/10.1155/2021/9961432

faces, thermal grease, and polyimide structure [4, 6, 8–10].In addition, the passive thermal control system does notrequire an additional power source, which can save thepower of the satellite [11]. More importantly, the cost of pas-sive thermal control devices is very low. The hardware costof the passive thermal control system applied to the smallsatellite can be as low as 148 dollars [12]. Therefore, the pas-sive method is the main solution for the thermal control sys-tem of small satellites. Of course, the effectiveness of passivethermal control system depends on the accurate analysis andeffective test [11, 13–15]. The thermal design philosophy ofQ-SAT is mainly a passive control system supplemented byactive heaters based on the above facts.
The thermal test is a criterion for judging whether thethermal design is effective. The thermal test should accu-rately simulate satellite’s thermal environment. The key ofthermal test is to simulate the heat flow input, usually radi-ation from different sources. The most common method isto use radiant lamps distributed inside the vacuum chamberas the input heat source [16]. However, the heat input at dif-ferent positions on the spherical surface cannot be accuratelycontrolled when multiple radiant lamps are working at the
Lowerhemisphere
Bearing frame
GNSS AntennEquatorial ring Motherboard
Upperhemisphere
(1) Overview (2) Layout
Y
X Z
LU
Y
X Z
Figure 1: Overview and layout of Q-SAT.
Flywheel
Microwaveamplifier
ACC OBC USB
Batteries
Dual-frequency
GNSSreceiver
Camera
ISM
TX2
GNSS receiver
X
Z
Motherboard
PMU
Equatorial ring
Bearingframe
Figure 2: Devices distributed inside Q-SAT.
Y
Z
Y
𝛽X
Y
Z
SSO of Q-SATQ-SAT Earth
Sunlight
Figure 3: Orbit and condition of Q-SAT.
Y
Core:bearing frame,motherboard
& devices
Polyimideinsulationstructure Equatorial ring
–Y hemispher +Y hemispherMultilayer
Solar cell& polyimide
filmSolar cell &polyimide film
Figure 4: Overview of Q-SAT thermal design.
2 International Journal of Aerospace Engineering

same time. Considering that the heat input at different posi-tions of the sphere is not the same, a distributed externalheat flow simulation method based on electric heaters ofpolyimide film type for the spherical satellite is proposedand tried in this mission. Another key factor in thermal test-ing is cost. Test expenses account for a large proportion (upto 1/3) of satellite R&D costs [17]. The cost of thermal test-ing of satellites is particularly expensive because of the con-tinuous use of liquid nitrogen on the thermal system,vacuum pumps, and cold fingers. Thermal test usuallyrequires a large number of professionals for the inherent24 h test process. Besides that, very specific kinds of mate-rials and devices such as infrared lamps, electrical cables,electrical heaters, tapes, and films are required to comprisethe test setup [18]. Considering the above factors, the ther-mal test is simplified from the following aspects: (a) testfocuses on the key devices of the small satellite as a wholeto lower the cost instead of testing devices one by one, andthere is no need to conduct specialized verification fordevices with flight experience. (b) The thermal test is con-ducted in a strategic sequence.
The second section of the article introduces the Q-SATstructure and thermal control design solution. The simula-tion results are given. The third section reports the methodsand results of the thermal test. The fourth section shows theactual temperature state of the satellite flying on orbit. Theconclusion is given in the last section.
2. Thermal Design
2.1. Structure of Q-SAT. The overview and the layout of Q-SAT are shown in Figure 1. The outer surface of the satelliteis a sealed sphere with a diameter of 510mm. Solar cells aremounted on the surface of Q-SAT to keep the sphericalshape. The structure of the satellite includes two hemispher-
ical shells, an equatorial bearing ring, a bearing frame, and amotherboard. The two hemispherical shells are fixedly con-nected to the equatorial bearing ring by screws, as is thebearing frame. The motherboard is installed on the bearingframe. Antennas are installed on the outer surface of theequatorial bearing ring. Electronic devices are distributedon the bearing frame and the motherboard. The origin ofthe satellite body coordinate system is defined as the centerof sphere. The Y-axis is perpendicular to the equatorial bear-ing ring and the positive direction points to the upper hemi-sphere. The Z-axis points in the opposite direction of theGNSS antenna. The X-axis has a right-handed spiral rela-tionship with the Y-axis and the Z-axis.
The main devices of Q-SAT are shown in Figure 2. Atti-tude control computer (ACC), on-board computer (OBC),ISM transceiver, and single-frequency GNSS receiver (S-FGNSS) are installed on the motherboard. USB transceiver,flywheel, microwave amplifier (MA), batteries, power con-trol unit (PCU), and the main payload dual-frequency GNSSreceiver (D-F GNSS) are fixed on the bearing frame.Another payload, the panoramic camera together with theon-board intelligent processing module are installed on theequatorial bearing ring. The camera lens is exposed outsidethe satellite.
2.2. Thermal Control Based on Integrated Spherical Structure.Qualitative discussion about thermal control is carried out
(1) Frame (2) With solar panels
Figure 5: The hemisphere.
Table 1: WHC and WCC parameters.
Case Date Internal heat source βSolar
constant
WHC 2021.2.10Devices run at max
power29.17° 1414W/m2
WCC 2021.6.03Devices run at min
power19.16° 1322W/m2
Figure 6: Thermal model of Q-SAT.
3International Journal of Aerospace Engineering
before numerical simulation calculations. Since space is avacuum environment, satellites can only interact with theenvironment through radiation. Therefore, for Q-SAT, ther-mal interaction includes three ways: (1) direct solar radia-tion, (2) solar radiation reflected from the Earth (albedoradiation) and direct infrared radiation from the Earth,and (3) the energy of heat radiation from the outer surfaceof the spacecraft to deep space. Due to the small magnitude,the thermal effects of other planets can be ignored in engi-neering. When the heat obtained by the thermal interactionbetween the satellite and the environment is equal to theinternal heat dissipation, the spacecraft is in a state of ther-mal equilibrium [19]. The orbit and sunlight condition areshown in Figure 3. According to mission, Q-SAT chose a500 km round high sun-synchronous orbit (SSO). Duringthe flight, the Q-SAT maintains the attitude of a 3-axis stablepointing to the Earth. The −Z-axis always points to the cen-ter of the Earth.
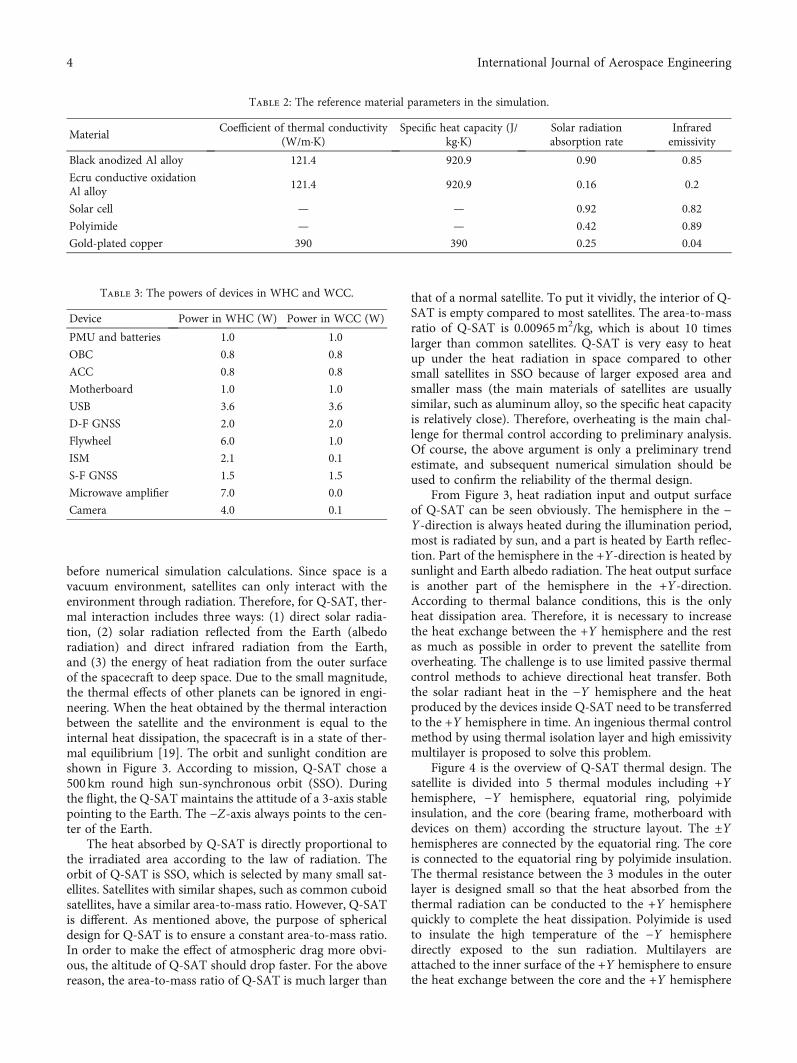
The heat absorbed by Q-SAT is directly proportional tothe irradiated area according to the law of radiation. Theorbit of Q-SAT is SSO, which is selected by many small sat-ellites. Satellites with similar shapes, such as common cuboidsatellites, have a similar area-to-mass ratio. However, Q-SATis different. As mentioned above, the purpose of sphericaldesign for Q-SAT is to ensure a constant area-to-mass ratio.In order to make the effect of atmospheric drag more obvi-ous, the altitude of Q-SAT should drop faster. For the abovereason, the area-to-mass ratio of Q-SAT is much larger than
that of a normal satellite. To put it vividly, the interior of Q-SAT is empty compared to most satellites. The area-to-massratio of Q-SAT is 0.00965m2/kg, which is about 10 timeslarger than common satellites. Q-SAT is very easy to heatup under the heat radiation in space compared to othersmall satellites in SSO because of larger exposed area andsmaller mass (the main materials of satellites are usuallysimilar, such as aluminum alloy, so the specific heat capacityis relatively close). Therefore, overheating is the main chal-lenge for thermal control according to preliminary analysis.Of course, the above argument is only a preliminary trendestimate, and subsequent numerical simulation should beused to confirm the reliability of the thermal design.
From Figure 3, heat radiation input and output surfaceof Q-SAT can be seen obviously. The hemisphere in the −Y-direction is always heated during the illumination period,most is radiated by sun, and a part is heated by Earth reflec-tion. Part of the hemisphere in the +Y-direction is heated bysunlight and Earth albedo radiation. The heat output surfaceis another part of the hemisphere in the +Y-direction.According to thermal balance conditions, this is the onlyheat dissipation area. Therefore, it is necessary to increasethe heat exchange between the +Y hemisphere and the restas much as possible in order to prevent the satellite fromoverheating. The challenge is to use limited passive thermalcontrol methods to achieve directional heat transfer. Boththe solar radiant heat in the −Y hemisphere and the heatproduced by the devices inside Q-SAT need to be transferredto the +Y hemisphere in time. An ingenious thermal controlmethod by using thermal isolation layer and high emissivitymultilayer is proposed to solve this problem.
Figure 4 is the overview of Q-SAT thermal design. Thesatellite is divided into 5 thermal modules including +Yhemisphere, −Y hemisphere, equatorial ring, polyimideinsulation, and the core (bearing frame, motherboard withdevices on them) according the structure layout. The ±Yhemispheres are connected by the equatorial ring. The coreis connected to the equatorial ring by polyimide insulation.The thermal resistance between the 3 modules in the outerlayer is designed small so that the heat absorbed from thethermal radiation can be conducted to the +Y hemispherequickly to complete the heat dissipation. Polyimide is usedto insulate the high temperature of the −Y hemispheredirectly exposed to the sun radiation. Multilayers areattached to the inner surface of the +Y hemisphere to ensurethe heat exchange between the core and the +Y hemisphere
Table 2: The reference material parameters in the simulation.
MaterialCoefficient of thermal conductivity
(W/m·K)Specific heat capacity (J/
kg·K)Solar radiationabsorption rate
Infraredemissivity
Black anodized Al alloy 121.4 920.9 0.90 0.85
Ecru conductive oxidationAl alloy
121.4 920.9 0.16 0.2
Solar cell — — 0.92 0.82
Polyimide — — 0.42 0.89
Gold-plated copper 390 390 0.25 0.04
Table 3: The powers of devices in WHC and WCC.
Device Power in WHC (W) Power in WCC (W)
PMU and batteries 1.0 1.0
OBC 0.8 0.8
ACC 0.8 0.8
Motherboard 1.0 1.0
USB 3.6 3.6
D-F GNSS 2.0 2.0
Flywheel 6.0 1.0
ISM 2.1 0.1
S-F GNSS 1.5 1.5
Microwave amplifier 7.0 0.0
Camera 4.0 0.1
4 International Journal of Aerospace Engineering

and the heat generated by the devices can be transferred intime. On the contrary, the inner surface of −Y hemisphereis aluminum alloy of conductive oxidation; the infraredemission rate of which is very low. The core ability of heattransfer by radiation is very low. This design reduces theheat exchange capability between the −Y hemisphere andthe core through radiation.
The hemisphere is specially designed in order to achievethermal equilibrium quickly. The hemisphere includes frameand solar panels (Figure 5). The hemisphere frame is formed
by a single piece of aluminum alloy instead of assembly toensure the low thermal resistance. The surface of the frameis anodized to ensure emissivity. The solar cells are pastedon the panel through polyimide film. It can be seen fromthe figures that most of the outer surface of the hemisphereis occupied by the panels. The area and emissivity of solarcells and polyimide can be accurately calculated, so the heatradiation characteristics of the hemisphere can be modeledaccurately. Equatorial ring also uses aluminum alloy. Silicagel is applied to the contact surface between hemispheresand the equatorial ring to improve the thermal conductivity.
The main devices are installed on the −Y side of the coreto ensure heat are radiated to the cooling surface of Q-SAT.These devices and the bearing frame adopt an installationmethod that enhances heat conduction. These devices areinstalled on the bearing frame through thermally conductivematerials. The structure surfaces are black anodized to pro-vide reliable emissivity and absorptivity. Active heatingdevices are used on the lithium batteries to prevent it fromworking at low temperatures.
2.3. Simulation. A thermal analysis of Q-SAT is created inthe simulation software Thermal Desktop (TD). Satellite’sheat input conditions are created based on the planned orbit.The key parameters of heat input include the angle betweensolar radiation and orbit β (shown in Figure 3), the solarconstant, and the heat generated by the devices inside Q-SAT. Changes in these parameters will result in the worst-hot case (WHC) and the worst-cold case (WCC). Whenthe angle β is the largest, the solar radiation reaches the −Y hemisphere the least. Considering the contact thermalresistance between the two hemispheres, the +Y hemisphereaccumulates the most heat at this time, which is the WHC.In the same way, when the angle β is the smallest, the satel-lite is in WCC. WHC and WCC are given in Table 1. Thevalue of the solar constant considers the fluctuation rangeof solar radiation. The thermal design should ensure thatthe operating temperatures of all devices are within the per-mitted range under different cases.
>46.47Node Node
46.47
43.09
39.70
36.31
32.93
29.54
26.15
22.77
19.38
15.99
12.60
<12.60Temperature (°C)
WHC WCC
Temperature (°C)
XY
XY
<-24.31
–24.31
–18.45
–12.59
–6.725
–0.863
4.999
10.06
16.72
22.50
28.45
34.31
>34.31
Figure 7: The core temperature distribution of thermal analysis.
Table 4: Temperatures of devices inside Q-SAT.
DeviceAllowingrange(°C)
Analysisresult inWHC (°C)
Analysisresult inWCC (°C)
Testresult(°C)
PCU -10~+50 21~23 15~21 20.4
Batteries 0~+40 15~21 9~11 22.7
OBC -40~+85 13~27 3~17 18.1
ACC -40~+85 13~27 3~17 15.8
Motherboard -40~+85 8~21 -3~10 12.5
USB -20~+65 32~47 20~35 36.9
D-F GNSS -25~+55 18~24 6~11 14.1
Magnetometer -40~+85 15~20 3~7 11.0
Flywheel -30~+60 32~33 7~9 11.3
ISM -30~+60 10~29 -2~3 20.3
IMU -30~+50 16~22 6~10 21.3
S-F GNSS -25~+50 12~22 0~9 13.4
MA -25~+50 16~25 2~6 17.0
Figure 8: The electric heater of polyimide film type.
5International Journal of Aerospace Engineering

A thermal model of Q-SAT is established with simplifi-cation on the basis of the real model, while the thermalcapacity of each component is kept unchanged. The modelis shown in Figure 6. According to the parameters inTable 1, a transient thermal analysis is performed on the sat-ellite, and all passive thermal control measures, the activeheating control on the batteries, and external thermal radia-tion were considered in the calculation. Material parametersmainly used in the simulation are shown in Table 2. Thepowers of devices under the two cases are listed in Table 3.Layout of the devices are shown in Figure 2.
Figure 7 shows the core temperature distribution of ther-mal analysis in WHC and WCC. Table 4 reports the simula-tion results, including the temperature variation range ofeach component under WHC and WCC, together with theallowable temperature range as a comparison. The time toreach thermal equilibrium is 83640 s in WHC and 52520 sin WCC. All the working temperatures of the devices arein the allowable range, according to the analysis results ofgraphics and tables of statistics, whether in WHC or WCC.Thermal analysis results show that the thermal controldesign can effectively control the temperature of Q-SAT ina reasonable range. Furthermore, the thermal test is neces-sary to verify the reliability of thermal design.
3. Thermal Test
3.1. Distributed Heat Flow Method Based on Electric Heaters.Thermal test is the basis for judging the reliability of thermaldesign. According to the previous analysis, Q-SAT is moreconcerned about overheating. Therefore, the thermal teststrategy based on WHC case was selected for saving timeand cost. The philosophy of thermal test is to verify the coreof Q-SAT as a whole instead of testing each device one byone. The electric heaters are mounted on the surface of thesatellite to accurately simulate the difference in radiation atdifferent positions on the spherical surface.
There are additional problems with the use of the heatersfor thermal testing of Q-SAT. Heaters must not directly con-tact the solar cells. A pair of hemispheres together with pol-yimide and simulated solar cells is made to solve this
WRL2
WRL1 WRL4WRL3
WRL6
WRL5
–Y Hemisphere+Y Hemisphere
WRL7WRL8
Z
X
Z
X
Figure 9: The layout of the distributed heaters.
Heaters
Heat insulated bracket Polyimide
Figure 10: Q-SAT before thermal test.
Establish vacuum environment(<1.3e-3Pa)
Install heaters and sensorsput Q-SAT in the vacuum tank
Create cold & black background
Thermal balance test (WHC)(last 5677 seconds)
Thermal vacuum test(2.5 cycles, H-C-H-C-H)
Test completed
Figure 11: Steps of thermal test (H: hot; C: cold).
6 International Journal of Aerospace Engineering

problem. They are used to replace the real hemisphere struc-tures and solar cells in thermal tests to facilitate surfacemounting of heaters. The difference between the two setsof hemispheres is whether the real solar cells are used. Solarcells are mature aerospace products with sufficient flightexperience, so it is reasonable to exclude them from test.This test method is to use distributed flexible electric heaters(Figure 8) attached to the surface of the sphere to heat thesatellite according to analyzed power. Unlike a plane, the
incident angles of heat radiation at different positions onthe spherical surface at the same time are different. Becauseonly a limited number of discrete heaters can be mounted onthe sphere, the power of each heater should be the integral ofthe corresponding area’s radiation input density. Each solarpanel is set as an independent heating unit, and 1~3 heatersare attached on it according to the area of the panel.
The layout scheme of the distributed external heaters isshown in Figure 9. There are 8 heating circuits
25°C
Pressure (Pa)
Mid cycle
LL of HT
HL of LT
Pressure≤6.65⨯10–3Pa
Time (h)
Time (h)
Temperature °C
Charge and discharge, duration≥4.0hCool down, rate≥1°C/min①
②
③
④
Instruction:Power off
Allowable deviation range of temperatureHeat up, rate≥°C/min
Keep the temperaturePower on & test
2°C
2°C
2°C2°C
①④
①
② ③
② ③
(a) The first and the lase cycle of thermal vacuum test
2°C
2°C
2°C
2°C
1⨯10–2Pa
25°CLL of HT LL of HT
HL of LT
Last cycle
Pressure (Pa)
1 ATM
First cycle
Pressure≤6.65⨯10–3Pa
Time (h)
Time (h)
Temperature °C
①
②
③
④
①
②
③
④
⑤
⑥
⑦
⑧
⑨
Instruction:Power off
Allowable deviation range of temperatureHeat up, rate≥°C/minStabilize the temperatureKeep the temperaturePower off to power on, duration≥0.5h
Power onCharge and discharge, duration≥4.0hCheck the GSCsCool down, rate≥1°C/minPower on
Power on & test
2°C2°C ⑤
⑥
⑦
⑧
⑨
①②
③
④
⑤⑥
⑦
⑧②
③
⑦
⑥
(b) The middle cycle of the thermal vacuum test
Figure 12: Temperature curve of thermal vacuum test.
7International Journal of Aerospace Engineering

(WRL1~WRL8) in the thermal, and several heaters are inseries in each heating loop. The heat input density of thepanels belonging to the same loop is the same, because theaverage integrated radiation of these panels during an orbitalperiod is approximately the same. The heaters cover all thesolar panels on the two hemispheres.
After the heaters are attached on the test hemispheres,the surface of Q-SAT is sprayed with a kind of special blackpaint to eliminate the environmental influence of the ther-mal vacuum tank. A special heat-insulated bracket is alsodesigned to isolate the heat input from the environment,with polyimide structures deployed at its junctions.Figure 10 is the overview of Q-SAT before thermal test.
Figure 11 lists the steps throughout the test. The thermalbalance test is conducted after the test environment is estab-lished. Only WHC is simulated as the heat input because thetime is quite tight; besides, overheat may be a destructiveproblem, and the active heater onboard Q-SAT can prevent
the satellite from too cold. The ambient temperature controlcurve of thermal vacuum test is shown in Figure 12.
3.2. Results of Thermal Balance Test. The thermal test(Figure 13) was conducted according to the method above.The parameters of the heating loops are listed in Table 5.The loops WRL5, WRL7, and WRL8 have obviously largerpowers, which is consistent with the −Y hemisphere beingthe main heated part on the orbit. The first 1893s of thermalbalance test is to simulate the state in shadow period whilethe rest time is illumination period. The power of eachheater is the average value in the orbital period. The correct-ness of thermal design and analysis can be validated throughthermal balance test.
Temperature sensors (thermistor MF501) were installednear each device before test. The stable temperatures ofdevices when the satellite is thermal balanced, as the results,are shown in Table 4. The test results are in good agreementwith the simulation results (WHC), indicating that the ther-mal design and analysis have a high credibility and reliabil-ity. Therefore, it is reasonable to believe that the analysisresults in WCC are also reliable, although the correspondingthermal balance test has not been carried out due to shorttime.
The main purpose of the thermal vacuum test is to verifythe environmental adaptability of devices and structure.Heat input in the thermal vacuum test is adjusted based onthe parameters in Table 5. Examination on Q-SAT beforeand after the thermal vacuum test showed that its perfor-mance has not changed.
4. On-Orbit Performance
Q-SAT was launched on August 6, 2020, atop the CZ-2Drocket from Jiuquan Satellite Center, northwest China, andit works well on orbit now. The telemetry data contains thetemperature information collected by the thermistor on thesatellite. This section introduces the thermal state of satel-lite’s daily orbit operation on October 22, 2020, to verifythe thermal design. The orbit period is about 90 minutes,and β is 20.8°on this day. The case of this day is betweenWHC and WCC. Thermistors on the inner surface of thehemispheres (Figure 14) detect the exposure of Q-SAT.
The temperatures of the hemispheres are recorded inFigure 15 (WHC) and Figure 16 (WCC). The period of sur-face temperature change is approximately 90 minutes, whichis the same as the period of the satellite orbit. The hottestpanel (10#) is about 55°C, and the opposite position (02#)is the coldest at -8°C in WHC. Considering that there is a5mm thick aluminum alloy between the sensor and theouter surface of the satellite, the measurement result mayhave a deviation of 3~5°C. The max temperature differenceon the satellite surface is about 50~60°C according to abovefacts. This temperature difference shows that the design ofusing an integrated spherical structure for thermal controlis very reasonable. The temperatures of the neighboringpanels distributed on opposite sides of the equatorial ringare very close, which indicates that the thermal resistancebetween the structures is well controlled. When the satellite
Figure 13: Thermal test scene.
Table 5: Parameters of the heating loops.
LoopLoad(Ω)
Heat area(mm2)
Power (W)(0~1893 s)
Power (W)(1893~5677 s)
WRL1 100 40 × 100 × 10 4.71 9.04
WRL2 40 40 × 100 × 4 5.42 10.66
WRL3 100 40 × 100 × 10 5.12 26.54
WRL4 100 40 × 100 × 10 5.18 26.59
WRL5 100 40 × 100 × 10 4.76 47.14
WRL6 40 40 × 100 × 4 5.42 14.08
WRL7 120 40 × 100 × 12 5.16 59.18
WRL8 100 40 × 100 × 10 5.10 49.13
8 International Journal of Aerospace Engineering

is in WCC, the temperature of the spherical surface is about-20°C.
The telemetry data of satellite’s internal thermistors isplotted in Figure 17 (WHC) and Figure 18 (WCC). It canbe seen from the curves that the temperatures inside Q-SAT also fluctuates in the orbital period. The temperatureof all devices is maintained at 0~20°C, and the batteries are
in 9~19°C, which is a quite perfect range. The temperatureof some devices is lower than expected. This is because theoperating power of these devices has been adjusted to a cer-tain extent when running on orbit. The daily remote temper-ature data is similar to the one shown in this section. Thetemperature control system successfully guaranteed the dailyoperation of Q-SAT.
05#
01#
02#
03#
04#
06#
08#
07#
X
Z
O
09# 15#
16#
12#
10# 14#
11# 13#
X
Z
O
+Y Hemisphere –Y Hemisphere
Figure 14: Thermistors on the hemispheres with numbers.
–25
–20
–15
–10
–5
0
5
10
15
20
0 50 100 150 200 250 300 350
Tem
pera
ture
(°C)
Time (30s)
ST1ST2ST3ST4
ST5ST6ST7ST8
(a) Temperatures of +Y hemisphere
Tem
pera
ture
(°C)
Time (30s)
–30
–20
–10
0
10
20
30
40
50
60
0 50 100 150 200 250 300 350
ST9ST10ST11ST12
ST13ST14ST15ST16
(b) Temperatures of −Y hemisphere
Figure 15: Temperatures of hemispheres on orbit on 2021.2.10 (X: time (30 s); Y : temperature (°C); ST N : surface temperature of N# panelin Figure 14).
9International Journal of Aerospace Engineering

5. Conclusion
According to the requirement of Q-SAT, a passive thermalcontrol system based on integrated spherical structure isproposed. Satellite’s on-orbit heat input is analyzed, andthe worst conditions are determined. The idea of the thermaldesign is to transfer the heat from the exposed surface and
the devices in Q-SAT to the heat dissipation surface as soonas possible. The main method of thermal control is to usethermal insulation materials, thermal conductive materials,and thermal control coatings to control the path of heatexchange. Analysis shows that this method is feasible.
A thermal test method based on distributed electricheaters is used to adapt the spherical structure of Q-SAT.
Tem
pera
ture
(°C)
Time (30s)
ST1ST2ST3ST4
ST5ST6ST7ST8
–25
–20
–15
–10
–5
0
5
10
15
20
0 50 100 150 200 250 300 350
(a) Temperatures of +Y hemisphere
Tem
pera
ture
(°C)
Time (30s)
–30
–20
–10
0
10
20
30
40
50
60
0 50 100 150 200 250 300 350
ST9ST10ST11ST12
ST13ST14ST15ST16
(b) Temperatures of −Y hemisphere
Figure 16: Temperatures of hemispheres on orbit on 2021.6.03 (X: time (30 s); Y : temperature (°C); ST N : surface temperature of N# panelin Figure 14).
Tem
pera
ture
(°C)
Time (30s)
OBCUSBISMBatteries
D-F GNSSMotherboardPMU
0
2
4
6
8
10
12
14
16
18
20
0 50 100 150 200 250 300 350
Figure 17: Temperatures of devices inside Q-SAT on 2021.2.10.
Tem
pera
ture
(°C)
Time (30s)
OBCUSBISMBatteries
D-F GNSSMotherboardPMU
0
2
4
6
8
10
12
14
16
18
0 50 100 150 200 250 300 350
Figure 18: Temperatures of devices inside Q-SAT on 2021.6.03.
10 International Journal of Aerospace Engineering
External heat flow input is accurately simulated. The testresults are consistent with the simulation results. After thesatellite is launched, the telemetry data shows that its inter-nal temperature is controlled very well. The excellent opera-tion indicates that thermal design of Q-SAT is satisfactory.Relying on reasonable thermal design and accurate simula-tion, the passive thermal control system based on COTScan meet the requirements of small satellites. With the vigor-ous development of small satellite technology, space scienceexploration missions may have more special-shaped satel-lites. The work in this paper can provide reference for moresmall satellite engineering practice.
Data Availability
The data used to support the findings of this study isincluded within the article and is also available from the cor-responding author upon request.
Conflicts of Interest
The authors declare that they have no conflicts of interest.
Acknowledgments
The authors thank Zhang Qi and Cai Yingkai (Ph.D stu-dents) for their assistance in processing on-orbit telemetrydata. The authors also thank Fan Hongmei from the Shan-dong Aerospace Electronics Institute for her advice on ther-mal design and test. Funding for this paper was providedfrom the Key Research and Development Projects in Guang-dong Province, China (No. 2020B090919002).
References
[1] Y. Zhao, Z. Wang, and Y. Zhang, “A spherical micro satellitedesign and detection method for upper atmospheric densityestimation,” International Journal of Aerospace Engineering,vol. 2019, Article ID 1758956, 15 pages, 2019.
[2] D. Park, K. Miyata, and H. Nagano, “Thermal design and val-idation of radiation detector for the ChubuSat-2 micro-satellite with high-thermal-conductive graphite sheets,” ActaAstronautica, vol. 136, pp. 387–394, 2017.
[3] A. Ali, J. Tong, H. Ali, M. R. Mughal, and L. M. Reyneri, “Adetailed thermal and effective induced residual spin rate anal-ysis for LEO small satellites,” IEEE Access, vol. 8, pp. 146196–146207, 2020.
[4] V. Baturkin, “Micro-satellites thermal control–concepts andcomponents,” Acta Astronautica, vol. 56, no. 1-2, pp. 161–170, 2005.
[5] W. Guo, Y. Li, Y. Z. Li et al., “A self-driven temperature andflow rate co-adjustment mechanism based on Shape-Memory-Alloy (SMA) assembly for an adaptive thermal con-trol coldplate module with on-orbit service characteristics,”Applied Thermal Engineering, vol. 114, pp. 744–755, 2017.
[6] P. R. Mashaei and M. Shahryari, “Effect of nanofluid on ther-mal performance of heat pipe with two evaporators; applica-tion to satellite equipment cooling,” Acta Astronautica,vol. 111, pp. 345–355, 2015.
[7] A. Ali, K. Ullah, H. Rehman, I. Bari, and L. M. Reyneri, “Ther-mal characterisation analysis and modelling techniques for
CubeSat-sized spacecrafts,” The Aeronautical Journal,vol. 121, no. 1246, pp. 1858–1878, 2017.
[8] D. Gilmore, Ed., Satellite Thermal Control Handbook, TheAerospace Corporation Press, El Segundo, CA, 2002.
[9] C. Latham, “Technical brief, thermal resistance of interfacematerials as a function of pressure,” Journal Electronics Cool-ing, vol. 2, no. 3, p. 35, 1996.
[10] Y. Shimakawa, T. Yoshitake, Y. Kubo et al., “A variable-emittance radiator based on a metal-insulator transition of(La,Sr)MnO3 thin films,” Applied Physics Letters, vol. 80,no. 25, pp. 4864–4866, 2002.
[11] M. Bonnici, P. Mollicone, M. Fenech, and M. Azzopardi,“Analytical and numerical models for thermal related designof a new pico-satellite,” Applied Thermal Engineering,vol. 159, article 113908, 2019.
[12] J. Berk, J. Straub, and D. Whalen, “The open prototype foreducational nanosats: fixing the other side of the small satellitecost equation,” in 2013 IEEE Aerospace Conference, Big Sky,MT, USA, 2013.
[13] R. Kovács and V. Józsa, “Thermal analysis of the SMOG-1PocketQube satellite,” Applied Thermal Engineering, vol. 139,pp. 506–513, 2018.
[14] I. Grande, A. Sanz-Andrs, C. Guerra, and G. Alonso, “Analyt-ical study of the thermal behavior and stability of a small satel-lite,” Applied Thermal Engineering, vol. 29, pp. 2567–2573,2009.
[15] M. Bulut and N. Sozbir, “Analytical investigation of a nanosa-tellite panel surface temperatures for different altitudes andpanel combinations,” Applied Thermal Engineering, vol. 75,pp. 1076–1083, 2015.
[16] E. Escobar, M. Diaz, and J. Zagal, “Evolutionary design of a sat-ellite thermal control system: real experiments for a CubeSatmission,” Applied Thermal Engineering, vol. 105, pp. 490–500, 2016.
[17] X. Jin, “Mechanical environmental test for artificial satellites,”Chinese Spaceflight, vol. 8, pp. 17–21, 1993.
[18] J. S. Almeida, M. B. Santos, D. L. Panissi, and E. C. Garcia,“Effectiveness of low-cost thermal vacuum tests of a micro-sat-ellite,” Acta Astronautica, vol. 59, no. 6, pp. 483–489, 2006.
[19] A. Farrahi and I. Pérez-Grande, “Simplified analysis of thethermal behavior of a spinning satellite flying over sun-synchronous orbits,” Applied Thermal Engineering, vol. 125,pp. 1146–1156, 2017.
11International Journal of Aerospace Engineering