thermal insulation - · pdf filethermal insulation – executive summary. thermal...
TRANSCRIPT

Energy Use in Homes
A series of reports on domestic energy use in England
Thermal Insulation

Energy Use in Homes
A series of reports on domestic energy use in England
Thermal Insulation
This is one of a series of five reports on the energy characteristics of the stock as observed by the 2001 English House Condition Survey.
The reports in this series are:
1. Energy Summary Report 2. Space and Water Heating
3. Thermal Insulation 4. Fuel Consumption 5. Energy Efficiency
The English House Condition Survey is funded and provided courtesy of the Office of the Deputy Prime Minister. More information about this survey can be found at www.odpm.gov.uk/ehcs
This analysis has been prepared by BRE with the funding and support of the Sustainable Energy Policy Division of the Department for Environment, Food and Rural Affairs (Defra) through a contract managed by the Energy Saving Trust. This publication is Crown Copyright. For any further information please contact [email protected]
© Crown Copyright. 2005.

Thermal Insulation – Executive Summary.
Thermal Insulation Executive Summary
Over two-thirds of dwellings in England (70%) have cavity walls. The majority of the remainder have solid walls. 35% of dwellings with cavity walls have some level of cavity wall insulation. Compared to 1996, when it was present in only 22% of dwellings, the level of cavity wall insulation has increased considerably - corresponding to around 1–1.5 million installations of cavity wall insulation during the period 1996-2001. There is considerable variation in the presence of cavity wall insulation by tenure - private rented dwellings are least likely to have cavity wall insulation (28%), and RSL dwellings most likely (44%). There has also been a substantial increase in loft insulation levels. 26% of houses and bungalows in 2001 have 150mm or more of loft insulation – an increase from 16% in 1996. This corresponds to an increase of around 1.7 million dwellings, and represents a significant loft insulation installation and replacement programme. Once more it is the private rented sector which shows the lowest level of insulation - only 17% have 150mm or more of loft insulation, and 12% have no insulation whatsoever. The highest levels of loft insulation are seen in the social rented (local authority and RSL) sectors. Dwellings with solid walls can be insulated by the application of an external and internal lining. These methods of insulation are fairly rare and are found in around 2% of all dwellings with solid walls. Levels of double glazing have increased since the previous EHCS. Only 60% of dwellings had double glazed windows in 1996 – this has increased to 76% in 2001. Owner occupied dwellings are the most likely to have double glazing (83%) and private rented dwellings the least likely (52%). There has also been an increase in the amount of dwellings in which all the windows in the dwelling are double glazed. The proportion of dwellings in which double glazing extends to all windows has increased from 31% in 1996 to 51% in 2001. RSL dwellings in particular show high leve ls of double glazing to all windows (66%). The vast majority of hot water cylinders (98%) are insulated. This insulation takes the form of either a flexible cylinder jacket or a foam coating (a foam coating is the more efficient method). In 2001, 57% of insulated cylinders have a foam coating and 43% a flexible jacket. This is an improvement on 1996 when only 45% of cylinders had a foam coating and 55% a flexible jacket.

Thermal Insulation
1
Thermal Insulation INTRODUCTION This report considers thermal insulation measures within the housing stock as observed by the 2001 English House Condition Survey (EHCS). It covers the main methods of insulation, which are cavity wall insulation, loft insulation, internal and external wall insulation, double glazing and hot water cylinder insulation, and looks at variation by dwelling tenure, age, type and geographical location. Where relevant and possible, comparisons are drawn with data from the 1996 EHCS. The EHCS is a five yearly survey undertaken in order to assess the condition of the housing stock in England. The results presented here are from the section of the survey that provides information on dwelling characteristics and a professional assessment of dwelling condition. The survey results are based upon a sample of approximately 17,500 dwellings.
Wall Construction The analysis in this section only considers external walls.
1.1 Of the 21.1 million dwellings in the housing stock, 70% of the housing stock (14.7 million dwellings) have predominantly cavity walls and 29% (5.6 million dwellings) have predominantly solid walls 1. This data is shown in table 1.1, and figure 1.1 below
Figure 1.1 – Predominant external wall construction (all dwellings).
1.2 The type of wall construction is closely related to dwelling age. This can be explained by the change in preferred construction practices over time: the popularity of solid wall construction has decreased in favour of cavity walls. This is shown in table 1.2 and figure 1.2 below.
1 Predominant wall type is defined as the wall type which makes up greater than or equal to 50% of the external wall area.
70%
29%
1%
Cavity Solid Other

Thermal Insulation
2
0%10%20%30%40%50%60%70%80%90%
100%
pre-1919 1919-1944
1945-1964
1965-1980
post-1980
Age Band
% a
ll dw
ellin
gs
with
this
wal
l typ
e
solid cavity other
Figure 1.2 – Predominant external wall construction by dwelling age (all dwellings).
85% of pre-1919 homes were built with solid walls, decreasing to 7% of post-1965 dwellings. As the occurrence of solid walls declines, there is a corresponding rise in the proportion of dwellings with cavity walls. Only 15% of pre-1919 dwellings were built with cavity walls, compared to 94% of post-1965 dwellings.
1.3 The distribution of wall construction within each dwelling type is shown below in figure 1.3 and in table 1.3. The variation shown is closely related to the proportion of older stock within each type.
Converted flats tend to be considerably older than other dwelling types (82% are pre-1919) and this is reflected by a high incidence of solid walls (84% of converted flats have predominantly solid walls).
Typically younger purpose built flats, detached houses and bungalows are most likely to have cavity walls (78%, 81% and 87% respectively).
1.4 Variations in wall construction by tenure reflect the age and type of stock within each tenure (see table 1.4).
The survey shows that private rented stock has the highest proportion of older dwellings. As such, private rented dwellings are the most likely to have solid walls (50% of tenure). This compares to 28% of owner occupied dwellings, 18% of registered social landlord (RSL) dwellings and 22% of local authority dwellings. The RSL tenure has the highest proportion of modern stock and this is reflected in the 81% of dwellings with predominantly cavity walls – the highest proportion of all tenures.
1.5 There are large regional variations in wall construction as shown in table 1.5. This can partly be explained by the age distribution of the stock across England.

Thermal Insulation
Solid walls are rarest in the more modern stock of the North East (14%) and most common in the older stock found in London (56%). The other regions have between 19% and 31% of dwellings with solid walls. Cavity walls show the reverse pattern. Just 43% of dwellings in London have predominantly cavity walls, compared to 86% in the North East.
0
10
20
30
40
50
60
70
80
90
100
Smallterracedhouse
Medium/largeterracedhouse
Semi-detached
house
Detachedhouse
Bungalow Convertedflat
Purpose builtf lat, low rise
Purpose builtf lat, high rise
Total
Dwelling Type
Perc
enta
ge o
f dw
ellin
gs w
ith w
all t
ype
cavity solid other
Figure 1.3 – Predominant external wall construction by dwelling type (all dwellings). CHANGE IN PREDOMINANT WALL TYPE SINCE 1996:
1.7
2.1
2.2
New stock added since 1996 has been of cavity wall construction. In 2001 70% of dwellings are of predominantly cavity wall construction, compared to 64% in 1996. This represents a net increase of around 1.7 million households living in dwellings with predominantly cavity walls. Around 850,000 of these are the result of new-build and change of use. The remainder are likely to be the result of extensions and alterations to existing dwellings and of counting discrepancies between 1996 and 20011.
Cavity Wall Insulation The analysis in this section considers just the 70% (14.7 million dwellings) of the total stock with predominantly cavity walls2 Cavity wall insulation refers to the presence of an insulating layer in the internal cavity of an external wall, built with two or more leaves. When fitted retrospectively it describes the process of injecting an insulating material (usually fibres, beads or a foam) in-between the inner and outer leaves of masonry that make up an external cavity wall.
There are 5.2 million dwellings with cavity wall insulation (see table 2.1). This represents 35% of the 14.7 million dwellings with predominantly cavity walls.
1 These discrepancies are likely to be in both the specification of wall type and the measurement of the proportion of each wall type. 2 This analysis uses a revised definition of cavity wall insulation which is more wall type and area specific to that used within the original 2001 EHCS analysis.
3

Thermal Insulation
2.3
2.4
2.5
There are variations in the levels of cavity wall insulation by tenure. Private rented stock is least likely to have cavity wall insulation (only 28% of this tenure) and RSL stock most likely (44%) (see table 2.2). Changing building practices mean modern housing is more likely to have cavity wall insulation and the 2001 EHCS shows post-1980 houses are the most likely of all to have cavity wall insulation. Only 13% of pre-1919 houses have insulation, compared to 57% of post-1980 houses (see table 2.3). There are significant variations in the amount of cavity wall insulation by dwelling type, as shown below in figure 2.1 and in table 2.4. This is related to both dwelling age and the difficulties of adding cavity wall insulation to some dwelling types. Bungalows (43%) and post-1919 detached houses (48%) are most likely to have cavity wall insulation. figure 2.1 shows that among semi-detached and terraced houses there is a clear relationship between the age of the dwellings and the levels of cavity wall insulation – older properties are less likely to have insulation. Low levels of cavity wall insulation are seen in pre-1919 houses and high rise purpose built flats. Within these dwelling types between 10% and 16% have cavity wall insulation. The dwelling type with the lowest incidence of cavity wall insulation is purpose built high-rise flats, with only 10% of dwellings having cavity wall insulation. This is a result of the difficulty in installing cavity wall insulation in properties of this type (it is usually impossible to install cavity wall insulation above 25m from the ground, and difficult up to this height).
0
10
20
30
40
50
60
High RisePB Flat: All
ages
Low RisePB Flat: All
ages
Convertedflat: Allages
Bungalow :All ages
DetachedHouse: Pre
1919
DetachedHouse:1919
onw ards
SemiDetached
andTerraced
Houses: Pre1919
SemiDetached
andTerracedHouses:
1919 -1944
SemiDetached
andTerracedHouses:
1945 -1964
SemiDetached
andTerracedHouses:
1965onw ards
Dwellling Type
Perc
enta
ge o
f dw
ellin
gs w
ith c
avity
in
sula
tion
Figure 2.1 – Cavity Wall Insulation by dwelling type (dwellings with cavity walls).
2.6 There are some regional variations in the prevalence of cavity wall insulation but it is difficult
to determine any particular pattern (see table 2.5). It seems reasonable to assume that regional differences will be due to a large number of factors including dwelling age, type, household income, tenure and climatic differences.
Dwellings in the West Midlands have the lowest percentage of cavity wall insulation (27%) whilst those in the Eastern region have the highest percentage (47%).
4

Thermal Insulation
5
2.7
3.1
3.2
CHANGE IN LEVELS OF CAVITY WALL INSULATION SINCE 1996: When considering the change in cavity wall insulation it is important to take into account that there are around 1.7 million more households living in dwellings with predominantly cavity walls in 2001 than in 1996. New-build and change of use can account for around 850,000 of these dwellings. The remainder are likely to be the result of extensions and alterations to existing dwellings as well as any counting discrepancies between 1996 and 2001.
There has been a significant increase in the prevalence of cavity wall insulation since 1996. Of those households living in dwellings with cavity walls, 35% have cavity wall insulation. This compares to 22% in 1996, and represents a net increase in cavity wall insulation of around 2.4 million dwellings. Taking into account the increase in dwellings with predominantly cavity walls noted above, and discounting the new-build properties, we can estimate that there have been 1-1.5 million installations of cavity wall insulation to existing dwellings since 1996.
This increase spans all tenures, but is particularly marked in the private rented and RSL sectors. In the private rented sector the cavity wall insulation levels increased from 11% in 1996 to 28% in 2001 – this corresponds to around 200,000 dwellings. Within the RSL sector the proportion of households with cavity wall insulation increased from 25% in 1996 to 44% in 2001, an increase of around 300,000 dwellings. The remaining two tenures have also shown large increases. The proportion of local authority dwellings with cavity wall insulation increased from 22% in 1996 to 35% in 2001 (200,000 dwellings). The owner occupied sector (the vast majority of the stock) increased by a similar proportion (23% in 1996 increasing to 35% in 2001 – an increase of 1.7 million dwellings). The oldest (pre-1919) stock has the lowest levels of cavity wall insulation. The 2001 data shows 13% of households in pre-1919 dwellings have cavity wall insulation – an increase from 7% in 1996. However, this age band contains a relatively low number of dwellings (only 4% of all those with predominantly cavity walls). A more considerable increase in terms of actual numbers of dwellings can be seen in the most modern stock (post-1980). In 1996, 32% of households in these dwellings had cavity wall insulation - this increases to 57% in 2001. This is equivalent to an increase of around 1.3 million dwellings with cavity wall insulation in this age band.
Loft Insulation The analysis in this section is limited to houses and bungalows with pitched roofs which have not been converted into loft rooms. The thickness of loft insulation was only measured for pre-1980 houses. For post-1980 houses it is assumed to conform to the Building Regulation requirements at the date of construction. The analysis in this section is limited to houses and bungalows with pitched roofs, which have not been converted into loft rooms. Flats are not considered.
The 2001 survey shows that 98% of all dwellings with a pitched roof (16.8 million dwellings) have an unconverted loft (see table 3.1). Of these, 5% have no insulation at all, and 26% have 150mm or more (see table 3.2).

Thermal Insulation
6
3.3 The incidence and thickness of loft insulation varies by dwelling age, as shown in figure 3.1 below and table 3.3. The graph shows younger houses are more likely to have loft insulation present, and to have insulation of a greater thickness. It should be noted that, in the 2001 EHCS, dwellings in the 1980 – 1990 age band are deemed to have 100mm loft insula tion by default and post-1990 dwellings are deemed to have 150mm loft insulation by default except where the actual survey showed greater thicknesses.
Changing building practices over time have resulted in variations in the incidence and thickness of loft insulation, with loft insulation being added to older dwellings retrospectively. The oldest dwellings (pre-1919) are much more likely to have no insulation in their loft at all (14% of age band) and least likely to have insulation 150mm thick or more (19%). There are some small variations in the incidence and thickness of loft insulation with dwelling type, but age seems to be a dominant factor (see table 3.4). Post-1919 detached houses show marginally higher levels of insulation than post-1965 semis, terraced houses and bungalows (only 1% with no insulation and 30% with 150mm or more).
Figure 3.1 – Levels of loft insulation by dwelling age (all houses with an unconverted loft).
3.4 There are significant variations in both the incidence and thickness of loft insulation by tenure as shown in figure 3.2 below and table 3.5. Private rented stock has the lowest levels of loft insulation with 12% having no insulation whatsoever. These dwellings are also the least likely to have 150mm or more of insulation (17% of tenure). Social rented stock is most likely to have loft insulation and most likely to have loft insulation of greater thickness. Only 1.5% of the local authority and RSL stock has no insulation at all, with 45% and 33% of these two groups respectively having loft insulation 150mm thick or greater. The owner occupied sector lies in between private and social tenants, with 5% of dwellings having no loft insulation, and 25% having 150mm or more. These differences are closely associated with the age of properties within each tenure. The private rented stock consists of older properties, which are less likely to have loft insulation (as described above and shown in figure 3.1), and the social stock vice-versa. Different maintenance strategies between the tenures are also likely to play a part.
3.5 Loft insulation is reasonably uniform across all Government Office regions, as can be seen in table 3.6. Houses in the North East are most likely to have loft insulation (98% of those with an unconverted loft), whilst houses in London are least likely (94%). In terms of the thickness of insulation, dwellings in the West Midlands are the most likely to have 150mm or more of
0
10
20
30
40
50
60
70
pre 1919 1919-1944 1945-1964 1965-1980 post 1980
Dwelling Age
Per
centa
ge of d
wel
lings
No insulation 50 mm or under 75 mm 100 mm 150 mm or greater

Thermal Insulation
7
insulation (32%) and dwellings in London and the South East the least likely (21%). These small regional variations are probably due to the tenure and age variations between the regions.
0
5
10
15
20
25
30
35
40
45
50
Owner Occupied Private Rented Local Authority RSL
Tenure
Per
centa
ge
of d
wel
lings
No insulation 50 mm or under 75 mm 100 mm 150 mm or greater
Figure 3.2 – Levels of loft insulation by tenure (all houses with an unconverted loft). CHANGE IN LEVELS OF LOFT INSULATION SINCE 1996:
3.6 Levels of loft insulation have increased significantly since 1996. In 1996, 7% of households had no insulation whatsoever and 16% had 150mm or more. In 2001 these figures are 5% with no insulation and 26% with more than 150mm. This corresponds to a decrease of around 300,000 households with no insulation and an increase of 1.7 million households with 150mm or more of loft insulation, and represents a considerable shift towards greater levels of loft insulation in the housing stock. The change in the number of dwellings with no insulation is approximately equal for all tenures. The lack of any loft insulation whatsoever is approximately two thirds of the levels observed in 1996 across all tenures. There is more variation when considering the thickest insulation category (150mm of insulation or more). In the private rented sector the proportion of houses with this thickest insulation has more than doubled (increasing from 8% in 1996 to 16% in 2001), the owner occupied sector has increased from 15% to 24%, the local authority sector from 20% to 33% and the RSL sector from 34% to 45%. The oldest dwellings have the lowest levels of loft insulation in the dwelling stock. However, these dwellings have also shown improvements since 1996. 20% of households living in pre-1919 dwellings had no insulation whatsoever in 1996. In 2001, this figure has decreased to 14% - although it is still considerably higher than the 5% average for dwellings of all ages. The proportion of dwellings with the thickest (150mm or more) insulation within this age band has increased from 11% in 1996 to 19% in 2001.
Solid Wall Insulation The analysis in this section is limited to those dwellings with predominantly solid walls.
4.1 There are 6.2 million dwellings with solid walls. Two main types of insulation can be applied to such walls: various methods of external wall insulation, and the application of an internal dry-lining.

Thermal Insulation
8
4.2 Only 2% of all solid walled dwellings are insulated (see table 4.1). The very low incidence of
this wall insulation means that large errors are possible within this sub-sample. Therefore, the analysis which is possible of this data is very limited.
4.3 Dwellings in the social tenures are more likely to have solid wall insulation than dwellings in the private sector (see table 4.2). Around 10% of solid walled dwellings in the social sector are insulated, compared to just 1% of dwellings in the private sector.
Double Glazing
5.1 Double glazing is measured by counting the total number of different types of windows in each dwelling. The survey only considers actual windows – and does not take any account of external doors other than patio doors.
5.2 Approximately 76% (16 million) of dwellings have some level of double glazing (see table
5.1 and figure 5.1 below). 51% (10 million) of dwellings have the entire dwelling double glazed, whilst 34% have none or less than half of the windows double glazed.
Figure 5.1 – Extent of double glazing (all dwellings).
5.3 When considering how double glazing varies by dwelling age it is useful to consider the pre-
1919 stock separately to the stock built after 1919. Pre-1919 homes have a significantly lower incidence of double glazing than the rest of the stock. Only 59% of pre-1919 dwellings having any amount of double glazing (see table 5.2), compared to around 80% of for all age bands post-1919. When considering the proportion of glazing within a dwelling, it is clear that the more modern a dwelling, the more likely it is that the entire dwelling will be double glazed. Only 28% of dwellings built before 1919 are entirely double glazed, compared to 43% of the 1919-1945 stock, and 70% of the post-1980 stock.
The changing incidence of double glazing within the stock is partly a result of modern regulations which, since 1990, have obliged all new and refurbished dwellings to be fitted
24%
10%
15%
51%
No double glazing Less than half More than half Entire dwelling
Thermal Insulation
9
with double glazed windows. It is also likely to be related to the distribution of different aged dwellings by tenure as described below.
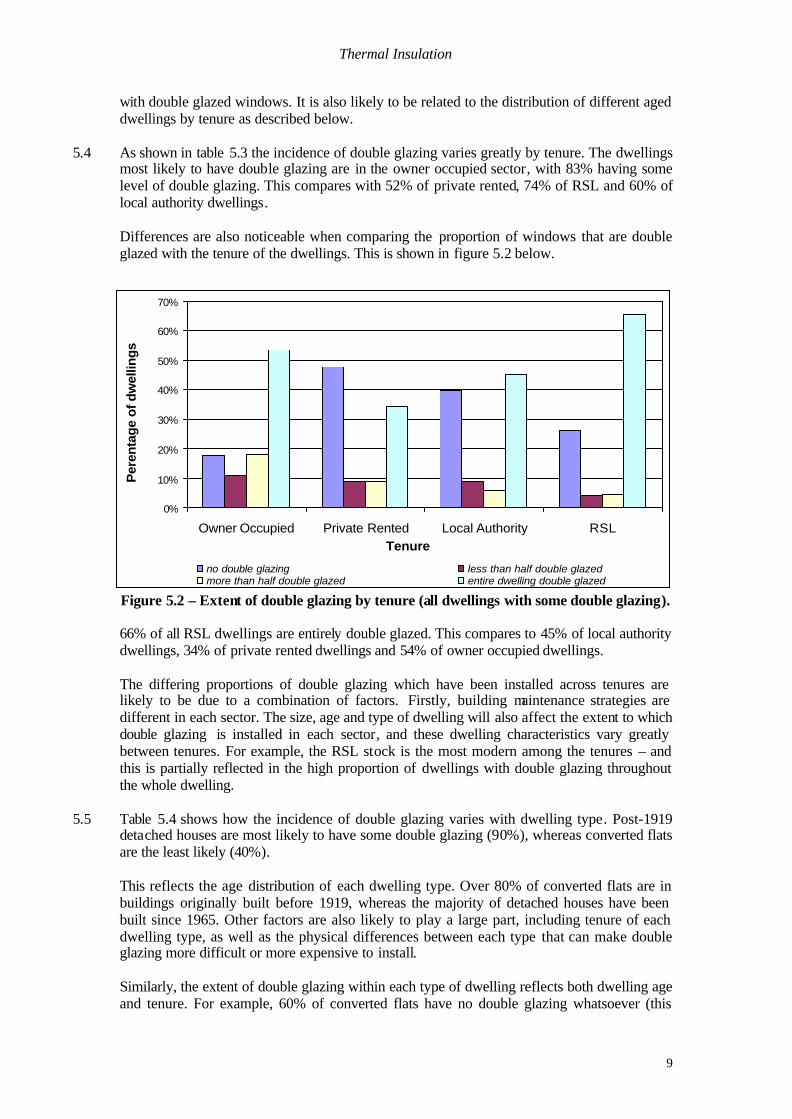
5.4 As shown in table 5.3 the incidence of double glazing varies greatly by tenure. The dwellings
most likely to have double glazing are in the owner occupied sector, with 83% having some level of double glazing. This compares with 52% of private rented, 74% of RSL and 60% of local authority dwellings.
Differences are also noticeable when comparing the proportion of windows that are double glazed with the tenure of the dwellings. This is shown in figure 5.2 below.
Figure 5.2 – Extent of double glazing by tenure (all dwellings with some double glazing). 66% of all RSL dwellings are entirely double glazed. This compares to 45% of local authority dwellings, 34% of private rented dwellings and 54% of owner occupied dwellings. The differing proportions of double glazing which have been installed across tenures are likely to be due to a combination of factors. Firstly, building maintenance strategies are different in each sector. The size, age and type of dwelling will also affect the extent to which double glazing is installed in each sector, and these dwelling characteristics vary greatly between tenures. For example, the RSL stock is the most modern among the tenures – and this is partially reflected in the high proportion of dwellings with double glazing throughout the whole dwelling.
5.5 Table 5.4 shows how the incidence of double glazing varies with dwelling type. Post-1919
detached houses are most likely to have some double glazing (90%), whereas converted flats are the least likely (40%).
This reflects the age distribution of each dwelling type. Over 80% of converted flats are in buildings originally built before 1919, whereas the majority of detached houses have been built since 1965. Other factors are also likely to play a large part, including tenure of each dwelling type, as well as the physical differences between each type that can make double glazing more difficult or more expensive to install. Similarly, the extent of double glazing within each type of dwelling reflects both dwelling age and tenure. For example, 60% of converted flats have no double glazing whatsoever (this
0%
10%
20%
30%
40%
50%
60%
70%
Owner Occupied Private Rented Local Authority RSLTenure
Per
enta
ge
of d
wel
ling
s
no double glazing less than half double glazedmore than half double glazed entire dwelling double glazed

Thermal Insulation
10
compares to 24% for all dwelling types). This reflects the amount of dwellings of this type which are old and the high proportion which are within the private rented tenure. The extent of double glazing by dwelling type is shown in figure 5.3 below.
Figure 5.3 – Extent of double glazing by dwelling type (all dwellings with some double glazing).
5.6 Double glazing also shows an amount of variation by region. Most government regions
have just under 80% of dwellings with some double glazing except the North East with 70% and London with 63%. There is little discernible difference when comparing dwellings with all windows double glazed by region. Most regions fall into the 48% – 55% band except the Eastern Region, the highest at 58% and London, the lowest at 42%. (see table 5.5).
5.7 The material used to construct double glazed window frames affects the window’s standard of
insulation. uPVC and wooden frames provide the most insulation, whereas aluminium frames are less efficient. The 2001 data shows the vast majority (93%) of double glazed windows have uPVC or wooden frames, with only 7% made from aluminium (see table 5.6). CHANGE IN LEVELS OF DOUBLE GLAZING SINCE 1996:
5.8 The 2001 results show a continuing trend of increased incidence of double glazing, as well as an increasing proportion of double glazing within each dwelling.
76% of households have some level of double glazing in 2001, compared to 60% in 1996. There has been a corresponding rise in the extent of double glazing in each dwelling. In 2001, 51% of households live in dwellings with all of the windows double glazed. This compares to 31% of households in 1996. The past five years continue the pattern of rapidly increasing amounts of double glazing across all tenures, as shown in figure 5.4 below. The lowest levels of double glazing are found within households living in pre-1919 dwellings, however, the incidence of double glazing within this age band has increased significantly since 1996 from 43% in 1996 to 59% in 2001.
0%
10%
20%
30%
40%
50%
60%
70%
High RisePB Flat : Al l
ages
Low Rise PBFlat : Al l
ages
Convertedflat: All
ages
Bungalow:All ages
DetachedHouse: Pre
1919
DetachedHouse: 1919
onwards
SemiDetached
andTerraced
Houses: Pre1919
SemiDetached
andTerraced
Houses: 1919- 1 9 4 4
SemiDetached
andTerracedHouses:
1945 -1964
SemiDetached
andTerracedHouses:
1 9 6 5onwardsDwelling Type
Per
cent
age
of d
wel
lings
no double glazing less than half double glazedmore than half double glazed entire dwelling double glazed

Thermal Insulation
11
Figure 5.4 – Presence of double glazing by tenure 1986 to 2001 (all dwellings with some double glazing).
In 2001, considerably more double glazed window frames were made of the more efficient uPVC or wood (93%) than in 1996 (79%).
Secondary glazing
5.9 In contrast to the 1996 survey, the 2001 EHCS only recorded secondary glazing installed specifically for sound insulation purposes. Therefore secondary glazing is not discussed further in this document.
Hot Water Cylinder Insulation The analysis in this section considers just those dwellings with a hot water cylinder.
6.1 The 2001 data shows 75% of dwellings (15.9 million) have a hot water cylinder (see table 6.1). Nearly 98% (15.5 million) of these cylinders are insulated (see table 6.2). Figure 6.1 below shows that approximately 43% of insulated cylinders have flexible cylinder jackets, while 57% have the more efficient foam coated cylinders (see table 6.2).
6.2 Only relatively recently has foam insulation become widely available and fitted as standard. Just over 50% of all insulated cylinders in dwellings built before 1980 have foam insulation. In post-1980 dwellings the proportion rises dramatically to 79% (see table 6.3).
6.3 The highest proportion of dwellings with foam insulated cylinders are post 1919 detached
houses (68%) and the lowest high-rise flats (44%) (see table 6.4). The distribution of foam insulation by dwelling type is likely to be related to the relative proportion of dwellings within each dwelling type built after 1980 (e.g. there are relatively high numbers of detached houses, and very few high rise flats, built after 1980).
010
203040
506070
8090
1986 1991 1996 2001
EHCS Survey Year
% o
f dw
ellin
gs w
ith s
ome
doub
le
gla
zin
g
Owner Occupied Private Rented Local Authority RSL All Tenures

Thermal Insulation
12
6.4 As table 6.5 show, the more efficient foam coating is more popular across all tenures than the flexible jackets. It is most popular of all within the RSL sector, with 68% of insulated cylinders using this form of insulation, and least popular in the local authority sector with 54% of insulted cylinders employing a foam coating.
Figure 6.1 – Type of hot water cylinder insulation (all insulated hot-water cylinders). This reflects the age distribution within each of the tenures, in particular the proportion of dwellings in each tenure built post-1980. 41% of RSL dwellings were built post-1980 (the largest proportion of all tenures), compared to 10% of local authority dwellings (the smallest proportion of all tenures).
6.5 There is some variation in the different insulation types between regions. This variation shows a general North-South split, with foam coating being more prevalent in the South. The lowest incidence of foam coating is in the North West & Merseyside, where only 39% of insulated hot water cylinders have a foam coating. In the North East, Yorkshire & Humberside and the West Midlands there is a relatively equal balance between the numbers of cylinder jackets and foam insulation. In the East Midlands, South West, Eastern Region, South East and London, the majority have foam insulation (see table 6.6).
CHANGES IN HOT WATER CYLINDER INSULATION SINCE 1996:
6.6 There has been a small increase in the proportion of cylinders with insulation since 1996. In 2001, 98% of cylinders have some level of insulation compared to 96% in 1996. It should be noted that there has been a net decrease in the number of cylinders in use in England since 1996 as a result of the installation of new space and water heating facilities that do not require a hot water cylinder. It is likely that these newly installed systems will have replaced older type heating systems, which are more likely to have had jacket insulation, leading to a net increase in the amount of cylinders with foam insulation. The principal change in insulation is from cylinder jacket insulation to foam coated insulation. The use of foam coating has increased substantially to 57% of all insulated cylinders since 1996 (when only 45% of all households had foam coated cylinders). This indicates a significant replacement programme (equivalent to 2 million cylinders). This is a continuation of a longer term trend revealed by the EHCS as shown in figure 6.2 below.
43%
57%
Foam Insulation Jacket Insulation

Thermal Insulation
13
Figure 6.2 – Type of cylinder insulation by EHCS date (all hot water cylinders).
0
10
20
30
40
50
60
70
None Jacket Foam
Insulation Type
Per
cen
tag
e o
f E
HC
S s
amp
le (
of
tho
se
with
ho
t w
ater
cyl
ind
ers)
1991 EHCS 1996 EHCS 2001 EHCS

Index - All worksheets in this order:
Table 1.1 Wall Construction - Predominant external wall typeTable 1.2 Wall Construction - Predominant external wall type by dwelling ageTable 1.3 Wall Construction - Predominant external wall type by dwelling typeTable 1.4 Wall Construction - Predominant external wall type by dwelling tenureTable 1.5 Wall Construction - Predominant external wall type by government regionTable 2.1 Cavity Wall Insulation - Frequency of cavity wall insulationTable 2.2 Cavity Wall Insulation - Frequency of cavity wall insulation by tenureTable 2.3 Cavity Wall Insulation - Frequency of cavity wall insulation by dwelling ageTable 2.4 Cavity Wall Insulation - Frequency of cavity wall insulation by combined dwelling age & typeTable 2.5 Cavity Wall Insulation - Frequency of cavity wall insulation by government regionTable 3.1 Loft Insulation - Houses and bungalows with unconverted loftsTable 3.2 Loft insulation - Thickness of insulationTable 3.3 Loft Insulation - Frequency analysis of thickness by dwelling ageTable 3.4 Loft Insulation - Frequency analysis of thickness by combined dweliing age and typeTable 3.5 Loft Insulation - Frequency analysis of thickness by tenureTable 3.6 Loft Insulation - Frequency analysis of thickness by government regionTable 4.1 Solid Wall Insulation - Frequency of solid wall insulationTable 4.1 Solid Wall Insulation - Frequency of solid wall insulation by private / socialTable 5.1 Double Glazing - Proportion of dwelling double glazedTable 5.2 Double Glazing - Proportion of dwelling double glazed by dwelling ageTable 5.3 Double Glazing - Proportion of dwelling double glazed by tenureTable 5.4 Double Glazing - proportion of dwelling double glazed by combined dwelling age and typeTable 5.5 Double Glazing - Proportion of dwelling double glazed by government regionTable 5.6 Double Glazing - Predominant frame typeTable 6.1 Hot Water Cylinder Insulation - Proportion of dwellings with hot water cylinder Table 6.2 Hot Water Cylinder Insulation - Type of insulationTable 6.3 Hot Water Cylinder Insulation - Hot water cylinder insulation by dwelling ageTable 6.4 Hot Water Cylinder Insulation - Hot water cylinder insulation by combined dwelling age and typeTable 6.5 Hot Water Cylinder Insulation - Hot water cylinder insulation by tenureTable 6.6 Hot Water Cylinder Insulation - Hot water cylinder insulation by government region

Table 1.1 Wall Construction - Predominant external wall type
count (000s), (column%)predominant wall type no dwellingscavity 14,740
( 69.7 )solid 6,188
( 29.3 )other 212
( 1.0 )total 21,140
( 100.0 )base: all dwellings(grossed by dwellings)

Table 1.2 Wall Construction - Predominant external wall type by dwelling age
count(000s), (row%), (column%)predominant wall type pre 1919 1919-1944 1945-1964 1965-1980 post 1980 Totalcavity 656 2,186 3,857 4,232 3,810 14,740
( 4.4 ) ( 14.8 ) ( 26.2 ) ( 28.7 ) ( 25.8 ) ( 100.0 )( 14.9 ) ( 58.5 ) ( 86.2 ) ( 91.9 ) ( 97.3 ) ( 69.7 )
solid 3732 1538 597 273 48 6188( 60.3 ) ( 24.9 ) ( 9.6 ) ( 4.4 ) ( 0.8 ) ( 100.0 )( 84.7 ) ( 41.1 ) ( 13.3 ) ( 5.9 ) ( 1.2 ) ( 29.3 )
other 19 15 23 99 57 212( 8.8 ) ( 7.0 ) ( 10.7 ) ( 46.6 ) ( 26.9 ) ( 100.0 )( 0.4 ) ( 0.4 ) ( 0.5 ) ( 2.1 ) ( 1.5 ) ( 1.0 )
total 4,406 3,739 4,476 4,604 3,915 21,140( 20.8 ) ( 17.7 ) ( 21.2 ) ( 21.8 ) ( 18.5 ) ( 100.0 )( 100.0 ) ( 100.0 ) ( 100.0 ) ( 100.0 ) ( 100.0 ) ( 100.0 )
base: all dwellings(grossed by dwellings)
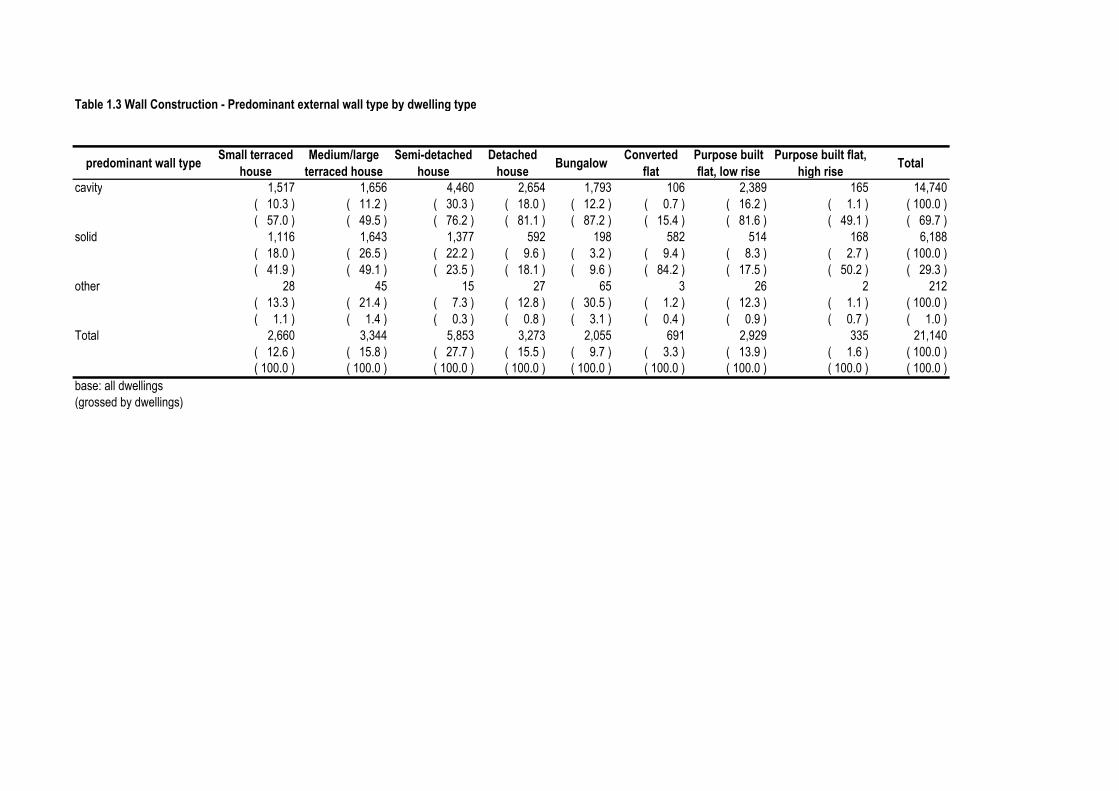
Table 1.3 Wall Construction - Predominant external wall type by dwelling type
predominant wall typeSmall terraced
houseMedium/large
terraced houseSemi-detached
houseDetached
houseBungalow
Converted flat
Purpose built flat, low rise
Purpose built flat, high rise
Total
cavity 1,517 1,656 4,460 2,654 1,793 106 2,389 165 14,740( 10.3 ) ( 11.2 ) ( 30.3 ) ( 18.0 ) ( 12.2 ) ( 0.7 ) ( 16.2 ) ( 1.1 ) ( 100.0 )( 57.0 ) ( 49.5 ) ( 76.2 ) ( 81.1 ) ( 87.2 ) ( 15.4 ) ( 81.6 ) ( 49.1 ) ( 69.7 )
solid 1,116 1,643 1,377 592 198 582 514 168 6,188( 18.0 ) ( 26.5 ) ( 22.2 ) ( 9.6 ) ( 3.2 ) ( 9.4 ) ( 8.3 ) ( 2.7 ) ( 100.0 )( 41.9 ) ( 49.1 ) ( 23.5 ) ( 18.1 ) ( 9.6 ) ( 84.2 ) ( 17.5 ) ( 50.2 ) ( 29.3 )
other 28 45 15 27 65 3 26 2 212( 13.3 ) ( 21.4 ) ( 7.3 ) ( 12.8 ) ( 30.5 ) ( 1.2 ) ( 12.3 ) ( 1.1 ) ( 100.0 )( 1.1 ) ( 1.4 ) ( 0.3 ) ( 0.8 ) ( 3.1 ) ( 0.4 ) ( 0.9 ) ( 0.7 ) ( 1.0 )
Total 2,660 3,344 5,853 3,273 2,055 691 2,929 335 21,140( 12.6 ) ( 15.8 ) ( 27.7 ) ( 15.5 ) ( 9.7 ) ( 3.3 ) ( 13.9 ) ( 1.6 ) ( 100.0 )( 100.0 ) ( 100.0 ) ( 100.0 ) ( 100.0 ) ( 100.0 ) ( 100.0 ) ( 100.0 ) ( 100.0 ) ( 100.0 )
base: all dwellings(grossed by dwellings)

Table 1.4 Wall Construction - Predominant external wall type by dwelling tenure
count(000s), (row%), (column%)predominant wall type Owner Occupied Private Rented Local Authority RSL Totalcavity 10,398 1,067 2,146 1,129 14,740
( 70.5 ) ( 7.2 ) ( 14.6 ) ( 7.7 ) ( 100.0 )( 70.4 ) ( 48.7 ) ( 76.9 ) ( 81.4 ) ( 69.7 )
solid 4233 1101 609 245 6188( 68.4 ) ( 17.8 ) ( 9.8 ) ( 4.0 ) ( 100.0 )( 28.7 ) ( 50.2 ) ( 21.8 ) ( 17.7 ) ( 29.3 )
other 140 23 36 13 212( 66.1 ) ( 10.9 ) ( 16.8 ) ( 6.3 ) ( 100.0 )( 0.9 ) ( 1.1 ) ( 1.3 ) ( 1.0 ) ( 1.0 )
Total 14,771 2,191 2,790 1,388 21,140( 69.9 ) ( 10.4 ) ( 13.2 ) ( 6.6 ) ( 100.0 )( 100.0 ) ( 100.0 ) ( 100.0 ) ( 100.0 ) ( 100.0 )
base: all dwellings(grossed by dwellings)

Table 1.5 Wall Construction - Predominant external wall type by government region
count(000s), (row%), (column%)
predominant wall type North EastYorkshire & Humberside
North West & Merseyside
East Midlands
West Midlands
South West Eastern South East London Total
cavity 920 1,576 2,191 1,301 1,469 1,496 1,753 2,714 1,319 14,740( 6.2 ) ( 10.7 ) ( 14.9 ) ( 8.8 ) ( 10.0 ) ( 10.2 ) ( 11.9 ) ( 18.4 ) ( 9.0 ) ( 100.0 )( 85.6 ) ( 71.4 ) ( 75.0 ) ( 70.7 ) ( 68.3 ) ( 70.6 ) ( 75.3 ) ( 79.2 ) ( 42.9 ) ( 69.7 )
solid 151 618 707 530 672 591 530 654 1,736 6,188( 2.4 ) ( 10.0 ) ( 11.4 ) ( 8.6 ) ( 10.9 ) ( 9.5 ) ( 8.6 ) ( 10.6 ) ( 28.1 ) ( 100.0 )( 14.0 ) ( 28.0 ) ( 24.2 ) ( 28.8 ) ( 31.2 ) ( 27.9 ) ( 22.8 ) ( 19.1 ) ( 56.4 ) ( 29.3 )
other 4 12 21 9 10 32 44 59 20 212( 1.9 ) ( 5.8 ) ( 10.1 ) ( 4.4 ) ( 4.8 ) ( 14.9 ) ( 20.6 ) ( 28.0 ) ( 9.6 ) ( 100.0 )( 0.4 ) ( 0.6 ) ( 0.7 ) ( 0.5 ) ( 0.5 ) ( 1.5 ) ( 1.9 ) ( 1.7 ) ( 0.7 ) ( 1.0 )
Total 1,074 2,207 2,919 1,841 2,151 2,119 2,327 3,428 3,076 21,140( 5.1 ) ( 10.4 ) ( 13.8 ) ( 8.7 ) ( 10.2 ) ( 10.0 ) ( 11.0 ) ( 16.2 ) ( 14.5 ) ( 100.0 )( 100.0 ) ( 100.0 ) ( 100.0 ) ( 100.0 ) ( 100.0 ) ( 100.0 ) ( 100.0 ) ( 100.0 ) ( 100.0 ) ( 100.0 )
base: all dwellings(grossed by dwellings)

Table 2.1 Cavity Wall Insulation - Frequency of cavity wall insulation
count(000s), (column%)Cavity wall insulation present? DwellingsNo 9,538
( 64.7)Yes 5,202
( 35.3)Total 14,740
( 100.0)base: all dwellings with predominantly cavity external walls(grossed by dwellings)

Table 2.2 Cavity Wall Insulation - Frequency of cavity wall insulation by tenure
count(000s), (row%), (column%)Cavity wall insulation present? Owner Occupied Private Rented Local Authority RSL TotalNo 6,741 769 1,397 632 9,538
( 70.7 ) ( 8.1 ) ( 14.6 ) ( 6.6 ) ( 100.0 )( 64.8 ) ( 72.1 ) ( 65.1 ) ( 55.9 ) ( 64.7 )
Yes 3,657 298 749 498 5,202( 70.3 ) ( 5.7 ) ( 14.4 ) ( 9.6 ) ( 100.0 )( 35.2 ) ( 27.9 ) ( 34.9 ) ( 44.1 ) ( 35.3 )
Total 10,398 1,067 2,146 1,129 14,740( 70.5 ) ( 7.2 ) ( 14.6 ) ( 7.7 ) ( 100.0 )( 100.0 ) ( 100.0 ) ( 100.0 ) ( 100.0 ) ( 100.0 )
base: all dwellings with predominantly cavity external walls(grossed by dwellings)

Table 2.3 Cavity Wall Insulation - Frequency of cavity wall insulation by dwelling age
count(000s), (row%), (column%)Cavity wall insulation present? pre 1919 1919-1944 1945-1964 1965-1980 post 1980 Total
No 569 1,733 2,694 2,902 1,639 9,538( 6.0 ) ( 18.2 ) ( 28.2 ) ( 30.4 ) ( 17.2 ) ( 100.0 )( 86.9 ) ( 79.3 ) ( 69.8 ) ( 68.6 ) ( 43.0 ) ( 64.7 )
Yes 86 453 1,164 1,329 2,170 5,202( 1.7 ) ( 8.7 ) ( 22.4 ) ( 25.6 ) ( 41.7 ) ( 100.0 )( 13.1 ) ( 20.7 ) ( 30.2 ) ( 31.4 ) ( 57.0 ) ( 35.3 )
Total 656 2,186 3,857 4,232 3,810 14,740( 4.4 ) ( 14.8 ) ( 26.2 ) ( 28.7 ) ( 25.8 ) ( 100.0 )( 100.0 ) ( 100.0 ) ( 100.0 ) ( 100.0 ) ( 100.0 ) ( 100.0 )
base: all dwellings with predominantly cavity external walls(grossed by dwellings)

Table 2.4 Cavity Wall Insulation - Frequency of cavity wall insulation by combined dwelling age & type
count(000s), (row%), (column%)
Cavity wall insulation present?
High Rise PB Flat: All ages
Low Rise PB Flat: All
ages
Converted flat: All ages
Bungalow: All ages
Detached House: Pre
1919
Detached House: 1919
onwards
Semi Detached and Terraced Houses: Pre
1919
Semi Detached and Terraced
Houses: 1919 -1944
Semi Detached and Terraced
Houses: 1945 -1964
Semi Detached and Terraced Houses: 1965
onwards
Total
No 148 1,516 85 1,021 76 1,333 428 1,305 1,610 2,016 9,538( 1.6 ) ( 15.9 ) ( 0.9 ) ( 10.7 ) ( 0.8 ) ( 14.0 ) ( 4.5 ) ( 13.7 ) ( 16.9 ) ( 21.1 ) ( 100.0 )( 89.7 ) ( 63.4 ) ( 80.0 ) ( 57.0 ) ( 84.2 ) ( 52.0 ) ( 87.2 ) ( 79.6 ) ( 70.2 ) ( 62.8 ) ( 64.7 )
Yes 17 873 21 772 14 1,231 63 335 683 1,193 5,202( 0.3 ) ( 16.8 ) ( 0.4 ) ( 14.8 ) ( 0.3 ) ( 23.7 ) ( 1.2 ) ( 6.4 ) ( 13.1 ) ( 22.9 ) ( 100.0 )( 10.3 ) ( 36.6 ) ( 20.0 ) ( 43.0 ) ( 15.8 ) ( 48.0 ) ( 12.8 ) ( 20.4 ) ( 29.8 ) ( 37.2 ) ( 35.3 )
Total 165 2,389 106 1,793 91 2,564 491 1,639 2,293 3,209 14,740( 1.1 ) ( 16.2 ) ( 0.7 ) ( 12.2 ) ( 0.6 ) ( 17.4 ) ( 3.3 ) ( 11.1 ) ( 15.6 ) ( 21.8 ) ( 100.0 )( 100.0 ) ( 100.0 ) ( 100.0 ) ( 100.0 ) ( 100.0 ) ( 100.0 ) ( 100.0 ) ( 100.0 ) ( 100.0 ) ( 100.0 ) ( 100.0 )
base: all dwellings with predominantly cavity external walls(grossed by dwellings)
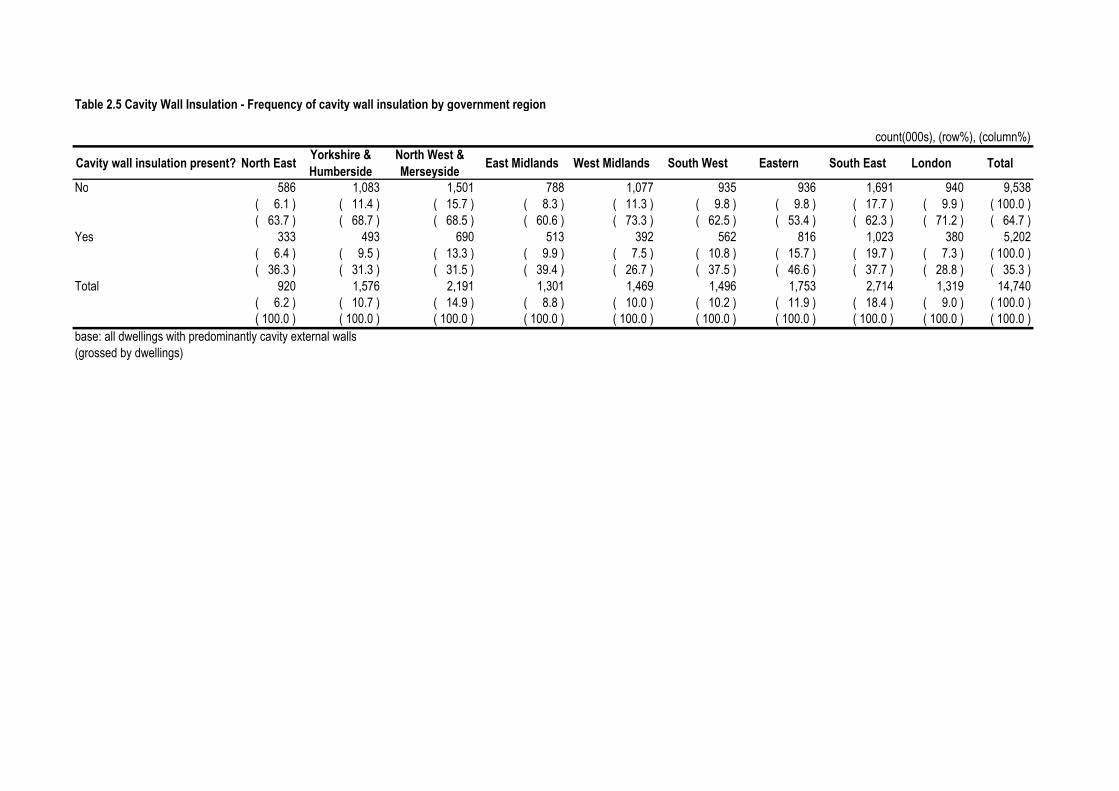
Table 2.5 Cavity Wall Insulation - Frequency of cavity wall insulation by government region
count(000s), (row%), (column%)
Cavity wall insulation present? North EastYorkshire & Humberside
North West & Merseyside
East Midlands West Midlands South West Eastern South East London Total
No 586 1,083 1,501 788 1,077 935 936 1,691 940 9,538( 6.1 ) ( 11.4 ) ( 15.7 ) ( 8.3 ) ( 11.3 ) ( 9.8 ) ( 9.8 ) ( 17.7 ) ( 9.9 ) ( 100.0 )( 63.7 ) ( 68.7 ) ( 68.5 ) ( 60.6 ) ( 73.3 ) ( 62.5 ) ( 53.4 ) ( 62.3 ) ( 71.2 ) ( 64.7 )
Yes 333 493 690 513 392 562 816 1,023 380 5,202( 6.4 ) ( 9.5 ) ( 13.3 ) ( 9.9 ) ( 7.5 ) ( 10.8 ) ( 15.7 ) ( 19.7 ) ( 7.3 ) ( 100.0 )( 36.3 ) ( 31.3 ) ( 31.5 ) ( 39.4 ) ( 26.7 ) ( 37.5 ) ( 46.6 ) ( 37.7 ) ( 28.8 ) ( 35.3 )
Total 920 1,576 2,191 1,301 1,469 1,496 1,753 2,714 1,319 14,740( 6.2 ) ( 10.7 ) ( 14.9 ) ( 8.8 ) ( 10.0 ) ( 10.2 ) ( 11.9 ) ( 18.4 ) ( 9.0 ) ( 100.0 )( 100.0 ) ( 100.0 ) ( 100.0 ) ( 100.0 ) ( 100.0 ) ( 100.0 ) ( 100.0 ) ( 100.0 ) ( 100.0 ) ( 100.0 )
base: all dwellings with predominantly cavity external walls(grossed by dwellings)

Table 3.1 Loft Insulation - Houses and bungalows with unconverted lofts
count (000s), (column%)unconverted loft? dwellingsNo 354
( 2.1 )Yes 16,831
( 97.9 )total 17,185
( 100.0 )base: all houses and bungalows(grossed by dwellings)

Table 3.2 Loft insulation - Thickness of insulation
count (000s), (column%)loft insulation thickness dwellingsNo insulation 816
( 4.8 )50 mm or under 1,989
( 11.8 )75 mm 2,042
( 12.1 )100 mm 7,667
( 45.5 )150 mm 3,050
( 18.1 )> 150 mm 1,267
( 7.5 )total 16,831
( 100.0 )base: houses and bungalows with unconverted lofts(grossed by dwellings)

Table 3.3 Loft Insulation - Frequency analysis of thickness by dwelling age
count(000s), (row%), (column%)loft insulation thickness pre 1919 1919-1944 1945-1964 1965-1980 post 1980 TotalNo insulation 517 199 100 0 0 816
( 63.4 ) ( 24.4 ) ( 12.3 ) ( 0.0 ) ( 0.0 ) ( 100.0 )( 14.4 ) ( 5.9 ) ( 2.8 ) ( 0.0 ) ( 0.0 ) ( 4.8 )
50 mm or under 427 422 455 686 0 1989( 21.5 ) ( 21.2 ) ( 22.9 ) ( 34.5 ) ( 0.0 ) ( 100.0 )( 11.9 ) ( 12.6 ) ( 12.7 ) ( 20.5 ) ( 0.0 ) ( 11.8 )
75 mm 485 438 485 634 0 2,042( 23.8 ) ( 21.5 ) ( 23.7 ) ( 31.0 ) ( 0.0 ) ( 100.0 )( 13.6 ) ( 13.1 ) ( 13.6 ) ( 18.9 ) ( 0.0 ) ( 12.1 )
100 mm 1,459 1,495 1,545 1,311 1,857 7,667( 19.0 ) ( 19.5 ) ( 20.2 ) ( 17.1 ) ( 24.2 ) ( 100.0 )( 40.7 ) ( 44.7 ) ( 43.3 ) ( 39.2 ) ( 62.3 ) ( 45.5 )
150 mm 432 502 600 454 1063 3050( 14.2 ) ( 16.5 ) ( 19.7 ) ( 14.9 ) ( 34.8 ) ( 100.0 )( 12.1 ) ( 15.0 ) ( 16.8 ) ( 13.6 ) ( 35.6 ) ( 18.1 )
> 150 mm 262 291 389 262 63 1,267( 20.7 ) ( 23.0 ) ( 30.7 ) ( 20.7 ) ( 5.0 ) ( 100.0 )( 7.3 ) ( 8.7 ) ( 10.9 ) ( 7.8 ) ( 2.1 ) ( 7.5 )
Total 3,583 3,346 3,573 3,346 2,982 16,831( 21.3 ) ( 19.9 ) ( 21.2 ) ( 19.9 ) ( 17.7 ) ( 100.0 )( 100.0 ) ( 100.0 ) ( 100.0 ) ( 100.0 ) ( 100.0 ) ( 100.0 )
base: houses and bungalows with unconverted lofts(grossed by dwellings)

Table 3.4 Loft Insulation - Frequency analysis of thickness by combined dweliing age and type
count(000s), (row%), (column%)
loft insulation thickness
Bungalow: All ages
Detached House: Pre 1919
Detached House: 1919 onwards
Semi Detached and Terraced Houses: Pre
1919
Semi Detached and Terraced Houses: 1919
-1944
Semi Detached and Terraced Houses:
1945 -1964
Semi Detached and Terraced Houses:
1965 onwardsTotal
No insulation 35 65 57 443 149 67 0 816( 4.3 ) ( 7.9 ) ( 7.0 ) ( 54.3 ) ( 18.3 ) ( 8.2 ) ( 0.0 ) ( 100.0 )( 1.8 ) ( 12.9 ) ( 2.1 ) ( 14.7 ) ( 5.5 ) ( 2.6 ) ( 0.0 ) ( 4.8 )
50 mm or under 229 61 254 354 337 323 432 1,989( 11.5 ) ( 3.1 ) ( 12.8 ) ( 17.8 ) ( 16.9 ) ( 16.3 ) ( 21.7 ) ( 100.0 )( 11.4 ) ( 12.2 ) ( 9.4 ) ( 11.7 ) ( 12.5 ) ( 12.4 ) ( 13.1 ) ( 11.8 )
75 mm 200 73 245 408 349 368 399 2,042( 9.8 ) ( 3.6 ) ( 12.0 ) ( 20.0 ) ( 17.1 ) ( 18.0 ) ( 19.6 ) ( 100.0 )( 10.0 ) ( 14.5 ) ( 9.0 ) ( 13.5 ) ( 13.0 ) ( 14.2 ) ( 12.1 ) ( 12.1 )
100 mm 988 178 1,355 1,257 1,218 1,130 1,540 7,667( 12.9 ) ( 2.3 ) ( 17.7 ) ( 16.4 ) ( 15.9 ) ( 14.7 ) ( 20.1 ) ( 100.0 )( 49.2 ) ( 35.3 ) ( 50.0 ) ( 41.7 ) ( 45.2 ) ( 43.4 ) ( 46.6 ) ( 45.5 )
150 mm 381 75 658 344 413 443 735 3,050( 12.5 ) ( 2.5 ) ( 21.6 ) ( 11.3 ) ( 13.5 ) ( 14.5 ) ( 24.1 ) ( 100.0 )( 19.0 ) ( 15.0 ) ( 24.3 ) ( 11.4 ) ( 15.3 ) ( 17.0 ) ( 22.3 ) ( 18.1 )
> 150 mm 175 51 139 209 226 271 196 1,267( 13.8 ) ( 4.0 ) ( 11.0 ) ( 16.5 ) ( 17.8 ) ( 21.4 ) ( 15.5 ) ( 100.0 )( 8.7 ) ( 10.1 ) ( 5.1 ) ( 6.9 ) ( 8.4 ) ( 10.4 ) ( 5.9 ) ( 7.5 )
Total 2,009 503 2,708 3,014 2,692 2,602 3,302 16,831( 11.9 ) ( 3.0 ) ( 16.1 ) ( 17.9 ) ( 16.0 ) ( 15.5 ) ( 19.6 ) ( 100.0 )( 100.0 ) ( 100.0 ) ( 100.0 ) ( 100.0 ) ( 100.0 ) ( 100.0 ) ( 100.0 ) ( 100.0 )
base: houses and bungalows with unconverted lofts(grossed by dwellings)

Table 3.5 Loft Insulation - Frequency analysis of thickness by tenure
count(000s), (row%), (column%)loft insulation thickness Owner Occupied Private Rented Local Authority RSL TotalNo insulation 618 164 23 11 816
( 75.7 ) ( 20.1 ) ( 2.8 ) ( 1.4 ) ( 100.0 )( 4.7 ) ( 12.2 ) ( 1.5 ) ( 1.6 ) ( 4.8 )
50 mm or under 1621 171 144 54 1989( 81.5 ) ( 8.6 ) ( 7.2 ) ( 2.7 ) ( 100.0 )( 12.3 ) ( 12.8 ) ( 9.2 ) ( 7.6 ) ( 11.8 )
75 mm 1,636 178 180 49 2,042( 80.1 ) ( 8.7 ) ( 8.8 ) ( 2.4 ) ( 100.0 )( 12.4 ) ( 13.3 ) ( 11.5 ) ( 6.9 ) ( 12.1 )
100 mm 6,071 610 704 282 7,667( 79.2 ) ( 8.0 ) ( 9.2 ) ( 3.7 ) ( 100.0 )( 46.0 ) ( 45.5 ) ( 44.8 ) ( 39.6 ) ( 45.5 )
150 mm 2,341 156 313 240 3,050( 76.7 ) ( 5.1 ) ( 10.3 ) ( 7.9 ) ( 100.0 )( 17.7 ) ( 11.7 ) ( 19.9 ) ( 33.8 ) ( 18.1 )
> 150 mm 925 60 207 76 1,267( 73.0 ) ( 4.7 ) ( 16.3 ) ( 6.0 ) ( 100.0 )( 7.0 ) ( 4.5 ) ( 13.1 ) ( 10.7 ) ( 7.5 )
Total 13,210 1,339 1,571 712 16,831( 78.5 ) ( 8.0 ) ( 9.3 ) ( 4.2 ) ( 100.0 )( 100.0 ) ( 100.0 ) ( 100.0 ) ( 100.0 ) ( 100.0 )
base: houses and bungalows with unconverted lofts(grossed by dwellings)

Table 3.6 Loft Insulation - Frequency analysis of thickness by government region
count(000s), (row%), (column%)
loft insulation thickness North EastYorkshire & Humberside
North West & Merseyside
East Midlands
West Midlands
South West Eastern South East London Total
No insulation 20 166 121 57 84 91 65 112 100 816( 2.4 ) ( 20.3 ) ( 14.8 ) ( 7.0 ) ( 10.3 ) ( 11.2 ) ( 8.0 ) ( 13.7 ) ( 12.3 ) ( 100.0 )( 2.2 ) ( 8.8 ) ( 4.8 ) ( 3.4 ) ( 4.6 ) ( 5.1 ) ( 3.4 ) ( 4.1 ) ( 6.2 ) ( 4.8 )
50 mm or under 83 175 364 207 222 183 256 328 170 1,989( 4.2 ) ( 8.8 ) ( 18.3 ) ( 10.4 ) ( 11.2 ) ( 9.2 ) ( 12.8 ) ( 16.5 ) ( 8.6 ) ( 100.0 )( 9.1 ) ( 9.3 ) ( 14.5 ) ( 12.5 ) ( 12.2 ) ( 10.3 ) ( 13.2 ) ( 12.0 ) ( 10.7 ) ( 11.8 )
75 mm 106 244 325 214 213 198 284 284 174 2,042( 5.2 ) ( 12.0 ) ( 15.9 ) ( 10.5 ) ( 10.4 ) ( 9.7 ) ( 13.9 ) ( 13.9 ) ( 8.5 ) ( 100.0 )( 11.6 ) ( 13.0 ) ( 13.0 ) ( 12.9 ) ( 11.7 ) ( 11.2 ) ( 14.7 ) ( 10.3 ) ( 10.9 ) ( 12.1 )
100 mm 427 838 1,072 688 720 816 852 1,442 813 7,667( 5.6 ) ( 10.9 ) ( 14.0 ) ( 9.0 ) ( 9.4 ) ( 10.6 ) ( 11.1 ) ( 18.8 ) ( 10.6 ) ( 100.0 )( 46.7 ) ( 44.5 ) ( 42.8 ) ( 41.5 ) ( 39.6 ) ( 46.1 ) ( 44.0 ) ( 52.5 ) ( 50.8 ) ( 45.5 )
150 mm 205 298 443 310 349 351 364 452 279 3,050( 6.7 ) ( 9.8 ) ( 14.5 ) ( 10.2 ) ( 11.4 ) ( 11.5 ) ( 11.9 ) ( 14.8 ) ( 9.2 ) ( 100.0 )( 22.4 ) ( 15.8 ) ( 17.7 ) ( 18.7 ) ( 19.2 ) ( 19.8 ) ( 18.8 ) ( 16.4 ) ( 17.5 ) ( 18.1 )
> 150 mm 73 161 182 183 229 132 116 128 63 1,267( 5.8 ) ( 12.7 ) ( 14.3 ) ( 14.4 ) ( 18.1 ) ( 10.4 ) ( 9.1 ) ( 10.1 ) ( 5.0 ) ( 100.0 )( 8.0 ) ( 8.6 ) ( 7.2 ) ( 11.0 ) ( 12.6 ) ( 7.5 ) ( 6.0 ) ( 4.7 ) ( 4.0 ) ( 7.5 )
Total 915 1,882 2,507 1,658 1,818 1,771 1,936 2,746 1,599 16,831( 5.4 ) ( 11.2 ) ( 14.9 ) ( 9.9 ) ( 10.8 ) ( 10.5 ) ( 11.5 ) ( 16.3 ) ( 9.5 ) ( 100.0 )( 100.0 ) ( 100.0 ) ( 100.0 ) ( 100.0 ) ( 100.0 ) ( 100.0 ) ( 100.0 ) ( 100.0 ) ( 100.0 ) ( 100.0 )
base: houses and bungalows with unconverted lofts(grossed by dwellings)

Table 4.1 Solid Wall Insulation - Frequency of solid wall insulation
count(000s), (row%)solid wall insulation present? TotalNo 6,059
( 97.9 )Yes 129
( 2.1 )Total 6,188
( 100.0 )base: dwellings with predominantly solid walls(grossed by dwellings)

Table 4.1 Solid Wall Insulation - Frequency of solid wall insulation by private / social
count(000s), (row%), (column%)solid wall insulation present? Private Social TotalNo 5,287 772 6,059
( 87.3 ) ( 12.7 ) ( 100.0 )( 99.1 ) ( 91.4 ) ( 92.0 )
Yes 47 83 129( 65.3 ) ( 63.9 ) ( 100.0 )( 0.9 ) ( 9.7 ) ( 8.0 )
Total 5,334 854 6,188( 86.2 ) ( 13.8 ) ( 100.0 )( 100.0 ) ( 100.0 ) ( 100.0 )
base: dwellings with predominantly solid walls(grossed by dwellings)
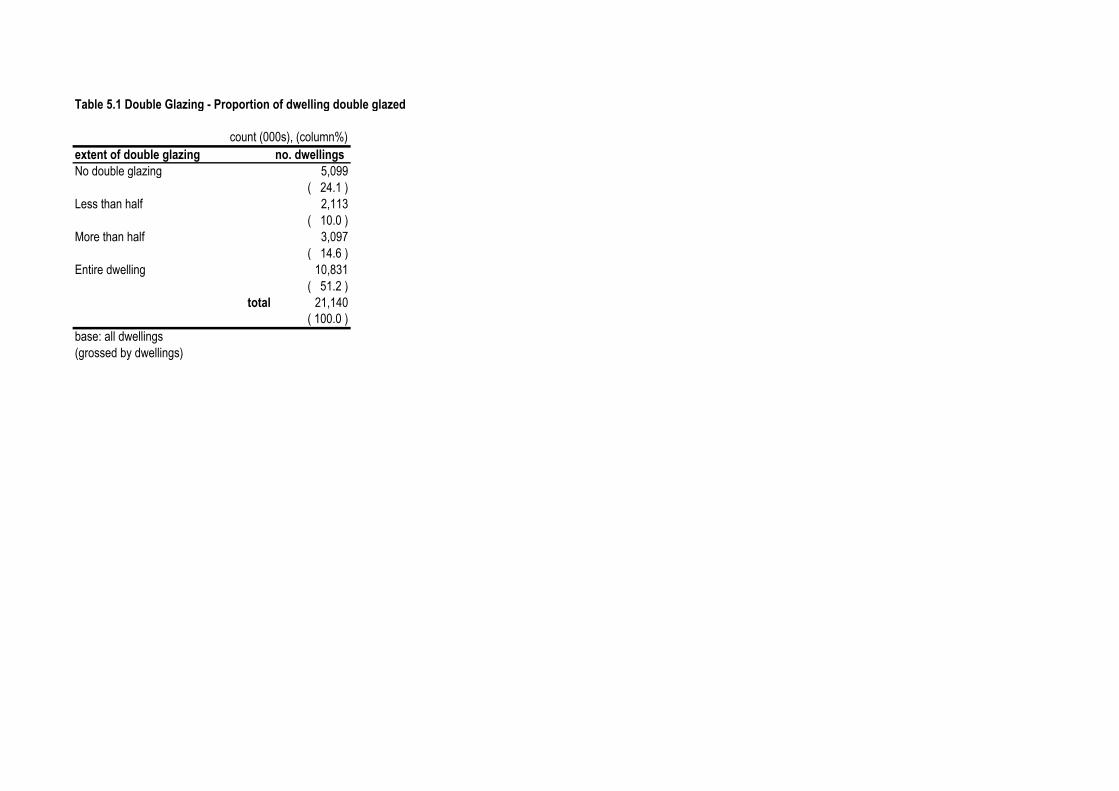
Table 5.1 Double Glazing - Proportion of dwelling double glazed
count (000s), (column%)extent of double glazing no. dwellingsNo double glazing 5,099
( 24.1 )Less than half 2,113
( 10.0 )More than half 3,097
( 14.6 )Entire dwelling 10,831
( 51.2 )total 21,140
( 100.0 )base: all dwellings(grossed by dwellings)

Table 5.2 Double Glazing - Proportion of dwelling double glazed by dwelling age
count(000s), (row%), (column%)extent of double glazing pre 1919 1919-1944 1945-1964 1965-1980 post 1980 Totalno double glazing 1,812 786 914 831 755 5,099
( 35.5 ) ( 15.4 ) ( 17.9 ) ( 16.3 ) ( 14.8 ) ( 100.0 )( 41.1 ) ( 21.0 ) ( 20.4 ) ( 18.1 ) ( 19.3 ) ( 24.1 )
less than half double glazed 692 478 346 355 241 2113( 32.7 ) ( 22.6 ) ( 16.4 ) ( 16.8 ) ( 11.4 ) ( 100.0 )( 15.7 ) ( 12.8 ) ( 7.7 ) ( 7.7 ) ( 6.2 ) ( 10.0 )
more than half double glazed 679 868 753 622 176 3,097( 21.9 ) ( 28.0 ) ( 24.3 ) ( 20.1 ) ( 5.7 ) ( 100.0 )( 15.4 ) ( 23.2 ) ( 16.8 ) ( 13.5 ) ( 4.5 ) ( 14.7 )
entire dwelling double glazed 1,223 1,607 2,463 2,796 2,742 10,831( 11.3 ) ( 14.8 ) ( 22.7 ) ( 25.8 ) ( 25.3 ) ( 100.0 )( 27.8 ) ( 43.0 ) ( 55.0 ) ( 60.7 ) ( 70.0 ) ( 51.2 )
total 4,406 3,739 4,476 4,604 3,915 21,140( 20.8 ) ( 17.7 ) ( 21.2 ) ( 21.8 ) ( 18.5 ) ( 100.0 )( 100.0 ) ( 100.0 ) ( 100.0 ) ( 100.0 ) ( 100.0 ) ( 100.0 )
base: all dwellings(grossed by dwellings)

Table 5.3 Double Glazing - Proportion of dwelling double glazed by tenure
count(000s), (row%), (column%)extent of double glazing Owner Occupied Private Rented Local Authority RSL Totalno double glazing 2,577 1,048 1,112 361 5,099
( 50.5 ) ( 20.6 ) ( 21.8 ) ( 7.1 ) ( 100.0 )( 17.4 ) ( 47.8 ) ( 39.9 ) ( 26.0 ) ( 24.1 )
less than half double glazed 1609 200 247 56 2113( 76.2 ) ( 9.5 ) ( 11.7 ) ( 2.6 ) ( 100.0 )( 10.9 ) ( 9.1 ) ( 8.8 ) ( 4.0 ) ( 10.0 )
more than half double glazed 2679 191 166 62 3097( 86.5 ) ( 6.2 ) ( 5.4 ) ( 2.0 ) ( 100.0 )( 18.1 ) ( 8.7 ) ( 6.0 ) ( 4.4 ) ( 14.7 )
entire dwelling double glazed 7,906 751 1,265 909 10,831( 73.0 ) ( 6.9 ) ( 11.7 ) ( 8.4 ) ( 100.0 )( 53.5 ) ( 34.3 ) ( 45.3 ) ( 65.5 ) ( 51.2 )
total 14,771 2,191 2,790 1,388 21,140( 69.9 ) ( 10.4 ) ( 13.2 ) ( 6.6 ) ( 100.0 )( 100.0 ) ( 100.0 ) ( 100.0 ) ( 100.0 ) ( 100.0 )
base: all dwellings(grossed by dwellings)
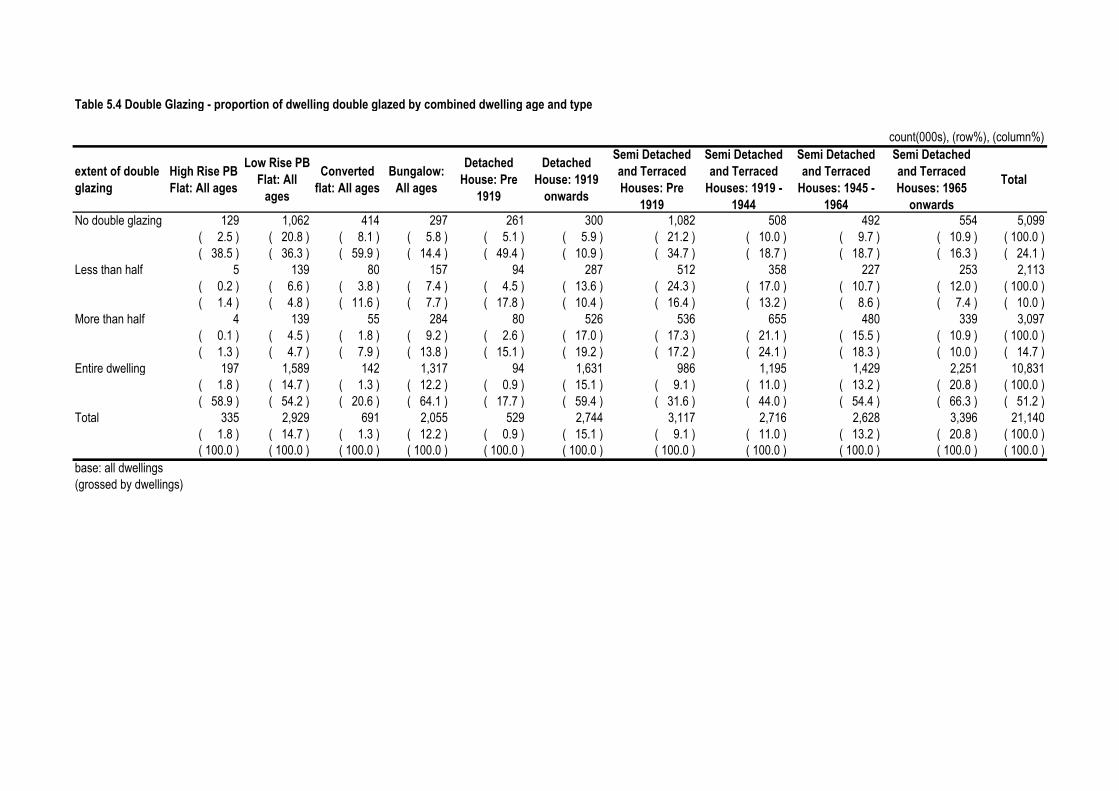
Table 5.4 Double Glazing - proportion of dwelling double glazed by combined dwelling age and type
count(000s), (row%), (column%)
extent of double glazing
High Rise PB Flat: All ages
Low Rise PB Flat: All
ages
Converted flat: All ages
Bungalow: All ages
Detached House: Pre
1919
Detached House: 1919
onwards
Semi Detached and Terraced Houses: Pre
1919
Semi Detached and Terraced
Houses: 1919 -1944
Semi Detached and Terraced
Houses: 1945 -1964
Semi Detached and Terraced Houses: 1965
onwards
Total
No double glazing 129 1,062 414 297 261 300 1,082 508 492 554 5,099( 2.5 ) ( 20.8 ) ( 8.1 ) ( 5.8 ) ( 5.1 ) ( 5.9 ) ( 21.2 ) ( 10.0 ) ( 9.7 ) ( 10.9 ) ( 100.0 )( 38.5 ) ( 36.3 ) ( 59.9 ) ( 14.4 ) ( 49.4 ) ( 10.9 ) ( 34.7 ) ( 18.7 ) ( 18.7 ) ( 16.3 ) ( 24.1 )
Less than half 5 139 80 157 94 287 512 358 227 253 2,113( 0.2 ) ( 6.6 ) ( 3.8 ) ( 7.4 ) ( 4.5 ) ( 13.6 ) ( 24.3 ) ( 17.0 ) ( 10.7 ) ( 12.0 ) ( 100.0 )( 1.4 ) ( 4.8 ) ( 11.6 ) ( 7.7 ) ( 17.8 ) ( 10.4 ) ( 16.4 ) ( 13.2 ) ( 8.6 ) ( 7.4 ) ( 10.0 )
More than half 4 139 55 284 80 526 536 655 480 339 3,097( 0.1 ) ( 4.5 ) ( 1.8 ) ( 9.2 ) ( 2.6 ) ( 17.0 ) ( 17.3 ) ( 21.1 ) ( 15.5 ) ( 10.9 ) ( 100.0 )( 1.3 ) ( 4.7 ) ( 7.9 ) ( 13.8 ) ( 15.1 ) ( 19.2 ) ( 17.2 ) ( 24.1 ) ( 18.3 ) ( 10.0 ) ( 14.7 )
Entire dwelling 197 1,589 142 1,317 94 1,631 986 1,195 1,429 2,251 10,831( 1.8 ) ( 14.7 ) ( 1.3 ) ( 12.2 ) ( 0.9 ) ( 15.1 ) ( 9.1 ) ( 11.0 ) ( 13.2 ) ( 20.8 ) ( 100.0 )( 58.9 ) ( 54.2 ) ( 20.6 ) ( 64.1 ) ( 17.7 ) ( 59.4 ) ( 31.6 ) ( 44.0 ) ( 54.4 ) ( 66.3 ) ( 51.2 )
Total 335 2,929 691 2,055 529 2,744 3,117 2,716 2,628 3,396 21,140( 1.8 ) ( 14.7 ) ( 1.3 ) ( 12.2 ) ( 0.9 ) ( 15.1 ) ( 9.1 ) ( 11.0 ) ( 13.2 ) ( 20.8 ) ( 100.0 )( 100.0 ) ( 100.0 ) ( 100.0 ) ( 100.0 ) ( 100.0 ) ( 100.0 ) ( 100.0 ) ( 100.0 ) ( 100.0 ) ( 100.0 ) ( 100.0 )
base: all dwellings(grossed by dwellings)

Table 5.5 Double Glazing - Proportion of dwelling double glazed by government region
count(000s), (row%), (column%)
extent of double glazing North EastYorkshire & Humberside
North West & Merseyside
East Midlands
West Midlands
South West Eastern South East London Total
No double glazing 313 510 650 380 455 437 465 752 1,137 5,099( 6.1 ) ( 10.0 ) ( 12.7 ) ( 7.5 ) ( 8.9 ) ( 8.6 ) ( 9.1 ) ( 14.7 ) ( 22.3 ) ( 100.0 )( 29.1 ) ( 23.1 ) ( 22.3 ) ( 20.7 ) ( 21.2 ) ( 20.6 ) ( 20.0 ) ( 21.9 ) ( 37.0 ) ( 24.1 )
Less than half 91 258 368 196 236 175 201 315 272 2,113( 4.3 ) ( 12.2 ) ( 17.4 ) ( 9.3 ) ( 11.2 ) ( 8.3 ) ( 9.5 ) ( 14.9 ) ( 12.9 ) ( 100.0 )( 8.5 ) ( 11.7 ) ( 12.6 ) ( 10.6 ) ( 11.0 ) ( 8.3 ) ( 8.6 ) ( 9.2 ) ( 8.8 ) ( 10.0 )
More than half 144 288 495 296 385 343 310 474 362 3,097( 4.7 ) ( 9.3 ) ( 16.0 ) ( 9.5 ) ( 12.4 ) ( 11.1 ) ( 10.0 ) ( 15.3 ) ( 11.7 ) ( 100.0 )( 13.4 ) ( 13.1 ) ( 17.0 ) ( 16.1 ) ( 17.9 ) ( 16.2 ) ( 13.3 ) ( 13.8 ) ( 11.8 ) ( 14.7 )
Entire dwelling 526 1,150 1,405 969 1,074 1,163 1,352 1,887 1,305 10,831( 4.9 ) ( 10.6 ) ( 13.0 ) ( 8.9 ) ( 9.9 ) ( 10.7 ) ( 12.5 ) ( 17.4 ) ( 12.0 ) ( 100.0 )( 48.9 ) ( 52.1 ) ( 48.1 ) ( 52.7 ) ( 49.9 ) ( 54.9 ) ( 58.1 ) ( 55.1 ) ( 42.4 ) ( 51.2 )
Total 1,074 2,207 2,919 1,841 2,151 2,119 2,327 3,428 3,076 21,140( 5.1 ) ( 10.4 ) ( 13.8 ) ( 8.7 ) ( 10.2 ) ( 10.0 ) ( 11.0 ) ( 16.2 ) ( 14.5 ) ( 100.0 )( 100.0 ) ( 100.0 ) ( 100.0 ) ( 100.0 ) ( 100.0 ) ( 100.0 ) ( 100.0 ) ( 100.0 ) ( 100.0 ) ( 100.0 )
base: all dwellings(grossed by dwellings)

Table 5.6 Double Glazing - Predominant frame type
count (000s), (column%)type of window no dwellingsTimber 2,313
( 14.4 )UPVC 12,577
( 78.4 )Aluminium 1,151
( 7.2 )total 16,041
( 100.0 )base: all dwellings with some double glazing(grossed by dwellings)

Table 6.1 Hot Water Cylinder Insulation - Proportion of dwellings with hot water cylinder
count(000s), (column%)Hot Water Cylinder present? DwellingsNo 5,281
( 25.0)Yes 15,859
( 75.0)Total 21,140base: all dwellings(grossed by dwellings)

Table 6.2 Hot Water Cylinder Insulation - Type of insulation
count (000s), (column%)hot water cylinder insulation no dwellingsfoam 8,907
( 56.2 )jacket 6,590
( 41.6 )none 362
( 2.3 )total 15,859
( 100.0 )base: all dwellings with hot water cylinder(grossed by dwellings)

Table 6.3 Hot Water Cylinder Insulation - Hot water cylinder insulation by dwelling age
count(000s), (row%), (column%)hot water cylinder insulation pre 1919 1919-1944 1945-1964 1965-1980 post 1980 Totalfoam 1,367 1,289 1,817 1,905 2,528 8,906
( 15.3 ) ( 14.5 ) ( 20.4 ) ( 21.4 ) ( 28.4 ) ( 100.0 )( 52.1 ) ( 50.5 ) ( 52.8 ) ( 52.1 ) ( 78.5 ) ( 57.5 )
jacket 1,256 1,263 1,625 1,752 693 6,590( 19.1 ) ( 19.2 ) ( 24.7 ) ( 26.6 ) ( 10.5 ) ( 100.0 )( 47.9 ) ( 49.5 ) ( 47.2 ) ( 47.9 ) ( 21.5 ) ( 42.5 )
Total 2,623 2,553 3,441 3,658 3,222 15,497( 16.9 ) ( 16.5 ) ( 22.2 ) ( 23.6 ) ( 20.8 ) ( 100.0 )( 100.0 ) ( 100.0 ) ( 100.0 ) ( 100.0 ) ( 100.0 ) ( 100.0 )
base: all dwellings with insulated hot water cylinders(grossed by dwellings)

Table 6.4 Hot Water Cylinder Insulation - Hot water cylinder insulation by combined dwelling age and type
count(000s), (row%), (column%)
hot water cylinder insulation
High Rise PB Flat: All ages
Low Rise PB Flat: All
ages
Converted flat: All ages
Bungalow: All ages
Detached House: Pre
1919
Detached House: 1919
onwards
Semi Detached and Terraced Houses: Pre
1919
Semi Detached and Terraced
Houses: 1919 -1944
Semi Detached and Terraced
Houses: 1945 -1964
Semi Detached and Terraced Houses: 1965
onwards
Total
foam 102 1,190 180 966 278 1,637 893 932 1,037 1,692 8,906( 1.1 ) ( 13.4 ) ( 2.0 ) ( 10.8 ) ( 3.1 ) ( 18.4 ) ( 10.0 ) ( 10.5 ) ( 11.6 ) ( 19.0 ) ( 100.0 )( 43.9 ) ( 57.9 ) ( 53.4 ) ( 58.9 ) ( 63.9 ) ( 68.1 ) ( 49.2 ) ( 50.0 ) ( 50.7 ) ( 63.4 ) ( 57.5 )
jacket 130 866 157 674 157 765 921 933 1,007 979 6,590( 2.0 ) ( 13.1 ) ( 2.4 ) ( 10.2 ) ( 2.4 ) ( 11.6 ) ( 14.0 ) ( 14.2 ) ( 15.3 ) ( 14.8 ) ( 100.0 )( 56.1 ) ( 42.1 ) ( 46.6 ) ( 41.1 ) ( 36.1 ) ( 31.9 ) ( 50.8 ) ( 50.0 ) ( 49.3 ) ( 36.6 ) ( 42.5 )
Total 232 2,055 337 1,640 435 2,402 1,814 1,866 2,044 2,671 15,497( 1.5 ) ( 13.3 ) ( 2.2 ) ( 10.6 ) ( 2.8 ) ( 15.5 ) ( 11.7 ) ( 12.0 ) ( 13.2 ) ( 17.2 ) ( 100.0 )( 100.0 ) ( 100.0 ) ( 100.0 ) ( 100.0 ) ( 100.0 ) ( 100.0 ) ( 100.0 ) ( 100.0 ) ( 100.0 ) ( 100.0 ) ( 100.0 )
base: all dwellings with insulated hot water cylinder(grossed by dwellings)

Table 6.5 Hot Water Cylinder Insulation - Hot water cylinder insulation by tenure
count(000s), (row%), (column%)hot water cylinder insulation Owner Occupied Private Rented Local Authority RSL Totalfoam 6,186 832 1,184 705 8,906
( 69.5 ) ( 9.3 ) ( 13.3 ) ( 7.9 ) ( 100.0 )( 57.1 ) ( 57.7 ) ( 53.9 ) ( 68.3 ) ( 57.5 )
jacket 4641 610 1012 328 6590( 70.4 ) ( 9.3 ) ( 15.4 ) ( 5.0 ) ( 100.0 )( 42.9 ) ( 42.3 ) ( 46.1 ) ( 31.7 ) ( 42.5 )
Total 10,826 1,441 2,197 1,032 15,497( 69.9 ) ( 9.3 ) ( 14.2 ) ( 6.7 ) ( 100.0 )( 100.0 ) ( 100.0 ) ( 100.0 ) ( 100.0 ) ( 100.0 )
base: all dwellings with insulated hot water cylinders(grossed by dwellings)

Table 6.6 Hot Water Cylinder Insulation - Hot water cylinder insulation by government region
count(000s), (row%), (column%)
hot water cylinder insulation North EastYorkshire & Humberside
North West & Merseyside
East Midlands
West Midlands
South West Eastern South East London Total
foam 352 705 740 881 770 1,005 1,302 1,978 1,174 8,906( 3.9 ) ( 7.9 ) ( 8.3 ) ( 9.9 ) ( 8.6 ) ( 11.3 ) ( 14.6 ) ( 22.2 ) ( 13.2 ) ( 100.0 )( 46.5 ) ( 47.7 ) ( 38.8 ) ( 58.5 ) ( 49.8 ) ( 65.7 ) ( 65.2 ) ( 71.8 ) ( 58.1 ) ( 57.5 )
jacket 405 772 1,165 625 777 526 696 777 847 6,590( 6.1 ) ( 11.7 ) ( 17.7 ) ( 9.5 ) ( 11.8 ) ( 8.0 ) ( 10.6 ) ( 11.8 ) ( 12.8 ) ( 100.0 )( 53.5 ) ( 52.3 ) ( 61.2 ) ( 41.5 ) ( 50.2 ) ( 34.3 ) ( 34.8 ) ( 28.2 ) ( 41.9 ) ( 42.5 )
Total 756 1,477 1,905 1,506 1,547 1,531 1,999 2,755 2,021 15,497( 4.9 ) ( 9.5 ) ( 12.3 ) ( 9.7 ) ( 10.0 ) ( 9.9 ) ( 12.9 ) ( 17.8 ) ( 13.0 ) ( 100.0 )( 100.0 ) ( 100.0 ) ( 100.0 ) ( 100.0 ) ( 100.0 ) ( 100.0 ) ( 100.0 ) ( 100.0 ) ( 100.0 ) ( 100.0 )
base: all dwellings with insulated hot water cylinder(grossed by dwellings)