thermal performance of unvented attics in hot-dry … · thermal performance of unvented attics in...
TRANSCRIPT
Thermal Performance ofUnvented Attics in Hot-DryClimates
April 2002 • NREL/TP-550-30839
Robert Hendron and Ren AndersonNational Renewable Energy Laboratory
Paul ReevesPartnership for Resource Conservation
Ed HancockMountain Energy Partnership
National Renewable Energy Laboratory1617 Cole BoulevardGolden, Colorado 80401-3393NREL is a U.S. Department of Energy LaboratoryOperated by Midwest Research Institute •••• Battelle •••• Bechtel
Contract No. DE-AC36-99-GO10337

National Renewable Energy Laboratory1617 Cole BoulevardGolden, Colorado 80401-3393NREL is a U.S. Department of Energy LaboratoryOperated by Midwest Research Institute •••• Battelle •••• Bechtel
Contract No. DE-AC36-99-GO10337
April 2002 • NREL/TP-550-30839
Thermal Performance ofUnvented Attics in Hot-DryClimates
Robert Hendron and Ren AndersonNational Renewable Energy Laboratory
Paul ReevesPartnership for Resource Conservation
Ed HancockMountain Energy PartnershipPrepared under Task No. BET2.8004

NOTICE
This report was prepared as an account of work sponsored by an agency of the United Statesgovernment. Neither the United States government nor any agency thereof, nor any of their employees,makes any warranty, express or implied, or assumes any legal liability or responsibility for the accuracy,completeness, or usefulness of any information, apparatus, product, or process disclosed, or representsthat its use would not infringe privately owned rights. Reference herein to any specific commercialproduct, process, or service by trade name, trademark, manufacturer, or otherwise does not necessarilyconstitute or imply its endorsement, recommendation, or favoring by the United States government or anyagency thereof. The views and opinions of authors expressed herein do not necessarily state or reflectthose of the United States government or any agency thereof.
Available electronically at http://www.osti.gov/bridge
Available for a processing fee to U.S. Department of Energyand its contractors, in paper, from:
U.S. Department of EnergyOffice of Scientific and Technical InformationP.O. Box 62Oak Ridge, TN 37831-0062phone: 865.576.8401fax: 865.576.5728email: [email protected]
Available for sale to the public, in paper, from:U.S. Department of CommerceNational Technical Information Service5285 Port Royal RoadSpringfield, VA 22161phone: 800.553.6847fax: 703.605.6900email: [email protected] ordering: http://www.ntis.gov/ordering.htm
Printed on paper containing at least 50% wastepaper, including 20% postconsumer waste
i
Executive Summary
Introduction
As unvented attics become a more common design feature implemented by Building Americapartners in hot-dry climates of the United States, more attention has been focused on how thisapproach affects heating and cooling energy consumption. By eliminating the ridge and eavevents that circulate outside air through the attic in most new houses, and by moving theinsulation to the roof plane, an unvented attic becomes a semiconditioned space and creates amore hospitable environment for cooling ducts that may be present. An energy trade-off is made,however, because the additional surface area (and perhaps reduced insulation thickness) increasesthe building loss coefficient of the house. Other advantages and disadvantages, unrelated toenergy, must also be considered. This report addresses only the energy-related effects ofunvented attics in hot-dry climates.
Approach
The National Renewable Energy Laboratory (NREL) has conducted field testing and hourlybuilding simulations for several Building America projects to evaluate energy use in vented andunvented attics in hot-dry climates. The projects yielding the most conclusive results were in LasVegas, Nevada, and Tucson, Arizona. Testing was conducted under winter and summerconditions in Las Vegas and under summer conditions in Tucson. One Las Vegas prototypehouse and one nearly identical base-case house (differing only in the attic design) were testedduring the summer using holes of different sizes to induce various amounts of duct leakage intoeach attic. NREL performed comprehensive testing of envelope leakage, duct leakage,temperature distribution, and electricity consumption. Some of the resulting test data were usedas inputs to hourly building simulation models. The models were then calibrated with actualelectricity measurements and then used to predict seasonal or annual energy consumption underrealistic operating conditions.
Results
In summer, testing of the Las Vegas prototype house demonstrated that the thermal performanceof an unvented attic is highly dependent on duct leakage. When the ducts were well sealed, thevented attic and unvented attic showed very little difference in cooling energy. When air leakagewas increased to 200 cubic feet per minute (cfm) for both the vented and unvented attic, energysavings up to 11.5% were observed for the unvented attic. This effect was confirmed usinghourly simulations of the two houses. The simulations developed for the Las Vegas project alsopredicted that the thermal performance of the unvented attic would be highly dependent on thelocal climatic conditions. A direct comparison of the vented and unvented attics was notpossible for the Tucson test, but an energy simulation predicted either a small energy benefit or asmall energy loss for the unvented attic, depending on which energy efficiency measures wereadded to the model first. High sensitivity to attic insulation R-value, roof solar absorptivity, andair infiltration were also predicted for the unvented attic using the Tucson model.
ii
Acknowledgments
The authors express their appreciation to George James, U.S. Department of Energy ProgramManager for Building America, for his ongoing leadership and support of this research area. Wewould also like to thank Sara Farrar-Nagy of the National Renewable Energy Laboratory for herefforts in leading the test and analysis activities at NREL when this work was conducted. Inaddition, we recognize the research and design work performed by the Building ScienceConsortium and their assistance in the development of this report.

iii
Table of Contents
Introduction....................................................................................................................................... 1
Approach .......................................................................................................................................... 3
Field-Testing of Vented and Unvented Attics ............................................................................ 3
Modeling an Unvented Attic Using DOE-2.2 Results................................................................. 3
Results ............................................................................................................................................. 5
Case 1: Las Vegas, Nevada ...................................................................................................... 5
Case 2: Tucson, Arizona ......................................................................................................... 28
Extension to Other Hot-Dry/ Mixed-Dry Climates........................................................................... 40
Conclusions.................................................................................................................................... 41
Appendix: Sensitivity Analysis of the Pulte,Tucson, Unvented Attic Prototype ............................. 42
List of Tables
Table 1. Potential Advantages and Disadvantages of Unvented Attics...................................... 1
Table 2. Las Vegas Test House Descriptions (Winter) .............................................................. 6
Table 3. Air-Leakage Measurements ......................................................................................... 9
Table 4. Summary of Tracer Gas Test Results during
Night Test Periods (11:00 p.m. to 5:00 a.m.) ............................................................. 10
Table 5. Las Vegas Test House Descriptions (Summer) ......................................................... 12
Table 6. Summary of Tracer Gas Test Results during Daytime
Test Periods (10:00 a.m. to 4:00 p.m.) ....................................................................... 16
Table 7. Daily Electricity Measurements During the Summer Test Period (kWh) .................... 18
Table 8. Window Area by Orientation (including framing) ........................................................ 19
Table 9. Comparison of Average Cooling Energy and Standard Deviation
Based on Simulations and Field Measurements ........................................................ 25
Table 10. Tucson Test House Descriptions................................................................................ 29
Table 11. Summary of Modeling Results for Pulte, Tucson ....................................................... 36
Table 12. Increment 7: Change from Vented to Unvented Attic ................................................. 38
Table A-1. Nominal Values of Parameters Used in the Sensitivity Analysis ...............................A-1

iv
List of Figures
Figure 1. Vented and unvented attic concepts............................................................................. 2Figure 2. Vented attic airflows...................................................................................................... 4Figure 3. Unvented attic airflows.................................................................................................. 5Figure 4. Front and rear views of first Las Vegas prototype house ............................................. 7Figure 5. Front and rear views of first Las Vegas base-case house............................................ 7Figure 6. The difference between inside and outside temperatures varied from
10º to 20ºC (18º to 36ºF) during the 9-day winter test period ....................................... 8Figure 7. Wind speed reached about 4 m/s (9 mi/hr) late in the 9-day test period...................... 8Figure 8. Air infiltration during periods of co-heating and normal furnace operation as
measured by a tracer gas ........................................................................................... 10Figure 9. Attic temperatures relative to outside temperatures during test period ...................... 11Figure 10. Front and rear views of second Las Vegas prototype house...................................... 13Figure 11. Front view of second Las Vegas base-case house .................................................... 13Figure 12. Outdoor and indoor temperatures during the summer test period ............................. 14Figure 13. Solar insolation and wind speed during the summer test period ................................ 15Figure 14. Air infiltration during the summer test period as measured by a tracer gas ............... 16Figure 15. Attic temperatures during the summer test period ..................................................... 17Figure 16. Hourly power measurements during the summer test period..................................... 18Figure 17. Las Vegas base-case house building geometry, view from the southeast................. 20Figure 18. Building geometry of Las Vegas base-case house, view from the northeast,
with shading from adjacent houses ............................................................................ 21Figure 19. Pretest simulated cooling profile for Las Vegas test house with vented
and unvented attics and varying levels of duct leakage. The unvented atticwas insulated to R-22 and the vented attic to R-30 .................................................... 23
Figure 20. Monitored versus simulated cooling energy with tight ducts (Case 1)........................ 24Figure 21. Monitored versus simulated cooling energy with 100-cfm supply
duct leakage (Case 2)................................................................................................. 24Figure 22. Monitored versus simulated cooling energy with 100-cfm supply plus a 100-cfm
return duct leakage (Case 3, Thursday-Saturday) and an estimated200-cfm supply plus a 100-cfm return duct leakage (Case 4, Sunday)...................... 25
Figure 23. Predicted monthly cooling energy for Las Vegas test house withvented attic insulated to R-30 at the ceiling plane and unventedattic insulated to R-22 at the roof plane ...................................................................... 26
Figure 24. Annual cooling requirement versus duct leakage for Las Vegas test houses ............ 27Figure 25. Front and rear views of Tucson prototype house ....................................................... 30Figure 26. Inside and outside temperatures for Tucson prototype during a 3-day
period of normal air conditioner operation. The attic temperature was onlymonitored for the first day........................................................................................... 31

v
List of Figures (continued)
Figure 27. Wind speed near Tucson prototype during 3-day period of normal operation ........ 31Figure 28. Air-exchange rate for Tucson prototype during 3-day period of
normal operation...................................................................................................... 32Figure 29. Front of prototype house (shading not included)
(Image captured from PowerDOE).......................................................................... 33Figure 30. Side and back of prototype house, including porch and nearby shading
(Image captured from PowerDOE)......................................................................... 34Figure 31. Comparison of cooling energy for vented and unvented attics
in Phoenix, Arizona.................................................................................................. 40Figure 32. Comparison of cooling energy cost for vented and unvented attics
in Sacramento, California ........................................................................................ 40Figure A-1. Comparison of heating energy for vented and unvented attics,
sensitivity to duct leakage.......................................................................................A-2Figure A-2. Comparison of cooling energy for vented and unvented attics,
sensitivity to duct leakage.......................................................................................A-2Figure A-3. Comparison of total space-conditioning energy for vented and unvented attics,
sensitivity to duct leakage.......................................................................................A-3Figure A-4. Comparison of heating energy for vented and unvented attics, sensitivity to
unvented attic air infiltration (Vented attic infiltration is held constant at1.5 ACH).................................................................................................................A-3
Figure A-5. Comparison of cooling energy for vented and unvented attics, sensitivity tounvented attic air infiltration (Vented attic infiltration is held constant at 1.5 ACH)................................................................................................................A-4
Figure A-6. Comparison of total space-conditioning energy for vented and unventedattics, sensitivity to unvented attic air infiltration (Vented attic infiltration is heldconstant at 1.5 ACH) ..............................................................................................A-4
Figure A-7. Comparison of heating energy for vented and unvented attics, sensitivity tounvented attic roof R-value (Vented attic R-value is held constant at R-30)..........A-5
Figure A-8. Comparison of cooling energy for vented and unvented attics, sensitivity to unvented attic roof R-value (Vented attic R-value is held constant at R-30)..........A-5Figure A-9. Comparison of total space-conditioning energy for vented and unvented
attics, sensitivity to unvented attic roof R-value (Vented attic R-value isheld constant at R-30) ............................................................................................A-6
Figure A-10. Comparison of heating energy for vented and unvented attics,sensitivity to roof absorptivity..................................................................................A-6
Figure A-11. Comparison of cooling energy for vented and unvented attics,sensitivity to roof absorptivity..................................................................................A-7
Figure A-12. Comparison of space-conditioning energy for vented and unvented attics,sensitivity to roof absorptivity..................................................................................A-7

vi

Introduction
Unvented attics have gained a significant amount of attention in the building science communityover the past 5 years as a number of builders have eliminated attic vents and moved theinsulation layer from the ceiling plane to the roof plane. This creates a semiconditioned spacewhere air ducts can reside in a much milder environment, particularly in hot climates. Thepurpose of this report is to evaluate the energy impacts of unvented attics from the body ofevidence that has accumulated through the research of Building America teams for builders inhot-dry climates, where the most extensive adoption of this technique has occurred. Beyond theenergy impacts of unvented attics, many other performance and quality assurance issues must beconsidered when evaluating this technology. Some of the most important advantages anddisadvantages of unvented attics are summarized in Table 1.
Table 1. Potential Advantages and Disadvantages of Unvented Attics
Potential Advantages Potential Disadvantages
• Milder environment for air ducts
• Eliminates cost of installing vents
• Semiconditioned storage area
• Smaller latent load on air conditioner(humid climates only).
• Larger area for air leakage and heatgain/loss
• Additional cost for insulation
• More difficult to install insulation at rooflevel compared to ceiling plane
• Higher roof sheathing temperature
• Higher shingle/tile temperature
• Gas appliances (e.g., furnace, waterheater) located in attic must be closed-combustion or be moved to garage.
The basic approach to creating an unvented attic, or cathedralized roof, is illustrated in Figure 1.The fiberglass batts, blown-in cellulose, or blown-in fiberglass insulation that typically fills thejoist space in a vented attic is replaced with either netted and blown cellulose or fiberglass battsplaced between roof trusses or rafters. Eave, ridge, and other roof vents are eliminated. Thecontinuous air barrier is moved to the roof plane instead of the ceiling, requiring careful attentionto detail when installing the air barrier around complex roof geometries. Supply and return airducts remain in the semiconditioned space of the attic, avoiding the severe temperature swingsexperienced by a traditional vented attic.

2
Figure 1. Vented and unvented attic concepts
The remainder of this report describes field-testing and analysis conducted by NREL and theBuilding America teams. The Building Science Consortium (BSC) has done the most extensiveresearch in this area, and the two builder projects described in detail in the following sectionswere led by this partnership: Pulte Homes in Tucson and Watt Homes in Las Vegas.

3
Approach
Field-Testing of Vented and Unvented Attics
Direct measurements of the performance characteristics of attics under realistic field conditionsare very important when developing an accurate model that can estimate annual energy savings.It is extremely helpful if a side-by-side test can be conducted, where the only difference betweentwo houses is the type of attic. This allows for the isolation of specific performance differencesresulting from the unvented attic.
The most useful specific field measurements include the air temperatures of the attic and houseinterior, building loss coefficient (UAo
*) and air infiltration determined during co-heating, changein UA and air infiltration resulting from air handler operation, effective leakage area as measuredwith a blower door, and duct leakage as measured with a duct blaster. It is also important to haveaccess to local temperature, wind, and solar conditions. A thorough site audit should also beconducted to verify that all features of the house are as expected.
Modeling an Unvented Attic Using DOE-2.2
An accurate and detailed model of the attic is essential to capture the difference between a ventedand unvented attic. The following discussion provides the general approach used by the authorsto simulate the energy usage of houses with vented and unvented attics using DOE-2.2†.However, it is important to make specific judgments regarding the most reasonable modelingassumptions, and even the most appropriate modeling tool, in the context of the project at hand.Important considerations include the attic design, air leakage characteristics, and the localclimate. It is also very important to use field test results to the largest extent possible as inputs tothe model and to validate the results.
An accurate analytical comparison of the two attic types must capture a number of quite differentheat flows. The following heat flows were considered the most important by the authors:
• Supply duct leakage, airflow loss to the attic• Return duct leakage, airflow from the attic to the return airstream• Conductive heat loss or gain from the ducts to the attic• Conductive and radiative heat transfer between the attic and the outside• Conductive heat transfer between the attic and the house• Natural air exchange between the attic, the house, and the outside• Mechanically induced air exchange between the attic, the house, and the outside.
* UAo is often referred to as the building loss coefficient. It represents the rate of heat loss or gain of a house as afunction of temperature between the inside and outside under steady-state conditions.† DOE-2.2 is an hourly building energy simulation software tool.

4
Certain heat flows were deemed secondary in the context of this study and were not included inthe simulations:
• Radiative heat transfer between the inside surface of the roof and the air ducts• Radiative heat transfer between the inside surface of the roof and the attic floor.
The comparison of an unvented attic and a traditional vented attic involved rather complicatedheat transfer paths that could not be entirely modeled using the standard options of DOE-2.2.One important example was return air leakage, which could not be directly modeled by DOE-2.2at the time the analysis was performed. On occasion, it was necessary to develop alternativemodeling approaches that resulted in accurate energy calculations even though the model maynot have directly resembled the physical features of the house. Specific details of the modelingassumptions used by the authors are addressed in the sections of this report describing each test.
For the vented scenario, illustrated in Figure 2, the attic was modeled as an unconditioned space.The attic air-exchange rate was specified as 1.5 air changes per hour (ACH), or approximately0.1 cfm per square foot of attic area.* Field-test measurements served as the basis for estimatingthe fraction of air leakage from the supply ducts that was lost to the outside and the fraction thatremained in conditioned space. It was also important to accurately model return leaks caused byattic air entering the return airstream, because the temperature of the attic air was often quitedifferent from either the return air or outside air.
Figure 2. Vented attic airflows
* 2001 ASHRAE Fundamentals Handbook, page 25.13.

5
The unvented attic model (Figure 3) had the insulation in the roof portion of the attic, creating amuch tighter space and reducing the natural ventilation in the attic. The attic was unintentionallyconditioned by the supply air leaks and was modeled as a conditioned space in DOE-2.2. Ductleakage into the attic, which was measured during field-testing, was modeled using an equivalentflow rate of conditioned supply air.
Figure 3. Unvented attic airflows
Results
Case 1: Las Vegas, Nevada
In 1998, field-testing of unvented attics was conducted during both the winter and summerseasons at communities built by Watt Homes in Las Vegas, Nevada. The tests conducted in thewinter included a Building America prototype house with an unvented attic at the Four Seasonsdevelopment and a similar base-case house at the Wildflower development. In addition to anunvented attic, the features that were different in the prototype house included an improved air-distribution system, controlled ventilation, and integrated hydronic heating. The prototype andbase case also had different floor plans, conditioned area, window area, and window orientations.The tests conducted in the summer included two prototype houses of the same model, whichwere nearly identical except for the attic ventilation and the location and R-value of the atticinsulation. These prototypes were not the same houses that were tested during the winter.

6
Winter Test
One prototype and one base-case house (Figures 4 and 5) were tested in February 1998 toevaluate a series of design features implemented by Watt Homes in the Four Seasonscommunity. The use of an unvented attic was one of several design changes made by thebuilder. Others included a combination domestic hot water (DHW) and space-heating system, asingle air handler, low-e vinyl frame windows, reduced window area, and controlled ventilation.The prototype house was also a different model than the base case, with a different floor area, butthe same north-facing orientation. Summaries of the specifications for both houses are presentedin Table 2.
Table 2. Las Vegas Test House Descriptions (Winter)
Item Base Case PrototypeLocation Wildflower 3, Block 14/Lot 11
7741 CuriosityLas Vegas, Nevada
Four Seasons, Lot 87621 CuriosityLas Vegas, Nevada
Model #4234, 2-story, slab-on-grade, 4bedrooms
#4133, “Summer,” 2-story, slab-on-grade, 3 bedrooms
Size 2,080 ft2 (standard plan, fireplace) 1,742 ft2 (standard plan)Front orientation North NorthWalls 2x4, R-13 cavity, R-4 EPS* 2x4, R-13 cavity, R-4 EPSRoof Conventional/vented, R-30
fiberglass, tile roofUnvented, R-30 fiberglass, tile
roofWindows Double-pane, clear, aluminum
frame, 393 ft2 glazing areaDouble-pane, low-e, vinyl frame,
255 ft2 glazing areaVentilation None Controlled supply, 4-in. outside
air duct to return of air handler,manual damper, FanRecyclercontrol
Heating Two furnace systems, nominal80% AFUE†, 50 kBtu/hr each
Hydronic combined system,nominal 0.55 EF§, 75%recovery efficiency, 63 kBtu/hrinput
Cooling Two 3.0-ton A/C units One 3.5-ton A/C unitAir handler and ductlocation
In vented attic In unvented attic
Distribution power Two 400-watt fans 800-watt fan + 100-watt pump
* Expanded polystyrene
† Annual Fuel Utilization Efficiency
§ Energy Factor

7
Figure 4. Front and rear views of first Las Vegas prototype house
Figure 5. Front and rear views of first Las Vegas base-case house
The weather conditions during the 9-day test period were fairly typical, mild winter days in LasVegas. The days were mostly sunny. Wind speeds were light during the first few days, butincreased later in the week. Temperature and wind speed during the test period are plotted inFigures 6 and 7. The thermostat setpoints were maintained at 24˚C (76°F) throughout the test.Inside temperatures were controlled using an electric co-heating system until Saturday morning,when the tests were conducted with normal operation of the heating system. The insidetemperature occasionally rose above the setpoint during sunny afternoons, when solar heat gainexceeded the heating load.
8
Figure 6. The difference between inside and outside temperatures varied from10° to 20ºC (18° to 36ºF) during the 9-day winter test period
0.0
1.0
2.0
3.0
4.0
5.0
6.0
20 4 Mon 20 4 Tue 20 4 Wed20 4 Thu 20 4 Fri 20 4 Sat 20 4 Sun 20 4 Mon20 4 Tue
Time of Day (Hour)
Win
d Sp
eed
(m/s
)
Figure 7. Wind speed reached about 4 m/s (9 mi/hr) latein the 9-day test period
0
5
10
15
20
25
30
35
20 4 Mon 20 4 Tue 20 4 Wed 20 4 Thu 20 4 Fri 20 4 Sat 20 4 Sun 20 4 Mon 20 4 Tue
Time of Day (Hour)
Tem
pera
ture
(°C
)OutsideInside (Prototype)Inside (Basecase)

9
Tracer gas, blower door, duct blaster, co-heating, and submetering were used to measure whole-building performance with the conventional conditioned space as the control volume (i.e., notincluding the attic space). Representatives of BSC and the Florida Solar Energy Center (FSEC)performed the blower door and duct blaster tests for these houses, while NREL conducted tracergas and co-heating tests. Co-heating was used for three nights in order to measure simple buildingUA and natural infiltration. Another night of co-heating was performed while the air-distributionfan was running to measure the fan-induced infiltration. An additional night of co-heating wasperformed while the air-distribution fan was running and the supply ventilation duct was open.The houses were then run with the installed heating systems in normal operation for three nights,with the best comparative data on the last night.
The air leakage and ventilation test results are summarized in Table 3. An uncertainty ofapproximately 5% for these blower door and duct blaster measurements can be expected whenthe equipment is used in accordance with standard industry practice. The hourly ACH for thetwo houses as measured by a tracer gas is shown in Figure 8, with a summary in Table 4. The airhandlers were operated at 100% duty cycle on certain nights to determine fan-inducedinfiltration. In the base case, only one air handler at a time was operated. The outside air ductwas taped off in the prototype house during the first two nights of air handler operation. The tapewas removed for the ventilation test on Thursday night. In addition to being significantly moreairtight, the prototype house lost much less air to the outside from the ducts. Theseimprovements cannot necessarily be attributed to the unvented attic because special attention wasgiven to the prototype to make it more airtight, but the results provide a strong indication that theattic was well sealed. A well-sealed roof plane is a vital attribute of a well-designed unventedattic.
Table 3. Air-Leakage Measurements
ItemBase case
(2,080 ft2, 19% window/floor area, no fireplace)
Prototype(1,742 ft2, 15% window/floor area, no fireplace)
Effective leakage area (ELA) (in.2) 110 ±5 50 ±3
Natural infiltration (ACH) 0.25–0.35 0.10–0.15
Total duct leakage
(cfm @ 25 Pa)
166 ±10 downstairs unit
232 ±10 upstairs unit
215 ±10
Duct leakage to outside
(cfm @ 25 Pa)
74 ±4 downstairs unit
86 ±4 upstairs unit
<19
Fan-induced infiltration (ACH) 0.10 ±0.01
(Per fan)
0.00 ±0.01
(Outside air taped-off)
Ventilation flow measured by duct blaster (cfm) N/A 30 ±2 (0.10 ±0.005 ACH)
Ventilation flow measured by tracer gas (ACH) N/A 0.07 ±0.01

10
0.0
0.1
0.2
0.3
0.4
0.5
0.6
0.7
0.8
0 Sun 0 Mon 0 Tue 0 Wed 0 Thu 0 Fri 0 Sat 0 Sun 0 Mon 0 Tue 0
Time of Day (PST, February 8-17, 1998)
Air
Cha
nge
per H
our (
AC
H)
BasecasePrototype
Ventilation (Prototype
Only)
Coheating Furnace Operation
High WindNatural Natural
Sys Fan,(2nd Floor
Only in Basecase)
Sys Fan(1st Floor
Only in Basecase)
Natural Natural
Figure 8. Air infiltration during periods of co-heating and normal furnaceoperation as measured by a tracer gas
Table 4. Summary of Tracer Gas Test Results during Nighttime Test Periods(11:00 p.m. to 5:00 a.m.)
Co-heating,Natural
Infiltration
Co-heatingw/ Air
Handler (2nd
Floor inBase Case)
Co-heatingw/ Air
Handler (1st
Floor inBase Case)
Co-heating,w/
Ventilation(Prototype
Only)
Furnace,NormalWind
Furnace,High WindOperating
Conditions
Base Proto Base Proto Base Proto Base Proto Base Proto Base Proto
Average ACH 0.27 0.11 0.45 0.13 0.37 0.12 0.28 0.17 0.35 0.14 0.56 0.19
AverageWind Speed(m/s)
0.73 1.42 1.43 0.98 1.73 3.05
Average ∆T(°C) 17.3 18.9 16.7 15.7 17.5 19.3
Nig
ht
AverageNatural Gasfor Heating,Normalizedby Floor Area(ft3/hr·ft2)
0 0 0 0 0 0 0 0 0.012 0.011 0.017 0.013

11
The attic temperature profiles for both houses during the test period are shown in Figure 9. Theunvented attic very nearly tracks the interior temperature. This implies that the attic is very wellinsulated at the roof plane, the attic is thermally well connected to the house, or there issubstantial air leakage from the supply ducts into the attic space that counteracts heat lossthrough the roof. The small change in air infiltration measured by the tracer gas when the airhandler is operating would lead one to the conclusion that the attic is well connected to the houseand that the roof is at least reasonably airtight. The vented attic in the base-case house issignificantly warmer than the outside during the day because the sunshine heats the attic air.Unfortunately, the temperature drops at night when the heating system is operating at the highestduty cycle and duct leakage is most detrimental.
Figure 9. Attic temperatures relative to outsidetemperatures during test period
Key Findings
• Energy losses associated with duct air leakage appeared to be negligible for the unventedattic, as indicated by the tracer gas measurements of heating system fan-inducedinfiltration.
• The unvented attic temperature tracked the interior temperature very well, resulting in avery mild environment for the ducts during the winter test period. The vented attictemperature was approximately midway between the inside and outside temperatures.
0
5
10
15
20
25
30
35
0 Mon 0 Tue 0 Wed 0 Thu 0 Fri 0 Sat 0 Sun 0 Mon 0 Tue
Time of Day (Hour)
Tem
pera
ture
(°C
)
Prototype AtticBasecase AtticOutside

12
Summer Test
In partnership with BSC, NREL tested a second pair of prototype and base-case houses (Figures10 and 11) built by Watt Homes in August 1998 to examine the performance of an unvented atticin hot summer conditions. This time the two test houses were nearly identical except for theunvented attic and the smaller attic R-value in the prototype (R-22 at the roof, compared to R-30at the ceiling). Summaries of the specifications for both houses are presented in Table 5.
Table 5. Las Vegas Test House Descriptions (Summer)
Vented Attic Unvented Attic
Developmentlocation
Four Seasons, Lot 267620 Adornment CourtLas Vegas, Nevada
Four Seasons, Lot 247612 Adornment CourtLas Vegas, Nevada
Model Spring, Plan # 41131-story, slab-on-grade, 3 bedrooms(with gable end over garage)
Same (with slope end over garage)
Size 1,350 ft2 Same
Front orientation South Same
Garage Right side Same
Insulation - Walls
- Attic
- Slab
R-13 celluloseR-30 cellulose at ceiling, vented,
tile roofNone (carpet pad installed)
SameR-22 cellulose at roof plane,
unvented, tile roofSame
Windows Double-pane, vinyl frame
PPG Sungate-1000 glazing
Same
Ventilation O/A duct to return air plenum,manual damper, FanRecyclercontrol (disabled for testing)
Same
Ducts Air handler in atticSupply ducts in attic2 return ducts, hall & mstr bdrm
Same
Cooling 2.5 tons, 10 SEER with equivalentrefrigerant charge
Same
Heating Hydronic heating with DHW SameAir distribution fan (measured)
500 W for approx. 1,100 cfm Same
13
Figure 10. Front and rear views of second Las Vegas prototype house
Figure 11. Front view of second Las Vegas base-case house
Tracer gas and submetering techniques were used to measure whole-building performance for theprototype and base-case houses. The nominal thermostat setpoint in both houses was 24°C(75°F).
Four test conditions were established to evaluate the effects of duct leakage on the performanceof the two attics. These conditions were in effect at the same time in both houses. Holes werecut in the supply and return air plenums to create the desired amount of duct leakage. Pressuredrop across a calibrated orifice plate was used to verify the leakage rate for Cases 2 and 3:

14
Case 1. Tight Ducts: Estimated 30-cfm total duct leakage asmeasured using a duct blaster.
Case 2. 100-cfm Supply Leak Same as Case 1 with a hole in the supply airplenum that leaked 100 cfm out of the systemat normal operating pressure.
Case 3. 100-cfm Supply and
100-cfm Return:
Same as Case 2 with a hole in the return airplenum that leaked 100 cfm into the system atnormal operating pressure.
Case 4. Additional Supply Leakage: Same as Case 3 with an enlarged hole in thesupply air plenum. Although this case is notrepresentative of observed levels of ductleakage, it was included in the test plan toprovide an upper extreme.
Weather conditions during the test period were hot and sunny with mild winds (Figures 12 and13). Outside temperatures peaked over 38°C (100°F) every day, except Tuesday, and droppeddown to 21°–27°C (70°–80°F) at night. Inside temperatures were well controlled at about 24˚C(75°F) throughout the test.
Figure 12. Outdoor and indoor temperatures during the summer test period
65
70
75
80
85
90
95
100
105
110
115
0 Fri 0 Sat 0 Sun 0 Mon 0 Tue 0 Wed 0 Thu 0 Fri 0 Sat 0 Sun 0
Time of Day (hour)
Tem
pera
ture
(°F)
OutsideInside - Prototype (Unvented)Inside - Basecase (Vented)

15
0
200
400
600
800
1000
1200
0 Thu 0 Fri 0 Sat 0 Sun 0 Mon 0 Tue 0 Wed 0 Thu 0 Fri 0 Sat 0 Sun 0 Mon
Time of Day (0=Midnight)
Sola
r Irr
adia
nce,
Hor
izon
tal (
W/m
2)
0
1
2
3
4
5
6
Win
d Sp
eed
(mph
)
Solar Wind
Case 1 (Tight Ducts) Case 2 Case 3 Case 4
Figure 13. Solar insolation and wind speed during the summer test period
The total air infiltration was measured using a tracer gas for each test house while applying thefour duct-leakage conditions. The ventilation system was made inactive during the test period bydisabling the FanRecycler. The hourly results are shown in Figure 14 and summarized in Table6. Air infiltration for each house was very small during normal cooling system operation beforeadditional duct leaks were introduced (Case 1). The prototype house was slightly less airtight onaverage, but no definite conclusion can be drawn about the tightness of the unvented attic. Asone would expect, the unvented attic was significantly less sensitive to increases in duct leakagebecause the ducts are within the conditioned space of the house.

16
Figure 14. Air infiltration during the summer test period as measuredby a tracer gas
Table 6. Summary of Tracer Gas Test Results During Daytime Test Periods(10:00 a.m. to 4:00 p.m.)
Case 1: TightDucts
Case 2: 100-cfm Supply
Leak
Case 3: 100-cfm Supply andReturn Leaks
Case 4:Additional
Supply LeakageOperatingConditions
Base Proto Base Proto Base Proto Base Proto
Average ACH 0.11 0.14 0.26 0.18 0.28 0.14 0.49 0.19
Average WindSpeed (mi/hr) 1.40 2.51 1.78 2.03
Average ∆T (°C) 13.3 11.8 14.9 17.9Day
time
Avg A/C Power(kW) 1.79 1.74 1.62 1.54 1.98 1.73 2.90 2.09
0.00
0.10
0.20
0.30
0.40
0.50
0.60
0.70
Thur 0 Fri 0 Sat 0 Sun 0 Mon 0 Tue 0 Wed 0 Thur 0 Fri 0 Sat 0 Sun 0
Time of Day (Hour)
Air
Cha
nges
per
Hou
r (A
CH
)
Basecase (Vented)Prototype (Unvented)
Case 1 (Tight ducts)
Case 2 Case 4 Case 3

17
Figure 15. Attic temperatures during the summer test period
Attic temperatures for the two test houses are shown in Figure 15. The unvented attic veryclosely tracked the interior temperature of the house. This demonstrated that the unvented atticwas thermally well connected to the interior conditioned space. Meanwhile the vented attictemperature was approximately the same as the outside temperature. In many attics thetemperature would have been much higher during the summer, but not in this case because thetile roof reflected much of the solar radiation, thereby reducing solar heat gain.
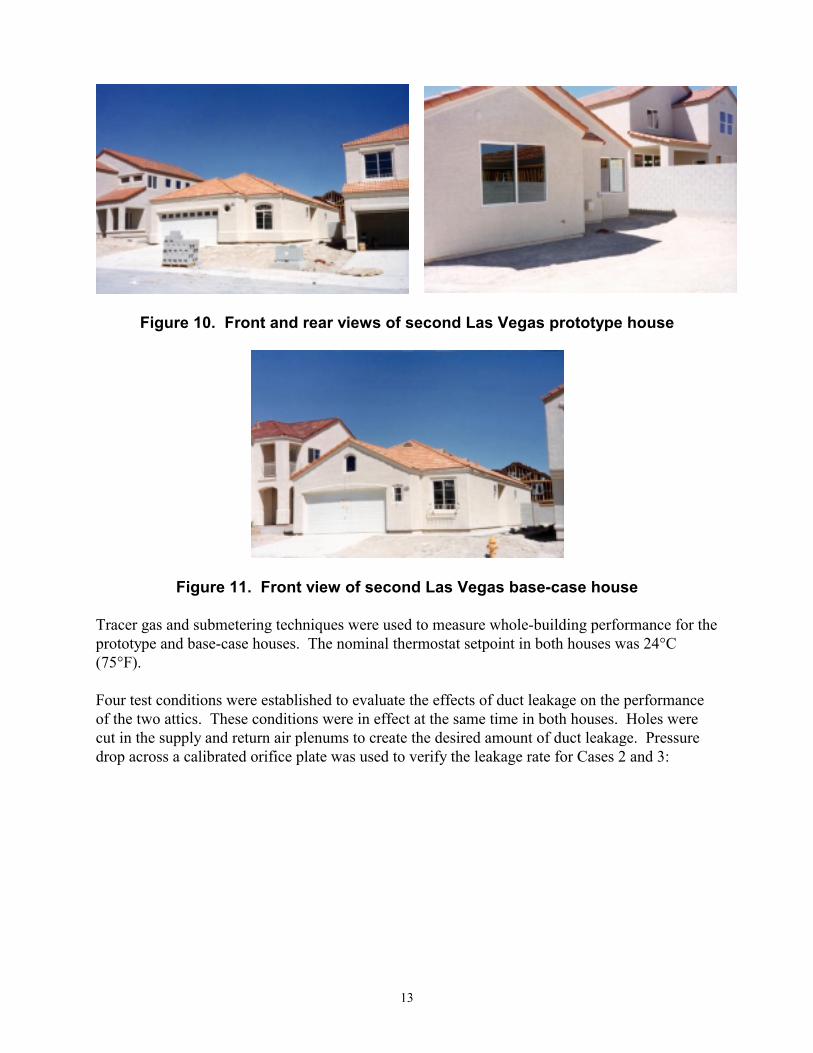
The hourly power consumption for each test house is shown in Figure 16 and summarized on adaily basis in Table 7. The electric power consumption was very similar for the two test housesduring the first 3 days when the ducts were tight. The house with the unvented attic usedsignificantly less energy during the last few days when the ducts were the most leaky.
When interpreting these results, it is important to note that the unvented attic is only insulated toR-22, compared to R-30 for the vented attic. A smaller R-value is not an inherent characteristicof unvented attics. A larger thermal envelope surface area can be expected with an unventedattic as described in this report, leading to greater heat loss for the same insulation R-value.
20
25
30
35
40
45
50
0 Fri 0 Sat 0 Sun 0 Mon 0 Tue 0 Wed 0 Thu 0 Fri 0 Sat 0 Sun 0
Time of Day (hour)
Tem
pera
ture
(°C
)Attic - Prototype (Unvented)Attic - Basecase (Vented)OutsideInterior Set Point
18
Figure 16. Hourly power measurements during the summer test period
Table 7. Daily Electricity Measurements During the Summer Test Period (kWh)
Day Duct Leakage Base case(Vented)
Prototype(Unvented)
PercentDifference
Friday Tight 29.9 30 0.3
Saturday Tight 27.2 27 -0.7
Sunday Tight 27.6 28.9 4.7
Monday 100-cfm supply 27.2 25.6 -5.9
Tuesday 100-cfm supply 18.8 18.3 -2.7
Wednesday 100-cfm supply 20.8 19.9 -4.3
Thursday 100-cfm supply and return 26.7 25.7 -3.7
Friday 100-cfm supply and return 29.4 26.1 -11.2
Saturday 100-cfm supply and return 34.7 30.7 -11.5
Sunday 100-cfm supply and return,plus additional supply 42.9 34.5 -19.6
0
500
1000
1500
2000
2500
3000
3500
Thu 0 Fri 0 Sat 0 Sun 0 Mon 0 Tue 0 Wed 0 Thu 0 Fri 0 Sat 0 Sun 0
Time of Day (Midnight=0)
Tota
l Pow
er (W
atts
)Basecase (Vented)
Prototype (Unvented)

19
DOE-2.2 Simulations
A detailed simulation model was created using a beta version of the DOE-2.2 building energysimulation program. The initial simulation model was based on construction documents suppliedby Watt Homes for Plan 4113. An audit of the two test houses proved to be valuable and led to anumber of modifications to the simulation, mainly with regard to the attic construction and siteshading.
Two DOE-2.2 models were created based on the alternative attic constructions observed in thefield. The base-case model used a vented attic insulated at the ceiling level, with a naturalventilation rate of 1.5 ACH. The prototype model used an unvented attic, insulated between theroof joists, and constructed with no intentional ventilation to the outside. Simulations were runusing actual test conditions to verify the accuracy of the models and using more realisticoperating conditions to predict cooling energy savings after the houses were occupied.
The following sections describe the modeling considerations for the various buildingcomponents.
Wall and Floor Construction
The walls were standard 2 x 4 construction, 16-in. on-center, with R-13 cellulose-filled cavities.The houses were built on slab foundations. Carpet pads were modeled during the test period andpads with carpet were modeled for the longer-term typical results. The windows were allconstructed with low-e, spectrally selective glazing (PPG Sungate 1000), and vinyl frames. Thesolar heat gain coefficient (SHGC) for the glass was 0.37 and the window U-value was 0.35Btu/hr•°F•ft2. Table 8 lists the total fenestration area for each orientation of the test houses.
Table 8. Window Area by Orientation (includes framing)
Orientation Fenestration AreaWest 45 ft2
South 26 ft2
East 14 ft2
North 66 ft2
Building Geometry and Shading
The models included accurate building geometry to account for the effects of shading onwindows and walls. Many of the windows were well shaded by adjacent houses. The DOE-2.2model was imported into PowerDOE®* to check building geometry. Figure 17 shows thelocation of exterior walls, windows, doors, and overhangs as depicted in PowerDOE®.
* PowerDOE is a graphic unser interface.

20
Figure 17. Las Vegas base-case house building geometry,view from the southeast
The geometry of the garage was slightly different between the two models. The vented attic wasopen to the area above the garage, while the unvented attic had an insulated wall between theattic and the garage.
Shading from adjacent houses was quite significant at this site, and an effort was made toaccurately model these effects. Although the window area on the east and west sides of eachhouse was small, the shading affected the total amount of heat transmitted though the opaqueportions of the walls (Figure 18). The houses to the east and west were modeled as measured atthe site.
21
Figure 18. Building geometry of Las Vegas base-case house,view from the northeast, with shading from adjacent houses
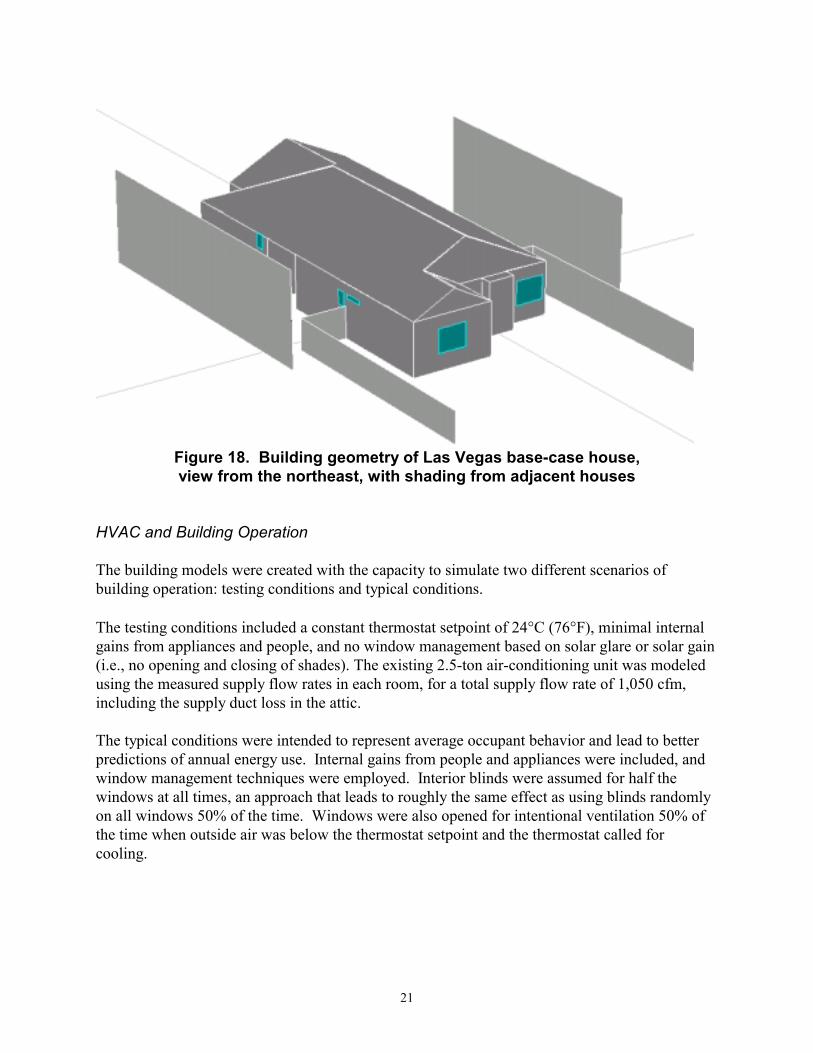
HVAC and Building Operation
The building models were created with the capacity to simulate two different scenarios ofbuilding operation: testing conditions and typical conditions.
The testing conditions included a constant thermostat setpoint of 24°C (76°F), minimal internalgains from appliances and people, and no window management based on solar glare or solar gain(i.e., no opening and closing of shades). The existing 2.5-ton air-conditioning unit was modeledusing the measured supply flow rates in each room, for a total supply flow rate of 1,050 cfm,including the supply duct loss in the attic.
The typical conditions were intended to represent average occupant behavior and lead to betterpredictions of annual energy use. Internal gains from people and appliances were included, andwindow management techniques were employed. Interior blinds were assumed for half thewindows at all times, an approach that leads to roughly the same effect as using blinds randomlyon all windows 50% of the time. Windows were also opened for intentional ventilation 50% ofthe time when outside air was below the thermostat setpoint and the thermostat called forcooling.

22
Air Infiltration
The natural infiltration for both houses was relatively low, as measured during the field-testing.The outdoor airflow into the house was a combination of the natural infiltration and the outdoorairflow induced by the heating, ventilation, and air-conditioning (HVAC) system. A DOE-2.2residential infiltration model was used along with the measured outdoor airflow rate inducedwhen the HVAC system was on to simulate the total air infiltration of the house.
Attic Model
An accurate model of the attic was essential to capture the difference between the vented andunvented attic test houses. The modeling approach described earlier in this report was used forthe analysis, with the following additions:
• Conductive losses from the supply ducts to the vented attic were set at 24 Btu/hr•°F.
• One hundred percent of the supply duct leakage in the vented attic case was replaced byinfiltration of outside or attic air into the conditioned space. The cooling energy of thesupply air was not completely lost, however, because the leaks provide some cooling ofthe attic space.
• Because the vented attic and outdoor air were approximately the same temperature duringthe field test, a simple DOE-2.2 specification of “outdoor air” cfm was used for airinduced into the house from either the outside or the attic. This assumption would not beappropriate during the winter months when the vented attic temperature is likely to benoticeably higher than the outdoor temperature or for houses with asphalt shingles insteadof tile roofs.
Test Conditions Simulation Results
One of the objectives of the simulation effort was to predict the cooling energy requirementsbefore the start of the field test. This information aided in designing an effective testing protocol.A cooling energy use profile was determined for a typical day in August, as shown in Figure 19,based on the initial description of the building, the cooling system (including part-loadperformance), and the attic design.

23
Predicted Cooling Energy for Vented & Unvented AtticsCooling Profile for 3 Levels of Supply Duct Leakage on Typical August Day
0
0.5
1
1.5
2
2.5
3
3.5
0 2 4 6 8 10 12 14 16 18 20 22Hour
Coo
ling
kW
Vented, 30 CFM Unvented, 30 CFMVented, 100 CFM Unvented, 100 CFMVented, 180 CFM Unvented, 180 CFM
Figure 19. Pretest simulated cooling profile for Las Vegas test housewith vented and unvented attics and varying levels of duct leakage. The
unvented attic was insulated to R-22 and the vented attic to R-30
Based on these initial simulations, the following predictions were made regarding the two testhouses:
• A measurable difference in cooling energy for the two houses was expected for mediumto high levels of duct leakage.
• The unvented attic appeared to be insensitive to the amount of duct leakage.• The cooling energy usage profile for the unvented attic appeared to be approximately the
same as for the vented attic with low duct leakage.
Another goal of the simulation was to match the actual performance of the houses under a rangeof conditions. Figures 20–22 show the measured cooling energy use and the predicted coolingenergy use for the two test houses during the test period. These graphs also include the measuredoutdoor temperature, which was the dominant independent variable for predicting the coolingenergy use. Solar irradiance was not as strong an influence because both test houses had tileroofs. The data points plotted in the graphs are summarized in Table 9.
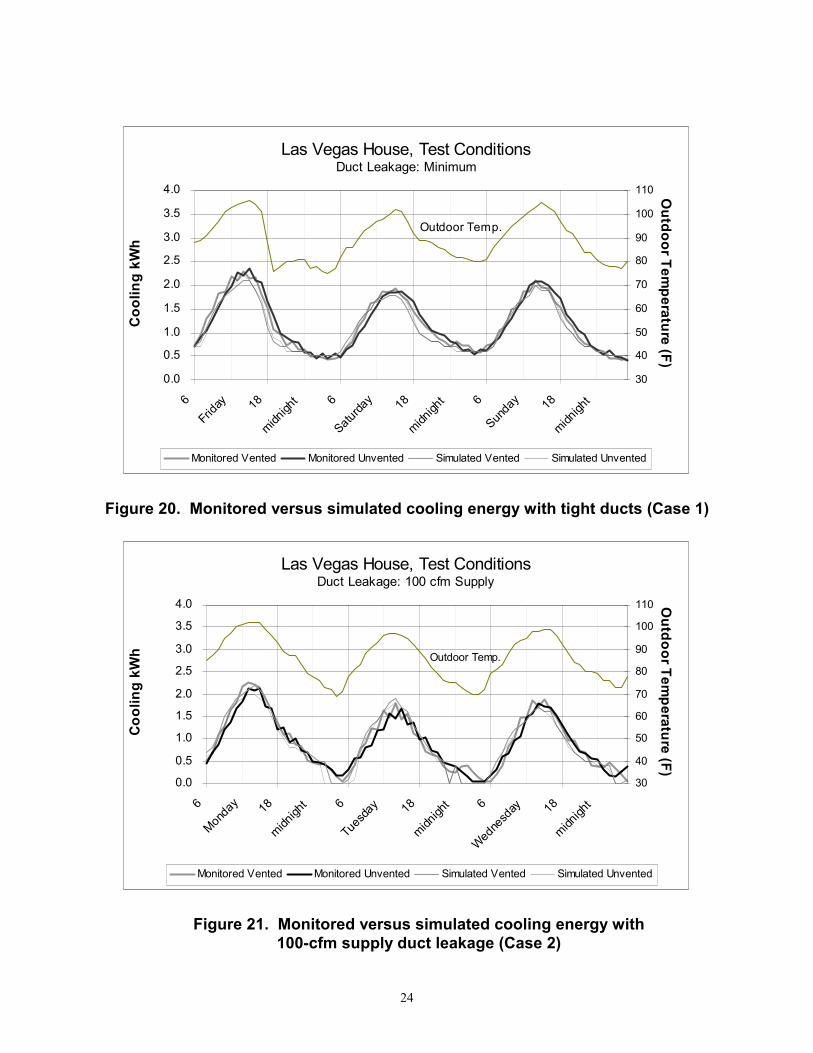
24
Las Vegas House, Test ConditionsDuct Leakage: Minimum
Outdoor Temp.
0.0
0.5
1.0
1.5
2.0
2.5
3.0
3.5
4.0
6Fri
day 18
midnigh
t 6
Saturda
y 18
midnigh
t 6
Sunda
y 18
midnigh
t
Coo
ling
kWh
30
40
50
60
70
80
90
100
110 Outdoor Tem
perature (F)
Monitored Vented Monitored Unvented Simulated Vented Simulated Unvented
Figure 20. Monitored versus simulated cooling energy with tight ducts (Case 1)
Las Vegas House, Test ConditionsDuct Leakage: 100 cfm Supply
Outdoor Temp.
0.0
0.5
1.0
1.5
2.0
2.5
3.0
3.5
4.0
6
Monda
y 18
midnigh
t 6
Tues
day 18
midnigh
t 6
Wedne
sday 18
midnigh
t
Coo
ling
kWh
30
40
50
60
70
80
90
100
110 Outdoor Tem
perature (F)
Monitored Vented Monitored Unvented Simulated Vented Simulated Unvented
Figure 21. Monitored versus simulated cooling energy with100-cfm supply duct leakage (Case 2)

25
Las Vegas House, Test ConditionsDuct Leakage: 200 cfm Supply + 100 cfm Return
Outdoor Temp.
0.0
0.5
1.0
1.5
2.0
2.5
3.0
3.5
4.0
6
Thurs
day 18
midnigh
t 6Fri
day 18
midnigh
t 6
Saturda
y 18
midnigh
t 6
Sunda
y 18
Coo
ling
kWh
30
40
50
60
70
80
90
100
110 Outdoor Tem
perature (F)
Monitored Vented Monitored Unvented Simulated Vented Simulated Unvented
Figure 22. Monitored versus simulated cooling energy with 100-cfm supply plusa 100-cfm return duct leakage (Case 3, Thursday-Saturday) and an estimated 200-
cfm supply plus a 100-cfm return duct leakage (Case 4, Sunday)
Table 9. Comparison of Average Cooling Energy and Standard Deviation Basedon Simulations and Field Measurements
Case 1: TightDucts
Case 2: 100-cfmSupply Leak
Case 3: 100-cfmSupply and
Return Leaks
Case 4:Additional
Supply LeakageOperating Conditions
Base Proto Base Proto Base Proto Base Proto
Monitored AverageCooling Energy (kW) 1.17 1.18 0.93 0.89 1.26 1.14 2.20 1.71
Simulated AverageCooling Energy (kW) 1.09 1.10 0.92 0.85 1.21 1.11 2.23 1.70
Monitored StandardDeviation (kW) 0.57 0.57 0.63 0.57 0.68 0.60 0.92 0.66
Simulated StandardDeviation (kW) 0.52 0.55 0.65 0.63 0.61 0.59 0.79 0.64
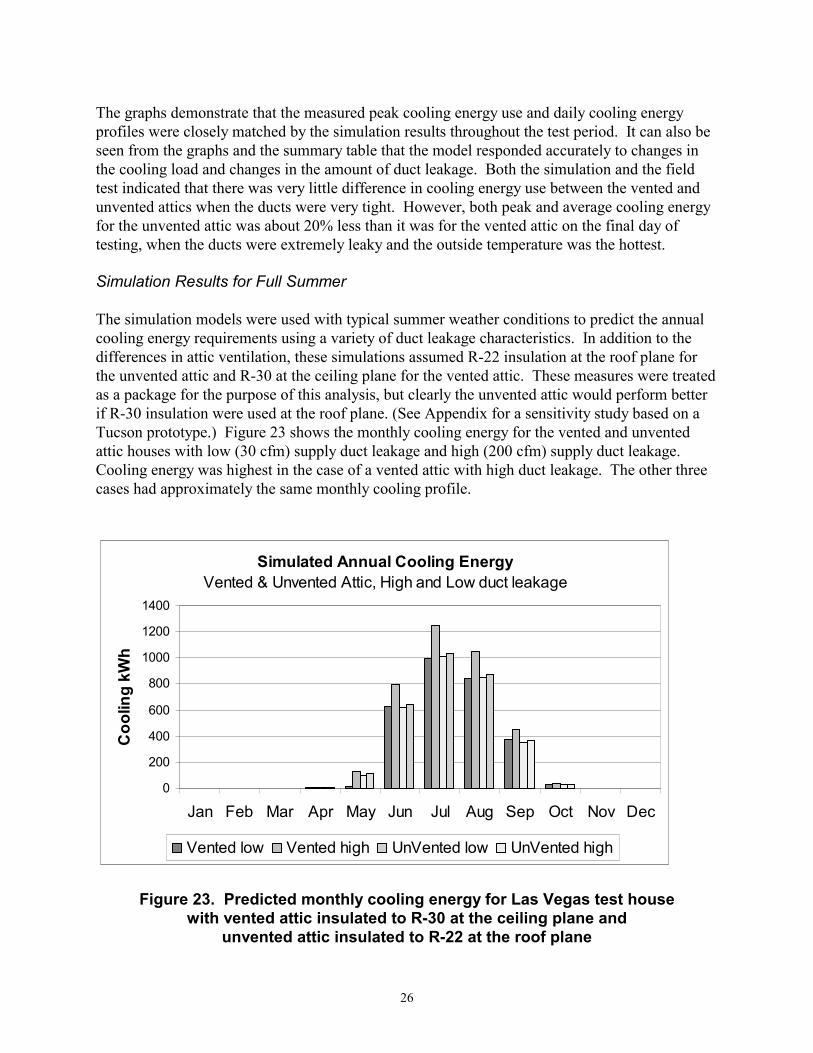
26
The graphs demonstrate that the measured peak cooling energy use and daily cooling energyprofiles were closely matched by the simulation results throughout the test period. It can also beseen from the graphs and the summary table that the model responded accurately to changes inthe cooling load and changes in the amount of duct leakage. Both the simulation and the fieldtest indicated that there was very little difference in cooling energy use between the vented andunvented attics when the ducts were very tight. However, both peak and average cooling energyfor the unvented attic was about 20% less than it was for the vented attic on the final day oftesting, when the ducts were extremely leaky and the outside temperature was the hottest.
Simulation Results for Full Summer
The simulation models were used with typical summer weather conditions to predict the annualcooling energy requirements using a variety of duct leakage characteristics. In addition to thedifferences in attic ventilation, these simulations assumed R-22 insulation at the roof plane forthe unvented attic and R-30 at the ceiling plane for the vented attic. These measures were treatedas a package for the purpose of this analysis, but clearly the unvented attic would perform betterif R-30 insulation were used at the roof plane. (See Appendix for a sensitivity study based on aTucson prototype.) Figure 23 shows the monthly cooling energy for the vented and unventedattic houses with low (30 cfm) supply duct leakage and high (200 cfm) supply duct leakage.Cooling energy was highest in the case of a vented attic with high duct leakage. The other threecases had approximately the same monthly cooling profile.
Simulated Annual Cooling EnergyVented & Unvented Attic, High and Low duct leakage
0
200
400
600
800
1000
1200
1400
Jan Feb Mar Apr May Jun Jul Aug Sep Oct Nov Dec
Coo
ling
kWh
Vented low Vented high UnVented low UnVented high
Figure 23. Predicted monthly cooling energy for Las Vegas test housewith vented attic insulated to R-30 at the ceiling plane and
unvented attic insulated to R-22 at the roof plane

27
Figure 24 shows the estimated annual cooling requirement over a range of duct losses. Below 50cfm of supply leakage, the annual cooling energy was very similar for both attic types. With 100cfm of supply duct leakage, annual energy use for the house with the vented attic was predictedto be approximately 8% more than for the house with the unvented attic. At 200 cfm of supplyduct leakage, the difference increased to about 20%.
Las Vegas Test HousesAnnual Cooling Energy under Typical Conditions
0500
100015002000250030003500
0 50 100 150 200 250Duct Leakage to Attic (CFM)
Annu
al C
oolin
g kW
h
VentedUnVented
Figure 24. Annual cooling requirement versus duct leakagefor Las Vegas test houses
Key Findings
Based on the summertime field monitoring of the two test houses and the DOE-2.2 models, thefollowing conclusions were drawn:
• The cooling requirement for the unvented attic house was fairly insensitive to the amountof supply and return duct leakage.
• At low duct leakage levels, the houses with vented and unvented attics had very nearly
the same annual cooling energy requirement based on the DOE-2.2 simulation. Forsupply duct leakage greater than 5% of total flow (~50 cfm), the unvented attic housewould require noticeably less annual cooling energy.
• The cooling requirements for the two houses were well characterized by the calibrated
DOE-2.2 model. The simulation models were able to accurately predict the coolingenergy use for the vented and unvented attic houses over a wide range of duct leakage andoutdoor weather conditions.
• The unvented attic temperature remained within 7°F of the inside temperature throughoutthe summer test period. The vented attic temperature essentially tracked the outsidetemperature during the same period.

28
Case 2: Tucson, Arizona
Two additional houses were tested by NREL in two Building America communities built byPulte Homes in Tucson, Arizona. The tests were conducted in late August 1999. One house wasa Building America prototype and featured an unvented attic with R-22 netted celluloseinsulation under a sloped roof deck. The other house, referred to as the base case, had a flat roofand R-30 fiberglass batts at the ceiling plane. The prototype had several other design featuresthat were different from the base case, including a downsized air conditioner, lower ceilingheight, less floor area, south-facing orientation, low-e windows, continuous exhaust ventilation,and a high-efficiency furnace. Because these differences made it very difficult to isolate theeffects of the unvented attic based on testing alone, it was necessary to use modeling to evaluatethe energy use of the prototype house with an unvented attic compared to a similar base case witha vented attic. Key specifications for both houses are presented in Table 10, but the test resultsfor the base case are not discussed in this report because its unusual flat attic design does notprovide a reasonable basis for comparison with the prototype. Photos of the front and back of theprototype house are shown in Figure 25.

29
Table 10. Tucson Test House Descriptions
Base case PrototypeLocation Reflections at the Bluffs, Lot 445
8919 N. Treasure Mountain Dr.Tucson, Arizona
Retreat at the Bluffs, Lot 5809093 Sweet Acacia PlaceTucson, Arizona
Model #5001, Marsanne, 1-story, 3bedrooms, 2 baths
#1618, The Preserve, 1-story, 4bedrooms, 2 baths
Size (ft2) 1,629 1,618
Options Flat roof with 10-ft ceilings Sloped roof, elevation A, patiocover, bay window @ MBR*
Front orientation East South
Insulation - Walls
- Roof
- Slab
R-19 fiberglass batts, 2x6, 16-in.oc†, R-4 EPS sheathing
R-30 fiberglass at ceiling, smallamount of ventingUninsulated, carpet installed
R-19 cellulose, 2x6, 24-in. oc,R-4 EPS sheathing
R-22 cellulose under roof deck,unventedSame, carpet pad only
Windows Double-pane, vinyl frame, clearglazing, U = 0.46, SHGC = 0.57
Double-pane, vinyl frame, PPGSungate 1000, U = 0.35,SHGC = 0.37
Exterior Finish Membrane roof covering, stuccosiding
Tile roof, stucco siding
Ventilation None Continuous exhaust fan in utilityroom, rated 80 cfm
Ducts Air handler in garage, supply andreturn ducts in attic
Air handler in unvented attic,ducts in unvented attic
Cooling 4.0 tons, 12-SEER (Carrier) 2.0 tons, 12-SEER, downsizedto 80% of Manual J guidelines
Heating Gas furnace, natural venting, 80%AFUE
Gas furnace, direct venting,92.6% AFUE
Zoning 1 thermostat, single-zone control Same
Water Heating 40-gallon tank in garage, 0.54 EF 40-gallon tank (Rheem) ingarage, 0.62 EF / 0.76 RE‡
* Master bedroom† on-center‡ Recovery efficiency

30
Figure 25. Front and rear views of Tucson prototype house
The two houses were operated for 3 consecutive days with constant thermostat setpoints from themorning of August 23 until the morning of August 26, representing normal operation undertypical summer conditions. The ventilation fan in the prototype house was not operated duringthis test period. Average temperature and wind conditions during this period are shown inFigures 26 and 27. Two severe early evening thunderstorms account for the rise in average windspeed from about 7:00 p.m. to 10:00 p.m.
The temperature of the unvented attic was usually about midway between the outside airtemperature and the conditioned interior of the house, as shown in Figure 26. Clearly the airducts were exposed to milder summer temperatures in the unvented attic than they would havebeen in a typical vented attic. However, it would be incorrect to view the attic space as“conditioned space,” because any conditioned air supplied to the attic resulted from unintentionalduct leakage.

31
60
70
80
90
100
110
120
130
0 600 Mon 1800 0 600 Tue 1800 0 600 Wed 1800
Time of Day (hour)
Tem
pera
ture
(°F)
Inside
Outside
Attic
Figure 26. Inside and outside temperatures for Tucson prototypeduring a 3-day period of normal air conditioner operation.The attic temperature was only monitored for the first day
0.0
1.0
2.0
3.0
4.0
5.0
6.0
7.0
0 600 Mon 1800 0 600 Tue 1800 0 600 Wed 1800
Time of Day (hour)
Win
d Sp
eed
(mi/h
r)
Figure 27. Wind speed near Tucson prototype during a3-day period of normal operation

32
Figure 28 shows the measured air-exchange rate for the prototype house during the normaloperation test period. It is important to note that tracer gas was injected in the living space andnot in the attic, although mixing with the attic was expected. The air change rate for the housewas relatively low, rarely exceeding 0.20 ACH. The ACH does not appear to increasesignificantly during periods of nearly continuous air-handler operation in the late afternoon, eventhough the driving forces of wind and temperature difference are also higher during this period.These results indicate that the amount of additional air exchange induced by air handler operationwas relatively small for the prototype house (approximately 10–15 cfm), supporting the notionthat the unvented attic in the prototype was well sealed. However, blower door tests conductedby BSC indicated that the total ACH of the house increased about 50% when the attic hatch wasopen. This result demonstrated that a significant amount of air leakage occurred at the roofplane, and there was some restriction of air exchange between the attic and the rest of the house.It is, therefore, apparent that the ducts themselves must have been very tight.
0.00
0.05
0.10
0.15
0.20
0.25
0.30
0.35
0.40
0 6 Mon 18 0 6 Tue 18 0 6 Wed 18
Time of Day (hour)
Air
Cha
nges
per
Hou
r (A
CH
)
Figure 28. Air-exchange rate for Tucson prototype duringa 3-day period of normal operation
33
Duct blaster testing conducted by BSC in 1999 did not seem to support the conclusion that theducts were especially tight. Duct blaster testing of the prototype house by BSC on August 19,1999, resulted in a total leakage measurement of 168 cfm at 25 Pa,* which was about 23% of thetotal supply flow rate. Of this total, about 60 cfm, or 36% of the duct leakage, was to the outsidewhen the attic hatch was closed and about 13 cfm was to the outside when the hatch was open.Aside from predicting higher duct leakage than was measured by the tracer gas, these tests alsosuggested that the attic was not very well connected to the interior of the house from an air-exchange standpoint. Pulte Homes repeated the test on August 25, 1999, after improvementswere made to the duct-sealing process, and the total leakage for the prototype was reduced to 117cfm, or 16% of total flow. When interpreting duct blaster results, however, it is very important toremember that ducts pressurized to 25 Pa behave very differently than ducts under normal airhandler operation. Internal pressure gradients and interactions with the rest of the house areminimized during duct blaster measurements. Tracer gas testing is, therefore, a more accurateapproach to estimating the air exchange caused by operation of the air distribution system.
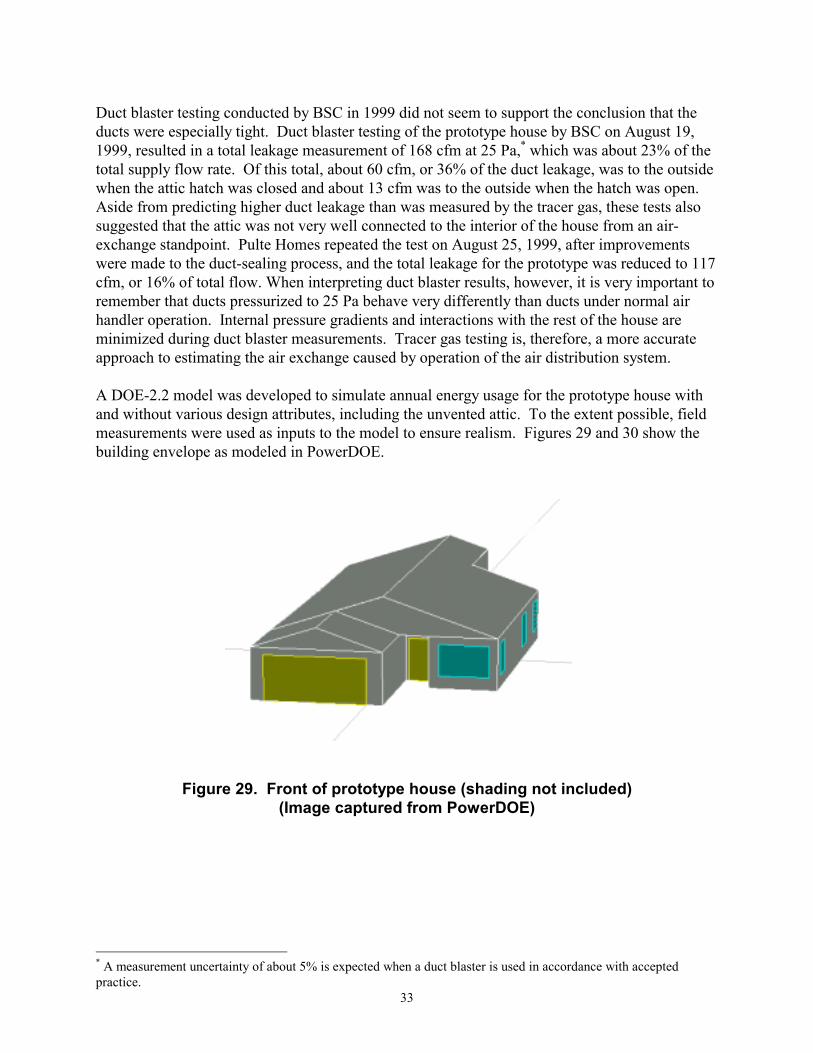
A DOE-2.2 model was developed to simulate annual energy usage for the prototype house withand without various design attributes, including the unvented attic. To the extent possible, fieldmeasurements were used as inputs to the model to ensure realism. Figures 29 and 30 show thebuilding envelope as modeled in PowerDOE.
Figure 29. Front of prototype house (shading not included)(Image captured from PowerDOE)
* A measurement uncertainty of about 5% is expected when a duct blaster is used in accordance with acceptedpractice.

34
Figure 30. Side and back of prototype house, including porch and nearby shading(Image captured from PowerDOE)
The analysis started with the geometry of the prototype house, but with energy-relatedspecifications consistent with builder standard practice. Features were then incrementally addeduntil the prototype house was simulated. Test data were used to establish many of the inputs tothe models, such as infiltration rates, air handler flow rate and power, and duct leakage. Themodels were then modified to better capture typical occupant behavior and house operation overa full year.
Features common to all of the building simulations:
• Shading from nearby building and patio shading (see Figure 30)
• Use of interior blinds and draperies:
o Half of all windows were assumed to be covered at all times
o When shades or draperies were used, the window R-value was increased by 1.0
o When shades or draperies were used, the shading coefficient was reduced by 40%
• Supply flow rate of 350 cfm per ton of cooling. This was the average of the measureddata
• Natural infiltration coefficients calculated based on tracer gas measurements. Theresidential infiltration model in DOE-2.2 was used. This is a multiple linear-regressionmodel that estimates the hourly infiltration rate based on a constant, a wind-drivencomponent, and a component driven by temperature difference. Infiltration induced bysystem fan operation and by intentional venting was included separately.

35
The approach to modeling the vented and unvented attics included the following assumptions:
• The duct thermal conductance (UA) was calculated using R-5 duct insulation
• For the vented attic, 80% of the supply duct leakage was assumed to be lost to theoutside. This assumption was derived from a combination of engineering judgment andthe process of reconciling the simulated results with field measurements
• For the unvented attic, it was assumed that 25% of the supply air leakage was lostimmediately to the outside, and replaced with outside air added directly to the returnairstream. The other 75% was assumed to mix with the attic air. This assumption wasalso based on both engineering judgment and calibration of the simulated results withfield measurements.
At the time the analysis described in this report was performed, DOE-2.2 could not directlymodel the affect of return duct leakage. An equivalent heat transfer was approximated using anair wall between the attic and the main house space in addition to the normal ceiling, with a totalUA equivalent to the heat capacity of the return air leak. The result was an additional load on theheating or cooling system equal to the amount of energy necessary to raise or lower thetemperature of the return air leak from the attic temperature to that of the conditioned space. Thearea of the air wall was defined as:
Area = ρ • Cp • (60 min/hr) • CFMret / Uairwall,
where
Uairwall = any arbitrary thermal conductivity (Btu/hr•ft2 •°F) thatresults in a reasonable value for area
CFMret = the return air leakage to the outside (cfm) as measuredusing a duct blaster
ρ • Cp = 0.018 Btu/ft3 • °F.
Table 11 presents a summary of modeling results for a series of simulations. This series startedwith the builder standard practice building description, and then measures were added one at atime until the building matched the prototype specifications. A number of issues wereconsidered when determining the order in which the measures would be added to the buildingmodel. First, the local builder was also building a number of houses that met ENERGY STAR®
requirements, including the base-case house that was tested at Reflections at the Bluffs. Thesehouses had 2-in. x 6-in. walls, vinyl-frame windows, and SEER 12 air-conditioning units. Thesemeasures were added first so that a comparison of the prototype house with the base-case housecould be made. From the ENERGY STAR model (Increment 3, described below), measures thatwere expected to have a negative or zero capital cost were added first, and then measures wereadded that were deemed to have the highest benefit-to-cost ratio. In this example, the unvented

36
attic measure was included as Increment 7. Increment 11 represented the prototype house, butIncrement 12 was added because we expected production houses to be built with SEER 10 airconditioners. The following section describes the changes made for each increment.
Table 11. Summary of Modeling Results for Pulte, Tucson
Htg/Clg Heating Htg/Clg Measure PackageIncrement kWh therms Cost value ($/yr) savings $/yr Std E-Star0: Builder Stand. Practice (BSP) 4977 92 593$ 1: BSP + incr. Insulation 4613 79 545$ 48.2$ 48$ 2: BSP + vinyl frames 4321 66 505$ 40.7$ 89$ 3: BSP + 12 SEER (Energy Star base case) 3670 66 436$ 68.4$ 157$ 26%4: E-Star + 4 to 3 tons 3745 66 444$ (7.9)$ 149$ 5: E-Star + 24" o.c. 3733 64 441$ 2.9$ 152$ 6: E-Star +PPG1000 2566 54 311$ 130.2$ 282$ 48%7: E-Star + Unv Roof 2586 71 326$ (15.2)$ 267$ 8: E-Star + AFUE 93 2586 62 319$ 6.9$ 274$ 9: E-Star +3 to 2 ton 2628 61 323$ (3.6)$ 271$ 10: E-Star + DHW EF62 2628 61 323$ -$ 271$ 46% 26%11: E-Star + vent (60cfm) 3209 94 409$ (86.4)$ 184$ 31% 6%12: E-Star + SEER 10 (prototype) 3695 94 460$ (51.0)$ 133$ 22% -6%
Savings overCost
•••• Builder Standard Practice (Increment 0) Builder standard practice was the starting point for the analysis and was based on thegeometry of the prototype house designed and built by Pulte Homes in Tucson on Lot 580of the Retreat at the Bluffs development. The energy features of this house were adjustedto match builder standard practice, as described in the BSC memo of July 27, 1999.
Features: Ceiling R-30 flat attic vented
Walls R-13 16-in. oc + R-4 EPS exterior
R-13 16-in. oc to garage
Foundation Slab, uninsulated
Windows Metal frame, double-glazed
U = 0.87, SHGC = 0.73
Infiltration As measured
Duct leakage 7% total, 5.4% lost to outside
Heating system 80% AFUE furnace in vented attic
Cooling system 10 SEER air conditioner, 4-ton
DHW 0.56 EF
37
•••• Increased wall insulation (Increment 1) Wall-cavity insulation was increased to a nominal R-19, based on 2 x 6 wall construction.This applied to all exterior walls as well as the wall between the house and garage.
•••• Vinyl-frame window upgrade (Increment 2) Window frames were upgraded from metal frames (aluminum, no thermal break) to vinylframes. The frame conductance in the DOE-2.2 model changed from 3.04 Btu/hr•ft2 •°Fto 0.50 Btu/hr•ft2 •°F. These values included the interior film coefficient, but not theexterior film coefficient, and were based on two-dimensional heat loss.
•••• Air-conditioner upgrade to SEER 12 (Increment 3) The air conditioner SEER was increased from 10 to 12. For DOE-2.2, the SEER wasconverted to a design energy-input-ratio (EIR) using the California Title-24recommended method, which separated out the assumed fan power and the compressorand condenser power. This increment brought the builder standard practice case up to theEnergy Star energy efficiency level.
•••• Air conditioner downsizing to 3 tons (Increment 4) The air conditioner capacity was decreased to 3 tons, from the builder standard practicecapacity of 4 tons. The total supply flow rate was reduced as well, remaining at 350 cfmper ton. Supply fan electric use changed from 0.55 watts per cfm to 0.60 watts per cfmbased on field measurements of similar systems. This was the first added measure to theEnergy Star configuration (Increment 3) because it had a negative associated cost andsmall energy cost benefit.
•••• Wall framing-factor reduction (Increment 5) Exterior walls were changed to 24-in. oc from 16-in. oc, increasing the effective R-valueof the wall construction by approximately 1 Btu/hr•ft2 •°F . As with the previousincrement, this measure was reported to have a negative first-cost and a small energy costbenefit.
•••• High-performance glazing (Increment 6) All windows were replaced with Sungate1000 high-performance windows, which havelow-e coatings and low solar gain factors. Whole window U-value was 0.35 Btu/hr•ft2
•°F, compared with 0.87 for the clear double-glass window it replaced. The glass solarheat-gain coefficient was reduced to 0.37, from 0.73. This measure had a significantenergy impact and a very quick payback period.
•••• Unvented attic (Increment 7) For the unvented attic design, the attic insulation was moved from the ceiling plane orattic floor to the roof plane. The roof type was changed to a sloped roof with a tilesurface. The attic was unintentionally conditioned by duct leakage, conductive losses,and air transfer between the attic and house (Table 12).

38
Table 12. Increment 7: Change from Vented to Unvented Attic
Vented Attic (base) Vented Attic (E-Star) Unvented Attic
Roof Type/Surface Flat/Membrane Flat/Membrane Sloped/Tile
Insulation Ceiling: R-30 Ceiling: R-30 Roof: R-21, Walls: R-19
Infiltration 1.5 ACH 1.5 ACH 0.15 ACH
Duct supply leakage 7% of supply cfm 2% of supply cfm 2% of supply cfm
Leakage to outside 80% (78 cfm) 80% (25 cfm) 25% (8 cfm) Design duct delta-T 1.5°F 1.5°F 1.5°F The tracer gas test showed the air-exchange rate associated with fan operation for theunvented attic to be very small, on the order of 8 cfm ± 2 cfm. The base-case test housewith a vented attic also showed very low air exchange associated with fan operation,probably the result of poor ventilation associated with the flat roof design. Significantlyhigher air loss to the attic was assumed for the builder standard practice case. With atotal supply flow rate of 1,400 cfm, builder standard practice was assumed to have about98 cfm airflow loss to the attic (7% of total). For the vented attics, it was assumed that80% of the supply airflow to the attic was exhausted to the outside and thus made upfrom outside air. The remaining 20% was made up through return air leaks from the attic.For the unvented attic, it was assumed that 25% of the duct leakage was directly to theoutside, while the other 75% mixed with the attic air. These estimates of duct leakagelost to the outside were calculated as part of the calibration of the model to the field testdata.
•••• Heating system AFUE improvement (Increment 8) The 80.0 AFUE furnace was replaced with a more efficient 92.6 AFUE furnace. Theunvented attic measure required using this more-efficient, closed-combustion, condensingfurnace because the attic was now essentially part of the conditioned space.
•••• Air conditioner downsizing to 2 tons (Increment 9) The air conditioner capacity was decreased to 2 tons, from the previous capacity of 3 tons.The total supply flow rate was reduced as well, remaining at 350 cfm per ton. Supply fanelectric use changed from 0.60 watts per cfm to 0.65 watts per cfm based on fieldmeasurements of similar systems. The smaller cooling capacity was only an option afterthe cooling load had been reduced by the combination of better glazing and the unventedattic.
•••• DHW heater improvement (Increment 10) The standard gas DHW heater with an Energy Factor (EF) of 0.56 was replaced with aheater with an EF of 0.62.
39
•••• Continuous ventilation (Increment 11)
An exhaust fan was added to provide a continuous 60 cfm of outside air to the house.The fan was assumed to use 40 watts.
•••• Air conditioner SEER 10 (Increment 12)The air conditioner SEER was decreased from 12 to 10. This cost trade-off measure wasadded last so that the previous measure would indicate the performance of the BuildingAmerica home with a SEER of 12.
A series of sensitivity runs were made with the Tucson model to ensure that building componentswere being modeled correctly and to gauge the importance of certain assumptions. Several of themore interesting sensitivity studies are provided in the appendix.
Key Findings
Several conclusions were drawn from the testing and analysis performed for the Pulte Homes –Tucson project:
• The unvented attic yielded a much milder environment for the ducts during the testperiod, with an attic temperature less than 4°C (7.2°F) higher than the inside temperature.By contrast, the temperature of the vented attic with a flat roof greatly exceeded theoutside temperature during sunny afternoons, reaching temperatures more than 25°C(45°F) hotter than the interior of the house.
• Duct leakage, insulating-value, air infiltration at the roof plane, and solar heat absorptionby the roof are important factors when calculating the potential energy savings or penaltyof an unvented attic compared to a vented attic. (See the appendix.)

40
Extension to Other Hot-Dry/Mixed-Dry Climates
The base-case and prototype models for Watt Homes in Las Vegas were run with a range of ductleakage levels for two other climate zones, Phoenix (hot-dry) and Sacramento (mixed-dry). Thesimulations assumed that most of the duct leakage was on the supply side of the air distributionsystem, and the cooling capacity was set to a constant 500 ft2 per ton in each case. Theseassumptions were based on field-testing of similar Building America projects. For each location,a graph illustrating the sensitivity of cooling energy to duct leakage is presented. These resultsare shown in Figures 31 and 32.
Figure 31. Comparison of cooling energy for ventedand unvented attics in Phoenix, Arizona
Figure 32. Comparison of cooling energy cost for ventedand unvented attics in Sacramento, California
Vented vs. Unvented AtticsAnnual Cooling Energy under Typical Conditions
0100020003000400050006000
0 50 100 150 200 250Duct Leakage to Attic (CFM)
Ann
ual C
oolin
g kW
h
VentedUnVented
Vented vs. Unvented AtticsAnnual Cooling Energy under Typical Conditions
0
100
200
300
400
500
0 50 100 150 200 250Duct Leakage to Attic (CFM)
Ann
ual C
oolin
g kW
h
VentedUnVented
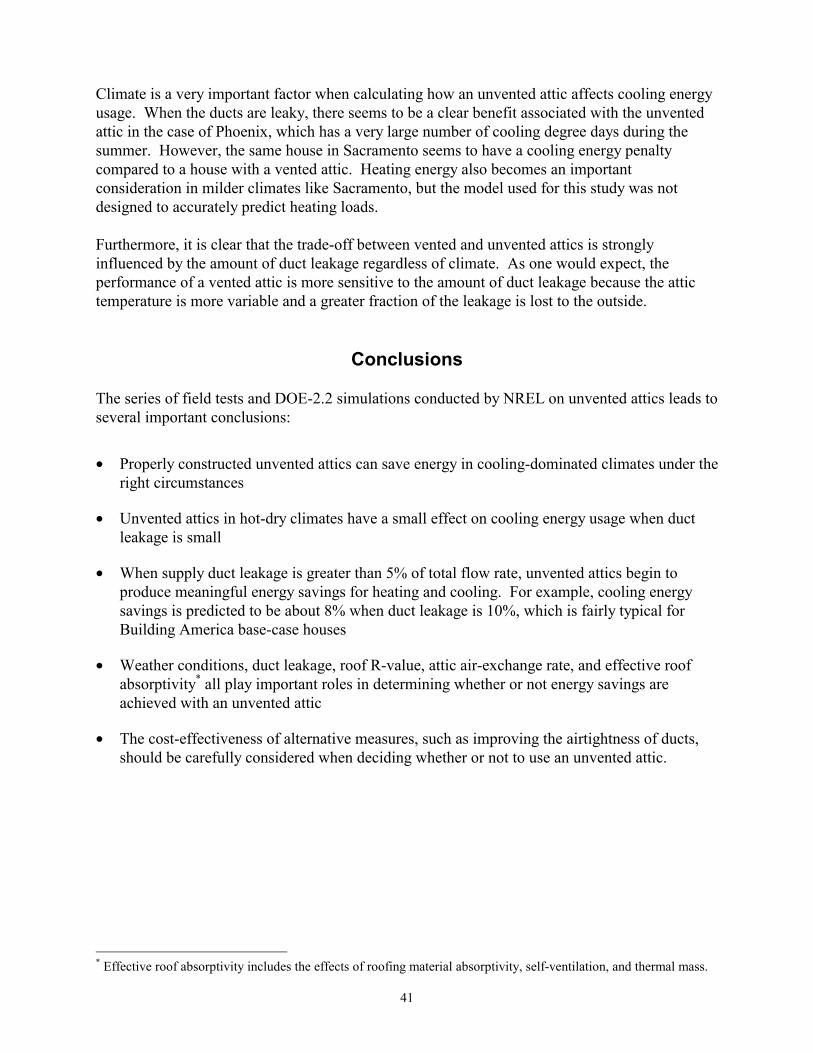
41
Climate is a very important factor when calculating how an unvented attic affects cooling energyusage. When the ducts are leaky, there seems to be a clear benefit associated with the unventedattic in the case of Phoenix, which has a very large number of cooling degree days during thesummer. However, the same house in Sacramento seems to have a cooling energy penaltycompared to a house with a vented attic. Heating energy also becomes an importantconsideration in milder climates like Sacramento, but the model used for this study was notdesigned to accurately predict heating loads.
Furthermore, it is clear that the trade-off between vented and unvented attics is stronglyinfluenced by the amount of duct leakage regardless of climate. As one would expect, theperformance of a vented attic is more sensitive to the amount of duct leakage because the attictemperature is more variable and a greater fraction of the leakage is lost to the outside.
Conclusions
The series of field tests and DOE-2.2 simulations conducted by NREL on unvented attics leads toseveral important conclusions:
• Properly constructed unvented attics can save energy in cooling-dominated climates under theright circumstances
• Unvented attics in hot-dry climates have a small effect on cooling energy usage when ductleakage is small
• When supply duct leakage is greater than 5% of total flow rate, unvented attics begin toproduce meaningful energy savings for heating and cooling. For example, cooling energysavings is predicted to be about 8% when duct leakage is 10%, which is fairly typical forBuilding America base-case houses
• Weather conditions, duct leakage, roof R-value, attic air-exchange rate, and effective roofabsorptivity* all play important roles in determining whether or not energy savings areachieved with an unvented attic
• The cost-effectiveness of alternative measures, such as improving the airtightness of ducts,should be carefully considered when deciding whether or not to use an unvented attic.
* Effective roof absorptivity includes the effects of roofing material absorptivity, self-ventilation, and thermal mass.

A-1
Appendix: Sensitivity Analysis of the Pulte, Tucson, Unvented AtticPrototype
The following sensitivity studies were based on the prototype and base-case houses constructedby Pulte Homes in Tucson, as described in Case 2 of this report. Table 13 contains a list of thenominal parameters for the two houses. The comparison between vented and unvented attics isnot a very meaningful one in the following series of graphs, because the base case (or “ventedattic” case) includes an atypical attic design with a flat roof, higher R-value, greater duct leakage,and a relatively small amount of ventilation. However, the results do shed light on which atticdesign parameters have the greatest effect on energy use and which should receive the greatestattention when considering the cost-effectiveness of an unvented attic in a hot-dry climate.
As shown in Figures A-1 to A-3, duct leakage is a very important parameter that influences theenergy savings (or loss) that can be expected from an unvented attic. The point has already beenmade several times in this report and is simply reinforced by the analysis presented here.
Another observation is that a roof should be very airtight to take full advantage of an unventedattic, as shown in Figures A-4 to A-6. Leaks at the roof plane cause the attic space to track theoutside temperature more than the inside, resulting in greater energy losses from the ducts. Theoverall air leakage of the house is also increased, placing additional loads on the heating andcooling systems. The analysis indicates that attic air infiltration has a somewhat larger effect onthe heating load than the cooling load.
Similarly, it is important to maintain a relatively high R-value at the roof plane if meaningfulenergy savings are to be achieved using an unvented attic, as shown in Figures A-7 to A-9.Insulation is usually more difficult to install in a uniform manner at the roof plane because theforces of gravity work against the installer. For the Tucson project, the analysis indicates thatadditional energy savings would have resulted if the roof of the unvented attic had the same R-value as the floor of the vented attic (R-30).
Finally, the solar absorptivity of the roofing material has an interesting effect on heating andcooling energy for a house with an unvented attic, as shown in Figures A-10 to A-12. Theunvented attic is clearly more sensitive to the absorptivity of the roof, but the benefits ofreflective materials in the summer are largely offset by additional heating loads in the winter.The more important benefit of reflective roofing materials in the context of an unvented attic isthe reduction in roof sheathing temperature during hot, sunny days. This is a durability issuebeing further investigated by BSC and FSEC as part of their Building America research efforts.
Table A-1. Nominal Values of Parameters Used in the Sensitivity Analysis
Item Vented Attic Unvented AtticDuct Leakage 98 cfm 32 cfmAttic Infiltration 1.5 ACH 0.15 ACHRoof /Ceiling R-Value R-30 R-22Roof Absorptivity 0.5 0.7

A-2
Heating EnergySensitivity to Duct Air Flow Loss to Attic
4.0
4.5
5.0
5.5
6.0
6.5
7.0
0 50 100 150 200
Duct Loss to Attic (CFM)
Heat
ing
Ener
gy (S
ourc
e M
Btu)
Htg-Vented
Htg-UnVented
Figure A-1. Comparison of heating energy for ventedand unvented attics, sensitivity to duct leakage
Cooling EnergySensitivity to Duct Air Flow Loss to Attic
20
21
22
23
24
25
26
27
28
29
0 50 100 150 200
Duct Loss to Attic (CFM)
Cool
ing
Ener
gy (S
ourc
e M
Btu)
Clg-Vented
Clg-UnVented
Figure A-2. Comparison of cooling energy for ventedand unvented attics, sensitivity to duct leakage
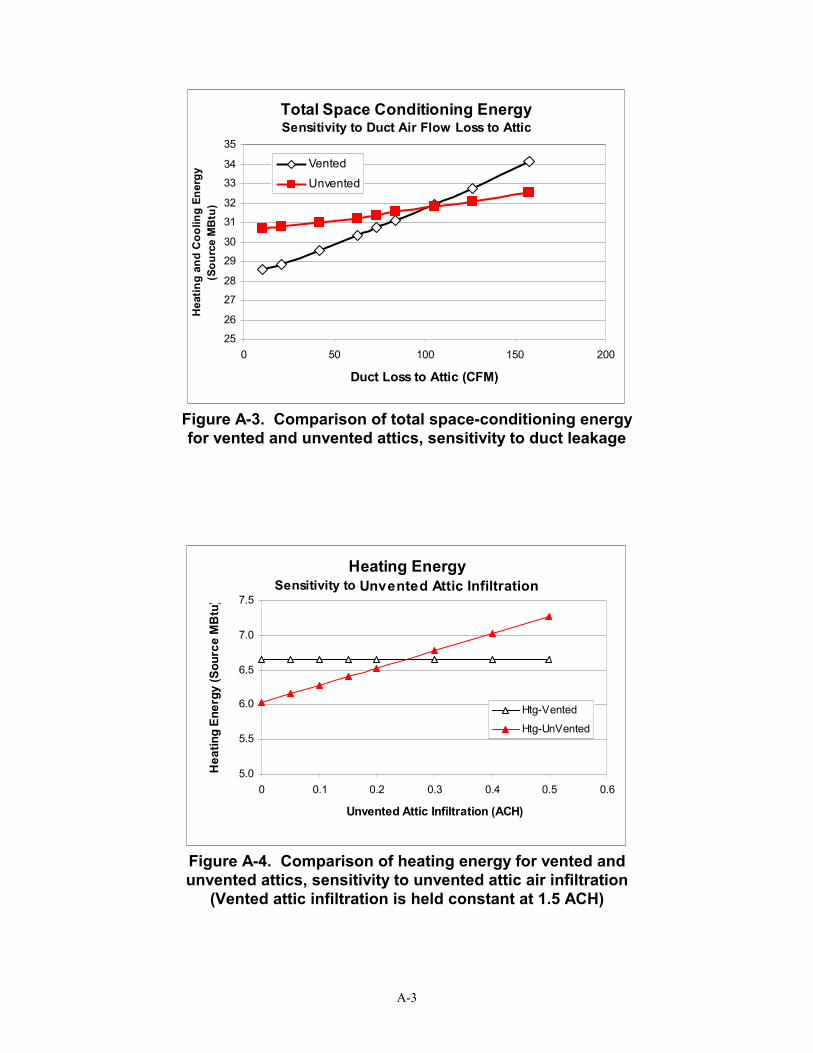
A-3
Total Space Conditioning EnergySensitivity to Duct Air Flow Loss to Attic
25
26
27
28
29
30
31
32
33
34
35
0 50 100 150 200
Duct Loss to Attic (CFM)
Hea
ting
and
Coo
ling
Ener
gy
(Sou
rce
MB
tu)
VentedUnvented
Figure A-3. Comparison of total space-conditioning energyfor vented and unvented attics, sensitivity to duct leakage
Heating EnergySensitivity to Unvented Attic Infiltration
5.0
5.5
6.0
6.5
7.0
7.5
0 0.1 0.2 0.3 0.4 0.5 0.6
Unvented Attic Infiltration (ACH)
Hea
ting
Ener
gy (S
ourc
e M
Btu
)
Htg-Vented
Htg-UnVented
Figure A-4. Comparison of heating energy for vented andunvented attics, sensitivity to unvented attic air infiltration
(Vented attic infiltration is held constant at 1.5 ACH)

A-4
Cooling EnergySensitivity to Unvented Attic Infiltration
24.80
25.00
25.20
25.40
25.60
25.80
26.00
26.20
0 0.1 0.2 0.3 0.4 0.5 0.6
Unvented Attic Infiltration (ACH)
Cool
ing
Ener
gy (S
ourc
e M
Btu)
Clg-Vented
Clg-UnVented
Figure A-5. Comparison of cooling energy for ventedand unvented attics, sensitivity to unvented attic air infiltration
(Vented attic infiltration is held constant at 1.5 ACH)
Total Space Conditioning EnergySensitivity to Unvented Attic Infiltration
30.831.031.231.431.631.832.032.232.432.632.8
0 0.1 0.2 0.3 0.4 0.5 0.6
Unvented Attic Infiltration (ACH)
Heat
ing
and
Cool
ing
Ener
gy (S
ourc
e M
Btu)
VentedUnvented
Figure A-6. Comparison of total space-conditioning energy for ventedand unvented attics, sensitivity to unvented attic air infiltration
(Vented attic infiltration is held constant at 1.5 ACH)

A-5
Heating EnergySensitivity to Unvented Attic Roof R-Value
0.01.02.03.04.05.06.07.08.09.0
10.0
10 15 20 25 30 35
Unvented Attic Roof R-Value
Hea
ting
Ener
gy (S
ourc
e M
Btu
)
Htg-Vented
Htg-UnVented
Figure A-7. Comparison of heating energy for vented andunvented attics, sensitivity to unvented attic roof R-value
(Vented attic R-value is held constant at R-30)
Cooling EnergySensitivity to Unvented Attic Roof R-Value
23.5
24.0
24.5
25.0
25.5
26.0
26.5
10 15 20 25 30 35
Unvented Attic Roof R-Value
Coo
ling
Ener
gy (S
ourc
e M
Btu
)
Clg-Vented
Clg-UnVented
Figure A-8. Comparison of cooling energy for vented andunvented attics, sensitivity to unvented attic roof R-value
(Vented attic R-value is held constant at R-30)
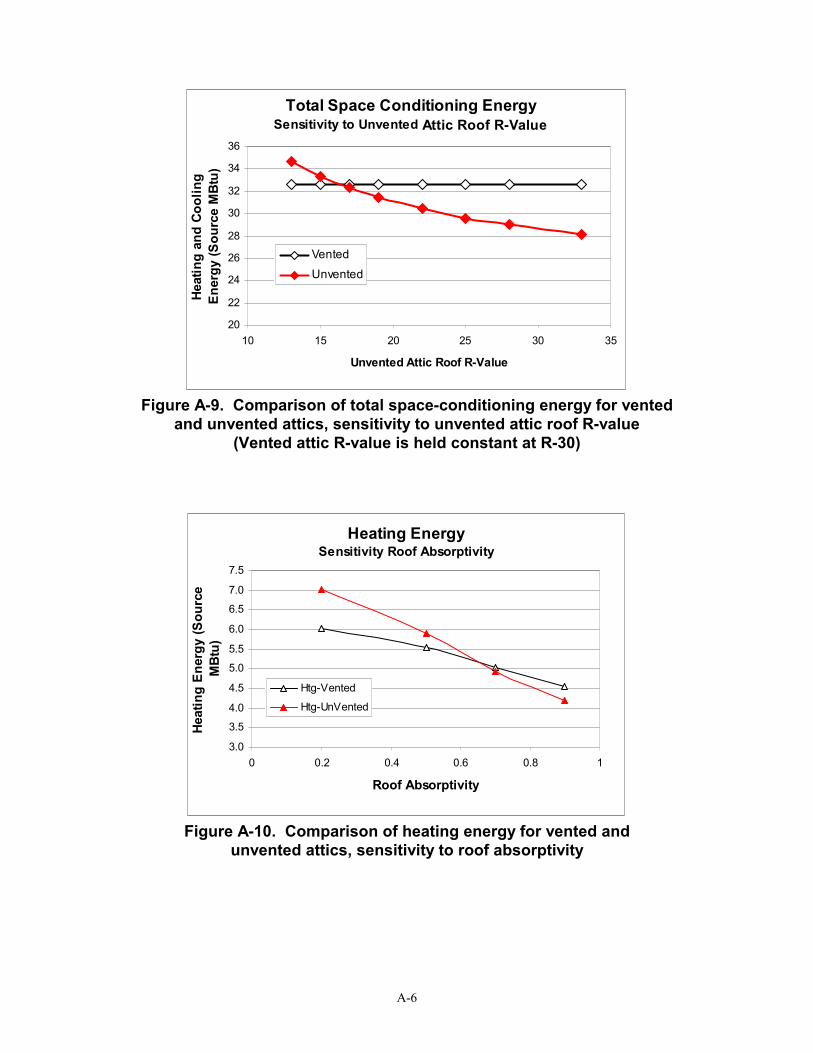
A-6
Total Space Conditioning EnergySensitivity to Unvented Attic Roof R-Value
20
22
24
26
28
30
32
34
36
10 15 20 25 30 35
Unvented Attic Roof R-Value
Heat
ing
and
Cool
ing
Ener
gy (S
ourc
e M
Btu)
VentedUnvented
Figure A-9. Comparison of total space-conditioning energy for ventedand unvented attics, sensitivity to unvented attic roof R-value
(Vented attic R-value is held constant at R-30)
Heating EnergySensitivity Roof Absorptivity
3.0
3.5
4.0
4.5
5.0
5.5
6.0
6.5
7.0
7.5
0 0.2 0.4 0.6 0.8 1
Roof Absorptivity
Heat
ing
Ener
gy (S
ourc
e M
Btu)
Htg-Vented
Htg-UnVented
Figure A-10. Comparison of heating energy for vented andunvented attics, sensitivity to roof absorptivity
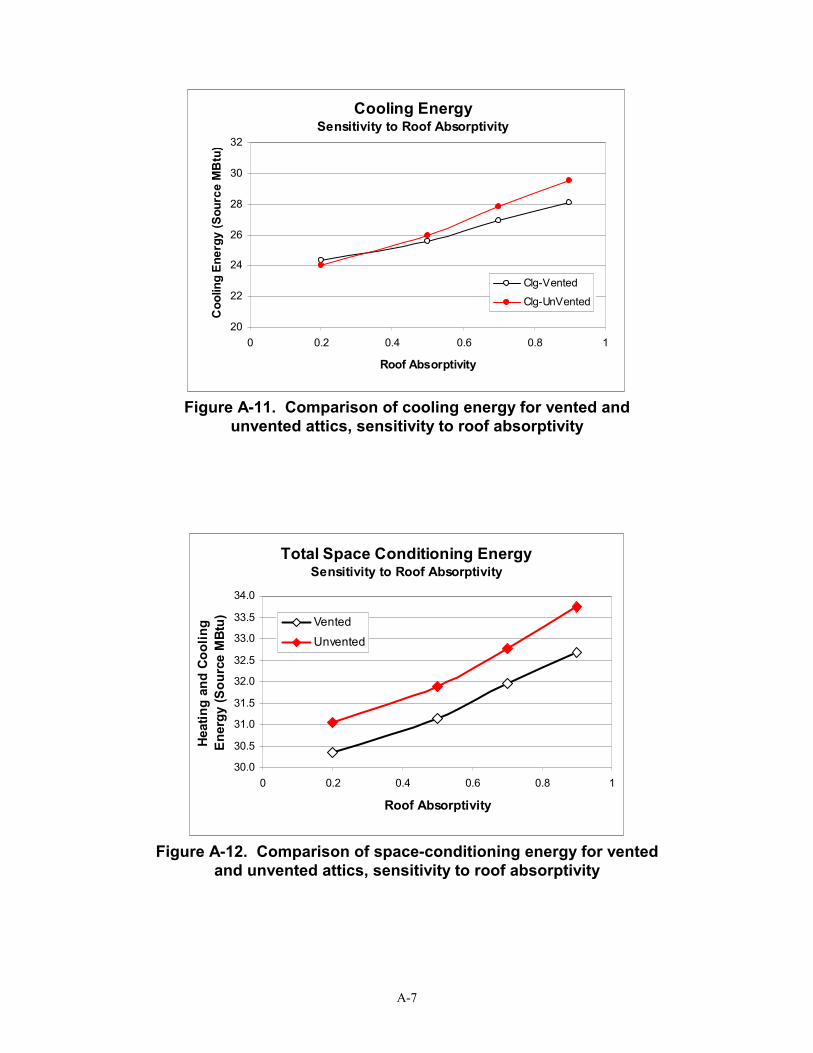
A-7
Cooling EnergySensitivity to Roof Absorptivity
20
22
24
26
28
30
32
0 0.2 0.4 0.6 0.8 1
Roof Absorptivity
Coo
ling
Ener
gy (S
ourc
e M
Btu
)
Clg-Vented
Clg-UnVented
Figure A-11. Comparison of cooling energy for vented andunvented attics, sensitivity to roof absorptivity
Total Space Conditioning EnergySensitivity to Roof Absorptivity
30.0
30.5
31.0
31.5
32.0
32.5
33.0
33.5
34.0
0 0.2 0.4 0.6 0.8 1
Roof Absorptivity
Heat
ing
and
Cool
ing
Ener
gy (S
ourc
e M
Btu) Vented
Unvented
Figure A-12. Comparison of space-conditioning energy for ventedand unvented attics, sensitivity to roof absorptivity

REPORT DOCUMENTATION PAGE Form ApprovedOMB NO. 0704-0188
Public reporting burden for this collection of information is estimated to average 1 hour per response, including the time for reviewing instructions, searching existing data sources,gathering and maintaining the data needed, and completing and reviewing the collection of information. Send comments regarding this burden estimate or any other aspect of thiscollection of information, including suggestions for reducing this burden, to Washington Headquarters Services, Directorate for Information Operations and Reports, 1215 JeffersonDavis Highway, Suite 1204, Arlington, VA 22202-4302, and to the Office of Management and Budget, Paperwork Reduction Project (0704-0188), Washington, DC 20503.
1. AGENCY USE ONLY (Leave blank) 2. REPORT DATEApril 2002
3. REPORT TYPE AND DATES COVEREDTechnical Report
4. TITLE AND SUBTITLEThermal Performance of Unvented Attics in Hot-Dry Climates
6. AUTHOR(S)R. Hendron, R. Anderson, P. Reeves, E. Hancock
5. FUNDING NUMBERS
BET2.8004
7. PERFORMING ORGANIZATION NAME(S) AND ADDRESS(ES)Partnership for Resource ConservationMountain Energy Partnership
8. PERFORMING ORGANIZATIONREPORT NUMBER
9. SPONSORING/MONITORING AGENCY NAME(S) AND ADDRESS(ES)National Renewable Energy Laboratory1617 Cole Blvd.Golden, CO 80401-3393
10. SPONSORING/MONITORINGAGENCY REPORT NUMBER
NREL/TP-550-30839
11. SUPPLEMENTARY NOTES
NREL Technical Monitor: Bob Hendron12a. DISTRIBUTION/AVAILABILITY STATEMENT
National Technical Information ServiceU.S. Department of Commerce5285 Port Royal RoadSpringfield, VA 22161
12b. DISTRIBUTION CODE
13. ABSTRACT (Maximum 200 words)As unvented attics become a more common design feature implemented by Building America partners in hot-dry climatesof the United States, more attention has been focused on how this approach affects heating and cooling energyconsumption. The National Renewable Energy Laboratory (NREL) has conducted field testing and hourly buildingsimulations for several Building America projects to evaluate energy use in vented and unvented attics in hot-dry climates.In summer, testing of the Las Vegas protoype house demonstrated that the thermal performance of an unvented attic ishighly dependent on duct leakage.
15. NUMBER OF PAGES14. SUBJECT TERMSunvented attic, vented attic, conditioned attic, sealed attic, energy efficiency, ductleakage, duct losses 16. PRICE CODE
17. SECURITY CLASSIFICATIONOF REPORTUnclassified
18. SECURITY CLASSIFICATIONOF THIS PAGEUnclassified
19. SECURITY CLASSIFICATIONOF ABSTRACTUnclassified
20. LIMITATION OF ABSTRACT
UL
NSN 7540-01-280-5500 Standard Form 298 (Rev. 2-89)Prescribed by ANSI Std. Z39-18
298-102