thermodynamics of moist air - colorado state...
TRANSCRIPT

• Phase transitions: what are the equilibrium conditions for a mixed-phase system, e.g. a mixture of water and water vapor?
• Consider a system consisting of liquid water and H2O(v) undergoing a change in state,
Thermodynamics of Moist Air
vapor
liquid
vapor
liquid
″ denotes liquid phase
″′ denotes vapor phase
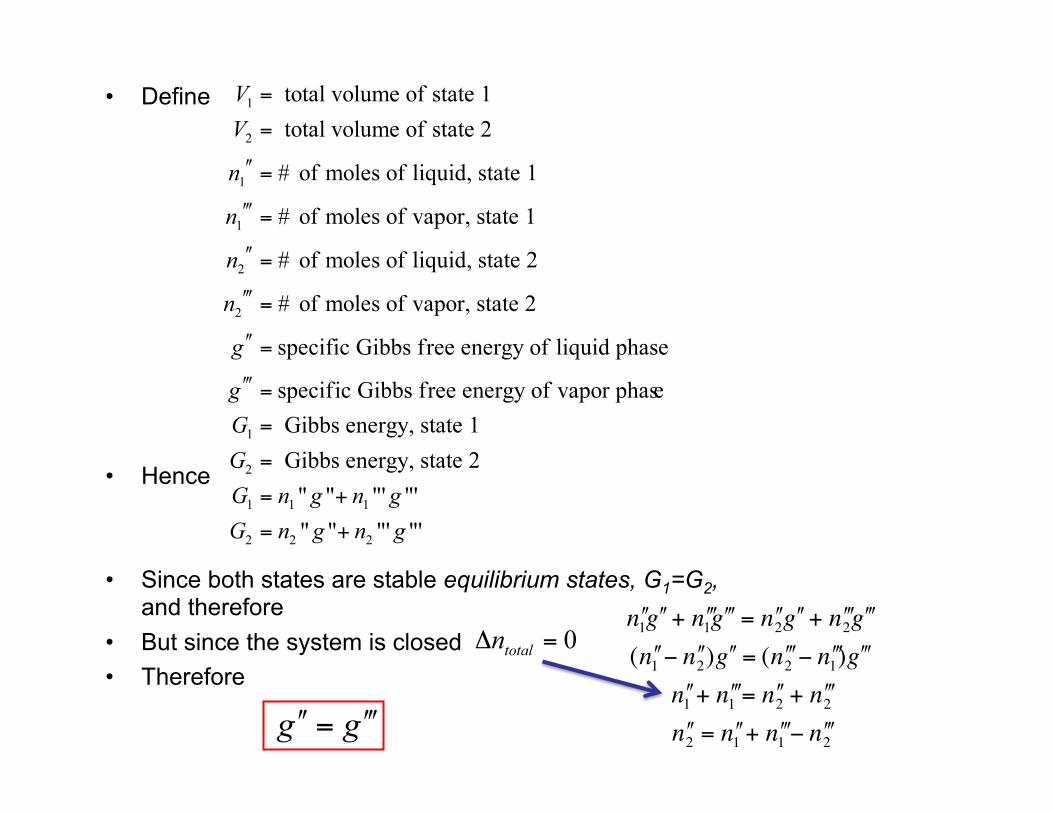
• Define
• Hence
• Since both states are stable equilibrium states, G1=G2, and therefore
• But since the system is closed • Therefore
€
ʹ′ ʹ′ n 1 ʹ′ ʹ′ g + ʹ′ ʹ′ ʹ′ n 1 ʹ′ ʹ′ ʹ′ g = ʹ′ ʹ′ n 2 ʹ′ ʹ′ g + ʹ′ ʹ′ ʹ′ n 2 ʹ′ ʹ′ ʹ′ g ( ʹ′ ʹ′ n 1 − ʹ′ ʹ′ n 2) ʹ′ ʹ′ g = ( ʹ′ ʹ′ ʹ′ n 2 − ʹ′ ʹ′ ʹ′ n 1) ʹ′ ʹ′ ʹ′ g
ʹ′ ʹ′ n 1 + ʹ′ ʹ′ ʹ′ n 1 = ʹ′ ʹ′ n 2 + ʹ′ ʹ′ ʹ′ n 2ʹ′ ʹ′ n 2 = ʹ′ ʹ′ n 1 + ʹ′ ʹ′ ʹ′ n 1 − ʹ′ ʹ′ ʹ′ n 2
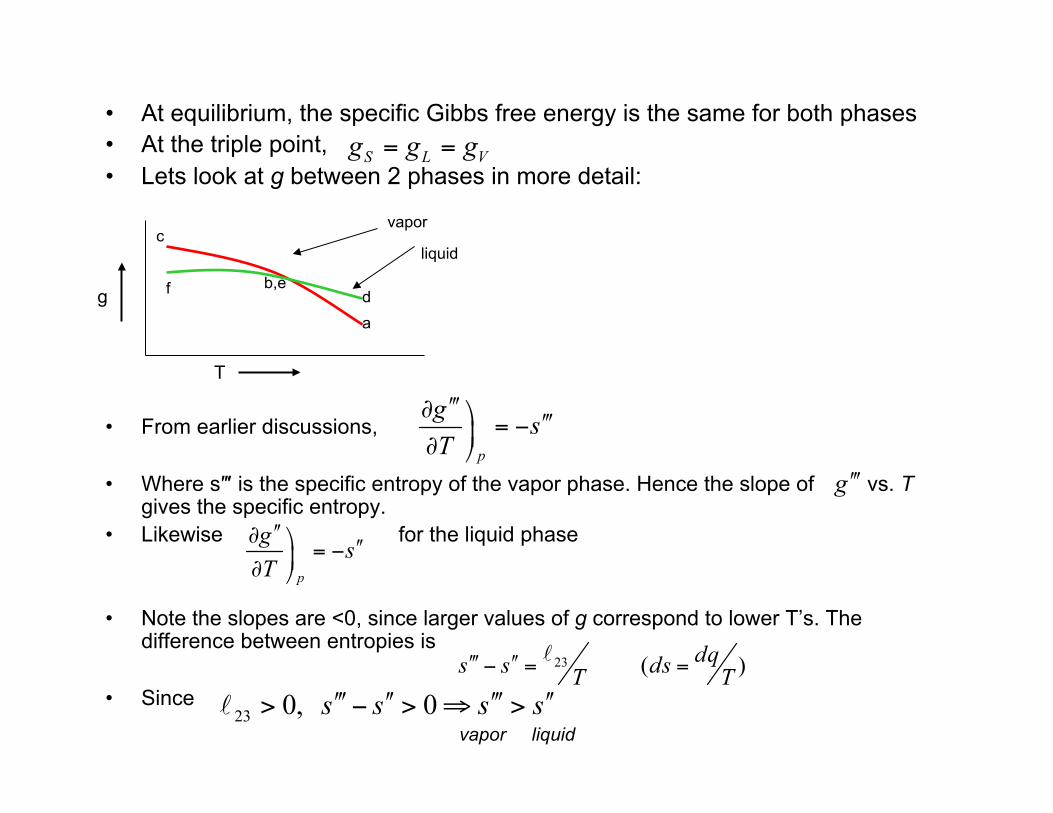
• At equilibrium, the specific Gibbs free energy is the same for both phases • At the triple point, • Lets look at g between 2 phases in more detail:
• From earlier discussions,
• Where s′″ is the specific entropy of the vapor phase. Hence the slope of vs. T gives the specific entropy.
• Likewise for the liquid phase
• Note the slopes are <0, since larger values of g correspond to lower T’s. The difference between entropies is
• Since
liquid
a d f
vapor
g
T
c
b,e
vapor liquid

Clausius-Clapeyron Equation • This equation is very important since it describes the variation in pressure
with temperature, for a system consisting of two phases in equilibrium. For the case of a liquid/vapor or vapor/solid system, this “pressure” is the saturation vapor pressure.
• For a system in equilibrium,
• Suppose the system undergoes a small change to a new pressure and temperature, p+dp, T+dT such that the new state is also a stable state. Each phase changes by amounts.
• Then for each phase:
• Since the new state is also an equilibrium state,
€
vapo ʹ′ ʹ′ ʹ′ r liqui ʹ′ ʹ′ d

• Or,
• Since
• For vapor-liquid system • For vapor-ice system • Geometrical Interpretation
T
P
VAPOR
SOLID LIQUID
Triple point
CLAUSIUS-CLAPEYRON EQUATION
s, v are specific quantities!
For vapor-liquid system
Critical point
S-L L-V
S-V
gives the slope of the equilibrium line between the 2 phases involved. (on P-V-T diagram.)
=latent heat for vapor-liquid interface
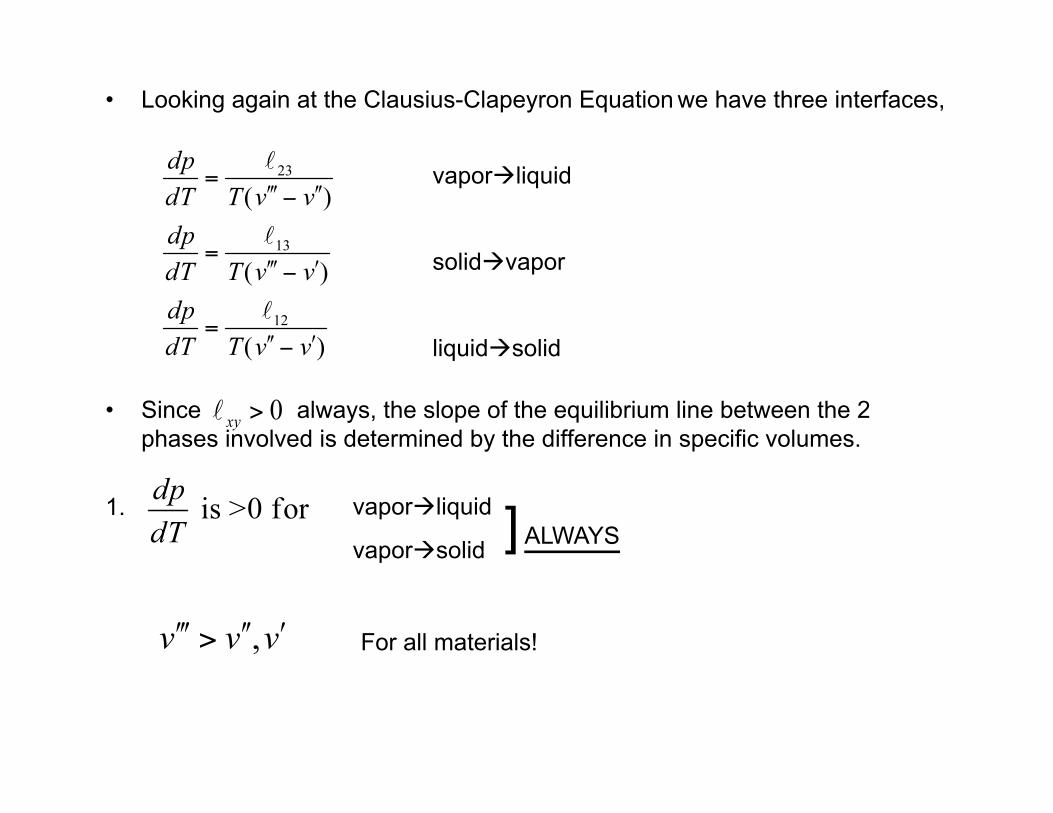
• Looking again at the Clausius-Clapeyron Equation we have three interfaces,
• Since always, the slope of the equilibrium line between the 2 phases involved is determined by the difference in specific volumes.
1.
vaporliquid
solidvapor
liquidsolid
vaporliquid
vaporsolid ] ALWAYS
For all materials!

2.
for a substance that expands upon freezing (like water). Then
substance contracts upon freezing. (MOST SUBSTANCES!)
T
P
V
S L
Triple
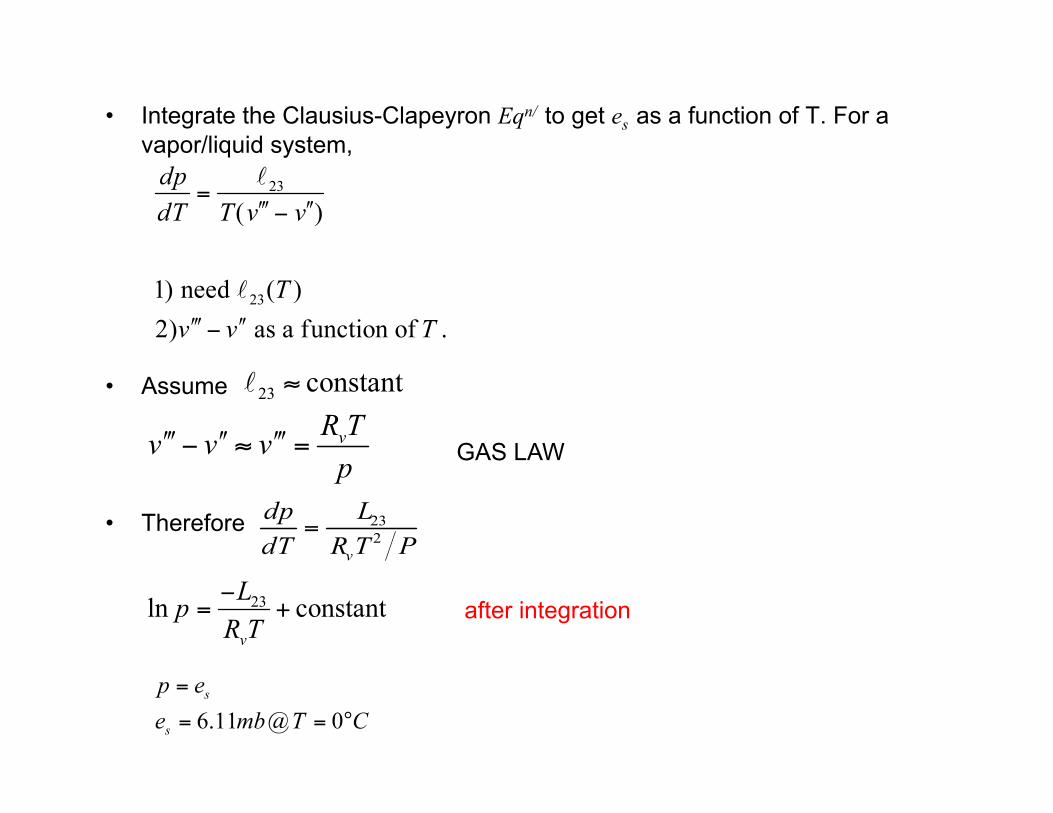
• Integrate the Clausius-Clapeyron Eqn/ to get es as a function of T. For a vapor/liquid system,
• Assume
• Therefore
GAS LAW
after integration
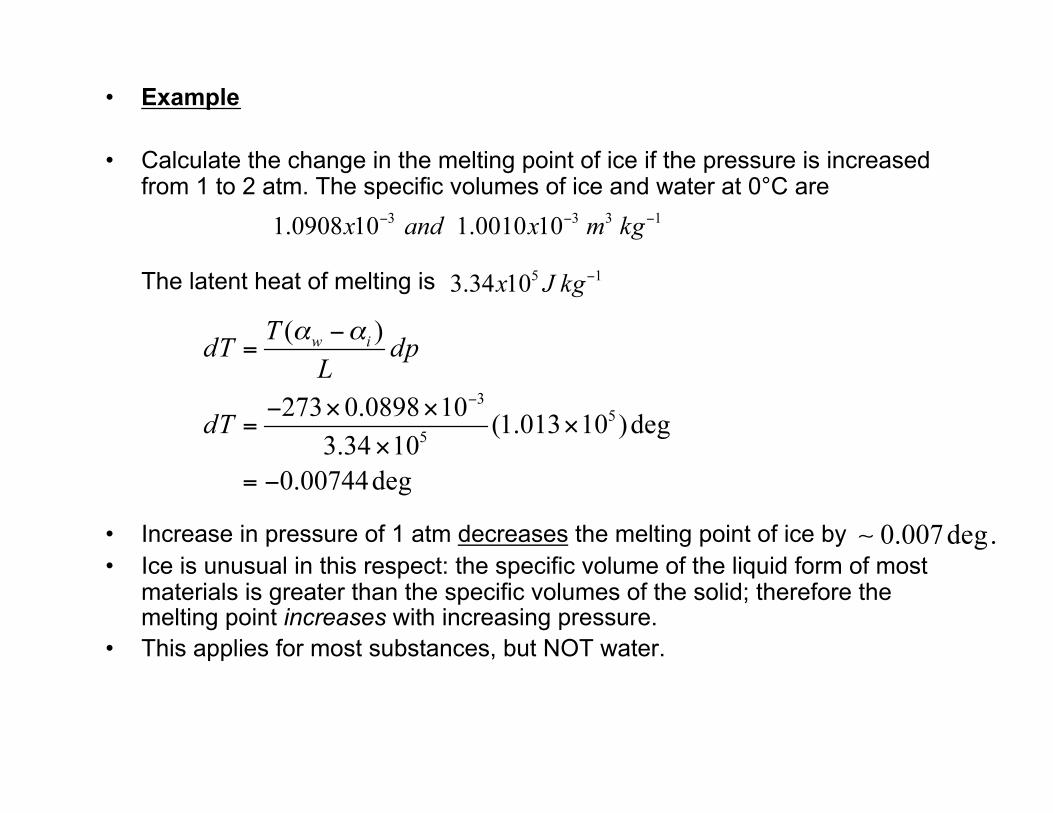
• Example
• Calculate the change in the melting point of ice if the pressure is increased from 1 to 2 atm. The specific volumes of ice and water at 0°C are
The latent heat of melting is
• Increase in pressure of 1 atm decreases the melting point of ice by • Ice is unusual in this respect: the specific volume of the liquid form of most
materials is greater than the specific volumes of the solid; therefore the melting point increases with increasing pressure.
• This applies for most substances, but NOT water.

• Better approximations: recognize that L = L(T)
• When the individual heat capacities are of the form, • Then,
• Integration constant found from experimental pairs of p,T. • For vaporization, first approximation
(1)
(2)
Constant Lv
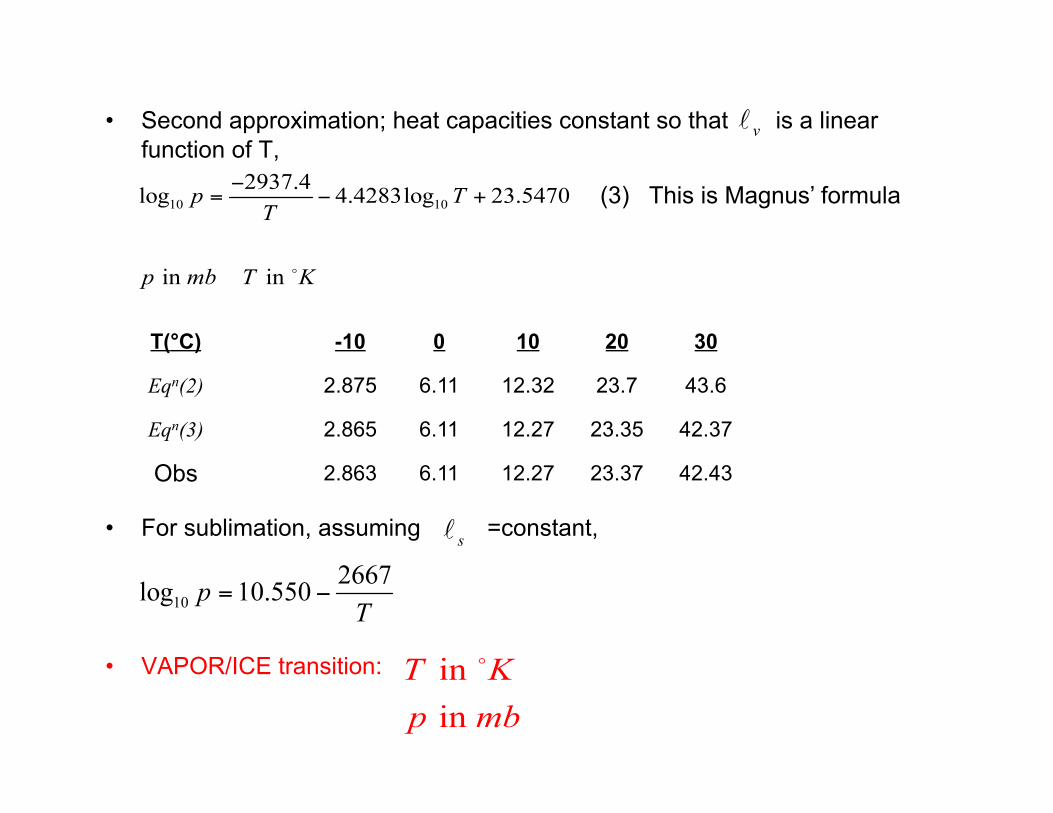
• Second approximation; heat capacities constant so that is a linear function of T,
• For sublimation, assuming =constant,
• VAPOR/ICE transition:
(3) This is Magnus’ formula
T(°C) -10 0 10 20 30
Eqn(2) 2.875 6.11 12.32 23.7 43.6
Eqn(3) 2.865 6.11 12.27 23.35 42.37
Obs 2.863 6.11 12.27 23.37 42.43

• Implications for depositional growth of ice crystals? • Why?
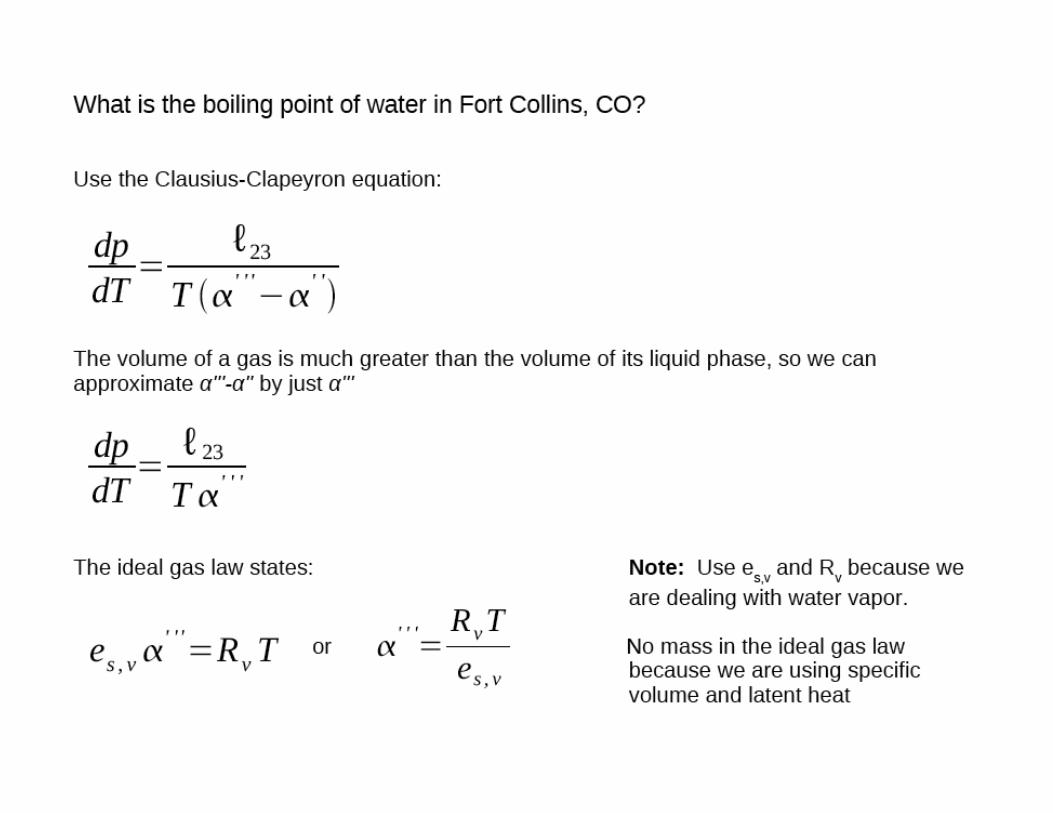
What is p at 100°C?
ice
Clausius-Clapeyron Equation


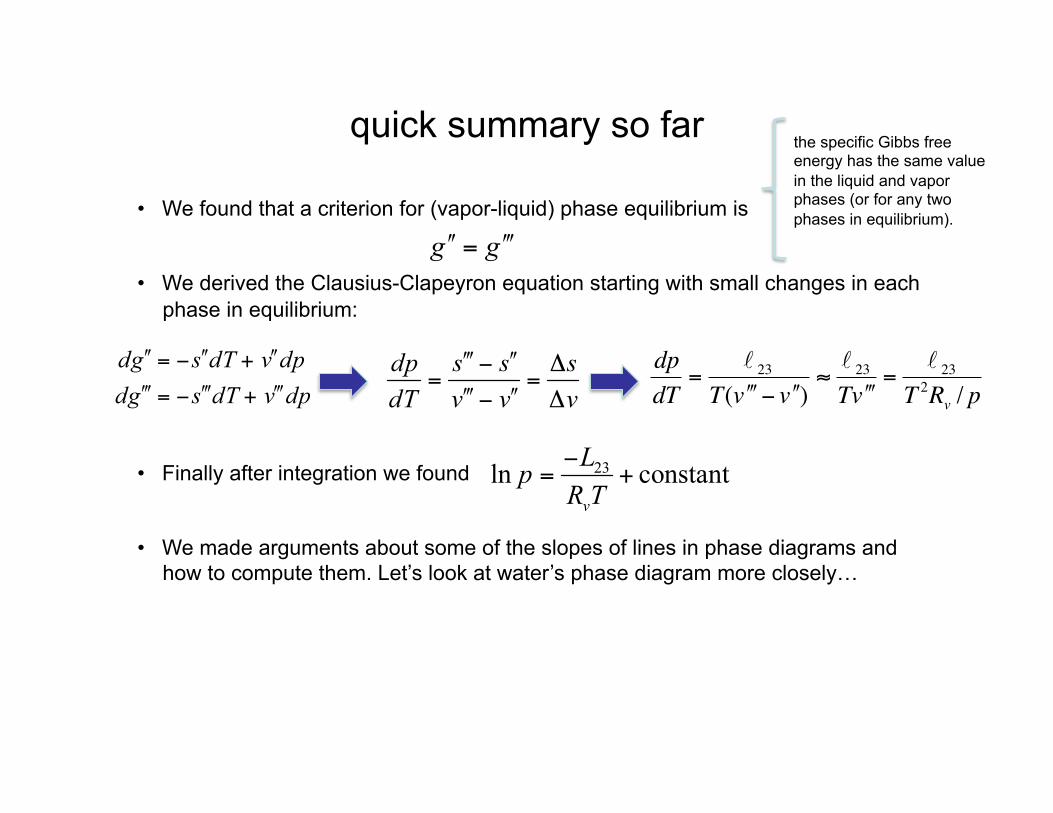
quick summary so far
• We found that a criterion for (vapor-liquid) phase equilibrium is
• We derived the Clausius-Clapeyron equation starting with small changes in each phase in equilibrium:
• Finally after integration we found
• We made arguments about some of the slopes of lines in phase diagrams and how to compute them. Let’s look at water’s phase diagram more closely…
€
dpdT
= 23
T( ʹ′ ʹ′ ʹ′ v − ʹ′ ʹ′ v )≈ 23T ʹ′ ʹ′ ʹ′ v
= 23
T 2Rv / p
the specific Gibbs free energy has the same value in the liquid and vapor phases (or for any two phases in equilibrium).

(from wikipedia)
close to the critical point, small changes in pressure or temperature result in large changes in density (volume)
The heat of vaporization is zero at and beyond the critical point, so there is no distinction between the two phases.
Above the critical temperature a liquid cannot be formed by an increase in pressure. We would find an inflection on a p-V diagram:
Phase diagram in P-T space
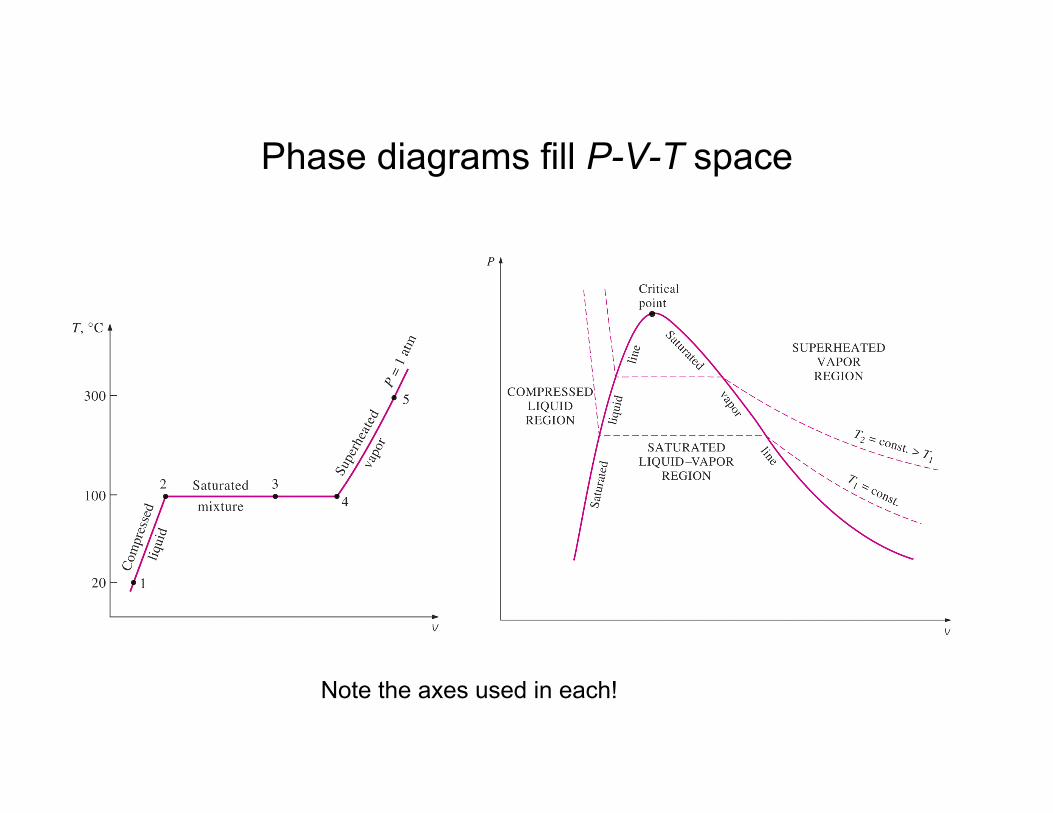
Phase diagrams fill P-V-T space
Note the axes used in each!

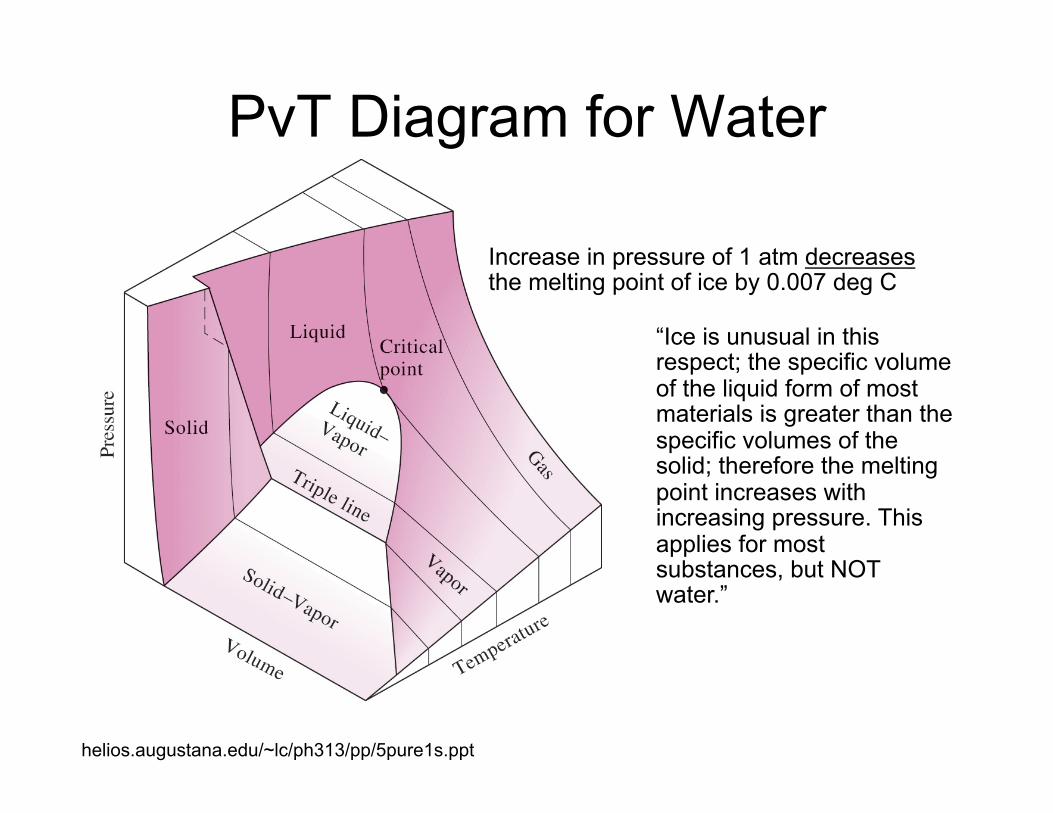
PvT Diagram for Water
helios.augustana.edu/~lc/ph313/pp/5pure1s.ppt
PvT Diagram for Water
helios.augustana.edu/~lc/ph313/pp/5pure1s.ppt
Increase in pressure of 1 atm decreases the melting point of ice by 0.007 deg C
“Ice is unusual in this respect; the specific volume of the liquid form of most materials is greater than the specific volumes of the solid; therefore the melting point increases with increasing pressure. This applies for most substances, but NOT water.”

Specific volumes
http://biomodel.uah.es/Jmol/plots/phase-diagrams/
Interactive 3D phase diagrams using Jmol. A. Herráez, R.M. Hanson and L. Glasser (2009) J. Chem. Educ. 86: 566 url: http://biomodel.uah.es/Jmol/plots/phase-diagrams/
Taken at saturated vapor pressure (P increases with T here)
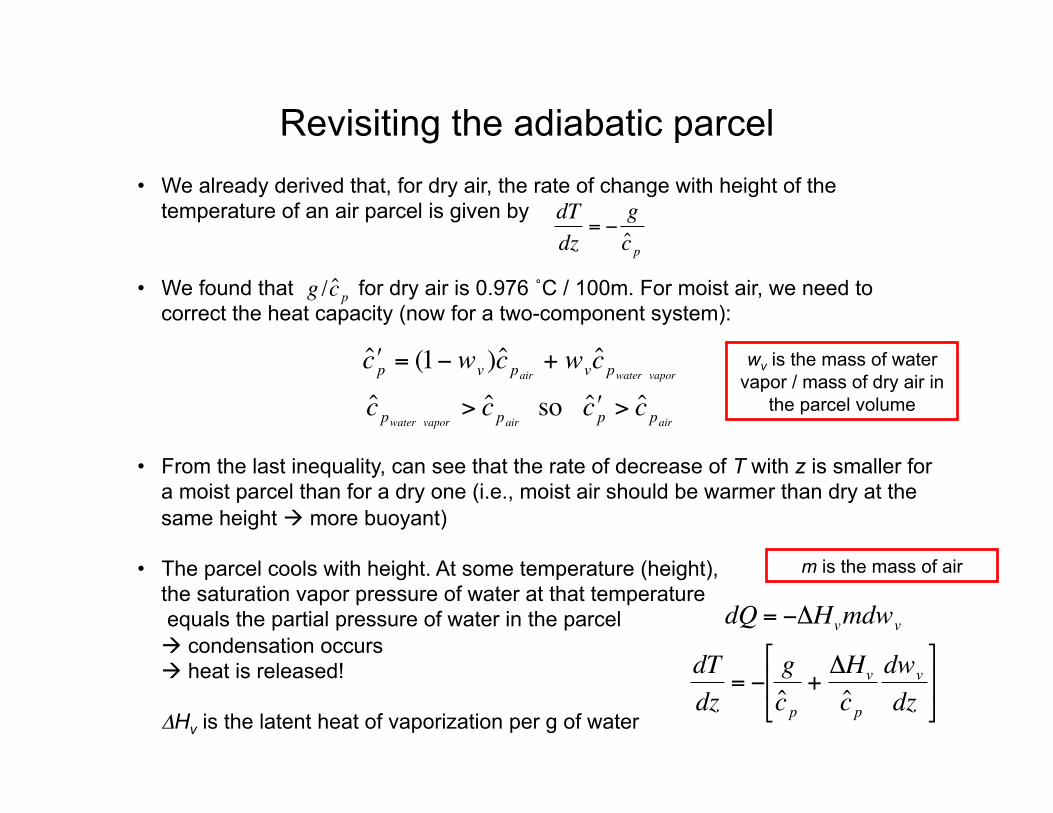
Revisiting the adiabatic parcel • We already derived that, for dry air, the rate of change with height of the
temperature of an air parcel is given by
• We found that for dry air is 0.976 ˚C / 100m. For moist air, we need to correct the heat capacity (now for a two-component system):
• From the last inequality, can see that the rate of decrease of T with z is smaller for a moist parcel than for a dry one (i.e., moist air should be warmer than dry at the same height more buoyant)
• The parcel cools with height. At some temperature (height), the saturation vapor pressure of water at that temperature equals the partial pressure of water in the parcel condensation occurs heat is released!
ΔHv is the latent heat of vaporization per g of water
€
g / ˆ c p
€
dTdz
= −gˆ c p
€
ˆ ʹ′ c p = (1− wv ) ˆ c pair+ wv ˆ c pwater vapor
ˆ c pwater vapor> ˆ c pair
so ˆ ʹ′ c p > ˆ c pair
wv is the mass of water vapor / mass of dry air in
the parcel volume
€
dQ = −ΔHvmdwv
dTdz
= −gˆ c p
+ΔHv
ˆ c pdwv
dz
⎡
⎣ ⎢
⎤
⎦ ⎥
m is the mass of air
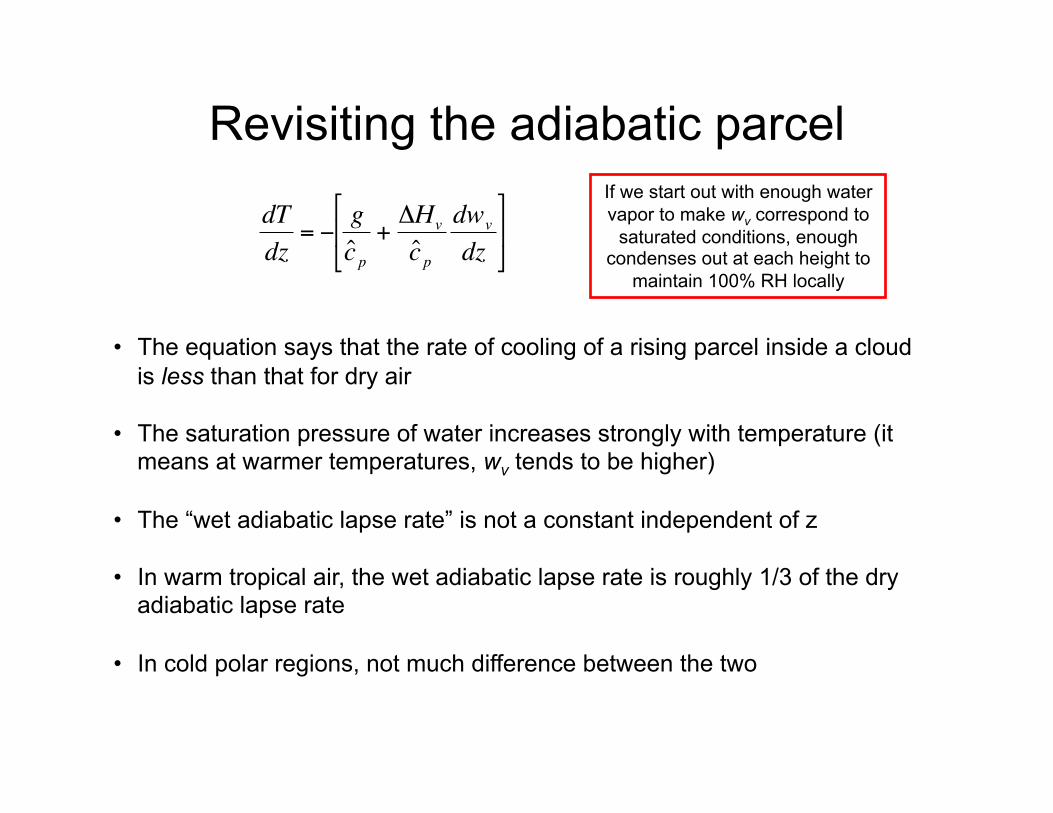
Revisiting the adiabatic parcel
€
dTdz
= −gˆ c p
+ΔHv
ˆ c pdwv
dz
⎡
⎣ ⎢
⎤
⎦ ⎥
• The equation says that the rate of cooling of a rising parcel inside a cloud is less than that for dry air
• The saturation pressure of water increases strongly with temperature (it means at warmer temperatures, wv tends to be higher)
• The “wet adiabatic lapse rate” is not a constant independent of z
• In warm tropical air, the wet adiabatic lapse rate is roughly 1/3 of the dry adiabatic lapse rate
• In cold polar regions, not much difference between the two
If we start out with enough water vapor to make wv correspond to
saturated conditions, enough condenses out at each height to
maintain 100% RH locally

T
Pk
Saturated adiabats
(blue dashed)
Saturated water mixing ratio (tan
dashed)
Equivalent Potential Temperature, θe
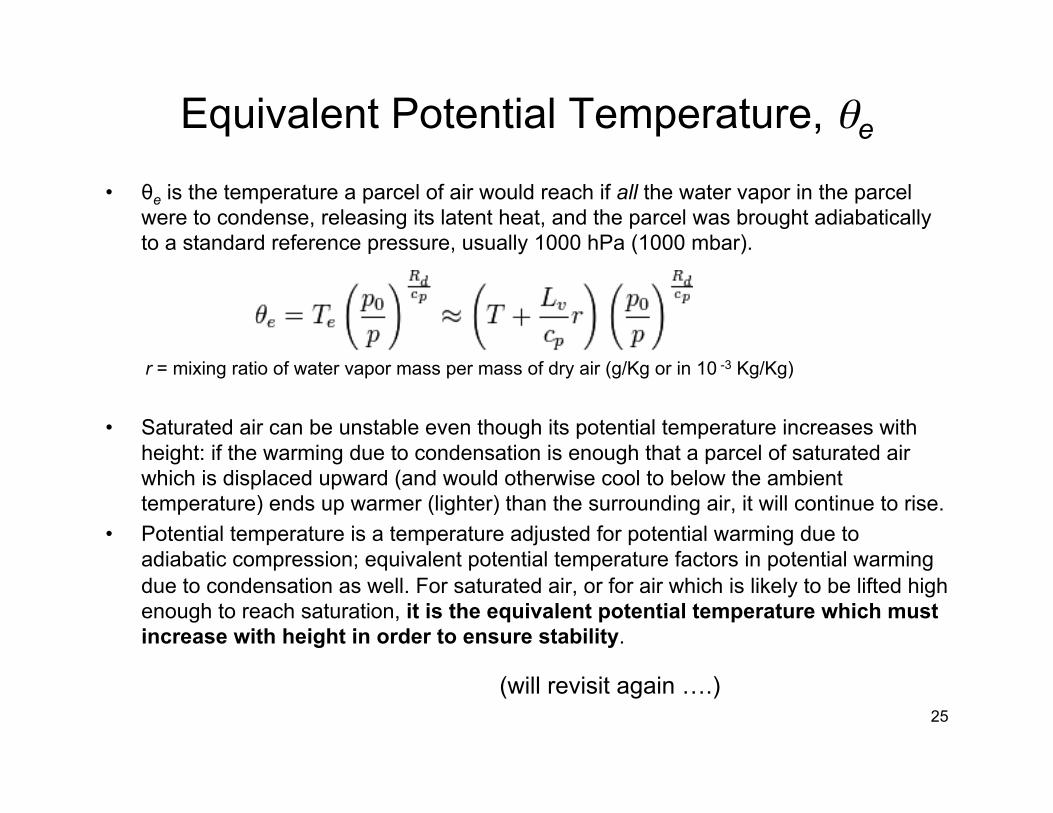
• θe is the temperature a parcel of air would reach if all the water vapor in the parcel were to condense, releasing its latent heat, and the parcel was brought adiabatically to a standard reference pressure, usually 1000 hPa (1000 mbar).
• Saturated air can be unstable even though its potential temperature increases with height: if the warming due to condensation is enough that a parcel of saturated air which is displaced upward (and would otherwise cool to below the ambient temperature) ends up warmer (lighter) than the surrounding air, it will continue to rise.
• Potential temperature is a temperature adjusted for potential warming due to adiabatic compression; equivalent potential temperature factors in potential warming due to condensation as well. For saturated air, or for air which is likely to be lifted high enough to reach saturation, it is the equivalent potential temperature which must increase with height in order to ensure stability.
25
r = mixing ratio of water vapor mass per mass of dry air (g/Kg or in 10 -3 Kg/Kg)
(will revisit again ….)