thesis m.tech
TRANSCRIPT
A COMPARATIVE STUDY OF SEWERAGETREATMENT PLANTS WITH DIFFERENT
TECHNOLOGIES IN THE VICINITY OF CHANDIGARHCITY
A DISSERTATION
SUBMITTED TO THE PANJAB UNIVERSITY, CHANDIGARH IN THE
PARTIAL FULFILLMENT OF THE REQUIREMENT FOR
THE AWARD OF THE DEGREE OF
MASTER OF ENGINEERING
IN
ENVIRONMENTAL ENGINEERING
SUBMITTED BY
PRERNA SHARMA
POST GRADUATE ENVIRONMENTAL ENGINEERING DEPARTMENT
PEC UNIVERSITY OF TECHNOLOGY
CHANDIGARH – 160012
2013


I
CERTIFICATE
This is to certify that the thesis entitled “A comparative study of seweragetreatment plants with different technologies in the vicinity of Chandigarh”which is being submitted herewith by Prerna Sharma (Roll no. 11201009) in partialfulfillment for the award of the degree of Master of Engineering (EnvironmentalEngg.) of PEC University of Technology Chandigarh is an authentic record of thestudent’s own work carried out under our supervision and guidance. The matterpresented in the thesis has reached the standards fulfilling the requirements of theregulation for the award of said degree.
Dr. R.K Khitoliya Dr. Shakti Kumar
Professor and Head Associate Professor
Deptt. Of Civil Engineering Deptt. Of Civil Engineering
PEC University of Technology PEC University of Technology
Chandigarh Chandigarh

II
ACKNOWLEDGEMENT
The present shape of this study has come forth only after contribution from differentspheres. Had this encouragement and support not been forth coming, it would havebeen extremely difficult to complete the thesis work in time.
I acknowledge my sincere thanks to my main guide Dr. R.K. Khitoliya, Professorand Head, Deptt. Of Civil Engineering, PEC, Chandigarh for his continuous supportin my thesis work. Mere words can never encompass the profound gratitude. I feelfor his guidance, valuable critism and constant inspiration that never let me waverduring the course of my thesis.
I am also highly thankful to my Co-Guide Dr. Shakti Kumar, Associate Professor,Civil Engineering department, Chandigarh without whose timely help andsuggestions my thesis work would never have been possible. I express my sincerethanks to him for providing me the necessary guidance throughout my thesis work.
I would like to thank Mr. Harish Kumar Saini, S.D.O, Sewerage Treatment Plant,Diggian, Mohali and Sewerage Treatment Plant Raipur Kalan for providing accessto these plants and for providing me the information i needed.
I own my special thanks to Mr. Pandey, Scientist, Chandigarh Pollution ControlCommittee for providing relevant information regarding my thesis work.
I am very thankful to Mr. Baljeet Singh, Mr. Bhardwaj and Mr. K. S. P Rana forproviding a pleasant atmosphere and necessary facilities in the laboratory.
Last but not the least, i am deeply grateful to my beloved parents for their moralsupport, love and encouragement without which it would not have been possible toreach this stage of my life.
Prerna Sharma

III

III
LIST OF TABLES
TABLE NO. CONTENTS PAGE NO.
1.1Comparison between Raipur Kalan,Raipur Khurd and Mohali STP 10
3.1 Parameters and Methods for their Analysis 34
3.2
Central Pollution Control Board (CPCB)
General Standards for the discharge of
Environmental Pollutants according to The
Environment (Protection) Rules, 1986
Schedule-VI Part–A : Effluents
49
4.1Characteristics of Influent and Effluent ofall the 3 STP’S in the month of FEB 54
4.2Characteristics of Influent and Effluent of
all the 3 STP’S in the month ofMARCH
55
4.3Characteristics of Influent and Effluent ofall the 3 STP’S in the month ofAPRIL
56

IV
4.4Average Characteristics of Influent andEffluent of all the 3 STP’S 57
4.5Comparison of all the three STP’s Effluentwith CPCB Effluent Discharge Standardsinto Inland Surface Water
63
4.6Overall Performance orRemoval/Reduction Efficiency of all the3 STP’s
66
4.7
Comparison of Mohali STP, (MBBR)
Technology, Average Effluent With the
CPCB Effluent Discharge Standards into
Land for Irrigation
72

V
LIST OF FIGURES
FIGURE NO. CONTENTS PAGE NO.
1.1Typical Stages in the Conventional
Treatment of Sewage2
1.2General diagram showing variousparts of an Sewerage Treatment
Plant3
1.3 Tube Chip Shaped Bio-Carriers 5
1.4Flow diagram showing MBBRtechnology at STP “Diggian”,
Mohali6
1.5Flow diagram showing UASB
technology at STP Raipur Kalan8
1.6Flow diagram showing ASP
technology at STP Raipur Khurd9
3.1 pH apparatus 35
3.2 Digital Thermometer 36
3.3 Soxhlet Apparatus 38
3.4 Glass Fibre Apparatus for TSS 40
3.5 BOD Incubator 42
3.6 Spectrophotometer 45
3.7Spectrophotometer Showing
Standard Curve46
4.1Graphical Representation of pH of
all the 3 STP’s 58

VI
4.2Graphical Representation of
Temperature of all the 3 STP’s 58
4.3Graphical Representation of TSS of
all the 3 STP’s 59
4.4Graphical Representation of TDS
of all the 3 STP’s 59
4.5Graphical Representation of Oil
and Grease of all the 3 STP’s 60
4.6Graphical Representation of BOD
of all the 3 STP’s 60
4.7Graphical Representation of COD
of all the 3 STP’s 61
4.8Graphical Representation of Cl- of
all the 3 STP’s 61
4.9Graphical Representation NO3-N of
all the 3 STP’s 62
4.10Graphical Representation of NH3 -
N of all the 3 STP’s 62
4.11Graphical Representation of of
PO4- OF all the 3 STP’s 63
4.12Graphical representation ofParameter exceeding CPCB
Standard65
4.13
Graphical representation of TSS forOverall Performance or
Removal/Reduction Efficiency of3 all the STP’s
67
4.14
Graphical representation of TDSfor Overall Performance or
Removal/Reduction Efficiency of3 all the STP’s
68

VII
4.15
Graphical representation of CODfor Overall Performance or
Removal/Reduction Efficiency of3 all the STP’s
69
4.16
Graphical representation of BODfor Overall Performance or
Removal/Reduction Efficiency of3 all the STP’s
70
4.17
Graphical representation of BODfor Overall Performance or
Removal/Reduction Efficiency of3 all the STP’s
71
VIII
LIST OF ABBREVIATIONS
BOD Biochemical Oxygen Demand
COD Chemical Oxygen Demand
FIG Figure
CPCB Central Pollution Control Board
mg/L Milligram Per Litre
TDS Total Dissolved Solids
TSS Total Suspended Solids
NO3 -N Nitrate Nitrogen
NH3 –N Ammonia Nitrogen
Cl- Chloride
PO4- Phosphate
Temp Temperature
MPN Most Probable Number
STP Sewerage Treatment Plant
ASP Activated Sludge Process
UASB Upflow Anaerobic Sludge Blanket
MBBR Moving Bed Biofilm Reactor
C Degree Celsius
IX
ABSTRACT
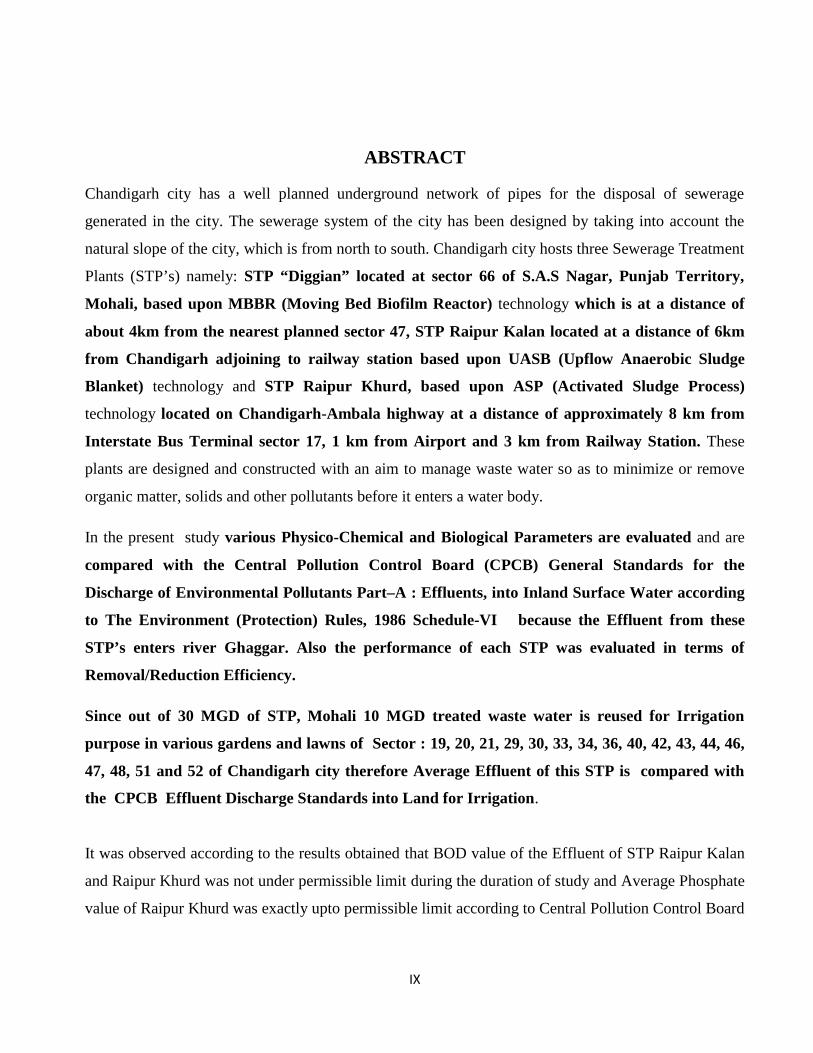
Chandigarh city has a well planned underground network of pipes for the disposal of sewerage
generated in the city. The sewerage system of the city has been designed by taking into account the
natural slope of the city, which is from north to south. Chandigarh city hosts three Sewerage Treatment
Plants (STP’s) namely: STP “Diggian” located at sector 66 of S.A.S Nagar, Punjab Territory,
Mohali, based upon MBBR (Moving Bed Biofilm Reactor) technology which is at a distance of
about 4km from the nearest planned sector 47, STP Raipur Kalan located at a distance of 6km
from Chandigarh adjoining to railway station based upon UASB (Upflow Anaerobic Sludge
Blanket) technology and STP Raipur Khurd, based upon ASP (Activated Sludge Process)
technology located on Chandigarh-Ambala highway at a distance of approximately 8 km from
Interstate Bus Terminal sector 17, 1 km from Airport and 3 km from Railway Station. These
plants are designed and constructed with an aim to manage waste water so as to minimize or remove
organic matter, solids and other pollutants before it enters a water body.
In the present study various Physico-Chemical and Biological Parameters are evaluated and are
compared with the Central Pollution Control Board (CPCB) General Standards for the
Discharge of Environmental Pollutants Part–A : Effluents, into Inland Surface Water according
to The Environment (Protection) Rules, 1986 Schedule-VI because the Effluent from these
STP’s enters river Ghaggar. Also the performance of each STP was evaluated in terms of
Removal/Reduction Efficiency.
Since out of 30 MGD of STP, Mohali 10 MGD treated waste water is reused for Irrigation
purpose in various gardens and lawns of Sector : 19, 20, 21, 29, 30, 33, 34, 36, 40, 42, 43, 44, 46,
47, 48, 51 and 52 of Chandigarh city therefore Average Effluent of this STP is compared with
the CPCB Effluent Discharge Standards into Land for Irrigation.
It was observed according to the results obtained that BOD value of the Effluent of STP Raipur Kalan
and Raipur Khurd was not under permissible limit during the duration of study and Average Phosphate
value of Raipur Khurd was exactly upto permissible limit according to Central Pollution Control Board

X
(CPCB) General Standards for the Discharge of Environmental Pollutants Part –A: Effluents, into
Inland Surface Water according to The Environment (Protection) Rules, 1986 Schedule-VI.
According to the results obtained it was also revealed that all the Physico-Chemical and Biological
Parameters evaluated for STP Mohali was under permissible limit according to CPCB Effluent
Discharge Standards into Land for Irrigation and also into Inland Surface water.
Also it was revealed from the performance study that efficiency of the three STP’s mentioned above
was poor with respect to removal of TDS (Total Dissolved Solids) in contrast to the removal
/reduction efficiency in other parameters like TSS (Total Suspended Solids), BOD (Biochemical
Oxygen Demand) and COD (Chemical Oxygen Demand).
The order of removal/reduction efficiency was 1.TDS(39%) 2.COD(56%) 3.TSS(76%)
4.BOD(79%), 1.TDS(46%) 2.TSS(51%) 3.BOD(73%) 4.COD(78%) and 1.TDS(55%) 2.COD(75%)
3.TSS(78%) 4.BOD(88%) respectively in Raipur Kalan STP, Raipur Khurd STP and “Diggian”
Mohali STP. In comparison with each other, out of the three STP’s, “Diggian” STP Located at
Mohali showed better results for the effluent, its reduction efficiency for BOD is 88% and is
highest among Raipur Kalan STP and Raipur Khurd STP which is 79% and 73% respectively.
From the evaluation it is further revealed that Mohali STP based upon MBBR technology have more
stable results than Raipur Kalan STP, based upon UASB technology and Raipur Khurd STP, based
upon ASP technology. The order of overall performance for the technologies studied in different
STP’s are: 1.MBBR 2.UASB 3.ASP which proves that MBBR technology is ahead to UASB and ASP
technology in the treatment of sewage.
Additionally, the working principle, problems associated with the operation and maintenance of all the
three STP’s is also discussed.

CONTENTS
CERTIFICATE I
ACKNOWLEDGEMENT II
LIST OF TABLES III
LIST OF FIGURES V
LIST OF ABBREVIATIONS VIII
ABSTRACT IX
CHAPTER 1
INTRODUCTION
1.1 General 1
1.2 30 MGD Sewerage Treatment plant, “DIGGIAN” 4based upon MBBR technology, at sector66 S.A.S Nagar, Phase 11, Mohali
1.3 5 MGD sewerage treatment plant based upon 7UASB technology at Raipur Kalan, Chandigarh
1.4 1.25 MGD Sewerage Treatment Plant based upon 9ASP technology at Raipur Khurd, Chandigarh
1.5 Objectives of the study 11
1.6 Significance of the study 11

CHAPTER 2
REVIEW OF LITERATURE
2.1 The innovative Moving Bed Biofilm Reactor/ solids contact 12
reaeration process for secondary treatment of municipal wastewater
2.2 Biological Fixed Film Systems 12
2.3 The Moving Bed Bio film Reactor 13
2.4 Treatment of pesticide wastewater by Moving-Bed Biofilm 13
Reactor combined with Fenton-coagulation pretreatment
2.5 Performance comparison of a pilot-scale UASB and DHS system 14
and activated sludge process for the treatment of municipal wastewater
2.6 Efficiency evaluation of sewage treatment plant with different 14
technologies in Delhi (India)
2.7 Treatment of domestic wastewater in an Up-Flow Anaerobic Sludge 15
Blanket reactor followed by Moving Bed Biofilm Reactor
2.8 Assessment of the efficiency of Sewerage Treatment Plants 16
2.9 Performance Evaluation of Moving Bed Bio-Film Reactor Technology 16
for Treatment of Domestic Waste Water in Industrial Area at MEPZ
(Madras Exports Processing Zone), Tambaram, Chennai, India
2.10 Biofilms in Water and Wastewater treatment 16
2.11 A review: The anaerobic treatment of sewage in UASB and EGSB 17
Reactors
2.12 Comparison of overall performance between "Moving-Bed" 18
and "Conventional" Sequencing Batch Reactor
2.13 Anaerobic sewage treatment in a one-stage UASB reactor and a 18
Combined UASB-Digester system
2.14 Performance evaluation of a UASB – activated sludge system 19
treating municipal wastewater
2.15 Combined Anaerobic/Aerobic Secondary Municipal Wastewater 20
Treatment: Pilot-Plant Demonstration of the UASB/Aerobic Solid
Contact System
2.16 Improvements in Biofilm Processes for Wastewater Treatment 21

2.17 Fluidized Bed Biofilm Reactor for wastewater treatment 22
2.18 Integrated application of Upflow Anaerobic Sludge Blanket 23
Reactor for the treatment of wastewaters
2.19 Potential of a Combination of UASB and DHS Reactor as a 23
Novel Sewage Treatment System for Developing Countries:
Long-Term Evaluation
2.20 A review of the upflow anaerobic sludge blanket reactor 24
2.21 Removal of Slowly Biodegradable COD in Combined Thermophilic 25
UASB and MBBR Systems
2.22 Technical review on the UASB process 26
2.23 Wastewater Treatment in Baghdad City Using Moving Bed 27
Biofilm Reactor (MBBR) Technology
2.24 The performance enhancements of Upflow Anaerobic Sludge 28
Blanket (UASB) reactors for domestic sludge treatment – A State of the
art review
2.25 Treatment of raw domestic sewage in an UASB reactor 28
2.26 Upgrading Activated Sludge Systems and reduction in excess sludge 29
2.27 Developments in wastewater treatment methods 29
2.28 Microbial attachment and growth in Fixed-Film Reactors: Process 30
startup considerations
2.29 Small wastewater treatment plants: A challenge to wastewater engineers 31
2.30 Sustainable options of post treatment of UASB effluent treating 31
sewage: A review
CHAPTER 3
MATERIALS AND METHODOLOGY
3.1 Selection of Sites and Sampling Points 33
3.2 Collection of Samples 33
3.3 Parameters Analyzed 33
3.4 Methods for Analysis 35
CHAPTER 4
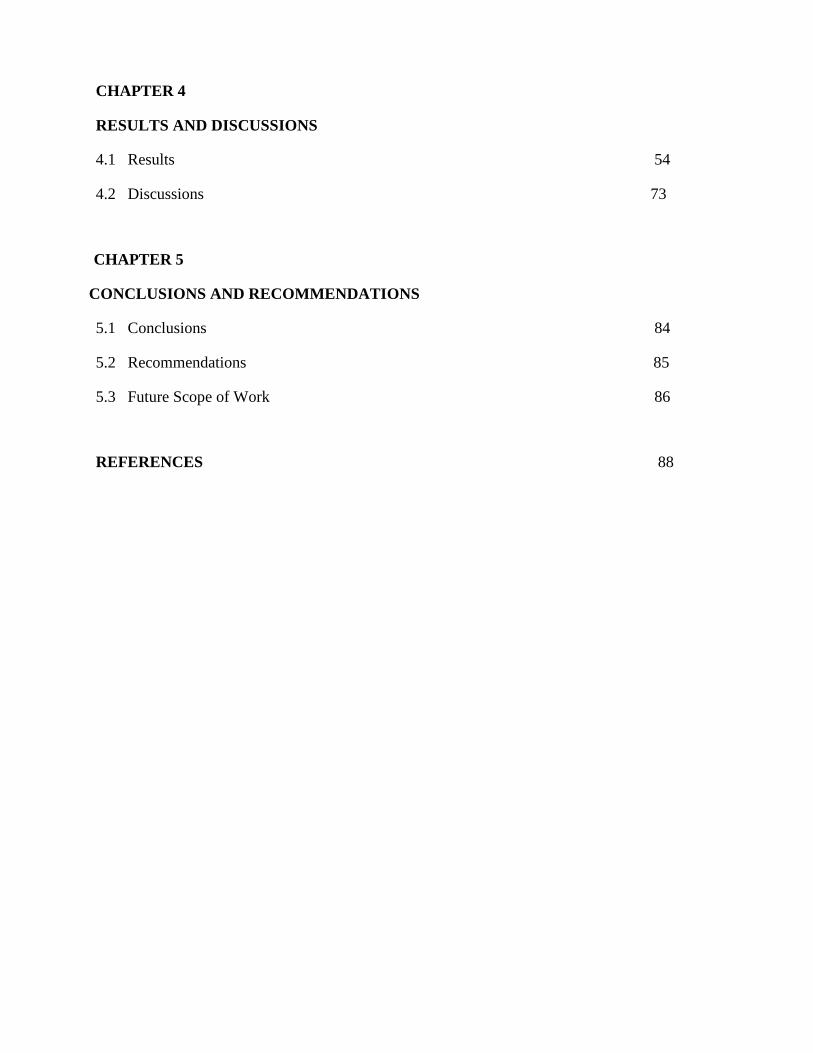
RESULTS AND DISCUSSIONS
4.1 Results 54
4.2 Discussions 73
CHAPTER 5
CONCLUSIONS AND RECOMMENDATIONS
5.1 Conclusions 84
5.2 Recommendations 85
5.3 Future Scope of Work 86
REFERENCES 88

1
CHAPTER 1
INTRODUCTION
1.1 General
In early days waste products of the society including human excreta were been collected, carried &
disposed of manually by the human beings and this system is called dry conservancy system. This
system leads to bad smell and health hazard. Now a day with the march of civilization &
development proper disposal of waste done by a new system called sewerage system that had
replaced the old dry conservancy system. In the sewerage system, the waste mixed with water is
called sewage. Sewage carried through close pipes or lines called sewers to the place away from
the residential area under the force of gravity to Sewerage Treatment Plant (STP). Here sewage
treated before disposing in environment. Sewage includes dissolved and suspended organic solids,
number of living microorganism, which lead into bad condition, odour and appearance.
Microorganism may contain disease-producing (pathogenic) bacteria and viruses that can be
readily transferred by sewage from sick individuals to well ones. So by removing it properly
environment can be maintained in an acceptable and safe condition.
State and Local authorities with statutory authority in pollution control have established standards
of purity that are necessary to prevent pollution of natural waters. When waste is discharged into
controlled amount, the standards set by State and Local authorities are maintained. Domestic
sewage consists of waste from toilets, lavatories, urinals, bathtubs, showers, home laundries and
kitchens. It also includes similar wastes from medical dispensaries and hospitals.
Treatment Methods Generally Followed at an STP
Sewerage Treatment Plant is a facility designed to receive the waste from domestic, commercial
and industrial sources and to remove materials that damage water quality and compromise public
health and safety when discharged into water receiving systems.
It works on the objective to allow human, domestic and industrial effluents to be disposed of
without danger to human health or unacceptable damage to the natural environment.
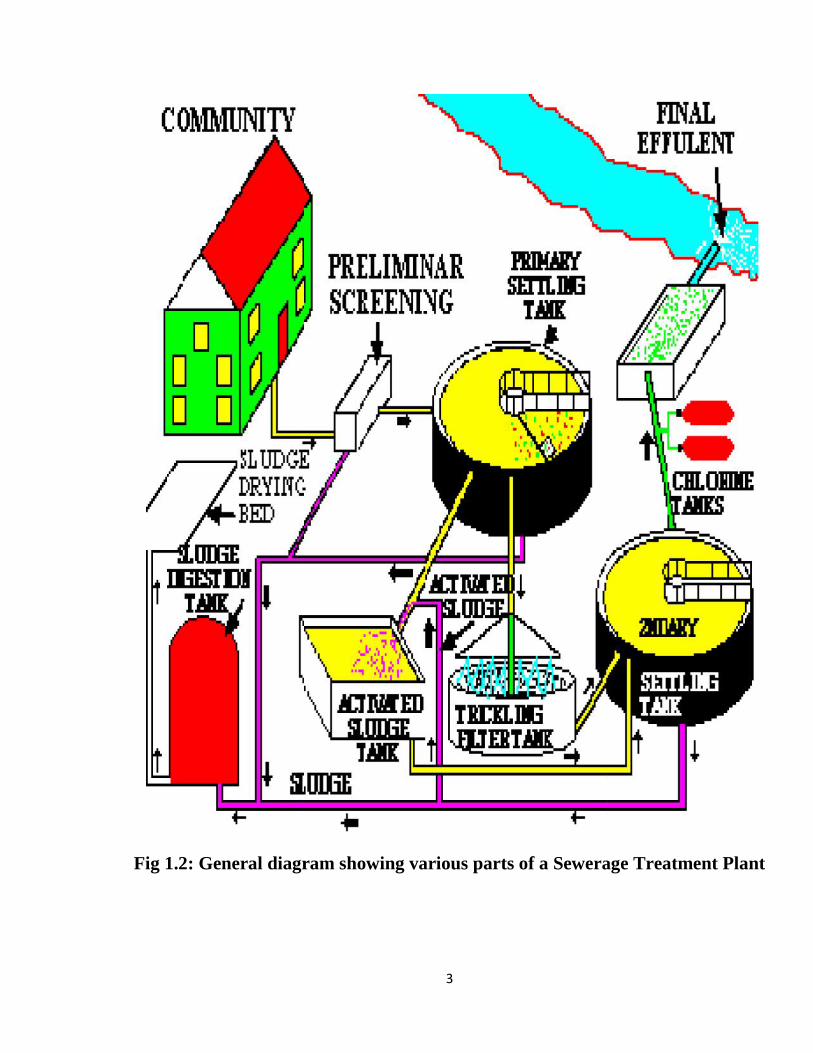
Conventional wastewater treatment consists of a combination of physical, chemical, and biological
processes and operations to remove solids, organic matter and nutrients from wastewater.

2
Fig 1.1: Typical stages in the Conventional Treatment of Sewage
3
Fig 1.2: General diagram showing various parts of a Sewerage Treatment Plant
3
Fig 1.2: General diagram showing various parts of a Sewerage Treatment Plant
3
Fig 1.2: General diagram showing various parts of a Sewerage Treatment Plant

4
1.2 30 MGD Sewerage Treatment Plant, “DIGGIAN” based upon MBBR
Technology, at Sector 66 S.A.S Nagar, Phase 11, Mohali
This Sewerage Treatment Plant, spread over an area of 48 acres, is located at Sector 66 of S.A.S.
Nagar in Punjab Territory which is at a distance of about 4 km from the nearest planned Sector 47.
The present capacity of the Sewerage Treatment Plant is 30 MGD. The sewage received at this
STP is subjected to primary, secondary and tertiary treatment. 30 MGD is treated upto tertiary
level and out of 30 MGD, 10 MGD treated waste water or sewage is recycled back to the city for
irrigation of open spaces/ gardens. The 20 MGD treated sewage is disposed off in an open Nallah
and finally it meets river Ghaggar.
The main components of STP “DIGGIAN”, Mohali Primary Treatment
Components (MBBR Technology)
1. Raw Sewage Sump : 4
2. Inlet Channel
3. Settling Chamber
4. Mechanical Screens : 4
5. Grid Separators : 4
Secondary Treatment Components
1. Fluidized Aerobic Bioreactor Media
2. MBBR units (Moving Bed Bio Film Reactors) : 2 (MBBR-I and MBBR- II)
3. Claritube settlers: 2
Tertiary Treatment Components
1. Disinfection (Chlorine contact), Chlorine Contact Tank : 1
2. Filtration: Dual filter Media, one coconut shell filter media & other coarse fine aggregates
as the other media.
5
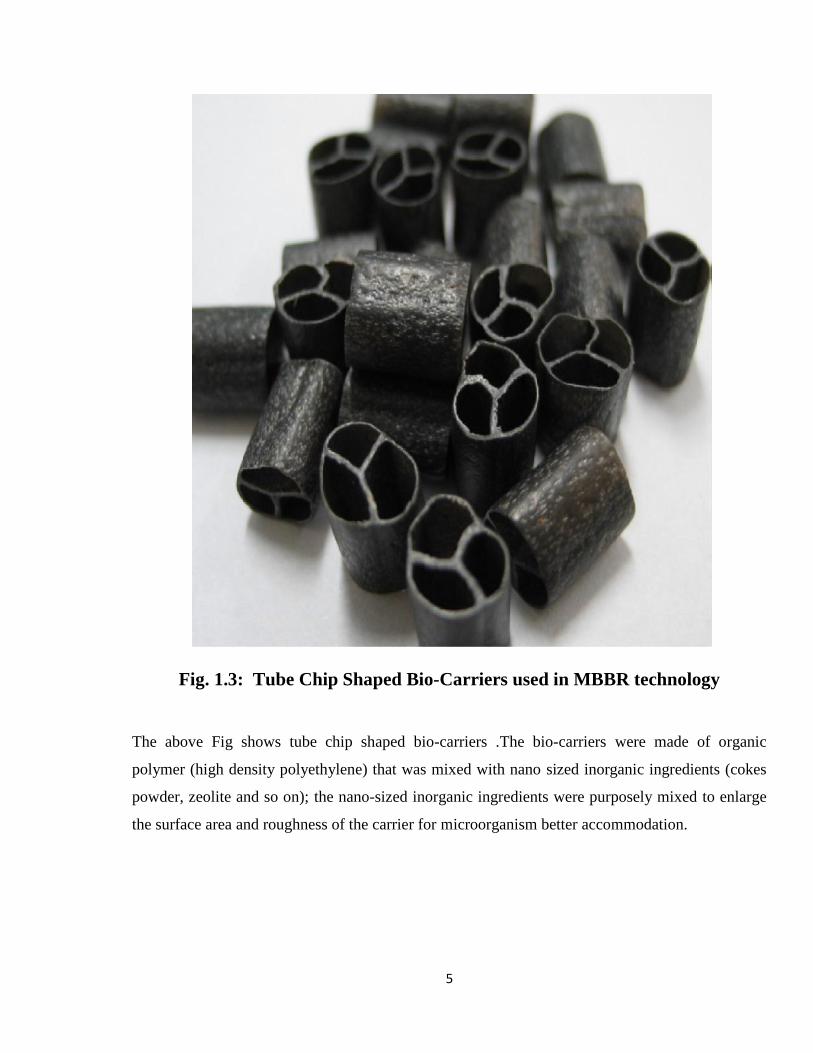
Fig. 1.3: Tube Chip Shaped Bio-Carriers used in MBBR technology
The above Fig shows tube chip shaped bio-carriers .The bio-carriers were made of organic
polymer (high density polyethylene) that was mixed with nano sized inorganic ingredients (cokes
powder, zeolite and so on); the nano-sized inorganic ingredients were purposely mixed to enlarge
the surface area and roughness of the carrier for microorganism better accommodation.

6
Fig 1.4: Flow diagram showing MBBR technology at STP Mohali

7
1.3 5 MGD Sewerage Treatment Plant based upon UASB Technology
Raipur Kalan, Chandigarh
STP Raipur Kalan is located at a distance of 6km from Chandigarh adjoining to railway station and
is based upon UASB (Upflow Anaerobic Sludge Blanket) technology.
The main components of STP Raipur Kalan (UASB Technology)
1. Inlet channel
2. Inlet chamber
3. Mechanical screens : 2
4. Manual Screen : 1
5. Grit Channel : 2
6. Parshal Flume : 2
7. Collection Chamber : 1
8. Divison Box : 1
9. Distribution Box : 4
10. UASB Reactor : 2
11. Final Polishing Unit
12. Sludge Drying Beds

8
Fig 1.5: Flow diagram showing UASB technology at STP Raipur Kalan
IINLET CHANNEL
INLET CHAMBER
SCREENS
GRIT CHANNEL
PARSHAL FLUME
COLLECTION CHAMBER
DIVISON BOX
DISTRIBUTION BOX
UASB REACTORS
EFFLUENT CHANNEL
FINAL POLISHING UNIT
SLUDGEWITHDRAWALPIT
SLUDGE DRYINGBEDS

9
1.4 1.25 MGD Sewerage Treatment Plant base upon ASP Technology at
Raipur Khurd, Chandigarh
STP Raipur Khurd, based upon ASP (Activated Sludge Process) technology is located on
Chandigarh-Ambala highway at a distance of approximately 8 km from Interstate Bus Terminal
sector 17, 1 km from Airport and 3 km from Railway Station, Chandigarh.
The main components of STP Raipur Khurd (ASP Technology)
1. Raw sewage Sump : 4
2. Inlet Channel :1
3. Mechanical Screens : 2
4. Grit Channel : 1
5. Aeration Tanks : 6
6. Secondary Sedimentation Tank: 1
7. Sludge Drying Beds
Fig 1.6: Flow diagram showing ASP technology at STP Raipur Khurd
IINLET CHANNEL
MECHANICAL SCREENS
GRIT CHANNEL
AERATION TANKS
SECONDARY SEDIMENTATION TANK
FINAL EFFLUENT
SLUDGE DRYINGBEDS
10
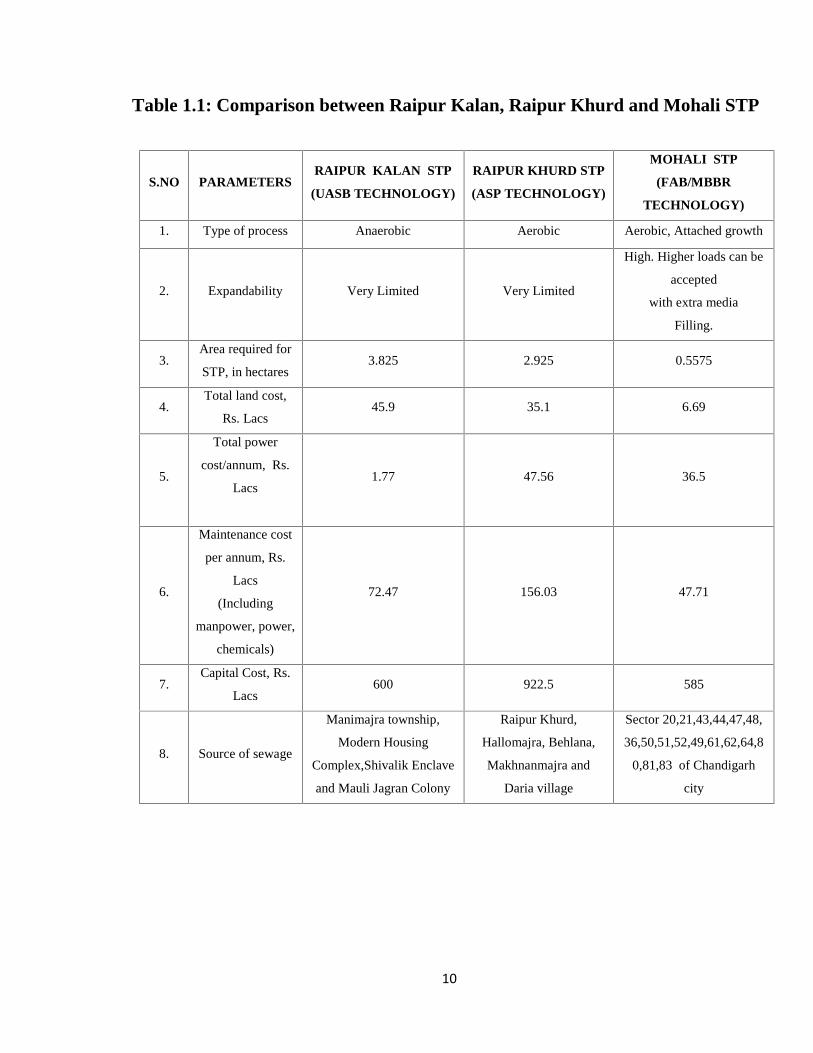
Table 1.1: Comparison between Raipur Kalan, Raipur Khurd and Mohali STP
S.NO PARAMETERSRAIPUR KALAN STP
(UASB TECHNOLOGY)
RAIPUR KHURD STP
(ASP TECHNOLOGY)
MOHALI STP
(FAB/MBBR
TECHNOLOGY)
1. Type of process Anaerobic Aerobic Aerobic, Attached growth
2. Expandability Very Limited Very Limited
High. Higher loads can be
accepted
with extra media
Filling.
3.Area required for
STP, in hectares3.825 2.925 0.5575
4.Total land cost,
Rs. Lacs45.9 35.1 6.69
5.
Total power
cost/annum, Rs.
Lacs1.77 47.56 36.5
6.
Maintenance cost
per annum, Rs.
Lacs
(Including
manpower, power,
chemicals)
72.47 156.03 47.71
7.Capital Cost, Rs.
Lacs600 922.5 585
8. Source of sewage
Manimajra township,
Modern Housing
Complex,Shivalik Enclave
and Mauli Jagran Colony
Raipur Khurd,
Hallomajra, Behlana,
Makhnanmajra and
Daria village
Sector 20,21,43,44,47,48,
36,50,51,52,49,61,62,64,8
0,81,83 of Chandigarh
city

11
1.5 Objectives of the Study
1. To analyze the physico-chemical parameters of influent and effluent of all the three STP’s
studied.
2. To study the biological parameters of influent and effluent of all the three STP’s.
3. To determine the Nutrient Load in each of the STP studied.
4. To determine the intensity and variation of pollution level in each of the STP studied.
5. To know practically about the working principle of all the three STP’s studied.
6. To determine the overall performance of each STP in terms of removal/reduction efficiency.
1.6 Significance of the Study
Proper treatment should be given to sewage in Sewerage Treatment Plant before their disposal into
inland surface water or for reuse of sewage effluent for irrigation purposes.
My study on the above three STP’s is done to check whether the effluent from the three STP’s
studied complies with the Central Pollution Control Board (CPCB) General Standards for the
discharge of environmental pollutants Part –A: Effluents, into Inland Surface Water according to
The Environment (Protection) Rules,1986 Schedule-VI , because the effluent from these STP’s
meet the river Ghaggar i.e the source of Inland Surface Water.
Also this study will help us to know that among ASP, MBBR and UASB which technology is
better for the treatment of sewage and producing effluent of good quality.

12
CHAPTER 2
REVIEW OF LITERATURE
2.1 Fluidized Bed Biofilm Reactor for wastewater treatment
Wen K. Shieh and John D. Keenan (1986) found that the fluidized bed biofilm reactor (FBBR)
represents a recent innovation in biofilm processes. Immobilization of microorganisms on the
small, fluidized particles of the medium results in a high reactor biomass holdup which enables the
process to be operated at significantly higher liquid throughputs with the practical absence of
biomass wash-out.
The process intensification (i.e., a reduction in process size while maintaining performance)
achieved in FBBRs makes this innovative technology particularly attractive in biological
wastewater treatment, commercial biomass conversion, and ethanol and biochemical production
applications. In this chapter, the present understanding of biofilm phenomena involved in the
operation of FBBRs is reviewed. Special emphasis is placed on the microbial and kinetic aspects of
FBBRs and practical design considerations and current applications are described.
2.2 Treatment of raw domestic sewage in an UASB reactor
R.A. Barbosa and G.L. Sant'Anna Jr (1989) carried out a study in which the treatment of raw
domestic sewage at ambient temperatures in an upflow anaerobic sludge blanket (UASB) reactor
with a volume of 120 l. and a height of 1.92 m was studied. The sewage had an average BOD5 of
357 mg l−1 and COD of 627 mg l−1. Approximately 75% of the organic materials were in the
suspended fraction.
The sewage temperature ranged from 18 to 28°C during the experimental period. The reactor
operated continuously for 9 months and assessed self-inoculation and raw domestic sewage
purification. The unit was started without inoculum and ran during the entire experimental period
with a hydraulic retention time of 4 h. During the experiment, a sludge bed build-up was observed.
At the end of the experimental period, the predominance of spherical granular particles up to 6–8

13
mm in diameter was evident. After a 4-month operation, it was observed that the
inoculation/acclimatization steps had been concluded. Removal efficiencies of BOD5 = 78%, COD
= 74% and TSS = 72% were obtained. A typical gas production factor of 80 l kg−1 COD added was
observed and the CH4 content of the biogas was 69%.
2.3 Technical review on the UASB process
Kwan‐Chow Lin et al. (1991) studied about a comprehensive review of the UASB wastewater
treatment process. Factors affecting granulation of the anaerobic sludge, start‐up of the process and
operation of UASB reactor are analyzed. Criteria about design and construction of the UASB
reactor are described, and studies on mathematical modeling of fluid flow pattern, sludge
distribution and biological conversion of substrate in the UASB reactor are reviewed. Finally,
applications of the process to the treatment of various types of wastewater are summarized.
2.4 Microbial attachment and growth in Fixed-Film Reactors: Process
startup considerations
A.P. Annachhatre and S.M.R. Bhamidimarri (1992) studied that Optimal steady-state performance
of any biofilm reactor requires a fully developed and mature biofilm. During fixed-film reactor
startup phase, biofilm is in process of development and accordingly, process performance is
difficult to quantify. Environmental, cellular and surface factors greatly influence the process of
biofilm formation during reactor startup.
Improved knowledge of nutritional, toxicological and environmental requirements of wastewater
degrading microorganisms has helped define optimal microbial growth conditions. In case of
anaerobic fixed film reactors the startup is hindered by low microbial growth rates, strict
environmental requirements and limited ability of methanogens to adhere and form fixed biofilms.
These obstacles could be overcome by proper support media selection and formulation of
appropriate inoculation procedures and startup strategies.

14
2.5 Small wastewater treatment plants — A challenge to wastewater
engineers
Markus Boller (1997) found that three conferences on “Small Wastewater Treatment Plants”
organized by the IAWQ Specialist Group demonstrate worldwide interest and activities in this
matter and the need to exchange experience concerning planning, design, construction, operation,
maintenance and control of small treatment plants. In near future, the number of small treatment
works will increase tremendously and will be accompanied by a strong demand for information on
appropriate procedures and technologies.
Pollution problems caused by small wastewater flows are usually restricted to small areas,
however, in view of the high per capita costs, treatment requirements and alternatives have to be
studied carefully. In comparison to larger plants, more pronounced and different boundary
conditions such as load fluctuations, operation and maintenance problems, per capita costs, and a
large variety of feasible treatment and disposal systems ask for experienced engineers with a broad
and sound knowledge in rural water quality management. The technical alternatives reaching from
mechanical and simple biological low rate systems such as ponds, sand filters and reed beds to
complex high rate suspended and fixed biomass reactors have to be evaluated regarding plant size,
operation safety, reliability, demand for skilled personnel, investment and operation costs.
In this respect, water engineers are increasingly challenged, not only to deal with a broad range of
present and future treatment technologies, but also to integrate economical and social aspects into
their evaluations.
2.6 A review: The anaerobic treatment of sewage in UASB and EGSB
Reactors
Lucas Seghezzo et al. (1998) conducted the study and observed that anaerobic treatment process is
increasingly recognized as the core method of an advanced technology for environmental
protection and resource preservation and it represents, combined with other proper methods, a
sustainable and appropriate wastewater treatment system for developing countries.

15
Anaerobic treatment of sewage is increasingly attracting the attention of sanitary engineers and
decision makers. It is being used successfully in tropical countries, and there are some encouraging
results from subtropical and temperate regions.
In this review paper, the main characteristics of anaerobic sewage treatment are summarized, with
special emphasis on the upflow anaerobic sludge blanket (UASB) reactor. The application of the
UASB process to the direct treatment of sewage is reviewed, with examples from Europe, Asia and
the Americas. The UASB reactor appears today as a robust technology and is by far the most
widely used high-rate anaerobic process for sewage treatment.
2.7 The innovative Moving Bed Biofilm Reactor/ solids contact
reaeration process for secondary treatment of municipal wastewater
Bjorn Rusten et al. (1998) carried out an study on the innovative moving bed biofilm reactor/solids
con tact reaeration (MBBR/SCR) process has been chosen for a new waste water treatment plant
serving a population of 200 000 at Moa Point, Wellington, New Zealand. Because the MBBR/SCR
combination was new, a pilot-scale demonstration project was made part of the contract.
Thorough pilot tests using a wide range of organic loads under both steady and transient-flow
conditions demonstrated that the MBBR/SCR process produced the required effluent quality at
loads higher than used in the original design. At 3 days mean cell residence time (MCRT) in the
SCR stage, a final effluent with a 5-day biochemical oxygen demand (BOD5) of less than 10 mg/L
was achieved at an organic load on the MBBR of 15 g BOD5/ m2-d (5.0 kg BOD5/m3-d). With
the same MCRT, a final effluent of less than 15 mg BOD5/L was achieved at an organic load on
the MBBR of 20 g BOD5/m2 d (6.7 kg BOD5/m3 d).
Dynamic loading tests demon started that a good-quality effluent was produced with a diurnal
peak hour load on the MBBR of more than 40 g BOD5/m2 d (13.3 kg BOD5/ m3-d). The
MBBR/SCR process was more compact and significantly cheaper than a conventional trickling
filter/solids contact or activated-sludge process at the Moa Point site. Water Environ. Res., 70,
1083 (activated-sludge process at the Moa Point site. Water Environ. Res., 70, 1083 (1998).

16
2.8 Biological Fixed Film Systems
Mark W. Fitch et al. (1999) carried out a study in which the work reviewed here was published
during the catalogue/issue year 1999 and described research involving biofilms treating pollutants.
This review explicitly excludes research in medical biofilms, dental biofilms, biofilms causing
corrosion and biofilm formation in drinking water treatment and distribution systems. Anaerobic
biofilm treatment system research is not reviewed here although a set of references is provided.
However, the authors have included coverage of denitrification in traditional biofilm treatment
systems. Similarly, biofilm systems for the treatment of air pollutants is reviewed in the Gaseous
Emissions from Wastewater Facilities section of this issue.
2.9 The Moving Bed Bio film Reactor
H. Odegaard et al. (1999) studied a new biofilm reactor for wastewater treatment: The Moving
Bed Bio Film Reactor (MBBR). The result from the investigations of different applications
(Carbonaceous removal, nitrification removal and nitrogen removal) when used for municipal
wastewater treatment, are discussed, Design value are given and it is demonstrated that use of this
reactor results in very compact treatment plants.
2.10 Performance evaluation of a UASB – activated sludge system
treating municipal wastewater
M. von Sperling*, V.H. Freire and C.A. de Lemos Chernicharo (2001): Recent research has
indicated the advantages of combining anaerobic and aerobic processes for the treatment of
municipal wastewater, especially for warm-climate countries. Although this configuration is seen
as an economical alternative, is has not been investigated in sufficient detail on a worldwide basis.
This work presents the results of the monitoring of a pilot-scale plant comprising of an UASB
reactor followed by an activated sludge system, treating actual municipal wastewater from a large
city in Brazil. The plant was intensively monitored and operated for 261 days, divided into five
different phases, working with constant and variable inflows.

17
The plant showed good COD removal, with efficiencies ranging from 69% to 84% for the UASB
reactor, from 43% to 56% for the activated sludge system only and from 85% to 93% for the
overall system. The final effluent suspended solids concentration was very low, with averages
ranging from 13 to 18 mg/l in the typical phases of the research.
Based on the very good overall performance of the system, it is believed that it is a better
alternative for warm-climate countries than the conventional activated sludge system, especially
considering the total low hydraulic detention time (4.0 h UASB; 2.8 h aerobic reactor; 1.1 h final
clarifier), the savings in energy consumption, the absence of primary sludge and the possibility of
thickening and digesting the aerobic excess sludge in the UASB reactor itself.
2.11 Removal of slowly biodegradable COD in combined Thermophilic
UASB and MBBR System
M.Ji et al (2001) studied that Starch, cellulose and polyvinyl alcohol (PVA) are common substrates
of the slowly biodegradable COD (SBCOD) in industrial wastewaters. Removal of the individual
and mixed SBCOD substrates was investigated in a combined system of thermophilic upflow
anaerobic sludge blanket (TUASB) reactor (55°C) and aerobic moving bed biofilm reactor
(MBBR).
The removal mechanisms of the three SBCOD substrates were quite different. Starch-COD was
almost equally utilized and removed in the two reactors. Cellulose-COD was completely (97-98%)
removed from water in the TUASB reactor by microbial entrapment and sedimentation of the
cellulose fibers. PVA alone was hardly biodegraded and removed by the combined reactors.
However, PVA-COD could be removed to some extent in a binary solution of starch (77%) plus
PVA (23%).
The PVA macromolecules in the binary solution actually affected the microbial activity in the
TUASB reactor resulting accumulation of volatile fatty acids, which shifted the overall COD
removal from the TUASB to the MBBR reactor where SBCOD including PVA-COD was
removed. Since the three SBCOD substrates were removed by different mechanisms, the combined
reactors showed a better and more stable performance than individual reactors.

18
2.12 Anaerobic sewage treatment in a one-stage UASB reactor and a
combined UASB-Digester system
In an another study made by Nidal Mahmoud et al (2004) the treatment of sewage at 15°C was
investigated in a one-stage upflow anaerobic sludge blanket (UASB) reactor and a UASB-Digester
system. The latter consists of a UASB reactor complemented with a digester for mutual sewage
treatment and sludge stabilisation. The UASB reactor was operated at a hydraulic retention time of
6 h and a controlled temperature of 15°C, the average sewage temperature during wintertime of
some Middle East countries. The digester was operated at 35°C.
The UASB-Digester system provided significantly (significance level 5%) higher COD removal
efficiencies than the one-stage UASB reactor. The achieved removal efficiencies in the UASB-
Digester system and the one-stage UASB reactor for total, suspended, colloidal and dissolved
COD were 66%, 87%, 44% and 30%, and 44%, 73%, 3% and 5% for both systems, respectively.
The stability values of the wasted sludge from the one-stage UASB reactor and the UASB-Digester
system were, respectively, 0.47 and 0.36 g CH4-COD/g COD. Therefore, the anaerobic sewage
treatment at low temperature in a UASB-Digester system is promising.
2.13 Developments in wastewater treatment methods
Amit Sonune and Rupali Ghate (2004) studied that Wastewaters are waterborne solids and liquids
discharged into sewers that represent the wastes of community life. Wastewater includes dissolved
and suspended organic solids, which are “putrescible” or biologically decomposable. Two general
categories of wastewaters, not entirely separable, are recognized: domestic and industrial.
Wastewater treatment is a process in which the solids in wastewater are partially removed and
partially changed by decomposition from highly complex, putrescible, organic solids to mineral or
relatively stable organic solids. Primary and secondary treatment removes the majority of BOD
and suspended solids found in wastewaters. However, in an increasing number of cases this level
of treatment has proved to be insufficient to protect the receiving waters or to provide reusable
water for industrial and/or domestic recycling.

19
Thus, additional treatment steps have been added to wastewater treatment plants to provide for
further organic and solids removals or to provide for removal of nutrients and/or toxic materials.
There have been several new developments in the water treatment field in the last years.
Alternatives have presented themselves for classical and conventional water treatment systems.
Advanced wastewater treatments have become an area of global focus as individuals, communities,
industries and nations strive for ways to keep essential resources available and suitable for use.
Advanced wastewater treatment technology, coupled with wastewater reduction and water
recycling initiatives, offer hope of slowing, and perhaps halting, the inevitable loss of usable water.
Membrane technologies are well suited to the recycling and reuse of waste water. Membranes can
selectively separate components over a wide range of particle sizes and molecular weights.
Membrane technology has become a dignified separation technology over the past decennia.
The main force of membrane technology is the fact that it works without the addition of
chemicals, with relatively low energy use and easy and well-arranged process conduction. This
paper covers all advanced methods of wastewater treatments and reuse.
2.14 Potential of a Combination of UASB and DHS Reactor as a Novel
Sewage Treatment System for Developing Countries: Long-Term
Evaluation
In a study made by Madan Tandukar et al. (2006) A novel municipal wastewater treatment
system, consisting of a combination of an upflow anaerobic sludge blanket (UASB) and down-
flow hanging sponge (DHS) post treatment unit, was continuously evaluated for more than three
years with raw sewage as an influent. The system was installed at a sewage treatment site and
operated at 25±3°C.
This paper reports on the results of a long term monitoring of the system. The whole experimental
period was divided into three distinct phases with different operating conditions. Organic
pollutants were only partially removed in anaerobic UASB pretreatment unit. The remaining
organics as well as nitrogenous compounds were almost completely removed by the DHS post
treatment unit.

20
In all phases the system demonstrated removal efficiency consistently over 95% for unfiltered
biochemical oxygen demand (BOD), 80% for unfiltered-chemical oxygen demand and 70% for
suspended solids. The system produced an excellent effluent quality with only 4–9 mg∕L of
residual unfiltered BOD.
Dissolved oxygen in the final effluent was 5–7 mg∕L although no aeration was provided to DHS
system. Moreover, excess sludge production from DHS was negligible thus eliminating secondary
sludge that is troublesome to dispose off.
The system also exhibited substantial stability against twofold hydraulic shock load and fourfold
organic shock load. The results suggested that the proposed system may be a competitive solution
for municipal sewage treatment under variable conditions.
2.15 Treatment of pesticide wastewater by Moving-Bed Biofilm Reactor
combined with Fenton-coagulation pretreatment
Sheng et al.(2006), South Korea conducted the study In order to treat pesticide wastewater having
high chemical oxygen demand (COD) value and poor biodegradability, Fenton-coagulation
process was first used to reduce COD and improve biodegradability and then was followed by
biological treatment. Optimal experimental conditions for the Fenton process were determined to
be Fe2+ concentration of 40 mol/L and H2O 2 dose of 97 mol/L at initial pH 3.
The interaction mechanism of organophosphorous pesticide and hydroxyl radicals was suggested
to be the breakage of the P S double bond and formation of sulfate ions and various organic
intermediates, followed by formation of phosphate and consequent oxidation of intermediates. For
the subsequent biological treatment, 3.2 g/L Ca(OH)2 was added to adjust the pH and further
coagulate the pollutants.
The COD value could be evidently decreased from 33,700 to 9300 mg/L and the ratio of
biological oxygen demand (BOD5) to COD of the wastewater was enhanced to over 0.47 by
Fenton oxidation and coagulation. The pre-treated wastewater was then subjected to biological

21
oxidation by using moving-bed biofilm reactor (MBBR) inside which tube chip type bio-carriers
were fluidized upon air bubbling.
Higher than 85% of COD removal efficiency could be achieved when the bio-carrier volume
fraction was kept more than 20% by feeding the pretreated wastewater containing 3000 mg/L of
inlet COD at one day of hydraulic retention time (HRT), but a noticeable decrease in the COD
removal efficiency when the carrier volume was decreased down to 10%, only 72% was observed.
With the improvement of biodegradability by using Fenton pretreatment, also due to the high
concentration of biomass and high biofilm activity using the fluidizing bio-carriers, high removal
efficiency and stable operation could be achieved in the biological process even at a high COD
loading of 37.5 gCOD/(m2 carrier day).
2.16 Combined Anaerobic/Aerobic secondary municipal wastewater
treatment: Pilot-Plant demonstration of the UASB/Aerobic Solid
Contact System
Enrique J. La Motta et al. (2007) done a study in which Anaerobic pretreatment followed by
aerobic post treatment of municipal wastewater is being used more frequently. Recent
investigations in this field using an anaerobic fluidized bed reactor/aerobic solids contact
combination demonstrated the technical feasibility of this process. The investigation presented
herein describes the use of a combined upflow anaerobic sludge bed (UASB)/aerobic solids
contact system for the treatment of municipal wastewater and attempts to demonstrate the technical
feasibility of using the UASB process as both a pretreatment unit and a waste activated sludge
digestion system.
The results indicate that the UASB reactor has a total chemical oxygen demand removal efficiency
of 34%, and a total suspended solids removal efficiency of about 36%. Of the solids removed by
the unit, 33% were degraded by the action of microorganisms, and 4.6% accumulated in the
reactor. This low solids accumulation rate allowed operating the UASB reactor for three months
without sludge wasting.

22
The long solids retention time in this unit is comparable to the one normally used in conventional
sludge digestion units, thus allowing the stabilization of the waste activated sludge returned to the
UASB reactor.
Particle flocculation was very poor in the UASB reactor, and therefore, it required post aeration
periods of at least 100 min to proceed successfully in the aerobic unit. Polymer generation, which
is necessary for efficient biological flocculation, was practically nonexistent in the anaerobic unit;
therefore, it was necessary to maintain dissolved oxygen levels greater than 1.5 mg∕L in the aerobic
solids contact chamber for polymer generation to proceed at optimum levels. Once these
conditions were attained, the quality of the settled solids contact chamber effluent always met the
30 mg BOD/L, 30 mg SS/L secondary effluent guidelines.
2.17 Performance comparison of a pilot-scale UASB and DHS system and
activated sludge process for the treatment of municipal wastewater
Madan Tandukar et al. (2007), Japan made an study which compares the performance of a pilot-
scale combination of UASB and DHS system to that of activated sludge process (ASP) for the
treatment of municipal sewage. Both systems were operated in parallel with the same sewage as
influent. The study was conducted for more than 300 days, which revealed that organic removal
efficiency of UASB + DHS system was comparable to that of ASP. Unfiltered BOD removal by
both systems was more than 90%. However, UASB + DHS system outperformed ASP for
pathogen removal. In addition, volume of excess sludge production from UASB +DHS was 15
times smaller than that from ASP. Moreover, unlike ASP, there is no requirement of aeration for
the operation of UASB + DHS system, which makes it an economical treatment system.
Considering the above observations, it was concluded that UASB + DHS system can be a cost-
effective and viable option for the treatment of municipal sewage over ASP,
especially for low-income countries.

23
2.18 Efficiency evaluation of sewage treatment plant with different
technologies in Delhi (India)
Priyanka Jamwal and Atul k.Mittal (2008) carried out an study on Physical, chemical and
microbiological efficiencies of Sewage Treatment Plants (STPs) located in Delhi’s watershed in
context of different treatment technologies employed in these plants have been determined. There
were in all seventeen STPs treating domestic wastewater which were studied over a period of 12
months. These STPs were based on Conventional Activated sludge process (ASP), Extended
aeration (Ex. Aeration), physical, chemical and biological removal treatment (BIOFORE) and
oxidation pond treatment process.
Results suggests that except “Mehrauli” STP which was based on Extended aeration process and
“Oxidation pond”, effluents from all other STPs exceeded FC standard of 103 MPN/100 ml for
unrestricted irrigation criteria set by National river conservation directorate (NRCD). Actual
integrated efficiency (IEa) of each STP was evaluated and compared with the standard integrated
efficiency (IEs) based upon physical, biological and microbiological removal efficiencies
depending upon influent sewage characteristics. The best results were obtained for STPs
employing extended aeration, BIOFORE and oxidation pond treatment process thus can be safely
used for Irrigation purposes.
2.18 Treatment of domestic wastewater in an Up-Flow Anaerobic Sludge
Blanket reactor followed by Moving Bed Bio film Reactor
A.Tawfik et al. (2009), The Netherlands made an study to evaluate the performance of a
laboratory-scale sewage treatment system composed of an up-flow anaerobic sludge blanket
(UASB) reactor and a moving bed biofilm reactor(MBBR) at a temperature of (22–35 °C) . The
entire treatment system was operated at different hydraulic retention times (HRT’s) of 13.3, 10 and
5.0 h.

24
An overall reduction of 80–86% for COD total; 51–73% for COD colloidal and 20–55% for COD
soluble was found at a total HRT of 5–10 h, respectively. By prolonging the HRT to 13.3 h, the
removal efficiencies of COD total, COD colloidal and COD soluble increased up to 92, 89 and
80%, respectively.
However, the removal efficiency of COD suspended in the combined system remained unaffected
when increasing the total HRT from 5 to 10 h and from 10 to 13.3 h. This indicates that, the
removal of COD suspended was independent on the imposed HRT. Ammonia-nitrogen removal in
MBBR treating UASB reactor effluent was significantly influenced by organic loading rate (OLR).
62% of ammonia was eliminated at OLR of 4.6 g COD m-2 day-1.
The removal efficiency was decreased by a value of 34 and 43% at a higher OLR’s of 7.4 and 17.8
g COD m-2 day-1, respectively. The mean overall residual counts of faecal coliform in the final
effluent were 8.9 9 104 MPN per 100 ml at a HRT of 13.3 h, 4.9 9 105 MPN per 100 ml at a HRT
of 10 h and 9.4 9 105 MPN per 100 ml at a HRT of 5.0 h, corresponding to overall log10 reduction
of 2.3, 1.4 and 0.7, respectively.
The discharged sludge from UASB–MBBR exerts an excellent settling property. Moreover, the
mean value of the net sludge yield was only 6% in UASB reactor and 7% in the MBBR of the total
influent COD at a total HRT of 13.3 h. Accordingly, the use of the combined UASB–MBBR
system for sewage treatment is recommended at a total HRT of 13.3 h.
2.20 Assessment of the efficiency of Sewerage Treatment Plants
In another study made by Ravi Kumar et al. (2010), Bangalore, Bangalore city hosts two Urban
Wastewater Treatment Plants (UWTPs) towards the periphery of Vrishabhavathi valley, located in
Nellakedaranahalli village of Nagasandra and Mailasandra Village, Karnataka, India. These plants
are designed and constructed with an aim to manage wastewater so as to minimize and/or remove
organic matter, solids, nutrients, disease-causing organisms and other pollutants, before it reenters
a water body.

25
It was revealed from the performance study that efficiency of the two treatment plants was poor
with respect to removal of total dissolved solids in contrast to the removal/reduction in other
parameters like total suspended solids, BOD and COD.
In Mailasandra STP, TDS, TSS, BOD, and COD removal efficiency was 20.01, 94.51, 94.98 and
76.26 % and respectively, while in Nagasandra STP, TDS, TSS, BOD, and COD removal
efficiency was 28.45, 99.0, 97.6 and 91.60 % respectively.
The order of reduction efficiency was
TDS < COD < TSS < BOD and TDS < COD < BOD < TSS respectively in Mailasandra and
Nagasandra STPs. Additionally, the problems associated with the operation and maintenance of
wastewater treatment plants is discussed.
2.21 Biofilms in Water and Wastewater treatment
Rakmi Abd.Rahman et.al (2010) studied that Biofilm reactors are increasingly used to treat
industrial effluents with difficult components, this type of process has been applied to wastewaters
containing various types of pollutants, such as those containing chlorinated organics. These have
not been effectively removed by conventional activated sludge types of processes due to their
recalcitrance. Biofilm reactors have biomass active even at very low concentrations of the target organics,
rendering the reactor more efficient for removing trace toxic compounds in wastewaters.
Biofilm processes, having high biomass concentrations, have also been found to be less sensitive
to the presence of toxic and inhibitory materials, and more resistant to shock loadings than the
dispersed growth systems. Such characteristics are essential where floor space is becoming
expensive and yet there is great need to treat and polish effluents before reuse.
With increasing pollution of rivers by trace industrial and household chemicals and
pharmaceuticals, and greater demands for water, the difference between effluent polishing and
water treatment is diminishing. With increasing knowledge of health effects of trace pollutants, a
more effective yet affordable water treatment system than the conventional system has to be
investigated. The conventional water treatment system of coagulation, settling and filtration,

26
removes mainly suspended solids; trace and recalcitrant organics would pass through the system.
Greater use of groundwater and stricter drinking water limits, such as the new EU Drinking Water
Directive (EU DWD), has established the use of biofilm processes in water treatment, such as in
northern Italy.
Results of on-going research on use of biofilm processes for water and wastewater treatment are
reported here. These are uses of biofilm columns for river water treatment and rainwater polishing,
and use of biofilm columns for removal of chloroorganics and heavy metals. In all these studies the
biofilm columns have been found very effective for treatment of river waters for removal of
organics and nutrients, and treatment of wastewaters, for removal of chloroorganics and heavy
metals.
Metabolite analysis indicated biodegradation of PCP reductive dechlorination had occurred in the
reactor, showing that biofilms offered both oxidative and reductive conditions. Besides these
special characteristics, no chemicals were employed in both water and wastewater biofilm
treatments. Thus no chemical sludge was generated, besides lowering treatment costs due to
chemicals. Biofilm processes as used here have potential to be further developed into cheaper,
environmentally friendlier processes for treating water and wastewaters containing organics and
heavy metals.
2.22 Comparison of overall performance between "Moving-Bed" and
"Conventional" Sequencing Batch Reactor
E. Hosseini Koupaie et al. (2011) carried out a studied in which the main objective of the work was
to compare the overall performances of "moving-bed" and "conventional" sequencing batch
reactor. For this purpose, different experimental parameters including COD and dye concentration,
turbidity, MLSS concentration, MLVSS/MLSS ratio, sludge volume index (SVI) and Oxidation-
Reduction Potential (ORP) were calculated.

27
One conventional sequencing batch reactor and three moving-bed sequencing batch reactors (MB-
SBR) were operated in this study. Each MB-SBR was equipped with a type of moving biofilm
carrier.
The results of dye, COD and turbidity analysis showed that there were no significant differences
between the moving-bed and conventional sequencing batch reactors in the matters of effluent
quality. A higher fluctuation of MLSS concentration and also higher SVI were observed in
moving-bed compared to that of the conventional sequencing batch reactor. Higher ORP values
which mean higher oxidation potential were measured in the reactors equipped with the moving
carriers in comparison with those measured in the conventional sequencing batch reactor.
2.23 Integrated application of Upflow Anaerobic Sludge Blanket Reactor
for the treatment of wastewaters
Muhammad Asif Latif et al (2011) observed that, the UASB process among other treatment
methods has been recognized as a core method of an advanced technology for environmental
protection. This paper highlights the treatment of seven types of wastewaters i.e. palm oil mill
effluent (POME), distillery wastewater, slaughterhouse wastewater, piggery wastewater, dairy
wastewater, fishery wastewater and municipal wastewater (black and gray) by UASB process. The
purpose of this study is to explore the pollution load of these wastewaters and their treatment
potential use in upflow anaerobic sludge blanket process.
The general characterization of wastewater, treatment in UASB reactor with operational
parameters and reactor performance in terms of COD removal and biogas production are
thoroughly discussed in the paper. The concrete data illustrates the reactor configuration, thus
giving maximum awareness about upflow anaerobic sludge blanket reactor for further research.
The future aspects for research needs are also outlined.

28
2.24 Sustainable options of post treatment of UASB effluent treating sewage:
A review
Abid Ali Khan et al. (2011) studied that upflow anaerobic sludge blanket (UASB) process is
reported to be a sustainable technology for domestic wastewaters treatment in developing countries
and for small communities. However, the inability of UASB process to meet the desired disposal
standards has given enough impetus for subsequent post treatment. In order to upgrade the UASB
based sewage treatment plants (STPs) to achieve desired effluent quality for disposal or for reuse,
various technological options are available and broadly differentiated as primary post-treatment for
the removal of organic and inorganic compounds and suspended matter; secondary post-treatment
for the removal of hardly degradable soluble matter, colloidal and nutrients; and polishing systems
for removals of pathogens.
Hence, this paper discusses the different systems for the treatment of UASB reactor effluent
treating sewage. Additionally, a comparative review, an economic evaluation of some of the
emerging options was conducted and based on the extensive review of different integrated
combination, i.e. UASB-different aerobic systems, a treatment concept based on natural biological
mineralization route recognized as an advanced technology to meet all practical aspects to make it
a sustainable for environmental protection, resource preservation and recovering maximum
resources.
2.25 Upgrading Activated Sludge Systems and reduction in excess sludge
Hossein Hazrati and Jalal Shayegan (2011) studied on activated sludge systems they found that
Most of 200 Activated Sludge Plant in Iran are overloaded and as a result, their efficiency is low.
In this work, a pilot plant is manufactured and put into operation in one of the wastewater
treatment plants in the west of Tehran.
Instead of conventional activated sludge, a membrane bioreactor and an upflow anaerobic sludge
blanket reactor used as a pretreatment unit in this pilot. For the sake of data accuracy and
precision, an enriched municipal wastewater was opted as an influent to the pilot. Based on the
attained result, the optimum retention time in this system was 4 h, and the overall COD removal
efficiency was 98%.

29
As a whole, the application of this retrofit would increase the plant’s capacity by a factor of 5 and
reducing the excess sludge by a factor of 10. The sludge volume index in the anaerobic reactor was
about 12 after granulation occurred.
2.26 Improvements in Biofilm Processes for Wastewater Treatment
Husham T. Ibrahim et al. (2012) made an effort in this review paper which intends to provide an
overall vision of biofilm technology as an alternative method for treating waste waters. This
technology has been gaining popularity through the years, mainly because many wastewater
treatment plants, which are still used Activated Sludge Process (AS) are present some
shortcomings when exposed to increased hydraulic and organic loads.
Fundamental research into biofilms is presented in three sections, Biofilm Types and
Characterization, Advantages and Drawbacks and Design Parameters. The reactor types covered in
this review are: un-submerged fixed film systems (trickling filters and rotating biological
contactors) and submerged fixed film systems (biological aerated flooded filters, submerged
aerated filters, biofilm up-flow sludge blanket, fluidized bed, expanded granular sludge blanket,
biofilm airlift suspension, internal circulation, moving bed biofilm and membrane biofilm)
reactors.
2.27 Performance evaluation of Moving Bed Bio-Film Reactor technology
for treatment of domestic waste water in Industrial Area at MEPZ
(Madras Exports Processing Zone), Tambaram, Chennai, India
Ravichandran.M and Joshua Amarnath.D (2012) carried out a study on MEPZ, an industrial unit
installed at Tambaram, Chennai, developed by the Ministry of Commerce and Industries,
Government of India is discharging domestic waste water generated by the workers and treated in
the 1.0MLD capacity Sewage Treatment Plant with Moving Bed Bio-film Reactor.

30
In this study, the performance of MBBR technology in removal of Biological Oxygen Demand
and suspended Solids have been evaluated by testing the raw sewage and treated effluent at various
situations like normal weather condition, heavy organic shock loading, dilution with storm water,
when artificial aeration is disturbed due to power failure.
The test results showed that the removal efficiency of BOD5 and SS from the domestic waste
water in normal weather condition in more than 98%, the efficiency of MBBR has not been
affected due to heavy Organic shock loading and the efficiency is about 90% in the disturbance of
artificial aeration.
The efficiency has been brought to this level by improving the surface area per unit volume of the
carrier element as designed by the M/s Anox Kaldnes, a Norway company. It is suggested that the
Moving Bed Bio-film Reactor technology could be used an ideal and efficient option for the
treatment of domestic waste water, when the available area is minimum.
2.28 The performance enhancements of Upflow Anaerobic Sludge Blanket
(UASB) reactors for domestic sludge treatment – A State of the art review
Siewhui Chong et al. (2012) made a study in which he found that Nowadays, carbon emission and
therefore carbon footprint of water utilities is an important issue. In this respect, we should
consider the opportunities to reduce carbon footprint for small and large wastewater treatment
plants.
The use of anaerobic rather than aerobic treatment processes would achieve this aim because no
aeration is required and the generation of methane can be used within the plant. High-rate
anaerobic digesters receive great interests due to their high loading capacity and low sludge
production. Among them, the upflow anaerobic sludge blanket (UASB) reactors have been most
widely used.

31
However, there are still unresolved issues inhibiting the widespread of this technology in
developing countries or countries with climate temperature fluctuations (such as subtropical
regions). A large number of studies have been carried out in order to enhance the performance of
UASB reactors but there is a lack of updated documentation.
2.29 Wastewater Treatment in Baghdad City Using Moving Bed
Biofilm Reactor (MBBR) technology
Mohammed A. Abdul-Majeed et al. (2012) conducted a study in which, a laboratory scale system
of Moving Bed Biofilm Reactor (MBBR) was used to treat municipal wastewater from a domestic
community in Baghdad City to get the water free from BOD for reuse in the irrigation or discharge
to the river.
The aim of the described experimentation was the comparison of a low cost MBBR and an
activated sludge system (AS); the other aim from this research is to derive successful MBBR
wastewater reuse projects in Iraq. Laboratory experiments were conducted in two parts, firstly at
BOD5 load of about (150-200) mg/l, filling ratio of plastic elements in the MBBR reactor was
40%. Aerobic reactor consumed most of the biodegradable organic matter.
The BOD5 removal efficiencies were 78 and 90% for MBBR & AS respectively. Second part when
BOD5 load about (900-1300) mg/l used (synthetic wastewater)، filling ratio is 67%. The removal
efficiencies of BOD reached 73 % for AS and about 88% for MBBR.
2.30 A review of the Upflow Anaerobic Sludge Blanket Reactor
Chidozie Charles Nnaji (2013) conducted a study in which the upflow anaerobic sludge blanket
(UASB) reactor has found wide acceptance in the treatment of industrial wastewaters since its
development in the Netherlands.

32
It has been applied to a wide spectrum of wastewaters on both domestic and industrial scales.This
acceptance stems from its simplicity, economy and the possibility of energy recovery. Studies
focusing on UASB reactors are numerous; and though conflicting results have been observed,
researchers are unanimous when it comes to the efficiency of the reactor in the treatment of high-
to medium-strength wastewaters with easily hydrolysable substrate.
It has also recorded a level of success in sewage treatment in tropical countries. As much, success
has not been recorded in cold climates and in the treatment of wastewaters containing complex or
toxic substance. The efforts of numerous researchers have given rise to many variants and
modifications of the UASB reactor, which have widened the scope of applicability of this very
important facility.
This paper presents a concise but comprehensive review of the UASB reactor and studies focusing
on it. Key operational issues such as granulation, methanogenesis, hydraulic retention time,
efficiency, toxicity, modifications of UASB reactors and biogas recovery were considered using
facts and data sieved from literature. This review shows that UASB reactors can be adapted for the
treatment of almost any type of wastewater if modified accordingly.

33
CHAPTER 3
MATERIALS AND METHODOLOGY
3.1 Selection of Sites and Sampling Points
Samples for analysis were collected from the three STP’s mentioned above namely:
1. Raipur Kalan STP
2. Raipur Khurd STP
3. “Diggian” Mohali STP
The major area from which samples were collected i.e the sampling points were:
1. Inlet and Final Outlet of Raipur Kalan STP
2. Inlet and Final Outlet of Raipur Khurd STP
3. Inlet and Final Outlet of “Diggian” Mohali STP
3.2 Collection of Samples
Grab Samples were collected as per APHA- Standard Methods for Examination of Water and
Wastewater. Samples were collected 3 times, one each, in month of FEBRUARY, MARCH and
APRIL during the duration of study.
3.3 Parameters Analyzed
1. Physico-chemical parameters
The parameters analyzed in this study were pH, Temp (Temperature), TSS (Total Suspended
Solids), TDS (Total Dissolved Solids), Oil and Grease, chlorides and Chemical Oxygen Demand
(COD).
2. Biological parameters
The biological parameters analyzed in present study included Biochemical Oxygen Demand
(BOD).

34
3. Nutrient Load
The Nutrients analysed in this study were Nitrate-Nitrogen (NO3 –N), Ammonical Nitrogen (NH3 –
N) and Phosphate (PO4-)
Table 3.1: Parameters and Methods for their Analysis
PARAMETER TEST METHOD
pH Electrometric
Temperature Digital Thermometer
Oil and Grease Soxhlet Extraction
Total Suspended Solids Membrane Filtration
Total Dissolved Solids Gravimetric
Biochemical Oxygen demand Winkler’s Titration
Chemical Oxygen Demand Closed Reflux Titrimetry
Chlorides Argentometric Titration
Nitrate – Nitrogen Acid Treatment followed by Spectrophotometry
Ammonical – Nitrogen Distillation Titrimetric
Phosphate Ascorbic Acid Spectrophotometry

35
Laboratories used for Parameters Analysis
1. STP “Diggian” Mohali Laboratory
2. Environ Tech Laboratories , Industrial Area, Phase -7, S.A.S. Nagar (Mohali
Punjab)
3. 39 - Water Works Laboratory, Sector – 39, Chandigarh
3.4 Methods for Parameters Analysis
pH
Method: Electrometric method was adopted for the determination.
Procedure
Standardize the pH meter by immersing the electrode in a buffer solution of known pH,
normally 4 and 9.
Read the pH and calibrate, till it indicates the correct value for pH of buffer solution. Rinse
the electrode in distilled water and immerse them in sample.
Read the pH value.
Fig 3.1: pH Apparatus
36
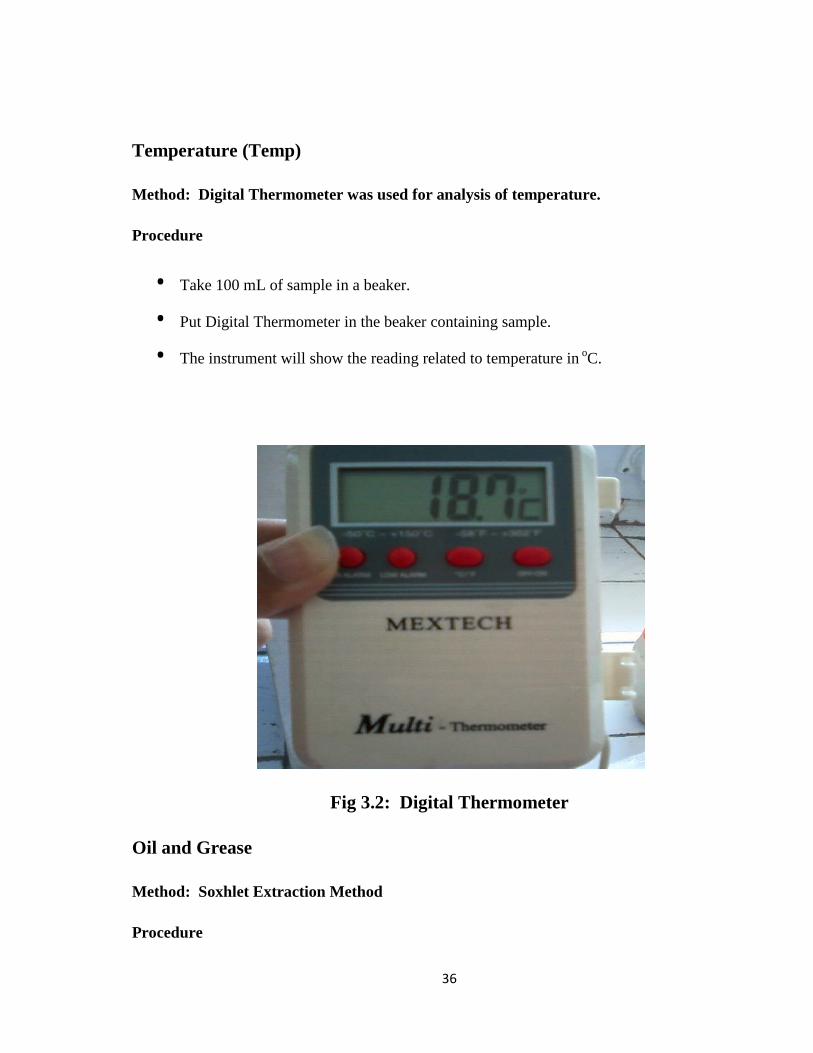
Temperature (Temp)
Method: Digital Thermometer was used for analysis of temperature.
Procedure
Take 100 mL of sample in a beaker.
Put Digital Thermometer in the beaker containing sample.
The instrument will show the reading related to temperature in oC.
Fig 3.2: Digital Thermometer
Oil and Grease
Method: Soxhlet Extraction Method
Procedure

37
Prepare filter consisting of a Muslin cloth disc overlaid with filter paper. Wet the cloth and
paper.
Pass 100 mL of filter aid suspension through the prepared filter using vacuum and wash
with 1 litre of distilled water. Filter the acidified sample.
Apply vacuum until no more liquid sample passes through filter paper.
Using forceps transfer the filter paper to a watch glass. Add material adhering to edges of
muslin cloth disc.
Wipe sides and bottom of collection vessel and Buchner funnel with filter paper soaked in
solvent, taking care to remove all films caused by grease and to collect all the solids
material.
Add pieces of filter paper on watch glass. Roll all filter papers containing sample and put
into an extraction thimble.
Add any piece of material remaining on watch glass. Wipe the watch glass with filter paper
soaked in solvent and place it in the thimble.
Dry the thimble at 1030C for 30 minutes in an oven. Fill the thimble with glass whool or
small glass beads.
Weigh the extraction flask and extract oil and grease in Soxhlet Apparatus, using hexane at
a rate of 20 cycles per hour for 4 hours counting first cycle.
Place the flask on a water bath at 700C for 15 minutes and draw air through it by vacuum
for final 1 minute
Cool, in desiccators for 30 minutes and weigh.
Calculation
Oil and Grease, mg/L = M x 1000
Where,
M = Mass, in mg, of the residue
V = Volume in ml of the sample taken for test
V

38
Fig 3.3: Soxhlet Apparatus
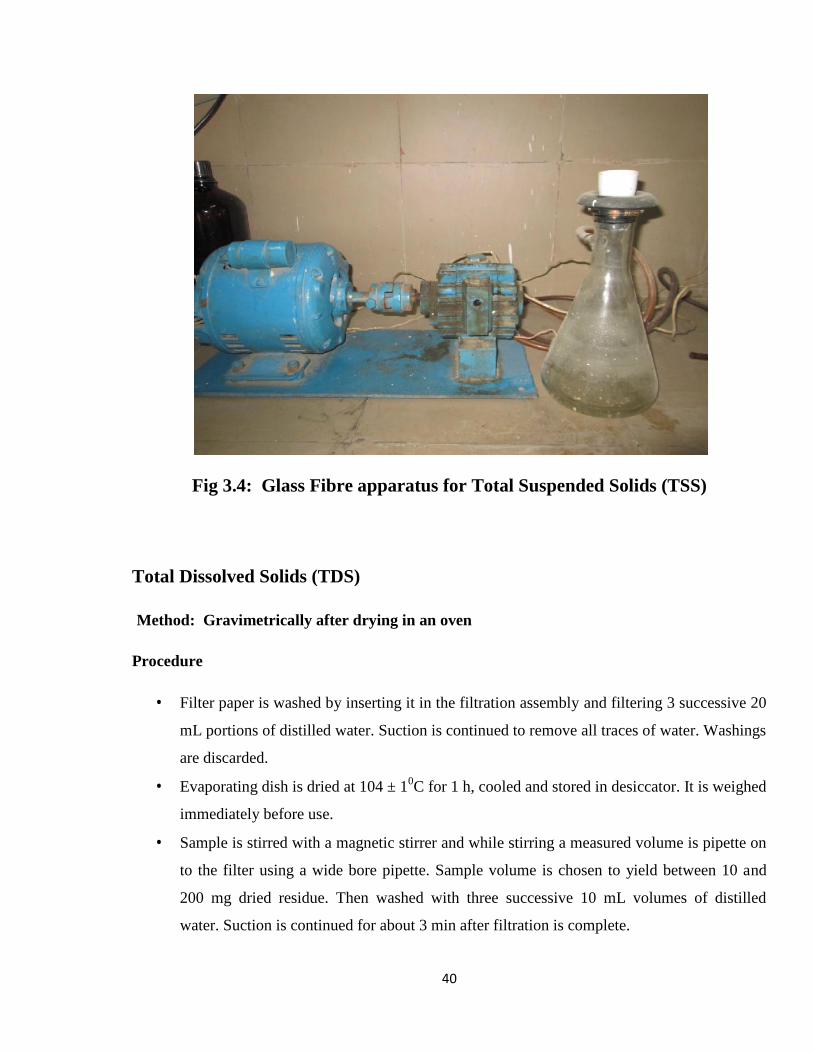
Total Suspended Solids (TSS)
Method: Membrane filtration Method
Procedure
Take 50 mL of sample in Gooch crucible.
Place the Gooch crucible on the glass fiber apparatus.
Switch on the electrical supply.

39
Liquid passes in the glass fiber.
Solids remains on the Asbestos layer.
Weigh the empty Gooch crucible before the experiment and after drying the crucible at
about 1030c in a oven to 15 mins.
Calculation
Total Suspended Solids =
(Weight of Gooch Crucible + Residue) - (Weight of empty Gooch Crucible )
Volume of sample Taken
Gooch Crucible
Χ 1000
40
Fig 3.4: Glass Fibre apparatus for Total Suspended Solids (TSS)
Total Dissolved Solids (TDS)
Method: Gravimetrically after drying in an oven
Procedure
Filter paper is washed by inserting it in the filtration assembly and filtering 3 successive 20
mL portions of distilled water. Suction is continued to remove all traces of water. Washings
are discarded.
Evaporating dish is dried at 104 ± 10C for 1 h, cooled and stored in desiccator. It is weighed
immediately before use.
Sample is stirred with a magnetic stirrer and while stirring a measured volume is pipette on
to the filter using a wide bore pipette. Sample volume is chosen to yield between 10 and
200 mg dried residue. Then washed with three successive 10 mL volumes of distilled
water. Suction is continued for about 3 min after filtration is complete.

41
Total filtrate is transferred with washings to a weighed evaporating dish and evaporated to
dryness in an oven at 104 ± 10C. If necessary successive portions are added to the same
dish after evaporation in order to yield between 10 and 200 mg dried residue. To prevent
splattering oven temperature may be lowered initially by 20C below boiling point and
raised to 104 0C after evaporation for 1h. Then cooled in a desiccator and weighed.
Calculation
Where:
A = Weight of dried residue + dish, mg
B = Weight of dish, mg.
Biochemical Oxygen Demand (BOD)
METHOD: Winkler’s Titration
Procedure
Prepare dilution water by adding 1mL each of phosphate buffer, Magnesium
sulphate solution, Calcium chloride and ferric chloride solution to 1 liter distilled
water.
Determine the exact capacity of three BOD bottles. Find out the D.O of undiluted sample
and designate as DOS.
Prepare the desired percent mixture by adding samples in dilution water.
Fill up one bottle with the mixture and the other one with dilution water blank.
Incubate at a fix temperature for 27C, 3 days.

42
Find out DO in both bottles after incubation and designate mixture as DOi, blank as DOb.
Calculation
BOD3, 27 C (mg/L) = [(DOB - DOi) D.F – (DOb- DOS)]
Where,
DOB = DO of blank solution (dilution water)
DOb = DO of incubated blank solution
DOi = DO of incubated diluted sample
DOS = DO of undiluted sample (sample)
D.F = dilution factor = Total vol. of sample + Blank
mL of Sample
Fig 3.5: BOD Incubator
43
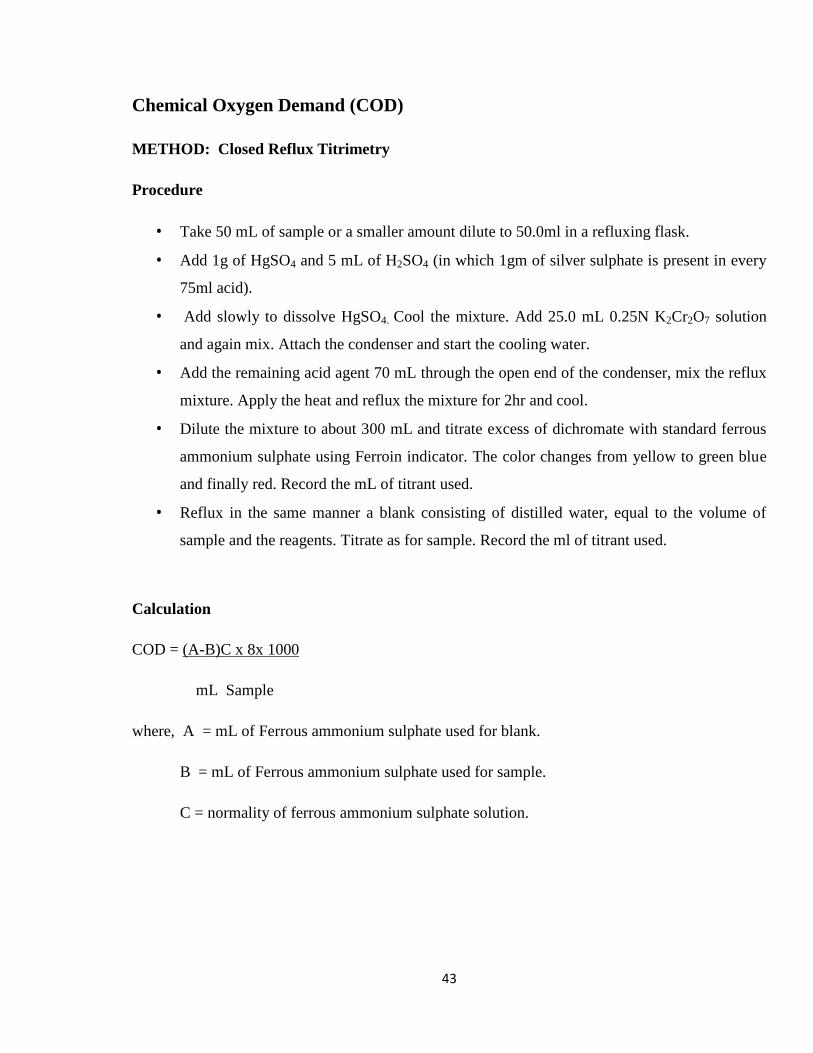
Chemical Oxygen Demand (COD)
METHOD: Closed Reflux Titrimetry
Procedure
Take 50 mL of sample or a smaller amount dilute to 50.0ml in a refluxing flask.
Add 1g of HgSO4 and 5 mL of H2SO4 (in which 1gm of silver sulphate is present in every
75ml acid).
Add slowly to dissolve HgSO4. Cool the mixture. Add 25.0 mL 0.25N K2Cr2O7 solution
and again mix. Attach the condenser and start the cooling water.
Add the remaining acid agent 70 mL through the open end of the condenser, mix the reflux
mixture. Apply the heat and reflux the mixture for 2hr and cool.
Dilute the mixture to about 300 mL and titrate excess of dichromate with standard ferrous
ammonium sulphate using Ferroin indicator. The color changes from yellow to green blue
and finally red. Record the mL of titrant used.
Reflux in the same manner a blank consisting of distilled water, equal to the volume of
sample and the reagents. Titrate as for sample. Record the ml of titrant used.
Calculation
COD = (A-B)C x 8x 1000
mL Sample
where, A = mL of Ferrous ammonium sulphate used for blank.
B = mL of Ferrous ammonium sulphate used for sample.
C = normality of ferrous ammonium sulphate solution.

44
Chloride (Cl -)
Method: Argentometric Titration
Procedure
Take 100 mL of sample in conical flask.
Add 1mL of Potassium chromate indicator. Sample colour turns Yellow.
Titrate with standard N/35.5 AgNO3 solution till the colour changes from yellow to brick
red. Note the amount of titrant used.
Calculation
Chlorides as Cl - = mL of AgNO3 used for sample x 1000
mL of sample
NITRATE – NITROGEN (NO3 –N)
Method: Acid Treatment followed by Spectrophotometry
Procedure
Treatment of sample: 1 mL HCl is added to 50 mL clear/filtered sample, mixed.
Preparation of standard curve: Calibration standards are prepared in the range of 0-7 mg
NO3--N/L, by diluting to 50 mL , 1 mL of HCl is added and mixed.

45
Spectrophotometric measurements: Absorbance or transmittance is read against re-distilled
water set at zero absorbance or 100 % transmittance. A wavelength of 220 nm is used to
obtain NO3- reading and a wavelength of 275nm to determine interference due to dissolved
organic matter.
Calculation
For sample and standards, 2 times the absorbance reading at 275nm is subtracted, from the
reading at 220nm to obtain absorbance due to NO3-. A standard curve is prepared by
plotting absorbance due to NO3- against NO3
--N concentration of standards. Sample
concentrations are obtained directly from standard curve, by using corrected sample
absorbance.
Fig 3.6: Spectrophotometer

46
Fig 3.7: Spectrophotometer Showing Standard Curve
Ammonical- Nitrogen (NH3 –N)
Method: Distillation Titrimetric Method
Procedure
Preparation of equipment: 500 mL water and 20 mL borate buffer are added,pH is adjusted
to 9.5 with 6N NaOH solution, and added to a distillation flask. A few glass beads or
boiling chips are added and this mixture is used to steam out distillation apparatus.
500 mL dechlorinated sample or a known portion diluted to 500 mL is used. The
following table is used to decide on sample volume.

47
25 mL borate buffer is added and pH is adjusted to 9.5 with 6N NaOH using a pH meter.
It is distilled at a rate of 6 to 10 mL/min with the tip of the delivery tube below the surface
of 50 mL indicting boric acid in a 500 mL Erlenmeyer flask. At least 200 mL distillate is
collected. The distillate-receiving flask is lowered in the last minute or two to clean
condenser and suction of the distillate is avoided into the condenser when the heater is
turned off.
Ammonia is titrated in distillate with 0.02 N H2SO4titrant until indicator turns pale
lavender.
A blank is carried through all steps and necessary correction is applied to the results.
Calculation
where:
A = mL H2SO4 titrated for sample
B = mL H2SO4 titrated for blank

48
Phosphate (PO4- )
Method: Ascorbic Acid Spectrophotometry
Procedure
Treatment of sample: 50 mL sample is taken into a 125 mL conical flask and 1 drop of
phenolphthalein indicator is added. Any red colour is discharged by adding 5N H2SO4. 8
mL combined reagent is added and mixed.
After 10 minutes, but no more than 30 minutes, absorbance of each sample is measured at
880nm. Reagent blank is used as reference.
Correction for turbid or coloured samples: A sample blank is prepared by adding all
reagents except ascorbic acid and potassium antimonyl tartrate to the sample. Blank
absorbance is subtracted from sample absorbance reading.
Preparation of calibration curve: Calibration from a series of standards between 0.15-1.30
mg P/L range (for a 1 cm light path) is prepared. Distilled water blank is used with the
combined reagent.
A graph with absorbance versus phosphate concentration is plotted to give a straight line.
At least one phosphate standard is tested with each set of samples.
Calculation
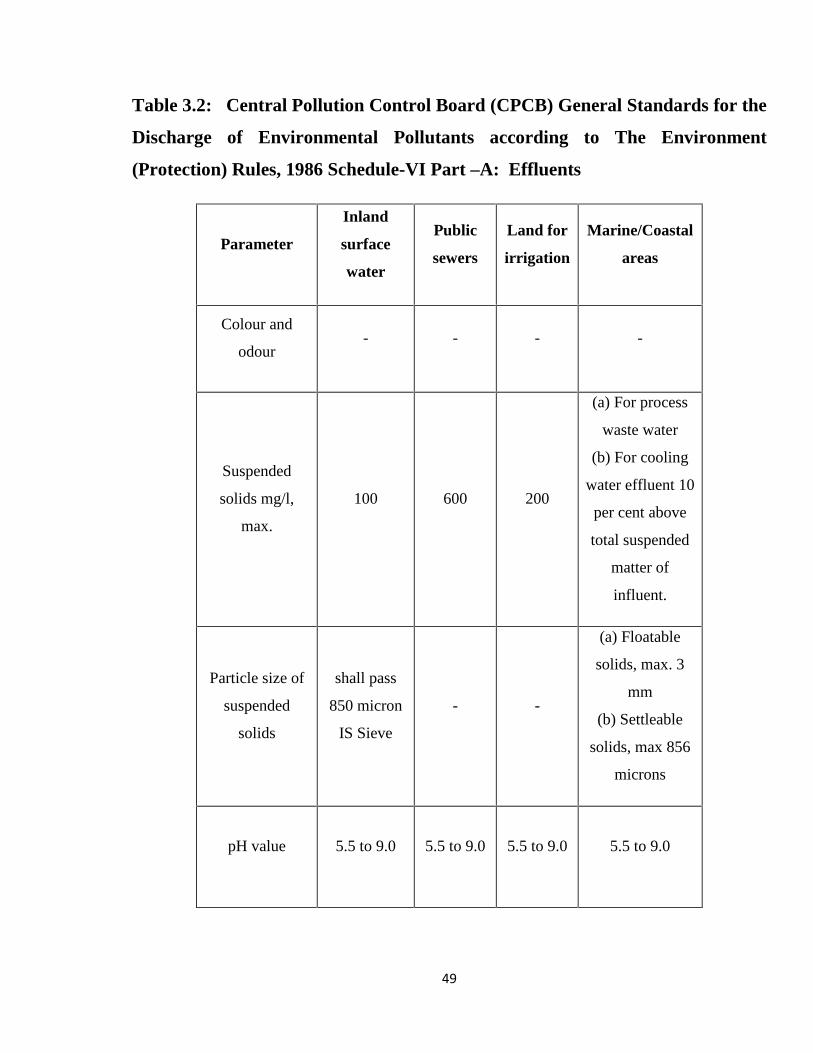
49
Table 3.2: Central Pollution Control Board (CPCB) General Standards for the
Discharge of Environmental Pollutants according to The Environment
(Protection) Rules, 1986 Schedule-VI Part –A: Effluents
Parameter
Inland
surface
water
Public
sewers
Land for
irrigation
Marine/Coastal
areas
Colour and
odour- - - -
Suspended
solids mg/l,
max.
100 600 200
(a) For process
waste water
(b) For cooling
water effluent 10
per cent above
total suspended
matter of
influent.
Particle size of
suspended
solids
shall pass
850 micron
IS Sieve
- -
(a) Floatable
solids, max. 3
mm
(b) Settleable
solids, max 856
microns
pH value 5.5 to 9.0 5.5 to 9.0 5.5 to 9.0 5.5 to 9.0

50
Temperature
shall not
exceed 5°C
above the
receiving
water
temperature
shall not exceed
5°C above the
receiving water
temperature
Oil and grease,
mg/l max,10 20 10 20
Total residual
chlorine, mg/l
max
1.0 - - 1.0
Ammonical
nitrogen as N;
mg/l, max.
50 50 - 50
Total kjeldahl
nitrogen (as
N);mg/l, max.
mg/l, max.
100 - - 100
Free ammonia
(as NH3),
mg/l,max.
5.0 - - 5.0
Biochemical
oxygen demand
(3 days at
27°C), mg/l,
max.
30 350 100 100

51
Chemical
oxygen demand,
mg/l, max.
250 - - 250
Arsenic (as As). 0.2 0.2 0.2 0.2
Mercury (As
Hg), mg/l, max.0.01 0.01 - 0.01
Lead (as Pb)
mg/l, max0.1 1.0 - 2.0
Cadmium (as
Cd) mg/l, max2.0 1.0 - 2.0
Hexavalent
chromium (as
Cr + 6), mg/l,
max.
0.1 2.0 - 1.0
Total chromium
(as Cr) mg/l,
max.
2.0 2.0 - 2.0
Copper (as Cu)
mg/l, max.3.0 3.0 - 3.0

52
Zinc (as Zn)
mg/l, max.5.0 15 - 15
Selenium (as
Se)0.05 0.05 - 0.05
Nickel (as Ni)
mg/l, max.3.0 3.0 - 5.0
Cyanide (as
CN) mg/l, max.0.2 2.0 0.2 0.2
Fluoride (as F)
mg/l, max.2.0 15 - 15
Dissolved
phosphates (as
P),mg/l, max.
5.0 - - -
Sulphide (as S)
mg/l, max.2.0 - - 5.0
Phenolic
compounds (as
C6H50H)mg/l,
max.
1.0 5.0 - 5.0

53
Radioactive
materials:
(a) Alpha
emitters micro
curie mg/l, max.
(b)Beta emitters
micro curie
mg/l
10 -7
10 -6
10 -7
10 -6
10 -8
10 -7
10 -7
10 -6
Bio-assay test
90%
survival of
fish after 96
hours in
100%
effluent
90%
survival
of fish
after 96
hours in
100%
effluent
90%
survival
of fish
after 96
hours in
100%
effluent
90% survival of
fish after 96
hours
in 100% effluent
Manganese 2 mg/l 2 mg/l - 2 mg/l
Iron (as Fe) 3mg/l 3mg/l - 3mg/l
Vanadium (as
V)0.2mg/l 0.2mg/l - 0.2mg/l
Nitrate Nitrogen 10 mg/l - - 20 mg/l

54
CHAPTER 4
RESULTS AND DISCUSSIONS
4.1 RESULTS
Concentration in mg/L, for all parameters except pH and Temp (C)
Table 4.1: Characteristics of INFLUENT and EFFLUENT of all the 3 STP’s in
the month of FEBRUARY
Parameters
Raipur Kalan STP
(UASB Technology)
Raipur Khurd STP
(ASP Technology)
Mohali STP
(MBBR
Technology)
Influent Effluent Influent Effluent Influent Effluent
Ph 7.9 8.6 7.8 8.4 7.6 8.1
Temp 18.4 18.1 18.6 18.0 18.3 17.9
TSS 159.0 38.0 168.0 63.0 172.0 30.0
TDS 283.0 160.0 285.0 169.0 291.0 106.0
Oil and Grease 3.7 0.4 4.5 0.3 5.2 0.2
BOD3, 27 C 154.0 34.0 140.0 37.0 184.0 17.0
COD 367.0 196.0 395.0 78.0 371.0 56.0
Cl- 192.0 88.0 118.0 98.8 168.0 106.0
NO3 -N 1.7 1.4 2.4 1.5 3.3 1.2
NH3 –N 28.7 30.3 25.3 28.1 19.7 24.5
PO4- 14.9 3.8 20.2 3.9 24.8 1.4
Temperature of Ghaggar river at the time of results calculated in February
was 19.2 C

55
Table 4.2: Characteristics of INFLUENT and EFFLUENT of all the 3 STP’s
in the month of MARCH
Parameters
Raipur Kalan STP
(UASB Technology)
Raipur Khurd STP
(ASP Technology)
Mohali STP
(MBBR
Technology)
Influent Effluent Influent Effluent Influent Effluent
pH 7.8 8.3 8.4 8.9 7.8 8.4
Temp 24.7 23.0 24.8 22.0 23.8 22.3
TSS 126.0 29.0 238.0 155.0 150.0 39.0
TDS 292.0 173.0 312.0 122.0 299.0 140.0
Oil and Grease 2.4 0.2 3.6 0.7 4.7 0.9
BOD3, 27 C 166.0 32.0 151.0 47.0 187.0 27.0
COD 349.0 105.0 379.0 99.0 357.0 63.0
Cl- 181.0 57.0 111.0 79.0 174.0 199.0
NO3 -N 2.8 1.3 4.1 1.4 4.9 1.4
NH3 –N 29.7 38.3 34.8 29.5 21.6 17.6
PO4- 19.4 5.2 15.2 7.8 15.9 1.96
Temperature of Ghaggar river at the time of results calculated in March was
27.4 C

56
Table 4.3: Characteristics of INFLUENT and EFFLUENT of all the 3 STP’s in
the month of APRIL
Parameters
Raipur Kalan STP
(UASB Technology)
Raipur Khurd STP
(ASP Technology)
Mohali STP
(MBBR
Technology)
Influent Effluent Influent Effluent Influent Effluent
pH 6.8 7.7 6.9 7.7 7.2 7.6
Temp 26.3 27.4 26.9 27.7 26.1 26.5
TSS 134.0 30.0 141.0 51.0 149.0 32.0
TDS 237.0 157.0 229.0 147.0 254.0 131.0
Oil and grease 2.9 0.6 3.8 0.9 3.3 0.4
BOD3, 27 C 179.0 35.0 149.0 31.0 189.0 26.0
COD 299.0 144.0 358.0 72.0 312.0 84.0
Cl- 169.0 53.0 147.0 33.0 158.0 113.0
NO3 -N 4.7 3.2 5.9 2.3 5.2 2.4
NH3 –N 19.5 28.8 23.2 37.8 17.5 23.6
PO4- 11.6 5.5 17.3 4.1 13.5 2.9
Temperature of Ghaggar river at the time of results calculated in APRIL was
32.6 C

57
Table 4.4: Average characteristics of INFLUENT and EFFLUENT of all the 3
STP’s
Parameters
Raipur Kalan STP
(UASB Technology)
Raipur Khurd STP
(ASP Technology)
Mohali STP
(MBBR
Technology)
Influent Effluent Influent Effluent Influent Effluent
pH 7.5 8.2 7.7 8.3 7.5 8.0
Temp 23.1 22.8 23.4 22.5 22.7 22.1
TSS 139.6 32.3 182.3 89.6 157.0 33.6
TDS 270.6 163.3 275.3 146.0 281.3 125.6
Oil and grease 3.0 0.4 3.9 0.6 4.4 0.5
BOD3, 27 C 166.3 33.6 146.6 38.3 186.6 23.3
COD 338.3 148.3 377.3 83.0 346.6 67.6
Cl- 180.6 66.0 125.3 70.0 166.6 139.3
NO3 -N 3.1 1.9 4.1 1.7 4.4 1.6
NH3 –N 25.9 32.4 27.7 31.8 19.6 21.9
PO4- 15.3 4.8 17.5 5.0 18.1 2.1
Average Temperature of Ghaggar river at the time of results calculated in
FEB, March and APRIL was 26.4 C

58
Graphical Representation of Average characteristics of INFLUENT and
EFFLUENT of all the 3 STP’s
X- Axis: Influent and Effluent
Y- Axis: Concentration in mg/L, for all parameters except pH and Temp (C)
Fig 4.1: Graphical Representation of pH
Fig 4.2: Graphical Representation of Temp
7
7.2
7.4
7.6
7.8
8
8.2
8.4
Influent
Raipur Kalan STP(UASB Technology)
21
21.5
22
22.5
23
23.5
Influent
Raipur Kalan STP(UASB Technology)
58
Graphical Representation of Average characteristics of INFLUENT and
EFFLUENT of all the 3 STP’s
X- Axis: Influent and Effluent
Y- Axis: Concentration in mg/L, for all parameters except pH and Temp (C)
Fig 4.1: Graphical Representation of pH
Fig 4.2: Graphical Representation of Temp
Influent Effluent Influent Effluent Influent Effluent
Raipur Kalan STP(UASB Technology)
Raipur Khurd STP (ASPTechnology)
Mohali STP (MBBRTechnology)
Influent Effluent Influent Effluent Influent Effluent
Raipur Kalan STP(UASB Technology)
Raipur Khurd STP (ASPTechnology)
Mohali STP (MBBRTechnology)
58
Graphical Representation of Average characteristics of INFLUENT and
EFFLUENT of all the 3 STP’s
X- Axis: Influent and Effluent
Y- Axis: Concentration in mg/L, for all parameters except pH and Temp (C)
Fig 4.1: Graphical Representation of pH
Fig 4.2: Graphical Representation of Temp
Effluent
Mohali STP (MBBRTechnology)
pH
Effluent
Mohali STP (MBBRTechnology)
Temp

59
Fig 4.3: Graphical Representation of TSS
Fig 4.4: Graphical Representation of TDS
0
20
40
60
80
100
120
140
160
180
200
Influent
Raipur Kalan STP(UASB Technology)
0
50
100
150
200
250
300
Influent
Raipur Kalan STP(UASB Technology)
TSS
Conc
entr
atio
nin
mg/
LTD
SCo
ncen
trat
ion
inm
g/L
59
Fig 4.3: Graphical Representation of TSS
Fig 4.4: Graphical Representation of TDS
Influent Effluent Influent Effluent Influent Effluent
Raipur Kalan STP(UASB Technology)
Raipur Khurd STP(ASP Technology)
Mohali STP (MBBRTechnology)
Influent Effluent Influent Effluent Influent Effluent
Raipur Kalan STP(UASB Technology)
Raipur Khurd STP(ASP Technology)
Mohali STP (MBBRTechnology)
TSS
Conc
entr
atio
nin
mg/
LTD
SCo
ncen
trat
ion
inm
g/L
59
Fig 4.3: Graphical Representation of TSS
Fig 4.4: Graphical Representation of TDS
Effluent
Mohali STP (MBBRTechnology)
TSS
TDS
TSS
Conc
entr
atio
nin
mg/
LTD
SCo
ncen
trat
ion
inm
g/L

60
Fig 4.5: Graphical Representation of Oil and Grease
Fig 4.6: Graphical Representation of BOD
00.5
11.5
22.5
33.5
44.5
5
Influent
Raipur Kalan STP(UASB
Technology)
020406080
100120140160180200
Influent
Raipur Kalan STP(UASB Technology)
BOD
Conc
entr
atio
n in
mg/
LO
il an
d Gr
ease
Conc
entr
atio
nin
mg/
L
60
Fig 4.5: Graphical Representation of Oil and Grease
Fig 4.6: Graphical Representation of BOD
Influent Effluent Influent Effluent Influent Effluent
Raipur Kalan STP(UASB
Technology)
Raipur Khurd STP(ASP Technology)
Mohali STP(MBBR
Technology)
Oil and grease
Influent Effluent Influent Effluent Influent Effluent
Raipur Kalan STP(UASB Technology)
Raipur Khurd STP(ASP Technology)
Mohali STP (MBBRTechnology)
BOD3, 27 °C
BOD
Conc
entr
atio
n in
mg/
LO
il an
d Gr
ease
Conc
entr
atio
nin
mg/
L
60
Fig 4.5: Graphical Representation of Oil and Grease
Fig 4.6: Graphical Representation of BOD
Oil and grease
BOD3, 27 °C
BOD
Conc
entr
atio
n in
mg/
LO
il an
d Gr
ease
Conc
entr
atio
nin
mg/
L

61
Fig 4.7: Graphical Representation of COD
Fig 4.8: Graphical Representation of Cl-
0
50
100
150
200
250
300
350
400
Influent
Raipur Kalan STP(UASB Technology)
0
20
40
60
80
100
120
140
160
180
200
Influent Effluent
Raipur Kalan STP(UASB
Technology)
CI-
Conc
entr
atio
nin
mg/
LCO
DCo
ncen
trat
ion
inm
g/L
61
Fig 4.7: Graphical Representation of COD
Fig 4.8: Graphical Representation of Cl-
Influent Effluent Influent Effluent Influent Effluent
Raipur Kalan STP(UASB Technology)
Raipur Khurd STP(ASP Technology)
Mohali STP (MBBRTechnology)
Influent Effluent Influent Effluent Influent Effluent
Raipur Kalan STP(UASB
Technology)
Raipur KhurdSTP (ASP
Technology)
Mohali STP(MBBR
Technology)
Cl-
CI-
Conc
entr
atio
nin
mg/
LCO
DCo
ncen
trat
ion
inm
g/L
61
Fig 4.7: Graphical Representation of COD
Fig 4.8: Graphical Representation of Cl-
Effluent
Mohali STP (MBBRTechnology)
COD
CI-
Conc
entr
atio
nin
mg/
LCO
DCo
ncen
trat
ion
inm
g/L

62
Fig 4.9: Graphical Representation of NO3 –N
Fig 4.10: Graphical Representation of NH3 –N
00.5
11.5
22.5
33.5
44.5
5
Influent
Raipur Kalan STP(UASB Technology)
0
5
10
15
20
25
30
35
Influ
ent
Raipur KalanSTP (UASB
Technology)
NO
3–N
Conc
entr
atio
nin
mg/
LN
H 3–
NCo
ncen
trat
ion
inm
g/L
62
Fig 4.9: Graphical Representation of NO3 –N
Fig 4.10: Graphical Representation of NH3 –N
Influent Effluent Influent Effluent Influent Effluent
Raipur Kalan STP(UASB Technology)
Raipur Khurd STP(ASP Technology)
Mohali STP (MBBRTechnology)
Efflu
ent
Influ
ent
Efflu
ent
Influ
ent
Efflu
ent
Raipur KalanSTP (UASB
Technology)
Raipur KhurdSTP (ASP
Technology)
Mohali STP(MBBR
Technology)
NH3 –N
NO
3–N
Conc
entr
atio
nin
mg/
LN
H 3–
NCo
ncen
trat
ion
inm
g/L
62
Fig 4.9: Graphical Representation of NO3 –N
Fig 4.10: Graphical Representation of NH3 –N
NO3 -N
NO
3–N
Conc
entr
atio
nin
mg/
LN
H 3–
NCo
ncen
trat
ion
inm
g/L

63
Fig 4.11: Graphical Representation of PO4-
Table 4.5: Comparison of all the three STP’s Effluent with Central Pollution
Control Board (CPCB), General Standards for the Discharge of Environmental
Pollutants according to The Environment (Protection) Rules, 1986 Schedule-VI
Part –A: Effluents
Parameter
Raipur Kalan
STP (UASB)
Technology
Average
Effluent
Raipur
Khurd STP
(ASP)
Technology
Average
Effluent
Mohali STP
(MBBR)
Technology
Average
Effluent
Comparison Result
With CPCB
Effluent Discharge
Standards into
Inland Surface
Water
pH 8.2 8.3 8.0Lower than
Permissible Limit
0
2
4
6
8
10
12
14
16
18
20
Influent
Raipur Kalan STP(UASB Technology)
PO4
-Co
ncen
trat
ion
inm
g/L
63
Fig 4.11: Graphical Representation of PO4-
Table 4.5: Comparison of all the three STP’s Effluent with Central Pollution
Control Board (CPCB), General Standards for the Discharge of Environmental
Pollutants according to The Environment (Protection) Rules, 1986 Schedule-VI
Part –A: Effluents
Parameter
Raipur Kalan
STP (UASB)
Technology
Average
Effluent
Raipur
Khurd STP
(ASP)
Technology
Average
Effluent
Mohali STP
(MBBR)
Technology
Average
Effluent
Comparison Result
With CPCB
Effluent Discharge
Standards into
Inland Surface
Water
pH 8.2 8.3 8.0Lower than
Permissible Limit
Influent Effluent Influent Effluent Influent Effluent
Raipur Kalan STP(UASB Technology)
Raipur Khurd STP (ASPTechnology)
Mohali STP (MBBRTechnology)
PO4
-Co
ncen
trat
ion
inm
g/L
63
Fig 4.11: Graphical Representation of PO4-
Table 4.5: Comparison of all the three STP’s Effluent with Central Pollution
Control Board (CPCB), General Standards for the Discharge of Environmental
Pollutants according to The Environment (Protection) Rules, 1986 Schedule-VI
Part –A: Effluents
Parameter
Raipur Kalan
STP (UASB)
Technology
Average
Effluent
Raipur
Khurd STP
(ASP)
Technology
Average
Effluent
Mohali STP
(MBBR)
Technology
Average
Effluent
Comparison Result
With CPCB
Effluent Discharge
Standards into
Inland Surface
Water
pH 8.2 8.3 8.0Lower than
Permissible Limit
Effluent
Mohali STP (MBBRTechnology)
PO4-
PO4
-Co
ncen
trat
ion
inm
g/L

64
Temp 22.8 22.5 22.1Lower than
Permissible Limit
TSS 32.3 89.6 33.6Lower than
Permissible Limit
TDS 163.3 146.0 125.6Lower than
Permissible Limit
Oil and
Grease0.4 0.6 0.5
Lower than
Permissible Limit
BOD3, 27 C 33.6 38.3 23.3
Higher than
Permissible Limit for
Raipur Kalan STP
and Raipur Khurd
STP
COD 148.3 83.0 67.6Lower than
Permissible Limit
Cl- 66.0 70.0 139.3Lower than
Permissible Limit
NO3 -N 1.9 1.7 1.6Lower than
Permissible Limit
NH3 –N 32.3 31.8 21.9Lower than
Permissible Limit
PO4-
4.8 5.0 2.1
Lower than
Permissible Limit for
Raipur Kalan STP
and Mohali STP but
Exactly upto
Permissible Limit for
Raipur Khurd STP

65
Fig 4.12: Graphical Representation of Parameter BOD Exceeding
CPCB Standard
For evaluating overall Performance/Efficiency of an STP four major
parameters are considered which are TSS, TDS, COD and BOD
Removal / Reduction Efficiency is Calculated as:
Initial Amount – Reduced Amount
0
5
10
15
20
25
30
35
40
45
(UASB) Technology
Raipur Kalan STP
Initial AmountX 100Er =
BOD
Conc
entr
atio
nin
mg/
L
StandardValue
65
Fig 4.12: Graphical Representation of Parameter BOD Exceeding
CPCB Standard
For evaluating overall Performance/Efficiency of an STP four major
parameters are considered which are TSS, TDS, COD and BOD
Removal / Reduction Efficiency is Calculated as:
Initial Amount – Reduced Amount
(UASB) Technology (ASP) Technology (MBBR) Technology
Raipur Kalan STP Raipur Khurd STP Mohali STP
Initial AmountX 100Er =
BOD
Conc
entr
atio
nin
mg/
L
StandardValue
65
Fig 4.12: Graphical Representation of Parameter BOD Exceeding
CPCB Standard
For evaluating overall Performance/Efficiency of an STP four major
parameters are considered which are TSS, TDS, COD and BOD
Removal / Reduction Efficiency is Calculated as:
Initial Amount – Reduced Amount
(MBBR) Technology
BOD
Initial AmountX 100Er =
BOD
Conc
entr
atio
nin
mg/
L
StandardValue

66
Table 4.6: Overall Performance or Removal/Reduction Efficiency of all the 3
STP’s
Removal/Reduction
EfficiencyTSS TDS COD BOD3, 27 C
Raipur Kalan STP
(UASB) Technology76 % 39 % 56 % 79 %
Raipur Khurd STP
(ASP) Technology51% 46 % 78% 73 %
Mohali STP
(MBBR) Technology78% 55 % 75 % 88 %
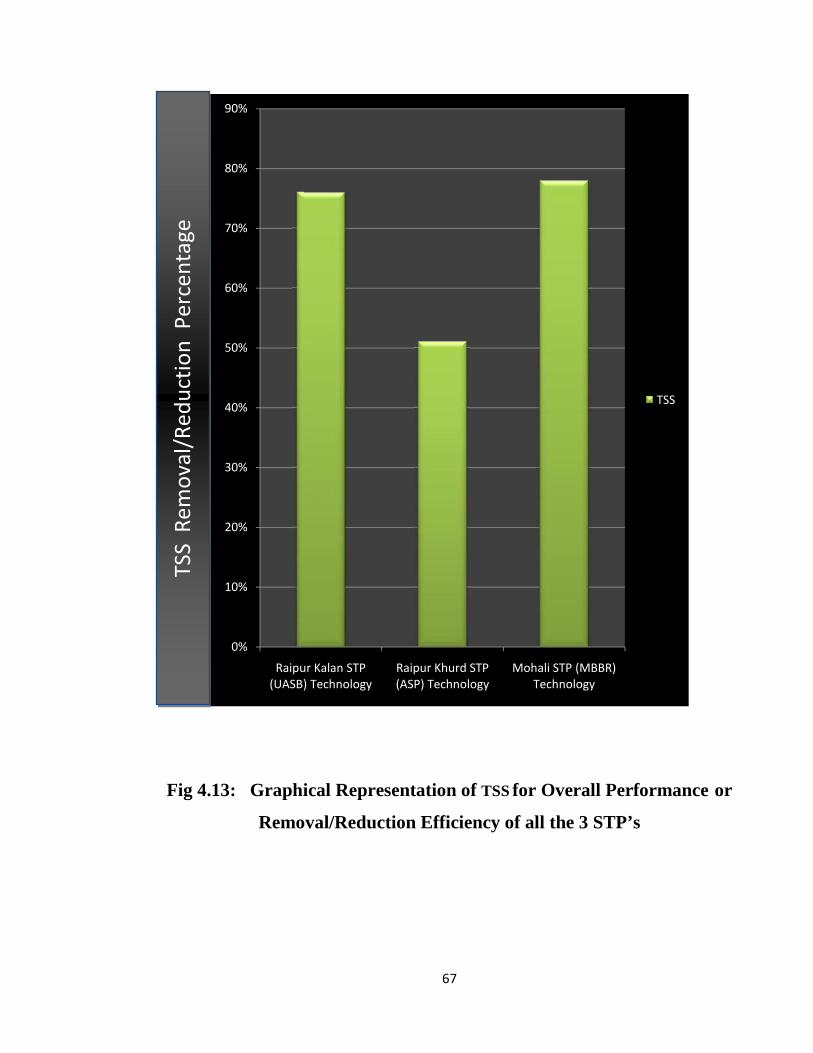
67
Fig 4.13: Graphical Representation of TSS for Overall Performance or
Removal/Reduction Efficiency of all the 3 STP’s
0%
10%
20%
30%
40%
50%
60%
70%
80%
90%
Raipur Kalan STP(UASB) Technology
TSS
Rem
oval
/Red
uctio
nPe
rcen
tage
67
Fig 4.13: Graphical Representation of TSS for Overall Performance or
Removal/Reduction Efficiency of all the 3 STP’s
Raipur Kalan STP(UASB) Technology
Raipur Khurd STP(ASP) Technology
Mohali STP (MBBR)Technology
TSS
Rem
oval
/Red
uctio
nPe
rcen
tage
67
Fig 4.13: Graphical Representation of TSS for Overall Performance or
Removal/Reduction Efficiency of all the 3 STP’s
Mohali STP (MBBR)Technology
TSS
TSS
Rem
oval
/Red
uctio
nPe
rcen
tage

68
Fig 4.14: Graphical Representation of TDS for Overall Performance or
Removal/Reduction Efficiency of all the 3 STP’s
0%
10%
20%
30%
40%
50%
60%
Raipur Kalan STP(UASB) Technology
TDS
Rem
oval
/Red
uctio
nPe
rcen
tage
68
Fig 4.14: Graphical Representation of TDS for Overall Performance or
Removal/Reduction Efficiency of all the 3 STP’s
Raipur Kalan STP(UASB) Technology
Raipur Khurd STP(ASP) Technology
Mohali STP (MBBR)Technology
TDS
Rem
oval
/Red
uctio
nPe
rcen
tage
68
Fig 4.14: Graphical Representation of TDS for Overall Performance or
Removal/Reduction Efficiency of all the 3 STP’s
Mohali STP (MBBR)Technology
TDS
TDS
Rem
oval
/Red
uctio
nPe
rcen
tage

69
Fig 4.15: Graphical Representation of COD for Overall Performance or
Removal/Reduction Efficiency of all the 3 STP’s
0%
10%
20%
30%
40%
50%
60%
70%
80%
90%
Raipur Kalan STP(UASB) Technology
COD
Rem
oval
/Red
uctio
nPe
rcen
tage
69
Fig 4.15: Graphical Representation of COD for Overall Performance or
Removal/Reduction Efficiency of all the 3 STP’s
Raipur Kalan STP(UASB) Technology
Raipur Khurd STP(ASP) Technology
Mohali STP (MBBR)Technology
COD
Rem
oval
/Red
uctio
nPe
rcen
tage
69
Fig 4.15: Graphical Representation of COD for Overall Performance or
Removal/Reduction Efficiency of all the 3 STP’s
Mohali STP (MBBR)Technology
COD
COD
Rem
oval
/Red
uctio
nPe
rcen
tage

70
Fig 4.16: Graphical Representation of BOD3, 27 C for Overall Performance or
Removal/Reduction Efficiency of all the 3 STP’s
0%
10%
20%
30%
40%
50%
60%
70%
80%
90%
100%
Raipur Kalan STP(UASB) Technology
BOD
Rem
oval
/Red
uctio
nPe
rcen
tage
70
Fig 4.16: Graphical Representation of BOD3, 27 C for Overall Performance or
Removal/Reduction Efficiency of all the 3 STP’s
Raipur Kalan STP(UASB) Technology
Raipur Khurd STP(ASP) Technology
Mohali STP (MBBR)Technology
BOD
Rem
oval
/Red
uctio
nPe
rcen
tage
70
Fig 4.16: Graphical Representation of BOD3, 27 C for Overall Performance or
Removal/Reduction Efficiency of all the 3 STP’s
BOD3, 27 °C
BOD
Rem
oval
/Red
uctio
nPe
rcen
tage

71
Fig 4.17: Graphical Representation of Overall Performance or
Removal/Reduction Efficiency of all the 3 STP’s
0%
10%
20%
30%
40%
50%
60%
70%
80%
90%
100%
TSS
Rem
oval
/Red
uctio
nPe
rcen
tage
71
Fig 4.17: Graphical Representation of Overall Performance or
Removal/Reduction Efficiency of all the 3 STP’s
TSS TDS COD BOD
Raipur Kalan STP (UASB)Technology
Raipur Khurd STP (ASP)Technology
Mohali STP (MBBR)Technology
Rem
oval
/Red
uctio
nPe
rcen
tage
71
Fig 4.17: Graphical Representation of Overall Performance or
Removal/Reduction Efficiency of all the 3 STP’s
Raipur Kalan STP (UASB)Technology
Raipur Khurd STP (ASP)Technology
Mohali STP (MBBR)Technology
Rem
oval
/Red
uctio
nPe
rcen
tage

72
Since out of 30 MGD of STP, Mohali 10 MGD treated waste water is reused for Irrigation purpose
in various gardens and lawns of Sector: 19, 20, 21, 29, 30, 33, 34, 36, 40, 42, 43, 44, 46, 47, 48, 51
and 52 of Chandigarh city therefore Average Effluent of this STP is compared with the CPCB
Effluent Discharge Standards into Land for Irrigation.
Table 4.7: Comparison of Mohali STP, (MBBR) Technology, Average Effluent
with the CPCB Effluent Discharge Standards into Land for Irrigation
Parameter
Mohali STP
(MBBR) Technology
Average Effluent
Comparison Result With CPCB
Effluent Discharge Standards
into Land for Irrigation
pH 8.0 Lower than Permissible Limit
Temp 22.1 _
TSS 33.6 Lower than Permissible Limit
TDS 125.6 _
Oil and Grease 0.5 Lower than Permissible Limit
BOD3, 27 C 23.3 Lower than Permissible Limit
COD 67.6 _
Cl- 139.3 _
NO3 -N 1.6 _
NH3 –N 21.9 _
PO4- 2.1 _

73
4.2 DISCUSSIONS
pH
The pH value of sewage indicates the negative log of hydrogen ion concentration present in
sewage. It is thus, an indicator of the alkalinity or acidity of sewage. If the pH value is less than 7,
the sewage is acidic, and if the pH value is more than 7, the sewage is alkaline. The
determination of pH value is important because of the fact that efficiency of certain treatment
methods depends upon the availability of a suitable pH value. The PH directly affects the
performance of a secondary treatment process because the existence of most biological life is
dependent upon the narrow and critical range of pH. Thus, pH is also an indicator of biological
life since most of them thrive in a quite narrow and critical pH range. In addition to all above,
Chemical processes used to coagulate wastewater, dewater sludge or oxidize certain substances,
such as cyanide ion requires that the pH be controlled within a narrow range. Thus, any variation
beyond acceptable range could be fatal to a particular organism.
During the course of the study it was recorded that pH varies from acidic to alkaline i.e 6.8-7.9,
6.9-8.4 and alkaline i.e 7.2-7.8 for Influent of STP Raipur Kalan, Raipur Khurd and Mohali
respectively. Maximum pH value was recorded in the month of February, March and March for
Influent of STP Raipur Kalan, Raipur Khurd and Mohali respectively. Average pH value of the
Influent was recorded as 7.5, 7.7 and 7.5 for STP Raipur Kalan, Raipur Khurd and Mohali
respectively indicating that the Influent was alkaline in nature for all the three STP’s.
Also during the course of the study it was recorded that pH varies from 7.7-8.6, 7.7-8.9 and 7.6-8.4
for Effluent of STP Raipur Kalan, Raipur Khurd and Mohali respectively which indicates that for
all the above mentioned STP’s the Effluent during the duration of study was alkaline in nature.
Maximum pH value was recorded in the month of February, March and March for effluent of STP
Raipur Kalan, Raipur Khurd and Mohali respectively. Average pH value of the Effluent was
recorded as 8.2, 8.3 and 8.0 for STP Raipur Kalan, Raipur Khurd and Mohali respectively which
clearly shows that the Effluent from above three STP’s were alkaline in nature. Also Average pH

74
value of the Effluent for all the three STP’s were under Permissible Limit according to CPCB
Effluent Discharge Standards into Inland Surface water.
Since out of 30 MGD of STP, Mohali 10 MGD treated waste water is reused for Irrigation purpose
in various gardens and lawns of Sector: 19, 20, 21, 29, 30, 33, 34, 36, 40, 42, 43, 44, 46, 47, 48, 51
and 52 of Chandigarh city, Average Effluent value of pH recorded for this STP was also under
permissible limit according to CPCB Effluent Discharge Standards into Land for Irrigation.
Temperature (Temp)
The determination of temperature is also important because temperature has an effect on the
biological activity of bacteria present in sewage, and also it affects the solubility of gases in
sewage. In addition, temperature also affects the viscosity of sewage, which in turn affects the
sedimentation process in its treatment.
In the present study temperature varies from 18.4-26.3oC, 18.6-29.9oC and 18.3-26.1oC for Influent
of STP Raipur Kalan, Raipur Khurd and Mohali respectively. Maximum temperature value of
influent was recorded in the month of April for all the three STP’s. Average temperature was
recorded as 23.1oC, 23.4oC and 22.7oC for Influent of STP Raipur Kalan, Raipur Khurd and
Mohali respectively. Not much variation was found in temperature of Influent for all the three
STP’s.
Also it was recorded that temperature varies from 18.1-27.4oC, 18.0-27.7oC and 17.7-26.5oC for
Effluent of STP Raipur Kalan, Raipur Khurd and Mohali respectively. Maximum temperature
value of Effluent was recorded in the month of April for all the three STP’s. Average temperature
was recorded as 22.8oC, 22.5oC and 22.1oC for Effluent of STP Raipur Kalan, Raipur Khurd and
Mohali respectively. Not much variation was found in temperature of Effluent for all the three
STP’s.
Also Average temperature value of the Effluent for all the three STP’s were under Permissible
Limit according to CPCB Effluent Discharge Standards into Inland Surface water
75
Total Suspended Solids (TSS) and Total dissolved Solids (TDS)
Sewage normally contains very small amount of solids in relation to the huge quantity of water
(99.9%). Solids in the sewage comprise of both: Organic as well as Inorganic solids. As a general
rule, the presence of inorganic solids in sewage is not harmful. They require only mechanical
appliances for their removal in the treatment plant. On the other hand suspended and dissolved
organic solids are responsible for creating nuisance, if disposed of untreated.
Total Solids (TS) have great implications in the control of biological and physical waste water
treatment processes. Total solids (TS), is a sum of two terms namely Total Suspended Solids
(TSS) and Total Dissolved Solids (TDS). TDS and TSS are common indicators of polluted water
and wastewater therefore these to parameters are must to determine. Also in overall performance
of an STP they are considered as important parameters. More over TDS of the wastewater is of
concern as it affects the reuse of wastewater for agricultural purposes, by decreasing the hydraulic
conductivity of irrigated land.
TSS
In the present study it was recorded that TSS varies from 126-159 mg/L, 141-238 mg/L and 149-
172 mg/L for the Influent of STP Raipur Kalan, Raipur Khurd and Mohali respectively.
Maximum TSS value was recorded in the month of February, March and February for Influent of
STP Raipur Kalan, Raipur Khurd and Mohali respectively. Average TSS value of the Influent was
recorded as 139.6 mg/L, 182.3 mg/L and 157.0 mg/L for STP Raipur Kalan, Raipur Khurd and
Mohali respectively. Average TSS value for the Influent of all the three STP’s indicated much
variation among the three STP’s in terms of TSS value for the Influent, which is attributed to
large difference in the organic and inorganic loading of solids with liquid content in all the three
STP’s.
In the present study it was recorded that TSS varies from 29-38 mg/L, 51-155 mg/L and 30-39
mg/L for the Effluent of STP Raipur Kalan, Raipur Khurd and Mohali respectively. Maximum
TSS value was recorded in the month of February, March and March for Effluent of STP Raipur
Kalan, Raipur Khurd and Mohali respectively.

76
Average TSS value of the Effluent was recorded as 32.3 mg/L, 89.6 mg/L and 157.0 mg/L for
STP Raipur Kalan, Raipur Khurd and Mohali respectively. Average TSS value for the Effluent of
all the three STP’s indicated much variation among the three STP’s in terms of TSS value for the
Effluent, which is again attributed to large difference in the organic and inorganic loading of
solids with liquid content in all the three STP’s.
Also Average TSS value of the Effluent for all the three STP’s were under Permissible Limit
according to CPCB Effluent Discharge Standards into Inland Surface water.
Since out of 30 MGD of STP, Mohali 10 MGD treated waste water is reused for Irrigation purpose
in various gardens and lawns of Sector: 19, 20, 21, 29, 30, 33, 34, 36, 40, 42, 43, 44, 46, 47, 48,
51 and 52 of Chandigarh city, Average Effluent value of TSS value recorded for this STP was also
under permissible limit according to CPCB Effluent Discharge Standards into Land for Irrigation.
TDS
In the present study it was recorded that TDS varies from 237-292 mg/L, 229-312 mg/L and 254-
299 mg/L for the Influent of STP Raipur Kalan, Raipur Khurd and Mohali respectively.
Maximum TDS value of Influent was recorded in the month of March for all the three STP’s.
Average TDS value of the Influent was recorded as 270.6 mg/L, 275.3 mg/L and 281.3mg/L for
STP Raipur Kalan, Raipur Khurd and Mohali respectively. Average TDS value for the Influent
of all the three STP’s indicated not much variation among the three STP’s in terms of TDS value
for the Influent, which is attributed to less difference in the organic and inorganic loading of
solids with liquid content in all the three STP’s.
In the present study it was recorded that TDS varies from 157-173 mg/L, 122-169 mg/L and 106-
140 mg/L for the Effluent of STP Raipur Kalan, Raipur Khurd and Mohali respectively.
Maximum TDS value was recorded in the month of March, February and March for Effluent of
STP Raipur Kalan, Raipur Khurd and Mohali respectively. Average TDS value of the Effluent
was recorded as 163.3 mg/L, 146.0 mg/L and 125.6 mg/L for STP Raipur Kalan, Raipur Khurd
and Mohali respectively. Average TDS value for the Effluent of all the three STP’s indicated
much variation among the three STP’s in terms of TDS value for the Effluent, which is again

77
attributed to large difference in the organic and inorganic loading of solids with liquid content in
all the three STP’s. Also Average TDS value of the Effluent for all the three STP’s were under
Permissible Limit according to CPCB Effluent Discharge Standards into Inland Surface water.
Oil and grease
Oil and Grease are derived in sewage from the discharges of animals and vegetable matter, which
mainly come from kitchens, hotels and restaurants and many other places. The determination of
Oil and Grease in sewage is important because such matter forms scum on the top of the
sedimentation tanks and clogs the voids of the filtering media. They thus interfere with the normal
treatment methods, and hence need proper detection and removal.
In the present investigation it was recorded that Oil and Grease varies from 2.4-3.7 mg/L, 3.6-4.5
mg/L and 3.3-5.2 mg/L for the Influent of STP Raipur Kalan, Raipur Khurd and Mohali
respectively. Also was recorded that Oil and Grease varies from 0.2-0.6 mg/L, 0.3-0.9 mg/L and
0.2-0.9 mg/L for the Effluent of STP Raipur Kalan, Raipur Khurd and Mohali respectively.
Not much variation was observed in Influent and Effluent value of Oil and Grease for all the three
STP’s which shows that the discharge from the various sources of Oil and Grease contain less
amount of oily and greasy material during the duration of study.
Also Average Oil and Grease value of the Effluent for all the three STP’s were under Permissible
Limit according to CPCB Effluent Discharge Standards into Inland Surface water.
Since out of 30 MGD of STP, Mohali 10 MGD treated waste water is reused for Irrigation purpose
in various gardens and lawns of Sector: 19, 20, 21, 29, 30, 33, 34, 36, 40, 42, 43, 44, 46, 47, 48, 51
and 52 of Chandigarh city, Average Effluent value of Oil and Grease recorded for this STP was
also under permissible limit according to CPCB Effluent Discharge Standards into Land for
Irrigation.

78
Biochemical Oxygen Demand (BOD)
Biochemical Oxygen Demand (BOD) is the measure of biodegradable organic matter present in a
water sample and can be defined as the amount of oxygen required by the microbes in stabilizing
the biologically degradable organic matter under aerobic condition. Determination of BOD is
considered very important because BOD value can be used as a measure of waste strength in terms
of oxygen required. The quantity of oxygen required may be taken as a measure of its content of
decomposable organic matter. The rate of BOD exertion is governed by the characteristics of
sewage, its decomposable organic matter, bacterial population and temperature. Moreover BOD is
the most essential parameter which is considered to define the overall performance or efficiency of
an STP.
During the study it was recorded that BOD varies from 154-169 mg/L, 140-151 mg/L and 184-189
mg/L for the Influent of STP Raipur Kalan, Raipur Khurd and Mohali respectively. Maximum
BOD value of Influent was recorded in the month of April, March and April for Influent of STP
Raipur Kalan, Raipur Khurd and Mohali respectively. The highest value of BOD for Influent of the
above three STP’s noticed clearly indicates that this highest value is attributed to heavy organic
and inorganic loading with less amount of water in the above mentioned months. Average BOD
was recorded as 166.3 mg/L, 146.6 3 mg/L and 186.6 3 mg/L for the Influent of STP Raipur
Kalan, Raipur Khurd and Mohali respectively, high average value of BOD for all the three STP’s
indicates the degree of pollution of Influent in each STP. Also DO was very less at inlet for all
three STP’s which is further stimulated by oxidation of sewage ammonia to nitrates, septic
condition and heavy organic loadings, therefore high BOD value are obtained at inlet in all the
three STP’s . Out of all the three STP’s mentioned above the average BOD value was maximum in
Mohali STP
BOD value for Effluent was in the range of 32-35 mg/L, 31-47 mg/L and 17-27 mg/L of STP
Raipur Kalan, Raipur Khurd and Mohali respectively. Average BOD value for Effluent recorded
was 33.6 mg/L, 38.3 mg/L and 23.3 mg/L of STP Raipur Kalan, Raipur Khurd and Mohali
respectively.
It was observed that average BOD value for Effluent of STP Raipur Kalan and Raipur Khurd was
not under permissible limit according to CPCB Effluent Discharge Standards into Inland Surface

79
water. But average BOD value for Effluent of STP Mohali was under permissible limit according
to CPCB Effluent Discharge Standards into Inland Surface water.
Since out of 30 MGD of STP, Mohali 10 MGD treated waste water is reused for Irrigation purpose
in various gardens and lawns of Sector: 19, 20, 21, 29, 30, 33, 34, 36, 40, 42, 43, 44, 46, 47, 48, 51
and 52 of Chandigarh city, Average Effluent value of BOD recorded for this STP was also under
permissible limit according to CPCB Effluent Discharge Standards into Land for Irrigation.
Chemical Oxygen Demand (COD)
Chemical Oxygen Demand (COD) is a measure of oxygen equivalent to the organic matter content
of the water susceptible to oxidation by a strong chemical oxidant and thus is an index of organic
pollution in the river. The test measures the amount of oxygen required for chemical oxidation of
organic matter in the sample to carbon dioxide and water. COD is also an important parameter of
water indicating the health scenario of freshwater bodies.
COD determination is considered important because it is widely used for measuring the pollution
strength of wastewater. All organic compounds except few exceptions can be oxidized to carbon
dioxide and water by the action of strong oxidizing agents regardless of biological assimilability of
substances.
In the present study COD value varies from 299-367 mg/L, 358-395 mg/L and 312-371 mg/L for
the Influent of STP Raipur Kalan, Raipur Khurd and Mohali respectively. Maximum COD value of
Influent was recorded in the month of February for Influent of all the three STP’s. Highest value
of COD in the month of February was due to the heavy organic loading with less amount of water.
Average Influent value of COD recorded was 338.3 mg/L, 377.3 mg/L and 346.6 mg/L for the
Influent of STP Raipur Kalan, Raipur Khurd and Mohali respectively. Not much variation was
found in COD value for the Influent of STP Raipur Kalan, Raipur Khurd and Mohali.

80
COD value recorded in the range of 105-196 mg/L, 72-99 mg/L and 56-84 mg/L for the Effluent of
STP Raipur Kalan, Raipur Khurd and Mohali respectively. Average COD value was recorded as
148.3 mg/L, 83 mg/L and 67.6 mg/L for the Effluent of STP Raipur Kalan, Raipur Khurd and
Mohali respectively.
It has been observed that average COD value for Effluent of STP Raipur Kalan, Raipur Khurd and
Mohali was under permissible limit according to CPCB Effluent Discharge Standards into Inland
Surface water.
Chloride (Cl-)
Chlorides are generally found in municipal sewage, and are derived from human feces and urinary
discharges etc. Determination of Cl- is important because Cl- is one of the major inorganic anions
in water and wastewater. Chloride is not strictly a pollutant but high concentration may harm
agriculture crops and corrode the metallic pipes.
However, large amounts of chloride content may enter from industries like ice cream plants, meat
salting, etc thus increasing the chloride contents of sewage. Hence, when the chloride content of a
given sewage is found to be high, it indicates the presence of industrial wastes or infiltration of sea
water, thereby indicating the strength of sewage.
In the present study Cl- value varies from 169-192 mg/L, 11-147 mg/L and 158-174mg/L for the
Influent of STP Raipur Kalan, Raipur Khurd and Mohali respectively. Average Influent value of
Cl- recorded was 180.6 mg/L, 125.3 mg/L and 166.6 mg/L for the Influent of STP Raipur Kalan,
Raipur Khurd and Mohali respectively. Not much variation was found in Cl- value for the Influent
of STP Raipur Kalan, Raipur Khurd and Mohali which indicates that there is no presence of
industrial waste or infiltration of sea water which generally attributes to the strength of sewage.
Cl- value recorded in the range of 53-88 mg/L, 33-98 mg/L and 106-199 mg/L for the Effluent of
STP Raipur Kalan, Raipur Khurd and Mohali respectively. Average Cl- value was recorded as 66.0
mg/L, 70.0 mg/L and 139.3 mg/L for the Effluent of STP Raipur Kalan, Raipur Khurd and Mohali
respectively. Average Cl- value of Effluent for the three STP’s indicates much variation among the
three with respect to the chloride content.

81
It was observed that average Cl- value for Effluent of STP Raipur Kalan, Raipur Khurd and Mohali
was under permissible limit according to CPCB Effluent Discharge Standards into Inland Surface
water.
Nutrient Load
The presence of nitrogen in sewage indicates the presence of organic matter, and may occur in one
or more of the following forms: Free ammonia, Ammonical nitrogen, Nitrites and Nitrates. Source
of nitrogenous organic matter for sewage are mainly animal and human waste. Ammonical
nitrogen (NH3 –N) indicates quantity of nitrogen present in sewage before the decomposition of
organic matter is started. Nitrates indicates the presence of fully oxidized organic matter in sewage.
Therefore the determination of Ammonical nitrogen (NH3 –N) and Nitrate nitrogen (NO3 –N) are
important in sewage.
Ammonical nitrogen (NH3 –N)
NH3 –N in the present study varies from 19.5-29.7 mg/L, 23.2-34.8 mg/L and 17.5-21.6 mg/L for
the Influent of STP Raipur Kalan, Raipur Khurd and Mohali respectively. Average Influent value
of NH3 –N recorded was 25.9 mg/L, 27.7 mg/L and 19.6 mg/L for the Influent of STP Raipur
Kalan, Raipur Khurd and Mohali respectively indicating little bit variation in NH3 –N Influent for
the above three STP’s.
Effluent value for NH3 –N was recorded in the range of 28.8-38.3 mg/L, 28.1-3.8 mg/L and 17.6-
24.5 mg/L for STP Raipur Kalan, Raipur Khurd and Mohali respectively. Average Effluent value
for NH3 –N recorded was 25.9 mg/L, 27.7 mg/L and 19.6 mg/L of STP Raipur Kalan, Raipur
Khurd and Mohali respectively. Effluent value of increases than the influent value in all the
months during the duration of study of STP Raipur Kalan, indicating that nitrogenous organic
matter is decomposed properly and and NH3 is evolved as an end product. Moreover Average
Effluent value for NH3 –N of all the three STP’s was under permissible limit according to CPCB
Effluent Discharge Standards into Inland Surface water.

82
Nitrate nitrogen (NO3 –N)
Nitrate is made in the human body, the rate of production being influenced by factors such as
exercise. Therefore presence of nitrates in the wastewater is one of the indicators of contact with
human wastes.
NO3 –N value was recorded in the range of 1.7-4.7 mg/L, 2.4-5.9 mg/L and 3.3-5.2 mg/L for the
Influent of STP Raipur Kalan, Raipur Khurd and Mohali respectively. Average Influent value of
NO3 –N recorded was 3.1 mg/L, 4.1 mg/L and 4.4 mg/L for the Influent of STP Raipur Kalan,
Raipur Khurd and Mohali respectively indicating that NO3 –N content in the inlet of all the three
STP’s were almost the same as same amount of nitrogenous organic matter entered in all the above
three STP’s.
In the present study it was recorded that Effluent value for NO3 –N varies from 1.3-3.2 mg/L, 1.4-
2.3 mg/L and 1.2-2.4 mg/L for the Effluent of STP Raipur Kalan, Raipur Khurd and Mohali
respectively. Average Effluent value for NO3 –N recorded was 1.9 mg/L, 1.7 mg/L and 1.6 mg/L
of STP Raipur Kalan, Raipur Khurd and Mohali respectively indicating that NO3 –N content in the
outlet of all the three STP’s were almost the same. Moreover Average Effluent value for NO3 –N
of all the three STP’s was under permissible limit according to CPCB Effluent Discharge
Standards into Inland Surface water.
Phosphate (PO4- )
Phosphorous occurs in wastewater as phosphates. The source of phosphates to sewage are mainly
due to detergents, they are added during laundering or other cleaning, because these materials are
major constituents of many commercial cleaning preparations. Organic phosphates are formed
primarily by biological processes. They are contributed to sewage by body wastes and food
residues, and may be formed from orthophosphates in the biological treatment processes or by
receiving water biota. Phosphates also occur in bottom sediments and biological sludge, both as
precipitated inorganic forms and incorporated into organic compounds.
PO4- value varies from 11.6-14.9 mg/L, 15.2-20.2 mg/L and 13.5-24.8 mg/L for the Influent of
STP Raipur Kalan, Raipur Khurd and Mohali respectively. Average Influent value of PO4-
recorded was 15.3 mg/L, 17.5 mg/L and 18.1 mg/L of STP Raipur Kalan, Raipur Khurd and

83
Mohali respectively indicating that phosphates content entering the inlet of all the above three
STP’s was near about the same.
In the present study PO4- value varies from 3.8-5.5 mg/L, 3.9-7.8 mg/L and 1.4-2.9 mg/L for the
Effluent of STP Raipur Kalan, Raipur Khurd and Mohali respectively. Average Effluent value of
PO4- recorded was 15.3 mg/L, 17.5 mg/L and 18.1 mg/L of STP Raipur Kalan, Raipur Khurd and
Mohali respectively. Average Effluent value of PO4- recorded was 4.8 mg/L, 5.0 mg/L and 2.1
mg/L of STP Raipur Kalan, Raipur Khurd and Mohali respectively.
Moreover Average Effluent value for PO4- of STP Raipur Kalan and Mohali was under permissible
limit according to CPCB Effluent Discharge Standards into Inland Surface water, but Average
Effluent value for PO4- of STP Raipur Khurd was exactly upto permissible limit according to
CPCB Effluent Discharge Standards into Inland Surface water.
Determination of all the above the three nutrients were important also from the point of view that
there increased concentration in effluent may cause eutrophication of river Ghaghar, in which the
effluent of all the above three STP’s is disposed of. Hence proper concentration of all the above
three nutrients should be maintained before discharging the sewage effluent into the water body.

84
CHAPTER 5
CONCLUSIONS AND RECOMMENDATIONS
5.1 CONCLUSIONS
From the study conducted for the comparison of 3 STP’s in the vicinity of Chandigarh city
following conclusions are made:
Physico-Chemical and Biological Parameters evaluated for STP Mohali was under
permissible limit according to CPCB Effluent Discharge Standards into Inland Surface
Water during the course of study.
Since out of 30 MGD of STP, Mohali 10 MGD treated waste water is reused for Irrigation
purpose in various gardens and lawns of Sector: 19, 20, 21, 29, 30, 33, 34, 36, 40, 42, 43,
44, 46, 47, 48, 51 and 52 of Chandigarh city therefore after evaluating various Physico-
Chemical and Biological Parameters for this STP it was revealed that all the parameters
evaluated were under permissible limit according to CPCB Effluent Discharge Standards
into Land for Irrigation during the course of study. Hence Effluent from this STP is safer for
agricultural use.
BOD value of the Effluent of STP Raipur Kalan and Raipur Khurd was not under
permissible limit during the course of study and Average Phosphate value of Raipur Khurd
was exactly upto permissible limit during the duration of study according to Central
Pollution Control Board (CPCB) General Standards for the Discharge of Environmental
Pollutants Part –A: Effluents, into Inland Surface Water according to The Environment
(Protection) Rules, 1986 Schedule-VI.
Also it was revealed from the performance study that efficiency of the three STP’s
mentioned above was poor with respect to removal of TDS (Total Dissolved Solids) in
contrast to the removal /reduction efficiency in other parameters like TSS (Total Suspended
Solids), BOD (Biochemical Oxygen Demand) and COD (Chemical Oxygen Demand).

85
The order of removal/reduction efficiency was 1.TDS(39%) 2.COD(56%) 3.TSS(76%)
4.BOD(79%), 1.TDS(46%) 2.TSS(51%) 3.BOD(73%) 4.COD(78%) and 1.TDS(55%)
2.COD(75%) 3.TSS(78%) 4.BOD(88%) respectively in Raipur Kalan STP, Raipur Khurd
STP and “Diggian” Mohali STP.
In comparison with each other, out of the three STP’s, “Diggian” STP Located at Mohali
showed better results for the effluent, its removal /reduction efficiency for BOD is 88% and
is highest among Raipur Kalan STP and Raipur Khurd STP which is 79% and 73%
respectively. The greater removal /reduction efficiency for STP Mohali is attributed to the
chemical treatment employed at this STP in the form of Tertiary Treatment of sewage.
From the evaluation it is further concluded that Mohali STP based upon MBBR technology
have more stable results than Raipur Kalan STP, based upon UASB technology and Raipur
Khurd STP, based upon ASP technology.
The order of overall performance for the technologies studied in different STP’s are:
1.MBBR 2.UASB 3.ASP which proves that MBBR technology is ahead to UASB and
ASP technology in the treatment of sewage
5.2 RECOMMENDATIONS
MBBR technology is recommended over ASP and UASB technology because of the
following reasons (Advantages of MBBR technology over ASP and UASB technology):
It has established itself as a well proven, robust and compact reactor for the wastewater
treatment.
The efficiency of the reactor has been demonstrated in many process combination, both
for BOD removal and nutrient removal.
It can be used for small as well as large plants. The primary advantage of the process as
compared to ASP technology is its compactness and no need for sludge recirculation.
The advantages over other biofilm processes, is its flexibility, one can use almost any
reactor shape and one can choose different operating loads in a reactor volume, simply

86
by choice of carrier filling. This technology can also be used for industrial waste water,
particularly in the food industry and paper and pulp industry.
UASB technology is recommended over ASP technology because of the following reasons:
It is simple and offer reasonable performance at presumably low cost of operation and
maintenance.
No electrical energy and mechanical equipments are required in UASB.
It does not require any external aeration and thus the cost associated with energy and
devices required for aeration and their maintenance are cut to zero.
Excess sludge production from this system is negligible compared to ASP, again
significantly reducing the cost for sludge handling as treatment as treatment and
disposal of sewage sludge is technically cumbersome and economically a heavy
burden.
The UASB technology can be cost effective and viable option for the treatment of
municipal sewage over ASP, especially for low-income countries.
Final Recommendation for treatment of sewage:
1. MBBR Technology
2. UASB Technology
3. ASP Technology
5.3 Future Scope of Work
Future Scope for UASB Technology:
The system helps to lower only two parameters of wastewater which are BOD and
Suspended Solids (SS). Eventually, the system does not help in the removal of toxic
pollutants, like heavy metals, which may present in some of the wastewater. The
UASB system will therefore have to be supported by subsidiary disposal systems to
remove the toxic pollutants, if present in the wastewater.

87
Like all other anaerobic high rate systems, UASB reactors also require larger quantity
of organic matter as compared to the aerobic reactors, because the growth of aerobic
bacteria per unit of organic matter is about 10-20 times the growth of anaerobes. In
order to support microbial growth and metabolism in UASB systems, therefore, 20 to
30 times more of organic matter has to be metabolized, as compared to that in Aerobic
systems. For the success of UASB, it therefore becomes necessary to ensure the
presence of at least 10% of suspended solids in the wastewater.
Future Scope for ASP Technology:
The treatment systems must be properly operated and maintained, source of raw
sewage need to be identified, and existing facilities should be upgraded accordingly.
As for proper operation and maintenance, there is a need for trained and experienced
workers to analyze the treatment performance at defined time interval and also the
handle the machinery properly.
STP should be utilized to full capacity so as to control the quality of final effluent.
Bulking of sludge is a common trouble which has to be controlled, especially when
industrial wastewater with high carbohydrate content or antiseptic properties are
present.
The quantity of returned sludge has to be adjusted every time, as and when there is a
change in the quantity of sewage flow for the proper efficiency of the plant.
Future Scope for MBBR Technology:
The most important recommendation for MBBR technology is that Design criteria
should be well established for its proper functioning.
Since energy production is not there in MBBR technology hence measures should
be taken to enhance the production of energy in these technologies.

88
REFERENCES
APHA –AWWA-WPCF,2005. RStandard Methods for Examination of Water and Wastewater, 21st
edition. American Public Health Association, Washington, DC,USA.
Abid Ali khan,Rubia Zahid Gaur,V.K Tyagi,Anwar Khursheed, Benilew, Indu Mehrotra and A.A
Kazmi, Sustainable option of post treatment UASB,Resources ,Conservation and
Recycling,Vol.55,Issue 12,Oct (2011),pp.1232-1251
A.P Annachhatre and S.M.R Bhamidimarri, Microbial attachment and growth in fixed films
reactor: Process start up considerations, Biotechnology Advances, Vol.10, Issue 1, (1992) pp.69-91
Amit Sonune and Rupali Ghate, Developments in wastewater treatment methods, Journal of
Desalination, Vol.167, 15 Aug (2004), pp 55-63
A. Tawfik Æ F. El-Gohary Æ H. Temmink. Treatment of domestic wastewater in an up-flow
anaerobic sludge blanket reactor followed by moving bed biofilm reactor,
Bioprocess Biosyst Eng (2010) 33:267–276
Bjorn Rusten, Mike Mcoy, Robert Proctor, Jon G.Siljudalen., The innovative moving bed biofilm
reactor/solids contact reaeration process for secondary treatment of municipal sewage,Water
Environment Research, Vol.70, No 5 (Jul-Aug 1998) pp.1083-1086
Chidozie Charles Nnaji, A review of the Upflow Anaerobic Sludge Blanket reactor, Jouranl of
Desalination and water Treatment (2013) pp.1-12
Colmenarejo, M. F., Rubio, A., Sanchez, E., Vicente, J., Gracia,M. G., & Bojra, R. (2006).
Evaluaton of municipal wastewater treatment plants with different technologies at
Las-Rozas, Madrid (Spain). Journal of Environmental Management, 81, 399–404.
D. Pokhrel, T. Viraraghavan. Treatment of pulp and paper mill wastewater—a review, Science
of the Total Environment 333 (2004) 37– 58
89
Dilip M. Ghaitidak & Kunwar D. Yadav (2013). Characteristics and treatment of greywater—a
review, Environ Sci Pollut Res DOI 10.1007/s11356-013-1533-0
E.Hosseini Koupaie, M.R Alavi Moghaddam and H. Hashemi, Comparison of overall performance
between “Moving Bed” and Conventional Sequencing Batch Reactor,Iranian Journal of
Environmental Health Science& Engineering, (2011), pp.235-244
Enrique J. La Motta, Eudomar Silva, Adriana Bustillos,Harold pardon and Jackeline Luque,
Combined Anaerobic/Aerobic Secondary Municipal waste water treatment:Pilot-Plant
Demonstration of the UASB/Aerobic Solids contact System, Journal of Environmental
Engineering, Vol.133, Issue 4 (April 2007)
Hossein Hazrati and Jalal Shayegan, Upgrading Activated Sludge Systems and reduction in excess
Sludge, Bioresource Technology, Vol.102, Issue 22, Nov (2011),pp.10327-10332
Husham T.Ibrahim, He Qiang, Wisams. AI-Rekabi and Yang Qiqi, Improvenments in Biofilm
Processes for wastewater treatment,Pakistan Jurnal of Nutrition, (2012),pp.610-636
Hospido A, Moreira MA, FeijooG (2007): A Comparison of Municipal Wastewater
TreatmentPlants for Big Centres of Population in Galicia (Spain). Int J LCA13 (1) 57–64
I garashi, T., watanbe, Y, asano, T. and tambo, N. the moving bed biofilm reactor, Water
Environmental Engineering and Reuse of Water, Hokkaido Press 1999,p. 250-305
Kadiya Calderón , Jaime Martín-Pascual , José Manuel Poyatos , Belén Rodelas, Alejandro
González-Martínez and Jesús González-López. Comparative analysis of the bacterial diversity in a
lab-scale moving bed biofilm reactor (MBBR) applied to treat urban wastewater under
differentoperational conditions, Bioresource Technology 121 (2012) 119–126

90
Kwan- Chowlin,Ping and Zhenxiang Yang, Technical Review on the UASB process, International
Journal of Environmental Studies,Vol.39, Issue 3, (1991)
Lucas Seghezzo,Grietje.Zeeman, Jules B.Van Lier,H.V.M hamelers,gatzeLettings, A Review: The
anaerobic treatment of sewage in UASB and EGSB reactors, Journal of Bioresource
Technology,Vol.65, Issue 3, Sept (1998),pp.175-190
Madun Tandukar,Izarul Machar, Shigeki Vemura,Akiyoshi Ohashi and Hideki Harada, Potential of
combination of UASB and DHS reactor as a Noval Sewage treatment system for developing
countries: Long term Evaluation,Journal of Environmental Engineering,Vol.132, Issue 2,Feb
(2006)
Madan Tandukara, A. Ohashib and H. Harada.Performance comparison of a pilot-scale UASB and
DHS system and activated sludge process for the treatment of municipal wastewater, WAT ER RE
S E ARCH 41 (2007) 2697 – 2705
Mark W.Fitch, Adrid Lam,Robeet Segar. Biological Fixed Film Systems; Water Environment
Research, vol.72, No.5
Markus Boller, Small waste water treatment plants: A Challenge to waste water engineers, Journal
of Water Science and Technology,Vol.35, Issue 6, (1997), pp.1-2
Metcalf and Eddy Inc., (2003), “ Wastewater Engineering- Treatment, Disposal and Reuse”, 4th
Edition, Tata McGraw Hill Publishinh Co. Ltd., New Delhi.
M. Von Sperling, V.H Freire and C.A De Lemos Chernicharo, Performane Evalution of a UASB-
Activated Sludge System treating Municipal wastewater, Journal of Water Science and
Technology,Vol.43,(2011), pp.323-328
M.Ji, J. Yu, H. Chen and P.L.Yue, Removal of slowly biodegradable COD in combined
Thermophilic UASB and MBBR systems, Journal of Environmental Engineering, Vol.22, Issue 9,
(2001), pp.1069-1079

91
Muhummad Asif, Latif, Rumana Gtrufran, Zularisam Abdul Wahid, Anwar Ahmad, Integrated
application of Upflow Anaerobic Sludge Blanket Reactor for the treatment of wastewater, Journal
of Water Resource,Vol.45, Issue16, 15 Oct (2011), pp. 4683-4699
M. Molinos-Senante, M. Garrido-Baserba , R. Reif , F. Hernández-Sancho and M. Poch.
Assessment of wastewater treatment plant design for small communities:Environmental and
economic aspects, Science of the Total Environment 427–428 (2012) 11–18
Nidal Mahmoud, Grietje Zeeman, Hoob Gijzen, Gatze Lettinga, Anaerobic sewage treatment in
one stage UASB reactor and a Combined UASB digestor system, Journal of Water Research,
Vol.38, Issue 9, May(2004), pp.2348-2358
Operation and Manitenance Manual for Sewage Treatment Plant, Municipal Corporation,
Chandigarh.
Priyanka Jamwal, Atul K. Mittal and Jean-Marie Mouchel. Efficiency evaluation of sewage
treatment plants with different technologies in Delhi (India), Environ Monit Assess (2009)
153:293–305
Pradip P. Kalbar, Subhankar Karmakar , Shyam R. Asolekar. Technology assessment for
wastewater treatment using multiple-attribute decision-making, Technology in Society 34 (2012)
295–302
Ravichandran.M and Joshua Amarnath.D. Performance Evaluation of Moving Bed Bio-Film
Reactor Technology for Treatment of Domestic Waste Water in Industrial Area at MEPZ (Madras
Exports Processing Zone), Tambaram, Chennai, India, Elixir Pollution 53 (2012) 11741-11744
Ravi Kumar, P., Liza Britta Pinto and Somashekar, R.k . Assessment of the efficiency of sewage
treatment plants: A comparative study between Nagasandra and Mailasandra sewage treatment
plant, Kathmandu University Journal of Science,Engineering and Technology, Vol.6,No. II, Nov,
2010,pp 115-125

92
R.A Barbosa and G.L Sant Anna Jr, Treatment of raw domestic sewage in an UASB reactor,
Journal of Water Research, Vol.23, Issue 12, Dec(1989), pp.1483-1490
Siewhui Chong, Tushar kanti Sen, Ahmet kayadp and Ha Ming Ang, The performance
enhancement of UASB for domestic Sludge treatment- A state of the art review, Journal of Water
Research, Vol.46, Issue 11, July (2012), pp. 3434-3470
Sheng Chen, Dezhi Sun, and Jong-Shik Chung. Treatment of pesticide wastewater by moving-bed
biofilm reactor combined with Fenton-coagulation pretreatment, Journal of Hazardous Materials
144 (2007) 577–584
Swayer , Mc Carty and Parkin.Chemistry for environmental engineering and science, fifth edition ,
Tata Mc Graw –Hill.
S.K Garg. Sewage Disposal and Air Pollution Engineering, Environmental Engineering (Vol.II)
Wen K. Shieh and John D. Keenan, Fluidized Bed Biofilm reactor for wastewater treatment,
Journal of Advances in Biochemical Engineering/Biotechnology, Vol.33, (1986), pp. 131-169
Water and wastewater testing (A laboratory manual), R.P Mathur.
Websites Referred
APHA-AWWA-WPCF, Standard Methods for the Examination of Water and Wastewater,
American Public Health Association www.apha.org
Central Pollution Control Board (CPCB) www.cpcb.nic.in
Science Direct: www.sciencedirect.com
Wikipedia www.wilipedia.org