thin supported silica membranes - university of twente · thin supported silica membranes...
TRANSCRIPT
THIN SUPPORTED SILICA MEMBRANES

Dissertation committee:
Chairman: Prof. dr. ir. J.A.M. Kuipers, University of Twente
Promotor: Prof. dr. ing. D.H.A. Blank, University of Twente
Co-promotor: Prof. dr. ir. A. Nijmeijer, Shell / University of Twente
Assistant promotor: dr. H. J. M. Bouwmeester, University of Twente
Committee members: Prof. dr. ir. J. C. Schouten, Technical Univ. Eindhoven
Prof. dr. ir. L. Lefferts, University of Twente
dr. ir. H. Wormeester, University of Twente
dr. ir. N. E. Benes, Technical Univ. Eindhoven
dr. R. Bredesen, SINTEF, Norway
The research described in this thesis was carried out in the Inorganic Materials Science group and the Inorganic Membrane group at the University of Twente and has been financially supported by the EU project number GRD1-2001-40315.
Thin Supported Silica Membranes
T. Zivkovic
ISBN 978-90-365-2600-5
Copyright © 2007 by T. Zivkovic
All rights reserved.
Printed by Wöhrmann Print Service BV, Zutphen, The Netherlands.

THIN SUPPORTED SILICA MEMBRANES
DISSERTATION
to obtain the doctor's degree at the University Twente,
on the authority of the rector magnificus, prof. dr. W.H. M. Zijm,
on account of the decision of the graduation committee, to be publicly defended
on Thursday 29th November 2007 at 16.45
by
Tijana Zivkovic born on 10th October 1973.
in Sarajevo, Bosnia

This dissertation is approved by promotor Prof. dr. ing. D.H.A. Blank, co-promotor Prof. dr. ir. A. Nijmeijer
and assistant promotor Dr. ir. H. J. M. Bouwmeester

Be the change you want to see in the world
M. Gandhi


VII
Table of Contents
1 Introduction 1
1.1 Hydrogen separation membranes 2
1.2 Nanofiltration 5
1.3 Scope of this thesis 6
1.4 Thesis outline 6
1.5 References 8
2 Gas transport efficiency of ceramic membranes:
Comparison of different geometries 11
2.1 Introduction 12
2.1.1 Base cases 13
2.2 Theory 14
2.2.1 Flux expressions 15
2.2.2 Comparison 17
2.2.3 Numerical solution 17
2.3 Results and discussion 18
2.3.1 Unary system 18
2.3.2 Binary system, MC geometry 23
2.4 Conclusions 26
2.5 Acknowledgements 27
2.6 List of symbols 28
2.7 References 30
3 Transport of binary mixtures through microporous silica
membranes 31
3.1 Introduction 32
3.2 Theory 32
3.2.1 Binary transport through a microporous membrane 32
3.2.2 Spectroscopic ellipsometry study of sorption in thin
porous layers 33

VIII
3.3 Experimental 35
3.3.1 Membrane materials 35
3.3.2 Gas permeation in the presence of water vapor 36
3.3.3 Spectroscopic ellipsometry 37
3.4 Results and Discussion 38
3.4.1 Water sorption in membrane layers
by spectroscopic ellipsometry 38
3.4.1.1.1 Fitting procedure 38
3.4.1.1.2 Analysis of the modelled data 40
3.4.2 Helium permeance in the presence of water vapour 44
3.4.3 Correlation of the He permeation with water sorption data 45
3.5 Conclusions 46
3.6 References 48
4 Characterization and transport properties of surfactant-
templated silica layers for membrane applications 51
4.1 Introduction 52
4.2 Experimental 53
4.3 Results and discussion 54
4.4 Conclusions 58
4.5 References 60
5 Electrolyte retention of supported bi-layered nanofiltration
membranes 61
5.1 Introduction 62
5.2 Theory 63
5.2.1 Effect of two separating layers on ion retention 68
5.3 Experimental 69
5.3.1 Membrane materials 69
5.3.2 Determination of membrane charging behavior 69
5.3.3 Water permeation 70

IX
5.3.4 Retention experiments 70
5.4 Results and discussion 71
5.4.1 Membrane materials 71
5.4.2 Comparison of measured and calculated retention 72
5.4.3 Effect of solvent pore viscosity on retention 75
5.4.4 Membrane pH stability 76
5.4.5 Influence of model input parameters on predicted
overall retention 78
5.5 Conclusions 79
5.6 Acknowledgements 80
5.7 References 81
Appendix 85
A.1 Liquid Permeation 86
A.2 Determination of Membrane Charging Behaviour 88
A.3 Zeta Potential 90
A.4 References 91
6 Evaluation and Recommendations 93
6.1 Gas transport in microporous silica membranes 94
6.2 Spectroscopic ellipsometry 95
6.3 Supported bi-layered membranes for electrolyte retention 96
6.4 References 97
Summary 99
Samenvatting 101
Acknowledgements 103

X

Chapter 1
General Introduction
General Introduction
2
Abstract:
This thesis focuses on the performance and transport properties of hydrogen-
selective thin supported silica membranes, the improvement of H2-selective
membrane properties by the use of templating techniques, and the application of
the latter in a bi-layer concept for nanofiltration membranes. In addition, the
use of spectroscopic ellipsometry as a non-destructive technique for the
characterization of microporous membranes is discussed. In this chapter a
general overview is given on hydrogen-selective membranes and nanofiltration.
This section is concluded by presenting the scope and outline of this thesis.

Chapter 1
3
1.1 Hydrogen Separation Membranes
Hydrogen separation, recovery and production are of increased importance today due to a high demand for hydrogen as a clean fuel and as an industrial component. Hydrogen–selective membranes can offer an energy-efficient alternative to the more conventional hydrogen separation methods, such as cryogenic separation or pressure swing adsorption (PSA) [1]. Inorganic (ceramic) microporous membranes for hydrogen separation are of interest for applications in petrochemical industry, especially at high temperature (300-600˚C), because of their good thermal, chemical and mechanical properties relative to polymeric membranes [2].
Inorganic membranes can be classified into non-porous (dense) and porous membranes. Non-porous membranes have a dense separation layer usually made from palladium or from alloys of palladium with silver or nickel. They are primarily used for a highly selective separation of hydrogen at high temperature. However their permeability is generally lower than that of porous inorganic membranes [3]. Other disadvantages of dense membranes include: sensitivity to chlorine, sulphur, olefins, reduction of mechanical stability due to formation of palladium hydride, and formation of non-uniform structure due to migration of alloying elements [4]. Recently, it was reported that Pd alloys containing iron [5] or copper [6] show substantially higher permeability compared to pure Pd. Furthermore, such alloys show to be more resistant to hydrogen embrittlement and to poisoning by H2S.
Several types of microporous membranes for hydrogen separation can be distinguished in terms of the membrane material: silica, zeolite and carbon [7], [8]. Carbon membranes exhibit low hydrogen permeation and instability in oxygen-containing atmosphere above 200 °C. Furthermore they are prone to plugging by the adsorption of the organic species [9]. Zeolite membranes generally have a moderate permselectivity. Their hydrogen flux is an order of magnitude lower than that of sol-gel derived silica membranes [10],[11]. The former is due to the inherent existence of the voids between zeolite grains, while the later is due to a considerable thickness of the zeolite layer (2-50µm) needed to prevent the pinhole formation.
This thesis focuses on microporous silica membranes that generally have a high hydrogen permeation (increasing with temperature) and a moderate to high permselectivity. Stability in steam-containing atmospheres at high temperature, however, remains an issue to be solved.
Most common silica membrane configuration is an asymmetric one consisting of several layers. A thin separative layer with pores in the range of the

General Introduction
4
size of the permeating gas molecules is situated on top of one or more supporting layers of larger thickness and pore size. The structure of the state-of-the-art microporous silica membrane is presented in Fig. 1.1 and in Table 1.1 [12].
Figure 1.1 State-of-the-art H2-selective membrane
(SEM image of a cross-section) [12]
Layer Top Intermediate Support
Material Silica γ-Alumina α-Alumina
Thickness 30-50 nm 3 µm 2 mm
Pore size 3-5 Ǻ 4 nm 80-120 nm
Table 1.1. Ceramic membrane structure [12]
On top of the macroporous support there is a mesoporous intermediate layer, which bridges the gap between the large pore-sizes of the support and the micropores of the top layer. The support layer is usually made of α-Al2O3, which is mechanically strong and chemically stable over a broad pH range. The intermediate layer, consisting of γ-alumina, provides a smooth surface for the selective silica layer and suppresses the penetration of the silica sol into the large pores of the support. It also reduces the number of coating steps to apply the selective layer, which can consequently be thinner and, hence, more permeable [13, 14].
Generally there are two major synthesis routes for the production of hydrogen selective silica membranes: the sol-gel method and the chemical vapour deposition / infiltration (CVD, CVI). Current CVD/CVI silica membranes feature a hydrogen permeance upper limit of 10-8 mol m-2 s-1 Pa-1 and a value for the permselectivity of hydrogen to other molecules of 104 [8], [16]. The sol-gel derived microporous silica membranes provide higher permeance in

Chapter 1
5
the order of 10-7 -10-6 mol m-2 s-1 Pa-1 while the values of the permselectivity are in the order of 103. These values are suitable for application of microporous silica membranes in the petrochemical industry [8].
State-of-the-art microporous silica membranes exhibit good gas separation properties, but their hydrothermal stability remains to be improved because membrane degradation at high temperatures can occur in humid atmosphere [17]. Improvements in the hydrothermal stability can possibly be achieved by doping of the parent oxide with oxides of transition metals (Ti, Zr), or by removal of silica surface hydroxyl groups [18].
Less resistance to the gas flow and, hence, improved permeability can be acquired if a thinner defect-free top-layer can be obtained that features a narrow pore size distribution in the region of the H2 kinetic diameter (~3 Å). Such thin defect-free layer requires a smooth support-layer with a structured porosity, which can be obtained by using templating techniques.
For most gasses the largest resistance for the gas transport is situated in the thin top silica layer. For gasses with high permeance values (H2, He), also the α-alumina support layer imposes a great resistance to the gas transport due to its large thickness and disordered structure (relatively high contribution of dead-end pores and tortuousity) [18].
Since the intermediate γ-alumina layer is rather porous (50%) and thin (1.5-3µm) [18], it has a small contribution to the gas flow resistance. However, the infiltration of silica in the γ-alumina layer can lead to an increase of the effective thickness of the silica layer. A reduction of the infiltration of silica in the intermediate layer can be obtained if between the two layers an additional thin layer is introduced. This may enable the deposition of a thinner top layer, resulting in a lower H2 transport resistance and, hence, a higher H2 permeability [19].
1.2 Nanofiltration
The use of surfactant templated layers providing more uniform pore-size, lower tortuosity and higher porosity, is interesting for the enhancement of transport properties not only in case of gas transport, but also in nanofiltration applications where the surfactant templated layers can be used as selective layers.
Nanofiltration is a pressure-driven membrane separation process in which particles and the dissolved species smaller than 2nm are retained (IUPAC, [20]). Applications include the reduction of water hardness and the rejection of organic or metallic solutes from aqueous solutions [21]. The prevalent separation

General Introduction
6
mechanism is the electrostatic exclusion where the charged solutes are retained by the ionisable groups on the membrane surface. The size exclusion can also play a role depending on the size of the pores and the solutes. The transport description elaborated in Chapter 5 and in the references therein is based on the Maxwell Stefan theory. It is applicable in case of the multi-component mixture since it explicitly considers the friction between the species.
Nanofiltration (NF) materials can be of an organic, inorganic or composite nature. A common inorganic NF material is alumina, while titania and zirconia offer a better pH stability in a very acid and alkaline aqueous solution compared to alumina [22], [23]. Generally inorganic membranes have a higher permeability due to a larger pore-size (>1nm) compared to the polymeric ones [24]. Most common polymeric materials used are polyethersulfones (PES), cellulose acetate (CA), and aromatic polyamides (PA) [25, 26].
A NF membrane performs ion separation best at pH values far from its iso-electric point (IEP), as this corresponds to a high membrane charge. Apart from the pH, the membrane charge is also a strong function of the type of ions present in the electrolyte solution and their concentration [27]-[29]. As the pH of most aqueous electrolyte solutions is close to 6, NF membrane materials with an IEP of 6-8, such as titania [30], zirconia (IEP≈6) and γ-alumina (IEP≈8), will perform poorly in practical applications. Additionally, in the industrial applications one would like to use a membrane over a wide pH range (e.g., to selectively remove differently charged species). In this case the membrane’s IEP is often included in the operating pH range and consequently the membrane separation performance will be poor there. A concept of a membrane consisting of a mixture of the two materials with a different IEP may offer a solution for the above problems, as will be demonstrated in Chapter 5.
1.3 Scope of this thesis
The scope of this thesis includes the performance and transport properties of hydrogen-selective thin supported silica membranes, the improvement of H2-selective membrane properties by the use of the templating techniques, and the application of the latter in a bi-layer concept for nanofiltration membranes. In terms of the gas transport limitations, the specific structural properties of microporous silica membranes and the effect of different support geometries are discussed. An improvement of the gas transport is considered by reducing the transport limitations imposed by the layer thickness. This is considered by applying a selective layer over a structured one obtained by using templating techniques. Another aspect of this thesis concerns the use of the optical characterisation techniques (spectroscopic ellipsometry) on microporous silica

Chapter 1
7
enabling a non-distructive assessment of layer thickness, porosity, and sorption properties.
1.4 Thesis outline
In Chapter 2 the gas transport efficiency of the microporous ceramic membranes with different support geometries is analyzed using the dusty gas model (DGM). The contribution of different transport mechanisms is accounted for. Both unary and binary gas systems are discussed.
In Chapter 3 the transport of binary mixtures containing inert mobile component such as H2, and a condensable component such as H2O through a microporous silica membrane is investigated. The correlation between the flux of the more mobile component and the sorption properties of the condensable component is discussed and is associated with the structural transport limitations of the microporous silica membranes.
Chapter 4 describes the improvement of the membrane performance in terms of the hydrogen separation due to the incorporation of an additional intermediate surfactant templated silica layer. Synthesis, characterization and performance of the modified microporous silica membrane are presented and compared with that of a standard silica membrane.
Chapter 5 describes the concept of a bilayered nanofiltration membrane for the retention of ions. The composite membrane consisting of a surfactant templated silica layer and a γ-alumina layer is analyzed in terms of the retention of monovalent (Na+, Cl-) ions over the pH range 4-10.
An evaluation of the major results presented in this thesis and recommendations for further research are given in Chapter 6.
The Appendix describes several characterization techniques for nanofiltration membranes including: liquid permeation, determination of the membrane charging behavior and zeta potential measurements.

General Introduction
8
1.5 References
[1] http://www.oit.doe.gov/chemicals/factsheets/hydrogenrecovery.pdf
[2] G.D. West, G.G. Diamond, D. Holland, M.E. Smith, M.H. Lewis, “Gas transport mechanisms through sol–gel derived templated membranes”, Journal of Membrane Science, 203, 53-69 (2002)
[3] A. F. Ismail, L.I.B. David, “A review on the latest development of carbon membranes for gas separation”, Journal of Membrane Science, 193, 1, 1-18 (2001)
[4] J.N. Armor, “Membrane catalysis: where it is now, what needs to be done?”, Catalysis Today, 25, 199-207 (1995)
[5] K.J. Bryden , J.Y. Ying, “Nanostructured palladium¯ iron membranes for hydrogen separation and membrane hydrogenation reactions”, Journal of Membrane Science, 203, 1-2, 29-42 (2002)
[6] S-E. Nam and K-H. Lee, “Hydrogen separation by Pd alloy composite membranes: introduction of diffusion barrier”, Journal of Membrane Science, 192, 1-2, 177-185 (2001).
[7] H.A. Meinema, R.W.J. Dirrix, H.W. Brinkman, R.A. Terpstra, J. Jekerle, P.H. Kosters “Ceramic Membranes for Gas Separation – Recent Developments and State of the Art” Interceram 54, 2, 86 (2005)
[8] R. Bredesenm K. Jordal, O. Bolland “High-temperature Membranes in Power Generation with CO2 Capture” Chemical Engineering and Processing 43, 1129 (2004)
[9] M. Tsapasis, G.R Gavalas, MRS Bulletin 24, 3, 30-35 (1999)
[10] J. Caro, M. Noack, P. Kolsch, R. Schafer, Microporous Mesoporous Materials, 38, 3 (2000)
[11] Y.-S.Lin, I. Kumakiri, B. N. Nair, H. Alsyouri, Separation and Purification Methods 31 (2), 229 (2002)

Chapter 1
9
[12] R.M. de Vos, H. Verweij, “Improved performance of silica membranes for gas separation”, Journal of Membrane Science, 143, 1-2, 37-51 (1998)
[13] V. Richard, E. Favre, D. Tondeur and A. Nijmeijer, “Experimental study of hydrogen, carbon dioxide and nitrogen permeation through a microporous silica membrane”, Chemical Engineering Journal, 84, 3, 593-598 (2001)
[14] C.J. Brinker, T.L. Ward, R. Sehgal, N.K. Raman, S.L. Hietala, D.M. Smith, D. Hua, T.J. Headley, “Ultramicroporous” silica-based supported inorganic membranes, Journal of Membrane Science, 77, 165 (1993)
[15] K.Kuraoka, N. Kubo, T. Yazawa, “Microporous Silica Xerogel Membrane with High Selectivity and High Permeance for Carbon Dioxide Separation”, Journal of Sol-Gel Science and Technology, 19, 515-518 (2000)
[16] S.T. Oyama, D. Lee, S.Sugiyama, K. fukui, Y. Iwasawa, “Characterization of a highly selective hydrogen permeable silica membrane”, Journal of Material Science, 35, 5213-5217, (2001)
[17] H. Imai, H. Morimoto, A. Tominaga, H. Hirashima, “Structural changes in sol-gel derived SiO2 and TiO2 films by exposure to water vapour”, Journal of Sol-Gel Science and Technology, 10, 45 (1997)
[18] N. Benes, A. Nijmeijer, H.Verweij, “Microporous Silica membranes, Recent advances in gas separation by microporous ceramic membranes”, Elsevier Science B.V. (2000)
[19] C-Y. Tsai, S.-Y. Tam, Y. Lu, C. J. Brinker, “Dual-layer asymmetric microporous silica membranes”, Journal of Membrane Science, 169, 2, 255-268 (2000)
[20] W. J. Koros, Y. H. Ma and T. Shimidzu “Terminology for Membranes and Membrane Processes IUPAC Recomendations”, Journal of Membrane Science 120, 149 (1996)

General Introduction
10
[21] P. R. Lakshminarayan, M. Cheryan, and N. Rajagopalan, “Consider Nanofiltration for Membrane Seapration”, Chemical Engineering and Processing 68-74 (1994)
[22] R. Vacassy, C. Guizard, V. Thoraval, L.Cot “Synthesis and Characterization of Microporous Zirconia Powders: Application in Nanofiltration and Nanofiltration Characteristics”, Journal of Membrane Science, 132, 109 (1997)
[23] J. Sekulic, J. E. ten Elshof, D.H.A. Blank, “A Microporous Titania Membrane for Nanofiltration and Pervaporation”, Advanced Materals 16, 1546 (2004)
[24] W. B. S. de Lint, “Transport of Electrolytes Through Ceramic Nanofiltration Membranes”, PhD Thesis, University of Twente, The Netherlands (2003)
[25] M. Mulder, “Basic Principles of Membrane Technology”, Kluwer Academic Press, Dordrecht, the Netherlands (1996)
[26] K.H. Choo, D.J. Kwon, K.W. Lee, S.J. Choi, “Selective removal of Cobalt Species using Nanofiltration Membranes”, Environmental Science and Technology, 6, 1330 (2002)
[27] S. De Lint, P.M. Biesheuvel and H. Verweij, “Application of the Charge Regulation Model to Transport of Ions through Hydrophilic Membranes: One-Dimensional Transport Model for Narrow Pores (Nanofiltration)”, Journal of Colloid Interface Science, 251, 131 (2002).
[28] Hall, D.R. Lloyd and V.M. Starov, “Reverse Osmosis of Multicomponent Electrolyte Solutions. Part II. Experimental Verification,” Journal of Membrane Science, 128, 39 (1997).
[29] J. Randon, A. Larbot, L. Cot, M. Lindheimer, S. Partyka, “Sulfate Adsorption on Zirconium Dioxide,” Langmuir, 7, 2654 (1991).
Chapter 1
11
[30] T. Van Gestel, C. Vandecasteele, A. Buekenhoudt, C. Dotremont, J. Luyten, R. Leysen, B. Van Der Bruggen and G. Maes, “Salt Retention in Nanofiltration with Multilayer Ceramic TiO2 Membranes,” Journal of Membrane Science, 209, 379 (2002).

12

13
Chapter 2
Gas Transport Efficiency
of Ceramic Membranes:
Comparison of Different Geometries*
*Published with modifications as “Gas Transport Efficiency of Ceramic Membranes: Comparison of Different Geometries” Journal of Membrane Science, Volume 236, Issues 1-2, 15 June 2004, Pages 101-108, T. Zivkovic, N. E. Benes and H. J. M. Bouwmeester

Gas Transport Efficiency of Ceramic Membranes: Comparison of Different Geometries
14
Abstract:
The effect of support geometry on the performance of asymmetric ceramic
membranes for gas separation is analyzed. Flat, tubular and multichannel
geometries are investigated using the Dusty Gas Model (DGM) to describe
transport of a multicomponent gas mixture through the macroporous support. It
is shown that (a) the support geometry significantly affects membrane
performance, (b) in the case of the multichannel geometry, the inner channels do
not contribute efficiently to the overall gas transport, (c) best performance in
terms of both flux and permselectivity is obtained for tubular geometry. It is
furthermore clarified that for an accurate description of the transport behaviour
it is crucial to properly account for the relative contributions of all different
transport mechanisms (Knudsen diffusion, bulk diffusion and viscous flow)
included in the DGM.

Chapter 2
15
2.1 Introduction
In the petrochemical industry, energy and equipment savings can be obtained if selective membrane separation of hydrogen from a gas mixture is employed in processes such are steam reforming, water-gas shift reaction, hydrocarbons dehydrogenation [1], [2]. To ensure high separation and permeation rates, while still retaining mechanical stability in harsh application conditions (chemically aggressive environment and high temperature), asymmetric ceramic membranes can be employed. An ultrathin separation layer is superimposed onto one or more intermediate layers that, in turn, are supported on a mechanically strong base support. This results in a graded pore structure across the membrane. Large dimensions (thickness) of the base support, compared to those of the selective layer, may induce a high resistance to mass transport that can even be dominant for the highly permeable gases (H2, He) [3] (although for most of the gases the top selective layer determines transport).
Membrane systems consist of membrane elements or modules. They often involve a tubular geometry rather than flat. Though multi-channel monolithic elements provide a greater surface-area-to-volume ratio and mechanical robustness, the use of multi-tubular modules allows for easy change of faulty elements. The packing density can be further increased by the use of hollow fiber geometry with even smaller overall membrane thickness and, hence, reduced support resistance [1].
The aim of this chapter is to investigate the influence of support geometry on the overall membrane performance of asymmetric ceramic membranes for gas separation. Due to the complex set of interrelated parameters, numerical simulations are usually employed for this kind of analysis. In the field of gas separation such studies are scarce. For micro- and ultra-filtration membranes, Dolecek and Cakl [4] have shown that increasing the packing density does not generally lead to enhanced membrane performance. The authors showed, experimentally and theoretically, that channel contributions to the total permeate flux through a 19-channel hexagonal ceramic membrane depend on the ratio of the selective-layer to porous-support permeabilities. However, these parameters vary with membrane geometry and the type of application. In this chapter, we address this issue for gas separation considering different membrane geometries. To the best of our knowledge, it is the first time that the effect of support geometry on the transport of a multi-component gas mixture through asymmetric ceramic membranes is considered, in terms of both flux and permselectivity.

Gas Transport Efficiency of Ceramic Membranes: Comparison of Different Geometries
16
2.1.1 Base cases
To enable comparison of the effect of support geometry on overall membrane performance, the following support geometries are considered:
1. Flat plate (FP)
2. Tubular (TU)
3. Multi-channel (MC)
The corresponding calculation domains Ω and boundary condition lines ∂Ω Figure 2.1) are determined by transport direction and symmetry considerations, which are addressed later in more detail. The macroscopic dimensions of the support geometries match those of commercially available ceramic membrane supports. Parameters used in calculation for both top layer and membrane support, are listed in Table 2.1.
Figure 2.1: Calculation domains Ω with boundaries ∂Ω and flux expressions for the three support geometries: FP, TU and MC.
For a single-species gas, hydrogen, and in the case of a binary gas mixture hydrogen and methane are considered as the permeating gases. The flux through the selective layer is assumed to be linearly dependent on the partial pressure difference across the layer, with the permeance Fi [mol⋅m-2⋅s-1⋅Pa-1] of the gas species i as the parameter of proportionality. This would, for instance, correspond to transport through a microporous silica layer at high temperature, i.e., in the Henry regime. The permeance of silica for hydrogen is varied over a very wide range of values, from 10-20 to 1 mol⋅m-2⋅s-1⋅Pa-1, which includes the value ∼ 10-6 mol⋅m-2⋅s-1⋅Pa-1 observed for state-of-the-art silica membranes [5]. Since our interest involves the hydrogen permeance, this quantity is referred to as F in the remainder of the text. Different values for the pressure difference are considered (Table 2.1). Each of these values corresponds to different

Chapter 2
17
contributions of the involved transport mechanisms, i.e., Knudsen diffusion, viscous flow and bulk diffusion.
Table 2.1: Top layer and membrane support properties, and investigated process parameters
2.2 Theory
For an isothermal system at steady-state, in the absence of chemical reactions, conservation of mass requires that the divergence of the flux Ni [mol⋅m-2⋅s-1] of a gaseous component i vanishes
0i∇⋅ =N , (1)
where ∇ is the differential operator ( , , )x y z∂ ∂ ∂ ∂ ∂ ∂ , with spatial coordinates x, y, and z. Transport in a flat plate geometry occurs in one direction and, consequently, for its description only a single coordinate is required. Transformation to polar coordinates and taking advantage of the axial symmetry also renders transport in the tubular geometry into a one-dimensional problem. For the multi-channel geometry two independent coordinates (x, y) remain and, due to symmetry considerations, the calculation domain only covers 1/12th of the actual 19-channel MC membrane cross-section. Figure 2.1 depicts the corresponding calculation domains Ω and boundary conditions ∂Ω.

Gas Transport Efficiency of Ceramic Membranes: Comparison of Different Geometries
18
In the solution domain Ω, three different categories of boundaries ∂Ω can be distinguished:
1. ∂ΩS: Symmetry, 0i− ⋅ =n N
2. ∂ΩP: Permeate side, fixed pressure, permi ip p=
3. ∂ΩR:Retentate side, flux through selective layer, ret( )i i i iF p p− ⋅ = −n N
where n is the outward normal vector on ∂Ω. The partial pressures pi [Pa] at both permeate and retentate side are assumed constant.
2.2.1 Flux expressions
Transport of gas mixtures in porous media has been studied extensively, and abundant theoretical descriptions have been proposed in the open literature. Present and De Bethune [6] presented flux expressions for the transport of a binary mixture in a long capillary, based on a momentum approach. They assumed that diffusive and viscous transport are simply additive and obtained expressions that are essentially the same as those provided by the well-known Dusty Gas Model (e.g., [7]) for transport of gas mixtures in porous media. For most practical problems these expressions are generally considered adequate.
a) Binary system
For a binary mixture the flux (Ni) expressions can be written as
00
0 0 ( )ij i j
i i i i i j
ij i j j i ij i j j i
Ð D DBRT D p p p p
Ð p D p D Ð p D p D
= − ∇ − + ∇ + + + + +
Nη
(2)
where the interchangeable indices i and j refer to either H2 or CH4, R and T have their usual meaning and η is the viscosity [Pa⋅s]. B0 is a parameter related to the structure of the porous medium [m2] and can be obtained from experiment or, assuming cylindrical pores, estimated from [7]
2p
0 32
dB =
ε
τ (3)
with ε [-] the porosity, τ [-] the tortuosity and dp [m] the pore diameter.

Chapter 2
19
Expression (2) contains three different diffusion coefficients, two of which (Di and Dj, [m
2⋅s-1]) are related to diffusion in the free molecule or Knudsen regime. These diffusion coefficients depend on the molar mass Mi [g⋅mol-1] of the gaseous species and temperature via
0
4 83i
i
RTD K
M=
π (4)
where K0 is a parameter related to the structure of the porous medium [m]. Assuming cylindrical pores K0 can be estimated from [7]
0 4pd
Kε
τ= (5)
The other diffusion coefficient Đij0 accounts for binary collisions between the
two gaseous species. It is related to the binary diffusion coefficient Dij by
0ij ijÐ p D
ε
τ≡ (6)
where multiplying with ε over τ is performed to account for the structure of the porous medium. For non-polar gases the binary diffusion coefficient can be estimated from the expression given by Fuller [8]
( )
1.752
21/3 1/31.013 10 i j
ij
i ji j
M MTD
M Mp v v
−+
= ⋅+
(7)
where v [m3] is the diffusion volume of a species and Mi [kg·mol-1] is the molar mass. Employing expression (7) the multiplication with the total pressure renders Đij
0 to be independent of pressure.
b) Unary system
For single component gas transport, DGM equation (2) reduces to the following flux expression:
01i i
BD p p
RT
= − + ∇
N
η (8)
The first and second term on the right hand side account for the diffusive and convective contribution to the total flux, respectively.
Gas Transport Efficiency of Ceramic Membranes: Comparison of Different Geometries
20
2.2.2 Comparison
A comparison between the geometries in terms of membrane performance is made on the basis of pure H2 flux and H2/CH4 permselectivity for a 50-50% binary mixture. The pure hydrogen flux is normalized with respect to the surface area of the silica layer on the retentate boundary ∂ΩR
( )
( )R
R
d
dN
∂Ω
∂Ω
− ⋅ ∂Ω< >=
∂Ω
∫∫
n N (9)
In case of MC geometry we can distinguish three boundaries on the retentate side, each corresponding to a channel l. The channel efficiency is defined as
tot
ll
N
N
< >≡
< >ξ (10)
where the total flux tot lN N< >= < >∑ is the sum of the normalized fluxes of all three channels.
2.2.3 Numerical solution
Numerical simulations were performed using the FEMLAB® software package. Files used for the calculations can be found at the Internet site: http://www.ims.tnw.utwente.nl/
2.3 Results and Discussion
2.3.1 Unary system
From a practical point of view the tubular and multichannel geometry are considered to be the most suitable in terms of a greater surface-area-to-volume ratio and mechanical robustness. Consequently, emphasis will be on the comparison of these two geometries. Calculations showed that the same general trend holds for all pressure differences, which is why only case C is discussed in more detail below.
The pressure and flow profiles over a solution domain (one twelfth of multi-channel cross section) are presented in Figure 2.2 for permeation of pure hydrogen in case of a high trans-membrane pressure difference (case C) for three

Chapter 2
21
distinctive values of the permeance of silica, i.e., F being very low, state-of-the-art or very high. Very low values of F (Figure 2.2a) correspond to almost impermeable dense silica layers. In this case the major part of the transport resistance and, hence, gradients in pressure are located in these thin layers. The pressure in the supporting structure is more or less constant and equal to pperm. The fluxes in the support are low and gradually increase in the direction towards the outside of the MC membrane.
In the extreme case of a very high permeance of silica (Figure 2.2c), the thin silica layers pose nearly no resistance. Hence, transport behavior in this case is entirely determined by the support. Here, the MC geometry induces a distinctive pressure profile, i.e., the pressure gradient is entirely located on the outside of the MC membrane. Consequently, only a small portion of each outer channel contributes to the total flux, while the central portion of the entire multi-channel element shows negligible contribution.
Figure 2.2: 2D-pressure profiles (isobars) and 2D flux profiles (arrows) as a function of permeance of silica in MC membranes for unary system for pressure case C. Very low F (a), value for the state-of-the-art (b) and very high F (c).
Figure 2.2b corresponds to an intermediate situation, in which the pressure changes are located within the silica layers as well as in the entire support. In this case all channels contribute to the total flux, albeit that the outer channels contribute more.
Figure 2.3 shows the channel efficiency (eq. (10)) for each channel as a function of the permeance of silica. For low values of the permeance, the influence of the support is negligible (analogous to Figure 2.2a) and the

Gas Transport Efficiency of Ceramic Membranes: Comparison of Different Geometries
22
efficiency of each channel is the same (1/3). Around the state-of-the-art value, the inner channels show a distinct decrease in efficiency with increasing permeance of silica, accompanied by an increase in the efficiency of the outer channels. For high permeance of silica, only the outer channel contributes to the flux.
The reduced efficiency of the inner channels of a MC membrane suggests that the performance of a thin silica layer will be better when applied onto tubular support geometry. Figure 2.4 shows the ratio of fluxes, normalized with respect to the total surface area of silica, for both tubular and multi-channel membranes as a function of the permeance of silica.
F [mol/m2/s/Pa]
10-8 10-7 10-6 10-5 10-4 10-3 10-2 10-1
ξl [-]
0.0
0.2
0.4
0.6
0.8
1.0
1
2
3
Figure 2.3: Channel efficiency in MC membranes for unary system and pressure case C. This corresponds to flux contribution per channel in MC membranes in case of no defects in silica layer.
It can be seen that the flux per surface area of silica is distinctly higher for tubular membranes for all three considered cases of pressure difference. For low permeance F the resistance imposed by the silica layer is dominant and the normalized flux is independent of the properties of the support, causing <NTU>/<NMC> to be close to unity.
When the permeance F of silica increases, the influence of the support becomes more significant. The reduced efficiency of the inner channels causes a reduced performance of the MC membranes compared to the TU membranes.

Chapter 2
23
Clearly, the change in <NTU>/<NMC> with F is different for the various cases of pressure difference. For the low pressure difference case (case A) the reduced performance of the MC membranes occurs at lower F value. This is due to the high support resistance in case A (i.e., due to a smaller viscous flow term).
F [mol/m2/s/Pa]
10-7 10-6 10-5 10-4 10-3 10-2 10-1 100
<N
>T
U/<
N>
MC
0
1
2
3
4
5
6
7
A C B
Figure 2.4: Flux normalized with respect to surface area silica for TU and MC membranes as a function of permeance of silica, for unary system and three base pressure cases.
For the high pressure difference case (case C) the viscous flow term is larger and the resistance of the support is much lower compared to the low pressure difference case. Consequently, a much higher permeance of silica is allowed before the support resistance becomes significant. It should be noted that even for the low pressure difference case (case A), the Knudsen number (ratio of the mean free path λ of the molecules and the pore radius dp) is smaller than 0.01, indicating that the Knudsen diffusion contribution is negligible compared to viscous transport. When a support with much smaller pores would be used, the Knudsen contribution might have been the governing transport mechanism, and the lines in Figure 2.4 would have shifted much more to the left.
For highly permeable silica, overall transport is governed by the support. Surprisingly, the ratio <NTU>/<NMC> reaches an asymptotic value (6.58), which is identical for all three cases of pressure difference. The asymptotic value is not

Gas Transport Efficiency of Ceramic Membranes: Comparison of Different Geometries
24
related to the pressure or temperature, but only arises from differences in geometry. For a comparison between MC and TU membranes, sophisticated numerical methods are required, such as the finite element method employed here. However, for a comparison between TU and FP geometry in this asymptotic regime an analytical solution can be found for the flux
0FP av
TU FP
1 BN D p p
RT
N G N
= − + ∆
= ⋅
δ η (11)
where pav is the average of the permeate and retentate pressures. The geometrical factor G expresses the influence of the curvature on the support resistance
ln(1 )
aG
a=
± ± (12)
where a=δ/r is the ratio of the support thickness δ and the inner radius r. The positive signs are valid in case the silica layer is on the inside of the tube. Then, for all a, G exceeds unity, signifying that the flux through a tubular membrane is always larger than through a flat membrane of the same thickness. For r >> δ, G→1, i.e., the effect of curvature disappears. When it is assumed that the silica layer is on the outside of the tube (corresponding to negative signs in Eq. 12), the flux with respect to the outside of the tube is relevant and curvature has a negative effect on the flux.
The surface area of silica is generally larger in a multi-channel membrane than in a tubular membrane of the same length. To account for this, we calculated the number of required tubes to obtain the same performance as one multi-channel element. The result is depicted in Figure 2.5 as a function of permeance F of silica.
For all three cases of investigated trans-membrane pressure difference, the number of required tubes decreases as the performance of silica improves, especially for state-of-the-art values for F. For the chosen commercial multi-channel element and tubular membranes, the ratio A of the silica surface areas of multichannel and tubular supports is 10.85. In the case of almost impermeable silica A equals the number of tubes required to achieve the same performance as an MC membrane. As the permeance of silica increases, the number of required tubes decreases dramatically and finally reaches the asymptotic value of 1.67 (= A / G).

Chapter 2
25
F [mol/m2/s/Pa]
10-8 10-7 10-6 10-5 10-4 10-3 10-2 10-1 100
# T
ube
s
0
2
4
6
8
10
12
A C B
Figure 2.5: The number of tubes, required to acquire the same performance as one multi-channel element, as a function of permeance of silica for unary system for three base pressure cases.
2.3.2 Binary system, MC geometry
The performance of a membrane is not merely determined by the flux of the desired species, but also by the permselectivity towards this species. In the remainder it is assumed that the intrinsic permselectivity (i.e., the permselectivity of only the thin silica layer) for H2 over CH4 is 500 [5]. Due to the presence of the support the actual permselectivity will be less than 500. In Figure 2.6 the permselectivity Fα for the different channels in MC membrane is plotted as a function of the H2 permeance F of silica for the pressure difference of caseC.
Clearly, the increase in F corresponds to a rise in the support resistance, resulting in a decline of permselectivity. The decline in permselectivity is most remarkable for the inner channels, for which even selectivities below unity are observed. This corresponds to a higher transport rate of CH4 compared to H2, suggesting that plugging of the inner channels would improve the performance. The reversed permselectivity can be explained as follows. At high Fi values the MC membrane will fill up with hydrogen, causing a decline in the flux of this

Gas Transport Efficiency of Ceramic Membranes: Comparison of Different Geometries
26
gas in the inner channels. The permeance of CH4 through the silica is much lower and the effect of filling up is less pronounced. Consequently, a smaller decline in CH4 flux is expected.
F [mol/m2/s/Pa]
10-6 10-5 10-4 10-3 10-2 10-1
Fα [−]
0.1
1
10
100
1000
1
Overall
2
3
Figure 2.6: Permselectivity per channel in MC membranes in case of no defects in silica layer for the pressure case C.
In Figure 2.7 the permselectivity is depicted for a MC membrane with a defective silica layer on the inside of channel 3, calculated for the low pressure difference (case A). Clearly, for low F values, the overall transport is largely determined by the defective channel. Almost all gas permeates from channel 3 to the outside of the MC membrane, while the contribution of the other channels to flow is negligible.
As can be expected from the small value (< 0.01) of the Knudsen number Kn (ratio of the mean free path λ of the molecules and the pore radius dp), the transport is dominated by the pressure-dependent second term in equation (2) and, hence, permselectivity is low.

Chapter 2
27
F [mol/m2/s/Pa]
10-8 10-7 10-6 10-5 10-4 10-3 10-2 10-1 100
Fα [−]
0.1
1
10
100
1000
1
2
3
Overall
Figure 2.7: Permselectivity per channel in MC membranes in case of defects in silica layer for the low-pressure case (A).
With an increase in F the contributions of channel 2 and in particular that of channel 1 become more important and the overall permselectivity increases. Concurrently, the influence of support resistance becomes larger with F. This leads to a decrease in the apparent permselectivity of channel 1 and 2 similar to that observed in Figure 2.6. At a certain F, the increase in the contribution of both channels to the total flow and the decrease in their apparent permselectivity cancel each other out exactly. At this point the permselectivity of the MC membrane reaches a maximum value of approximately 10, which is small compared to the intrinsic permselectivity of 500. Further increase of F leads to a more dominating support resistance, and consequently a decrease in the permselectivity of the MC membrane. The position of the maximum is obviously dependent on the relative resistance of the support. For instance, the maximum shifts to the left upon decreasing pore size of the support material.
The fluxes of hydrogen and methane corresponding to Figure 2.7 are predominantly governed by viscous transport and, consequently, show a monotonic increase with F. The maximum in overall permselectivity is due to a change in the relative transport contributions of the silica layer and the support. When the pore size of the support is decreased, the viscous contribution is lowered compared to the diffusive contribution and the maximum in permselectivity shifts towards lower F. In Figure 2.8 the fluxes of hydrogen and

Gas Transport Efficiency of Ceramic Membranes: Comparison of Different Geometries
28
methane are depicted for the case dp = 7·10-7 m, and again a defective silica layer on the inside of channel 3. Remarkably, for this case the hydrogen flux shows a maximum at a certain value of F. This indicates that improvement of the permeance of the silica membrane layer beyond a certain value would even result in decreased performance of the multichannel membrane.
log F [mol/m2/s/Pa]
-10 -8 -6 -4 -2 0
N [
mo
l/m
2/s
]
0.0
5.0e-4
1.0e-3
1.5e-3
2.0e-3
2.5e-3
H2
CH4
Figure 2.8: Flux of hydrogen and methane in MC membranes with defective silica layers on the inside of channel 3 as a function of permeance of silica for the low-pressure case (A) and smaller pore size of the support material sup
pd =0.7µm.
The increased number of intermolecular collisions with increasing methane concentration can explain the decrease in hydrogen flux observed for high permeance of silica. During these collisions momentum is transferred from the fast moving hydrogen to the less mobile methane, moderating the hydrogen flux while increasing the methane flux. It should be noted that there is still an overall permselectivity at infinite value of F. This can only be attributed to the difference in mass of the permeating gases, i.e., the Knudsen diffusion contribution. Consequently, for a prediction of transport behaviour it is crucial to properly account for the three transport mechanisms included in the DGM.

Chapter 2
29
2.4 Conclusions
The effect of support geometry on multicomponent gas transport through microporous silica composite membranes was investigated under several trans-membrane pressure differences. Multi-channel (MC), tubular (TU) and flat plate (FP) geometries were compared on the basis of pure H2 flux and H2/CH4 permselectivity for a 50-50% binary mixture. The Dusty Gas Model (DGM) was used to account for the properties of the multicomponent gas mixture, membrane matrix and the governing transport mechanisms. Numerical simulations were performed using the FEMLAB® software package.
It is shown that the MC support geometry imposes a severe resistance to gas transport, inducing a distinct pressure profile. For highly permeable silica, the transport is entirely dominated by the support, i.e., the pressure gradient is entirely located on the outside of the MC membrane. Hence, only a small portion of the outer channels contributes to the total flux, while the central portion of the multi-channel module shows negligible fluxes. This suggests that the performance of the thin silica layer will be improved when applied onto a tubular support. Indeed, for all investigated pressure differences the flux per surface area silica for this geometry is clearly higher than for a multi-channel geometry. The <NTU>/<NMC> flux ratio reaches an asymptotic value (6.58), which is identical for all considered pressure differences. This indicates that the asymptotic value is neither related to pressure nor temperature, but arises only from differences in the geometry. Consequently, as the performance of silica improves, the number of required tubes to obtain the same performance as the MC membrane decreases dramatically to the value of 1.67. Hence, the high packing densities, i.e., high surface area to volume ratio, for multi-tubular and multi-channel membrane modules only translate into optimum performance for the former case.
In terms of permselectivity, the inner channels also show a considerable decline, and even selectivities below unity are observed (Figure 2.6). This corresponds to a higher transport rate of CH4 compared to H2, suggesting that plugging, i.e., exclusion, of the inner channels would improve the performance. When the inner channel is leaking, a maximum in permselectivity is observed for a certain value of F. Due to intermolecular collisions, the flux of hydrogen may also show a maximum with F, suggesting that further improvement of the silica layer would result in a decreased performance of the MC membrane.
Finally, the present study demonstrates that for accurate description of the gas transport it is crucial to properly account for the relative contributions of Knudsen diffusion, bulk diffusion and viscous flow, which are included in the DGM.

Gas Transport Efficiency of Ceramic Membranes: Comparison of Different Geometries
30
2.5 Acknowledgements
Financial support of EU project CERHYSEP number GRD1-2001-40315 is gratefully acknowledged.

Chapter 2
31
2.6 List of Symbols
a ratio of the support thickness and the inner radius of a tubular membrane (-)
A ratio of silica surface areas of multichannel and tubular supports (-) B0 structure parameter of the porous medium (m2) dp pore diameter (m) Di diffusion coefficient of gaseous species i in the free molecule, or
Knudsen regime (m2 s-1) Dij binary diffusion coefficient (m2 s-1) Đij
0 diffusion coefficient that accounts for binary collisions between the two gaseous species i, j (m2 s-1)
Fα permselectivity (-) Fi permeance of gaseous species i (mol m-2 s-1 Pa-1) G ratio of fluxes through tubular and multichannel membrane, which are
normalized with respect to the surface area of the silica layer (-) Kn Knudsen number (-) K0 structure parameter of the porous medium (m) Mi molar mass of gaseous species i (g mol-1) Ni flux of gaseous species i (mol m-2 s-1)
lN< > flux through channel l normalized with respect to the surface area of the
silica layer on the retentate boundary (mol s-1)
MCN< > flux through multichannel membrane normalized with respect to the
surface area of the silica layer (mol s-1)
totN< > total flux as sum of the normalized fluxes of all three channels (mol s-1)
TUN< > flux through tubular membrane normalized with respect to the surface
area of the silica layer (mol s-1) pav average of the permeate and retentate pressures (Pa) pi partial pressure of gaseous species i (Pa)
permip partial pressure of gaseous species i on permeate side (Pa) retip partial pressure of gaseous species i on retentate side (Pa)
r inner radius of a tubular membrane (m) R gas constant (J mol-1 K-1) T temperature (K)

Gas Transport Efficiency of Ceramic Membranes: Comparison of Different Geometries
32
Greek symbols
δ support thickness (m)
ε porosity (-)
lξ efficiency of channel l (-)
η viscosity (Pa s) λ mean free path of molecules (m) vi diffusion volume of gaseous species i (m3)
τ tortuosity (-) ∂ΩS symmetry boundary ∂ΩP boundary on the permeate side ∂ΩR boundary on the retentate side

Chapter 2
33
2.7 References
[1] A. J. Burggraaf and L. Cot, “Fundamentals of Inorganic membrane science and technology”, Elsevier, New York, 1996.
[2] S. L. Jorgensen, P.E.H. Nielsen and P. Lehrmann, “Steam Reforming of Methane in a membrane Reactor”, Catal. Today, 25, 303 (1995).
[3] N. E. Benes, A. Nijmeijer and H. Verweij, “Microporous Silica Membranes, Recent Advances in Gas Separations by Microporous Membranes”, N. Kannellopoulos (Ed.), Elsevier, Amsterdam 2000.
[4] P. Dolecek and J. Cakl, “Permeate flow in hexagonal 19-channel inorganic membrane under filtration and backflush operating modes”, J. Mem. Sci., 149, 171 (1998).
[5] R. M. De Vos and H. Verweij, “High-Selectivity, High Flux Silica Membranes”, Science, 279, 1710 (1998).
[6] R. D. Present and A. J. De Bethune, “Separation of a Gas Mixture Flowing Through a Long Tube at Low Pressure”, Phys. Rev., 75, 1050 (1948).
[7] E. A. Mason and A. P. Malinauskas, “Gas Transport in Porous Media: The Dusty Gas Model”, Elsevier, New York, 1983.
[8] E. N. Fuller, P. D. Schettler, and J. C. Giddings, “A New Method for Prediction of Binary Gas-Phase Diffusion Coefficients”, Ind. Eng. Chem., 58, 19 (1966).

34

35
Chapter 3
Transport of Binary Mixtures
through Microporous Silica Membranes

Transport of Binary Mixtures through Microporous Silica Membranes
36
Abstract:
In this chapter the transport of binary gas mixtures consisting of the
components with different mobilities through a microporous silica membrane is
investigated. The flux values for the highly mobile inert component (He) in the
presence of H2O at low temperatures (<100˚C) are correlated with H2O sorption
data obtained in-situ from the supported membrane layers by spectroscopic
ellipsometry. The flux of the more mobile component is lowered by the presence
of the less mobile component, and this effect is more pronounced as the
difference in the mobilities of the two components increases.

Chapter 3
37
3.1 Introduction
Ceramic microporous membranes with a high permselectivity to small gas molecules are potential candidates for gas separation in the petrochemical industry since they generally show good thermal, chemical and mechanical properties relative to polymeric membranes [1]. Membrane-based separation represents an energy-efficient alternative to conventional separation methods (e.g., pressure swing adsorption). Possible applications of the ceramic membranes range from the selective removal of hydrogen from H2-containing industrial streams to their use in H2-selective membrane reactors for conversion enhancement in thermodynamically limited reactions (e.g., steam reforming, water-gas shift, hydrocarbons dehydrogenation) [2]-[4].
A proper description of transport phenomena in the microporous media, especially in the case of multi-component mixtures, is important for optimal design of the membrane separators. The separation of light and inert (i.e., non-adsorbing) molecules like He and H2 from a given multi-component mixture will be greatly affected by the molecular size, diffusivity, and the sorption properties of all components in the mixture, as well as by the microstructure of the membrane (pore size, porosity and connectivity).
In this work, we investigate the gas transport through the microporous silica membranes for a binary mixture consisting of He and H2O. Both components have similar molecular size, but show different mobilities at temperatures considered in this study (<100˚C). The hindered transport of the mobile component (He) in the presence of the strongly sorbing H2O molecules is correlated with the equilibrium sorption data for H2O obtained in-situ from the supported membrane layers by spectroscopic ellipsometry.
3.2. Theory
3.2.1 Binary transport through a microporous membrane
Multicomponent mass transport through a microporous membrane is affected both by thermodynamics and the mobilities of the involved species. If the microporous medium is considered as a lattice of satq sites accessible to molecules of the diffusing species i , with one molecule per site and single hopping between adjacent sites, the flux expression for a binary mixture consisting of components A and B reads [5]

Transport of Binary Mixtures through Microporous Silica Membranes
38
(1)
where AD
~
is the single component chemical diffusion coefficient of component A, θ is the occupancy, with satqq /=θ , and q is the number of occupied sites with respect to the total amount of adsorption sites satq . Eq. 1 predicts that Aθ and Bθ change linearly across the membrane thickness. In the limit of zero occupancies of both components at the permeate side of the membrane, the normalized flux of the component A A sat A
/ q D−J % , will be invariant with respect to changes in Bθ at the feed side of the membrane.
If the occupancy of B is uniform across the membrane thickness, i.e., 0B
θ∇ = , then Eq. 1 simplifies to
(2)
Accordingly, the flux of component A is fractionally reduced by the presence of B, which is due to the concurrent reduction in the number of sites accessible to component A upon increasing Bθ . It should be noted, however, that the idealized hopping model does not take into account the molecular blocking or network connectivity, which could affect transport in the microporous systems.
3.2.2 Spectroscopic Ellipsometry study of Sorption in Thin Porous Layers
In this section, a concise theoretical background of Spectroscopic Ellipsometry will be outlaid. This characterisation technique was employed for determining the sorption properties of the porous layers comprising the membrane.
Spectroscopic ellipsometry is a non-destructive optical technique for characterization of thin layers. In an ellipsometry experiment, the change in polarisation state of a linearly polarized incident light wave upon reflection on a substrate is measured. This change in polarisation state is the result of a different reflection from, and transmission through, the interface between the layers for the polarization components parallel and perpendicular to the plane of incidence, as schematically presented in Figure 3.1.
( )( )1AA sat B A A B
q D θ θ θ θ= − − ∇ + ∇J~
( )( )1AA sat B A A B
q D θ θ θ θ= − − ∇ + ∇J ~

Chapter 3
39
Figure 3.1 Reflection of a light beam from a sample. Eis and Eip are the s- and p-polarized electric field vectors of the incident light, respectively. Ers and Erp are s- and p-polarized electric field vectors of the reflected light, respectively. θ is the incident angle.
The change in the polarisation state of the incident beam can be related to a change in the optical properties of the material due to sorption. The change in the ratio of the amplitude reflection coefficients for the parallel tot
pr~ and perpendicularly tot
sr~ polarized light components before and after reflection,
denoted as tan( )ψ , and the change in the mutual phase ∆ are measured by the ellipsometer, and expressed as the complex number ρ~ [6]:
∆= ie)tan(~ ψρ (3)
For dielectric materials such as alumina and silica, the change in the phase ∆ upon reflection is only small. Therefore the change of tan( )ψ with wavelength (dispersion) is used for optical characterisation of the sample. Fitting of the optical properties of the membrane layers is carried out using the effective medium theory, as in a previous study on the microporous and surfactant templated silica membranes [7], [8], [9].
The porous membrane investigated in this study is a composite system consisting of an α-alumina support, γ-alumina intermediate layer and a silica top layer. Each individual porous layer contains a void fraction f, and a solid fraction m. The dielectric function of the solid fraction ε(m) can be related to the refractive index n by the expression 2nε = . The voids in each layer may be filled with a sorbent, by amount g, and the dielectric function ε(g) and consequently, the refractive index n will change. Although the membrane layers are heterogeneous on a molecular scale, each individual layer can be represented as an effective medium with an effective dielectric function ε⟨ ⟩ . Many effective

Transport of Binary Mixtures through Microporous Silica Membranes
40
medium theories are in use today, and for the system investigated in this study we used the Bruggeman effective medium approach [10], f+g+m =1:
( )( )
( ) ( )( )
( )0
21
21
1
2=
+
−−+
+
−−+
+
−
εε
εε
ε
ε
εε
εε
m
mfgf
g
gg (4)
The optical properties of the solid fraction of γ-alumina can be approximated with the optical properties of sapphire (aluminium oxide) [7]. As a result of a large hydroxyl content, the solid fraction of silica has a very different chemical composition and, hence, shows a dispersion different from quartz (silicium dioxide). In case of α-alumina support, the effective medium approach can not be applied due to the fact that this layer is macroporous (dp>50nm) with a pore size in the order of the wavelength so that scattering has an influence on the refractive index. Therefore, in the case of α-alumina and silica layers, the dispersion of n with wavelength is modelled by a Cauchy relation for the refractive index n:
λ2
1 2C
Cn += (5)
where C1 and C2 are the Cauchy coefficients.
The experimental procedure regarding the use of spectroscopic ellipsometry for the measurement of the water vapour sorption in a membrane is presented in Section 3.3.3.
3.3. Experimental
3.3.1 Membrane materials
Ceramic membranes, comprising silica and γ-alumina layers on top of a α-alumina support were prepared using the sol-gel method. Disc shaped (d=3.9cm) α-alumina supports were prepared by colloidal filtration of a stabilised suspension of AKP30 powder (Sumitomo Chemicals Ltd.), followed by drying and sintering at 1150 °C for 3 hours in air. A mesoporous γ-alumina layer was applied by dip-coating the support in a purified boehmite sol, followed by drying and calcining at 600 °C for 3 hours in air. Subsequent dip coating in a silica sol, drying and calcining at 600 °C for 3 hours in air resulted in the final membrane. A more detailed description of the synthesis route of the boehmite and silica sols, and the membrane preparation from these sols have been reported elsewhere [11], [12].

Chapter 3
41
3.3.2 Gas permeation in the presence of water vapor
The gas permeation setup is shown schematically in Figure 3.2. The membrane was placed in a steel cell and sealed with the Kalrez® rings. Prior to the measurements, membranes were outgassed at 200ºC for 24 h under a He flow in order to remove the physisorbed water.
A water bubbler was used to control the water concentration in the feed gas. A porous sieve within a gas bubbler was used to maximize the contact interface between water and the gas. Additional dilution with He of H2O/He mixture enabled setting of pH2O values as low as 0.05 kPa. The tubing was heated to avoid water condensation. At each bubbler water temperature TH2O, the system was allowed to equilibrate for 24 hours.
Figure 3.2: Experimental setup for gas permeation in the presence of water vapour.
Helium permeation measurements were conducted as a function of pH2O at 30, 50 and 90ºC. The helium permeance was calculated from FHe = N/(S ∆p), where F is the permeance (mol m-2 s-1 Pa-1), N the gas flow rate (mol s-1), S the surface area (m2) of the membrane, and ∆p the applied pressure difference across the membrane (Pa). For the permeance tests, only crack- and defect-free samples were taken showing a permselectivity α(He/CH4) larger than 300 at 200ºC. The He permeance was measured as a function of pH2O in the binary mixture feed stream, maintaining a constant pressure difference of 3 bar between the feed and permeate side of the membrane. The volumetric flow rate of the dried permeate gas was measured by a soap flow meter. The permeate gas was dried by passing it through a U tube filled with silica gel containing a moisture indicator. After a stable FHe was measured at given pH2O, the water vapour flow was measured from the weight gain of silica gel over 12h.
Transport of Binary Mixtures through Microporous Silica Membranes
42
3.3.3 Spectroscopic Ellipsometry
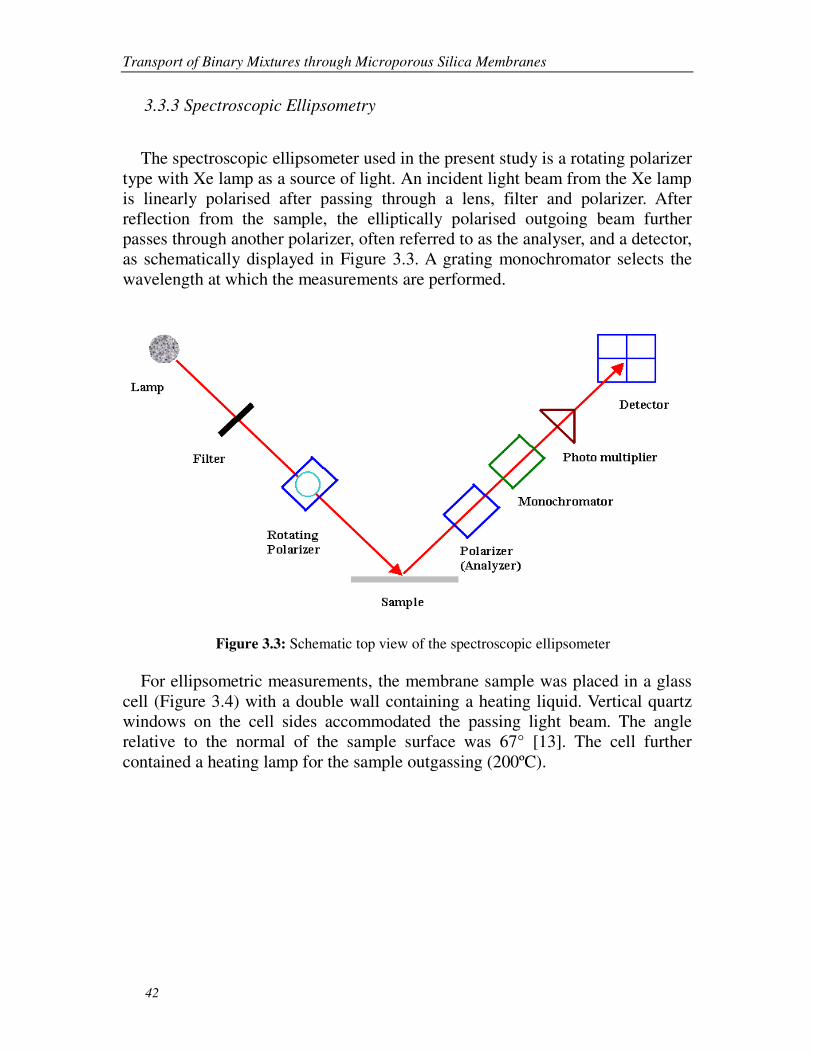
The spectroscopic ellipsometer used in the present study is a rotating polarizer type with Xe lamp as a source of light. An incident light beam from the Xe lamp is linearly polarised after passing through a lens, filter and polarizer. After reflection from the sample, the elliptically polarised outgoing beam further passes through another polarizer, often referred to as the analyser, and a detector, as schematically displayed in Figure 3.3. A grating monochromator selects the wavelength at which the measurements are performed.
Figure 3.3: Schematic top view of the spectroscopic ellipsometer
For ellipsometric measurements, the membrane sample was placed in a glass cell (Figure 3.4) with a double wall containing a heating liquid. Vertical quartz windows on the cell sides accommodated the passing light beam. The angle relative to the normal of the sample surface was 67° [13]. The cell further contained a heating lamp for the sample outgassing (200ºC).

Chapter 3
43
Figure 3.4: Side and top view of the sample cell in the ellipsometry setup
The water vapor delivery system was similar to that used in the gas permeation experiments. Temperatures and water vapour partial pressures maintained during the experiment corresponded with those covered by the gas permeation experiments.
Prior to sorption experiments, the membrane was outgassed in the cell for 24 h at 200ºC under a He flow of 80 ml/s. Data were recorded by measuring the change in )tan(ψ following a step change in pH2O. Equilibration was established typically within 10 h. Data were recorded using two types of scanning modes: energy- and time- scans. In the energy scan mode, tanψ was recorded as a function of wavelength in the range 1.5 to 3 eV. In the timescan mode, data were recorded at a single wavelength, as will be discussed later (see Fig 3.7 and 3.8).

Transport of Binary Mixtures through Microporous Silica Membranes
44
3.4 Results and Discussion
3.4.1 Water sorption in membrane layers measured by spectroscopic ellipsometry
3.4.1.1 Fitting procedure
Fitting of the data from the ellipsometric measurements of a membrane was performed for the entire set of spectra obtained at all OHp 2 values at a single temperature, including the spectrum obtained for the membrane free of water. The thicknesses of the γ-alumina and silica layers, the corresponding void fractions f and the Cauchy coefficients were varied within plausible ranges. The thickness for the γ-alumina layer was allowed to vary between 1200 and 1500 nm, the void fraction of silica between 0 and 40%, etc. With a grid search procedure, the values of relevant parameters were changed with small increments to search for a global minimum. For instance, the void fraction of γ-alumina was varied between 40 and 70% with a step size of 5%. Final fitting was accomplished with an additional non-linear least squares fitting procedure. Cauchy coefficients for the α-alumina and silica layers obtained from such fitting are presented in Table 3.1.
C1 C2
α-alumina 1.5593 -0.02218
silica 1.6848 0
Table 3.1 Cauchy coefficients for α-alumina and silica layer
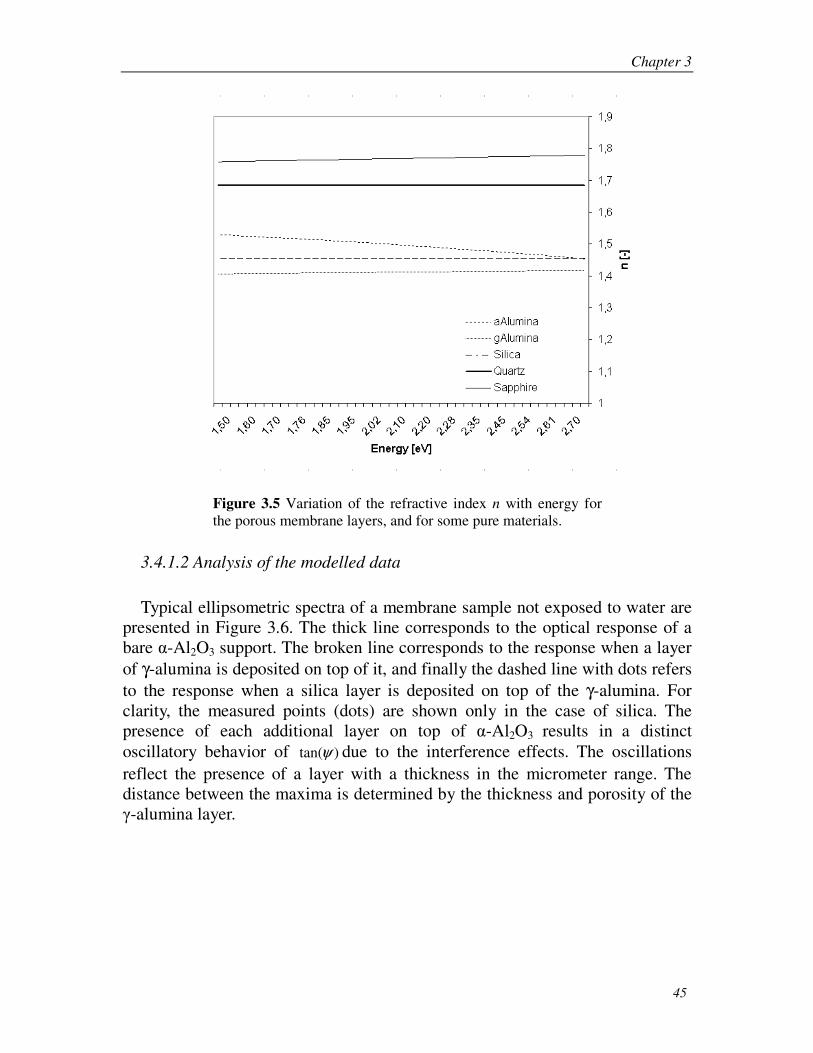
Figure 3.5 shows the dispersion of n with wavelength, i.e., with energy [eV] for the porous membrane layers, including sapphire and quartz. The use of the refractive index of quartz for silica would result in a wavelength dependent porosity [8]. As discussed in Section 3.2.2, the dispersion of α-alumina and silica layers is modelled using Cauchy relation (Eq. 8).
Chapter 3
45
Figure 3.5 Variation of the refractive index n with energy for the porous membrane layers, and for some pure materials.
3.4.1.2 Analysis of the modelled data
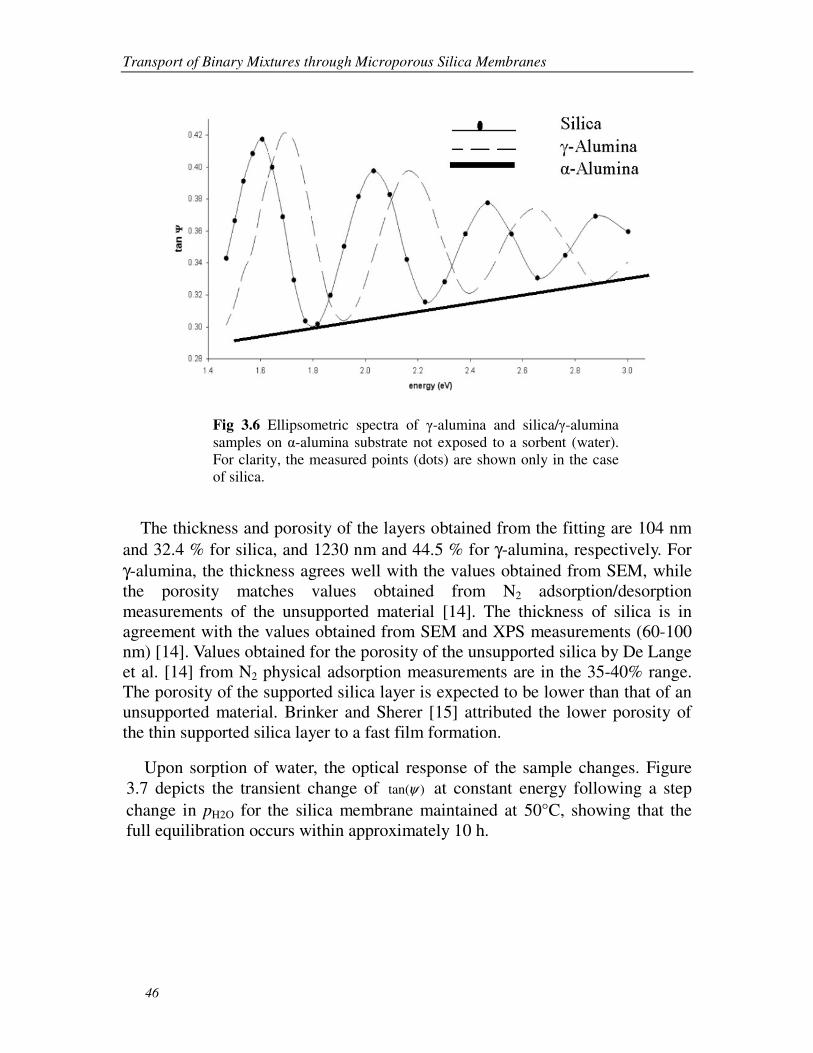
Typical ellipsometric spectra of a membrane sample not exposed to water are presented in Figure 3.6. The thick line corresponds to the optical response of a bare α-Al2O3 support. The broken line corresponds to the response when a layer of γ-alumina is deposited on top of it, and finally the dashed line with dots refers to the response when a silica layer is deposited on top of the γ-alumina. For clarity, the measured points (dots) are shown only in the case of silica. The presence of each additional layer on top of α-Al2O3 results in a distinct oscillatory behavior of tan( )ψ due to the interference effects. The oscillations reflect the presence of a layer with a thickness in the micrometer range. The distance between the maxima is determined by the thickness and porosity of the γ-alumina layer.
Transport of Binary Mixtures through Microporous Silica Membranes
46
Fig 3.6 Ellipsometric spectra of γ-alumina and silica/γ-alumina samples on α-alumina substrate not exposed to a sorbent (water). For clarity, the measured points (dots) are shown only in the case of silica.
The thickness and porosity of the layers obtained from the fitting are 104 nm and 32.4 % for silica, and 1230 nm and 44.5 % for γ-alumina, respectively. For γ-alumina, the thickness agrees well with the values obtained from SEM, while the porosity matches values obtained from N2 adsorption/desorption measurements of the unsupported material [14]. The thickness of silica is in agreement with the values obtained from SEM and XPS measurements (60-100 nm) [14]. Values obtained for the porosity of the unsupported silica by De Lange et al. [14] from N2 physical adsorption measurements are in the 35-40% range. The porosity of the supported silica layer is expected to be lower than that of an unsupported material. Brinker and Sherer [15] attributed the lower porosity of the thin supported silica layer to a fast film formation.
Upon sorption of water, the optical response of the sample changes. Figure 3.7 depicts the transient change of tan( )ψ at constant energy following a step change in pH2O for the silica membrane maintained at 50°C, showing that the full equilibration occurs within approximately 10 h.

Chapter 3
47
0 20 40 60 80 100 1200.23
0.24
0.25
0.26
0.27
0.28
0.29
0.30
7.38 kPa3.17 kPa
1.23 kPa
0.81 kPa
0.41 kPa
Dry
0.20 kPa
tan(ψ
) [-
]
t [h]
pH2O
=0.10 kPa
Figure 3.7: H2O sorption in silica/γ-alumina sample at 50°C measured by spectroscopic ellipsometry. E=2.65eV.
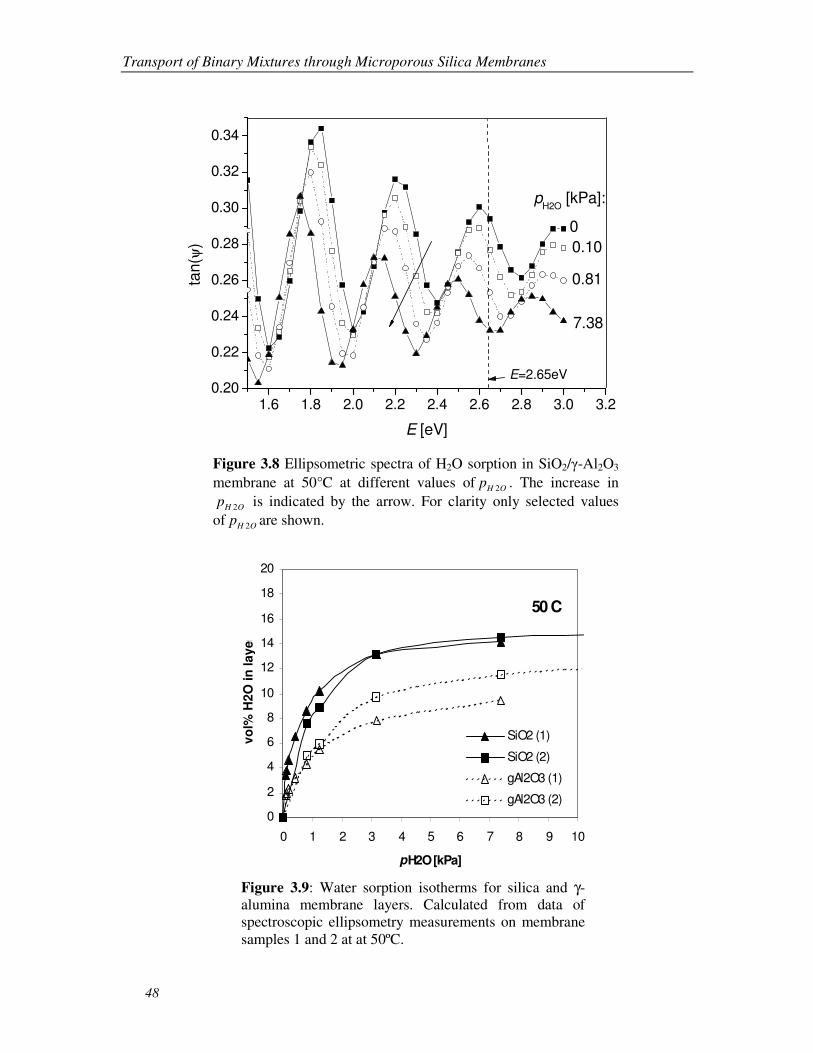
Figure 3.8 represents the ellipsometric spectra of H2O sorption by the silica/γ-alumina membrane at 50°C. As a consequence of water sorption, the absolute value of tan( )ψ decreases and the oscillations shift to the lower energy values. A single specific energy value between tan( )ψ maxima and minima was chosen (e.g., E=2.65eV in Fig. 3.8) to monitor the transient change of tan( )ψ presented in Figure 3.7. Note that the equilibration can be monitored in the region of E values where tan( )ψ does vary with the extent of sorption.
The modeling of the energy dependent spectra by using the Bruggeman effective medium approach enables decoupling of sorption behaviour of the individual layers. Results are shown in Figures 3.9 and 3.10 for the temperatures of 50 and 90ºC, respectively. Fitting of the data at 30ºC did not lead to consistent results, and is therefore not further discussed in this chapter.
Transport of Binary Mixtures through Microporous Silica Membranes
48
1.6 1.8 2.0 2.2 2.4 2.6 2.8 3.0 3.20.20
0.22
0.24
0.26
0.28
0.30
0.32
0.34
0.81
7.38
0.10
tan(ψ
)
E [eV]
E=2.65eV
pH2O
[kPa]:
0
Figure 3.8 Ellipsometric spectra of H2O sorption in SiO2/γ-Al2O3 membrane at 50°C at different values of 2H Op . The increase in
2H Op is indicated by the arrow. For clarity only selected values of 2H Op are shown.
50 C
0
2
4
6
8
10
12
14
16
18
20
0 1 2 3 4 5 6 7 8 9 10
pH2O [kPa]
vo
l% H
2O
in
la
ye
r
SiO2 (1)
SiO2 (2)
gAl2O3 (1)
gAl2O3 (2)
Figure 3.9: Water sorption isotherms for silica and γ-alumina membrane layers. Calculated from data of spectroscopic ellipsometry measurements on membrane samples 1 and 2 at at 50ºC.

Chapter 3
49
From Figure 3.9 we see that at 50ºC the sorption isotherms for silica almost coincide for the two investigated samples, while for γ-alumina only a moderate agreement is observed. Most surprisingly, a large mismatch is observed for the sorption isotherms of silica at 90ºC (Figure 3.10). This may be a consequence of different samples being used for the measurements. However, a general trend is that H2O sorption by the silica layer is about 1.5 times higher than that by the γ-alumina layer, which is in accordance with the results published by Dawoud and Aristov [16], who investigated water vapour sorption by microporous silica and mesoporous alumina at temperatures similar to those reported in this study (35 and 50ºC).
90C
0
2
4
6
8
10
12
14
16
18
20
0 1 2 3 4 5 6 7 8 9 10
p H2O [kPa]
vo
l% H
2O
in
la
ye
r
SiO2 (3)
SiO2 (4)
gAl2O3 (3)
gAl2O3 (4)
Figure 3.10: Water sorption isotherms for silica and γ-alumina membrane layers. Calculated from data of spectroscopic ellipsometry measurements on membrane samples 3 and 4 at 90ºC
Figure 3.11 shows the occupancy θSiO2 as a function of 2H Op , calculated from the data of Figures 3.9 and 3.10, where
2SiO 0/q qθ = , with q the amount of water within the silica layer, and 0q the amount corresponding to saturation. The obtained Type I (IUPAC) isotherms are characteristic for a microporous material.

Transport of Binary Mixtures through Microporous Silica Membranes
50
0
0,2
0,4
0,6
0,8
1
0 10 20 30 40 50 60 70
p H2O [kPa]
ΘΘ ΘΘ S
iO2
[-]
SiO2 90 C
SiO2 50 C
Figure 3.11: Water occupancy θSiO2 as a function of different values of 2H Op at 50ºC (sample 1) and 90ºC (sample 3).
3.4.2 Helium permeance in the presence of water vapour
Figure 3.12 shows the helium permeance, FHe, as a function of pH2O at different temperatures*.
0 2 4 6 8 10 12 14 16
0.0
5.0x10⁻⁸
1.0x10⁻⁷
1.5x10⁻⁷
2.0x10⁻⁷
30oC
50oC
FH
e [m
ol m
-2s
-1P
a-1]
pH2O
90oC
Figure 3.12: Helium permeance FHe as function of pH2O
* Silica membranes studied here were sintered at 600ºC for 3 h. Their deterioration in the presence of water is not expected at temperatures below 100ºC.

Chapter 3
51
It is immediately clear from this figure that FHe decreases significantly with increasing pH2O. At 30 and 50 ºC, He permeance almost vanishes in the presence of water vapour. At 90ºC a certain helium permeance is observed even at high pH2O values. This may be attributed to coupling between the fluxes of helium and water and/or to the presence of a gradient in the water concentration across the membrane.
3.4.3. Correlation of He permeance data with H2O sorption data
In Figure 3.13, the normalised He permeance, / dry
He HeF F , is plotted as a function of 2SiOθ for the two investigated temperatures. It can be observed that the normalized He permeance is lowered by the sorption of water. At 90°C, the normalised He permeance decreases almost linearly with 2SiOθ . At 50°C, the effect is even more pronounced. The change in curvature of / dry
He HeF F vs. 2SiOθ with temperatures can be attributed to a different ratio in the mobilities of helium and water at the two different temperatures, leading to a blocking of the more mobile component (He) by the presence of the more sorbable and less mobile component (H2O).
Figure 3.13: Normalised helium permeance FHe as a function of water occupancy 2SiOθ obtained from
)tan(ψ measurements
It should be noted that this effect is not expected from Eq. (2), which predicts a linear decrease of the flux of component A with the increase of occupancy of component B.

Transport of Binary Mixtures through Microporous Silica Membranes
52
The mobility ratio of He and H2O, 2/He H Oν ν , can be estimated from the ratio of
their diffusivities 2
/He H O
D D
2
2 2
0
0
(exp
)H OHe
He He d d
H O H O
D D E E
D D RT
− −=
(6)
where d staE E Q= − is the activation energy of diffusion, aE the activation
energy for the permeance and stQ the isosteric heat of sorption. He
aE was approximated by value 13.6 kJ/mol for the activation energy of diffusion of hydrogen for microporous silica at 600˚C [18]. By using 54.8 kJ/mol for
2H O
aE [18], 40 kJ/mol (this work) for OH
stQ 2 , we may estimate the change in the diffusivity ratio at the two temperatures. It should be noted that 2H O
aE from [18] corresponds to the silica calcined at 400 °C while our experiments were performed with the silica calcined at 600 °C. The higher calcining temperature generally leads to smaller pores and more hydrophobic surface, and hence the
2H O
aE value is used here as an estimate. Moreover, the values of the pre-exponential factors in Eq. 6 are unknown, and
2
/He H O
D D can only be expressed relative to each other. The calculations show that at 50 °C
2
/He H O
D D is about one order of magnitude larger than at 90 °C.
Similar results as those presented in Figure 3.13 were found in a Monte Carlo simulation study of the lattice gas diffusion for a binary gas mixture [5]. It can not be excluded that also the complexity of silica microstructure, characterized by high tortuosity, low porosity, low pore connectivity and low pore accessibility, is of influence. Furthermore, the presence of a gradient in
OH 2θ across the membrane can be of influence, and some general recommendations for future work can be made accordingly. In the permeation experiments it should be ensured that no gradient in the less mobile component exists over a membrane, and that a more precise water detection on the permeate side is used. In the spectroscopic ellipsometry experiment, ideally the same samples should be used for all measurements, and the optical properties for the solid fractions of the investigated layers used in the study should be known.
3.5 Conclusions
In this chapter, the transport of a binary mixture of components differing in mobility through the microporous silica membranes was investigated. Transport of a more mobile inert component (He) is affected by the presence of the less mobile and sorbable component (H2O) in a membrane, and this effect is more

Chapter 3
53
pronounced at lower temperature. The extent of water sorption in the thin supported membrane layers was obtained by the in-situ spectroscopic ellipsometry measurements. A linear decline of the normalised He permeance
/ dry
He HeF F as a function of water occupancy 2SiOθ is observed at 90˚C. This effect is more pronounced at lower temperature where water has lower molecular mobility. It should be noted that this effect is not obvious from the theoretical descriptions of transport of binary mixtures in case the microporous medium is considered as a lattice of sites (Eq. 2, Section 3.2.1), where only a linear dependency of flux of component A (He) on occupancy of component B (H2O) is included.

Transport of Binary Mixtures through Microporous Silica Membranes
54
3.6 References
[1] A.J. Burgraaf, L. Cot, “Fundamentals of Inorganic Membrane Science and Technology”, Elsevier, Amsterdam (1996).
[2] R. De Vos, and H. Verweij, “High-Selectivity, High Flux Silica Membranes for Gas Separation”, Science, 275, 1710 (1998).
[3] G. Saracco, G.F. Versteeg, and W.P.M. van Swaaij, “Current Hurdles to the Success of High Temperature Membrane Reactors,” J. Membrane Sci., 95, 105 (1994).
[4] J. Zaman, and A. Chakma, “Inorganic membrane Reactors,” J. Membrane Sci., 92, 1 (1994).
[5] N.E. Benes, H.J.M. Bouwmeester, and H. Verweij, “Multi-Component Lattice Gas Diffusion,” Chem. Eng. Sci, 57, 2673(2002).
[6] R.M.A. Azzam and N. M. Bashara, “Ellipsometry and Polarized Light” (North Holland, Amsterdam, 1987), 2nd ed.
[7] N.E. Benes, G. Spijksma, H. Wormeester, B. Poelsema, and H. Verweij, “CO2 Sorption of a Thin Silica Layer Determined by Spectroscopic Ellipsometry,” AICHE Journal, 47, 1212 (2001).
[8] H. Wormeester, N.E. Benes, G. Spijksma, H. Verweij, and B. Poelsema, “CO2 Sorption of a Ceramic Separation Membrane,”Thin Solid Films, 455-456, 747 (2004).
[9] T. Zivkovic, N.E. Benes, D. Blank, and H.J. M. Bouwmeester, “Characterisation and Transport Properties of Surfactant Templated Silica Layers for Membrane Applications,” J. Sol-Gel Sci.Tech., 31, 205 (2004).
[10] U. Kreiberg and M. Vollmer, „Optical Properties of Metal Clusters“, Springer-Verlag, Berlin (1995).
[11] A.F.M. Leenaars and A.J. Burggraaf, “The Preparation and Characterization of Alumina Membranes with Ultrafine Pores. 2. The Formation of Supported Membranes,” J. Colloid Interface Sci., 105 27 (1985).

Chapter 3
55
[12] N.E.Benes, A. Nijmeijer, and H. Verweij, in Recent Advances in Gas Separation by Microporous Ceramic Membranes, edited by N.K. Kannellopoulos, Elsevier Science (2000).
[13] H.G. Tompkins, “A User’s Guide to Ellipsometry”, Academic Press, San Diego (1993).
[14] R.S.A. De Lange, J.H.A. Hekkink, K. Keizer, and A.J. Burgraaf, “Formation and Characterization of Supported Microporous Ceramic Membranes Prepared by Sol-Gel Modification Techniques”, J. Memb. Sci. , 99, 57 (1995).
[15] C.J. Brinker, G.W. Sherer, „Sol-Gel Science: the Physics and Chemistry of Sol-Gel processing”, Academic Press, Boston (1990).
[16] Belal Dawoud and Yuri Aristov,“Experimental study on the kinetics of water vapor sorption on selective water sorbents, silica gel and alumina under typical operating conditions of sorption heat pumps” International Journal of Heat and Mass Transfer 46 (2003) 273–281.
[17] S. Sommer and T. Melin “Influence of operation parameters on the saparation of mixtures by pervaporation and vapour permeation with inorganic membranes” Chemical Engineering Science 60, 4509-4523 (2005)
[18] R.De Vos, “High-Selectivity, High Flux Silica Membranes for Gas Separation: Synthesis, Transport and Stability,” PhD Thesis, University ofTwente, Enschede (1998).

Transport of Binary Mixtures through Microporous Silica Membranes
56

57
Chapter 4
Characterization and Transport Properties
of Surfactant-Templated Silica Layers
for Membrane Applications*
* Published with modifications as “Characterization and Transport Properties of Surfactant-Templated Silica Layers for Membrane Applications” Journal of Sol-Gel Science and Technology, Volume 31, 2004, Pages 205-208, T. Zivkovic, N. E. Benes, D. H. A. Blank and H. J. M. Bouwmeester

Surfactant Templated Silica Layers for Membrane Applications
58
Abstract:
An intermediate surfactant-templated silica (STS) layer is applied between
the supporting mesoporous γ-Al2O3 and the amorphous microporous silica top
layer resulting in dual-layered microporous silica membranes for gas separation
applications that show improved values for both hydrogen flux and
permselectivity. Determination of thickness and porosity of as-deposited
membrane layers by spectroscopic ellipsometry reveals that the STS layer is
present as a distinctive layer of ~20 nm thickness, with penetration up to a depth
of ~70 nm into the underlying γ-Al2O3 support layer, whose thickness and
porosity are determined to be 1.3 µm and 50%, respectively.

Chapter 4
59
4.1 Introduction
Microporous silica membranes prepared by sol-gel processing have attracted attention for gas separation due to their good thermal and chemical stability compared to conventional polymeric membranes. Mechanical strength is provided by a macroporous support, e.g., α-Al2O3, while an intermediate layer of mesoporous γ-Al2O3 is applied to overcome the large difference in pore size between the support or supporting layers and the microporous silica top-layer. To ensure good separation and a high flux, the silica top-layer must be thin and free of defects like cracks or pinholes [1], [2]. Different strategies are applied to avoid defects, including repeated dip-coating under clean room conditions or gradual reduction of pore size of subsequently deposited layers [1].
It has been known that the application of surfactant-templated silica (STS) offers properties such as a tuneable pore size and connectivity of pores in the direction of transport [3]. Recently, Tsai et al. [4] reported that application of such a STS layer between the mesoporous γ-Al2O3 layer and the microporous silica overlayer shows improved membrane performance in terms of both flux and permselectivity. The STS layer would prevent penetration of the silica sol into the underlying γ-Al2O3 layer.
For the pore size control, two main templating strategies exist [4]: the solvent (water)-templating and the surfactant-templating technique. Due to the different size of the templating molecule in each case, the former is more applicable to the microporous silica layer, while the latter technique is suitable for the mesoporous intermediate one:
Solvent (water)-templating
In the sol-gel processing, during the stages of dip-coating and drying of the deposited film, the removal of water, solvents and organic residue takes place. The preferential alcohol evaporation takes place during the dip-coating stage, while water is the dominant solvent during the final stage of drying where the pore size is established. Water molecules confined in the stressed film serve as the templates to create pores of molecular dimension needed for molecular sieving.

Surfactant Templated Silica Layers for Membrane Applications
60
Surfactant-templating
For the surfactant-templating strategy, the surfactants (amphiphilic molecules composed of a hydrophilic head group and a hydrophobic tail) are used as the templates. Surfactant-templated silicas (STS) are a high surface area amorphous solids (up to 1400 m2/g) characterized by the pores, ranging normally from about 10 to 100 Å in diameter, organized into the periodic arrays that often mimic the liquid crystalline phases exhibited by surfactant¯ water systems.
Both water and surfactants can be removed by heating to create pores with various dimensions.
In the present study, dual-layer microporous silica membranes comprising an intermediate STS layer are processed and characterised by spectroscopic ellipsometry and gas permeation measurements.
4.2 Experimental
‘Standard’ microporous silica membranes were prepared on γ-Al2O3 coated on flat α-Al2O3 supports, as described in Refs. [1] and [2]. Membranes comprising an additional STS sublayer were prepared following the procedure as described by Tsai et al. [4].
A dip-coating solution was obtained in two steps. In the first step, tetraethyl orthosilicate (TEOS) (98%, Aldrich) was mixed with the appropriate amounts of EtOH (99.9%, Merck), H2O and HCl, in a ratio TEOS : EtOH : H2O : HCl = 1.0 : 3.8 : 1.1 : 5×10⁻⁵ (pH=4.7), and then refluxed for 90 min at 60°C. The sol was then stored in a freezer at -30°C for one day. In the second step, additional water and HCl were added to the stock sol, followed by the addition of a 0.125 M C6-surfactant (triethylhexylammonium bromide, 99%, Aldrich). The sol was then aged for one day in the fridge. After diluting this sol with twice its volume of EtOH, the dip-coating sol was obtained. Prior to coating, the sol was filtered through a 0.45 µm filter (Nalgene).
Both ‘standard’ as well as dual-layer silica membranes, comprising an additional STS sublayer were subjected to spectroscopic ellipsometry and gas permeation measurements. For spectroscopic ellipsometry measurements, all consecutive coatings were deposited once. For gas permeation measurements, the γ-Al2O3 layer was deposited twice, while it is specifically indicated whether the SiO2 coating was deposited one or two times.

Chapter 4
61
The single gas dead-end permeance (Figure 4.1) of H2, O2, N2 and CH4 was measured at 200ºC. In a dead-end permeance measurement a pressure difference over the membrane is applied and the stationary flow necessary to maintain the pressure difference is determined.
Figure 4.1: Schematic representation of single gas dead-end permeance set-up
The spectroscopic ellipsometer used in our experiments is of a rotating polarizer type equipped with a Xe lamp and photomultiplier (Wentink, 1996). After deposition of each layer, data were acquired under vacuum after outgassing the sample overnight. During outgassing, heat was supplied by a 50W halogen lamp, positioned 3 mm from the middle of the support-side of the sample. More details concerning the experimental procedure can be found in Ref. [5]. Dried unsupported (bulk) STS material is characterized by thermal gravimetric analysis (TGA) (Setaram, Setsys 16/18) and, after calcinations at 500ºC, by N2 sorption at 77K (Sorptomatic 1990) employing the Horvath-Kawazoe method [6-8]. The quality of the layer deposition and its thickness were investigated by HR-SEM (LEO Gemini 1550 FEG-SEM, UK).
4.3 Results and Discussion
Thermogravimetric analysis of bulk STS (Figure 4.2) showed a weight loss around 300˚C, with a rapid burn-out of the organics as indicated by the exothermic peak at 350˚C. N2 sorption analysis of bulk STS material calcined at 500ºC showed a pore size distribution around 1 nm (Figure 4.3). This implies that STS itself will pose a negligible resistance to the transport of gas molecules whose size is in the range of 0.3 to 0.5 nm (H2, O2, N2, CH4).

Surfactant Templated Silica Layers for Membrane Applications
62
60
70
80
90
100
0 100 200 300 400 500 600
Temperature(?C)
We
igh
t L
os
s (
%)
-20
-10
0
10
20
He
at
flo
w (
mW
)
Figure 4.2: Heat flow (bold) and weight loss (TGA curve) for the STS material in air (1 atm) at the heating rate of 2˚C/min
Figure 4.3: Pore size distribution of STS unsupported material obtained by N2 sorption
Material and processing parameters of the different layers used in membrane preparation are listed in the Table 4.1.

Chapter 4
63
Table 4.1: Material, processing and structural parameters of the membrane
Layer Material Calcination
temperature
Thickness Pore size (dp) nm
Porosity
Top, membrane SiO2 400˚C <50 nm# 0.3-0.5 $ 10-15% [5]
Sublayer STS 500˚C 20+70 nm* 1 nm* 10%*
Intermediate γ-Al2O3 600˚C 1.3 µm* 4 [2] 50%* [2]
Support α-Al2O3 1100˚C 2 mm# 80 [2] 30% [2]
* Discussed in the text # From SEM picture [1] $ From N2, CO2, Ar sorption on unsupported (bulk) material [1]
Figure 4.4 shows the single gas dead-end permeance of H2, O2, N2 and CH4, at 200ºC, for silica membranes with and without a sublayer of STS, plotted as a function of the kinetic diameter of the respective gases.
d Kn
[Angstrom ]
2.8 3.0 3.2 3.4 3.6 3.8 4.0
F [
mo
l/m
2/s
/Pa]
1e-9
1e-8
1e-7
1e-6
1e-5
2 SiO 2 on g-Al2O 3
1 SiO 2 on STS
2 SiO 2 on STS
H2
O 2
N2
CH4
Figure 4.4: Single gas permeation at 200˚C
It is immediately apparent from this figure that compared with the ‘standard’ silica membrane, comprising two SiO2 coatings on top of γ-Al2O3, deposition of a STS sublayer followed by subsequent deposition of either 1 or 2 SiO2 overlayers significantly improves hydrogen flux, while for improved

Surfactant Templated Silica Layers for Membrane Applications
64
permselectivity of H2 over CH4 still 2 SiO2 overlayers are required. An improvement in hydrogen flux due to the presence of the STS layer was also observed by Tsai et al. [3] and may be attributed to the prevention of penetration of ‘standard’ microporous silica into the γ-alumina layer.
The extent of penetration of STS into the γ-alumina layer is studied using spectroscopic ellipsometry. This technique allows evaluation of the structural properties, like layer thickness and porosity, of thin layers deposited on a supporting structure [5]. It involves measurement of change in the polarization state of an incident light beam upon reflection from a sample surface. Hence, it enables characterization of as-synthesized composite membranes in a single non-destructive way.
For dielectric oxides, absorption of light is negligible and, hence, the change in the phase upon reflection ∆ is only small. Therefore, only tan(Ψ), related to change in amplitude was measured as a function of wavelength λ. Graphical results are shown in Figure 4.5, where the dots correspond to experimental data and lines correspond to the best fit spectra. Fitting was done using an optical model with the optical properties and thickness of each layer as parameters [5]. Parameters obtained from fitting are listed in Table. 4.1.
The closed dots in Figure 4.5 correspond to an α-/γ-alumina sample. The thin film produces an interference pattern, leading to oscillatory behaviour of tan(Ψ) versus λ. As can be seen, the presence of the STS sublayer induces significant modulation in the peak amplitudes as well as in the width of the peaks. Best fits were obtained when the penetration depth of STS into the γ-Al2O3 support was taken into account as a separate interface layer, with weighed properties of the constituting materials. The quality of the layer deposition as well as thickness of γ-Al2O3 and STS layers determined by spectroscopic ellipsometry, corresponds well with HR-SEM measurements of these layers (not shown).
Utilizing an effective medium approach, the porosity of each layer can be determined from its optical properties. Since the pore dimensions of the α-alumina support are comparable to ¼th of the wavelength of visible light, an effective medium approach fails. Using the relation of Bruggeman [5], while assuming that the optical properties of dense γ-Al2O3 are identical to those of sapphire, the porosity of the γ-Al2O3 support layer is estimated to be ~50% and corresponds well with the literature data for the unsupported material [1].

Chapter 4
65
Figure 4.5: Wavelength dependence of tan(ψ) for the γ−alumina layer on top of α−alumina layer (black symbols), and for the additional STS layer on top of γ−alumina (open symbols). Symbols represent the measured data; lines represent fit of the optical model
The porosity does not vary significantly with λ, as expected. Assuming that the optical properties of dense STS are identical to those of quartz, the porosity of the STS layer is calculated to be ~10%. Although this porosity again does not vary significantly with λ, the value is probably an underestimate (the porosity of amorphous silica is already 15-20%). Most likely, the assumption of similar optical properties for dense STS and quartz is not valid. When it is assumed that there is no STS/γ-Al2O3 interface, but only a STS top-layer, a thickness of approximately 50 nm is obtained. However, the porosity calculated from the optical properties in that case would be strongly dependent on the wavelength, which is physically not plausible.
4.4 Conclusions
Microporous silica membranes were prepared, comprising an intermediate surfactant-templated silica (STS) between the mesoporous γ-Al2O3 support layer and the amorphous microporous silica overlayer. Compared with a standard membrane for gas separation applications, i.e., without a STS sublayer, single gas dead-end permeation measurements (H2, O2, N2 and CH4) indicate a

Surfactant Templated Silica Layers for Membrane Applications
66
significant increase in the values for the hydrogen flux as well as permselectivity. Investigations of as-deposited membrane layers by spectroscopic ellipsometry reveal that the STS layer is present as a distinctive thin layer (22 nm), with additional intrusion (73 nm) into the underlying γ-Al2O3 (thickness 1.33 µm). While the porosity of γ-Al2O3 complies with the previous findings (51%), in case of siliceous layers (top silica and STS sublayer) the current results indicate a porosity of the STS layer of ~10%. This value is probably an underestimate due to the invalid assumption of similar optical properties for dense STS and quartz.

Chapter 4
67
4.5 References
[1] R.M. De Vos, PhD Thesis, University of Twente (1998)
[2] N.E. Benes, A. Nijmeijer, and H. Verweij, in “Recent Advances in Gas Separation by Microporous Ceramic Membranes”, Elsevier Science B.V. (2000)
[3] C.J. Brinker, Y. Lu, A Sellinger, and H. Fan, Advanced Materials 11 (7), 579 (1999)
[4] C.Y. Tsai, S.-Y. Tam, Y. Lu, C.J. Brinker, Journal of Membrane Science, 203, 255 (2000)
[5] N.E. Benes, G. Spijksma, H. Verweij, H. Wormeester, and B. Poelsema, AIChE Journal, 47, 1212 (2001)
[6] G. Horvath, and K. Kawazoe, Journal of Chemical Engineering of Japan, 16, 470 (1983)
[7] R.S.A. de Lange, J.H.A. Hekkink, K. Keizer, A.J. Burggraaf, and Y.H. Ma, Journal 2of Porous Materials, 2, 141 (1995)
[8] D.W. Breck, in “Zeolite molecular sieves: structure, chemistry and use”, Wiley, New York (1974)
[9] U. Kreibig, and M. Vollmer, in “Optical Properties of Metal Clusters”, Springer-Verlag, Berlin (1995)

68

69
Chapter 5
Electrolyte Retention of Supported Bi-Layered
Nanofiltration Membranes*
*Published with modifications as “Electrolyte Retention of Supported Bi-Layered Nanofiltration Membranes” Journal of Membrane Science, Volume 277, Issues 1-2, 1 June 2006, Pages 18-27, W.B. S. de Lint, T. Zivkovic, N. E. Benes, H. J.M. Bouwmeester and D. H.A. Blank

Electrolyte Retention of Supported Bi-Layered Nanofiltration Membranes
70
Abstract:
The electrolyte separation behaviour of a supported bi-layered ceramic
membrane is investigated experimentally and the measured ion retentions are
compared with the predictions of a site-binding transport model with no
adjustable parameters. Due to the difference in iso-electric point between its two
separating layers, the bi-layered system is expected to perform better over a
large pH range compared with a membrane with only one type of selective layer.
The separating layers in the membrane are a microporous (dpore
=0.8 nm) silica
and a mesoporous (dpore
=2 nm) γ-alumina and their retention is studied for a
binary electrolyte solution of NaCl at 1 mol/m3 for pH values between 4 and 10.
Because of its smaller pores and high charge, the silica layer mainly determines
the membrane retention at neutral and alkaline pH, while the γ-alumina layer
has a significant impact on the NaCl retention at 4<pH<5. The model
predictions are in good agreement with the experimental data for Na+ at
4<pH<9 and for Cl- at the whole pH range. For a pH of 4 the predicted chloride
retention is lower than the sodium retention while the experimental data show
the opposite effect.

Chapter 5
71
5.1 Introduction
In the last decade considerable progress has been made in understanding and predicting the ion separation of nanofiltration (NF) membranes. For the separation of salts from aqueous solutions using inorganic NF membranes, consensus is that separation arises mainly from electrostatic interactions between ions and the charged membrane. A NF membrane performs ion separation best at pH values far from its iso-electric point (IEP), as this corresponds to a high membrane charge. Apart from the pH, the membrane charge is also a strong function of the type of ions present in the electrolyte solution and their concentration [1-9].
As the pH of most aqueous electrolyte solutions (without any addition) is close to 6, some current common inorganic NF membrane materials with the IEP 6-7 (cf. titania [6,7], zirconia (IEP≈6) and γ-alumina (IEP≈8)) will perform very poorly in a practical application. Additionally, in industrial applications one would like to use a membrane over a large pH range (e.g., to selectively remove differently charged species). In this case the membrane’s IEP is often included in the operating pH range and consequently the membrane separation performance will be poor there.
A solution for both of these problems is to use a membrane consisting of a mixture of two materials with a different IEP. However, Elmarraki et al.[10] showed that this option may not be a viable alternative as one of the two materials in a mixed system can dominate the charging properties of the membrane layer (see Fig. 6 in their work). A more promising option could be to create a stack of layers of materials with a different IEP [11,12]. In addition to the expected improved separation performance, this may also be a fast and effective way to reduce the exposure of any intermediate layers to harsh pH conditions (due to retention, the top layer can reduce the concentration of strong acid or base within the next layers) or, alternatively to prevent fouling of the membrane [13].
It must be noted here that the separation performance of any membrane with one or more positive and negative layers can be significantly reduced by strongly adsorbing electrolytes that may nullify or reverse the charge on some of these layers. Such effects are well known for monopolar membranes, but Elmarraki et al. [14] have also shown this for bilayered membranes.
The advantages of a two-layer NF membrane system were the incentive to conduct an investigation into the separation characteristics of these membranes. Adopting the extended Nernst-Planck equations Tsuru and co-workers [15] presented a thorough theoretical analysis of the retention behaviour of bilayered

Electrolyte Retention of Supported Bi-Layered Nanofiltration Membranes
72
(or bipolar) reverse osmosis membranes, showing the effects of flux, concentration and potential on their separation performance. They did however not discuss the effect of membrane charge on retention or compared their predictions to experimental data.
As the membrane charge is strongly dependent on the pH, in this work the electrolyte retention of a bilayered membrane is studied as a function of pH. The membrane used in this study consists of a silica and a γ-alumina separating layer and its retention behaviour is studied for the monovalent electrolyte NaCl. The experimental data is compared with predictions of the model presented by De Lint and Benes [8], which is extended to incorporate the charging effects of both separating layers.
5.2 Theory
In the model applied in this work [8], the charge on nanofiltration membranes is determined by adsorption of protons and electrolyte ions on a fixed number of sites, c
//tot. Adsorption is assumed to occur on a single type of surface site,
M-OH-1/2 [16], with M representing either alumina or silica. The exact surface structure of silica is not known but it is thought that its charging behaviour is fully dominated by Si-O- groups [17]. Here, for simplicity however we assume that alumina and silica have the same active surface site for adsorption, being M-OH-1/2. On this surface site competitive adsorption of protons, cations (here Na+) and anions (here Cl-) takes place. In this work adsorption is described by the well known 1-pK site-binding model:
(1)
A label (s) in Eq. (1) is used to designate virtual non-adsorbed ions (e.g., H+) with the same potential as their surface complexes (e.g., M-OH2
+1/2). The corresponding equilibrium constants are:
+1/2 +1/2-1/22 2
+ -1/2 + -1/2 +1/22
ref refrefM-OH M-OH ClM-OH Na
Na Cls s s
H M-OH Na M-OH Cl Al-OH
, , c c c cc c
K K Kc c c c c c
−+
−
+ = = = (2)

Chapter 5
73
with cref the thermodynamic reference concentration of 103 mol/m3
(1 mol/dm3). In the 1-pK model the proton adsorption constant is equal to the point of zero charge, pHPZC=pK
+. The Boltzmann relation relates the concentration of virtual species to that in the bulk of the electrolyte.
s bsexp i
i i i
z Fc c
RT
− = γ φ
(3)
In Eq. (3) γi is the bulk activity coefficient of species i, b denotes the bulk (φb≡0), zi is the charge number, F is the constant of Faraday, R the ideal gas constant, T the temperature, and φs the potential of the virtual species ci
s. In this work we assume a thermodynamically ideal solution, that is γi≡1.
To describe the variation of the potential φ and charge σ away from the membrane pore surface a triple-layer model (see Figure 5.1) is adopted [16], consisting of the surface or 0-plane, the 1-plane or inner Helmholtz plane (IHP), the 2-plane or outer Helmholtz plane (OHP) and a layer with diffuse charge (φd).
Adsorbed protons are located at the 0-plane while electrolyte adsorption occurs on the 1-plane. The electrostatic expressions for the charge σp at the planes for the triple-layer model are:
( )0 1 0 1Cσ = φ − φ (4)
( ) ( )1 2 1 2 1 0 1C Cσ = φ − φ − φ − φ (5)
2 0σ = (6)
In this work the location of the shear or zeta potential plane, ζ, is assumed to be located near the OHP, but is a function of the electrolyte concentration (see [16]). Due to double layer overlap, the radial potential in the diffuse part of the double layer can be assumed constant. This assumption of zero radial potential gradient is referred to as the uniform potential approach and results in a diffuse double layer charge σd given by

Electrolyte Retention of Supported Bi-Layered Nanofiltration Membranes
74
Figure 5.1: Schematic description of triple-layer model consisting of an inner and outer Helmholtz plane (IHP and OHP, respectively), comprising the so-called Stern layer and a diffuse double layer (not drawn to scale).
d12
n
i i
i
acF z x
=
σ = ∑ (7)
A crucial point in properly linking the charging properties to the transport behaviour in our NF model is the effect of charge regulation. This concept, describing the variation of double layer charge and potential as charged surfaces approach each other, e.g., [18], [19], allows the use of (zeta) potential and (surface) charge data of particles in dilute electrolyte solutions for the prediction of the charging properties in NF membrane pores with double layer overlap [16].
For the description of transport in this work the Maxwell-Stefan relations in one dimension (the direction of flow, z, see Figure 5.2) are used:

Chapter 5
75
ceff eff eff
1M M
d d d
d d d
nj i i ji i i i
i i i iji ij i
x N x Nx V x Np Fx x z H v
z RT z RT z Ð cÐ cÐ=
−φ− − − − = +∑ (8)
with xi the molar fractions of species i, iV the molar volumes, zi is the charge number, Hi
c is a correction factor for convective transport, v is the convective velocity, Ni are the species’ fluxes, and Ði
eff are the effective Maxwell-Stefan diffusion coefficients, In the model the solvent and solute activity coefficients are assumed unity and radial pore potential gradients are neglected [5], [8]. For the pore sizes used in this study (<2 nm) this uniform potential approach can be confidently used (see Fig. 9b in [5]). Other major assumptions in the model include: isothermal dead-end filtration system, cylindrical membrane pores, steady state ( d d 0iN z = ), external mass transport represented by a stagnant film of 10 µm thickness. For a detailed description and derivation of Eq. (8) the reader is referred to [8].
For our bi-layered membrane there are three interfaces (see Figure 5.2): the feed/silica interface, the silica/γ-alumina interface and the γ-alumina/support interface.
At all these interfaces we assume local thermodynamic equilibrium.
( ) ( )(+) (-) (+) (-) (+) (-)exp expi ii i i
z F Vx h x p p
RT RT
− − = φ − φ −
(9)
where the superscripts (+) and (-) denote locations just inside and outside the interface, respectively, and the term hi accounts for steric hindrance effects.
Some additional relations are needed to complete our model description but here only the key equations are given. For a more detailed description of the model the reader is referred to [8].
Electroneutrality must hold everywhere in the system.
1
0n
i i
i
z x=
=∑ . (10)
The boundary conditions are considered at the feed and the permeate. The feed concentrations, pressure and potential are fixed. In the permeate ‘e’ the concentrations are related to the fluxes,
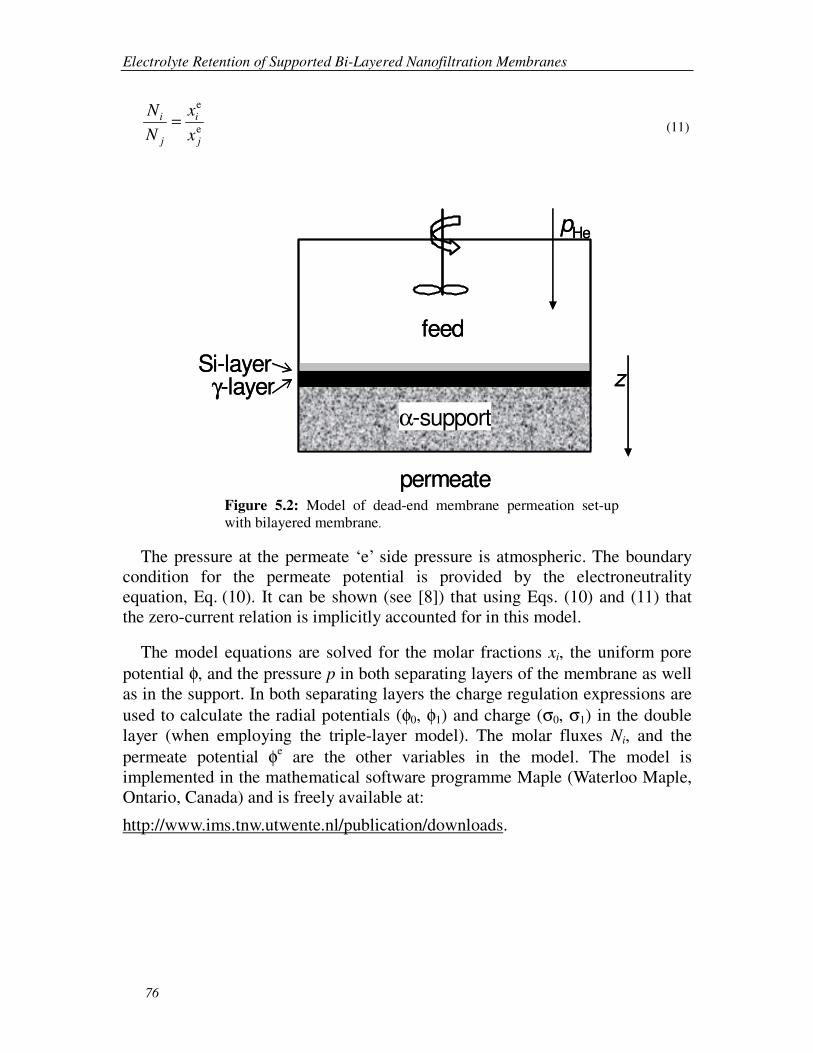
Electrolyte Retention of Supported Bi-Layered Nanofiltration Membranes
76
e
ei i
j j
N x
N x= (11)
γ-layer
α-support
z
feed
permeate
pHe
Si-layerγ-layer
α-support
z
feed
permeate
pHe
Si-layer
Figure 5.2: Model of dead-end membrane permeation set-up with bilayered membrane.
The pressure at the permeate ‘e’ side pressure is atmospheric. The boundary condition for the permeate potential is provided by the electroneutrality equation, Eq. (10). It can be shown (see [8]) that using Eqs. (10) and (11) that the zero-current relation is implicitly accounted for in this model.
The model equations are solved for the molar fractions xi, the uniform pore potential φ, and the pressure p in both separating layers of the membrane as well as in the support. In both separating layers the charge regulation expressions are used to calculate the radial potentials (φ0, φ1) and charge (σ0, σ1) in the double layer (when employing the triple-layer model). The molar fluxes Ni, and the permeate potential φe are the other variables in the model. The model is implemented in the mathematical software programme Maple (Waterloo Maple, Ontario, Canada) and is freely available at:
http://www.ims.tnw.utwente.nl/publication/downloads.

Chapter 5
77
5.2.1 Effect of two separating layers on ion retention
The main idea of applying a bi-layered NF membrane with separating layers featuring a different iso-electric point (IEP) is that such a system will perform better over a large pH range compared to a membrane with only one IEP. To show this characteristic, in Figure 5.3 the transport model is applied to calculate the effect of a bi-layered system on the retention of NaCl (for clarity only the Na+ retention is shown).
The selective membrane layers have identical material and adsorption properties, except for their different IEP, which are chosen arbitrarily. For the top layer IEP=5.0 and for the second separating layer IEP=8.3, as for γ-alumina. The achieved separation is compared to two monolayer membrane systems (having only one IEP), one with IEP=5.0 and one with IEP=8.3, respectively. The thickness of the separating layer in the monolayer systems is identical to the total thickness of the selective layers in the bipolar membrane.
The retention behaviour of the membranes with only one IEP in Figure 5.3 is already explained in detail in many papers in the open literature. The general trend is a high retention far away from the IEP and zero retention at the IEP (the retention of a few percent at the IEP in Figure 5.3 is caused by size exclusion).
As expected, for the bi-layered membrane the separation performance is relatively constant: the retention of the two-layer system over the whole pH range varies between 60-80%. At the IEPs of the respective layers, R≈80%, and this is a huge improvement compared to the performance of a monolayer membrane. There is, however, a small trade-off, because in the bi-layered system both layers contribute to retention, the overall retention is lower than that of a single material at a pH far removed from the IEP (e.g., at pH=4, R≈90% for the monolayer material with IEP=8.3 while R≈80% for the bi-layered system).

Electrolyte Retention of Supported Bi-Layered Nanofiltration Membranes
78
pHavg
4 6 8 10
RN
a+ [%
]
0
20
40
60
80
100
IEP1=5/IEP
2=8.3
IEP1=5/IEP
2=5
IEP1=8.3/IEP
2=8.3
Figure 5.3: Predicted Na+ retention for NF membranes with two different or a single iso-electric point as function of pH for a solution of 1 mol/m3 NaCl solution at 1 MPa. The iso-electric points of the top (1) and intermediate (2) layer are 5.0 and 8.3, respectively. The top and intermediate layers are γ-alumina (data from Table 5.2). Adsorption data for γ-alumina (except for the IEP) is used in the model calculations (see Table 5.1).
5.3 Experimental
5.3.1 Membrane materials
Ceramic membranes, consisting of a silica and γ-alumina layer on top of α-alumina support were prepared using sol-gel techniques. The α-alumina supports were prepared by filtering stabilised suspensions of AKP15 powder (Sumitomo Chemicals Ltd.) and consecutive sintering at 1150 °C. One layer of boehmite sol was applied on the support by dip-coating, resulting, after sintering at 600 °C, in the γ-alumina top layer. A more detailed description of the synthesis route for γ-alumina membranes has been reported elsewhere [20-23]. For the preparation of the silica membrane top layer a method reported by McCool et al. [24] was used. They describe the synthesis of a three-dimensional meso-porous cubic silica (MCM-48) membrane using a templating technique.

Chapter 5
79
5.3.2 Determination of membrane charging behaviour
To access the charging properties of the membrane, electrophoretic mobility and potentiometric titration measurements were conducted. For these experiments the separating membrane layers were made as unsupported films, following the same preparation method as for the supported layers. Those films were then ground and suspended in 1, 10 and 100 mol/m3 electrolyte solutions of NaCl at various pH. A detailed description of the preparation procedure of the solutions for the electrophoresis experiments is given elsewhere [9]. The potentiometric titration experiments were performed at the Physical Chemistry and Colloid Science Group of the University of Wageningen. A more detailed description of the techniques used for the determination of the membrane charging behaviour is given in the Appendix.
5.3.3 Water permeation
Assuming cylindrical pores, the (hydrodynamic) pore sizes of the separating layers can be determined by measuring the ultra-pure water flux. For γ-alumina this method has already been used previously and a pore size of 2.0 nm was obtained [9]. An explanation of this procedure is described in the Appendix.
5.3.4 Retention experiments
The ion retention experiments were performed at 25±1 °C on a dead-end permeation set-up with a volume of 2 dm3 under rapid stirring [9]. The retention experiments were conducted with aqueous solutions of 1 mol/m3 NaCl at various pH. The pH was adjusted using 0.25 mol/m3 NaOH and HCl.
During each pH experiment, permeate samples were collected at a pressure difference of 1.8 MPa. The ion concentrations in the feed and permeate were determined with an ion-chromatograph (Dionex DX120). The details of the setup and the procedure can be found in the Apendix.

Electrolyte Retention of Supported Bi-Layered Nanofiltration Membranes
80
5.4 Results and Discussion
5.4.1 Membrane materials
In Figure 5.4 a SEM micrograph of the ceramic membranes used for this study is shown. Contrary to the reports of McCool et al. [24], we did not obtain a meso-porous structure for the silica top layer. Instead, water permeation measurements showed that our silica had an average pore size in the micro-porous domain, similar to that of non-templated silica.
Also XRD results (not shown) did not show any 3D cubic structure. Therefore, although the precise microstructure of the membrane top layer is unknown, in the remainder of this chapter it will be referred to as micro-porous silica.
The thickness of the membrane layers used in this study was 1.9 mm for the support and 1.3 µm for the γ-alumina [25], while it was 0.4 µm for the silica (from SEM data).
Figure 5.4: SEM micrograph of silica/γ-alumina/α-alumina NF membrane.

Chapter 5
81
5.4.2 Comparison of measured and calculated retention
In this section, the experimentally determined retention of 1 mol/m3 NaCl through a supported bi-layered silica/γ-alumina membrane as a function of pH is compared to the predictions obtained with our transport model [8]. The adsorption and material data used in the model calculations are given in Table 5.1 and Table 5.2, respectively. This data was obtained using several experimental techniques. Their results and interpretation are explained in the Appendix.
Table 5.1: Adsorption properties for NaCl on γ-alumina and silica
Adsorption parameters
γ-alumina [16]
log(K+)=8.3, log(KNa)=log(KCl)=-0.7,
C1=1.2 [C/(V⋅m)], C2=50 [mC/(V⋅m)],
c//tot=1.33⋅10-5 [mol/m2]
Adsorption Parameters silica (c//tot from [17])
log(K+)=2.0, log(KNa)=log(KCl)=-4.0,
C1=0.88 [C/(V⋅m)], C2=48 [mC/(V⋅m)],
c//tot=1.33⋅10-5 [mol/m2]
Table 5.2: Measured solution and membrane properties
The variation in the feed pH displayed in Table 5.2 was determined by measuring the pH at the beginning and the end of every retention experiment. The average of these two pH values was then used for the model calculations.
The results of the experimental and model retention are shown in Figure 5.5. The measured retention of NaCl is high, between 90-100±5%, over the whole
pHavg Layer Thickness
[µm]
Permeability 1020 [m2]
ϕ/τ 2a [nm]
silica 0.40 0.17 0.05 0.8±0.2
γ-layer 1.3 ([25]) 2.3 [9] 0.17 [9] 2.0±0.2 [9]
4.0±0.5;
6.9±0.1;
7.4±0.1; .
8±0.25;
10.1±0.1;
8.2±0.9 ‡
support 1.9⋅103 15.8⋅103 [9] 0.09 [9] 197±30 [9]
‡Retention experiments performed in this order. Given pH deviations are variations between feed and retentate pH. ϕ and τ are the porosity and tortuosity of the respective layers and 2a denotes the average pore size.

Electrolyte Retention of Supported Bi-Layered Nanofiltration Membranes
82
pH range. The data for 4<pH<9 indicate that the chloride retention is constantly about 5% higher than that of sodium.
The experimental results in Figure 5.5 clearly indicate that separation performance of the bi-layered membrane is considerably better than for systems with only a γ-alumina layer. For γ-alumina membranes NaCl retentions of about 40% at pH≈9.5 were reported (at 1.6 MPa, [9]) while in the bi-layered system R≈95% in the alkaline region. This higher retention of the silica/γ−alumina system stems of course partly from the fact that the pore size of the silica layer is twice as small as that of the γ-alumina, but is also a direct result from the high (negative) membrane charge of the silica at neutral and alkaline pH. The high overall retention comes with a price however. The flux through the bi-layered system is about ten times lower than that of a supported membrane with only a γ-alumina layer (see [9]).
The solid lines in Figure 5.5 show the retention predictions using the transport model. For Na+ at pH values between 4 and 9 and for Cl- in the entire pH range the model retention predictions are in good agreement with the measurements (that is, within the experimental error in retention of 5%). For a pH of 4, however, the predicted chloride retention is lower than the sodium retention, in contrast with the experimental data.
At alkaline pH, both layers in the bi-layered system are negatively charged (IEPsilica=2.0 and IEPγ-alumina=8.3) and therefore a lower sodium than chloride retention is expected because of the presence of highly mobile hydroxyl ions. The OH- ions enhance the transport of sodium and hence reduce its retention. Both the experimental and the model results show this expected effect. However, the model predictions for sodium are a long way off from the measurements at pH=10. Where experimentally RNa=93% is found, the model predicts a retention of 58%. It is not clear what causes this large discrepancy but it is believed that its effect originates from structural changes in the silica [26] and concurrently it may also be that the parameters used to model the charging of silica (see the Appendix) are not valid anymore at such high pH values. The effect of structural changes will be discussed further in the following section on the membrane’s pH stability.

Chapter 5
83
pHavg
3 5 7 9 11
R [%
]
50
60
70
80
90
100
Na+
Cl-
Figure 5.5: Experimental silica/γ-alumina/α-alumina retention for Na+ (black circles) and Cl- (white circles) as a function of pH for 1 mol/m3 NaCl at 1.8 MPa trans-membrane pressure. Lines are Na+ (solid) and Cl- (dashed) model predictions.
In order to further understand the difference between the experimental data and the model predictions it is important to determine what the effect of both membrane separation layers is on the retention in different pH regions. To illustrate this, the contribution of the individual separating layers in the bi-layered system to the chloride retention as calculated with the model is shown in Figure 5.6. It shows that for pH>6 the membrane retention is completely determined by the silica layer. Therefore, the difference between the experimental and model retention in the alkaline pH region that we see in Figure 5.5 point to an incomplete description of the silica layer by the model.
At pH<6, Figure 5.6 indicates that the γ-alumina layer starts to contribute significantly to the overall NaCl retention. At these acidic pH values, the model predicts a lower retention for chloride than for sodium (Figure 5.5).

Electrolyte Retention of Supported Bi-Layered Nanofiltration Membranes
84
pHavg
3 5 7 9 11
RC
l- [%
]
0
20
40
60
80
100
γ-alumina
silica
Figure 5.6: Modeled Contribution of the chloride retention for the silica (dotted line) and γ-alumina (dashed line) layers to the overall bi-layer model retention (solid line) for a silica/γ-alumina/α-alumina membrane as a function of pH for 1 mol/m3 NaCl at 1.8 MPa trans-membrane pressure.
The reason for this result is the increased contribution of the γ-alumina to the overall model membrane retention coupled to the increased concentration of highly mobile protons.The experimental results, however, show instead a higher chloride retention at acidic pH. As in a system with only a silica layer at low pH (negatively charged membrane) the chloride retention is higher than that of sodium (because of the direction of the axial electric field), the experimental results indicate that even at low pH the silica layer dominates the retention of the membrane.
Due to difficult determination of the silica material parameters, the accurate prediction of the bi-layer retention over the entire pH region is hampered. Since an additional downside of the use of micro-porous silica material is its low trans-membrane flux, an option is to replace the silica top layer with a meso-porous titania layer, as titania can be much easier characterised and its meso-porous structure will result in a considerably higher flux.
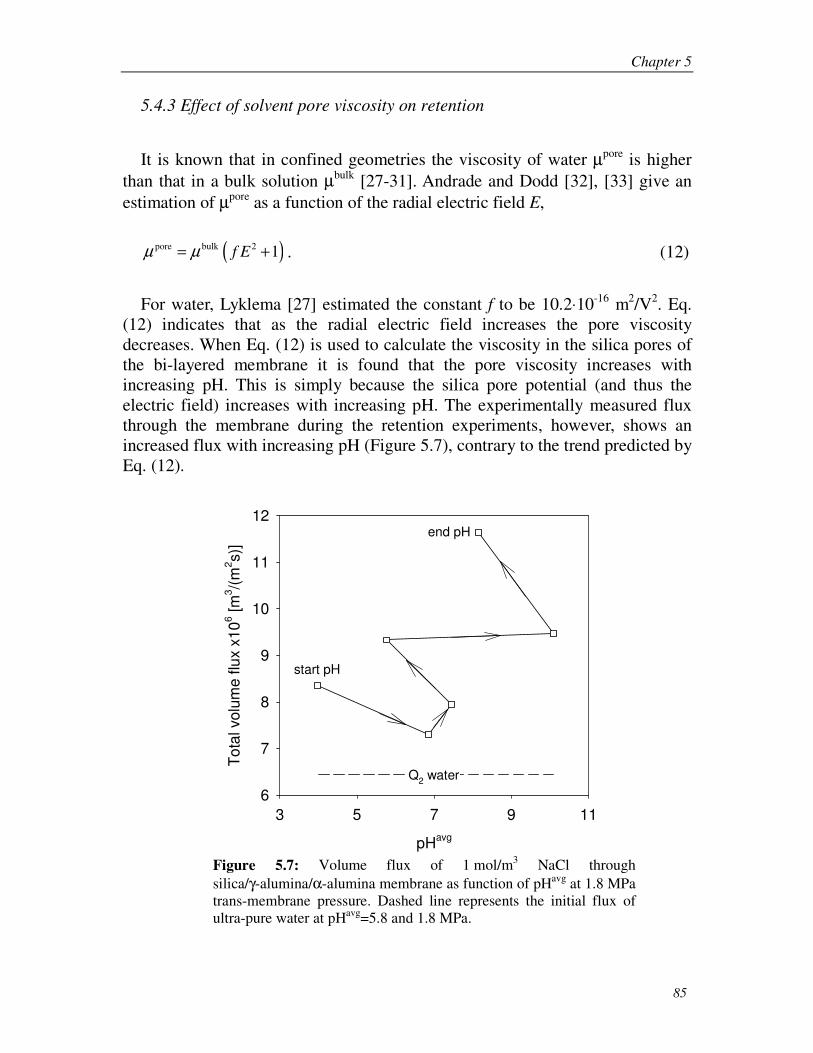
Chapter 5
85
5.4.3 Effect of solvent pore viscosity on retention
It is known that in confined geometries the viscosity of water µpore is higher than that in a bulk solution µbulk [27-31]. Andrade and Dodd [32], [33] give an estimation of µpore as a function of the radial electric field E,
( )pore bulk 2 1f Eµ µ= + . (12)
For water, Lyklema [27] estimated the constant f to be 10.2⋅10-16 m2/V2. Eq. (12) indicates that as the radial electric field increases the pore viscosity decreases. When Eq. (12) is used to calculate the viscosity in the silica pores of the bi-layered membrane it is found that the pore viscosity increases with increasing pH. This is simply because the silica pore potential (and thus the electric field) increases with increasing pH. The experimentally measured flux through the membrane during the retention experiments, however, shows an increased flux with increasing pH (Figure 5.7), contrary to the trend predicted by Eq. (12).
pHavg
3 5 7 9 11
To
tal volu
me flu
x x
10
6 [m
3/(
m2s)]
6
7
8
9
10
11
12
Q2 water
start pH
end pH
Figure 5.7: Volume flux of 1 mol/m3 NaCl through silica/γ-alumina/α-alumina membrane as function of pHavg at 1.8 MPa trans-membrane pressure. Dashed line represents the initial flux of ultra-pure water at pHavg=5.8 and 1.8 MPa.

Electrolyte Retention of Supported Bi-Layered Nanofiltration Membranes
86
This experimental result therefore indicates that probably the viscosity in the membrane pores is not any different from its bulk value, and therefore throughout this study whenever convective transport had to be considered, the bulk viscosity (0.9 mPa⋅s) was used.
5.4.4 Membrane pH stability
The stable pH range for γ-alumina was determined in previous work [9] to be 4<pH<10. Therefore, in this section the focus is only on the pH stability of the silica membrane layer.
The observed effect in Figure 5.7 of increasing flux with increasing pH could be due to a poor alkaline stability of the silica membrane. If this is the case, it could lead to dissolution of the top layer, resulting in an increase in the silica pore size and/or a reduction of the silica layer thickness. In literature it has been reported that some silicas prepared by templating techniques are stable for pH<5.4 [26]. However, for another MCM-48 silica, Nishiyama et al. [34] reported a stability up to pH=9. This ambivalence in the literature data seems to indicate that the pH stability of templated silicas is dependent on their preparation history.
We believe that the specific templated silica used in this study was stable for 4<pH<10. This conclusion is based on the experimental results of the ultra pure water flux before and after the retention experiments, displayed in Figure 5.8.
Although Figure 5.7 indicates that the flux through the silica layer is a strong function of pH, Figure 5.8 shows that this pH effect is reversible as that the water flux after the retention experiments is the same (within experimental error) as the initial ultra pure water flux. Therefore, the effect of pH from the retention experiments on the structural properties (that is, the pore size and layer thickness) of the silica layer was negligible on the time scale of our measurements.

Chapter 5
87
∆p [MPa]
0.0 0.5 1.0 1.5 2.0
To
tal vo
lum
e flu
x
x10
6 [m
3/(
m2s)]
0
2
4
6
Figure 5.8: Volume flux of ultra-pure water as a function of trans-membrane pressure before (white circles) and after (black circles) the complete series of retention experiments displayed in Figure 5.5. Solid line is fit according to Eq. A1 (see Appendix) of volume flux data collected before the series of retention experiments (white circles).
Apart from dissolution of the silica layer, the change in flux with pH of Figure 5.7 might also be due to a change in morphology of the templated silica material. Such structural changes were reported by Doyle and Hodnett [26]. They showed that MCM-48 changed its pore diameter in acidic conditions (pH<5.4) by ≈20%. Using X-ray diffraction they observed that the MCM-48 structure disappeared altogether at pH=6.9. Further transformations occurred at pH>9.1. If the templated silica in our study exhibited such structural changes, they were apparently reversible (cf. Figure 5.8) or had a minor influence on the transport properties in the silica layer of the membrane.
5.4.5 Influence of model input parameters on predicted overall retention
Apart from a physical origin, the discrepancy observed at alkaline pH between the experimentally measured sodium retention in Figure 5.5 and the predicted model value can be due to errors in the input parameters used to describe the silica layer in the model. In order to establish whether this is the

Electrolyte Retention of Supported Bi-Layered Nanofiltration Membranes
88
case a sensitivity analysis was performed on some of the key model input parameters for this layer, being its charging characteristics (KNa_Si=KCl_Si, C1_Si, C2_Si) and pore size (2aSi) or permeability (B0
Si). Their impact on the overall membrane retention predictions at pH=10.2 compared with the predictions shown in Figure 5.5 are discussed below.
The adsorption parameters for silica were varied by ±50% of their base case value (e.g., log(KNa)=-4.0±2.0). This large variation, however, only resulted in a change of the overall NaCl retention of less than 1% at pH=10.2. Clearly, the retention is not very sensitive to the values of the adsorption constants in this pH region, which can be explained from the very high (zeta) potential on the silica layer. Figure A.3 (see Appendix) shows that zeta potential at pH=10.2 is around -80 mV (in the silica pores the uniform potential is -184 mV) and the exclusion of chloride from the membrane is therefore almost complete. Even a significant variation in the silica adsorption parameters cannot change this situation (see also [9] for the case of Ca2+ ions). The deviation between the observed and predicted retention at alkaline pH in Figure 5.5 can therefore not be amended by changing the model’s adsorption parameters.
Changing the flux through the bi-layered membrane by varying the permeability of the silica layer has a more significant impact on the predicted overall retention. Figure 5.7 indicates that at high pH a 10-12 times higher flux is obtained. If B0
Si is increased by a factor of 10, while keeping the pore size at 0.8 nm, the overall retention of chloride ions changes by <1%. The Na+ retention, however, decreases by 15%. That is to be expected as the extra electrical field that is set up to prevent the transport of mobile charges in the membrane as a result of the increased flux, favours the transport of co-ions through the system, thereby reducing the retention of sodium. To obtain a better agreement between the predicted and experimental retention we would therefore have to reduce the silica permeability, but this is in conflict with the experimental data in Figure 5.7.
A change of the silica pore size, while keeping the permeability constant, will influence the membrane retention by means of steric hindrance. A pore size variation of 50% was investigated. For 2aSi=1.2 nm the sodium and chloride retention change at pH=10.2 was within the numerical accuracy of the model (that is <2%). When 2aSi was decreased to 0.4 nm, however, RNa decreased by 46% (RCl remained fairly unchanged). This can be understood by considering the competition between chloride and hydroxyl ion exclusion in the silica pore. For a smaller pore size the ratio of xCl
-/xOH- will increase as the much smaller
hydroxyl ions can still more easily enter the pores. As OH- is more mobile than Cl-, the trans-layer axial potential gradient will be smaller, thereby decreasing the sodium retention.
Chapter 5
89
If it would be assumed that the increase in permeability observed at alkaline pH (see Figure 5.7) is solely due to an increase in the silica pore size, both B0
Si and 2aSi would have to be increased in the model. By setting B0
Si=1.7⋅10-20 and 2aSi=1.2 nm (in keeping with the results in Figure 5.7) the Na+ retention at pH=10.2 increased by 9%, while RCl decreased by 4%. With these adjustments of the model parameters, the model predictions are in a better, but still poor, agreement with the experimental data and further improving it would mean that the model parameters would have to be set to physically unrealistic values.
5.5 Conclusions
The retention behaviour of supported bi-layered membranes for 1 mol/m3 NaCl as a function of pH is determined experimentally and compared with the results of a predictive transport model. The model calculations agree well with the experimental data, but at extreme pH of 10 the Na+ retention prediction is poor, probably due to the uncertainty in the model’s structure and charging parameters of the (templated) silica layer. To test if reducing this uncertainty in the model parameters will lead to a better agreement between the predicted and experimentally observed retention for a bi-layered membrane, in a future study the micro-porous silica layer should be replaced by a meso-porous titania that can be characterised much better and, additionally, will have a significantly higher flux.
5.6 Acknowledgements
The authors would like to thank Wika Wiratha and Alisia Peters of the Inorganic Material Science Group at University of Twente for the preparation of the membranes and Wim Threels of the Physical Chemistry and Colloid Science Group at Wageningen University for the potentiometric titration experiments.

Electrolyte Retention of Supported Bi-Layered Nanofiltration Membranes
90
5.7 References
[1] M.S. Hall, D.R. Lloyd and V.M. Starov, “Reverse Osmosis of Multicomponent Electrolyte Solutions. Part II. Experimental Verification,” J. Membrane Sci., 128, 39 (1997).
[2] J. Randon, A. Larbot, C. Guizard, L. Cot, M. Lindheimer and S. Partyka, “Interfacial Properties of Zirconium Dioxide Prepared by the Sol-Gel Process,” Colloids and Surfaces, 52, 241 (1991).
[3] J. Randon, A. Larbot, L. Cot, M. Lindheimer, S. Partyka, “Sulfate Adsorption on Zirconium Dioxide,” Langmuir, 7, 2654 (1991).
[4] A.E. Childress and M. Elimelech, “Effect of Solution Chemistry on the Surface Charge of Polymeric Reverse Osmosis and Nanofiltration Membranes,” J. Membrane Sci., 119, 253 (1996).
[5] W.B.S. De Lint, P.M. Biesheuvel and H. Verweij, “Application of the Charge Regulation Model to Transport of Ions through Hydrophilic Membranes: One-Dimensional Transport Model for Narrow Pores (Nanofiltration),” J. Colloid Interface Sci., 251, 131 (2002).
[6] T. Van Gestel, C. Vandecasteele, A. Buekenhoudt, C. Dotremont, J. Luyten, R. Leysen, B. Van Der Bruggen and G. Maes, “Salt Retention in Nanofiltration with Multilayer Ceramic TiO2 Membranes,” J. Membrane Sci., 209, 379 (2002).
[7] C. Labbez, P. Fievet, A. Szymczyk, A. Vidone, A. Foissy and J. Pagetti, “Analysis of the Salt Retention of a Titania Membrane using the “DSPM” model: Effect of pH, Salt Concentration and Nature,” J. Membrane Sci., 208, 315 (2002).
[8] W.B.S. De Lint and N.E. Benes, “Predictive Charge-Regulation Transport Model for Nanofiltration from the Theory of Irreversible Processes,” J. Membrane Sci., 243, 365 (2004).
[9] W.B.S. De Lint and N.E. Benes, “Separation Properties of γ-Alumina Nanofiltration Membranes Compared to Charge Regulation Model Predictions,” J. Membrane Sci., 248, 149 (2005).
[10] Y. Elmarraki, M. Cretin, M. Persin, J. Sarrazin and A. Larbot, “Elaboration and Properties of TiO2-ZnAl2O4 Ultrafiltration Membranes,” Mater. Res. Bull., 36, 227 (2001).
Chapter 5
91
[11] M. Urairi, T. Tsuru, S-I. Nakao and S. Kimura, “Bipolar Reverse Osmosis Membranes for Separating Mono- and Divalent Ions,” J. Membrane Sci., 70, 153 (1992).
[12] L. Krasemann and B. Tieke, “Selective Ion Transport across Self-Assembled Alternating Multilayers of Cationic and Anionic Polyelectrolytes,” Langmuir, 16, 287 (2000).
[13] A.A. Sonin and G. Grossman, “Ion Transport through Layered Ion Exchange Membranes,” J. Phys. Chem., 76, 3996 (1972).
[14] Y. Elmarraki, M. Persin, J. Sarrazin, M. Cretin and A. Larbot, “Filtration of Electrolyte Solutions with New TiO2-ZnAl2O4 Ultrafiltration Membranes in Relation with the Electric Surface Properties,” Sep. Purif. Technol., 25, 493 (2001).
[15] T. Tsuru, S-I. Nakao and S. Kimura, “Ion Separation by Bipolar Membranes in Reverse Osmosis,” J. Membrane Sci., 108, 269 (1995).
[16] W.B.S. De Lint, N.E. Benes, A. Van Der Linde, J. Lyklema and M. Wessling, “Determination of Ion-Adsorption Parameters from Zeta-Potential Measurements and Titration Data on a γ-Alumina Nanofiltration Membrane,” Langmuir, 19, 5861 (2003).
[17] T. Hiemstra, J.C.M. De Wit and W.H. Van Riemsdijk, “Multisite Proton Adsorption Modeling at the Solid/Solution Interface of (Hydr)oxides: A New Approach. II. Application to Various Important (Hydr)oxides,” J. Colloid Interface Sci., 133, 105 (1989).
[18] B.W. Ninham and V.A. Parsegian, “Electrostatic Potential Between Surfaces Bearing Ionizable Groups in Ionic Equilibrium with Physiologic Saline Solution,” J. Theor. Biol., 31, 405 (1971).
[19] D.Y.C. Chan, J.W. Perram, L.R. White and T.W. Healy, “Regulation of Surface Potential at Amphoteric Surfaces During Particle-Particle Interaction,” J. Chem. Soc. Faraday Trans. I, 71, 1046 (1975).
[20] A.F.M. Leenaars, K. Keizer and A.J. Burggraaf, “The Preparation and Characterization of Alumina Membranes with Ultra-Fine Pores. Part 1. Microstructural Investigations on Non-Supported Membranes,” J. Mater. Sci., 19, 1077 (1984).

Electrolyte Retention of Supported Bi-Layered Nanofiltration Membranes
92
[21] A.F.M. Leenaars and A.J. Burggraaf, “The Preparation and Characterization of Alumina Membranes with Ultrafine Pores. 2. The Formation of Supported Membranes,” J. Colloid Interface Sci., 105, 27 (1985).
[22] A.F.M. Leenaars and A.J. Burggraaf, “The Preparation and Characterization of Alumina Membranes with Ultra-Fine Pores. Part 3. The Permeability for Pure Liquids,” J. Membrane Sci., 24, 245 (1985).
[23] R.J.R. Uhlhorn, M.H.B.J. Huis in’t Veld, K. Keizer and A.J. Burggraaf, “Synthesis of Ceramic Membranes. Part I. Synthesis of Non-Supported and Supported γ-Alumina Membranes without Defects,” J. Mater. Sci., 27, 527 (1992).
[24] B.A. McCool, N. Hill, J. DiCarlo and W.J. DeSisto, “Synthesis and Characterization of Mesoporous Silica Membranes via Dip-Coating and Hydrothermal Deposition Techniques,” J. Membrane Sci., 218, 55 (2003).
[25] N.E. Benes, G. Spijksma, H. Verweij, H. Wormeester and B. Poelsema, “CO2 Sorption of a Thin Silica Layer determined by Spectroscopic Ellipsometry,” AIChE J., 47, 1212 (2001).
[26] A. Doyle and B.K. Hodnett, “Stability of MCM-48 in Aqueous Solution as a Function of pH,” Micropor. Mesopor. Mater., 63, 53 (2003).
[27] D.C. Grahame, “Effects of Dielectric Saturation upon the Diffuse Double Layer and the Free Energy of Hydration of Ions,” J. Chem. Phys., 18, 903 (1950).
[28] S. Basu and M.M. Sharma, “An Improved Space-Charge Model for Flow through Charged Microporous Membranes,” J. Membrane Sci., 124, 77 (1997).
[29] J. Lyklema, Fundamentals of Interface and Colloid Science. Volume II: Solid-Liquid Interfaces, Academic Press, London, 1995, chapters 2 and 4.
[30] J.N. Israelachvili, “Measurement of the Viscosity of Liquids in very Thin Layers,” J. Colloid Interface Sci., 110, 263 (1986).

Chapter 5
93
[31] M.L. Gee, P.M. McGuiggan, J.N. Israelachvili and A.M. Homola, “Liquid to Solid-like Transitions of Molecularly Thin Films under Shear,” J. Chem. Phys., 93, 1895 (1990).
[32] E.N.Da.C. Andrade and C. Dodd, Proc. Roy. Soc. (London), A187 (1946) 296.
[33] E.N.Da.C. Andrade and C. Dodd, Proc. Roy. Soc. (London), A204 (1951) 449.
[34] N. Nishiyama, H. Saputra, D.-H. Park, Y. Egashira and K. Ueyama, “Zirconium-Containing Mesoporous Silica Zr-MCM-48 for Alkali Resistant Filtration Membranes,” J. Membrane Sci., 218, 165 (2003).
[35] R.E. Johnson Jr., “A thermodynamic Description of the Double Layer Surrounding Hydrous Oxides”, J. Colloid Interface Sci. 100, 540 (1984).
[36] G.H. Bolt, “Determination of the Charge Density of Silica Sols”, J. Phys. Chem., 61, 1166 (1957).
[37] Th.F. Tadros, J. Lyklema, “Adsorption of Potential-Determining Ions at the Silica-Aqueous Electrolyte Interface and the Role of Some Cations”, J. Electroanal. Chem. 17, 267 (1968).
[38] R.W. O’Brien, L.R. White, “Electrophoretic Mobility of a Spherical Colloidal Particle”, J. Chem. Soc. Faraday. Trans. II 74, 1607 (1978).

94

95
Appendix
Nanofiltration Membrane Characterization

Appendix
96
Abstract:
Characterization techniques that were employed in Chapter 5 to determine
the electrolyte retention of supported bi-layered nanofiltration membranes are
briefly discussed in this section. They include the measurement of liquid
permeation, determination of membrane charging behaviour and zeta potential.

Appendix
97
A.1 Liquid permeation
The retention and liquid permeation experiments were performed on a 2 dm3 dead-end set-up (Figure A1) with rapid stirring (255 rpm). Additional cooling prevented temperature increase (>15°C without cooling) induced by the rapid stirring, providing constant temperature (25±1°C) during all experiments.
Figure A1: Liquid permeation setup
The retention experiments were conducted with aqueous solutions of 1 mol/m3
NaCl at various pH. The pH adjustment was performed by using 25
mol/m3 NaOH and HCl, and resulted in only slight increase of the ionic strength
of the electrolyte solutions of less than 6%.
During each pH experiment, permeate samples were collected at 1.8 MPa pressure difference. Ion concentrations in the feed and permeate were determined with an ion-chromatograph (Dionex DX120). A period of 1 hour was used to allow both the flux and the permeate retention to reach steady state, with continuous monitoring of permeate conductivity and flux in this equilibration period.
For the model calculations, the feed pH was determined as the average of pH values at the beginning and the end of every retention experiment, while the typical variation between the feed and retentate pH was within 0.5 pH unit, except around the iso-electric point where a pH difference of ≈1.5 was measured.

Appendix
98
In the water permeation experiments of the bi-layered membrane, the volume flow rate v is directly proportional to the trans-membrane pressure difference ∆p,
*0v B p= ∆ . (A1) (A1)
With the known thickness L and permeability of the support B0s and the
γ-layer B0γ (see Table 5.2, Chapter 5), silica permeability B0
Si was calculated to be B0
Si=1.7⋅10-21 m2 from the slope B0*, ( )γs Si
* s γ Si0 0 00
1 LL L
B B BBµ= + + by using the data
for the volume flux as a function of pressure difference for the silica/γ-alumina/α-alumina membrane from Figure 5.8, Chapter 5.
Benes et al. [1] determined a porosity ϕ of 15-25% for silica using spectroscopic ellipsometry. In this work we have used the value ϕ=25%. Assuming a tortuosity τ of the silica layer of 3, equal to that of γ-alumina [2], the pore size of the silica layer was determined to be 0.8 nm.
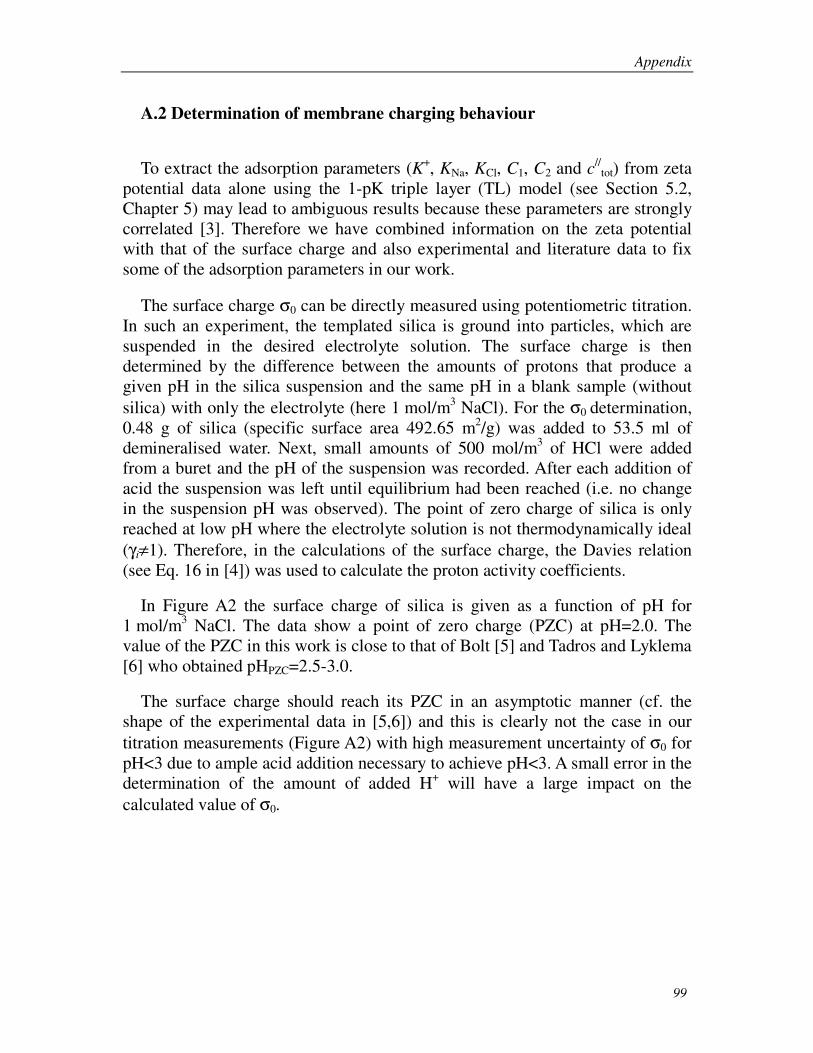
Appendix
99
A.2 Determination of membrane charging behaviour
To extract the adsorption parameters (K+, KNa, KCl, C1, C2 and c//tot) from zeta
potential data alone using the 1-pK triple layer (TL) model (see Section 5.2, Chapter 5) may lead to ambiguous results because these parameters are strongly correlated [3]. Therefore we have combined information on the zeta potential with that of the surface charge and also experimental and literature data to fix some of the adsorption parameters in our work.
The surface charge σ0 can be directly measured using potentiometric titration. In such an experiment, the templated silica is ground into particles, which are suspended in the desired electrolyte solution. The surface charge is then determined by the difference between the amounts of protons that produce a given pH in the silica suspension and the same pH in a blank sample (without silica) with only the electrolyte (here 1 mol/m3 NaCl). For the σ0 determination, 0.48 g of silica (specific surface area 492.65 m2/g) was added to 53.5 ml of demineralised water. Next, small amounts of 500 mol/m3 of HCl were added from a buret and the pH of the suspension was recorded. After each addition of acid the suspension was left until equilibrium had been reached (i.e. no change in the suspension pH was observed). The point of zero charge of silica is only reached at low pH where the electrolyte solution is not thermodynamically ideal (γi≠1). Therefore, in the calculations of the surface charge, the Davies relation (see Eq. 16 in [4]) was used to calculate the proton activity coefficients.
In Figure A2 the surface charge of silica is given as a function of pH for 1 mol/m3 NaCl. The data show a point of zero charge (PZC) at pH=2.0. The value of the PZC in this work is close to that of Bolt [5] and Tadros and Lyklema [6] who obtained pHPZC=2.5-3.0.
The surface charge should reach its PZC in an asymptotic manner (cf. the shape of the experimental data in [5,6]) and this is clearly not the case in our titration measurements (Figure A2) with high measurement uncertainty of σ0 for pH<3 due to ample acid addition necessary to achieve pH<3. A small error in the determination of the amount of added H+ will have a large impact on the calculated value of σ0.

Appendix
100
pH
1 3 5 7 9 11
σ0
[mC
/m2]
-180
-140
-100
-60
-20
20
Figure A2: Surface charge of silica as function of pH for 1 mol/m3 NaCl solution. Solid line is the model calculation of the triple-layer model combined with a 1-pK description of the surface adsorption chemistry.
The solid line in Figure A2 shows the 1-pK-TL model fit. A detailed description of the fitting of the adsorption parameters is given elsewhere [7]. Below we will briefly mention important features for the fitting procedure. The total number of sites on the silica surface, c//
tot, was fixed at 8 sites/nm2 using literature data [8]. Although there is some evidence suggesting that chloride adsorbs preferentially on silica [6], this effect, if present [5], will be small. In this study NaCl is therefore assumed to act as an indifferent electrolyte. As a result the adsorption constants for Na+ and Cl- were set equal in the fitting procedure (KNa=KCl).Because of the indifferent adsorption of NaCl, it holds that –log(K+) =pHPZC=pHIEP (with IEP and PZC the iso-electric point and point of zero charge of the material). Hence, during the fitting log(K+) was kept fixed at 2.0 (see Table 5.2, Chapter 5), in agreement with the experimental evidence for the surface charge and zeta potential (see next section A3 ‘Zeta Potential’). Hence, the three parameters that had to be determined were KNa, KCl (with KNa=KCl), and the Helmholtz capacities C1 and C2 (see Table 5.1, Chapter 5). Two data sets were used for the determination of the adsorption parameters: the σ0-pH and the ζ-pH data (see Figure A3) at 1 mol/m3 NaCl.

Appendix
101
A.3 Zeta potential
The zeta potential of silica material is obtained by electrophoresis [7]. The measured electrophoretic mobility of the silica membrane particles is converted into a zeta potential using the model proposed by O’Brien and White [9]. The measured zeta potentials and their fits with the 1-pK TL model are displayed in Figure A3 (the adsorption parameters were determined using only the ζ-pH data for 1 mol/m3 NaCl).
pH
1 3 5 7 9 11
ζ [m
V]
-120
-100
-80
-60
-40
-20
0
20
1 mol/m 3
10 mol/m 3
Figure A3: Zeta-potential of silica as function of pH for NaCl solutions of 1 mol/m3 (squares), 10 mol/m3 (triangles), and 100 mol/m3 (circles). Solid lines are model calculations of the 1-pK triple-layer model. The ζ-plane was located at 1γ1 (1 mol/m3), 0.98γ1 (10 mol/m3) and 0.96γ1 (100 mol/m3) of the outer Helmholtz plane [7].
The experimental data show an iso-electric point at pH=2.0±0.5. With increasing concentration the zeta potential is expected to decrease. For pH>pHIEP our experiments show this behaviour but at pH≤2.5, however, the zeta potentials at 10 mol/m3 lie below that of 100 mol/m3. It not clear what causes this deviation in zeta at 10 mol/m3.

Appendix
102
A.4 References
[1] N.E. Benes, G. Spijksma, H. Verweij, H. Wormeester and B. Poelsema, “CO2 Sorption of a Thin Silica Layer determined by Spectroscopic Ellipsometry,” AIChE J., 47, 1212 (2001).
[2] W.B.S. De Lint and N.E. Benes, “Separation Properties of -Alumina Nanofiltration Membranes Compared to Charge Regulation Model Predictions,” J. Membrane Sci., 248, 149 (2005).
[3] R.E. Johnson Jr., “A thermodynamic Description of the Double Layer Surrounding Hydrous Oxides”, J. Colloid Interface Sci. 100, 540 (1984).
[4] W.B.S. De Lint and N.E. Benes, “Predictive Charge-Regulation Transport Model for Nanofiltration from the Theory of Irreversible Processes,” J. Membrane Sci., 243, 365 (2004).
[5] G.H. Bolt, “Determination of the Charge Density of Silica Sols”, J. Phys. Chem., 61, 1166 (1957).
[6] Th.F. Tadros, J. Lyklema, “Adsorption of Potential-Determining Ions at the Silica-Aqueous Electrolyte Interface and the Role of Some Cations”, J. Electroanal. Chem. 17, 267 (1968).
[7] W.B.S. De Lint, N.E. Benes, A. Van Der Linde, J. Lyklema and M. Wessling, “Determination of Ion-Adsorption Parameters from Zeta-Potential Measurements and Titration Data on a γ-Alumina Nanofiltration Membrane,” Langmuir, 19, 5861 (2003).
[8] T. Hiemstra, J.C.M. De Wit and W.H. Van Riemsdijk, “Multisite Proton Adsorption Modeling at the Solid/Solution Interface of (Hydr)oxides: A New Approach. II. Application to Various Important (Hydr)oxides,” J. Colloid Interface Sci., 133, 105 (1989).
[9] R.W. O’Brien, L.R. White, “Electrophoretic Mobility of a Spherical Colloidal Particle”, J. Chem. Soc. Faraday. Trans. II 74, 1607 (1978).

103
Chapter 6
Evaluation and Recommendations
Evaluation and Recommendations
104
Abstract:
In this thesis thin supported silica membranes have been discussed. Several
transport-related aspects have been investigated: gas transport efficiency in
terms of different support geometries (Chapter 2), transport of binary gas
mixtures consisting of components with a large difference in mobility (Chapter
3), and gas transport enhancement due to the use of surfactant-tempated silica
intermediate layer (Chapter 4). For the characterization of the thin supported
membrane layers the use of non-destructive techniques can be advantageous,
and spectroscopic ellipsometry has been used throughout this thesis (Chapters 3
and 4) to determine the layer thickness, porosity and sorption properties.
Moreover, a silica membrane modified by using templating techniques has been
investigated in a concept of bilayered nanofiltration membranes applicable over
a large pH range (Chapter 5). This chapter gives a brief evaluation of the results
presented in this thesis together with some recommendations for future work.

Chapter 6
105
6.1 Gas Transport in Microporous Silica Membranes
For the description of (multicomponent) gas transport in (micro)porous media, the generalized Maxwell-Stefan can be used. In this formulation driving forces (such as the gradient in chemical potential) are balanced by frictional forces. These frictional forces can for instance arise from intermolecular collisions or collisions between mobile species and a solid medium. For transport of gases in porous media this approach leads to the well-known Dusty Gas Model that accounts for different simultaneous occurring gas transport mechanisms (Knudsen diffusion, bulk diffusion and viscous flow). In Chapter 2 the Dusty Gas Model has been used to determine the gas transport efficiency of ceramic membranes in terms of different support geometries (planar (i.e., flat plate), tubular, multichannel) for pure hydrogen and 50-50% binary hydrogen/methane mixture, in terms of flux and permselectivity.
For the highly permeable silica the observed inefficiency of the inner channels rendered the multichannel configuration to be far less efficient than the multitubular one, even though the surface-area-to-volume ratio is higher in the former case. The increase of permeance led to even more dominant support resistance, and to put this into right perspective the modelling study of the support resistance can be extended to a case with lower bulk transport contribution. This signifies the importance of a proper transport description and awareness of the transport limitations imposed by the support resistance. These issues can be resolved by preparation of high-quality hollow fibre microporous silica membranes for gas separation with smaller overall membrane thickness and, hence, reduced support resistance. Some promising efforts to this end are already underway [1].
In Chapter 3, transport of binary gas mixtures consisting of components with a difference in mobility through microporous silica membrane was investigated. Flux values of the more mobile component (He) in the presence of the less mobile component (H2O) were correlated with sorption data for H2O obtained in-situ from the thin supported membrane layers by spectroscopic ellipsometry. A microscopic theory was used to describe transport of binary gas mixture through the microporous silica membrane.
There is a need for further theoretical development since none of the available theories take into account the fact that also the complexity of the porous medium can play a role as the difference in mobility of the components increases. The effect of the decreased flux of the more mobile component in the presence of less mobile component is more pronounced if network has low connectivity, as is the case for microporous silica membranes. To enable better comparison with

Evaluation and Recommendations
106
the results of the Monte Carlo (MC) simulations [2], experimental conditions should be chosen in accordance with the conditions set in those MC simulations involving no gradient in concentration of the less mobile component across the membrane.
In Chapter 4, it was demonstrated that the addition of surfactant-tempated silica layer between the intermediate γ-alumina and the upmost silica layer could enhance gas transport. Deposition of thinner selective layer with reduced penetration into the supporting structure resulted in a lower transport resistance. Surfactant-templating silica layers may also provide a more hydrophobic and hence more hydrothermally stable porous medium, if a sufficient amount of organic groups is preserved within the material after the calcination procedure.
6.2 Spectroscopic Ellipsometry
Spectroscopic ellipsometry is an optical, non-destructive technique enabling characterization of thin supported layers in terms of thickness, porosity, refractive index, and sorption properties. Sorption experiments are usually performed under specific conditions of controlled temperature, pressure, and humidity. The advantage of spectroscopic ellipsometry used for sorption studies is that dynamic sorption processes can be followed in situ for actual thin supported membrane (silica) layers. However, data analysis is complicated and the measurements require precise control of the experimental conditions. In addition, the optical properties of solid silica (without porosity) as prepared in this study are unknown. One option is to model them as indicated in Chapter 3, while another option would be to assume that the value is similar to another material, such as quartz. This limits proper data analysis.
The ellipsometer used in a study of water sorption was operated in the visible light range recording the optical signal as a function of degree of water sorption. Some recent developments indicate that infrared ellipsometry can be used to probe the presence of and behaviour of relevant functional groups, such as Si-O-Si, Si-OH, and HOH. An example is monitoring of water presence and the evolution of water content during formation of (mesostructured) silica films prepared by dip-coating [3]. This concept can further be coupled with temperature-programmed sorption [4] in order to better monitor the equilibrium and kinetics of sorption. It can be even attempted combine these concepts to investigate a degree of membrane degradation due to the presence of water at high temperatures.

Chapter 6
107
6.3 Supported Bi-layered Membranes for Electrolyte Retention
In Chapter 5 the retention behaviour of supported bi-layered (silica/ γ-Alumina) membrane for 1 mol/m3 NaCl as a function of pH has been determined experimentally. The results are compared with predictions from a numerical model based on the model presented by De Lint et al. [5]. The model accounts for charge regulation effects of aqueous salt solutions in the small pores of metal oxides and has been extended to incorporate the charging effects of the two separating layers present in a bi-layered membrane. The general agreement between experimental data and model predictions was found to be good, with a discrepancy at high pH (pH 10) in case of sodium retention. The sensitivity analysis on key input parameters showed that this discrepancy can not be amended by a simple change of parameters within the physically realistic values.
As mentioned in Chapter 5 and in the Appendix, the accurate prediction of the bi-layer retention over the entire pH region is hampered due to the fact that the values of silica material parameters, such as surface charge and zeta potential, are not known or not accurate over the entire pH. Additional disadvantage is that porous silica material used in Chapter 5 shows low trans-membrane flux. An option would be to replace the silica top layer with another porous transition metal oxide layer, such as titania.
A general requirement for extending the bi-layered concept to other materials would be that the iso-electric points (IEP) of the materials comprising the bi-layered membrane are sufficiently different to ensure consistent retention over entire pH range and that the materials are stable at extreme pH values. Care should be taken to provide specific and tuneable pore size of the resulting membrane. Possible materials are other transition metal oxides like titania and zirconia materials [6]. Additionally, in this way the applicability of the here discussed bilayered membrane concept and of the employed model of De Lint and Benes [5] can be further tested for predicting ion retention in case of other transition metal oxides.

Evaluation and Recommendations
108
6.4 References
[1] T.A. Peters, J. Fontalvo, M.A.G. vorstman, N.E. Benes, R.A. van Dam, Z.A.E.P. Vroon, E.L.J. van Soest-Vercammen and J.T.F. Keurentjes “Hollow fibre microporous silica membranes for gas separation and pervaporation: synthesis, performance and stability”, Journal of Membrane Science 248 (1-2) 73-80 (2005)
[2] N.E. Benes, H.J.M. Bouwmeester, and H. Verweij, “Multi-Component Lattice Gas Diffusion,” Chem. Eng. Sci, 57, 2673 (2002)
[3] A. Brunet-Bruneau, A. Bourgeois, F. Cagnol, D. Grosso, C. Sanchez, and J. Rivory “An in situ study of mesostructured CTAB-silica film formation using infrared ellipsometry: evolution of water content” Thin Solid Films 455-456, 656-660 (2004)
[4] J. M. Mugge “Adsorption Isotherms from Temperature-Programmed Physisorption – Equilibrium and Kinetics” PhD Thesis University of Twente (2000)
[5] W.B.S. De Lint and N.E. Benes, “Predictive Charge-Regulation Transport Model for Nanofiltration from the Theory of Irreversible Processes,” J. Membrane Sci., 243, 365 (2004)
[6] G.I. Spijksma, C. Huiskes, N.E. Benes, H. Kruidhof, D.H.A. Blank, V. Kessler, and H.J.M. Bouwmeester “Microporous Zirconia–Titania Composite Membranes Derived from Diethanolamine-Modified Precursors” Advanced materials (2006) DOI: 10.1002/adma.200502568

Chapter 6
109

110
Summary
This thesis discusses several transport-related aspects relevant for the application of thin supported silica membranes for gas separation and nanofiltration.
The influence of support geometry on overall membrane performance is investigated. Planar (i.e., flat plate), tubular, and multichannel support geometries are investigated in numerical simulations of the membrane performance in gas separation. The emphasis is laid on the last two membrane geometries which are considered more suitable due to their greater surface-area-to-volume ratio and mechanical robustness. The dusty-gas-model (DGM) is used, and the contribution of different transport mechanisms occurring in a porous system (Knudsen diffusion, bulk diffusion and viscous flow) is accounted for. The comparison of geometries is performed in terms of the calculated flux and selectivity, in case of separation of pure H2 and of a 50-50% binary H2/CH4 mixture. The multichannel configuration is found to be far less efficient than the multitubular one due to the inefficiency of the inner channels, even in the case of highly permeable silica - where the transport is governed by the support - and even though the surface-area-to-volume ratio is higher in the multichannel configuration. For a proper prediction of transport behaviour it is crucial to account for the three transport mechanisms included in the DGM, especially in case of the binary mixtures. Calculations for the binary mixture show that the inner channels contribute to a considerable decline of the selectivity. Even values below unity may be obtained in the case of highly permeable silica, i.e. indicating a higher transport rate of CH4 compared to H2. For a leaking inner channel, a maximum in selectivity is observed for a certain value of permeability of silica for H2. Further improvement of the silica membrane layer would thus result in a decreased performance of the multichannel membrane.
The transport of binary mixtures containing an inert mobile component such as He and a condensable component such as H2O through a microporous silica membrane has been investigated using spectroscopic ellipsometry. Attention is focussed to the correlation between the flux of the more mobile component and the sorption properties of the condensable component. A linear decline of the normalized He permeance as a function of water occupancy is observed. This behaviour is agreement with a theoretical description of the transport where the microporous medium is considered as an ideal lattice of sites. However, departures from linear behaviour are observed experimentally at low temperatures, where water has low molecular mobility, which can not be accounted for by the theoretical description.

111
It is demonstrated that an improved membrane performance in gas separation can be achieved by incorporating an additional intermediate surfactant templated silica layer between the supporting mesoporous γ-Al2O3 and the amorphous microporous silica top layer. The dual-layered silica membrane shows improved values of H2 flux and H2/CH4 permselectivity compared with that of a standard silica membrane.
Throughout this thesis spectroscopic ellipsometry is used as a non-destructive characterization technique to determine the thickness and porosity of the as-deposited membrane layers, but also to monitor in-situ the sorption of water by the membrane.
Improved ion retention can be achieved by using a bilayered nanofiltration membrane. The novel bilayered membrane concept is based on a difference in iso-electric point between the two separating layers in the membrane allowing improved ion retention over a large pH range. The composite membrane consisting of a γ-alumina layer and a surfactant templated silica layer, similar to that investigated for the improvement of membrane performance in gas separation, is analyzed in terms of the retention of monovalent ions (Na+, Cl-) over the pH range 4-10. A good agreement is found between experimental data and model predictions, with a discrepancy at high pH (pH 10) in case of sodium retention.

112
Samenvatting
Dit proefschrift behandelt verschillende transportgerelateerde aspecten die van belang zijn voor de toepassing van gedragen silica membranen in gasscheiding en nanofiltratie.
De invloed van dragergeometrie op de prestaties van membranen in gasscheiding wordt onderzocht. Vlakke, buisvormige en multichannel membranen worden bestudeerd aan de hand van numerieke simulaties van de membraanprestaties in gasscheiding. De nadruk wordt gelegd op de twee laatstgenoemde membraangeometriën die meer geschikt worden geacht in verband met hun grotere oppervlakte-volume verhouding en mechanische robuustheid. Het dusty-gas-model (DGM) wordt gebruikt met inachtneming van de verschillende mechanismes van transport die kunnen optreden in een poreus systeem (Knudsen diffusie, bulk diffusie en viskeuze stroming). De vergelijking van de verschillende geometriën vindt plaats op basis van de berekende flux en selectiviteit, in het geval van scheiding van puur H2 en van een 50-50% binair H2/CH4 mengsel. Gevonden wordt dat de multichannel configuratie veel minder efficiënt is dan de configuratie waarbij meerdere buizen gebruikt worden vanwege de inefficiëntie van de binnenste channels, zelfs wanneer zeer permeabel silica gebruikt wordt - waarbij het transport beheerst wordt door de drager -, en ondanks het feit dat het oppervlakte-volume verhouding hoger is in de multichannel configuratie. Voor een juiste voorspelling van het transportgedrag is het belangrijk rekening te houden met de drie transportmechanismes in het DGM model, vooral in het geval van binaire mengsels. De berekeningen voor het binaire mengsel laten zien dat de binnenste channels bijdragen aan een aanzienlijke verlaging van de selectiviteit. In het geval van zeer permeabel silica kunnen zelfs waarden lager dan één verkregen worden, wat inhoudt dat de transportsnelheid van CH4 groter is dan die van H2. In het geval van een lek in één van de binnenste channels wordt bij bepaalde waarde van de permeabiliteit voor silica een maximum in de selectiviteit waargenomen. Verbetering van de silica membraanlaag leidt dus aldus tot een minder goede prestatie van het multichannel membraan.
Het transport van binaire mengsels met een inerte mobiele component zoals He en een condenseerbare component zoals water in microporeus silica wordt bestudeerd met behulp van spectroscopische ellipsometrie. Aandacht gaat uit naar de correlatie tussen de flux van de meer mobiele component en de sorptie-eigenschappen van water. Waargenomen wordt een lineaire afname van de genormaliseerde He permeatie als functie van de bezettingsfractie van water. De waargenomen afhankelijkheid is in overeenstemming met een theoretische beschrijving van het transport van binaire mengsels waarbij het microporeuze
113
medium wordt beschouwd als een ideaal rooster met punten. Experimenteel worden afwijkingen van het lineaire gedrag waargenomen bij lage temperaturen, waar water een lage moleculaire mobiliteit heeft, welke niet verklaard kunnen worden door de theoretische beschrijving.
Het wordt aangetoond dat een verbeterde membraanprestatie in gasscheiding verkregen kan worden door het inbouwen van een extra surfactant-templated silicalaag tussen de mesoporeuze γ-Al2O3 drager en de amorfe microporeuze silica toplaag. In vergelijking met een standaard silica membraan geeft het twee-laagse silicamembraan verbeterde waarden van de H2 flux en H2/CH4 selectiveit.
In het onderzoek beschreven in dit proefschrift wordt spectroscopische ellipsometrie gebruikt als een niet-destructieve karakteriseringtechniek voor de bepaling van dikte en porositeit van aangebrachte membraanlagen, maar tevens om in-situ sorptie van water door het membraan te monitoren.
Een verbeterde ionenretentie kan verkregen worden door gebruikmaking van een twee-laags nanofiltratiemembraan. Het nieuwe twee-laags concept is gebaseerd op een verschil in iso-elektrisch punt van de twee scheidingslagen in het membraan en maakt een verbeterde retentie van ionen mogelijk over een breed pH gebied. Het composiet membraan, bestaande uit een γ-alumina en een surfactant-templated silicalaag, gelijk aan dat gebruikt voor de verbetering van de membraanprestatie in gasscheiding, wordt bestudeerd aan de hand van de retentie van monovalente ionen (Na+, Cl-) in het pH gebied 4-10. Er wordt een goede overeenstemming gevonden tussen experimentele data en model voorspellingen, met een discrepantie bij hoge pH (pH 10) in het geval van retentie van natrium ionen.

114
Acknowledgements
PhD study has been a great learning experience and I would like to thank to a number of people for their professional and personal support and for sharing those years with me.
My thanks first go to Nieck Benes who introduced me to the subject of ceramic membranes in 2002 and was my supervisor for the first two years. I am also very grateful to Henny Bouwmeester who supervised my research thereafter.
Special thanks to my promotor Dave Blank and co-promotor Arian Nijmeijer for their support, and for their inspiring personalities that made time spent in the group and on the EU project truly enjoyable. I am also very grateful to all members of the Dissertation Committee.
Since October 2006, while completing my thesis, I have started working at Shell International B.V., in the Intellectual Property Department, The Hague. I would like to give my warm thanks to my line manager Robert Matthezing and to my mentor Michiel Cramwinckel for their understanding and support.
Membrane research was a great teamwork thanks to enthusiastic Master students Sjoerd Kuipers, Chunlin Song and Tijs van Olfen. My special thanks go to Samuel de Lint for collaboration on nanofiltration membranes. I am very grateful to Herbert Wormeester of the Solid State Physics Group for his guidance of my humble efforts to master the art of operating spectroscopic ellipsometer. For sharing their membrane expertise with me I would like to thank Henk Kruidhof, Louis Winubst, Mieke Luiten-Olieman, and Cindy Huiskes of the Inorganic Membranes Group. Further, I would also like to thank to all the members of the Central Materials Analysis Laboratory for their characterization expertise. For wondrous and ability to make and reshape any of my set-ups in no time, I am grateful to Attila Csaki and Gerrit Mollenhorst.
A very special thanks to my EU project partners for the truly enjoyable project meetings all over Europe (Norvay, Grece, Germany, The Netherlands) and in South Africa: Paul Pex, Jaap Vente, Henk van Veen (ECN), Truls Norby, Reidar Haugsrud (U. Oslo), Hans Olapinski, Barbara Seling, Kimball Roelofs (Membraflow), Rune Bredesen, Yngve Larring (Sintef), Suzana Nunes, Sergey Shishatskiy (GKSS), Vladimir Linkov, Ben Bladergroen (UWC), Costas Stournaras, Vassillis Stathopoulos (Cereco), Michael Stoukides, George Marnellos (CPERI).

115
Big thanks to all colleagues and friends from UT, the Inorganic Materials Science Group, Inorganic Membrane Group, PhD Network, and the fantastic ladies of the Female Faculty Network Board for our wonderful time together. Special thanks to Monse Garcia Curiel of the IMS Group, and especially to my paranimfs Gerald Spijksma and Biba Potic. I am truly grateful to all my Serbian friends, especially to those at UT and in The Netherlands, for bringing a dash of home to a life in Holland! To my longest time friend Ana Jokovic I am thankful for being always close through all our life changes.
My husband Miroslav and our son Marko have given me so much love, and are, together with my parents and sister, my dearest loving and supportive companions on this great journey!
