this is your presentation title rcp roadshow central... · • internal audit functions 7 . 8 ......
TRANSCRIPT

www.WayUp.my
ezBE MEASURING PRODUCTIVITY PERFORMANCE THROUGH PRODUCTIVITY TOOLKITS
==============================================================
6 OCTOBER 2018 ║ HILTON PETALING JAYA
JOSFFA BIN ISMAIL

Introduction on Malaysia Productivity Corporation (MPC)
Driving Productivity of the Nation
Chemical Productivity Nexus (CPN)
Understanding Productivity & Its Benefits
Measuring Productivity through ezBE (Step by Step)
Q & A
AGENDA TABLE OF CONTENTS

3
VISION The leading organisation in productivity enhancement for global competitiveness and innovation.
MISSION To deliver high impact services towards achieving performance excellence through innovation for the betterment of life.

Nurturing innovative and creative culture for productivity and competitiveness through partnership programmes.
OBJECTIVES
4
Developing human capital and organisational excellence for
building a knowledge-based workplaces through training, systems
development and best practices.
Providing value-added information on productivity, quality,
competitiveness and best practices through research activities
and databases.
Conducting review on regulation and promoting Good
Regulatory Practice to create a more competitive
business environment

National Productivity Council was established in 1962 as a joint project between the United Nations Special Fund and the Federal Government, with the International Labour Organisation acting as its executing agency.
In 1966, the National Productivity Council (Incorporation) was established as an autonomous body.
This act was subsequently amended as the National Productivity Corporation (Incorporation) in 1991.
With effect from 21st February 2008, in keeping with the expanded role of the corporation, National Productivity Corporation (NPC) is officially known as Malaysia Productivity Corporation.
HISTORY
5

MPC data. Productivity levels based on constant 1987 prices between 1960 – 2005, and on constant 2010 prices in later periods. Source: MPC
Management
Training &
Advisory
Services
Research &
Systems
Development
Productivity &
Efficiency
Enhancement
Benchmarking &
Best Practices
Competitiveness &
Innovation
Industrialization
5.2%
RM13,768
Productivity improvement
Knowledge-driven
economy
Balanced growth Focus Driving Productivity of the Nation
1960 1990 1995 2000 2005 2010 2015
• Established as mgmt training
organisation
• 1st Nat'l Productivity
Campaign
• Consultative panels for
research focus
• 1st Annual Productivity Report
• TFP measures for national &
sector output
• Service Efficiency Award by
NCCI
• Became partner institute with
IMD and WEF
• Won UN Public Service
Award
• 2.5X increase in programs and
participants5
• Secretariat to Doing Business
focus groups
Smart
Regulation
Delivery Management
Office
Beyond 2020
• 9 Nexus led by Industry champion formed
• Established DMO in MPC to coordinate , monitor , &
evaluate implementation of initiatives
2.3%
RM13,029
Productivity Growth & Level
MPC Achievements
Improvement in infrastructure
Priorities have evolved since its inception MPC has consistently aligned its strategies with the nation's five-year economic plans
3.7%
RM27,221
5.0%
RM56,863
3.4%
RM75,548
3.7%
RM92,300 annual target
PQCI Journey
* Note: Productivity, Quality, Competitiveness, Innovation
*
6
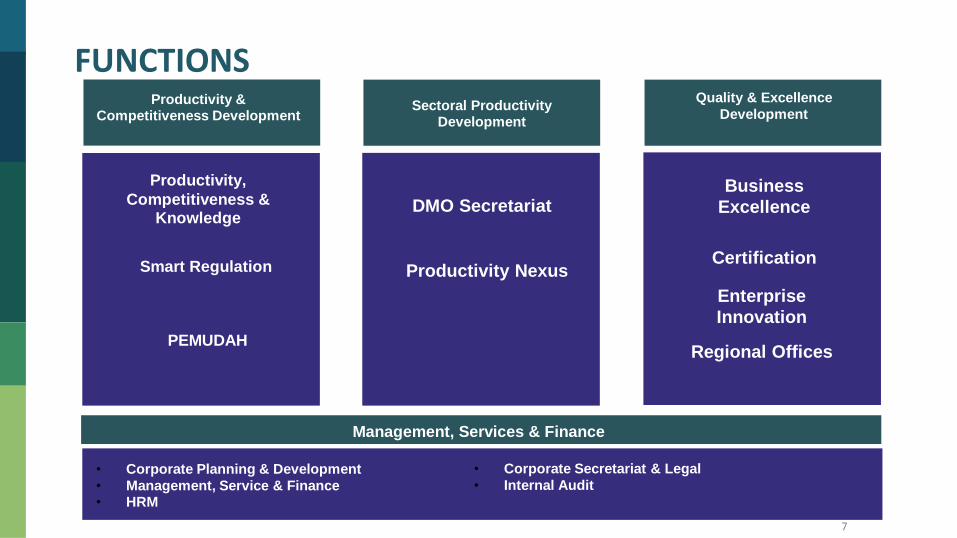
Productivity & Competitiveness Development
Smart Regulation
Productivity,
Competitiveness & Knowledge
PEMUDAH
Sectoral Productivity Development
DMO Secretariat
Productivity Nexus
Management, Services & Finance
• Corporate Planning & Development
• Management, Service & Finance • HRM
Quality & Excellence
Development
Business
Excellence
Certification
Enterprise
Innovation
Regional Offices
• Corporate Secretariat & Legal
• Internal Audit
FUNCTIONS
7

8
Kepala Batas
Kuala Terengganu
Kota Bharu
Kuantan
Kuching
Kota Kinabalu
Johor Bahru
MPC HQ, Petaling Jaya, Selangor
MPC PJ8 Petaling Jaya, Selangor
MPC LOCATION OF OFFICES
Headquarters & Centre Region Office Petaling Jaya
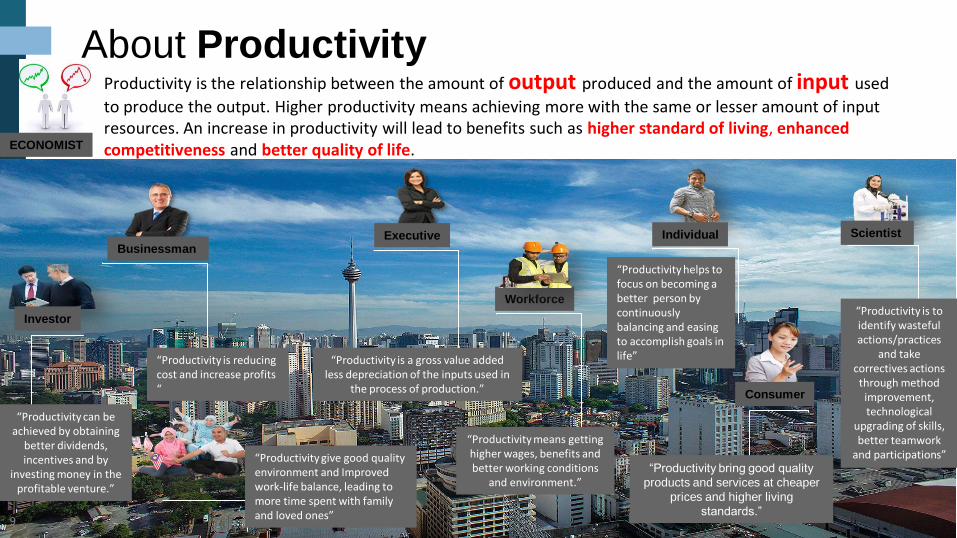
About Productivity Productivity is the relationship between the amount of output produced and the amount of input used
to produce the output. Higher productivity means achieving more with the same or lesser amount of input resources. An increase in productivity will lead to benefits such as higher standard of living, enhanced competitiveness and better quality of life.
Businessman Executive
Workforce
Investor
Scientist Individual
Consumer
9
“Productivity is reducing cost and increase profits “
“Productivity can be achieved by obtaining
better dividends, incentives and by
investing money in the profitable venture.”
“Productivity means getting higher wages, benefits and better working conditions
and environment.”
“Productivity is a gross value added less depreciation of the inputs used in
the process of production.”
“Productivity is to identify wasteful actions/practices
and take correctives actions through method improvement, technological
upgrading of skills, better teamwork
and participations” “Productivity give good quality environment and Improved work-life balance, leading to more time spent with family and loved ones”
ECONOMIST
“Productivity helps to focus on becoming a better person by continuously balancing and easing to accomplish goals in life”
“Productivity bring good quality
products and services at cheaper
prices and higher living
standards.”

Better Quality of Life
Higher Standard of Living
Higher Gross Domestic Product
Increase in
Employment
Quality of
Workforce
Quality of
Capital
Qualitative Inputs Quantitative Inputs
Higher Productivity
Higher Total Factor Productivity
3.7% 1.3%-2.3%
2.3% Higher Capital Intensity
1.4%
Private Investment Growth 9.4%
5% -6%
Quality of
Systems
PRODUCTIVITY MEASUREMENT FRAMEWORK
10
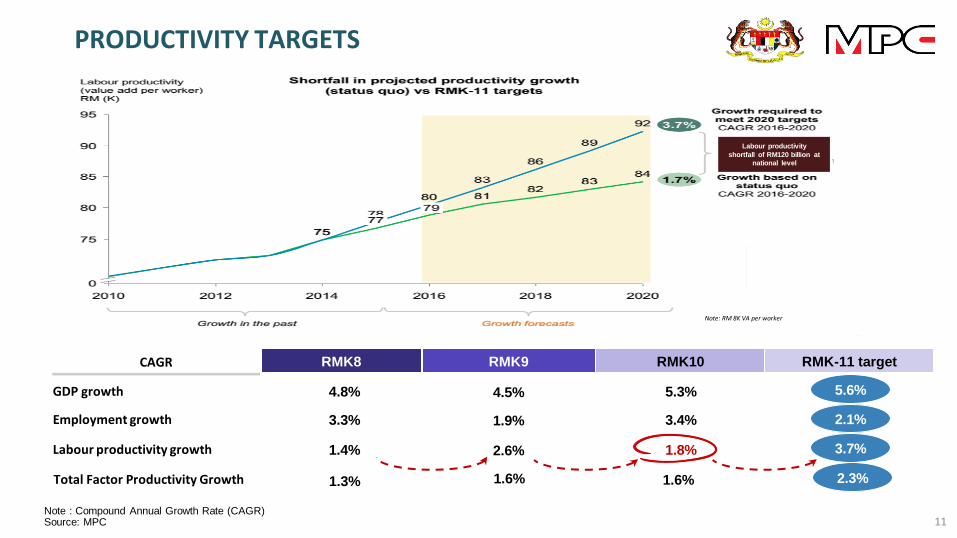
GDP growth
Labour productivity growth
CAGR
Employment growth
4.8% 4.5% 5.3%
1.4% 2.6% 1.8%
RMK8 RMK9 RMK10
3.3% 1.9% 3.4%
RMK-11 target
3.7%
5.6%
Note : Compound Annual Growth Rate (CAGR) Source: MPC
2.1%
Labour productivity
shortfall of RM120 billion at
national level
Note: RM 8K VA per worker
Total Factor Productivity Growth
PRODUCTIVITY TARGETS
1.6% 1.6% 1.3% 2.3%
11

NATIONAL-LEVEL INITIATIVES
SECTOR-LEVEL INITIATIVES
ENTERPRISE-LEVEL INITIATIVES
Outline policy priorities to uplift national productivity
• To be led by core government ministries
and agencies • Targets governance of
productivity policies impacting all economic
sectors
Outline explicit sector strategies to address sector-level productivity barriers
• To be led by key industry associations and anchor enterprises for each sector
• Targets acceleration of productivity uplift, impacting large enterprises and SMEs at sector level
Outline specific enterprise strategies to enhance operations related to productivity improvement
• To be led by management at enterprises (including SMEs) with guidance from sector Productivity Nexus
• Targets productivity improvement at enterprise level
• Strong coordination and governance are key to securing implementation certainty • Productivity needs to be top of mind movement and embedded into day-to-day work culture • Productivity must be addressed holistically and in tandem – at the national, sector and enterprise levels
PRODUCTIVITY OUTLINES
12
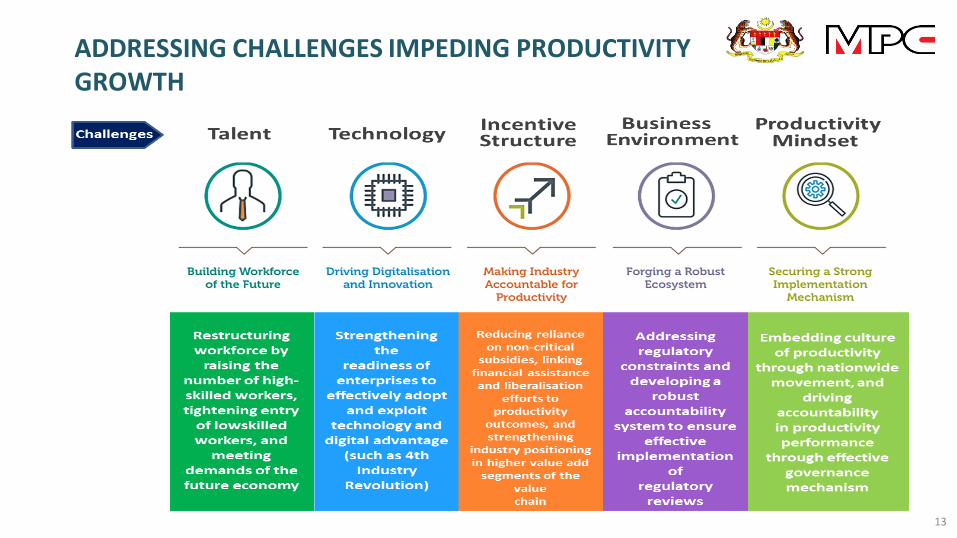
ADDRESSING CHALLENGES IMPEDING PRODUCTIVITY GROWTH
13

Retail and F&B Chemicals & Chemical Products
Electrical and Electronics
Machinery and Equipment
Tourism Agro-food
ICT Professional Services
Private Healthcare
Contribute to 30% of Malaysia’s GDP, and
40% of total employment
Workforce Technology Industry Eco-system Structure
Thrusts at National Level
Mind set
9 PRIORITY NEXUS
14

www.WayUp.my
• The ability to produce more output from the same input
• Measure the efficiency & effectiveness of resources utilizations. Such as technology, employees, material, energy and time
15
PRODUCTIVITY CONCEPT
PRODUCTIVITY = OUTPUT
INPUT
www.WayUp.my
“Productivity is never an accident.
It is always the result of commitment to excellence,
intelligent planning, and focused effort” –
Paul J.Meyer
16
www.WayUp.my
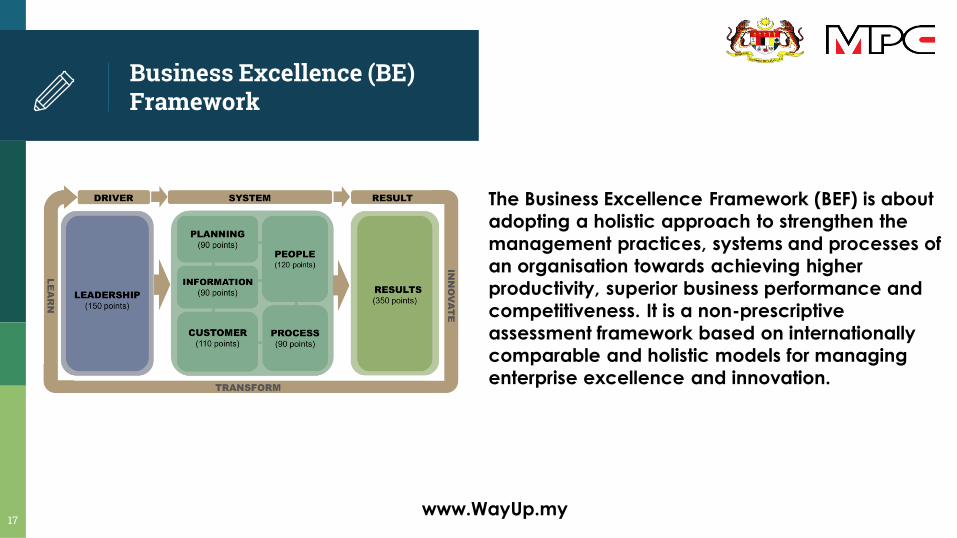
Business Excellence (BE) Framework
17
The Business Excellence Framework (BEF) is about
adopting a holistic approach to strengthen the
management practices, systems and processes of
an organisation towards achieving higher
productivity, superior business performance and
competitiveness. It is a non-prescriptive
assessment framework based on internationally
comparable and holistic models for managing
enterprise excellence and innovation.
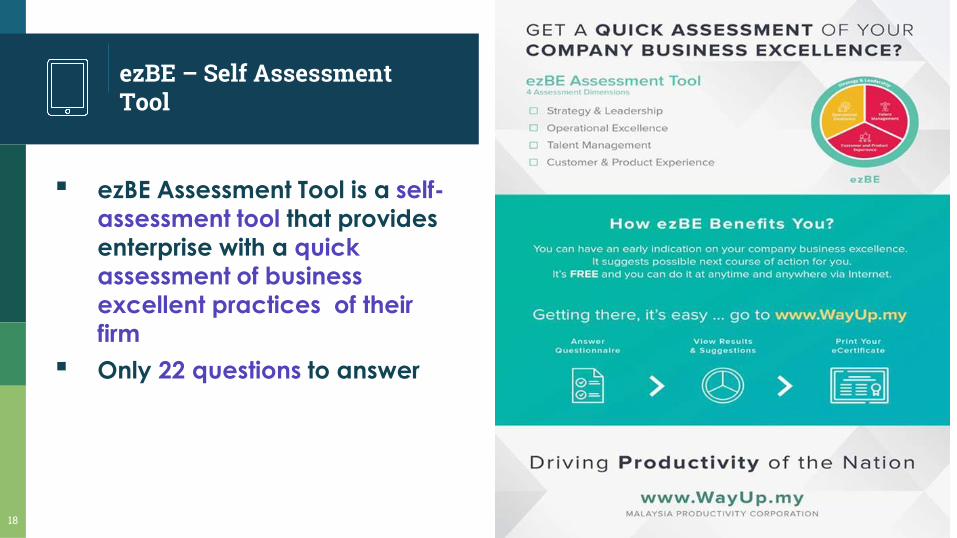
ezBE – Self Assessment Tool
▪ ezBE Assessment Tool is a self-
assessment tool that provides
enterprise with a quick
assessment of business
excellent practices of their
firm
▪ Only 22 questions to answer
18

www.WayUp.my
How can ezBE Benefit you?
19
01 Early indication on your company business excellence
02 Suggest further action that enterprise
may want to consider
03 It's FREE and you can do it
anytime, any device,
anywhere via internet
04 The result come with
CERTIFICATION!
www.WayUp.my
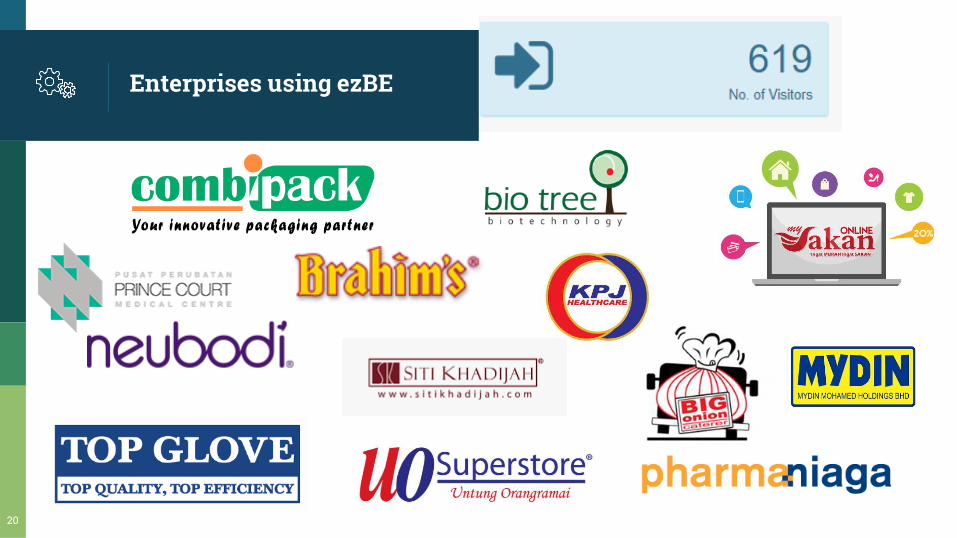
Enterprises using ezBE
20

www.WayUp.my
How to use ezBE Assessment Tool?
21
View result &
suggestion
Certification
2 3 4 1
www.WayUp.my

ezBE Assessment Tool …cont’d
22
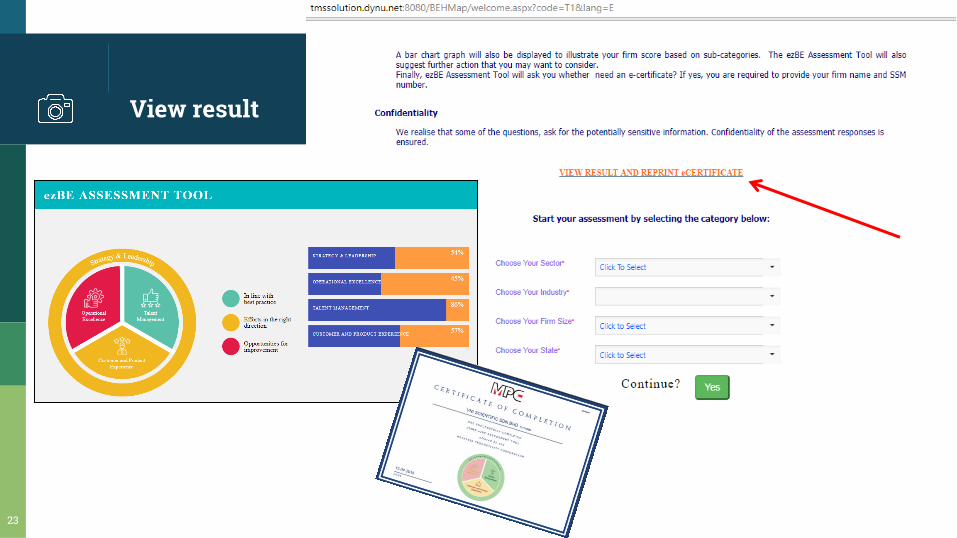
View result
23

ezBE Assessment Tool …cont’d
24

Next Action
25
Focus Area Definition
Operational Excellence This measure assesses the ability of an enterprise to drive efficiency by streamlining processes, and to deploy the right tools to support these initiatives.
Talent Management
This measure assesses the ability of an enterprise to enable and encourage individual performance by raising employees’ skill levels and improving recruitment and retention of staff.
Strategy & Leadership
This measure assesses the ability of an enterprise to grow sustainably via the application of a clear, coherent and consistent business strategy and operating model.
Customer & Product Experience
This measure assesses the ability of an enterprise to incorporate customer needs into the design of products and/or service offerings.
165 Programs, Incentives & Grant!!

An organization that is constantly improving the performance of the
business in terms of
1 SAFETY mployees and company properly embraced safety related
aspects.
2 MORALE Discipline and motivation to pursue continuous improvement
in their activities
3 PRODUCTIVITY total labor required to complete XX no of orders (minutes per
order)
4 QUALITY Reduce no. of defects / scraps / reworks
5 COST Reduce cost of waiting, Labor, overheads and material
charges
6 DELIVERY On time delivery of products and services to customers
without any delays
in on going incremental step improvements, to provide the greatest benefit overall to the
customers, the company, the employees, and the community
SAFETY AND ITS RELATION TO PQCDM
