thixotropic behavior of cement-based materials: effect of
TRANSCRIPT

Graduate Theses and Dissertations Iowa State University Capstones, Theses andDissertations
2010
Thixotropic behavior of cement-based materials:effect of clay and cement typesZhuojun QuanjiIowa State University
Follow this and additional works at: https://lib.dr.iastate.edu/etd
Part of the Civil and Environmental Engineering Commons
This Thesis is brought to you for free and open access by the Iowa State University Capstones, Theses and Dissertations at Iowa State University DigitalRepository. It has been accepted for inclusion in Graduate Theses and Dissertations by an authorized administrator of Iowa State University DigitalRepository. For more information, please contact [email protected].
Recommended CitationQuanji, Zhuojun, "Thixotropic behavior of cement-based materials: effect of clay and cement types" (2010). Graduate Theses andDissertations. 11724.https://lib.dr.iastate.edu/etd/11724

Thixotropic behavior of cement-based materials: effect of clay
and cement types
by
Zhuojun Quanji
A thesis submitted to the graduate faculty
in partial fulfillment of the requirement for the degree of
MASTER OF SCIENCE
Major: Civil Engineering Materials
Program of Study Committee:
Kejin Wang, Major Professor
Chris Williams
Stephenson, W. Robert
Iowa State University
Ames, Iowa
2010
Copyright ©Zhuojun Quanji, 2010. All rights reserve

ii
Table of Contents
List of Figures ..................................................................................................................... iv
List of Tables ...................................................................................................................... vi
Acknowledgement ............................................................................................................. vii
Abstract ............................................................................................................................... ix
Chapter 1 Introduction ........................................................................................................ 1
1.1 General ................................................................................................................... 1
1.2 Research Objectives .............................................................................................. 3
1.3 Scope of Thesis ...................................................................................................... 4
Chapter 2 Literature Review ............................................................................................... 6
2.1 Introduction ........................................................................................................... 6
2.2 Basic rheology principles ...................................................................................... 6
2.3 Concrete Rheology .............................................................................................. 10
2.4 Measurement of Concrete Rheological Properties .............................................. 11
2.5 Factors Affecting Concrete Rheology ................................................................. 16
2.5.1 Water Content ........................................................................................... 16
2.5.2 Temperature and Elapsed Time ................................................................ 17
2.5.3 Chemical Admixtures ............................................................................... 18
2.5.4 Supplementary Cementitious Materials .................................................... 20
2.5.5 Aggregate .................................................................................................. 21
2.5.6 Clay Addition............................................................................................ 21
2.5.7 Others ........................................................................................................ 24
2.6 Thixotropy ........................................................................................................... 27
2.6.1 The Origin of Thixotropy ......................................................................... 27
2.6.2 Origin of Thixotropy of Cement Paste ..................................................... 28
2.6.3 Experimental Quantification of Thixotropy ............................................. 30
2.7 Flocculation ......................................................................................................... 34
2.7.1 Attractive Forces ....................................................................................... 35
2.7.2 Repulsive Forces ....................................................................................... 38
2.7.2.1 Electrostatic repulsion ................................................................... 38
2.7.2.2 Steric Repulsion ............................................................................. 41
2.7.3 The Effect of Hydration on Flocculation Mechanism .............................. 42
Chapter 3 Experiment Program ........................................................................................ 44

iii
3.1 Material Characterization and Mix Composition ................................................ 44
3.2 Mix Proportions ................................................................................................... 47
3.3 Mixing Procedure ................................................................................................ 48
3.4 Test Methods ....................................................................................................... 49
3.4.1 Paste Rheology Measurement................................................................... 49
3.4.2 Heat of Hydration ..................................................................................... 55
3.4.3 Compressive Strength ............................................................................... 57
Chapter 4 Evaluation of Structural Rebuilding Rate ........................................................ 58
4.1 Introduction ......................................................................................................... 58
4.2 Rheology Test Results ......................................................................................... 58
4.3 Understanding Rheology Results Based on Statistical Analysis ......................... 67
4.3.1 How to Understand Analysis of JMP ....................................................... 67
4.3.2 Actigel....................................................................................................... 67
4.3.3 High Reactivity Metakaolin ...................................................................... 71
4.3.4 Ground Clay Brick .................................................................................... 75
4.3.5 Different Types of Cement ....................................................................... 78
4.4 Discussion ............................................................................................................ 82
4.5 Correlation between Flow Table Test and Structural Rebuilding Rate ............... 94
4.6 Comparison among Different Clays .................................................................. 103
4.7 Chapter Summary .............................................................................................. 105
Chapter 5 Evaluation of Effect of Heat Generation Rate
on Structural Rebuilding Rate ........................................................................ 108
5.1 Introduction ....................................................................................................... 108
5.2 Effect of Heat generation Rate on Structural Rebuilding Rate ......................... 109
5.3 Chapter summary ............................................................................................... 116
Chapter 6 Compressive Strength Test ............................................................................ 118
6.1 Introduction ....................................................................................................... 118
6.2 Test Results........................................................................................................ 118
Chapter 7 Conclusions and Recommendations .............................................................. 122
7.1 Conclusions ....................................................................................................... 122
7.2 Recommendations ............................................................................................. 124
References ....................................................................................................................... 126

iv
List of Figures Figure 2 - 1. Newtonian Model for fluid............................................................................. 8
Figure 2 - 2.Bingham Model for fluid ................................................................................ 8
Figure 2 - 3.Thixotropy measurement and hysteresis loop ................................................. 9
Figure 2 - 4.Thixotropic ratio measurement (two hysteresis loop) ................................... 11
Figure 2 - 5. Thixotropic measurement method (break and rebuild) ................................ 12
Figure 2 - 6. Mutiple hysteresis loops for evaluating structural rebuilding rate ............... 13
Figure 2 - 7.Three categories of rheometers ..................................................................... 16
Figure 2 - 8.Physical description of the thixotropic behavior of cementitious materials 29
Figure 2 - 9.Visualization of thixotropic behavior of cement paste ................................. 29
Figure 2 - 10.Typical hysteresis loop for measuring thixotropy ....................................... 31
Figure 2 - 11.Differences between the shear thinning and shear thickening materials .... 32
Figure 2 - 12.Flow curve of constant shear method.......................................................... 34
Figure 2 - 13.Description of London Dispersion Forcecs ................................................. 36
Figure 2 - 14.Double charged layer model of particles .................................................... 39
Figure 2 - 15. Repulsive energy as a function of distance between particles ................... 41
Figure 2 - 16.Schematic of steric repulsion mechanism of superplasticizers ................... 42
Figure 3 - 1.Hobart mixer ................................................................................................. 49
Figure 3 - 2.Brookfield R/S SST2000 rheometer ............................................................. 50
Figure 3 - 3.Vane and cylinder for rheometer ................................................................... 51
Figure 3 - 4.Shear history for paste rheology measurement ............................................. 52
Figure 3 - 5. Application of experimental procedures ...................................................... 53
Figure 3 - 6. Flow table equipment ................................................................................... 55
Figure 3 - 7. The unit of isothermal calorimeter ............................................................... 56
Figure 3 - 8. Test Mark compressive strength testing equipment ..................................... 57
Figure 4 - 1. Thixotropy versus time for pastes with different amount of Actigel ........... 59
Figure 4 - 2. Yield stress versus time for pastes with different amount of Actigel .......... 60
Figure 4 - 3. Viscosity versus time for pastes with different amount of Actigel .............. 60
Figure 4 - 4. Thixotropy versus time for pastes with different amount of HRM ............. 61
Figure 4 - 5. Yield stress versus time for pastes with different amount of HRM ............. 62
Figure 4 - 6. Viscosity versus time for pastes with different amount of HRM................ 62
Figure 4 - 7. Thixotropy versus time for pastes with different amount of Ground GCB . 63
Figure 4 - 8. Yield stress versus time for pastes with different amount of GCB .............. 64
Figure 4 - 9. Viscosity versus time for pastes with different amount of GCB ................. 64
Figure 4 - 10. Thixotropy versus time for pastes made with different types of cement ... 65
Figure 4 - 11. Yield stress versus time for pastes made with different types of cement .. 66
Figure 4 - 12. Viscosity versus time for pastes made with different types of cement ...... 66
Figure 4 - 13. Bivariate Fit of Thixotropy by Time for Actigel Addition ........................ 69
Figure 4 - 14. The plot of coefficient of square time vs. Actigel amount ......................... 70
Figure 4 - 15. Bivariate Fit of Thixotropy by Time for HRM replacement...................... 73

v
Figure 4 - 16. Plot of coefficient of time vs. HRM amount .............................................. 74
Figure 4 - 17. Bivariate Fit of Thixotropy by Time for paste with GCB replacement ..... 76
Figure 4 - 18. Plot of coefficient of square time vs. GCB amount ................................... 77
Figure 4 - 19. Bivariate Fit of Thixotropy by Time for different types of cement ........... 80
Figure 4 - 20. The plot of coefficient of square time vs. cement types ............................ 81
Figure 4 - 21. (a) Traditional dry process, (b) Wet process ( Actigel process) of Actigel 83
Figure 4 - 22. (a) Bristles of Magnesium Alumino Silicates, (b) Bristles of Actigel ....... 84
Figure 4 - 23. Particle Morphology of Actigel ................................................................. 85
Figure 4 - 24. The mechanism of increasing thixotropy for paste with Actigel addition . 86
Figure 4 - 25. SEM (Scanning electron microcopy) micrograph of metakaolin .............. 89
Figure 4 - 26. SEM (Scanning electron microcopy) micrograph of ground clay brick .... 90
Figure 4 - 27.―A, B: Syngenite formation imaged by ESEM-FEG 2 h of hydration
of cement A with 4.49 wt.% potassium sulphate. A) Cement hydrated
without agitation; random orientation of syngenite, B) cement paste
after shearing in the viscometer; preferred orientation of syngenite
crystals. C: Cement paste A with 1.56% K2SO4 content: minor amount
of syngenite.‖ ............................................................................................. 93
Figure 4 - 28. Flow change with time for pastes with different amount of Actigel .......... 95
Figure 4 - 29. The coefficient of time vs. Actigel amount ................................................ 95
Figure 4 - 30. Correlation plot of thixotropy vs. flow percent for PC+Actigel ................ 96
Figure 4 - 31. Flow percent change with time for pastes with HRM replacement ........... 97
Figure 4 - 32. The coefficient of time vs. HRM amount .................................................. 97
Figure 4 - 33. Correlation plot of flow percent vs. thixotropy for PC+HRM ................... 98
Figure 4 - 34. Flow percent change with time for pastes with GCB replacement ............ 99
Figure 4 - 35. The coefficient of time vs. GCB amount ................................................... 99
Figure 4 - 36. Correlation plot of flow percent vs. thixotropy for PC+GCB .................. 100
Figure 4 - 37. Flow table test results for pastes made with different types of cement ... 101
Figure 4 - 38. The coefficient of time vs. cement types ................................................. 101
Figure 4 - 39. Correlation of flow percent vs. thixotropy for different cement types .... 102
Figure 4 - 40. Comparison amoung different clay addition/ replacement ...................... 104
Figure 4 - 41. The plot of coefficient of time versus clay types ..................................... 104
Figure 5 - 1. Rate of heat generation for pates with Actigel addition ............................. 109
Figure 5 - 2. Rate of heat generation for pates with replacement of HRM..................... 110
Figure 5 - 3. Rate of heat generation for pates with replacement of GCB ..................... 112
Figure 5 - 4. Rate of heat generation for pates made with different types of cement ..... 113
Figure 6 - 1. (a) Compressive strength for pastes with Actigel addition;
(b) Compressive strength for pastes with HRM replacement;
(c) Compressive strength for pastes with GCB replacement;
(d) Compressive strength for pastes made with different types of cement 120
vi
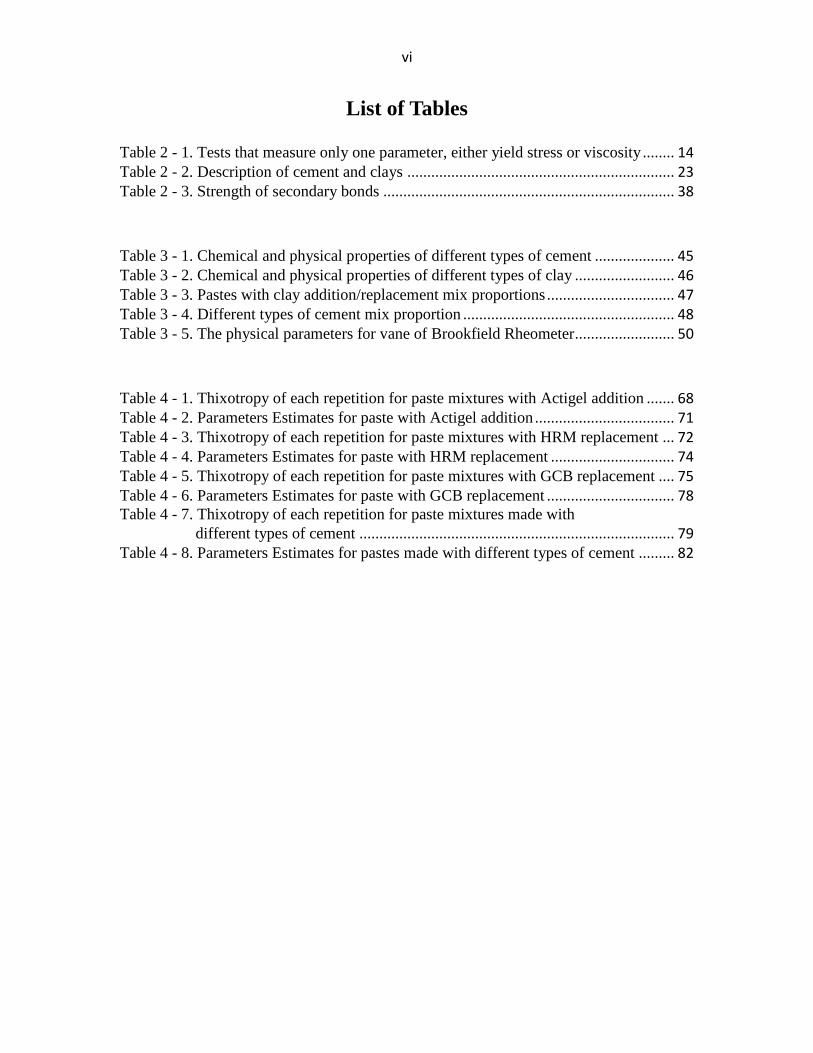
List of Tables
Table 2 - 1. Tests that measure only one parameter, either yield stress or viscosity ........ 14
Table 2 - 2. Description of cement and clays ................................................................... 23
Table 2 - 3. Strength of secondary bonds ......................................................................... 38
Table 3 - 1. Chemical and physical properties of different types of cement .................... 45
Table 3 - 2. Chemical and physical properties of different types of clay ......................... 46
Table 3 - 3. Pastes with clay addition/replacement mix proportions ................................ 47
Table 3 - 4. Different types of cement mix proportion ..................................................... 48
Table 3 - 5. The physical parameters for vane of Brookfield Rheometer ......................... 50
Table 4 - 1. Thixotropy of each repetition for paste mixtures with Actigel addition ....... 68
Table 4 - 2. Parameters Estimates for paste with Actigel addition ................................... 71
Table 4 - 3. Thixotropy of each repetition for paste mixtures with HRM replacement ... 72
Table 4 - 4. Parameters Estimates for paste with HRM replacement ............................... 74
Table 4 - 5. Thixotropy of each repetition for paste mixtures with GCB replacement .... 75
Table 4 - 6. Parameters Estimates for paste with GCB replacement ................................ 78
Table 4 - 7. Thixotropy of each repetition for paste mixtures made with
different types of cement ............................................................................... 79
Table 4 - 8. Parameters Estimates for pastes made with different types of cement ......... 82

vii
Acknowledgement
I firmly believe that I am here in this position right now because of the support,
guidance, love, and sacrifice of many people. To those who used to help me to this point
in my life, I appreciate your support.
To my advisor Professor Kejin Wang: She not only provided me with a great
opportunity but also always motivated and encouraged me throughout my study. I learned
much valuable information during the time working with her as a research and teaching
assistant. Recalling many mistakes I made during my first semester at ISU, I earnestly
appreciate the understanding and encouragement I received. The guidance and patience
have inspired and made me more interested in concrete research under your supervision.
To my committee members Professor Williams and Professor Stephenson: I am
very grateful for your participating in my research. Your suggestions have made my
thesis and research more meaningful and practical. The patient instructions from Dr.
Stephenson on my testing results analysis helped me think about what types of errors,
why they occur, and how they affect my research results.
To my officemate Gilson Lomboy: My heart feels thanks to his constant advices in
each step of my study. He is always patient with my questions and always gave me
specific ideas, which really helped me go through the different time in my study.
To my special friend Yao Yu: Without her support and understanding, my dream
for studying in US could not become true. Her loves encouraged me work hard and work
with clear purpose.

viii
To my family, especially my parents: No words could describe how much I
appreciate the support from my family. Every word in every phone call has made me feel
refreshed and repowered for achieving my goal in the US.
ix
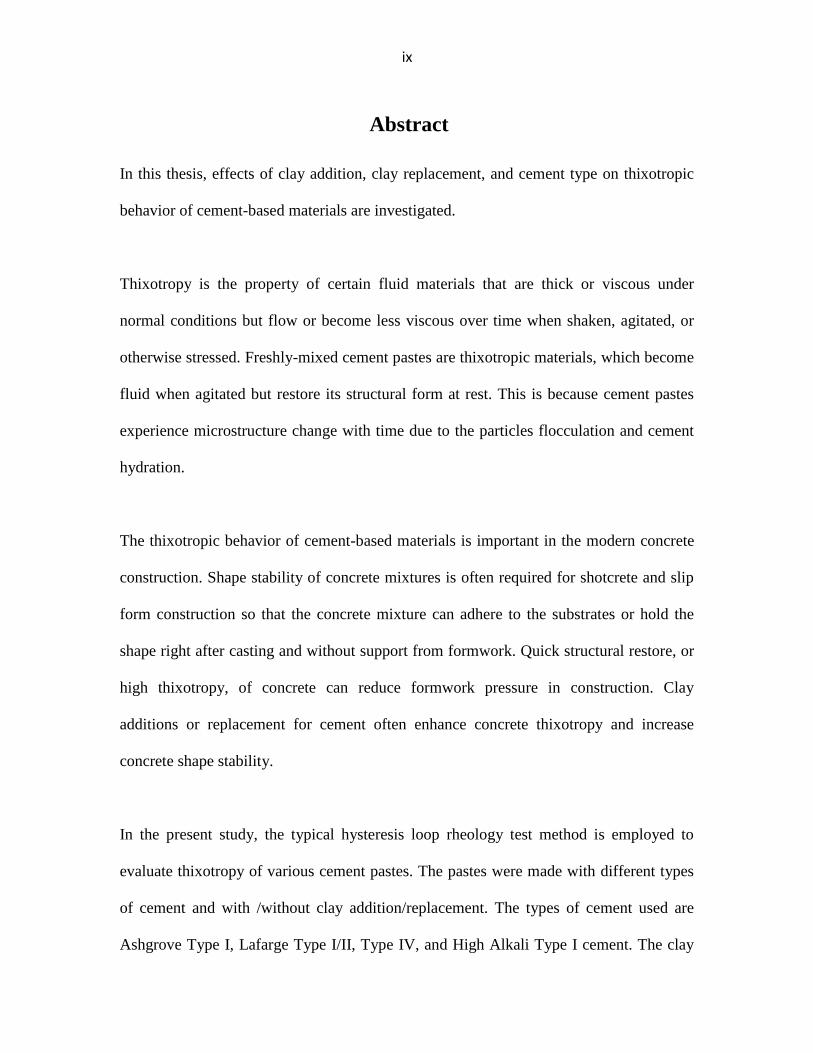
Abstract
In this thesis, effects of clay addition, clay replacement, and cement type on thixotropic
behavior of cement-based materials are investigated.
Thixotropy is the property of certain fluid materials that are thick or viscous under
normal conditions but flow or become less viscous over time when shaken, agitated, or
otherwise stressed. Freshly-mixed cement pastes are thixotropic materials, which become
fluid when agitated but restore its structural form at rest. This is because cement pastes
experience microstructure change with time due to the particles flocculation and cement
hydration.
The thixotropic behavior of cement-based materials is important in the modern concrete
construction. Shape stability of concrete mixtures is often required for shotcrete and slip
form construction so that the concrete mixture can adhere to the substrates or hold the
shape right after casting and without support from formwork. Quick structural restore, or
high thixotropy, of concrete can reduce formwork pressure in construction. Clay
additions or replacement for cement often enhance concrete thixotropy and increase
concrete shape stability.
In the present study, the typical hysteresis loop rheology test method is employed to
evaluate thixotropy of various cement pastes. The pastes were made with different types
of cement and with /without clay addition/replacement. The types of cement used are
Ashgrove Type I, Lafarge Type I/II, Type IV, and High Alkali Type I cement. The clay
x
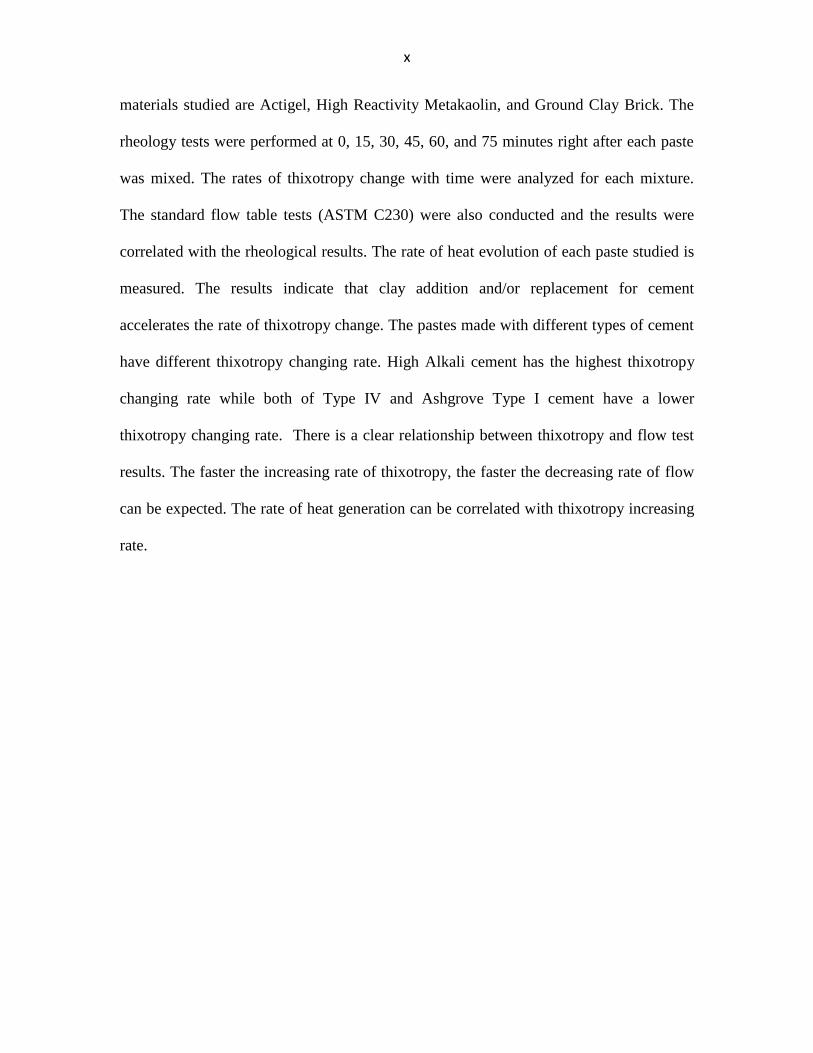
materials studied are Actigel, High Reactivity Metakaolin, and Ground Clay Brick. The
rheology tests were performed at 0, 15, 30, 45, 60, and 75 minutes right after each paste
was mixed. The rates of thixotropy change with time were analyzed for each mixture.
The standard flow table tests (ASTM C230) were also conducted and the results were
correlated with the rheological results. The rate of heat evolution of each paste studied is
measured. The results indicate that clay addition and/or replacement for cement
accelerates the rate of thixotropy change. The pastes made with different types of cement
have different thixotropy changing rate. High Alkali cement has the highest thixotropy
changing rate while both of Type IV and Ashgrove Type I cement have a lower
thixotropy changing rate. There is a clear relationship between thixotropy and flow test
results. The faster the increasing rate of thixotropy, the faster the decreasing rate of flow
can be expected. The rate of heat generation can be correlated with thixotropy increasing
rate.

1
Chapter 1 Introduction
1.1 General
Concrete which is composed of Portland cement, water and aggregates is the most widely
used construction material. Advances in concrete materials have led to the use of
supplementary cementitious materials and other admixtures. In fresh state of concrete, its
method of placement, compaction and transportation generate high requirement of fresh
concrete properties, such as workability. Concrete needs proper flowability or rheological
performance to make sure that it gains enough workability. Concrete rheology is a
quantitative measurement that cannot be used to characterize concrete flow but can be
used to describe other aspects of concrete workability. During recent years, increasingly
researchers put more emphasis on concrete rheology, because construction costs can be
reduced by optimizing concrete workability to obtain easier placing ability. Additionally,
different types of equipment and instrumentation have been developed to measure the
concrete rheology. However, due to the complex composition of concrete, no standard
measuring method is available for field construction.
Some models are available to describe the rheological properties of cement paste. One of
the most popular ones is the Bingham model. The basic rheological parameters include
yield stress, viscosity and thixotropy. Because aggregates can be considered as inert
materials, researchers try to put more attention on the investigation of paste rheology
properties. After mixing of paste, the chemical reaction between cement and water tends
to change the structural degree of cement paste. Thus, the study of structural rebuilding

2
after mixing will provide valuable information about rheological properties of cement
based materials. Besides, the study of rate of structural rebuilding can be related to form
pressure of concrete. In modern construction field, pre-cast concrete technology leads to
development of special concrete, such as Self Consolidating Concrete (SCC). Concerning
SCC, inappropriate estimation of formwork pressure might lead to formwork failure.
The thixotropy can be measured by a hysteresis loop and the area within the hysteresis
loop can be described as the energy required to breakdown the structure of materials. The
measurement of the variation of thixotropy with a period of time after mixing has the
ability to provide useful information on structural rebuilding. In cementitious materials,
thixotropy results from the time that cement takes to rearrange the microstructure of the
paste matrix after introduction of shear energy. The phenomenon of structural rebuilding
has a close relationship with aggregation, deflocculation of cement particles, dispersion
of solid particles, rearrangement and reflocculation of cement particles. Thus
combination of flocculation mechanism and structural rebuilding will improve the
understanding about flow behavior of cement based materials.
In modern construction, different types of cement and cementitious materials are used for
different purposes. The use of different admixtures has also become invaluable to
enhance the properties of concrete to suit various construction requirements. The
application of clay also provides opportunities to improve the performance of concrete,
such as stability, durability and mechanical performance. Thus, more understanding
about the structural rebuilding rate and flocculation mechanism of paste with clay

3
addition/replacement or paste made with different types of cement will advance the
knowledge about concrete flowability.
1.2 Research Objectives
The main purpose of this thesis is to investigate the influence clay addition/replacement
and different cement types have on the structural rebuilding rate of cement based
materials. To accomplish this main purpose, this thesis has the following objectives:
1. Evaluation of structural rebuilding rate of cement paste with different clay addition or
replacement.
2. Evaluation of structural rebuilding rate of paste made with different types of cement.
3. Investigation of correlation between flow percent decreasing with structural rebuilding.
4. Study of relationship between heat generation rate and structural rebuilding rate.
5. Compressive strength for paste with clay addition/replacement and paste made with
different types of cement
Three different types of clay (Actigel, High Reactivity Metakoalin and Ground Clay
Brick) and four different types of cement (Ashgrove Type I, Lafarge Type I/II, High
Alkali and Type IV cement) were used for this thesis. For the first two objectives, a
systematic rheology test procedure based on the hysteresis loop was used. To accomplish
the third objective, a flow table test was applied to measure the flow percent change with
time. The fourth objective was achieved using isothermal calorimeter equipment which
can measure the heat generation rate. The last objective was accomplished based on the
procedure describe in ASTM C150.

4
1.3 Scope of Thesis
This thesis is divided into seven chapters including the literature review, experimental
work, evaluation of structural rebuilding rate, rate of heat generation analysis and
compressive strength analysis.
Chapter 1 provides the general information and background, research objective and thesis
scope.
Chapter 2 provides a literature review based on basic rheology concepts, structural
rebuilding rate and flocculation mechanism.
Chapter 3 describes the whole experimental program including material characterization,
equipment and sample preparation procedures in detail.
Chapter 4 discusses the influences of clay addition/replacement and different cement
types on the structural rebuilding rate of cement paste and the correlation between flow
table test results and structural rebuilding rate. The rheology test results were also
analyzed by statistical software in order to build a regression model to describe the
structural rebuilding rate of cement paste.
Chapter 5 investigates the relationship between heat generation rate and structural
rebuilding rate.

5
Chapter 6 gives the analysis of mechanical performance of cement paste with clay
addition/replacement and paste made with different types of cement.
Chapter 7 offers overall conclusions of this thesis and recommendations for future
research.
6
Chapter 2 Literature Review
2.1 Introduction
This chapter provides basic information in terms of rheology principles and rheological
parameters for cement based material. Detailed information about thixotropy property
and flocculation of cement based materials are given in order to advance understanding
of structural rebuilding of cement based materials.
2.2 Basic rheology principles
Rheology is the science of studying the deformation and flow of matter under shear stress
[1]. Investigating rheological properties places large emphasis on the response of
materials under the application of shear rate, and the relationship between the shear rate
and shear stress has been investigated. Scientists have developed many models, by which
they can describe the flow and fluidity of concrete and cement paste. Two of them are
very widely used. The first one is Newton’s model, the other one is Bingham model.
Since rheology is a science of relationship between the shear stress and shear strain of the
materials under shearing, the curve of shear rate versus shear stress is called flow curve.
The flow curve is very important for analyzing rheological properties. For a fluid like
water, it is characterized as Newtonian liquid. For such materials, the application of shear
will not create a definite shear stress. The shear stress is linearly proportional to the shear
rate. It obeys Newton’s law of flow, which is shown as the following equation:
τ = η γ
Equation 2-1

7
In this equation:
τ ------- Shear stress (Pa)
γ------- Shear rate (s-1
)
η ------- Viscosity (Pa•s)
In Figure 2-1, Newtonian liquid is described with a plot of shear stress and shear rate,
from which we can see a straight line going through the plot with a slope of η (Viscosity).
This is because that Newtonian material will demonstrate a viscous and elastic property
at the same time. Therefore the shear stress and shear rate have a linear relationship. The
Newtonian material is a very diluted suspension of solids in a liquid and no interpaticle
forces exist while the concrete and cement paste can be considered as very concentrated
suspensions which have many interparticle forces. Thus, for such concentrated material
which has forces acting between the solid particles, it obeys the Bingham model and can
be described as the following equation:
τ = τ y + μ γ
Equation 2-2
In this equation:
τ -------Shear stress (Pa)
γ ------- Shear rate (s-1
)
μ ------- Viscosity (Pa•s)
τ y ------ Yield stress (Pa)

8
Figure 2 - 1. Newtonian Model for fluid
Figure 2 - 2.Bingham Model for fluid
A Bingham fluid has one more rheological parameter which is named as yield stress. The
yield stress indicates the smallest energy required to initiate the flow of materials. Due to
some materials with same viscosity might not have same yield stress, both of these two
parameters should be used to describe the flow of materials. The measurement of
rheological parameters is attractive to the scientists for the reason that it will be very
important and valuable to predict the properties and flowability of fresh concrete and
cement paste. To determine the Bingham parameters, there are two possible methods: 1)

9
Slowly increase the shear rate and measuring the shear stress. The stress where materials
start to flow is yield stress and the slope of the flow curve is viscosity; 2) High shear rate
is applied before test. Then, the shear rate will slowly decrease and the shear stress is
measured. The plot of shear stress versus shear rate indicates the yield stress which is the
zero intercept of shear rate and viscosity is the slope.
Figure 2 - 3.Thixotropy measurement and hysteresis loop
Another important parameter for rheology is thixotropy. Figure 2-3 describes the
measurement of thixotroy. The plot of shear rate versus time indicates the shear history
needed for the measurement of thixotropy. The shear rate ramps up from zero to a pre-
determined value. Once the shear rate increases to this point, it will ramp down back to
zero. From the plot of shear stress versus shear rate, we can tell that the up curve lies
above the down curve and the area between up and down curve is thixotropic value. This
phenomenon results from the decreasing viscosity during shearing with time. Thixotropy
can be described as the energy needed to break down structure of material. Generally, the
combination of the up and down curve is called the as ―hysteresis loop‖ and the larger the
area for the hysteresis loop, the higher degree that the material structure is broken down.

10
2.3 Concrete Rheology
Due to the fact that concrete is usually put into place when it is plastic, the rheological
properties of concrete are very significant to the cosnstruction industry. But
unfortunately, because of the complicated composition of the concrete materials, no
standard methods of measuring the flow and rheological properties are available. Besides,
a large range of particle sizes can be found in concrete (the large differences in terms of
particle size of aggregates and cement), thus even the characterization of concrete
rheological parameters is not easy to achieve. Usually, measurement of concrete rheology
just applied one of the many available test methods. However, the intrinsic flow
properties of concrete are just partially measured and only limit information can be
obtained from such flow tests. Therefore, more understanding of concrete rheological
properties is needed to help us predict the flowability of concrete.
In the civil engineering field, many of the terms such as workability and flowability are
used for describing the rheological behavior of concrete. Tattersall [1] explained concrete
workability as ―the ability of concrete to flow in a mold or formwork, perhaps through
congested reinforcement, the ability to be compacted to a minimum volume, perhaps the
ability to perform satisfactorily in some transporting operation or forming process, and
maybe other requirements as well‖ [1]. There are also some definitions available for
describing concrete rheology and workability, however, there is not total agreement
among them. It is possible that these definitions are based on feeling of researchers rather
than intrinsic rheological behaviors of concrete materials.
11
2.4 Measurement of Concrete Rheological Properties
The hysteresis loop method described in the previous section is the commonly used
method for measuring the thixotropy. However, there are more techniques to investigate
the thixotropy behavior in colloid materials.
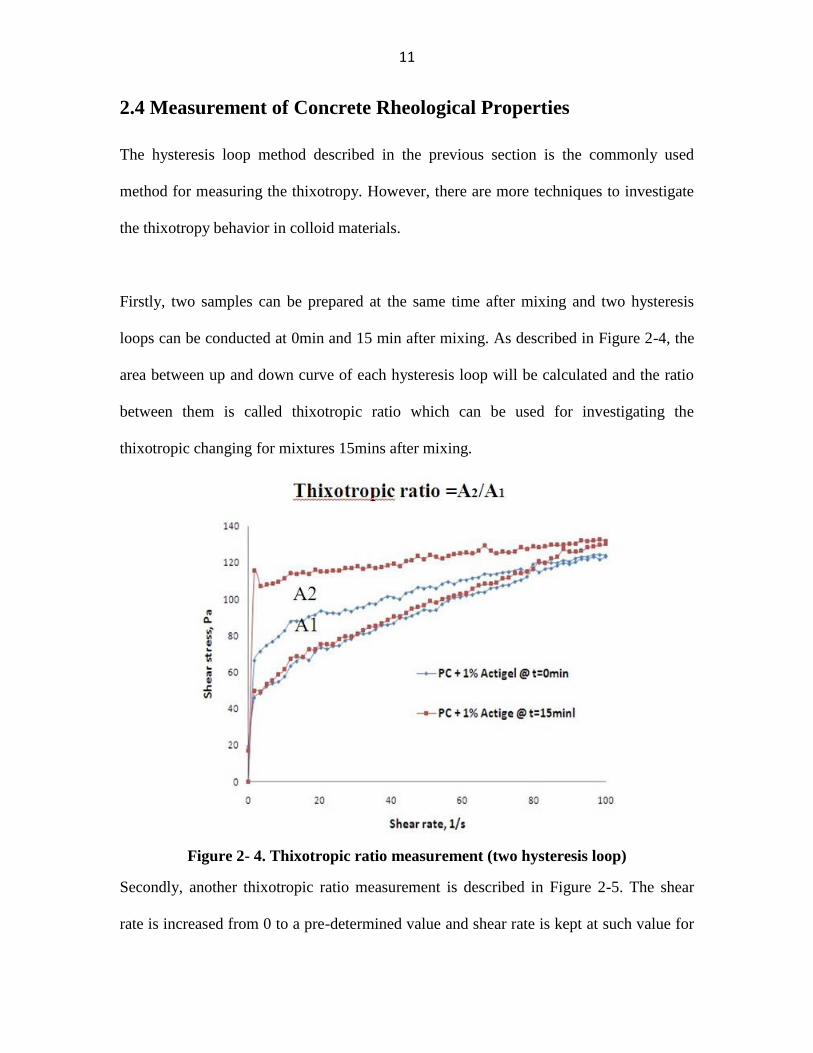
Firstly, two samples can be prepared at the same time after mixing and two hysteresis
loops can be conducted at 0min and 15 min after mixing. As described in Figure 2-4, the
area between up and down curve of each hysteresis loop will be calculated and the ratio
between them is called thixotropic ratio which can be used for investigating the
thixotropic changing for mixtures 15mins after mixing.
Figure 2- 4. Thixotropic ratio measurement (two hysteresis loop)
Secondly, another thixotropic ratio measurement is described in Figure 2-5. The shear
rate is increased from 0 to a pre-determined value and shear rate is kept at such value for

12
3mins in order to break-up the microstructure. Then, the shear rate is ramped down to a
much lower value (10 S-1
) and such value is kept for 15mins. It is assumed that the
microstructure of mixture is able to rebuild with a low enough shear rate. Therefore, the
generated flow curve can be used for calculating break-up area and re-build area. The
ratio between them can also be used for investigating the thixotropic changing of the
colloid materials.
Figure 2- 5. Thixotropic measurement method (break and rebuild)
Besides, some researchers [23] tried to evaluate the structural rebuilding rate of materials
by conducting multiple hysteresis loops after mixing. The method can be described as
Figure 2-6. Before the mixing, they increased the shear rate to pre-determined value and

13
keep this value for 8 minutes to generate an equilibrium state and then decrease the shear
rate back to zero. Only one sample will be prepared after mixing and hysteresis loop are
conducted every 10 mins after mixing. The area between up curve of each hysteresis loop
and down curve of equilibrium curve will be calculated and plotted versus time. The
slope of the curve can be used for indicating the structural rebuilding rate of colloid
materials.
Figure 2- 6. Mutiple hysteresis loops for evaluating structural rebuilding rate
There are many test techniques and types of equipments available to characterize the
rheological parameters of concrete in the construction field. However, it is very important
to choose the most appropriate method to test the rheological properties because that it is
meaningful and valuable to use this method to predict and investigate the workability and
flowability of fresh concrete. It is noted that the basic parameters used to describe

14
concrete rheological properties are yield stress and viscosity. Therefore, the methods that
can appropriately indicate both of these parameters can be used for field construction.
However, most of the test techniques and equipment can just measure one of these two
parameters, either yield stress or viscosity, which is not enough to give an indication of
the natural fundamentals of concrete. Thus, it is necessary to develop the best method to
characterize the rheological properties of concrete and cement paste. In the last several
decades, some test methods were developed by the researchers in order to obtain
rheological parameters of concrete materials. Considering whether results of test
techniques are based on one parameter or two parameters, the test methods can be
divided into two categories, one parameter measuring and two parameters measuring
method.
Table 2 - 1. Tests that measure only one parameter, either yield stress or viscosity
Test method Application of stress Relation to rheological parameters
Slump Self Gravity Yield stress
Ve-Be Time External Vibration Yield stress
Flow cone Self Gravity Yield stress
Turning tube viscometer Self Gravity Viscosity
Table 2-1 describes some test methods that measure only one of the two parameters,
either yield stress or viscosity. About these methods, the basic parameters needed to
characterize concrete rheology cannot be calculated from the test results. However, some
relationships between rheological parameters and workability might be performed.
For the two parameters measuring methods, they can better reflect the basic concrete
rheological parameters. Some popular test methods include: Two-point test, Bertta

15
apparatus, BTRHEOM rheometer, modified slump cone test, IBB rheometer, vibration
slope apparatus and BML viscometer.
Rheometer is one of the most popular measuring methods for characterizing the rheology
of concrete. To achieve this purpose, different combinations of shear history are applied
to concrete or cement paste and both the viscosity and yield stress can be analyzed from
the resultant plot of shear rate versus shear stress. Generally, the rheometers can work in
the following two mechanisms. Firstly, the imposed shear rate will be controlled by
researchers and the reflection of shear stress will be measured. Secondly, the shear stress
will be controlled and the resulting shear rate will be measured. Therefore, the former one
is called a controlled-rate rheometer and the later one is called a controlled-stress
rheometer.
Researchers usually try to relate the rheological properties of concrete with the cement
paste/mortar. Because the aggregates are usually considered as intrinsic materials in
concrete [2,3]. It is also easier and less labor intensive to measure the rheological
parameters of cement paste than fresh concrete. A wide range of rheometers are
commercially available, most of which can be used for measuring cement paste and
mortar.

16
Figure 2 - 7.Three categories of rheometers
As shown in Figure 2-7, rheometers for concrete, cement paste and mortar can be
divided into the following three categories: coaxial cylinders, parallel plate and impeller-
type.
2.5 Factors Affecting Concrete Rheology
Prediction of evolution of rheological parameters is becoming more and more important
for fresh properties of new generation concretes, such as Self Consolidating Concrete
(SCC). Most of fresh properties of concrete are determined using concrete rheological
parameters. Concrete rheology is influenced by all of the components of concrete and all
factors during concrete mixing and placing. The following section will discuss the
factors affecting concrete rheology properties in more detail.
2.5.1 Water Content
Water content has a very significant role to play in determining the rheological properties
of concrete. When other components of concrete are controlled, increasing the water
content has the ability to decrease the yield stress and viscosity of fresh concrete.
However, the increasing content of water also tends to result in more bleeding and
segregation of concrete. Much emphasis is put on the investigation of the relationship

17
between concrete rheology and water content. Jones and Taylor [2] developed an
empirical equation based on flow curves in order to describe the correlation between
rheological parameters of cement paste and water to cement ratio. Also, Banfill [3]
pointed out that increasing the amount of water contributed a higher slump and less Vebe
testing time.
2.5.2 Temperature and Elapsed Time
The development of water reducing agents and superplasticizers advanced the application
of modern concrete technologies. Temperature affects efficiency and incompatibility of
water reducing agents with the cementitious materials and other admixtures [4, 5 and 6].
It is shown that the rheological properties of mortars including High Range Water
Reducing Agent are significantly influenced by temperature [7]. Mixture temperature can
increase the yield stress and decrease the initial plastic viscosity. If the mixture
temperature increases from 10 to 30 °C, the initial plastic viscosity will decrease while
the plastic viscosity will linearly increase with time. The decrease in mixture temperature
is related to a reduction of cement hydration rate and water reducing agent adsorption. At
the same time, the duration of the dormant period of concrete will be lengthened [7 and
8].
It is known that the combination of mineral admixtures and chemical admixtures are used
for improving workability of concrete and cementitious materials. However, the
efficiency of such combination also depends on the temperature of the mixture. Petit [9]
investigated the effects time and temperature have on yield stress and plastic viscosity of
mortar mixtures obtained from SCC with addition of High Range Water Reducing

18
Agents. He also developed general equations in order to indicate the relationship between
temperature/time with yield stress and viscosity, which were very useful to predict the
rheological parameters for concrete.
2.5.3 Chemical Admixtures
It is well known that chemical admixtures have the ability to change the yield stress and
viscosity of concrete which have an important role to play in the rheology properties of
concrete. Air entraining agent (AEA) and water reducing agent are applied in order to
improve the concrete workability. The addition of AEA has the ability to lead to an
increase of paste volume and improve the consistency of the concrete while reducing
bleeding and segregation. Chia and Zhang [10] indicated that the AEA addition will
reduce the plastic viscosity without changing yield stress due to the reason that the small
air bubbles have the ability to lubricate the cement structure. However, Struble and Jiang
[11] stated that the addition of AEA results in a decrease of viscosity but an increase of
yield stress.
In the fresh state of concrete, cement particles will contact together to form flocculation
and some water will become trapped into the flocs of cement particles. The water
reducing agents can attach to the cement particles’ surface and disperse the flocs,
releasing the trapped water and improving the workability of concrete. Cry et al [12]
investigated the influences high range water reducer has on the rheology of cement paste.
They found that high solid concentration and repulsive forces between cement particles
resulted in a shear thickening fluid. It is also expected that the water reducing agents will
reduce the yield stress but viscosity of fresh concrete might not be significantly affected

19
[9] while some other researchers indicated that the yield stress will decrease with the
increase of viscosity at the same time. In addition, Perret [13] found that different
combinations of cement and HRWR will improve the concrete rheological properties at
different levels.
Viscosity Modifying Admixture (VMA) is commercially used for self consolidating
concrete (SCC). VMA has been proved to have the ability to increase the viscosity of
concrete and advance the stability of fresh mixing concrete [14]. Some VMAs are high
molecular weight polymers with a high affinity to water. The functional groups of VMA
molecules tend to interact with surfaces of cementitious particles and water, by which a
three dimensional structure in the liquid phase of the mixture will be built up. Therefore,
viscosity and yield stress will increase. The degree/strength of this three dimensional
structure determines the extent to which the yield stress and viscosity is increased. Some
other VMAs are inorganic materials, for example, colloidal silica. Their particles are
amorphous, insoluble, non-diffusible and small enough to keep suspended in water
system without setting. A three dimensional gel structure is formed due to the ionic
interaction of silica and calcium of cement, by which the viscosity and yield stress will
increase. The homogeneity of cement based materials can be improved by addition of
VMA and a more uniform fluid can be expected. Comparing with concrete without
addition of VMA, concrete with VMA addition is expected for higher thixotropy [15]. It
is also found that the addition of VMA will lead to a higher value of both the yield stress
and viscosity of fresh concrete [16]. The combination of appropriate amount of VMA and
high range water reducer can dramatically produce a high performance concrete with
high flowability and high cohesive ability in order to reduce the water dispersion [17 and

20
18].What’s more, the time of addition of chemical admixtures will also affect the flow
properties of fresh concrete. It is found that delaying the addition of High Range Water
Reducer is advantageous to get a better dispersion of cement particles [19].
2.5.4 Supplementary Cementitious Materials
The supplementary cementitious materials are used to improve the strength, permeability,
flowability and shrinkage of concrete. Rudzinski indicated that the addition of Fly Ash
has the ability to increase the flowability of fresh concrete [20] because fly ash has
spherical particles and a smooth surface texture, by which it can be considered as small
ball bearings that can lubricate the fine particles and reduce the friction between cement
particles. It is believed that the size distribution of particles, density and particle
morphologies of fly ash are the major factors influencing the flowability of fresh concrete
[21]. Also, both of yield stress and viscosity of cement based materials will decrease due
to the replacement of fly ash. However, unlike fly ash, some mineral admixtures made
with very fine particles, such as Silica Fume, will increase the water demand and reduce
workability of fresh concrete. Cry et al. pointed out that the silica fume will have a very
strong negative effect on water demand and hence workability [12]. Actually, the silica
fume increases the amount of superplasiticizer needed to remain a constant rheology
level. However, comparing with silica fume, ground silica or limestone dust will not
increase water demand significantly. This suggests that high surface area is not the only
factor related to higher amount of superplasticizer demand, and silica fume may have a
strong affinity to superplasticizer molecules [22].

21
2.5.5 Aggregate
The particle size of aggregates will affect the workability of fresh concrete. More water
will be needed to keep a constant slump of concrete if the particle size of aggregate is
high. Besides, with the same water to cement ratio, the complicated shape and texture of
fine sands will increase the water demand. Therefore, fresh concrete is expected to obtain
a worse flowability with larger aggregates. In addition, the shape and texture of both fine
and coarse aggregates have a significant effect on the rheological properties of fresh
concrete. Usually aggregates with spherical shape are helpful to improve the workability.
What’s more, the gradation of fine and coarse aggregates also affects concrete rheology
[91].
2.5.6 Clay Addition
Modern processing technologies have lead to the generation of modern concrete such as
Self Consolidating Concrete (SCC). The change of microstructure of SCC during/after
mixing and placing has been investigated recently in order to advance understanding of
processing techniques. Considering SCC, its high flowability can be obtained with an
increasing formwork pressure. SCC needs enough flowability to complete consolidation
without the application of external vibration. It is also very important for other types of
SCC, such as semi-flowable SCC, to obtain enough shape holding ability (shape stability)
in order to remain its original shape after slipform paving [32]. Some research stated that
modification in terms of microstructure of fresh concrete might increase the flowability
without reducing the formwork pressure of fresh concrete [23]. The microstructure
change is a reflection of the flocculation degree of the cement particles. Cement paste has

22
a high inherent solid concentration. When water and cement contact with each other,
cement particles rapidly form into flocs due to the frequency of particle collisions
significantly increasing [24].There will be a constant formation and breakage of
flocculation of cement paste during mixing. Applied with a constant mixing speed, the
floc size will reach an equilibrium state based on a function of the flocculation strength.
Higher flocculation strength can obtain larger flocs [25]. If mixing speed is high enough,
a maximum solid volume fraction can be expected as a function of flocculation strength
as well as the distribution of particle size and particle shape [26]. The yield stress is
dependent on both the flocculation strength and structure of the suspension [27]. If the
larger flocs are separated into smaller flocs under the application of shear rate, the flow of
cement paste will be initiated when the reflective shear stress is larger than yield stress.
The trapped water will be released into the cement paste and lubricate the particles of
cement paste. As a result, the viscosity begins to decrease, which explains the shear-
thinning behavior of cement pastes [28, 29]. The floc strength is also a determinative
factor for shape holding ability of fresh concrete.
It has been demonstrated that with small addition of clay (less than 1% by mass of
cement), substantial improvements on the shape-stability of SCC can be made. Small
dosage of Clay addition has also been proved to improve the cohesiveness of cement-
based materials [30, 31].
Tregger [32] tried to quantify how clay admixtures affect the strength of microstructure
based on rheological theory. He applied different rheological techniques including shear
and compressive rheology techniques in order to measure the effects of solids volume
23
fraction of cement paste suspensions with different clay admixtures on shear stress. By
which, he measured the shape holding ability of cement paste and investigated the effects
of clays added into the mixture on ability to keep balance between flowability and
formwork pressure. He also tried to take advantage of green strength test to check if the
results were consistent with the results obtained from rheological investigation of cement
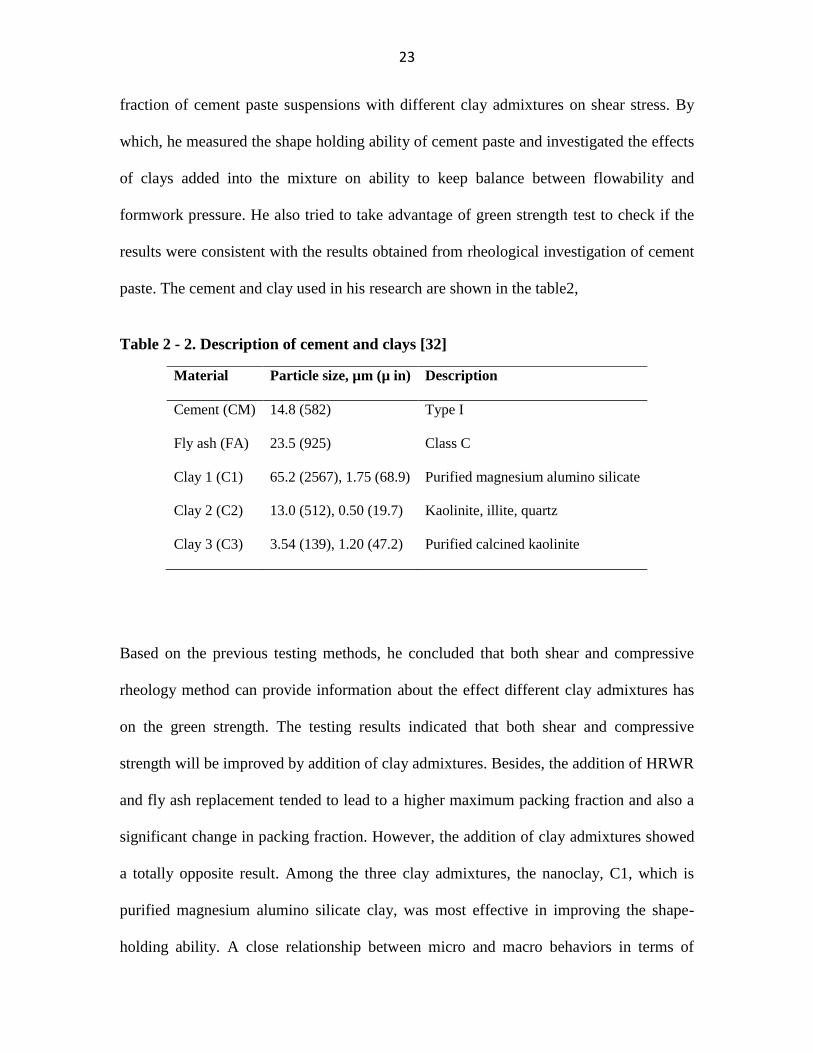
paste. The cement and clay used in his research are shown in the table2,
Table 2 - 2. Description of cement and clays [32]
Material Particle size, µm (µ in) Description
Cement (CM) 14.8 (582) Type I
Fly ash (FA) 23.5 (925) Class C
Clay 1 (C1) 65.2 (2567), 1.75 (68.9) Purified magnesium alumino silicate
Clay 2 (C2) 13.0 (512), 0.50 (19.7) Kaolinite, illite, quartz
Clay 3 (C3) 3.54 (139), 1.20 (47.2) Purified calcined kaolinite
Based on the previous testing methods, he concluded that both shear and compressive
rheology method can provide information about the effect different clay admixtures has
on the green strength. The testing results indicated that both shear and compressive
strength will be improved by addition of clay admixtures. Besides, the addition of HRWR
and fly ash replacement tended to lead to a higher maximum packing fraction and also a
significant change in packing fraction. However, the addition of clay admixtures showed
a totally opposite result. Among the three clay admixtures, the nanoclay, C1, which is
purified magnesium alumino silicate clay, was most effective in improving the shape-
holding ability. A close relationship between micro and macro behaviors in terms of

24
microstructural flocculation strength and green strength was demonstrated. Thus,
modification of microstructure of cement paste can be accomplished by addition of nano
clay admixtures and flocculation behavior will be improved. It is expected that we may
develop modern concrete with better shape holding ability by taking advantage of nano
clay application.
2.5.7 Others
There are still many other factors affecting the rheology of concrete, such as fiber
addition, mixing procedures and vibration, anyone of which will also has an important
role to play in rheology of concrete.
For fiber addition, it has a very positive effect on the rheological properties of fresh
concrete and the degree of effect depends on the aspect ratio of fibers [95]. The aspect
ratio is defined as the value of fiber length divided by diameter. The amount of fibers
added into concrete will also affect the rheological properties of concrete. With
increasing amount of fibers addition, both the yield stress and viscosity will increase
obviously at the same time. From the macroscopical point of view, the slump of fresh
concrete will decrease because of the increasing viscosity and yield stress. It has been
demonstrated that there is a critical amount of fiber addition, above which the concrete
will not flow due to the fact that the fibers will connect and interlock with each other
[95]. It leads to a much larger structural connection and more energy required to break
down the structure. Because some metal fibers have complicated shape and hard to be
sheared, it will be very difficult to measure the rheological parameters of fiber reinforced
concrete using the same measurement of cement paste. However, it is very important to

25
understand more information about the effect of fiber addition on rheological properties
of concrete, by which we can take advantage of fibers to improve the other properties of
concrete.
Before placing, the concrete will be mixed in the trucks for field construction. It is
obvious that the mixing procedure will dramatically affect the rheological properties of
concrete, among which, the shearing rate is the most important factor. High shear rate
during mixing will break down the structural flocculation and agglomerates of cement
particles. High shear rate has ability to result in an irreversible structural breakdown.
Tattersall and Banfill stated that the agglomerates and flocculations of cement share the
same hydrate membrane which will be broken by the high shear rate during mixing and
another new membrane will immediately generate and attach around the particles of
cement. The membrane will protect the cement particles from agglomeration and
flocculation [33]. This theory is supported by environmental scanning electron
microscopy [34, 35]. The high shear rate will decrease both the viscosity and yield stress
of concrete [36]. In addition, the area between the up and down curve of hysteresis loop
will also reduce [37, 38]. The increasing shear rate will result in more structural
breakdown, but the hydration products during high shearing will form to fill intervals of
cement flocculation and lead to an increasing viscosity and yield stress. Normally, people
measure the rheological parameters of concrete buy testing the mortar extracting from the
concrete, by which they try to figure out the effects of shearing and mixing on rheology
of concrete [39]. However, the mortar sieving from concrete cannot keep the same
initially structural nature, therefore there are no informative research about the effects of

26
shear mixing on concrete rheology and most of research aim to test the effect of mixing
on cement paste or mortar. It is shown that shear during the first two hours will
significantly influence the rheological properties of cement paste [40]. Actually, hand
mixing will result in a higher and faster peak stress comparing with the high shearing
methods. What’s more, it is also proved that yield stress and plastic viscosity will
decrease as the increase of mixing duration.
The low yield stress and viscosity are two major characterizations of SCC. However, the
situation is ideal for SCC and deviations always occur in the real construction field. For
normal or high strength concrete, the vibration is necessary. Thus, vibration also has an
important role to play to determine the rheological properties of concrete. During
vibration, the yield stress of fresh concrete will significantly decrease while no
pronounced effect on the viscosity [41]. De Larrard, Krstulovic and Banfill investigated
the influence of vibration on concrete rheology [42, 43, 44]. They indicated that the
workability of fresh concrete has close relationship with frequency of vibration. There
velocity of vibration has a critical value, below this value the workability of concrete is
linearly increase as the increase of vibration velocity and lower viscosity and yield stress
can be expected. Once the velocity is above the critical value, the workability of fresh
concrete will not have an obvious increase.
All the factors previously discussed will affect the concrete rheology in different points
of aspects. The different combinations of all these factors tend to dramatically affect the
rheological parameters of fresh concrete. If single change of any of these factors is

27
conducted, the others have to be adjusted at the same time in order to keep the same
flowability.
2.6 Thixotropy
2.6.1 The Origin of Thixotropy
In the field of colloid science, the property of thixotropy is the most famous rheological
phenomenon, which is very attractive to researchers. However, the research about the
thixotropy is very challenging and even confusing. Although the phenomenon of
thixotropy is widely applied in the modern engineering and industrial systems, the
complex information of thixotropy due to microstructral changes of materials are not
understood very well. Thus, there is still no standard method for fully indicating
thixotropical behavior.
People used to observe that, with shaking into a liquid sol, some gels (dispersions of
aqueous Fe2O3) could be changed. However, this type of gel generated again when the
samples were placed without shaking and this transformation could be repeatable many
times [45, 46 and 47]. Therefore, this transformation is the major contribution to the
thixotropy of colloidal materials. Due to the development of material rheology, the
phenomenon of thixotropy has been advanced. Many researchers put more attention on
the differences in thixotropy between the Newtonian Behavior and Bingham Behavior.
The definition of thixotropy can be described as following: the decrease of viscosity with
time by application of shear and the recovery of viscosity when the material is at rest.
The definition is based on viscosity and it is a time dependent change. Besides, viscosity
changing is reversible.

28
The understanding of the thixotropy is based on the microstructure of the fluid. The
existence of weak interparticle forces will create a network structure and lead to the
flocculation of particles. However, such weak interparticle forces cannot exist when there
is not outside mechanical shear, which break the flocculation and also decreases yield
stress and viscosity. Once the fluid is placed at rest, the flocculation and the
microstructural network will start again because of the interparticle forces.
2.6.2 Origin of Thixotropy of Cement Paste
The basic physical description for thixotropical properties cannot fully indicate the nature
of thixotropical properties of cementitious materials since the hydration of cement will
result in different phases and states of cementitious materials. The development of
thixotropy of cement paste is due to the changes of materials from one phase to another
phase. Therefore, based on the microstructural point, the thixotropy for cement paste
comes from the break of flocculation or connected particles [48].The physical description
of thixotropic behavior is as shown in Figure 2-8. As shown in figure (a), the smallest
potential energy lead to a balance position for each cement particle. Once small external
energy is applied into the materials, ΔE will not be enough to make the particle move
from this position, as show in (b), the particle will move back to its initial position.
However, if the external energy is larger than certain value, the particles will move
outside of the energy well, as shown in (c), and the flow initiates. For thixotropic
behavior of cementitious materials, the energy required for cement paste to leave the
energy well increases due to change of interactions of particles and cement hydration. As
shown in (d), after the particles leaving the energy well, the energy well will return to its
initial depth.

29
Figure 2- 8.Physical description of the thixotropic behavior of cementitious
materials [48]
Figure 2 - 9.Visualization of thixotropic behavior of cement paste [49]
Figure 2-9 gives another description of thixotropic behavior of cement paste. The
thixotropy of cementitious materials can be considered as the coagulation of particles
when shearing is not applied to the cement particles. Once the external shearing is
applied into the paste, the particles will be separated. It is noted that the reversible
behavior of coagulation, separation and coagulation of cement particles contribute to
thixotropic behavior of cement paste [49]. The decrease of viscosity of cement paste
during the mixing with time is contributed by change of microstructure. When the
microstructure is sheared, the viscosity of cement paste will decrease up to a certain
steady value. During the shearing, the particles will form into lines parallel to the shear
direction. The deflocculation and dispersion of cement paste particles will happen,
coming with the decrease of viscosity. Once the paste is at rest, the re-connection and re-

30
coagulation of particles come with the increasing viscosity again. The yield stress
properties come with the change of thixotropy and thixotropy has a significant role to
play to affect the yield stress beacuse it takes some time to rebuild the microstructure of
cement paste. The yield stress of cement paste will increase as the resting time after
shearing and it is noted that the longer the resting time, the higher the yield stress will be.
Thus the rate of change of yield stress with resting time is very useful for characterizing
the thixotropy of cement paste [50]. Pierce used to investigate the thixotropic behavior of
cement paste with testing gel strength of paste by applying some cycles of shearing and
rest [51]. Khayat studied the effects of thixotropy on cement paste and the variation of
peak stress and minimum stress [52]. They also developed an important method to study
the rate of microstructural rebuilding of cement paste by measuring the thixotropic value
of cement paste 1, 2 and 3 hours after mixing [52].
2.6.3 Experimental Quantification of Thixotropy
Concrete and cement paste are thixotropic materials. There are several experiments
available for measuring and characterizing the thixotropy. Two of them are very popular
and both of them are based on a rheological test. One of them takes the application of a
constant shear rate and the other one is applying different shear rates on the fluid. For
cementitious materials, the thixotropy is often quantified by measuring the area between
the up and down curve of thixotropic loop which is also called a ―Hysteresis loop‖. The
hysteresis loop method still has some problems because it is very dependent on testing
procedures and equipments [53]. The shearing procedures can be described as follow:
The shear rate will increase from zero up to a pre-determined point and it will decrease

31
back to zero. Then, the shear stress versus shear rate will be plotted. A typical hysteresis
loop is show in the Figure 2-10.
Figure 2 - 10.Typical hysteresis loop for measuring thixotropy
Normally, the area between the up curve and down curve can be used for the
measurement of thixotropy and used as an indication of energy needed to breakdown the
microstructure. The reason for the different positions of up and down curve can be
explained as the following: when the shear stress is over a certain value, the flow will
occur and the microstructure will be separated. However, it is true that the cement paste
particles have a tendency to reconnect and coagulate with each other and the flocculation
will not be quick enough to get back to the initial state. The differences between a shear
thinning and shear thickening material are shown in the Figure 2-11.

32
Figure 2- 11.Differences between the shear thinning and shear thickening materials
Tattersall took advantage of the different shear rate methods to measure the structural
breakdown and thxiotropic properties of Portland cement [54]. The cycles of increasing
and decreasing shear rate were repeated several times after mixing, by which these
hysteresis loops can give information about the structure breakdown and rebuilding.
Chemical admixtures can dramatically influence the thixotropy of cementitious materials.
Many researches about the effect of superplastisizers on thixotropy of cement paste were
conducted. Ur’ev et al [55] performed the hysteresis loop for each cement mixture with
addition of different types of superplasticizers. He concluded that superplastisizers can
decrease the area between the up and down curve. However, compared to
superplasiticizers, the information of Viscosity Modifying Agent on the thixotropy is
limited. T.H. Phan compared the influences of High Range Water Reducer and VMA on
the thixotropy of cement paste. He indicated that the VMA has function to stabilize
concrete by increasing the viscosity and thixotropy [56].

33
Mineral admixtures also have an important effect on the thixotropy of cement-based
materials. V. Petkova [57] substituted some amount of cement with slag and applied the
hysteresis loop to study the effect of slag on the thixotropy of cement paste. The
obtained results demonstrated that slag will increase the area of hysteresis loop, which is
due to the increase of surface contacting. Salem [58] studied the effect of silica fume
replacement on thixotropy of cement paste. She revealed that the hysteresis loop area
increase as silica fume amount increases, which is due to the interaction of free Ca(OH)2
and silica fume and more quick rate of transformation of ettringite-monosuflate. Besides,
more water content will decrease the area between hysteresis loop. Janotka [59] studied
the rheological properties of metakaolin blended cement paste. He investigated the
hysteresis loop area for mixtures with varied amount of metakaolin. He confirmed that
the metakaolin blended cement paste has a thixotropic behavior and demonstrated that the
hysteresis loop area increases with the increasing amount of metakaolin content. Such
pozzolanic material will also increase the yield stress of cement paste due to the higher
specific surface.
Although the shape of hysteresis loop is a very useful measurement for quantifying
thixotropy, the hysteresis loop is very sensitive to the shearing protocol. Thus, it is very
important to determine an appropriate shear history. For the constant shear rate method,
the shear stress will be measured as a function of time with a constant shear rate. There
are two parameters describing this method, one is called the initial stress (τi) and the other
one is named the equilibrium stress (τeq). It is proved that τi depends on the initial

34
structural condition of the mixture and τeq indicates a balance between the structural
breakdown and rebuilding [60]. A typical flow curve of constant shear rate method used
for measuring thixotropy is shown as Figure 2-12.
Figure 2 - 12.Flow curve of constant shear method [60]
2.7 Flocculation
Flocculation results from the process by which fine particles can combine together into
floc. In the earth sciences, flocculation can be explained as a condition where clays,
polymers or other small charged particles become attached and thus a fragile structure is
formed. In dispersed suspensions, flocculation occurs when there is no external shearing
and the dispersed particles spontaneously form flocs because of attraction resulting from
opposing charged particles. The explanations of flocculation mechanism include two
aspects: the first one is attractive forces and the second one is repulsive forces. This
section will discuss them in terms of Portland cement paste in details.

35
2.7.1 Attractive Forces
Although the cement paste cannot be totally defined as a colloid, it is true that the cement
paste consists of colloid particles. The particles of cement paste have charged particles
surface. These charges are intrinsic and come from interactions during dissolution,
adsorption and ionization of particles [61, 62]. When outer orbital electrons are switched
or shared by the other atoms, ionic and metallic bond, which are considered as strong
primary bonds, will form. Besides, the Van der Waals force can be characterized as a
secondary bond. It exists between molecules and is much weaker than the primary bonds.
If the molecules are contacting close to each other, the secondary forces will be very
effective.
Secondary bonds can also be defined as physical bonds. It is possible that these weaker
secondary forces are the most contributive factors to the thixotropic properties of cement
paste. In another words, they are the main reasons why cement paste has the reversible
flocculation and deflocculation when it is placed. There are three types of weaker
secondary forces which can be defined as follow: London dispersion forces, dipole-dipole
and hydrogen bonding. During the following pages, more detail information about these
three types of secondary forces will be given in details.
London dispersion forces are caused by instantaneous changes in the dipole of atoms due
to the location of the electrons in the orbital of atoms. Schrödinger equation describes the
probability of an electron in an atom. When an electron is on one side of the nucleus, this
side will be slightly negative charged (δ-). It will repel electrons of other atoms around,
which makes these regions positive charged (δ+). The electrostatic attraction will be
36
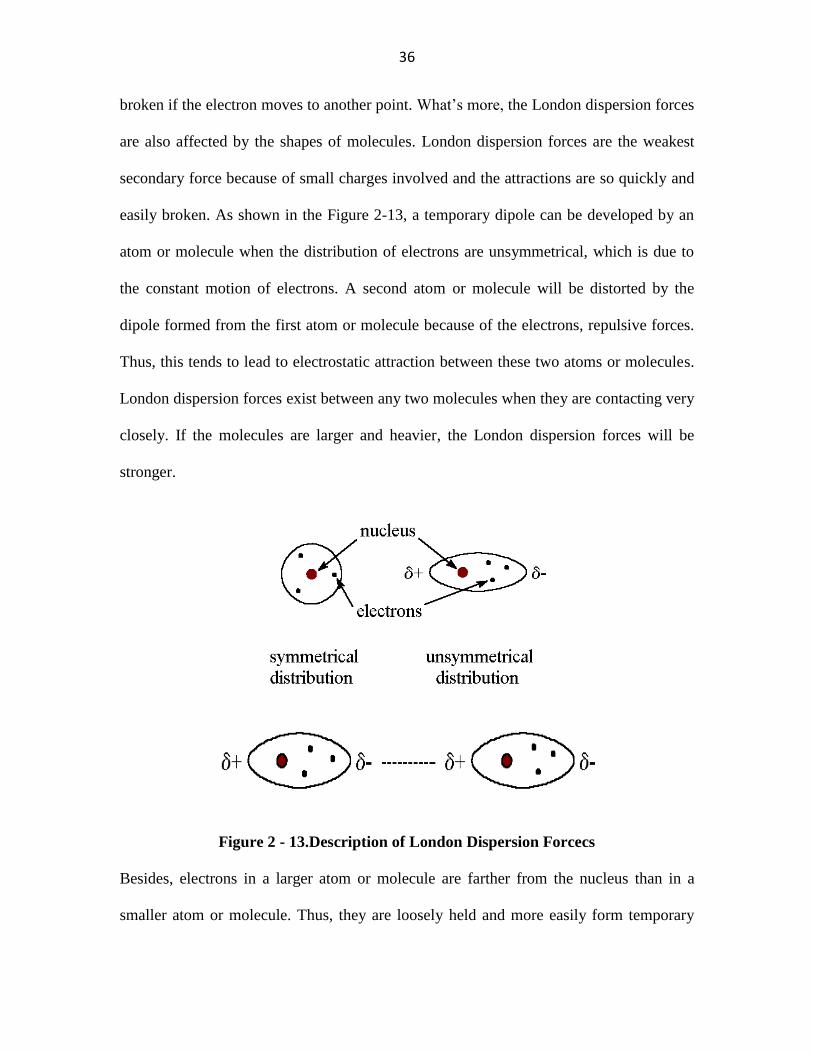
broken if the electron moves to another point. What’s more, the London dispersion forces
are also affected by the shapes of molecules. London dispersion forces are the weakest
secondary force because of small charges involved and the attractions are so quickly and
easily broken. As shown in the Figure 2-13, a temporary dipole can be developed by an
atom or molecule when the distribution of electrons are unsymmetrical, which is due to
the constant motion of electrons. A second atom or molecule will be distorted by the
dipole formed from the first atom or molecule because of the electrons, repulsive forces.
Thus, this tends to lead to electrostatic attraction between these two atoms or molecules.
London dispersion forces exist between any two molecules when they are contacting very
closely. If the molecules are larger and heavier, the London dispersion forces will be
stronger.
Figure 2 - 13.Description of London Dispersion Forcecs
Besides, electrons in a larger atom or molecule are farther from the nucleus than in a
smaller atom or molecule. Thus, they are loosely held and more easily form temporary

37
dipoles. London dispersion forces have a close relationship with the degree of polarity of
atoms and molecules. If the molecules are hard to polarize, weaker London dispersion
forces will form. However, if molecules can be easily polarized, stronger disperswion
forces will be expected. In cement paste which is a colloidal material, London dispersion
forces have a very significant role to play in the flocculation.
Dipole-Dipole interactions are caused from permanent dipoles of molecules. When one
atom is combined with another because of electronegative differences, the
electronegative atom draws the electrons in the bond closely to itself and become slightly
negative. At the same time, the other atom becomes slightly positive. The opposing
charges generate electrostatic forces and the molecules tend to align themselves in order
to improve the attraction and the potential energy reduces. However, due to atoms hardly
having a permanent dipole, the dipole-dipole interaction between two atoms is almost
zero.
Hydrogen bonds result from by highly electronegative atoms and they are stronger form
of dipole-dipole interaction. They are the strongest intermolecular force and only exist
between hydrogen and oxygen, fluorine or nitrogen. High polar bonds with hydrogen can
be created by high electronegativities of F, O and N and strong bonding between them
can be expected.
The relative strength of the listed three types of bonds can be seen in the Table2-3.

38
Table 2 - 3. Strength of secondary bonds
Bond type Energy of Dissociation energy
(kcal)
Hydrogen bonds 12~16
Dipole-dipole interactions 0.5~2
London dispersion forces (Van der Waals) Smaller than 1
As we can see in such table, the London dispersion force is the most important factor to
determine the flocculation of cement paste. The cement paste is made of heterogeneous
materials and it has different phases because of hydration, therefore, more electrostatic
attraction will also be created between particles [63]. Plassard applied atomic force
microscopy in order to study if some other forces, except of Van der Waals forces, can be
responsible for flocculation of cement paste [64]. He pointed out that calcium hydroxide
concentration also affects the attractive forces. Higher the concentration of calcium
hydroxide is, the stronger attractive forces can be expected. He assumed that the
attraction results from ion-ion forces and interaction and some other types of forces also
have an important effect on the flocculation of cement paste.
2.7.2 Repulsive Forces
The repulsive force mechanism includes two aspects: electrostatic repulsion and steric
repulsion.
2.7.2.1 Electrostatic repulsion
The electrostatic field due to charged particles is described by the double layer model
[65,66] which is shown in Figure2-14.

39
Figure 2 - 14.Double charged layer model of particles
The cement particles are positively charged. They will attract the ions with negative
charges to their surfaces. The layer just outside particle surface with positive charge is
defined as stern layer. The so called diffuse layer lies outside of the stern layer and it is
made of negative ions. The concentration of these negative ions is very high near the
surface of the Stern layer. However, the concentration of the negative ions will reduce
linearly and exponentially with the increase of distance between the diffuse and the Stern
layer. However, the positive charged cement particles will also attract some other
negatively charged ions and these ions tend to be repelled by each other. A dynamic
balance of these competitive ions with negative charge will be built up, by which the
diffuse layer forms. If the particles are with the same chemical nature and their surface
charges and potentials are the same, the repulsive forces between particles will always be
expected [67].
The pore solution has an important role to play to determine the electrostatic repulsion
force. The Debye-Huckel length (1/k) represents the thickness of the double layer model.
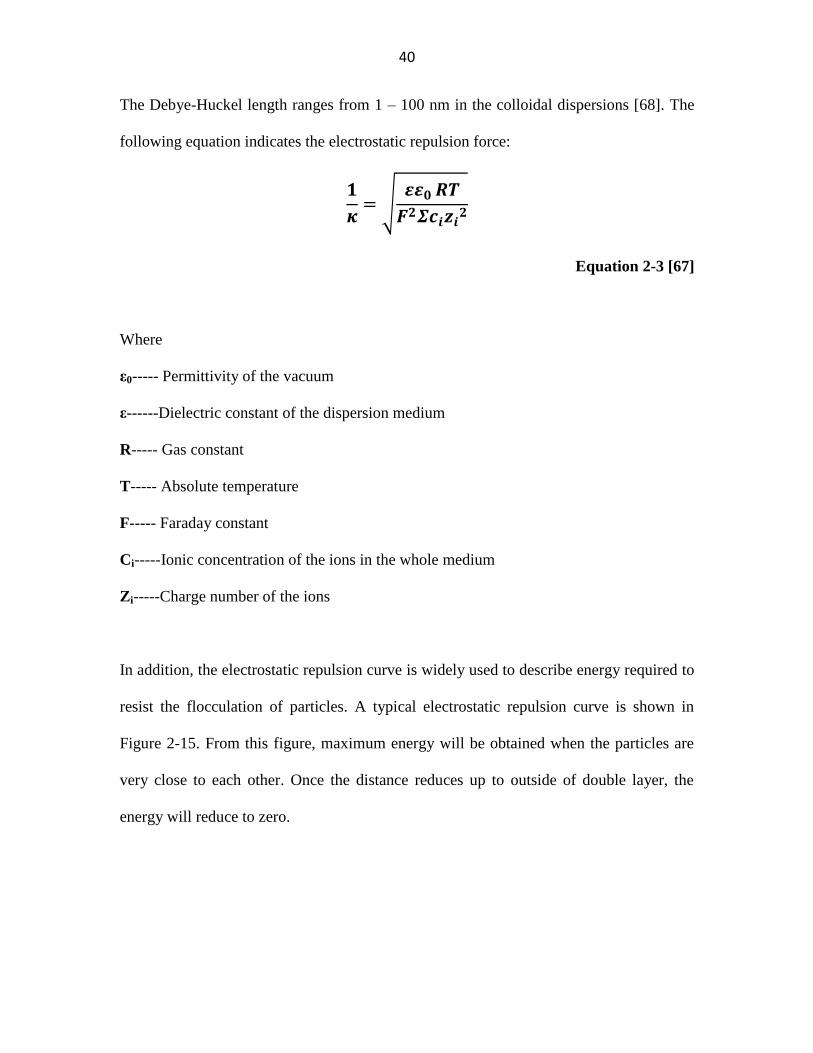
40
The Debye-Huckel length ranges from 1 – 100 nm in the colloidal dispersions [68]. The
following equation indicates the electrostatic repulsion force:
Equation 2-3 [67]
Where
ε0----- Permittivity of the vacuum
ε------Dielectric constant of the dispersion medium
R----- Gas constant
T----- Absolute temperature
F----- Faraday constant
Ci-----Ionic concentration of the ions in the whole medium
Zi-----Charge number of the ions
In addition, the electrostatic repulsion curve is widely used to describe energy required to
resist the flocculation of particles. A typical electrostatic repulsion curve is shown in
Figure 2-15. From this figure, maximum energy will be obtained when the particles are
very close to each other. Once the distance reduces up to outside of double layer, the
energy will reduce to zero.

41
Figure 2- 15. Repulsive energy as a function of distance between particles [69]
Considering the cement paste will experience different states due to hydration, the
surface of particles is not stable. A shear plane exists between the Stern and the diffuse
layer. It can be defined as a layer at which the diffuse and the Stern layers meet with each
other.
2.7.2.2 Steric Repulsion
Actually, there will be some amount of spaces in each atom of a molecule. An increase of
free energy due to overlap of adsorbed layers can be expected if two atoms are very close
to each other [70]. The increasing of free energy will also affect the preferred shape and
reactivity of molecules. It is noted that surface-active agents in water will dissolve into
water and attach on the interfaces of particles, which will change the properties and
shapes of cement particles. Therefore, the flocculation of cement particles will be
inhibited by large molecules of surface-active agents. However, this inhibition will not
happen if the main length of particles attached on interfaces is smaller than distance

42
between particles. Based on this mechanism, new chemicals with better dispersing ability
are developed, for example, superplasticizers with high water reducing ability used in self
consolidating concrete (SCC). This development is very meaningful for civil engineering
construction. The polymers of superplasticizers are negatively charged and have ability to
attach on the cement particles. Thus, as shown in Figure 2-16, the steric repulsion of
protective layer of attached polymers on the cement paste tends to inhibit the flocculation
of cement particles.
Figure 2- 16.Schematic of steric repulsion mechanism of superplasticizers
2.7.3 The Effect of Hydration on Flocculation Mechanism
The major factors affecting the flocculation of cement paste involve distribution of
particle size, volume fraction of particles, interparticle forces and cement hydration.
However, information about the effect of hydration of cement paste on the flocculation
mechanism is not enough. Since concrete will experience different states and physical
phases due to cement hydration, it has to be placed before setting. Powers pointed out
that Van der Waals forces, electrostatic forces and hydration forces cause the rheological
behavior of cement paste [71]. Some other research also confirmed that agglomeration

43
and flocculation of cement particles are caused from these forces [72, 73]. Recently, et al.
[74] and Kauppi et al. [75] developed a model in order to measure these forces, by which
they predicted rheological properties of fresh concrete. Uchikawa [76] and Banfill [77]
indicated that the interparticle interaction will be increased by the formation of ettringite
and the flocculation of cement paste is accelerated. Rößler, Eberhardt, Kučerová and
Möser [78] qualitatively and quantitatively characterized cement hydration. They tried to
advance the basic understanding on how the formation of hydration products influence
the cement paste flowability and evaluated the influence of hydration products (syngenite
and AFm) on the fluidity of cement pastes. A model used for describing the fluidity of
cement paste had been developed by understanding the properties of flocculation of
cement paste under application of shear energy. During cement hydration, formation of
long prismatic crystals like syngenite or gypsum will make a preferred crystal orientation
with application of shear energy and increase the flowability of cement paste.
The fluidity and rheological properties will be improved when there is external shearing,
which can be explained as follow: Firstly, network structure of AFm formation connects
the particles of cement paste. Such connection will be broken by shear and mixing.
What’s more, ettringite transformed from AFm because of anhydrite elements will slowly
dissolve and reduces the amount of composition available for formation of ettringite such
as calcium and sulphate. Since separated ettringite cannot connect cement particles with
the same rate as AFm, a better dispersion and weaker flocculation can be expected, which
will lead to improvement of cement flowability. In addition, insufficient C3A retardation
is represented by longer crystals and shorter crystals indicate a sufficient C3A retardation.
It was proved that longer prismatic crystals are correlated with an increasing flocculation.

44
Chapter 3 Experiment Program
3.1 Material Characterization and Mix Composition
There are two major parts for the whole experiment. The first part aims to study the effect
of different clay addition/replacement on the structural rebuilding of cement paste while
the second part aims to investigate how different cement compositions will affect the
structural rebuilding rate of cement paste.
For different cement composition, the cements used for the experiment included
Ashgrove Type I cement, Lafarge Type I/II cement, High alkali cement(Type I) and Type
IV cement from Korea. The chemical composition and physical properties of these four
types of cement are listed in Table3-1.

45
Table 3 - 1. Chemical and physical properties of different types of cement
Ashgrove Type
I
Type IV Lafarge Type
I/II
High Alkali
CaO (%) 62.8 63.03 63.37 62.50
SiO2 (%) 20.6 25.13 20.54 20.19
Al2O3 (%) 4.13 2.51 4.39 5.57
Fe2O3 (%) 2.99 3.48 3.17 2.33
SO3 (%) 2.56 2.05 3.46 4.40
MgO (%) 2.99 1.66 3.48 2.40
K2O (%) 0.64 0.64 0.67 1.15
Na2O (%) 0.1 0.04 0.09 0.23
L.O.I (%) 2.53 1.25 1.16 0.69
Specific gravity 3.14 3.14 3.14 3.15
Specific surface area 452.7 m²/kg 347m²/kg 386 m²/kg 418 m²/kg
Compound
C3S (%) 60 38 58 48
C2S (%) 14 43 15 22
C3A (%) 6 1 6 11
C4AF (%) 9 11 9 7

46
Table 3 - 2. Chemical and physical properties of different types of clay
Oxide Analysis Actigel
High Reactivity
Metakaolin
Ground Clay Brick
SiO2 (%) 49.57 51-53 69.9
Al2O3 (%) 9.44 42-44 15.4
Fe2O3 (%) 3.31 <2.20 6.8
MgO (%) 8.81 <0.10 1.6
CaO (%) 1.88 <0.20 0.8
Na2O (%) 0.59 <0.05
<2.8
K2O (%) 0.66 <0.40
TiO2 (%) 0.42 <3.0 -
P2O5 (%) 0.68 <0.2 -
MnO (%) 0.02 - -
CrO3 (%) 0.02 - -
SO4 (%) - <0.5 -
SO3 (%) - - 0.1
L.O.I (%) <0.50 19.50 0.2
Specific surface
area
150m2/g 15m
2/g 0.370m²/g
Specific gravity 2.62 2.6 2.65
Mean particle size 2 um 4.5um 80um

47
For clay addition/replacement part, this thesis used three different kinds of clay, Actigel,
High Reactivity Metakaolin (HRM) and Ground Clay Brick (GCB). The chemical
composition and physical properties of the three types of clay used for the whole
experiment are shown in the Table 3-2.
Tap water (70 °F) was used for all mixing of the cement paste.
3.2 Mix Proportions
In order to study how clay addition/replacement will affect the structural rebuilding rate,
the mixing proportions are shown in Table 3-3. w/c of 0.4 was selected for all the
mixtures. Ashgrove Type I cement was used for all mixtures. All pastes were mixed by a
Hobart mixer according to the mixing procedure described in Section 3.3. The factors
studied included different types of cement and different amount of clay
addition/replacement. The amount of clay addition/replacement was all by percent
weight of cement.
Table 3 - 3. Pastes with clay addition/replacement mix proportions
Clay w/c Amount of clay addition/replacement
Actigel 0.4 0.5%, 1%, 2%, 3%
High Reactivity Metakaolin 0.4 5%, 10%, 15%
Ground Clay Brick 0.4 15%, 25%, 35%
For the study of how different types of cement will affect the structural rebuilding rate,
the mix proportions are shown in Table 3-4. The w/c of 0.4 was fixed for all mixtures.

48
Four different types of cement were studied and the w/c can ensure suitable flowability of
cement pastes. All pastes were also mixed by a Hobart mixer according to the mixing
procedure shown in Section 3.3.
Table 3 - 4. Different types of cement mix proportion
Type of cement w/c
Ashgrove Type I 0.4
Lafarge Type I/II 0.4
High Alkali 0.4
Type IV 0.4
3.3 Mixing Procedure
One mixer and one mixing procedure were used to study the effect of clay
addition/replacement and different cement types on structural rebuilding of cement paste.
The Hobart model N50 mixer which is shown in Figure 3-1 was used for mixing based on
the mixing procedures described as following:
1. Add the cement and clay into the mixing bowl of the mixer,
2. Mix the dry cement and clay on low speed (140 ) for 60 seconds,
3. Put the water into the mixing bowl and keep mixing on low speed (140 ) for
120 seconds,
4. Stop the mixer for 60 seconds, during this time scrape down any paste or dry
ingredients that collected on the edges of the Hobart mixer,
5. Start mixing again on medium speed (285 ) for 150 seconds,

49
6. Stop the mixer for another 60 seconds, during this time scrape down the paste on the
edges of Hobart Mixer,
7. Start mixing again on medium speed (285 ) for another 150 seconds.
Figure 3 - 1.Hobart mixer
3.4 Test Methods
3.4.1 Paste Rheology Measurement
Typically, the rheometer is applied to evaluate the rheological parameters of cement-
based materials. For this thesis, the Brookfield R/S SST2000 rheometer which is shown
in Figure 3-2 was used to measure the rheological parameters of cement paste. It is a
constant shear stress rheometer controlled by a computer program. The calculation of
shear stress and shear rate are based on readings in the load cell and the rotating vane
size.

50
Figure 3 - 2.Brookfield R/S SST2000 rheometer
Vane size may have a significant effect on rheology measurement of cement-based
material, only one size of rotating vane was used according to the rheological parameters
of different materials under test. Table 3-5 lists the physical parameters of rotating vane.
Figure 3-3 shows the vane and cylinder for rheology test.
Table 3 - 5. The physical parameters for vane of Brookfield Rheometer
Vane type Diameter (m) Height (m) Torque range (Pa) Size of container
V30-15 0.015 0.030 121-4040 2’’×4’’ Cylinder

51
Figure 3 - 3.Vane and cylinder for rheometer
The shearing procedure of rheology measurement is shown in Figure 3-4. This procedure
was used for all paste rheology measurements. Once the mixing of paste was finished, the
mixture was placed into 6 cylinders at the same time for rheology measurement. Then
one of the paste specimens was placed into the rheometer. There was no pre-shear step
due to the fact that the experiment aims to evaluate how clay addition/replacement and
different types of cement will affect the structural rebuilding rate and flocculation of
cement paste. Although the pre-shear has the ability to protect the sedimentation of
cement paste during the experiment, the pre-shear will break the structural connection
and flocculation, which will negatively affect the evaluation of structural rebuilding and
flocculation. At the very beginning, the specimen was subjected to perform a hysteresis
loop. The shear rate increased from 0 to 100s-1
over 60 seconds and then ramped down
from 100 to 0s-1
over another 60 seconds. This procedure was repeated 6 times for each
mixing proportion (The second specimen was allowed to rest for 15 minutes from the end

52
of mixing, the third specimen was allowed to rest for 30 minutes from the end of mixing,
etc. ), and each specimen was performed a hysteresis loop. Similarly, the hysteresis loop
for the sixth specimen was performed 75 minutes from the end of mixing. It is expected
that an increasing shear stress can be seen with the change of time. Since the rheology
measurement is very sensitive, three repetitions were performed for each mixing
proportion.
Figure 3 - 4.Shear history for paste rheology measurement
The thxiotropic value (area within the up and down curve of each hysteresis loop), was
calculated for each specimen and the average values were plotted versus time. The slope
of the line can be used to indicate the structural rebuilding rate. If the thixotropic values
for different mixtures can be plotted together it can give information about comparisons
among the rates of structural rebuilding for different paste with different clay
addition/replacement or pastes made with different types of cement. For example, as we
can see in Figure 3-5, the structural rebuilding rate of material 1 is highest followed by
0
20
40
60
80
100
120
0 20 40 60 80 100 120 140
She
ar r
ate
, 1/s
Time, s

53
material 2 and material 3 while the slope of the plane for material 4 is lower than the
other three.
Figure 3 - 5. Application of experimental procedure to compare the structural
rebuilding rate of different mixtures
In addition, the other two rheological parameters (yield stress and viscosity) for each
specimen were also plotted versus time because both the yield stress and viscosity are
informative parameters which can be related to the structural rebuilding and flocculation
of cement paste. Therefore, the plots provide valuable information about the study focus.
Since the rheological test is very sensitive, in order to protect errors from experiment, the
rheological test for each mix proportion was repeated for three times and the average
values for each parameter were plotted versus time.
0
2000
4000
6000
8000
10000
12000
14000
16000
18000
20000
0 10 20 30 40 50 60 70 80
Thix
otr
op
y, P
a/s
Time, min
Material 4
Material 3
Material 2
Material 4

54
In addition to the rheology test for paste mixtures, a flow table test was used to evaluate
the flowability of cement-based materials, so that the rheological parameters can be
compared with the standard tests in order to correlate the rheology test results to better
evaluate the structural rebuilding and flocculation of cement paste. The flow table test
were done according to the ASTM C230 and estimated the flowability of mortar based on
the spread of a mortar specimen subjected to 25 drops of the flow table which is shown in
Figure 3-6. The flow percentage of the mortar was calculated by measuring the diameter
of spread of mortar. It is known that the higher flow percentage indicates better
flowability of mortar. This thesis applied this test method to cement paste. The ASTM
C1437 describes the test procedure and mixing procedure described in Section 3.3 was
used for the flow table test. For the paste specimens with very high flowability, they
might lead to a spread larger than the measurable range at 25 drops. Thus, a modified
flow percentage measuring equation was developed based on the spread diameter on a
logarithm scale. The modified equation can be described as following [91]:
F25 = Ft +46.779 (ln25 - lnt)
Equation 3-1
Where F25 is the flow percent of paste at 25 drops and Ft is the flow percent of paste
sample at t drops. Similar with the rheology measurement of cement paste, six specimens
for each mixing proportion were prepared right after mixing, the first one was tested right
after mixing and the sixth specimen was tested 75 minutes after mixing. The flow
percentage of each specimen was plotted versus time.

55
Figure 3 - 6. Flow table equipment
3.4.2 Heat of Hydration
Another part of this thesis is to investigate how cement hydration will influence the
structural rebuilding rate of cement based materials. Therefore, paste specimens were
prepared for isothermal calorimeter testing. The paste samples were prepared based on
the mixing procedure previously described in section 3.3. The isothermal calorimeter is
manufactured by Thermometric. It can be used for measuring the rate of heat of hydration
of cement paste. There are eight individual sample channels and all of them can be tested
at the same time. The picture of isothermal calorimeter is shown in Figure 3-7.

56
Figure 3 - 7. The unit of isothermal calorimeter
Right after mixing, the pastes (approximately 100 grams) were placed into the chamber
which has two heat flow senors, one is an inert sensor and the other is an output sensor.
The heat generated from hydration of cement paste will be measured by these two
sensors. Once the heat generated from physical and chemical reaction spread to the
surrounding, it will be detected by the two sensors. The differences between inert and
output sensor will generate a voltage based on the proportion of heat flow. The
measurement will be conducted every 30 seconds and last for 48 hours. By a calibrating
procedure, the detected voltage signal will be converted to rate of heat of hydration. In
this thesis, the total heat of hydration generated by all cement paste mixtures at 20 degree
C was measured.

57
3.4.3 Compressive Strength
The compressive strength of cubic specimens of cement paste with different clay
addition/replacement or different types of cement were also studied in this thesis. The test
procedure followed the ASTM C150. The equipment is shown in Figure 3-8. Concerning
the High Reactivity Metakaolin and Ground Clay Brick are pozzolanic materials which
have slow/rapid rate of hydration, for each mix proportion with clay addition/replacement
described in Section 3.2, 3, 7, 28 and 56 days compressive strength were tested.
However, for another experimental step studying the effect of different types of cement
on structural rebuilding and flocculation, 3, 7 and 28 days compressive strength were
tested for each mix proportion described in Section 3.2. Three specimens for each test
were prepared and the average compressive strength was plotted together.
Figure 3 - 8. Test Mark compressive strength testing equipment

58
Chapter 4 Evaluation of Structural Rebuilding Rate
4.1 Introduction
The objective for this chapter is to investigate how different clay addition and types of
cement will affect the structural rebuilding rate of cement based materials. The rheology
test method and flow table test described in Chapter 3 were used for measuring the rate of
structural rebuilding. The rheology measurements were analyzed and a regression model
was developed to describe the structural rebuilding rate of cement paste. Because the
different clays will not be used at the same time in construction field, therefore only
pastes with individual clay addition/replacement were studied.
4.2 Rheology Test Results
Figure 4-1, Figure 4-2 and Figure 4-3 show the plot of thixotropy, yield stress and
viscosity versus time for cement paste specimens with addition of Actigel, respectively.
It can be seen that the rate of structural rebuilding rate was obviously affected by the
addition of Actigel. The plot indicates that the Actigel addition increased the energy
required to breakdown the structure of paste since that thixtropic value for each time
point increased with the increasing amount of Actigel addition. Besides, the thixotropic
values were highest for 3% amount of Actigel addition and lowest for the pure cement
paste. Similar results can be seen in the plots of yield stress and viscosity. However, the
rate of structural rebuilding varied a lot for pastes with different amounts of Actigel
addition. Small amount of Actigel addition increased structural rebuilding rate. The
highest structural rebuilding rate was obtained by paste with 1% Actigel addition and

59
with continuing addition of Actigel, rate of structural rebuilding started to decrease
gradually and the lowest rate of structural rebuilding was seen in paste samples with 3%
addition of Actigel.
Figure 4 - 1. Thixotropy versus time for pastes with different amount of Actigel
0
1000
2000
3000
4000
5000
6000
0 10 20 30 40 50 60 70 80
Thix
otr
op
y, P
a/s
Time, min
OPC
PC+0.5% Actigel
PC+1% Actigel
PC+2% Actigel
PC+3% Actigel

60
Figure 4 - 2. Yield stress versus time for pastes with different amount of Actigel
Figure 4 - 3. Viscosity versus time for pastes with different amount of Actigel
30
40
50
60
70
80
90
0 10 20 30 40 50 60 70 80
Yie
ld s
tre
ss, P
a
Time, min
OPC PC+0.5% Actigel
PC+1% Actigel PC+2% Actigel
PC+3% Actigel
0.4
0.5
0.6
0.7
0.8
0.9
1
1.1
1.2
0 10 20 30 40 50 60 70 80
Vis
cosi
ty, P
a•s
Time, min
PC + 0% Actigel PC + 0.5% Actigel
PC + 1% Actigel PC + 2% Actigel
PC + 3% Actigel

61
Figure 4-4, Figure 4-5 and Figure 4-6 show the plot of thixotropy, yield stress and
viscosity versus time for cement paste specimens with replacement of High Reactivity
Metakaolin (HRM) clay respectively. Similarly, the pastes with HRM replacement were
shown to have improved thixotropic behavior due to the fact that higher thixotropic
values with increased amounts of HRM replacement were seen at each time point. It
seems that there is an increase in yield stress with increasing HRM, but yield stress is not
significantly affected by time when the HRM amount is low. However, the yield stress
increase with the time when HRM amount is larger than 10%. The same trend can be
seen for viscosity. As expected, the rate of structural rebuilding rate increased with the
amount of HRM replacement. The highest rebuilding rate was obtained when the amount
of replacement is 15% while pure cement paste had the lowest structural rebuilding rate.
Figure 4 - 4. Thixotropy versus time for pastes with different amount of High
Reactivity Metakaolin replacement
0
2000
4000
6000
8000
10000
12000
14000
16000
18000
0 10 20 30 40 50 60 70 80
Thix
otr
op
y, P
a/s
Time, min
OPC
PC+5% HRM
PC+10% HRM
PC+15% HRM

62
Figure 4 - 5. Yield stress versus time for pastes with different amount of High
Reactivity Metakaolin replacment
Figure 4 - 6. Viscosity versus time for pastes with different amount of High
Reactivity Metakaolin replacment
0
20
40
60
80
100
120
140
160
180
200
220
240
260
0 10 20 30 40 50 60 70 80
Yie
ld s
tre
ss, P
a
Time, min
PC + 0% HRM
PC + 5% HRM
PC + 10% HRM
PC + 15% HRM
0
0.5
1
1.5
2
2.5
3
0 10 20 30 40 50 60 70 80
Vis
cosi
ty, P
a•s
Time, min
PC + 0% HRM
PC + 5% HRM
PC + 10% HRM
PC + 15% HRM

63
For the replacement of Ground Clay Brick (GCB), Figure 4-7, Figure 4-8 and Figure 4-9
show the plot of thixotropy, yield stress and viscosity versus time for cement paste
specimens with different amount of Ground Clay Brick replacement respectively. It is
shown that cement pastes with replacement of GCB had thixotropic behavior and the
higher thixotropy, yield stress and viscosity value with increasing amount of GCB
replacement can be seen at each time point. For the structural rebuilding rate, it seems
that the replacement of GCB increased the structural rebuilding rate of cement paste
slightly. Higher structural rebuilding rate was seen in the paste specimens with 25% and
35% GCB replacement. However, no pronounced differences between them were found.
The pure cement paste and paste with 15% GCB replacement had similar rate of
structural rebuilding and both of them were lower than pastes with 25% or 35% GCB
replacement.
Figure 4 - 7. Thixotropy versus time for pastes with different amount of Ground
Clay Brick replacement
0
500
1000
1500
2000
2500
3000
3500
4000
0 10 20 30 40 50 60 70 80
Thix
otr
op
y, P
a/s
Time, min
OPC
PC+15% GCB
PC+25% GCB
PC+35% GCB

64
Figure 4 - 8. Yield stress versus time for pastes with different amount of Ground
Clay Brick replacement
Figure 4 - 9. Viscosity versus time for pastes with different amount of Ground Clay
Brick replacement
30
35
40
45
50
55
0 10 20 30 40 50 60 70 80
Yie
ld s
tre
ss, P
a
Time, min
PC + 0% GCB
PC + 15% GCB
PC + 25% GCB
PC + 35% GCB
0.4
0.45
0.5
0.55
0.6
0.65
0.7
0.75
0.8
0 20 40 60 80
Vis
cosi
ty, P
a•s
Time, min
PC + 0% GCB PC + 15% GCB
PC + 25% GCB PC + 35% GCB

65
Figure 4-10, Figure 4-11 and Figure 4-12 show the plot of thixotropy, yield stress and
viscosity versus time for pastes made with different types of cement. From these figures,
high alkali cement gained the highest thixotropy, viscosity and yield stress with time,
followed by Lafarge Type I/II and Type IV cement. The Ashgrove Type I cement
obtained the lowest thixotropy, yield stress and viscosity. We can also observe that the
higher structural rebuilding rate was obtained by High Alkali cement and Lafarge Type
I/II cement. At the same time, lower structural rebuilding rate was seen for pastes made
with Type IV cement and Ashgrove Type I cement and rates for them were similar with
each other.
Figure 4 - 10. Thixotropy versus time for pastes made with different types of cement
0
1000
2000
3000
4000
5000
6000
7000
0 10 20 30 40 50 60 70 80
Thix
otr
op
y, P
a/s
Time, min
Ashgrove Type I
Lafarge Type I/II
Type IV
High Alkali

66
Figure 4 - 11. Yield stress versus time for pastes made with different types of cement
Figure 4 - 12. Viscosity versus time for pastes made with different types of cement
0
20
40
60
80
100
120
140
160
180
0 10 20 30 40 50 60 70 80
Yie
ld s
tre
ss, P
a
Time, min
Ashgrove Type I
LafargeType I/II
Type IV
High Alkali
0
0.2
0.4
0.6
0.8
1
1.2
1.4
1.6
0 10 20 30 40 50 60 70 80
Vis
cosi
ty, P
a•s
Time, min
Ashgrove Type I
LafargeType I/II
Type IV
High Alkali

67
4.3 Understanding Rheology Results Based on Statistical Analysis
4.3.1 How to Understand Analysis of JMP
The Thixotropy values for each mixtures used for analyzing structural rebuilding rate
were analyzed by a statistical software program (JMP 8.0). From the previous
descriptions about plots of thixotropy versus time, we can see that the structural
rebuilding trend cannot always be linearly described. Thus, for those that cannot be
described as a linear relationship, bivariate fit was transformed to a model as a function
of square root of time. The regression models were used for analyzing structural
rebuilding rate. The table of Parameter Estimates indicated whether the changing of
structural rebuilding rate is statistically significant. If P-value in such a table is less than
0.05, it indicated that the changing of structural rebuilding rate is statistically significant.
4.3.2 Actigel
Table 4-1 shows the thixotropy values for paste mixtures with different amount of
Actigel addition at each time point.
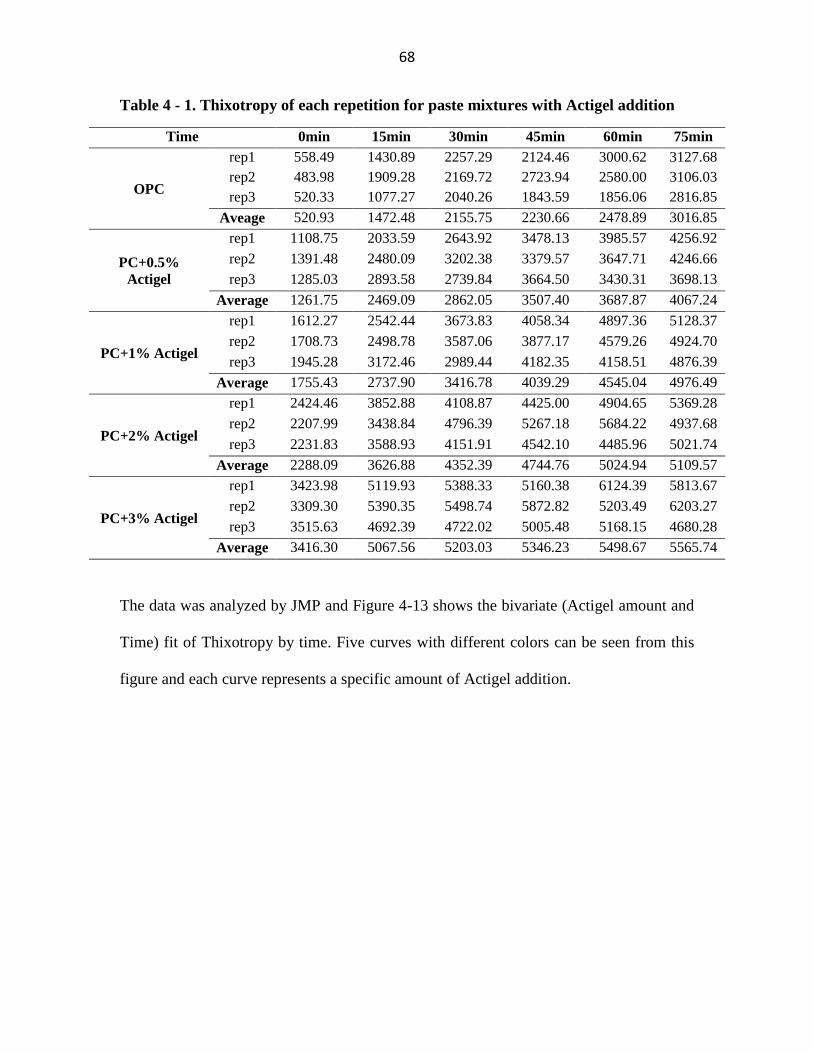
68
Table 4 - 1. Thixotropy of each repetition for paste mixtures with Actigel addition
Time 0min 15min 30min 45min 60min 75min
OPC
rep1 558.49 1430.89 2257.29 2124.46 3000.62 3127.68
rep2 483.98 1909.28 2169.72 2723.94 2580.00 3106.03
rep3 520.33 1077.27 2040.26 1843.59 1856.06 2816.85
Aveage 520.93 1472.48 2155.75 2230.66 2478.89 3016.85
PC+0.5%
Actigel
rep1 1108.75 2033.59 2643.92 3478.13 3985.57 4256.92
rep2 1391.48 2480.09 3202.38 3379.57 3647.71 4246.66
rep3 1285.03 2893.58 2739.84 3664.50 3430.31 3698.13
Average 1261.75 2469.09 2862.05 3507.40 3687.87 4067.24
PC+1% Actigel
rep1 1612.27 2542.44 3673.83 4058.34 4897.36 5128.37
rep2 1708.73 2498.78 3587.06 3877.17 4579.26 4924.70
rep3 1945.28 3172.46 2989.44 4182.35 4158.51 4876.39
Average 1755.43 2737.90 3416.78 4039.29 4545.04 4976.49
PC+2% Actigel
rep1 2424.46 3852.88 4108.87 4425.00 4904.65 5369.28
rep2 2207.99 3438.84 4796.39 5267.18 5684.22 4937.68
rep3 2231.83 3588.93 4151.91 4542.10 4485.96 5021.74
Average 2288.09 3626.88 4352.39 4744.76 5024.94 5109.57
PC+3% Actigel
rep1 3423.98 5119.93 5388.33 5160.38 6124.39 5813.67
rep2 3309.30 5390.35 5498.74 5872.82 5203.49 6203.27
rep3 3515.63 4692.39 4722.02 5005.48 5168.15 4680.28
Average 3416.30 5067.56 5203.03 5346.23 5498.67 5565.74
The data was analyzed by JMP and Figure 4-13 shows the bivariate (Actigel amount and
Time) fit of Thixotropy by time. Five curves with different colors can be seen from this
figure and each curve represents a specific amount of Actigel addition.

69
Figure 4 - 13. Bivariate Fit of Thixotropy by Time for Actigel Addition
Considering the two variables of Actigel amount and time, the regression model is:
Thixotropy = 493.77529 + 733.57977 A0.5 +1051.1934 A1 + 1852.2802 A2 +3214.1573
A3 +284.5427 + 48.616844*A0.5* +101.28476 A1* +66.453103 A2* -
32.74304 A3*
R2=0.943032
Equation 4-1

70
Where 493.77529 is the average of response and the code variables are amount of Actigel
addition and time. In this equation, if Actigel amount is 0.5%, A0.5 =1, and A1, A2 and A3
all equal to zero. Similarly, if the Actigel amount is 3%, A3 =1 and A0.5, A1, A2 all equal
to zero. Therefore, the equation above can be transformed as following:
when Actigel amount = 0%, Thixotropy = 493.77529 + 274.5427 ;
when Actigel amount = 0.5%, Thixotropy =1227.3551 + 323.15955 ;
when Actigel amount = 1%, Thixotropy = 1544.9687 + 375.82747 ;
when Actigel amount = 2%, Thixotropy= 2346.0555 + 340.99581 ;
when Actigel amount = 3%, Thixotropy = 3707.9326 + 241.79966 .
The coefficient of indicates the structural rebuilding rate of pastes with different
amount of Actigel addition. The plot of coefficient of is plotted versus Actigel
amount which is shown in Figure 4 - 14. It is not difficult to see that the structural
rebuilding rate will increase as the increasing amount of Actigel addition from 0% to 1%
while the rebuilding rate will decrease if the amount of Actigel is over 1%.
Figure 4 - 14. The plot of coefficient of square time vs. Actigel amount
y = 5E+06x3 - 735114x2 + 16237x + 271.01R² = 0.9766
200
220
240
260
280
300
320
340
360
380
400
0.0% 0.5% 1.0% 1.5% 2.0% 2.5% 3.0% 3.5%
Co
eff
icie
nt
of
sqar
tim
e
Actigel amount, %

71
Table 4 - 2. Parameters Estimates for paste with Actigel addition
Term Estimate Std Error t Ratio Prob>|t|
Intercept 493.77529 180.2522 2.74 0.0076*
Actigel_0.5 733.57977 254.9151 2.88 0.0051*
Actigel_1.0 1051.1934 254.9151 4.12 <.0001*
Actigel_2.0 1852.2802 254.9151 7.27 <.0001*
Actigel_3.0 3214.1573 254.9151 12.61 <.0001*
SQRT(Time) 274.5427 29.43506 9.33 <.0001*
SQRT(Time)*Actigel_0.5 48.616844 41.62746 1.17 0.2463
SQRT(Time)*Actigel_1.0 101.28476 41.62746 2.43 0.0172*
SQRT(Time)*Actigel_2.0 66.453103 41.62746 1.60 0.1143
SQRT(Time)*Actigel_3.0 -32.74304 41.62746 -0.79 0.4339
Table 4-2 gives the Parameters Estimates of this regression model. From this table, the
highlighted part can be used for estimating if the increasing of structural rebuilding rate
compared with paste with 0% Actigel is statistically significant in terms of unit square
time. Based on the p-value of each part, we can see that only increase of structural
rebuilding rate of paste with 1% Actigel (p-value=0.0172<0.05) is statistically
significant.
4.3.3 High Reactivity Metakaolin
Table 4-2 shows the thixotropy values for paste mixtures with different amount of HRM
replacement at each time point.
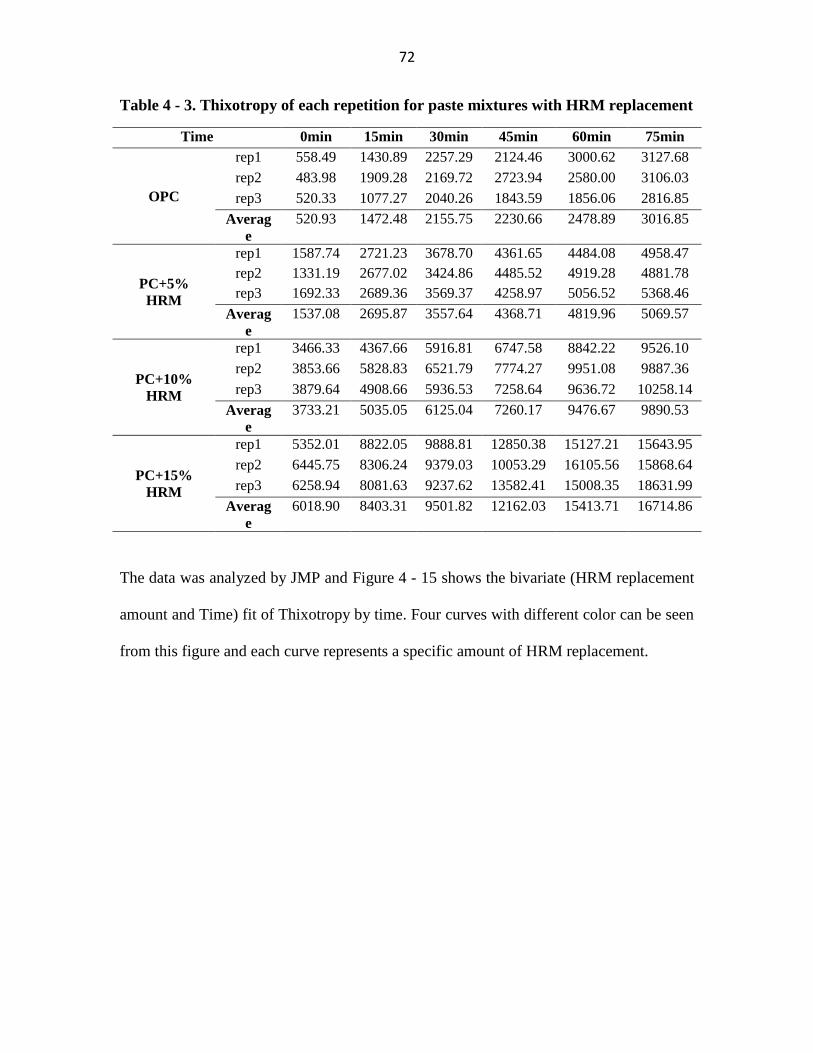
72
Table 4 - 3. Thixotropy of each repetition for paste mixtures with HRM replacement
Time 0min 15min 30min 45min 60min 75min
OPC
rep1 558.49 1430.89 2257.29 2124.46 3000.62 3127.68
rep2 483.98 1909.28 2169.72 2723.94 2580.00 3106.03
rep3 520.33 1077.27 2040.26 1843.59 1856.06 2816.85
Averag
e
520.93 1472.48 2155.75 2230.66 2478.89 3016.85
PC+5%
HRM
rep1 1587.74 2721.23 3678.70 4361.65 4484.08 4958.47
rep2 1331.19 2677.02 3424.86 4485.52 4919.28 4881.78
rep3 1692.33 2689.36 3569.37 4258.97 5056.52 5368.46
Averag
e
1537.08 2695.87 3557.64 4368.71 4819.96 5069.57
PC+10%
HRM
rep1 3466.33 4367.66 5916.81 6747.58 8842.22 9526.10
rep2 3853.66 5828.83 6521.79 7774.27 9951.08 9887.36
rep3 3879.64 4908.66 5936.53 7258.64 9636.72 10258.14
Averag
e
3733.21 5035.05 6125.04 7260.17 9476.67 9890.53
PC+15%
HRM
rep1 5352.01 8822.05 9888.81 12850.38 15127.21 15643.95
rep2 6445.75 8306.24 9379.03 10053.29 16105.56 15868.64
rep3 6258.94 8081.63 9237.62 13582.41 15008.35 18631.99
Averag
e
6018.90 8403.31 9501.82 12162.03 15413.71 16714.86
The data was analyzed by JMP and Figure 4 - 15 shows the bivariate (HRM replacement
amount and Time) fit of Thixotropy by time. Four curves with different color can be seen
from this figure and each curve represents a specific amount of HRM replacement.

73
Figure 4 - 15. Bivariate Fit of Thixotropy by Time for HRM replacement
From this figure, the curves are fitted as a linear function. Considering the two variables
of HRM replacement amount and time, the regression model is:
Thixotropy = 866.85286 + 1033.2575 H5 + 2821.3589 H10 + 4990.0214 H15 +
29.664279 t +17.660971 *t *H5 + 56.519733* t* H10 + 117.3285* t* H15
R2= 0.979287
Equation 4-2

74
Similarly with analysis of Actigel,
when HRM amount is 0%, H5, H10, H15 = 0, Thixotropy = 866.85286 + 29.664279*t;
when HRM amount is 5%, H5=1, H10, H15=0, Thixotropy = 1900.1103 + 47.325251*t;
when HRM amount is 10%, H10=1, H5, H15=0, Thixotropy = 3688.2117 + 86.184013*t;
when HRM amount is 15%, H15=1, H5, H10=0, Thixotropy = 5856.8743 + 146.99277*t.
Figure 4 - 16. Plot of coefficient of time vs. HRM amount
The coefficient of t are plotted versus HRM amount (Figure 4 - 16)and can be used for
indicating structural rebuilding rate of cement paste with HRM replacement. With
increasing amount of HRM replacement (from 0%~15%), a sustained increasing rate of
structural rebuilding was obtained.
Table 4 - 4. Parameters Estimates for paste with HRM replacement
Term Estimate Std Error t Ratio Prob>|t|
Intercept 866.85286 274.1282 3.16 0.0024*
Time 29.664279 6.036104 4.91 <.0001*
HRM_5% 1033.2575 387.6758 2.67 0.0097*
HRM_10% 2821.3589 387.6758 7.28 <.0001*
HRM_15% 4990.0214 387.6758 12.87 <.0001*
Time*HRM_5% 17.660971 8.53634 2.07 0.0426*
Time*HRM_10% 56.519733 8.53634 6.62 <.0001*
Time*HRM_15% 117.3285 8.53634 13.74 <.0001*
y = 4314.8x2 + 134.47x + 29.702R² = 1
0
20
40
60
80
100
120
140
160
0% 5% 10% 15% 20%
Co
eff
icie
nt
of
tim
e
HRM amount, %

75
Table 4-4 gives the Parameters Estimates of regression model of cement paste with HRM
replacement. From the highlighted part of this table, the p-values of cement paste with
5%, 10% and 15% are 0.0426, <.0001 and <.0001 respectively. All of them are less than
0.05, which indicated that structural rebuilding rate of paste with different amount of
HRM replacement are statistically significant compared with pure cement paste in terms
of unit time.
4.3.4 Ground Clay Brick
Table 4 - 5. Thixotropy of each repetition for paste mixtures with GCB replacement
Time 0min 15min 30min 45min 60min 75min
OPC
rep1 558.49 1430.89 2257.29 2124.46 3000.62 3127.68
rep2 483.98 1909.28 2169.72 2723.94 2580.00 2406.03
rep3 520.33 1077.27 2040.26 1843.59 1856.06 2916.85
Average 520.93 1472.48 2155.75 2230.66 2478.89 2816.85
PC+15%
GCB
rep1 760.11 1956.73 2716.70 3143.17 3078.81 3144.32
rep2 623.33 1698.36 2543.80 2672.70 2797.60 3562.49
rep3 787.74 1482.80 1865.56 2429.30 2550.73 2704.61
Average 723.72 1712.63 2375.35 2748.39 2809.04 3137.14
PC+25%
GCB
rep1 647.27 1829.65 2850.40 3267.46 3183.19 3430.23
rep2 857.36 2009.66 2796.45 2646.59 3625.56 3409.09
rep3 606.55 1729.64 2102.04 3050.69 3246.92 4000.62
Average 703.73 1856.31 2582.96 2988.25 3351.89 3613.31
PC+35%
GCB
rep1 982.52 1966.85 2626.36 3863.77 4209.62 3531.00
rep2 1025.76 2036.47 2947.55 3059.10 2933.47 3496.07
rep3 807.75 1798.85 2324.64 2268.43 3258.41 3874.65
Average 938.68 1934.06 2632.85 3063.77 3467.16 3633.91
Table 4-5 shows the thixotropy values for paste mixtures with different amount of GCB
replacement at each time point. Figure 4 - 17 shows the bivariate (GCB replacement

76
amount and Time) fit of Thixotropy by time. Four curves with different color can be seen
from this figure and each curve represents a specific amount of GCB replacement.
Figure 4 - 17. Bivariate Fit of Thixotropy by Time for paste with GCB replacement
Concerning the two variables (Cement types and time), the regression model is given as:

77
Thixotropy = 531.70972 + 192.00578 G15 +125.06957 G25 + 325.28075 G35 +
261.37124 + 20.904963*G15* + 82.257489*G25* + 62.934911*G35*
R2 = 0.895022
Equation 4-3
Where:
When GCB amount is 0%, G15, G25, G35=0, Thixotropy = 531.70972 +261.3712* ;
When GCB amount is 15%, G15=1, G25, G35=0, Thixotropy = 723.7155 +282.27621* ;
When GCB amount is 25%, G25=1, G15, G35=0, Thixotropy = 656.7792 +343.62873* ;
When GCB amount is 35%, G35=1, G15, G25=0, Thixotropy = 856.9904+ 324.30616* .
Figure 4 - 18. Plot of coefficient of square time vs. GCB amount
From Figure 4 - 18, it is found that the highest coefficient of was obtained by cement
paste with 25% GCB followed by paste with 35% GCB. Lower coefficients were gained
by pure cement paste and paste with 15% GCB. This indicated that paste specimens with
25% and 35% tended to have higher structural rebuilding rate.
y = -16944x3 + 8674x2 - 780.46x + 261.37R² = 1
0
50
100
150
200
250
300
350
400
0% 5% 10% 15% 20% 25% 30% 35% 40%
Co
eff
icie
nt
of
tim
e
GCB amount, %

78
Table 4 - 6. Parameters Estimates for paste with GCB replacement
Term Estimate Std Error t Ratio Prob>|t|
Intercept 531.70972 166.5888 3.19 0.0022*
GCB_15% 192.00578 235.5921 0.81 0.4181
GCB_25% 125.06957 235.5921 0.53 0.5973
GCB_35% 325.28075 235.5921 1.38 0.1722
SQRT(Time) 261.37124 27.20384 9.61 <.0001*
SQRT(Time)*GCB_15% 20.904963 38.47204 0.54 0.5888
SQRT(Time)*GCB_25% 82.257489 38.47204 2.14 0.0363*
SQRT(Time)*GCB_35% 62.934911 38.47204 1.64 0.1068
Table 4-6 gives the parameter estimates for paste with different amount of GCB
replacement, from which, the only p-value of paste with 25% GCB (p-
values=0.0363<0.05) indicates that the increasing of thixotropy within unit of square time
is statistically significant compared with OPC.
4.3.5 Different Types of Cement

79
Table 4 - 7. Thixotropy of each repetition for paste mixtures made with different
types of cement
Time 0min 15min 30min 45min 60min 75min
Ashgrove Type
I
rep1 658.49 1430.89 2257.29 2124.46 3000.62 3127.68
rep2 883.64 1909.28 2169.72 2723.94 2580.00 3106.03
rep3 20.67 1077.27 2040.26 1843.59 1856.06 2816.85
Average 520.93 1472.48 2155.75 2230.66 2478.89 3016.85
Type IV rep1 805.17 2339.43 3057.19 4059.37 3330.08 4219.87
rep2 1116.76 2887.47 3712.59 3163.27 4226.05 3638.58
rep3 1283.28 3309.40 3867.47 3292.84 4032.43 4025.94
Average 1068.40 2845.43 3545.75 3505.16 3862.85 3961.46
Lafarge Type
I/II
rep1 847.33 2556.47 3065.99 4039.79 4159.40 4223.77
rep2 681.10 2337.19 3092.68 3732.35 4319.45 4673.27
rep3 702.37 2587.13 3245.12 3451.39 3941.37 4544.99
Average 743.60 2493.59 3134.59 3741.17 4140.07 4480.68
High Alkali rep1 2007.40 4188.01 5060.56 5897.32 5664.06 6015.86
rep2 2457.10 4293.61 4504.06 5605.70 5954.27 6895.09
rep3 3128.31 3858.54 5352.05 5869.14 6472.37 6784.16
Average 2530.94 4113.39 4972.22 5790.72 6030.23 6565.03
Table 4-7 lists the thixotropy values for paste mixture made with different types of
cement and Figure 4-16 shows the bivariate (Type of cement and Time) fit of Thixotropy
by time. The code of cement types can be described as:
Cement Type = 0 : Ashgrove Type I cement
Cement Type = 1 : Lafarge Type I/II cement;
Cement Type = 2 : Type IV cement;
Cement Type = 3 : High Alkali cement.

80
Figure 4 - 19. Bivariate Fit of Thixotropy by Time for different types of cement
Considering the two variables (Cement type and time), the regression model is given as:
Thixotropy = 531.70972 + 240.35029 C1 + 788.21598 C2 + 1920.3882 C3 + 261.37124
+ 172.98942*C1* + 73.439532*C2* + 209.60124*C3*
R2
= 0.958128
Equation 4-4
Where:
When Ashgrove Type I cement is used, C1, C2, C3 =0:
Thixotropy = 531.70972 + 261.37124* ;

81
When Lafarge Type I/II cement is used, C1=1, C2, C3=0:
Thixotropy = 772.06 + 434.36067* ;
When Type IV cement is used, C2=1, C1, C3=0:
Thixotropy = 1319.9257 + 334.81078* ;
When High Alkali cement is used, C3=1, C1, C2=0:
Thixotropy = 2452.0979 + 470.97248* .
Figure 4 - 20. The plot of coefficient of square time vs. cement types
From Figure 4 - 20, cement paste made with High Alkali cement had highest coefficient
of (470.97248) followed by Lafarge Type I/II cement (434.36067). However, lower
coefficient of was obtained by Type IV (334.81078) and Ashgrove Type I cement
(261.37124). This indicates that structural rebuilding rate is highest for High Alkali
cement and lowest for Ashgrove Type I cement.
0
50
100
150
200
250
300
350
400
450
500
Ashgrove I Lafarge I/II Type IV High AK

82
Table 4 - 8. Parameters Estimates for pastes made with different types of cement
Term Estimate Std Error t Ratio Prob>|t|
Intercept 531.70972 173.2911 3.07 0.0032*
Lafarge Type I 240.35029 245.0707 0.98 0.3304
Type IV 788.21598 245.0707 3.22 0.0020*
High Alkali 1920.3882 245.0707 7.84 <.0001*
SQRT(Time) 261.37124 28.29832 9.24 <.0001*
SQRT(Time)*Lafarge Type I 172.98942 40.01987 4.32 <.0001*
SQRT(Time)*Type IV 73.439532 40.01987 1.84 0.0711
SQRT(Time)*High Alkali 209.60124 40.01987 5.24 <.0001*
Figure 4-8 gives parameters estimates for pastes made with different cement types. From
the highlighted part, we can see that both Lafarge Type I/II and High Alkali cement have
p-values smaller than 0.05, this indicates that, compared with Ashgrove Type I cement,
their increasing of structural rebuilding rate is statistically significant. Never the less,
although the structural rebuilding rate is higher for Type IV cement, its difference with
Ashgrove Type I cement is not statistically significant since its p-value is 0.0711 and
larger than 0.05.
4.4 Discussion
Actigel is nano clay characterized as a highly purified Magnesiun Alumino Silicate which
can be applied for improving the performance of concrete. Unlike most industrial and
commercially available Magnesium Alumino Silicates which are made by a dry method
(as shown in Figure 4 - 21. a), it is made from a wet process (as shown in Figure 4 - 21.
b). The dry process will lead to impurities that cannot be removed because the bristles are
not exfoliated (as shown in Figure 4 - 22. a). By contrast, wet processing significantly
removes most of grit (SiO2, CaCO3) and impurities (Smectite) mechanically. However,
the pure, uniform size and shaped particles are kept. Besides, it is made without grinding.

83
Actually, the Magnesium Alumino Silicate Bristles of Actigel are chemically exfoliated
(as shown in Figure 4 - 22. b).
(a)
(b)
Figure 4 - 21. (a) Traditional dry process, (b) Wet process ( Actigel process) of
Actigel

84
(a)
(b)
Figure 4 - 22. (a) Bristles of commercially available Magnesium Alumino Silicates,
(b) Bristles of Actigel
Figure 4 - 23 shows the particle morphology of Actigel. It has an average particle size of
1.5 to 2 microns in length and an average diameter of 30 Angstroms. The bristles of
Actigel are positively charged on the ends and negatively charged along the axis, which
is the significant factor affecting gel formation to connect the microstructure of cement
based materials.

85
Figure 4 - 23. Particle Morphology of Actigel
The cement paste with clay addition of Actigel has been proved to be thixotropic and the
thixotropic value increases with the amount of Actigel addition, which can be explained
by Figure 4 - 24. When the cement paste is at rest ( No shear applied ), the positively
charged particle ends tend to be attached on the particle axis with negative charge, which
will result in a formation of a card-house network microstructure. However, when the
shear is applied to the paste, the particles will be rearranged into the preferred direction
and the new orientation of Actigel particles will offset the structural connection between
particles. Therefore, the addition of Actigel has the ability to improve the structural
connection of cement paste and more energy is required to break down the
microstructural network. It also explains the increasing yield stress and viscosity of paste
specimens.

86
Figure 4 - 24. The mechanism of increasing thixotropy for paste with Actigel
addition
The increasing structural rebuilding rate of cement paste with small amount of Actigel
addition (0.5% and 1%) is possibly due to the ultra high fineness of the Actigel particles.
Thus the Actigel particles are characterized as micro/nano-fillers and connectivity of the
networking structure will be improved. The smaller particles of Actigel will fill the
interstices of larger cement particles. Thus, the number of physical contacting points will
increase significantly. As mentioned in the literature review, the strength of the force of
particle attraction from London dispersion force is significantly affected by the particle
size. Actigel is composed of ultra fine particles and its specific surface is very high. The
smaller particle sizes result in more effective London dispersion forces between particles
and the particles are easier to flocculate together. Besides, the higher surface area makes
the particles easily contact with each other and the particles are prone to aggregate. Water
has a function to lubricate the microstructure and disperse the particles, which makes the
particles of cement paste easily slide past each other. However, the Actigel has high
water absorption of 200% by weight and it is surface absorption. Without the lubricating

87
water, the suspension tends to have a higher yield stress and also a stronger
microstructural network connection. Thus, it is expected that higher floc strength and
higher rate of structural rebuilding of cement paste can be obtained. In addition, due to
the addition of Actigel, the solid volume content will increase and the distance between
flocs will reduce. Therefore, it is also possible that the increasing solid volume content is
responsible to the increasing structural rebuilding rate.
As described previously, the charged Actigel particles will attract with each other and a
strong interlocking connection will form when the mixture is placed without shear.
However, the structural rebuilding rate will decrease if the addition amount is more than
1%. This is possibly due to too much Actigel particles existing in the interstices of
cement particles and there is not enough room for Actigel particles to be rearranged to
form an interlocking microstructure. Thus, the structural rebuilding rate of cement paste
with large amount of Actigel is inhibited.
High Reactivity Metakaolin (HRM) is a manufactured pozzolanic mineral admixture,
which significantly enhances performance and many characteristics of cement-based
materials. It is derived from purified kaolin clay and it is an amorphous alumino-silicate
with white color. It is shown that the replacement of HRM has the ability to improve the
cohesiveness of cement based material even at very low dosage [84]. HRM can
aggressively react with calcium hydroxide to form compounds with cementitious value.
The application of HRM will contribute to increased strength, reduced permeability,
greater durability, effective control of efflorescence and the better control of degradation.

88
The sustained increasing rate of structural rebuilding as the increasing amount of
substitution of HRM was seen in the previous description of test results. It indicated that
the replacement of HRM had a very significant role to play to affect the structural
rebuilding rate of cement paste. Firstly, it is possible that the finer particle size will
contribute to stronger attractive forces between particles, which can possibly result in
faster formation of flocs and aggregation of particles. Secondly, the high reactivity
metakaolin clay has a spiny needle-like microstructure (as shown in Figure 4 - 25) with a
very high surface area. It is expected that the water demand will increase significantly
because the high specific surface area and irregular particle shape tends to interweave and
bridge solid particles by which flocculation efficiency will significantly increase. In
another word, the bond strength of particles will significantly increase. This is consistent
with research which shows that the modification of some natural clay can be used to net
and bridge solid particles and increase the flocculation efficiency of solid particles in a
freshwater system [86]. Thirdly, it is noted that the cement substitution is a mass basis
process. Due to the different specific gravity of cement and HRM, more solid particles
volume will be obtained, which may also contribute to the increasing structural
rebuilding rate because of the decreasing distance between particles. In addition, the high
reactivity of HRM combined with more chemically contacting points (due to smaller
particle size), the replacement will aggressively and quickly react with the cement
hydration products and generate more stable and stronger paste interlocking network,
which might be another explanation of sustained increasing rate of structural rebuilding
for pastes with different amount of HRM replacement.

89
Figure 4 - 25. SEM (Scanning electron microcopy) micrograph of metakaolin [85]
Ground clay brick (GCB), is defined as a calcined natural pozzolanic material and is
generated from finely grinding of waste brick. The clay brick manufacturing process can
be defined as a pozzolanic procedure. Thus, the ground clay brick can be used as a
supplementary cementitious material to improve the durability of concrete. It has a
relatively regular particle shape, which can be seen in Figure 4 - 26. It was shown that
the replacement tended to slightly increase the rate of structural rebuilding and no
obvious differences were found among structural rebuilding rates of paste with 25% and
35% ground clay brick replacement. However, compared with Actigel addition and
HRM replacement, the ability of increasing rebuilding rate is much less effective.
Considering that the fineness of ground clay brick is approximately identical to the
fineness of cement, its much higher particle size compared to that of Actigel and HRM
and its regular microstructural shape, the slightly increasing structural rebuilding rate

90
possibly results from the higher solid volume content contributed by lower specific
gravity of GCB. This will reduce the distance between particles and result in stronger
attractive forces between particles. Besides, the higher absorption of water of GCB
reduces the water available for lubricating the microstructure and dispersing the matrix of
cement paste, therefore the particles are prone to floc together, which might also
contribute to the slightly increasing structural rebuilding rate.
Figure 4 - 26. SEM (Scanning electron microcopy) micrograph of ground clay brick
[87]
Considering the investigation of the effects of different types of cement on the structural
rebuilding rate of cement paste, test results from Figures 4-10, 4-11 and 4-12 indicated
that cement paste with high alkali amount was expected to have higher rate of structural
rebuilding. The high alkali cement (alkali content is 1.38%) used for this thesis obtained a
higher rate of structural rebuilding than others. Due to the fact that alkali content for Type
IV cement and Ashgrove Type I cement is similar, the rebuilding rates for these cements

91
are approximately equal. The testing result was consistent with the research from Lyon
and Talor [88,89]. They revealed that the structural build up of cement paste during early
ages depends on the amount of C3A (this will be discussed in Chapter 5) and alkali. The
higher the amount, the faster rate of structural rebuilding can be expected. The
explanation they provided was that the alkali formed from sodium and potassium will
dissolve in the pore solution very quickly. When the cement reacts with water, the
dissolution of alkali will quickly combine with the released Ca+2
and OH- ions, which will
result in stronger attractive forces and more cohesive paste. It is proved that ionic
strength of aqueous phase of cement paste will increase significantly with the addition of
alkali, especially with the addition of sodium addition. This is due to the fact that the
potassium and sulphate ions will be consumed by syngenite formation [90]. The ionic
strength of pore fluid is a determinative factor to the double-layer thickness of ions
around cement particles. Normally, with the higher ionic strength, the thickness of
double-layer decreases very quickly, by which the particles will be prone to contact
closely. Therefore, the cement particles are easy and fast to floc and aggregate together to
form a 3-dimensional network structure.
In addition, the ESEM investigation of microstructure of cement paste with high content
of potassium proved that the increasing amount of potassium sulphate leaded to an
increasing amount of long prismatic crystals formation [90].The prismatic crystals were
found right after the contacting of cement particles with mixing water and the detection
lasted up to 2 hours. Actually, the microanalysis (EDX) and its morphology indicated
that these crystals were syngentie. Figure 4 - 27 [7] shows the ESEM-FEG image during
92
2 hours hydration of cement paste with high/low alkali content. These prismatic crystals
serve as an agent to rapidly build an interlocking microstructure and lead to higher rate of
structural rebuilding. Figure 4 - 27 (A and B) describes cement with high amount of
Alkali sulphate, from (A) we can see that large amount of prismatic crystals randomly
orientate in order to interlock the paste matrix without applying shear energy while (B)
indicates that the prismatic crystals obtain preferred orientation with shearing. Figure 4 -
27 (C) describes the microstructure of paste with small amount of Alkali sulphate and we
can see that much less prismatic crystals (Syngenite) are formed.

93
Figure 4 - 27.“A, B: Syngenite formation imaged by ESEM-FEG 2 h of hydration of
cement A with 4.49 wt.% potassium sulphate. A) Cement hydrated without
agitation; random orientation of syngenite, B) cement paste after shearing in the
viscometer; preferred orientation of syngenite crystals. C: Cement paste A with
1.56% K2SO4 content: minor amount of syngenite.” [90]
94
4.5 Correlation between Flow Table Test and Structural Rebuilding
Rate
The flow table test was performed to try to verify the rate of structural rebuilding
obtained from rheology test. The plot of flow percent change versus time for pastes with
Actigel addition, high reactivity metakaolin clay, ground clay brick replacement and
pastes made with different type of cement are shown in Figure 4 - 28, Figure 4 - 31,
Figure 4 - 34 and Figure 4 - 37 respectively. Each curve for different clay or cement
types are fitted in to a liner regression equation, the coefficients of time are plotted versus
clay amount or cement types, which are shown in Figure 4 - 29, Figure 4 - 32, Figure 4 -
35 and Figure 4 - 38. The correlation plot of flow percent and thixotropy can be used for
see whether there is correlation between them, which are shown in Figure 4 - 30, Figure 4
- 33, Figure 4 - 36 and Figure 4 - 39.

95
Figure 4 - 28. Flow percent change with time for pastes with different amount of
Actigel addition
Figure 4 - 29. The coefficient of time vs. Actigel amount
y = -0.3704x + 172.01R² = 0.9862
y = -0.4545x + 169.45R² = 0.9717
y = -0.5799x + 166.63R² = 0.9926
y = -0.4774x + 158.67R² = 0.9922
y = -0.403x + 146.82R² = 0.9871
110
120
130
140
150
160
170
180
0 20 40 60 80
Flo
w p
erc
en
t, %
Time, min
PC+0% Actigel
PC+0.5% Actigel
PC+1% Actigel
PC+2% Actigel
PC+3% Actigel
y = 33973x3 - 2214.2x2 + 37.261x + 0.3582R² = 0.8786
0.20
0.30
0.40
0.50
0.60
0.70
0.0% 0.5% 1.0% 1.5% 2.0% 2.5% 3.0% 3.5%
Co
eff
icie
nt
of
tim
e
Actigel amount, %
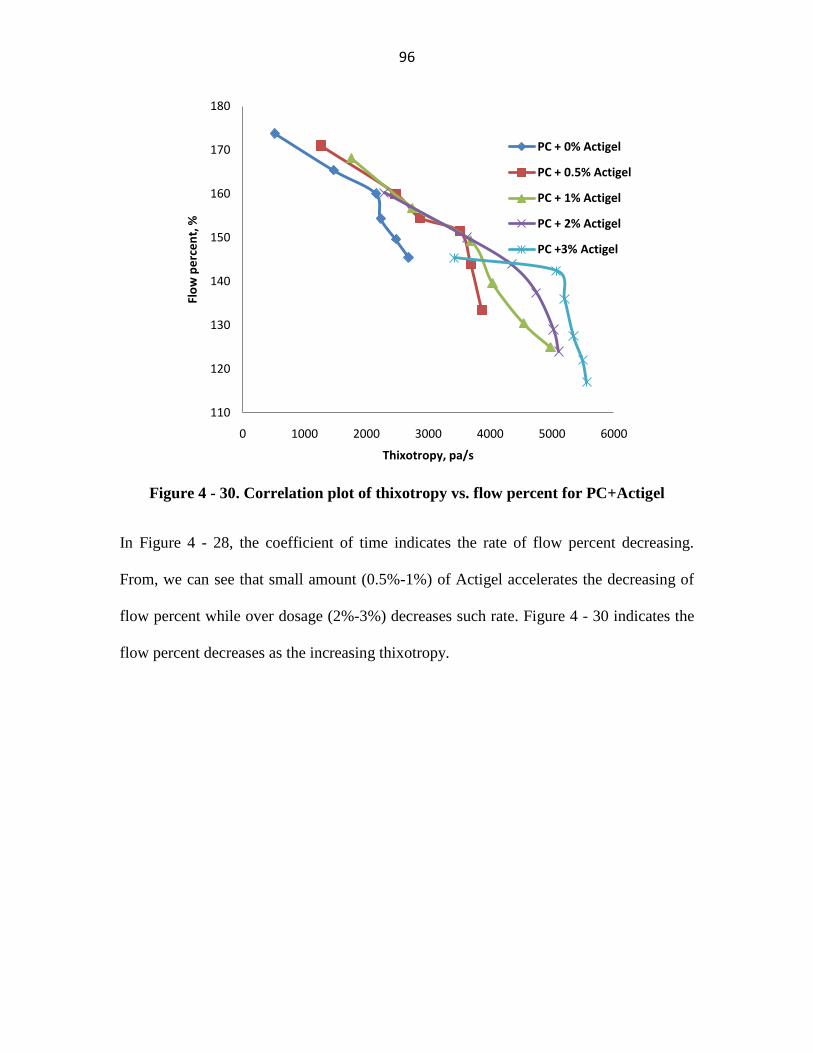
96
Figure 4 - 30. Correlation plot of thixotropy vs. flow percent for PC+Actigel
In Figure 4 - 28, the coefficient of time indicates the rate of flow percent decreasing.
From, we can see that small amount (0.5%-1%) of Actigel accelerates the decreasing of
flow percent while over dosage (2%-3%) decreases such rate. Figure 4 - 30 indicates the
flow percent decreases as the increasing thixotropy.
110
120
130
140
150
160
170
180
0 1000 2000 3000 4000 5000 6000
Flo
w p
erc
en
t, %
Thixotropy, pa/s
PC + 0% Actigel
PC + 0.5% Actigel
PC + 1% Actigel
PC + 2% Actigel
PC +3% Actigel

97
Figure 4 - 31. Flow percent change with time for pastes with HRM replacement
Figure 4 - 32. The coefficient of time vs. HRM amount
y = -0.3999x + 168.42R² = 0.9852
y = -0.5234x + 161.9R² = 0.9665
y = -0.6893x + 153.87R² = 0.9672
y = -0.8592x + 142.3R² = 0.9671
80
90
100
110
120
130
140
150
160
170
180
0 20 40 60 80
Flo
w P
erc
en
t, %
Time, min
PC+0% HRM
PC+5%HRM
PC+10%HRM
PC+15%HRM
y = 3.0876x + 0.3864R² = 0.9949
0
0.1
0.2
0.3
0.4
0.5
0.6
0.7
0.8
0.9
1
0% 5% 10% 15% 20%
Co
eff
icie
nt
of
tim
e
HRM amount, %
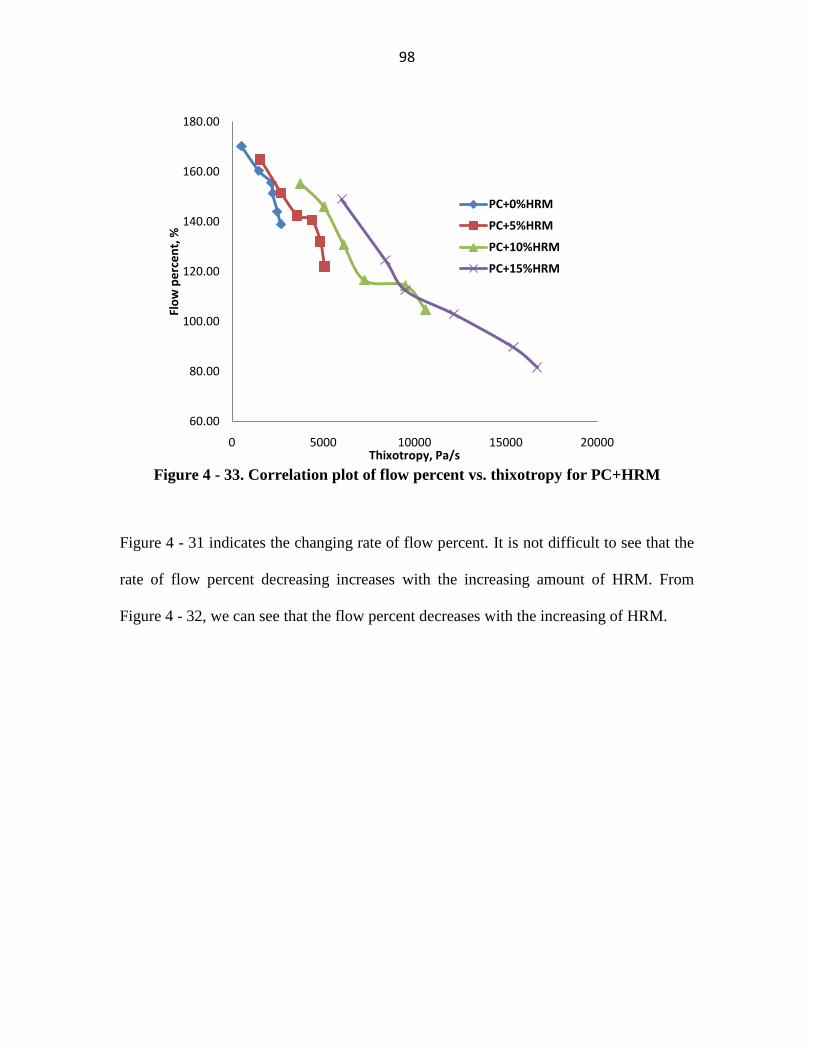
98
Figure 4 - 33. Correlation plot of flow percent vs. thixotropy for PC+HRM
Figure 4 - 31 indicates the changing rate of flow percent. It is not difficult to see that the
rate of flow percent decreasing increases with the increasing amount of HRM. From
Figure 4 - 32, we can see that the flow percent decreases with the increasing of HRM.
60.00
80.00
100.00
120.00
140.00
160.00
180.00
0 5000 10000 15000 20000
Flo
w p
erc
en
t, %
Thixotropy, Pa/s
PC+0%HRM
PC+5%HRM
PC+10%HRM
PC+15%HRM

99
Figure 4 - 34. Flow percent change with time for pastes with GCB replacement
Figure 4 - 35. The coefficient of time vs. GCB amount
y = -0.3647x + 171.63R² = 0.9806
y = -0.5044x + 172.29R² = 0.9867
y = -0.5751x + 168.14R² = 0.9807y = -0.5659x + 162.19
R² = 0.9539
110
120
130
140
150
160
170
180
0 20 40 60 80
Flo
w p
erc
en
t, %
Time, min
PC+0%GCB
PC+15%GCB
PC+25%GCB
PC+35%GCB
y = -8.279x3 + 2.4143x2 + 0.7555x + 0.3647R² = 1
0.2
0.25
0.3
0.35
0.4
0.45
0.5
0.55
0.6
0.65
0% 10% 20% 30% 40%
Co
eff
icie
nt
of
tim
e
GCB amount, %

100
Figure 4 - 36. Correlation plot of flow percent vs. thixotropy for PC+GCB
From Figure 4 - 35, we can see that, from 0% to 25% percent GCB replacement, the
decreasing rate of flow percent increases. However, when the amount of GCB is more
than 25%, such rate starts to slightly slow down. Figure 4 - 36 indicates that the flow
percent will decrease as the increasing thixotropy.
100
110
120
130
140
150
160
170
180
0 1000 2000 3000 4000
Flo
w p
erc
en
t, %
Thixotropy, Pa/s
PC+0%GCB
PC+15%GCB
PC+25%GCB
PC+35% GCB

101
Figure 4 - 37. Flow table test results for pastes made with different types of cement
Figure 4 - 38. The coefficient of time vs. cement types
y = -0.3226x + 169.92R² = 0.9107
y = -0.5618x + 158.89R² = 0.9197
y = -0.6448x + 160.92R² = 0.9068
y = -0.7233x + 151.77R² = 0.9768
90
100
110
120
130
140
150
160
170
180
0 10 20 30 40 50 60 70 80
Flo
w p
erc
en
t, %
Time, min
Ashgrove Type I
Lafarge Type I/II
Type IV
High Alkali
0
0.1
0.2
0.3
0.4
0.5
0.6
0.7
0.8
Ashgrove type I Lafarge Type I/II Type IV High Akali
Co
eff
icie
nt
of
tim
e

102
Figure 4 - 39. Correlation of flow percent vs. thixotropy for different cement types
It is believed that the flow table test results have a close relationship with rheological
parameters of yield stress and viscosity at a very low amount of aggregate [91]. However,
the experimental method used for this thesis measured the flow percent of paste over a
75mins time scale and a curve fitted for flow percent of pastes at different time point. The
rate of decreasing of flow percent might be an indication of structural rebuilding rate.
From the flow table test results, it seems that a relatively strong correlation between
structural rebuilding rate and the flow percent decreasing with time exists for different
mixtures.
For clay addition of Actigel, the flow percent decreasing rate increased from 0% to 1%,
then with more addition, the decreasing of flow percent started to slow down. Concerning
80
90
100
110
120
130
140
150
160
170
180
0 1000 2000 3000 4000 5000 6000 7000
Flo
w p
erc
en
t, %
Thixotropy, Pa/s
Ashgrove Type I
Lafarge Type I/II
Type IV
High Alkali

103
the replacement of HRM, the rate of flow percent decreasing increased as the increasing
amount of HRM replacement. In addition, the substitution of GCB slightly accelerated
the reduction of flow percent but no significant differences were found for paste
specimens with different amount of GCB replacement. For different types of cement, the
faster rate of decreasing flow percent was obtained by high alkali cement while the
lowest rate of decreasing flow percent was obtained by Ashgrove type I cement. The flow
percent decreasing rate of Type IV and Lafarge Type I/II cement were similar, which was
not totally agree with the rheology test since rheology tests showed that Lafarge Type I/II
cement and High Alkali cement gained higher structural rebuilding rate while lower and
similar structural rebuilding rate was found by Type IV and Ashgrove Type I cement.
Although some small discrepancies between flow table test and rheology test were
shown, it seems that a strong relationship between them still exists.
4.6 Comparison among Different Clays
From previous discussions, based on thixotropic changing rate analysis, the optimum
amount of clay addition or replacement is 1% Actigel, 10% HRM or 25% GCB. Figure 4
- 40 plot the thixotropy change for each of them.

104
Figure 4 - 40. Comparison amoung different clay addition/ replacement
Figure 4 - 41. The plot of coefficient of time versus clay types
y = 47.141x + 1910.7R² = 0.9941
y = 92.946x + 3553R² = 0.9873
y = 31.673x + 1286.4R² = 0.9323
0
2000
4000
6000
8000
10000
12000
0 15 30 45 60 75 90
Thix
otr
op
y, P
a/s
Time, min
PC + 1% Actigel
PC + 10% HRM
PC + 25% GCB
0
10
20
30
40
50
60
70
80
90
100
25% GCB 1% Actigel 10% HRMType of clay
Thix
otr
op
y,
105
The plot of coefficient of time versus types of clays is shown in Figure 4 - 41. It indicates
that, 10% HRM can be used for obtaining the highest structural rebuilding rate, which is
followed by 1% Actigel and 25% GCB.
4.7 Chapter Summary
The main aim of this chapter was to investigate the effects clay addition/replacement and
different cement types have on the structural rebuilding rate of cement based materials. A
systematic experimental program was applied to determine the influence of Actigel
addition, High Reactivity Metakaolin and Ground Clay Brick replacement and different
cement types. Based on the descriptions of test results in this chapter, the conclusions can
be made as follows:
The addition of Actigel, replacement of HRM and GCB were shown to advance
the thixotropic behavior of cement paste, also the yield stress and viscosity.
However, comparing with GCB, Actigel and HRM were more effective in this
function.
Structural rebuilding rate of cement paste was strongly influenced by clay
addition/replacement and cement composition.
Due to the ultra fine particle size, charged particle morphology and high water
absorption, the addition of Actigel had the ability to efficiently build up an
interlocking and networking microstructure, increased the opportunities for solid
particles to floc together and thus increased the structural rebuilding rate. Cement
paste with small amount of addition of Actigel (1%) gained the highest structural
rebuilding rate. However, over-dosage of Actigel might lead to a reducing

106
structural rebuilding rate. It is possible that not enough room for them to
rearrange the particles orientation to form a card-house like microstructure.
The replacement of High Reactivity Metakaolin (HRM) strongly increased the
rate of structural rebuilding of cement paste and the rate increased with the
amount of HRM replacement. The finer particle size and spiny needle-like
microstructure with high specific surface area of HRM might contribute to the
increasing rebuilding rate. Besides, because the paste was mixed depending on a
mass-based theory, solid volume significantly increased, which lead to closer
distance between particles. More chemical contacting points and stronger
attractive forces tended to rapidly increase the interparticle-bond and structure
degree.
The Ground Clay Brick replacement (GCB) slightly increased the structural
rebuilding rate of cement paste, which is possibly contributed by the small
specific gravity and high water absorbing ability. However, the differences of
structural rebuilding rate among pastes with different amount of replacement were
not obvious.
Fixing the w/c ratio, the cement composition obviously affected the structural
rebuilding rate. The cement pastes with high alkali content had faster rate of
structural rebuilding, which is possibly contributed by the pore solution chemistry
which tended to increase the bond strength of particles. Besides, its higher alkali
sulphate content leaded to increasing amount of prismatic crystals formation.
These crystals effectively bridged and netted the microstructure of cement paste
and acceleration of structural rebuilding was expected. Type IV and Ashgrove

107
Type I cement gained lower and similar structural rebuilding rate, which possibly
resulted from their lower alkali content.
Flow table test was used to correlate the flow percent reduction with structural
rebuilding of cement paste. Based on flow percent change with time, it was
proved that a strong relationship existed between them. The higher rate of
decreasing flow percent indicated a faster structural rebuilding rate.
The 10% HRM can be used for concrete mixing in order to obtain the highest
structural rebuilding rate.

108
Chapter 5 Evaluation of Effect of Heat Generation Rate on
Structural Rebuilding Rate
5.1 Introduction
Due to the fact that cement will hydrate with water after mixing and generate hydration
products to build up the structure of cement paste, this chapter aims to investigate if the
rate of heat generation from cement hydration will influence the structural rebuilding rate
of cement based materials. The rate of heat generation for pastes with different clay
addition/replacement and pastes made with different types of cement during the first 1.5
hours after mixing was analyzed.

109
5.2 Effect of Heat generation Rate on Structural Rebuilding Rate
Figure 5 - 1. Rate of heat generation for pates with Actigel addition
Figure 5-1 shows the rate of heat generation for paste samples with different amount of
Actigel addition during 1.5 hours after mixing. From this figure, we can see that the paste
with 1% Actigel had the highest rate of heat generation followed by cement paste with
0.5% Actigel. The rate of heat generation for paste with 0%, 2% and 3% were lower and
no pronounced differences were found. This result indicates that, during the first 1.5
hour, the rate of heat generation increased with small amounts of Actigel addition while
large amounts of Actigel addition tended to slow down the heat generation rate.
Compared with the rheology measurement, the rate of heat generation and structural
rebuilding rate are verywell correlated. As shown in table 3-2, the potassium content of
0
1
2
3
4
5
6
7
8
9
10
0 0.2 0.4 0.6 0.8 1 1.2 1.4 1.6
Rat
e o
f H
eat
Ge
ne
rati
on
, cal
/g•h
Time, hour
OPC
0.5% Actigel
1% Actigel
2% Actigel
3% Acigel

110
Actigel is very high. Based on the discussion in section 4.4, higher potassium content will
increase the amount of formation of syngenite with long prismatic crystals which
increases the structural interlock efficiently during the first 2 hours of hydration. It is
possible that the increasing rate of heat generation resulted from the increasing amount of
syngenite formation. However, Actigel has water absorption of 200% and very high
specific surface area. Over-addition of Actigel might lead to high contacting with water
and reduce the water available used for C3A hydration. Thus, the heat generation rate
reduced and slowed down the structural build up.
Figure 5 - 2. Rate of heat generation for pates with replacement of High Reactivity
Metakaolin
0
1
2
3
4
5
6
7
8
0 0.2 0.4 0.6 0.8 1 1.2 1.4 1.6
Rat
e o
f H
eat
Ge
ne
rati
on
,cal
/g•h
Time, hour
OPC
PC+5% HRM
PC+10% HRM
PC+15% HRM

111
Figure 5-2 shows the rate of heat generation for pastes with different amount of HRM
replacement. From this figure, we can see that the rate of heat generation increased with
the increasing amount of HRM replacement. Since the results from rheology test
indicated that the rate of structural rebuilding also increased with the increasing amount
of HRM replacement, this supports an association between the rate of heat generation and
the structural rebuilding rate of paste with HRM replacement. The increasing rate of heat
generation is possible due to the reactivity of Metakaolin will increase with amount of
HRM. The reaction between AS2 and CH from cement hydration will form additional
cementitious aluminium containing CSH gel and crystalline products. Thus, the higher
the reactivity of Metakaolin will lead to a higher rate of heat generation and thus a higher
and faster structure degree.

112
Figure 5 - 3. Rate of heat generation for pates with replacement of Ground Clay
Brick
Figure 5-3 indicates the rate of heat generation for pastes with different amounts of GCB
replacement. It can be seen that higher rates of heat generation were obtained by pastes
with 25% and 35% GCB replacement during the first 1.5 hours, while pure cement paste
had lowest rate of heat generation. Comparing with rheology measurement, cement paste
with 25% and 35% GCB also gained higher structural rebuilding rate while pure cement
paste obtained the lowest rate. Similarly, this indicates the existence of a good correlation
between the structural rebuilding rate and the rate of heat generation. The increasing rate
of heat generation is possibly due to the pozzolanic reactivity of GCB.
0
1
2
3
4
5
6
7
8
0 0.2 0.4 0.6 0.8 1 1.2 1.4 1.6
Rat
e o
f H
eat
Ge
ne
rati
on
,cal
/g•h
Time, hour
OPC
PC+15% GCB
PC+25% GCB
PC+35% GCB

113
Figure 5 - 4. Rate of heat generation for pates made with different types of cement
Figure 5-4 indicates the rate of heat generation for pastes made with different types of
cement during the first 1.5 hours. It is easy to see that the highest rate of heat generation
was obtained by High Alkali cement which was followed by Lafarge Type I/II cement.
At the same time, the rates of heat generation of Type IV and Ashgrove Type I cement
were lowest and no big differences between them were found. Again, considering
rheology measurement, there is a good correlation between the rate of heat generation
and structural rebuilding. The initial structural degree depends a lot on the C3A content.
0
2
4
6
8
10
12
0 0.2 0.4 0.6 0.8 1 1.2 1.4 1.6
Rat
e o
f H
eat
Ge
ne
rati
on
,cal
/g•h
Time, hour
Ashgrove Type I
Lafarge Type I/II
Type IV
High Alkali

114
As shown in table 3-1, the C3A content of High Alkali cement is 11% which is much
higher than the others and its alkali content is also higher. It is expected that these two
factors might contribute the higher heat generation rate and thus a higher structural
rebuilding rate. The C3A content for Ashgrove Type I (6%) is higher than Type IV (1%)
and the alkali content for them are similar. However, neither a higher heat generation
rate nor higher structural rebuilding rate was found for Ashgrove Type I cement.
Actually, concerning microstructure of C3A, there are two types of C3A: cubic and
orthorhombic. It is known that the increasing amount of orthorhombic C3A tends to result
in a lower reactivity of C3A. Therefore, it is possible that the reactivities of C3A for these
two different types of cement are not the same. It is likely that the C3A existing in
Ashgrove Type I cement is dominated by orthorhombic C3A with low reactivity, which
leads to a lower rate of heat generation and slower structural rebuilding rate.

115
Figure 5 - 5. The peak rate of heat generation vs. clay and cement types
Figure 5-5 plots the peak rate of heat generation versus different clay amount and cement
types, by which we can see the higher the peak of heat generating rate, higher the
thixotropy changing rate we can obtained.
0
1
2
3
4
5
6
7
8
9
10
PC+0% Actigel
PC+0.5% Actigel
PC+1% Actigel
PC+2% Actigel
PC+3% Actigel
0
1
2
3
4
5
6
7
8
PC+0% HRM
PC+5% HRM
PC+10% HRM
PC+15% HRM
0
1
2
3
4
5
6
7
8
PC+0% GCB PC+15% GCB
PC+25% GCB
PC+35% GCB
0
2
4
6
8
10
12
Ashgrove I
Lafarge I/II
Tpye IV High AK

116
5.3 Chapter summary
The isothermal calorimeter was used to investigate if the rate of heat generation from
cement hydration during the first 1.5 hours has correlation with structural rebuilding rate.
Based on the test results shown in this chapter, the following conclusions can be made:
A strong correlation between the rate of heat generation and structural rebuilding
was found for pastes with different clay addition/replacement and pastes made
with different types of cement. A higher rate of heat generation related with a
faster structural rebuilding rate.
Small amount of Actigel addition (up to 1%) increased the rate of heat generation
and structural degree, thus a higher structural rebuilding rate can be obtained. It is
possibly due to the high content of Alkali in Actigel. However, over-dosage of
Actigel addition decreased the rate of heat generation. It seems that the high water
absorption of Actigel prohibited the reaction between cement and water.
The rate of heat generation increased as the amount of High Reactivity
Metakaolin replacement, which is contributed by its high pozzolanic reactivity.
For the Ground Clay Brick, the 35% and 25% amount of replacement had higher
heat generation rate and lowest rate of heat generation was obtained by pastes
without GCB replacement. However, significant differences among pastes with
different amount of GCB were no found.
The C3A predominately determines the rate of heat generation of pure cement
paste during the first 1.5 hours hydration. For study about different types of
cement, high alkali cement with relatively higher alkali and C3A content gained

117
the fastest heat generation rate, which was followed by Lafarge Type I/II cement.
The rate for Type IV and Ashgrove Type I cement were similar and both of them
were lower than the others, it is possible that the amount of orthorhombic C3A
with low reactivity in Ashgrove Type I cement is higher.

118
Chapter 6 Compressive Strength Test
6.1 Introduction
This chapter investigated the influence of Clay addition/replacement and different types
of cement on the mechanical performance of cement paste. For the study of clay addition
or replacement, because the High Reactivity Metakaolin and Ground Clay Birck are
characterized as pozzolanic materials, 3, 7, 28 and 56 day strength were studied.
However, for investigation of influence of different cement types, just 3, 7 and 28 day
strengths were considered.
6.2 Test Results
(a)
0
2000
4000
6000
8000
10000
12000
OPC PC+0.5% Actigel PC+1%Actigel PC+2%Actigel PC+3%Actigel
Co
mp
ress
ive
Str
en
gth
, psi
Specimen Type
3-day
7-day
28-day
56-day

119
(b)
(c)
0
2000
4000
6000
8000
10000
12000
OPC PC+5%HRM PC+10%HRM PC+15%HRM
Co
mp
ress
ive
Str
en
gth
, psi
Specimen type
3-day
7-day
28-day
56-day
0
2000
4000
6000
8000
10000
12000
OPC PC+15% GCB PC+25% GCB PC+35% GCB
Co
mp
ress
ive
Ste
rmgt
j
Specimen type
3-day
7-day
28-day
56-day

120
(d)
Figure 6 - 1. (a) Compressive strength for pastes with Actigel addition; (b)
Compressive strength for pastes with HRM replacement; (c) Compressive strength
for pastes with GCB replacement; (d) Compressive strength for pastes made with
different types of cement
Figure 6-1 shows the compressive strength test results for paste samples with addition of
Actigel, High Reactivity Metakaolin, and Ground Clay Brick replacement and cement
paste made with different types of cement. From the test results, we can see that the
Actigel addition had ability to increase the compressive strength of paste specimen. This
might be due to that the smaller particle size of Actigel can create a more dense paste.
Compared with Actigel, the replacement of HRM with high pozzolanic reactivity and
finer particle size obviously increased compressive strength of paste specimens.
However, concerning the replacement of Ground Clay Brick, although the early strength
0
2000
4000
6000
8000
10000
12000
Ashgrove Type I Lafarge Type I/II Type IV High Alkali
Co
mp
ress
ive
Str
en
gth
, psi
Specimen type
3-day
7-day
28-day

121
of specimens were much lower than pure cement pastes, the rate of compressive strength
gain increased with curing age. Besides, it is expected that the later strength (91-day or
180-day compressive strength) of paste samples with GCB replacement might be
comparable and even equal to the compressive strength of pure cement paste samples.
For the pastes made with different types of cement, compressive strength of Ashgrove
Type I cement and Lafarge Type I/II were similar with each other. Type IV cement
gained much lower compressive strength at early age, however, the rate of strength gain
at later age is high. This might be due to that lower C3A content result in a slow strength
development at early stage. High Alkali cement gained more compressive strength than
others at early stage, but the rate of strength gain is low. Thus, the 28-day compressive
strength is closer to Ashgrove Type I and Lafarge Type I/II cement.

122
Chapter 7 Conclusions and Recommendations
7.1 Conclusions
The main goal of the thesis is to investigate how clay addition/replacement and different
types of cement affect the structural rebuilding of cement based materials. The major
conclusions based on test results were made as follows:
(1) Clay addition/replacement and different cement composition had a significant effect
on the thixotropic changing rate of cement based materials.
(2) Small amounts (0.5% -1%) of Actigel increased the thixotropic changing rate of
cement paste, which is possibly due to the ultra fine particle size, charged particle
morphology and high water absorption of Actigel. The particles tended to build up an
interlocking and networking microstructure, increased the opportunities for solid particles
to floc together and thus accelerated the thixotropic changing rate. However, over-
dosage (larger than 1%) of Actigel tended to slow down thixotropic chaning rate. It is
possible that not enough room for them to rearrange the particles orientation to form a
card-house like microstructure.
(3) The replacement of High Reactivity Metakaolin significantly increased thixotropic
changing rate of cement paste. The higher amount of replacement, the faster rate of
thixotripic increasing rate can be obtained. The finer particle size and spiny needles-like
microstructure with high specific surface area of HRM might contribute to the increasing
rebuilding rate. Because paste was mixed depending on a mass-based theory, solid

123
volume significantly increased, which leads to closer distances between particles. More
chemical contacting points and stronger attractive forces tended to rapidly increase the
interparticle-bond and structure degree.
(4) Substitution of Ground Clay Brick slightly increased the thixotropic changing rate of
cement paste, which is possibly contributed by the small specific gravity and high water
absorbing ability.
(5) Compared to 25% GCB replacement, 1% Actigel addition or 10% HRM replacement
of HRM can be used for field trial (slipform construction) due to that they have higher
increasing rate of thixotropy, which is beneficial to obtain better shaper holding ability
after mixing.
(6) Cement with high Alkali and C3A tended to gain higher thixotropic changing rate.
Thus, highest rate of increasing thixotropy was obtained by High Alkali cement, which
was followed by Lafarge Type I/II cement. The lowest rate was obtained by Type IV and
Ashgrove Type I cement. The pore solution chemistry of cement with high alkali content
tended to increase the bond strength of particles. Additionally, its higher alkali sulphate
content leaded to increasing amount of prismatic crystals formation. These crystals
effectively bridged and netted the microstructure of cement paste and acceleration of
structural rebuilding was expected.
(7) Strong relationship exists between flow percent decreasing rate and thixotropic
changing rate. It seems that faster flow percent decreasing rate indicated higher

124
thixotropic increasing rate. Besides, the increasing of thixotroy comes with decreasing
flow percent.
(8) A good correlation between rate of heat generation and thixotropic changing rate was
found. A higher heat generation rate can be related with faster structural rebuilding rate.
(9) Actigel and High Reactivity Metakaolin improved the compressive strength of cement
paste while Ground Clay Brick decreased the early strength. However, as the increase of
curing age, the strength gaining rate increased significantly. Ashgrove Type I cement and
Lafarge Type I/II cement obtained similar mechanical performance. High Alkali cement
gained higher early strength than others while Type IV cement gains much lower early
strength. However, the strength gaining rate at later stage of Type IV was much higher.
7.2 Recommendations
The results from this thesis provided some information for the cement and concrete
industry. The influence of clay addition/replacement and types of cement on structural
rebuilding rate was analyzed. At the same time, rate of heat generation and flow percent
decreasing of paste were also correlated with rheology tests. The following
recommendations are proposed for the future development:
(1) Concrete industry not only focuses on cement paste because it has a complicated
composition including aggregates and some other chemical admixtures. Therefore, more
study should be developed for mortar and concrete in terms of structural rebuilding rate.
This will provide more information in terms of predicting rheological behavior of fresh

125
concrete. A general model to describe structural rebuilding of concrete should be also
considered as future research.
(2) Clay addition/replacement is always combined with different chemical admixtures in
the field construction, such as Viscosity Modifying Agent and superplastisizers.
Therefore, the interaction between clay and chemical admixtures deserves more
emphasis.
(3) In order to verify influence of different clay addition/replacement on structural
rebuilding rate, just Ashgrove Type I cement was used for mixing in this thesis.
However, different types of cements (High Alkali cement or type IV) will be applied
based on different construction purposes. Therefore, the interaction between clay
addition/replacement and cement types should be paid more attention in future research.

126
References
[1] G. H. Tattersall and P. F. G. Banfill, The Rheology of Fresh Concrete, First ed.
Marshfield: Pitman Publishing Inc, 1983.
[2] Jones, T.E. R.; and Taylor, S., (1977), ― Mathematical model relating the flow curve
of a cement paste to its water/cement ratio‖, Magazine of Concrete Research, Vol. 29,
No. 101, pp. 207-212.
[3] Banfill, P. F. G. (1994). ―Rheological methods for assessing the flow properties of
mortar and related materials‖, Construction and Building Materials, Vol. 8, No. 1, pp.
43-50
[4] A.M. Alshami, A.R. Sabouni and A.H. Bushlaibi, Influence of set retarding
superplasticizer and microsilica on setting time of pastes at various temperatures,
Cem Concr Res 23 (3) (1993), pp. 562–598.
[5] J.Y. Petit, E. Wirquin and B. Duthoit, Influence of temperature on the yield value of
highly flowable micromortars made with sulfonate-based superplasticizer, Cem
Concr Res 35 (2) (2005), pp. 256–266.
[6] Jolicoeur C, Sharman J, Otis N, Lebel A, Simard MA, Page M. The influence of
temperature on the rheological properties of superplasticized cement pastes. In:
Malhotra VM, editor. Proceedings 5th CANMET/ACI international conference on
superplasticizers and other chemical admixtures in concrete. Rome: American
Concrete Institute; 1997. p. 379–415.
[7] J. Golaszewki and J. Szwabowski, Influence of superplasticizer on rheological
behavior of fresh cement mortars, Cem Concr Res 34 (2) (2003), pp. 235–248.
[8] Petit JY. Coupled effect of temperature, superplasticizers and mineral additions on
rheological variations of cement-based micromortars and self consolidating concretes.
Ph.D. Thesis, Béthune, University of Sherbrooke and Université d’Artois; 2005.
[9] Jean-Yves Petit, Eric Wirquin and Kamal H. Khayat, Effect of temperature on the
rheology of flowable mortars, Cement and Concrete composites, Vol 32, Issue1,
January 2010, Pages 45-53
[10] Chia, K. S.; and Zhang, M. H., (2004). ― Effect of chemical admixtures on
rheological parameters and stability of fresh lightweight aggregate concrete‖,
Magazine of Concrete Research, Vol. 56, No. 8, pp. 465-473.
[11] Struble, L. J.; and Jiang, Q., (2004). ―Effects of air entrainment on rheology‖, ACI
Materials Journal, Vol. 101, No. 6, pp. 448-456

127
[12] Cry, M.; Legrand, C.; and Mouret, M., (2000). ―Study of the shear thickening effect
of superplasticizers on the rheological behavior of cement pastes containing or not
mineral additives‖, Cement and Concrete Research, Vol. 30, no. 9, pp.1477-1483
[13] Pettet, S.; Palardy, D.; and Ballivy, G., (2000). ― Rheological behavior and setting
time of microfine cement-based grouts‖, ACI Materials Journal, Vol. 97, No.4, pp.
472-478.
[14] Lachemi, M.; Hossain, K. M. A.; Lambros, V. ; Nkinamubanzi, P. C.; and
Bouzoubaa, N., (2004a). ―Self-consolidating concrete incorporating new viscosity
modifying admixtures‖, Cement and Concrete Research, Vol. 34, No.6, pp.917-926
[15] Assaad, J.; Khayat, K. H.; and Mesbah, H., (2003), ―Assesment of thixotropy of
flowable and self consolidating concrete‖, ACI Materials Journal, Vol. 100, No. 2,
pp. 99-107
[16] Khayat, K. H.; and Yahia, A., (1997). ―Effect of Eelan gem-high-range water
reducer combinations on rheology of cement grout:, ACI Materials journal , Vol.
94, No. 5, pp. 365-372
[17] Lachemi, M.; Hossain, K. M. A.; V.; Nkinamubanzi, P. C.; and Bouzounaa, N.,
(2004b). ―Performance of new viscosity modifying admixtures in enhancing the
rheological properties of cement paste‖, Cement and Concrete Research, Vol. 34.
No. 2, pp. 185-193
[18] Kamal, H. K., (1998). ― Viscosity-enhancing admixtures for cement- based
materials- An Overview‖, Cement and Concrete composites, Vol. 20, No. 2-3,
pp.171-188
[19] Ferraris, C. F.; Obla, K. H.; and Hill R., (2001). ― The influence of mineral
admixtures on the rheology of cement paste and concrete‖, Cement and Concrete
Research, Vol. 31, No. 2, pp. 245-255.
[20] Rudzinski, L., (1984). ― Effect of fly ash on the rheological behavior of cement
paste‖, Materiaux et Constructions, Materials and Structures, Vol. 17, No. 101, pp.
369-373
[21] Li, Y.; Zhou, S.; Yin, J.; and Gao, Y., (2004b). ―The effect of fly ash on the fluidity
of cement paste, Motar, and concrete‖, In: K. Wang, Ed. International Workshop on
Sustainable Development and Concrete Technology, Beijing, China, May 20-21,
2004, CTRE
[22] Nehdi, M.; Mindess, S.; ad Aichin, P. C., (1998). ― Rheology of high performance
concrete: Effect of ultralfine particles‖, Cement and Concrete Research, Vol. 28, No.
5, pp, pp. 687-697

128
[23] R. Ferron, A. Gregori, Z. Sun and S.P. Shah, Rheological method to evaluate
structural buildup in self consolidating concrete cement pastes, ACI Materials
Journal 104 (3) (2007), pp. 242–250.
[24] P. Jarvis, B. Jefferson, J. Gregory and S.A. Parsons, A review of floc strength and
breakage, Water Research 39 (14) (2005), pp. 3121–3137
[25] D.M. Liu, Theoretical determination of floc size in highly-concentrated zirconia-wax
suspensions, Acta Materialia 50 (8) (2002), pp. 1927–1935.
[26] D.M. Liu, Particle packing and rheological property of highly-concentrated ceramic
suspensions: m determination and viscosity prediction, Journal of Materials Science
35 (21) (2000), pp. 5503–5507.
[27] S.B. Johnson, G.V. Franks, P.J. Scales, D.V. Boger and T.W. Healy, Surface
chemistry–rheology relationships in concentrated mineral suspensions, International
Journal of Mineral Processing 58 (1–4) (2000), pp. 267–304.
[28] G.H. Tattersall and P.F.G. Banfill, The Rheology of Fresh Concrete, Pitman
Advanced Publishing Program, Boston (1983).
[29] R. Shaughnessy and P.E. Clark, The rheological behavior of fresh cement pastes,
Cement and Concrete Research 18 (1988), pp. 327–341.
[30] K. Kuder and S.P. Shah,Rheology of extruded cement-based materials, ACI
Materials Journal 104 (3) (2007), pp. 283–290.
[31] T. Voigt, T. Malonn and S.P. Shah, Green and early age compressive strength of
extruded cement mortar monitored with compression tests and ultrasonic techniques,
Cement and Concrete Research 36 (5) (2006), pp. 858–867.
[32] Nathan A. Tregger, Margaret E. Pakula and Surendra P. Shah, Influence of clays on
the rheology of cement pastes, Cement and Concrete Research, Volume 40, Issue 3,
March 2010, Pages 384-391
[33] G.H. Tattersall and P.F.G. Banfill. The Rheology of Fresh Concrete Pitman
Advanced Publishing, Boston (1983).
[34] K. Sujata and H.M. Jennings, Formation of a protective layer during the hydration of
cement. J Am Ceram Soc 75 6 (1992), pp. 1669–1673.
[35] M. Yang and H.M. Jennings, Influence of mixing methods on the microstructure and
rheological behavior of cement paste. Advn Cem Bas Mat 2 (1995), pp. 70–78.

129
[36] J. Orban, P. Parcevaux, D. Guillot, Influence of shear history on the rheological
properties of oil well cement slurries, in: Proc 8th Intl Cong Chem Cem, Rio de
Janeiro. VI.3, 1986, pp. 243–247
[37] ] K. Asaga and D.M. Roy, Rheological properties of cement mixes V: The effects of
time on viscometric properties of mixes containing superplasticizers; conclusions.
Cem Con Res 10 (1980), pp. 287–295.
[38] R.A. Helmuth, Structure and rheology of fresh cement paste, in: Proc 7th Intl Cong
Chem Cem, Paris, VI.0, 16, 1980, pp. 16–30.
[39] F.J. Tang and S. Bhattacharja. Development of an early stiffening test, Report RP46
Portland Cem Assoc, Skokie, IL (1997).
[40] Yang, M.; and Jennnings, H. M., (1995). ― Influence of mixing methods on the
microstructure and rheological behavior of cement paste‖, Advanced Cement Based
Materials, Vol. 2 No. 2, pp. 70-78.
[41] Hu, C.; and de Larrard, F., (1996). ― the rheology of fresh high performance
concrete‖, Cement and Concrete Research, vol. 26, No. 2, pp. 283-294
[42] De Larrard, F.; Hu. C.; Sedran, T.; T.; Szitkar, J.; Joly, C. M.; Claux, F.; and Derkx,
F., (1997). ― A new rheometer for soft-to-fluid fresh concrete‖, ACI Materials
Jounrnal, Vol. 94, No. 3, pp. 234-243
[43] Krstulovic, P.; and Juradin, S., (1999). ―Modeling of fresh concrete behavior
behavior under vibration‖, International Journal for Engineering Modeling, Vol. 12,
No. 1, pp. 43-51
[44] Banfill, P. F. G.; Xu, Y.; and Domone, P. L. J., (1999). ― Relationship between the
rheology of unvibrated fresh concrete and its flow under vibration in a vertical pipe
apparatus‖, Magazine of Concrete Research, Vol. 51, No. 3, pp. 181-190
[45] J. Mewis, J Non-Newton Fluid Mech 6 (1979), p. 1.
[46] H.A. Barnes, J Non-Newton Fluid Mech 70 (1997), p. 1
[47] E. Schalek and A. Szegvari, Kolloid-Z 32 (1923), p. 318 1923;33:326.
[48] A Saak, ―Characterization and Modeling of Rheology of Cement Paste: With
Applications toward Seld-Flowing Materials,‖ Ph. D. Dissertation, Northwestern
University, Evanston 2000
[49] J. Wallevik, ―Rheology of Particle Suspensions,‖ Ph. D. Dissertation, The
Norwegian University of Science and Technology, Trondheim, Norway 2003.

130
[50] L. D. A. Schwartzentruber, R. Le Roy, and J. Cordin, ―Rheological Behavior of
Fresh Cement Pastes Formulated from a Self Compacting Concrete (SCC),‖ Cement
and Concrete Research, Vol. 36, pp. 1203-1213, 2006
[51] C. H. Pierce, ―Thixotropy of Oil Well Cement Slurries,‖ Ph.D. Dissertation,
Stanford university, Stanford 1940
[52] K. Khayat, M. Saric-Coric, and F. Liotta, ―Influence of Thixotropy on Stability
Characteristics of Cement Grout and Concrete,‖ ACI Materials Journal, Vol.99,
pp.234-241, 2002
[53] P.F.G. Banfill and D.C. Saunders, On the viscosimetric examination of cement
pastes, Cem. Concr. Res. 11 (1981), pp. 363–370
[54] G. H. Tattersall, ―Rheology of Portland Cement Paste,‖British Journal of Applied
Physics L2, vol. 6, pp. 165-167, 1955
[55] N. B. Ur’ev, R. L. Baru, A. P. Izhik, S. V. Choi, and V. V. Saskovets, ―Rheology
and Thixotropy of Cement-Water Siuspesions in the Presence of Superplasticizers,‖
Colloid Journal of the Russian Academy of Sciences, vol. 59, pp. 773-779, 1997
[56] T.H. Phan, M. Chaouche, and M. Moranville, ―Influence of organic admixtures on
the rheological behaviour of cement pastes‖ Cement and Concrete Research, Vol
36, Issue 10, October 2006, Pages 1807-1813
[57] V. Petkova, and V. Samichkov, ―Some influences on the thixotropy of composite
slag Portland cement suspensions with secondary industrial waste‖ Construction
and Building Materials, Vol. 21, Issue 7, July 2007, Pages 1520-1527
[58] Th. M. Salem, ―Electrical conductivity and rheological properties of ordinary
Portland cement–silica fume and calcium hydroxide–silica fume pastes‖ Cement
and Concrete Research, Vol 32, Issue 9, September 2002, Pages1473-1481
[59] I. Janotka, F. Puertas, M. Palacios, M. Kuliffayová and C. Varga, ―Metakaolin sand–
blended-cement pastes: Rheology, hydration process and mechanical properties‖
Construction and Building Materials, Volume 24, Issue 5, May 2010, Pages 791-802
[60] J. Assaad, ―Formwork Pressure of Self Consolidating Concrete-Influence of
Thixotropy,‖ Ph.D. Dissertation, University de Sherbrooke (Quebec), Canada 2004.
[61] W.B. Russell, D.A. Saville and W.R. Schowalter. Colloidal Dispersions Cambridge
University, Cambridge (1989).
[62] R.J. Hunter. Foundations of Colloid Science, Volume 1 Oxford University, New
York (1987).

131
[63] L. J. Struble, The Rheology of Fresh Cement Paste, in Advances in Cemenitious
Materials, v. 16 ed., S. Mindess, Ed., 1991, pp. 7-29.
[64] C. Plassard, E. Lesniewaska, I Pochard, and A. Nonat, ―Nanoscale Experimental
Investigattion of Particle Interaction at the Origin of the Cohesion of Cement,‖
Langmuir, vol. 21, pp. 7263-7270, 2005.
[65] W.B. Russell, D.A. Saville and W.R. Schowalter. Colloidal Dispersions Cambridge
University, Cambridge (1989).
[66] R.J. Hunter. Foundations of Colloid Science, Volume 1 Oxford University, New
York (1987).
[67] J. T. G. Overbeek, ―Recent Development in the Understanding of Colloid Stability,‖
Journal of Colloid and Interface Science, Vol. 58 , pp. 408 -422, 1977
[68] M. Yang, C. M. Neubauer, and H. M. Jennings, ―Interparticle Potential and
Sedimentation Behavior of Cement Suspension: Review and Results from Paste,‖
Advance Cement Based Materials, vol. 5, pp. 1-7, 1997
[69] Zeta –Meter Incorporation, ―Zeta Potential: A Complete Course in 5 Minutes.‖ Vol.
2005, Z.-M. Inc., Ed, 1998
[70] I. D. Morrison and S. Ross, Colloidal Dispersions: Suspensions, Emulsions, and
Foams. New York: Wiley-Interscience, 2002.
[71] T.C. Powers, ―The Properties of Fresh Concrete‖, Wiley, New York (1968).
[72] P.M. McGuiggan and J.N. Israelachvili, Short-range and adhesion forces between
surfaces in aqueous electrolyte solutions: interplay of DLVO and hydration forces.
In: A. Nonat and J.C. Mutin, Editors, Hydration and Setting of Cements,
Proceedings of the International RILEM Workshop on Hydration and Setting, Dijon
1991, E&FN SPON, London (1992), pp. 205–217.
[73] H. Haidara, Fundamental mechanisms of adhesion: relevance to particle interactions,
sticking and aggregation in a fluid medium. In: A. Nonat, Editor, Hydration and
Setting — Why Does Cement Set? An Interdisciplinary Approach, Proceedings of
the Second International RILEM Workshop, Dijon, 1997, RILEM Publications
S.A.R.L., Cachan Cedex (2000), pp. 3–22.
[74] R.J. Flatt, Dispersion forces in cement suspensions, Cem. Concr. Res. 34 (3)
(2004), pp. 399–408.
[75] A. Kauppi, P.F.G. Banfill, P. Bowen, L. Galmiche, Y.F. Houst, F. Lafuma, U.
Mäder, F. Perche, B.G. Petersen, K. Reknes, I. Schober, A. Siebold and D. Swift,

132
Improved superplasticizers for high performance concrete, Proc. of the 11th ICCC,
Durban, Techbook International, New Delhi, India (2003), pp. 528–537.
[76] H. Uchikawa, K. Ogawa and S. Uchida, Influence of character of clinker on the early
hydration process and rheological property of cement paste, Cem. Concr. Res. 15
(4) (1985), pp. 561–572.
[77] P.F.G. Banfill, Simultaneous measurements of hydration rate and rheology on
cement pastes. In: A. Nonat and J.C. Mutin, Editors, Hydration and Setting of
Cements, Proceedings of the International RILEM Workshop on Hydration and
Setting, Dijon 1991, E&FN SPON, London (1992), pp. 267–278.
[78] C. Rößler, A. Eberhardt, H. Kučerová and B. Möser , Influence of hydration on the
fluidity of normal Portland cement pastes , Cement and Concrete Research, Volume
38, Issue 7, July 2008, Pages 897-906
[79] H.F.W. Taylor. Cement Chemistry Academic, London (1990).
[80] P.J. Andersen. Cem. Concr. Res. 16 (1986), pp. 931–940.
[81] H. Uchikawa, S. Hanehara and D. Sawaki. Cem. Concr. Res. 27 (1997), pp. 37–50.
[82] Christopher M. Neubauer, Ming Yang and Hamlin M. Jennings, Interparticle
Potential and Sedimentation Behavior of Cement Suspensions: Effects of
Admixtures, Advanced Cement Based Materials, Volume 8, Issue 1, July, Pages 17-
27
[84] K. G. Kuder, N. Ozyurt, E.B. Mu, and S.P. Shah. ― Rheology of Fiber-Reinforced
Cementitious Materials,‖ Cement and Concrete Research, Vol. 37, pp. 191-199 2007
[85] K.L. Konan, C. Peyratout, A. Smith, J.-P. Bonnet, S. Rossignol and S. Oyetola,
―Comparison of surface properties between kaolin and metakaolin in concentrated
lime solutions‖ , Jounral of Colloid and Interface Science, Vol. 339, Issue 1,
November 2009, Pages 103-109
[86] G.Pan, M.-M. Zhang, H. Chen, H. Zou, and H. Yan, ―Removal of Cyanobacterial
Blooms in Taihu Lake Using Local Soils. I. Equilibrium and Kinetic Screening on
the Flocculation of Microcystis Aeruginosa Using Commercially Available Clays
and Minerals,‖ Environmental Pollution, vol. 141, pp. 195-200,2006
[87] Fatih Bektas, ―Use of ground clay brick as a supplementary cementitious material in
concrete-hydration characteristics, mechanical properties, and ASR durability‖,
Dissertation, Iowa State University, 2007.

133
[88] M.K. Lyon, D. W. Mead, R. E. Elliott, and L. G. Leal, ―Structure Formation in
Moderately Concentrated Viscoelastic Suspensions in Simple Shear Flow ,‖ Journal
of Rheology, vol. 45. pp. 881-890,2001
[89] H. F. W. Taylor, Cement Chemistry, San Diego: Academic Press Inc., 1990
[90] C. Rößler, A. Eberhardt, H. Kučerová and B. Möser, ―Influence of hydration on the
fluidity of normal Portland cement pastes‖, Cement and Concrete Research, vol. 38,
issure 7, pp. 897-906, 2008
[91] Jiong Hu, ―A study of effects of aggregate on concrete rheology‖, Ph. D dissertation,
Iowa State University, 2005
[92] ASTM C230 / C230M – 98, (2003). ―Standard Specification for Flow Table for Use
in Tests of Hydraulic Cement,‖ Annual Book of ASTM Standards, Vol. 04. 01
[93] ASTM C1437-01, (2003), ―Standard Test Method for Flow of Hydraulic Cement
mortar,‖ Annual Book of ASTM Standards, Vol. 04. 02
[94] ASTM C150 (2002). ―Standard Specification for Portland Cement.‖ Annual Book of
ASTM Standards, Vol. 04. 01
[95] Katherine G. Kuder, Nilufer Ozyurt , Edward B. Mu, Surendra P. Shah, ―Rheology
of fiber-reinforced cementitious materials‖, Cement and Concrete Research, vol. 37 ,
pp.191–199, 2007