three-dimensional electromagnetic and electrical ... · dures that will be discussed further are...
TRANSCRIPT

Three-dimensional electromagnetic and electrical inversions over the Antonio gold deposit in PeruMichael S.G. McMillan∗, Douglas W. Oldenburg, UBC-Geophysical Inversion Facility, University of British Columbia
SUMMARY
Electromagnetic (EM) and electrical geophysical datasetswere acquired over the Antonio high sulfidation epither-mal gold deposit in Northern Peru, and each dataset pro-duced a three-dimensional resistivity inversion model whichhelped map geologic alteration. Time-domain airborne-EMand pole-dipole Induced-Polarization (IP) data were indepen-dently inverted, and compared to a Controlled-Source Audio-Frequency Magnetotellurics (CSAMT) 3D inversion. Abso-lute resistivity values were consistent across all three sur-veys and collectively they effectively outlined silicic alter-ation mapped from previous geologic work and drilling. Forairborne-EM modeling, all 270 transmitter sources over thedeposit region were included in the final inversion. This abil-ity to model airborne-EM data in 3D with multiple transmittersources demonstrates that large advancements have been madein recent years with inversion codes, data acquisition and pro-cessing. Using multiple datasets to accurately delineate silicicalteration is valuable for exploration purposes, as this highlyresistive zone hosts much of the gold mineralization in thearea.
INTRODUCTION
Electrical resistivity measures the degree to which a materialopposes the flow of electric current, and can help distinguishrock types and alteration zones due to resistivity contrasts withbackground lithologies. Various geophysical methods attemptto recover the resistivity structure of the earth, and three proce-dures that will be discussed further are EM, DC/IP and CSAMT.This paper will focus on how time-domain EM, DC/IP andCSAMT 3D inversion models help establish a uniform ex-planation of the resistivity structure over the Antonio deposit,and how each model relates to surrounding geologic alteration.This work builds upon previous research by Oldenburg et al.(2004) which focused on 3D inversion results of CSAMT andDC/IP data in the area.
ANTONIO GEOLOGY BACKGROUND
The Antonio gold deposit is located within the larger Yana-cocha high sulfidation epithermal system in mountainous North-ern Peru. Newmont Mining Corporation owns the majority ofthis active mining and exploration project. Like many highsulfidation epithermal deposits, Antonio experienced perva-sive hydrothermal alteration which texturally and chemicallychanged the nature of most preexisting rocks. The bulk of goldmineralization resides within alteration envelopes, and partic-ularly within areas of silicic alteration such as massive silica,vuggy silica and granular silica. These quartz-rich areas ofmetasomatism are often found near faults where confined fluid
flow occurred. Furthermore, the intersection of faults is espe-cially prospective for gold mineralization where hydrothermalbreccias broke through overlaying volcanic units (Pinto andQuispe, 2003). These structural traps within favorable pyro-clastic lithologies, such as ignimbrite, beneath or proximal toflow dome complexes are typical geologic hosts to gold de-posits in the region (Loayza and Reyes, 2010). Figure 1 showsa geology map of Antonio with common lithologies and struc-tures marked. The primary extent of the deposit is circled inbold black.
Figure 1: Antonio geology overview with deposit circled. Fig-ure modified from (Oldenburg et al., 2004).
GEOPHYSICAL SURVEYS
Electromagnetic and electrical surveys were completed at An-tonio with the intention of mapping silicic alteration. Hostrocks which have undergone such alteration exhibit an ele-vated resistivity signature compared to surrounding units mak-ing them detectable through geophysical investigation. Sincethis alteration pattern is of prime exploration significance, defin-ing its spatial extent in 3D both near-surface and at depth isclearly of interest for resource modeling and drill targeting.Firstly, a conventional time-domain pole-dipole DC/IP surveywas conducted with five East-West oriented lines of variablelengths, spaced 150-200 meters apart using 50 meter spacedtransmitter and receiver electrodes. DC/IP uses grounded elec-trodes to inject electric current into the subsurface while re-ceiver electrodes throughout the survey grid measure electricpotential differences. This survey was complimented with asyn-chronous scalar CSAMT data acquired by Quantec Geoscienceincluding 11 East-West and 8 North-South lines. Station spac-ings were held constant at 50 meters and lines were separatedby 150 meters. CSAMT uses a frequency-domain approachwith grounded electrode sources situated well outside the sur-vey region and receivers placed inside the area of interest whichmeasure orthogonal pairs of electric and magnetic fields. Dataat 13 frequencies were recorded ranging from 2Hz - 8192Hz.
© 2012 SEG DOI http://dx.doi.org/10.1190/segam2012-1316.1SEG Las Vegas 2012 Annual Meeting Page 1
Dow
nloa
ded
01/0
9/13
to 1
37.8
2.10
7.11
0. R
edis
trib
utio
n su
bjec
t to
SEG
lice
nse
or c
opyr
ight
; see
Ter
ms
of U
se a
t http
://lib
rary
.seg
.org
/
Modeling EM data at Antonio
In addition, airborne EM data were acquired with NEWTEM,a helicopter airborne time-domain EM system developed andinternally operated by Newmont, (Eaton et al., 2002). Thissystem achieved a peak current of 275 amps with a loop dipolemoment of 80,000 Am2. The secondary response was mea-sured with time channels ranging from 10 microseconds to 6milliseconds. NEWTEM was chosen as opposed to a groundEM survey because of its ability to rapidly collect data cover-ing a large area of ground. Flights lines were flown in an East-West manner with data points separated by approximately 20meters and adjacent lines spaced 200 meters apart. Antoniois one of many gold deposits in the Yanacocha region, and assuch the NEWTEM data analyzed for this paper do not repre-sent the entire airborne EM dataset, but a pertinent subsectionof the survey area flown.
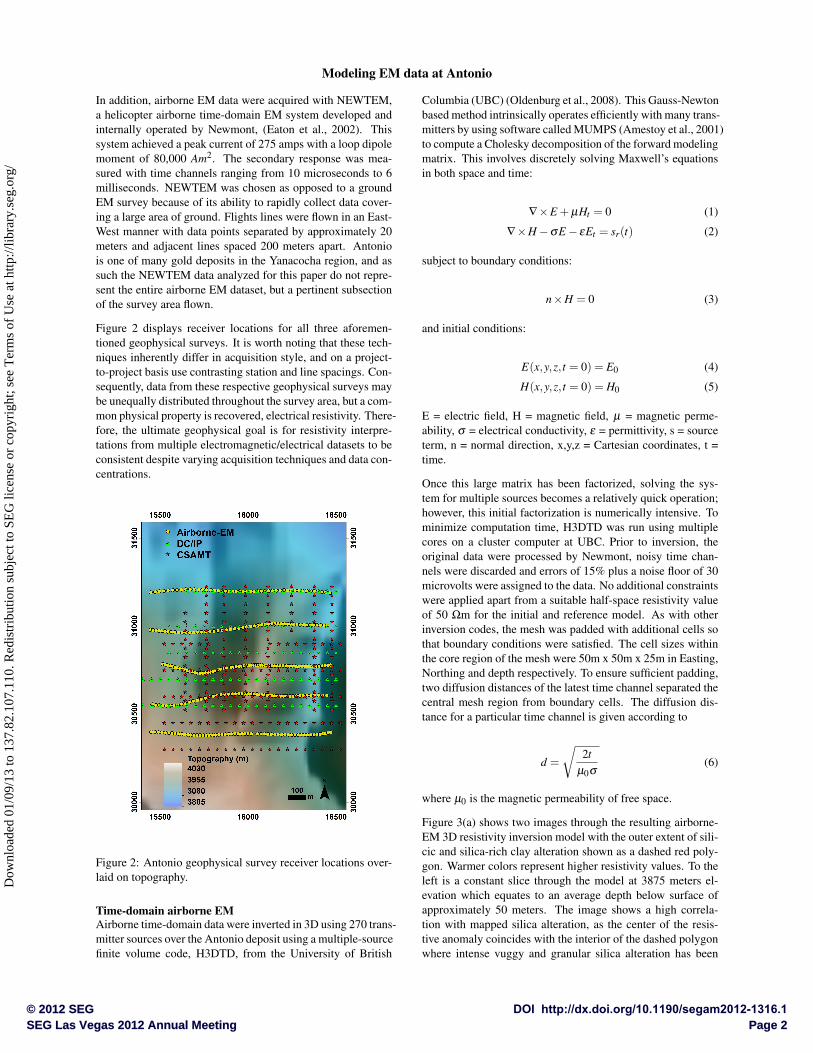
Figure 2 displays receiver locations for all three aforemen-tioned geophysical surveys. It is worth noting that these tech-niques inherently differ in acquisition style, and on a project-to-project basis use contrasting station and line spacings. Con-sequently, data from these respective geophysical surveys maybe unequally distributed throughout the survey area, but a com-mon physical property is recovered, electrical resistivity. There-fore, the ultimate geophysical goal is for resistivity interpre-tations from multiple electromagnetic/electrical datasets to beconsistent despite varying acquisition techniques and data con-centrations.
Figure 2: Antonio geophysical survey receiver locations over-laid on topography.
Time-domain airborne EMAirborne time-domain data were inverted in 3D using 270 trans-mitter sources over the Antonio deposit using a multiple-sourcefinite volume code, H3DTD, from the University of British
Columbia (UBC) (Oldenburg et al., 2008). This Gauss-Newtonbased method intrinsically operates efficiently with many trans-mitters by using software called MUMPS (Amestoy et al., 2001)to compute a Cholesky decomposition of the forward modelingmatrix. This involves discretely solving Maxwell’s equationsin both space and time:
∇×E +µHt = 0 (1)
∇×H −σE − εEt = sr(t) (2)
subject to boundary conditions:
n×H = 0 (3)
and initial conditions:
E(x,y,z, t = 0) = E0 (4)
H(x,y,z, t = 0) = H0 (5)
E = electric field, H = magnetic field, µ = magnetic perme-ability, σ = electrical conductivity, ε = permittivity, s = sourceterm, n = normal direction, x,y,z = Cartesian coordinates, t =time.
Once this large matrix has been factorized, solving the sys-tem for multiple sources becomes a relatively quick operation;however, this initial factorization is numerically intensive. Tominimize computation time, H3DTD was run using multiplecores on a cluster computer at UBC. Prior to inversion, theoriginal data were processed by Newmont, noisy time chan-nels were discarded and errors of 15% plus a noise floor of 30microvolts were assigned to the data. No additional constraintswere applied apart from a suitable half-space resistivity valueof 50 Ωm for the initial and reference model. As with otherinversion codes, the mesh was padded with additional cells sothat boundary conditions were satisfied. The cell sizes withinthe core region of the mesh were 50m x 50m x 25m in Easting,Northing and depth respectively. To ensure sufficient padding,two diffusion distances of the latest time channel separated thecentral mesh region from boundary cells. The diffusion dis-tance for a particular time channel is given according to
d =
√2t
µ0σ(6)
where µ0 is the magnetic permeability of free space.
Figure 3(a) shows two images through the resulting airborne-EM 3D resistivity inversion model with the outer extent of sili-cic and silica-rich clay alteration shown as a dashed red poly-gon. Warmer colors represent higher resistivity values. To theleft is a constant slice through the model at 3875 meters el-evation which equates to an average depth below surface ofapproximately 50 meters. The image shows a high correla-tion with mapped silica alteration, as the center of the resis-tive anomaly coincides with the interior of the dashed polygonwhere intense vuggy and granular silica alteration has been
© 2012 SEG DOI http://dx.doi.org/10.1190/segam2012-1316.1SEG Las Vegas 2012 Annual Meeting Page 2
Dow
nloa
ded
01/0
9/13
to 1
37.8
2.10
7.11
0. R
edis
trib
utio
n su
bjec
t to
SEG
lice
nse
or c
opyr
ight
; see
Ter
ms
of U
se a
t http
://lib
rary
.seg
.org
/

Modeling EM data at Antonio
observed. A resistivity cross-section along line 30700N is dis-played to the right in Figure 3(a) overlaid by a dashed out-line of silica and silica-clay altered rock as defined by drilling.This image demonstrates that the airborne-EM 3D resistivityanomaly defines well the vertical and horizontal extent of sil-ica alteration.
Further inversion improvements are being sought by using finermesh cells along-line to take advantage of close data spac-ing. The large recovered EM resistivity anomaly has smoothedges with roughly homogeneous resistivity values in its in-terior. This is a characteristic appearance of a least-squaresinversion algorithm result. Perhaps with tighter mesh cells,this indicated region can be further refined to glean additionalspatial information from the data. Nevertheless, Figure 3(a)depicts encouraging results by demonstrating that even with arelatively coarse mesh, highly resistive alteration zones can beaccurately mapped using 3D inversion models of time-domainairborne-EM.
DC/IPDC/IP data were inverted for resistivity using DCIP3D (Li andOldenburg, 2000) with assigned errors of 10% plus a noisefloor of 1 mV. A 50 Ωm half-space discretized within a central12.5m x 50m x 12.5m mesh was used as an initial and refer-ence model. Figure 3(b) displays a constant elevation slicethrough the model at 3875m, and a cross-section along line30700N. Worth noting is that a consistent resistivity color scaleand alteration outline has been applied to all images in Figure3. Overall the model produces a similar curved NNW trendingresistivity feature as the airborne-EM survey, although only thewestern portion of the EM resistivity anomaly is coincidentlymapped with a DC/IP resistivity high. This resistive featureoverlaps with silica and clay-silica in the North-West domainof alteration, but elsewhere within the dashed outline there ispoorer agreement. At the south-eastern extremity of alteration,the resistivity anomaly terminates well prior to the end of thesilica zone. The cross-section appears similar, as the westernportion of alteration is mapped well at depth whereas the east-ern zone is mapped as mostly conductive.
EM and DC/IP resistivity anomalies do not have a perfect cor-relation especially in the eastern portion of the mapped al-teration zone, but absolute resistivity values are comparable.This is important to recognize since EM and DC/IP surveysuse inductive and galvanic sources respectively to excite theearth’s subsurface. These two separate methods converging toan equivalent resistivity is evidence of recent improvementsof geophysical inversion software and data processing. As forspatial inconsistencies, they could potentially be explained bysparse data coverage due to the presence of only five lines ofDC/IP data. Alternatively, a slight coordinate shift could haveoccurred if an incorrect transformation was applied to convertdata from one coordinate system to another. These possible ex-planations will be further investigated. Regardless of this out-come, the deposit area would be well suited for a ”3D-style”densely spaced array of distributed IP data, such as Newmont’sinternally developed system: NewDAS (Eaton et al., 2010).The ensuing model could then be compared to its conventionalIP counterpart.
(a) Airborne-EM 3D Inversion. Silica and clay-silica alteration outlined in red. Left: Constantelevation, 3875m, resistivity plan map with line 30700N shown as a bold black line; Right: line30700N resistivity cross-section.
(b) DC/IP 3D Inversion. Silica and clay-silica alteration outlined in red. Left: Constantelevation, 3875m, resistivity plan map with line 30700N shown as a bold black line; Right:line 30700N resistivity cross-section.
(c) CSAMT 3D Inversion. Silica and clay-silica alteration outlined in red. Left: Constantelevation, 3875m, resistivity plan map with line 30700N shown as a bold black line; Right:line 30700N resistivity cross-section.
Figure 3: 3D Resistivity inversion slices at 3875m elevationand cross-sections along 30700N. Constant elevation slices areoverlaid on topography. All images use a consistent resistivitycolor scale.
© 2012 SEG DOI http://dx.doi.org/10.1190/segam2012-1316.1SEG Las Vegas 2012 Annual Meeting Page 3
Dow
nloa
ded
01/0
9/13
to 1
37.8
2.10
7.11
0. R
edis
trib
utio
n su
bjec
t to
SEG
lice
nse
or c
opyr
ight
; see
Ter
ms
of U
se a
t http
://lib
rary
.seg
.org
/
Modeling EM data at Antonio
CSAMTA CSAMT inversion model outlined in Oldenburg et al. (2004)was used for comparison with EM and DC/IP results. EH3Dinv,a Gauss-Newton algorithm for frequency-domain EM data, asdescribed in Haber et al. (2004), was used to invert the data tocreate this 3D volume. The original survey parameters con-sisted of a southern transmitter for East-West receiver linesand an eastern transmitter for North-South receiver lines. Thetransmitters were located many kilometers away from the corereceiver area, which made establishing an appropriate meshchallenging. Large meshes made computation times impracti-cal, and the solution chosen to counter this issue was to takea multi-step approach. To begin, a coarse mesh of 200 me-ter cells of constant 50 Ωm resistivity were forward modeledto establish expected electromagnetic fields at the edge of thecore region. These fields were subsequently treated as bound-ary conditions for the ensuing inversion over the inner areawhich contained finer 50m x 50m x 25m cells. Amplitude andphase data from both transmitters were incorporated into the fi-nal inversion using frequencies of 4Hz and 64Hz with assignederrors of 10% plus a noise floor of 2 degrees.
Figure 3(c) displays a constant 3875m elevation slice and across-section through line 30700N within the Antonio portionof the 3D inversion model. The outline of silicic alterationmatches well with the CSAMT resistivity anomaly in both planand cross-section view. These results agree closely with thosefrom airborne-EM. Resistivity values are also consistent withboth airborne-EM and DC/IP models which suggests that thesemagnitudes are indeed appropriate for this area. An additionalobservation can be made: that the region shown by CSAMT tobe highly resistive is divided into two distinct lobes as opposedto the one large zone depicted in the EM image. Whether thisfurther refinement into two sections is geologically significanthas yet to be determined, but will be a topic of future dis-cussion. This resistivity separation can also be observed inthe DC/IP result, despite the lobes being focused more to theNorth-West. In future work, the inversion program will be uti-lized to produce additional models that incorporate electric andmagnetic fields from as many of the available 13 frequenciesas possible. Particularly of interest will be whether or not sig-nificant changes occur to the observed resistivity pattern withthese supplementary frequencies.
CONCLUSIONS
Three separate resistivity inversion models were analyzed overthe Antonio high sulfidation epithermal deposit in NorthernPeru. Time-domain airborne-EM (NEWTEM) and conven-tional pole-dipole IP data were inverted in 3D and comparedwith a 3D CSAMT inversion model. Consistent results wereobserved with regards to the spatial location and magnitude ofresistive anomalies within EM and CSAMT models, whereasminor differences existed with the spatial extent of DC/IP de-rived resistors. Collectively the models accurately highlightedareas of resistive silica alteration known to host gold mineral-ization. When analyzed in further detail, the airborne-EM re-sult was defined as a single resistive anomaly while DC/IP andCSAMT models showed the resistor as being partially sepa-
rated into two lobes. The geologic significance of this dis-connect is currently unknown, and will receive more attentionin the coming months. Overall a high correlation to silicicalteration was shown by extracting elevation slices at 3875mthrough all three inversion models and comparing them to out-lines of silica altered regions mapped from previous geologicwork. Cross-sections through each 3D volume along East-West line 30700N showed that the depth extent of silica andsilica-clay alteration was well defined by all three datasets inthe western portion of the altered zone. In the eastern sec-tion, EM and CSAMT inversions produced resistors with ahigh agreement to silica alteration while the DC/IP result dis-played a more conductive zone which has yet to be explained.Possible causes of this difference may be sparser data coverageof DC/IP data or issues stemming from coordinate transforma-tions.
Altogether, this study has shown that 3D time-domain airborne-EM inversions provide valuable information at locations, suchas Antonio, where resistivity contrasts are prominent and prospec-tive for gold mineralization. The agreement in the recoveredresistivities from the different field surveys is very encour-aging and provides optimism that current data collection andanalysis in 3D is reaching maturity. Notably, all resistivitymodels were produced using unconstrained inversions on rel-atively coarse meshes, meaning that further improvements canbe achieved. Geologic constraints, such as petrophysical mea-surements from down-hole logging or drill-core, could be in-troduced as bounds or weights in future inversions. Construct-ing finer celled meshes for EM and CSAMT inversions wouldalso be a logical progression. Other topics currently beinglooked into include incorporating more CSAMT frequencies,and attempting to remedy any inconsistencies in the DC/IP in-version results.
ACKNOWLEDGMENTS
The authors especially thank Rob Eso who, as a graduate stu-dent at UBC in 2003, carried out the first 3D inversions of theDC/IP and CSAMT data sets at Antonio, and showed the mu-tual agreement of the two inversions. A synoptic summary ofthose results was shown in Oldenburg et al. (2004), but un-fortunately the detailed paper by Eso never materialized. Wealso thank Newmont Mining Corporation for permission toshow this data, especially Perry Eaton for his support of uni-versity research and David Wynn for his adept programmingskills. Further thanks goes to Elliot Holtham and all membersof UBC-GIF for their support during this work.
© 2012 SEG DOI http://dx.doi.org/10.1190/segam2012-1316.1SEG Las Vegas 2012 Annual Meeting Page 4
Dow
nloa
ded
01/0
9/13
to 1
37.8
2.10
7.11
0. R
edis
trib
utio
n su
bjec
t to
SEG
lice
nse
or c
opyr
ight
; see
Ter
ms
of U
se a
t http
://lib
rary
.seg
.org
/
http://dx.doi.org/10.1190/segam2012-1316.1 EDITED REFERENCES Note: This reference list is a copy-edited version of the reference list submitted by the author. Reference lists for the 2012 SEG Technical Program Expanded Abstracts have been copy edited so that references provided with the online metadata for each paper will achieve a high degree of linking to cited sources that appear on the Web. REFERENCES
Amestoy, R., I. D. J.-Y. L’Excellent, and J. Koster, 2001, A fully asynchronous multifrontal solver using distributed dynamic scheduling: Simax, 23, 15–41.
Eaton, P., B. Anderson, I. Mackenzie, and D. Wynn, 2010, Newdas — The Newmont distributed IP data acquisition system: 80th Annual International Meeting, SEG, Expanded Abstracts, 1768–1771.
Eaton, P., B. Anderson, B. Nilsson, E. Lauritsen, S. Queen, and C. Barnett, 2002, Newtem — A novel time-domain helicopter electromagnetic system for resistivity mapping: 72nd Annual International Meeting, SEG, Expanded Abstracts, 1–4.
Haber, E., U. M. Ascher, and D. W. Oldenburg, 2004, Inversion of 3D electromagnetic data in frequency and time domain using an inexact all-at-once approach: Geophysics, 69, 1216–1228.
Li, Y., and D. W. Oldenburg, 2000, 3D inversion of induced polarization data: Geophysics, 65, 1931–1945.
Loayza, C., and J. Reyes, 2010, Geologic overview of the Yanacocha mining district Cajamarca, northern Peru: Presented at the SIMEXMIN10 — IV Brazilian Symposium of Mineral Exploration.
Oldenburg, D. W., E. Haber, and R. Shekhtman, 2008, Forward modeling and inversion of multisource tem data: 78th Annual International Meeting, SEG, Expanded Abstracts, 559–563.
Oldenburg, D. W., R. Shehktman, R. A. Eso, C. G. Farquharson, P. Eaton, B. Anderson, and B. Bolin, 2004, Closing the gap between research and practice in EM data interpretation: 74th Annual International Meeting, SEG, Expanded Abstracts, 1179–1182.
Pinto, R., and J. Quispe, 2003, Antonio project: Exploration and development final report: Minera Yanacocha Exploration Geology Department.
© 2012 SEG DOI http://dx.doi.org/10.1190/segam2012-1316.1SEG Las Vegas 2012 Annual Meeting Page 5
Dow
nloa
ded
01/0
9/13
to 1
37.8
2.10
7.11
0. R
edis
trib
utio
n su
bjec
t to
SEG
lice
nse
or c
opyr
ight
; see
Ter
ms
of U
se a
t http
://lib
rary
.seg
.org
/