three-dimensional terrain visualization on personal ... visualization on personal computers: an...
TRANSCRIPT

Three-Dimensional Terrain Visualization onPersonal Computers: An Application withStereo SIR-B ImagesR. Welch and D. PapaclulralamposCenter for Remote Sensing and Mapping Science (CRMS), Department of Geography, The University of Georgia, Athens, GA30602
ABSTRACT: A low-cost personal computer and image processing/mapping software package were employed to deriveterrain elevations from Shuttle Imaging Radar-B (SIR-B) stereo image data in digital formats, and to create three-dimensional (3D) perspective views of the rugged Mt. Shasta area in northern California. Elevation errors of less than ± 65m were achieved using automatic stereocorrelation techniques and a linear OEM calibration approach. It is anticipatedthat future radargrammetric mapping and terrain visualization studies can be conducted using digital stereo radarimages in a PC-based workstation environment. This will greatly facilitate utilization of radar images for studies of theperennial cloud-covered areas of the world_
INTRODUCTION
SYNTHETIC APERTURE RADAR (SAR) images have proved usefulfor a variety of landform and land-use analysis tasks. They
also have been employed to derive terrain elevations (Ford etai., 1986; Leber! et ai., 1986a). However, the computation of Zcoordinates from stereo SAR data in digital formats is a difficulttask, even with large, powerful computers (Ramapriyan et al.,1986). Factors that influence the derivation of terrain elevationsinclude inherent noise, a relatively narrow range of useful intensity values, comparatively poor spatial resolution, layovercaused by terrain relief, and variable geometric characteristicsintroduced during acquisition. These problems are well-knownand were encountered in the present study of Shuttle ImagingRadar-B (SIR-B) data of Mt. Shasta in northern California (Figure1).
Previous mapping studies have been conducted with SIR·Bdata of Mt. Shasta, including those by Leber! et al. (1986b) andSimard et al. (1986), both of whom employed stereo-pairs recorded at incidence angles of 29 and 53 degrees. The formerstudy utilized image processing techniques to generate optimized film transparencies from the digital SIR-B data. These filmimages were then inserted in an analytical stereoplotter controlled by specially tailored software to produce spot heightsand a contour plot at an interval of 200 m. The root-mean-squareerror (RMSE) of spot heights ranged from ± 53 m to ± 178 m.Simard et al. (1986), on the other hand, employed automatedstereocorrelation techniques to generate elevations and orthoimages from the digital SIR-B stereo images. However, correlation success was limited to about 33 percent, and comparisonswith map data revealed the stereocorrelation produced a rootmean-square difference of about ± 100 m between map andimage-derived Z-coordinate values. While the above studiesdocument the possibilities for producing topographic information from the stereo SIR-B data, and for generating maps, orthoimages, and 3D displays, they also indicate the problems ofworking with SAR images in digital formats.
The objective of this study is to expand the previous work bydemonstrating the heretofore unrealized possibilities for generating topographic information from digital SAR images usingautomated stereocorrelation and terrain visualization techniques with personal computers (Welch and Papacharalampos,1990). At the time this study was conducted, automatic stereocorrelation of digital SAR data had not been demonstrated onsmall computers. Furthermore, Earth scientists seldom have ac-
PHOTOGRAMMETRIC ENGINEERING & REMOTE SENSING,Vol. 58, No.1, January 1992, pp. 71-75.
~Study erg
NEVADA
o
FIG. 1. Study area is centered on Mt. Shasta innorthern California.
cess to details about SAR sensor geometry that will be of use interrain mapping. Consequently, an effort was made to developcorrelation techniques in combination with a simplified computational approach for deriving terrain elevations that can beused by geomorphologists, geologists, and map makers.
A software package, the Desktop Mapping System (OMS)"',developed to create planimetric, topographic, and thematic mapproducts from digital images has been employed for this purpose (Welch, 1989). The OMS software is designed to permitlow-cost, effective image processing and 3D terrain mapping onIBM compatible personal computers (Welch, 1990). It providesa rigorous 3D mapping capability when employed with SPOTstereo images, and is well suited for use with image data recorded by a variety of sensor systems.
All data processing in this study was undertaken on a Dell325 personal computer equipped with Intel 80386 and 80387microprocessors operating at 25 MHz. The memory system included 4 Mbytes of RAM and a 320 Mbyte hard disk. An IBM8514/A compatible display adapter and monitor provided 256 colorsat 1024-pixel by 768-line resolution. The OMS software packagerunning under MS-DOS 4.0 incorporated all necessary routinesfor rectification, registration, stereocorrelation, and three-dimensional display.
0099-1112/92/5801-71$03.00/0©1992 American Society for Photogrammetry
and Remote Sensing
72 PHOTOGRAMMETRlC ENGINEERING & REMOTE SENSING, 1992
STUDY AREA AND STEREO SIR-B DATA SETS
The study area is centered on Mt. Shasta, California (4r 25'N latitude and 1220 10' W longitude) and covers approximately700 km2 • Elevations range from about 800 m to more than 4300m above sea level.
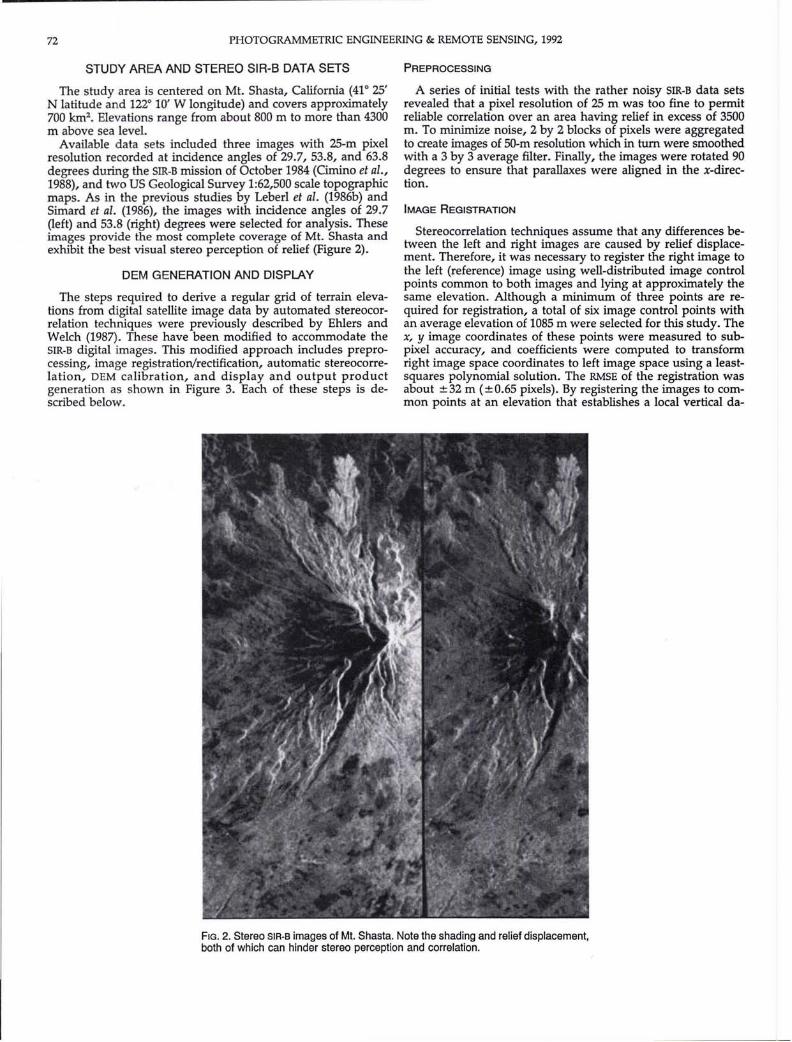
Available data sets included three images with 25-m pixelresolution recorded at incidence angles of 29.7, 53.8, and 63.8degrees during the SIR-B mission of October 1984 (Cimino et aI.,1988), and two US Geological Survey 1:62,500 scale topographicmaps. As in the previous studies by Leber! et al. (1986b) andSimard et al. (1986), the images with incidence angles of 29.7(left) and 53.8 (right) degrees were selected for analysis. Theseimages provide the most complete coverage of Mt. Shasta andexhibit the best visual stereo perception of relief (Figure 2).
DEM GENERATION AND DISPLAY
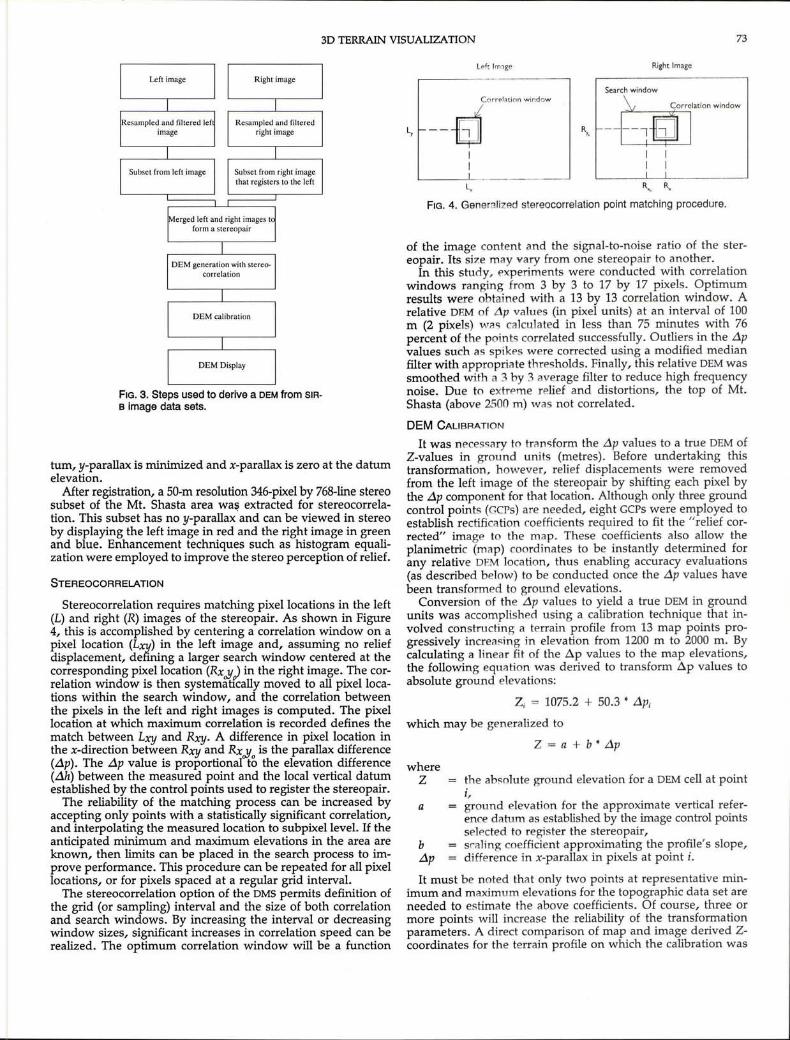
The steps required to derive a regular grid of terrain elevations from digital satellite image data by automated stereocorrelation techniques were previously described by Ehlers andWelch (1987). These have been modified to accommodate theSIR-B digital images. This modified approach includes preprocessing, image registration/rectification, automatic stereocorrelation, DEM calibration, and display and output productgeneration as shown in Figure 3. Each of these steps is described below.
PREPROCESSING
A series of initial tests with the rather noisy SIR-B data setsrevealed that a pixel resolution of 25 m was too fine to permitreliable correlation over an area having relief in excess of 3500m. To minimize noise, 2 by 2 blocks of pixels were aggregatedto create images of SO-m resolution which in turn were smoothedwith a 3 by 3 average filter. Finally, the images were rotated 90degrees to ensure that parallaxes were aligned in the x-direction.
IMAGE REGISTRATION
Stereocorrelation techniques assume that any differences between the left and right images are caused by relief displacement. Therefore, it was necessary to register the right image tothe left (reference) image using well-distributed image controlpoints common to both images and lying at approximately thesame elevation. Although a minimum of three points are required for registration, a total of six image control points withan average elevation of 1085 m were selected for this study. Thex, y image coordinates of these points were measured to subpixel accuracy, and coefficients were computed to transformright image space coordinates to left image space using a leastsquares polynomial solution. The RMSE of the registration wasabout ±32 m (±O.65 pixels). By registering the images to common points at an elevation that establishes a local vertical da-
FIG. 2. Stereo SIR-B images of Mt. Shasta. Note the shading and relief displacement,both of which can hinder stereo perception and correlation.
3D TERRAIN VISUALIZATION 73
FIG. 4. Generalized stereocorrelation point matching procedure.
Right Image
Search window
~Iationwindow
R,.~---bWj
I I
! :
Left Image
a
whereZ the absolute ground elevation for a OEM cell at point
i,ground elevation for the approximate vertical reference datum as established by the image control pointsselpcted to register the stereopair,
b sraling coefficient approximating the profile's slope,.::1p difference in x-parallax in pixels at point i.
It must be noted that only two points at representative minimum and maximum elevations for the topographic data set areneeded to estimate the above coefficients. Of course, three ormore points will increase the reliability of the transformationparameters. A direct comparison of map and image derived Zcoordinates for the terrain profile on which the calibration was
of the image content and the signal-to-noise ratio of the stereopair. Its size may vary from one stereopair to another.
In this study, experiments were conducted with correlationwindows ranging from 3 by 3 to 17 by 17 pixels. Optimumresults were obtained with a 13 by 13 correlation window. Arelative OEM of .1p values (in pixel units) at an interval of 100m (2 pixels) Wile; calculated in less than 75 minutes with 76percent of the points correlated successfully. Outliers in the .::1pvalues such as spikes were corrected using a modified medianfilter with appropriate thresholds. Finally, this relative OEM wassmoothed with a 3 by 3 average filter to reduce high frequencynoise. Due to extrpme relief and distortions, the top of Mt.Shasta (above 2500 m) was not correlated.
OEM CALIBRATION
It was necessary to trilnc;form the .::1p values to a true OEM ofZ-values in ground units (metres). Before undertaking thistransformation, however, relief displacements were removedfrom the left image of the stereopair by shifting each pixel bythe .::1p component for that location. Although only three groundcontrol points (GCPs) are needed, eight GCPs were employed toestablish rectification coefficients required to fit the "relief corrected" image to the map. These coefficients also allow theplanimetric (map) coordinates to be instantly determined forany relative OEM location, thus enabling accuracy evaluations(as described below) to be conducted once the .::1p values havebeen transformed to ground elevations.
Conversion of the .::1p values to yield a true OEM in groundunits was accomplished using a calibration technique that involved constructing a terrain profile from 13 map points progressively increasing in elevation from 1200 m to 2000 m. Bycalculating a linear fit of the L\p values to the map elevations,the following equation was derived to transform L\p values toabsolute ground elevations:
Z; = 1075.2 + 50.3 • .::1Pi
which may be generalized to
Z = a + b' .::1p
tum, y-parallax is minimized and x-parallax is zero at the datumelevation.
After registration, a 50cm resolution 346-pixel by 768-line stereosubset of the Mt. Shasta area was extracted for stereocorrelation. This subset has no y-parallaxand can be viewed in stereoby displaying the left image in red and the right image in greenand blue. Enhancement techniques such as histogram equalization were employed to improve the stereo perception of relief.
STEREOCORRELATION
Stereocorrelation requires matching pixel locations in the left(L) and right (R) images of the stereopair. As shown in Figure4, this is accomplished by centering a correlation window on apixel location (Lxy) in the left image and, assuming no reliefdisplacement, defining a larger search window centered at thecorresponding pixel location (Rx,}/ ) in the right image. The correlation window is then systematically moved to all pixellocations within the search window, and the correlation betweenthe pixels in the left and right images is computed. The pixellocation at which maximum correlation is recorded defines thematch between Lxy and Rxy. A difference in pixel location inthe x-direction between Rxy and Rx,}/ is the parallax difference(.::1p). The .::1p value is proportional to the elevation difference(.::1h) between the measured point and the local vertical datumestablished by the control points used to register the stereopair.
The reliability of the matching process can be increased byaccepting only points with a statistically significant correlation,and interpolating the measured location to subpixellevel. If theanticipated minimum and maximum elevations in the area areknown, then limits can be placed in the search process to improve performance. This procedure can be repeated for all pixellocations, or for pixels spaced at a regular grid interval.
The stereocorrelation option of the OMS permits definition ofthe grid (or sampling) interval and the size of both correlationand search windows. By increasing the interval or decreasingwindow sizes, significant increases in correlation speed can berealized. The optimum correlation window will be a function
FIG. 3. Steps used to derive a DEM from SIR·B image data sets.
74 PHOTOGRAMMETRIC ENGINEERING & REMOTE SENSING, 1992
Elevation (m)
2500
2000
'500
'0005000 10000
_ U.S.G.S Map
- Stereocorrel.a!ion
15000
Distance (m)
20000 30000
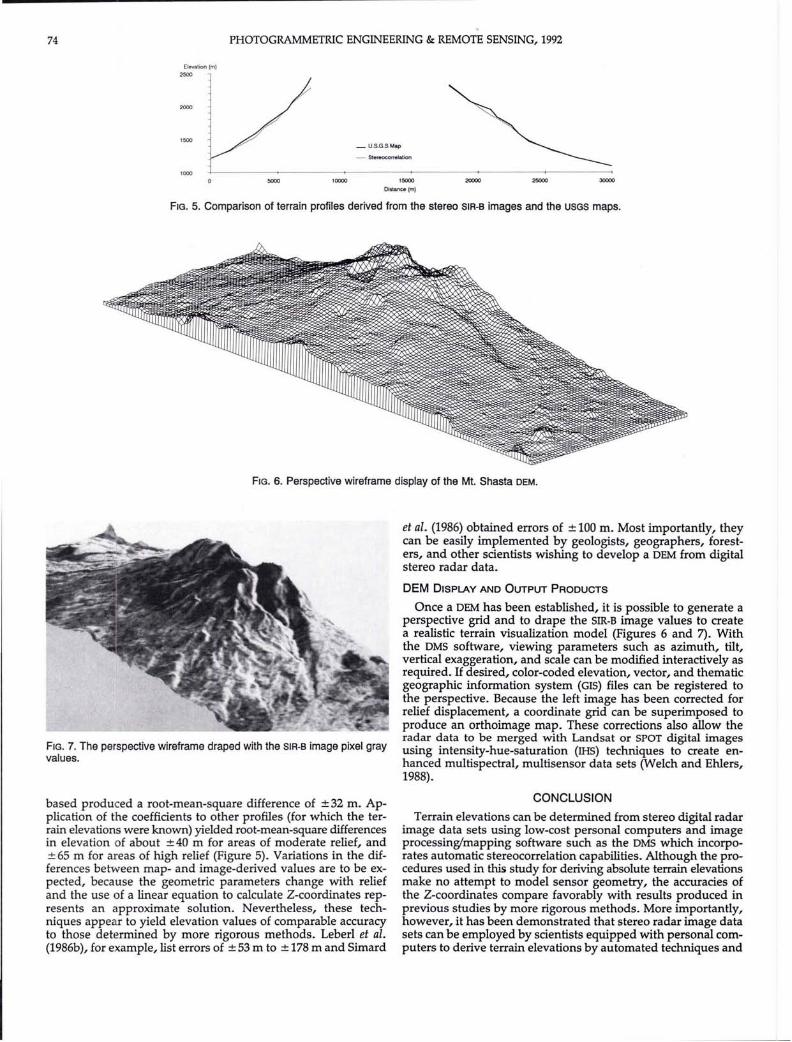
FIG. 5. Comparison of terrain profiles derived from the stereo SIR-B images and the USGS maps.
FIG. 6. Perspective wireframe display of the Mt. Shasta OEM.
FIG. 7. The perspective wireframe draped with the SIR-B image pixel grayvalues.
based produced a root-mean-square difference of ± 32 m. Application of the coefficients to other profiles (for which the terrain elevations were known) yielded root-mean-square differencesin elevation of about ±40 m for areas of moderate relief, and± 65 m for areas of high relief (Figure 5). Variations in the differences between map- and image-derived values are to be expected, because the geometric parameters change with reliefand the use of a linear equation to calculate Z-coordinates represents an approximate solution. Nevertheless, these techniques appear to yield elevation values of comparable accuracyto those determined by more rigorous methods. Leber! et aI.(1986b), for example, list errors of ± 53 m to ± 178 m and Simard
et aI. (1986) obtained errors of ± 100 m. Most importantly, theycan be easily implemented by geologists, geographers, foresters, and other scientists wishing to develop a DEM from digitalstereo radar data.
DEM DISPLAY AND OUTPUT PRODUCTS
Once a DEM has been established, it is possible to generate aperspective grid and to drape the SIR-B image values to createa realistic terrain visualization model (Figures 6 and 7). Withthe DMS software, viewing parameters such as azimuth, tilt,vertical exaggeration, and scale can be modified interactively asrequired. If desired, color-coded elevation, vector, and thematicgeographic information system (GIS) files can be registered tothe perspective. Because the left image has been corrected forrelief displacement, a coordinate grid can be superimposed toproduce an orthoimage map. These corrections also allow theradar data to be merged with Landsat or SPOT digital imagesusing intensity-hue-saturation (IHS) techniques to create enhanced multispectral, multisensor data sets (Welch and Ehlers,1988).
CONCLUSION
Terrain elevations can be determined from stereo digital radarimage data sets using low-cost personal computers and imageprocessing/mapping software such as the DMS which incorporates automatic stereocorrelation capabilities. Although the procedures used in this study for deriving absolute terrain elevationsmake no attempt to model sensor geometry, the accuracies ofthe Z-coordinates compare favorably with results produced inprevious studies by more rigorous methods. More importantly,however, it has been demonstrated that stereo radar image datasets can be employed by scientists equipped with personal computers to derive terrain elevations by automated techniques and

3D TERRAIN VISUALIZATION 75
to create orthoimage maps, 3D perspectives, and enhanced multiresolution, multisensor image products. Such capabilities lendthemselves to a variety of mapping and GIS applications in theremote, poorly mapped areas of the world or in regions wherecloud cover prevents obtaining photographic or electro-opticalimages of good quality.
ACKNOWLEDGMENTS
This study was conducted as part of the project, "ShuttleImaging Radar-B (SIR-B) Data Analysis," funded by the California Institute of Technology Jet Propulsion Laboratory OPL) under Contract No. 957516. The assistance of C. Elachi, D. Evansand M. Kobrick of JPL is greatly appreciated. The Desktop Mapping System (DMS)TN software package is marketed by R-WEL,Inc., P.O. Box 6206, Athens, GA 30604.
REFERENCES
Cimino, J.B., B. Holt, and A. Holmes Richardson, 1988. The ShuttleImaging Radar B (SIR-B) Experiment Report, JPL Pub. 88-2, Jet Propulsion Laboratory, Pasadena, California.
Ehlers, M., and R. Welch, 1987. Stereocorrelation of Landsat TM Images, Photogrammetric Engineering & Remote Sensing, Vol. 53, No.9,pp. 1231-1237.
Ford, J.P., J. B. Cimino, B. Holt, and M. R. Ruzek, 1986. Shuttle ImagingRadar Views the Earth From Challenger: The SIR-B Experiment, JPL Pub.86-10, Jet Propulsion Laboratory, Pasadena, California.
Leber!, F.W., G. Domik, J. Raggam, J. B. Cimino, and M. Kobrick,1986a. Multiple Incidence Angle SIR-B Experiment Over Argentina:Stereo-Radargrammetry Analysis, IEEE Transactions on Geoscienceand Remote Sensing, Vol. GE-24, No.4, pp. 482-491.
Leber!, F.W., G. Domik, J. Raggam, and M. Kobrick, 1986b. RadarStereomapping Techniques and Application to SIR-B Images of Mt.Shasta, IEEE Transactions on Geoscience and Remote Sensing, Vol. GE24, No.4, pp. 473-481.
Ramapriyan, H.K., J. P. Strong, Y. Hung, and C. W. Murray, Jr., 1986.Automated Matching of Pairs of SIR-B Images for Elevation Mapping, IEEE Transactions on Geoscience and Remote Sensing, Vol. GE24, No.4, pp. 462-472.
Simard, R., F. Plourde, and T. Toutin, 1986. Digital Elevation Modelingwith Stereo SIR-B Image Data, Remote Sensing for Resources Development and Environmental Management, International Archives of Photogrammetry and Remote Sensing, Vol. 26, Part 7/1, pp. 161-166.
Welch, R., 1989. Desktop Mapping with Personal Computers, Photogrammetric Engineering & Remote Sensing, Vol. 55, No. 11, pp. 16511662.
--, 1990. 3-D Terrain Modeling for GIS Applications, GIS World,Vol. 3, No.5, pp. 26-30.
Welch, R., and M. Ehlers, 1988. Cartographic Feature Extraction withIntegrated SIR-B and Landsat TM Images, International Journal ofRemote Sensing, Vol. 9, No.5, pp. 87~89.
Welch, R., and D. Papacharalampos, 1990. 3-D Computation and Display of Terrain Models from Stereo Imaging Radar Data, RemoteSensing Science for the Nineties, Proceedings of the IEEE 10th AnnualInternational Geoscience & Remote Sensing Symposium, College Park,Maryland, Vol. 3, pp. 1967-1969.
Forthcoming ArticlesYue Hong Chou, Slope-Line Detection in a Vector-Based GIS.Raymond 1. Czaplewski, Misclassification Bias in Areal Estimates.Claude R. Duguay and Ellsworth F. LeDrew, Estimating Surface Reflectance and Albedo from Landsat-5 Thematic Mapper over
Rugged Terrain.Peter F. Fisher, First Experiments in Viewshed Uncertainty: Simulating Fuzzy Viewsheds.G. M. Foody, A Fuzzy Sets Approach to the Representation of Vegetation Continua from Remotely Sensed Data: An Example
from Lowland Heath.Steven E. Franklin and Bradley A. Wilson, A Three-Stage Classifier for Remote Sensing of Mountain Environments.Clive S. Fraser, Photogrammetric Measurement to One Part in a Million.Clive S. Fraser and James A. Mallison, Dimensional Characterization of a Large Aircraft Structure by Photogrammetry.Peng Gong and Philip J. Howarth, Frequency-Based Contextual Classification and Gray-Level Vector Reduction for Land-Use
Identification.Christian Heipke, A Global Approach for Least-Squares Image Matching and Surface Reconstruction in Object Space.Richard G. Lathrop, Jr., Landsat Thematic Mapper Monitoring of Turbid Inland Water Quality.Donald 1. Light, The New Camera Calibration System at the U.s. Geological Survey.Ronald T. Marple and Eugene S. Schweig, III, Remote Sensing of Alluvial Terrain in a Humid, Tectonically Active Setting: The New
Madrid Seismic Zone.Fabio Maselli, Claudio Conese, Ljiljana Petkov, and Raffaello Resti, Inclusion of Prior Probabilities Derived from a Nonparametric
Process into the Maximum-Likelihood Classifier.Ram M. Narayanan, Steven E. Green, and Dennis R. Alexander, Soil Classification Using Mid-Infrared Off-Normal Active Differential
Reflectance Characteristics.Kurt Novak, Rectification of Digital Imagery.Albert f. Peters, Bradley C. Reed, and Donald C. Rundquist, A Technique for Processing NOAA-AVHRR Data into a Geographically
Referenced Image Map.Kevin P. Price, David A. Pyke, and Lloyd Mendes, Shrub Dieback in a Semiarid Ecosystem: The Integration of Remote Sensing and
Geographic Information Systems for Detecting Vegetation Change.Omar H. Shemdin and H. Minh Tran, Measuring Short Surface Waves with Stereophotography.Michael B. Smith and Mitja Brilly, Automated Grid Element Ordering for GIS-Based Overland Flow Modeling.David M. Stoms, Frank W. Davis, and Christopher B. Cogan, Sensitivity of Wildlife Habitat Models to Uncertainties in GIS Data.Khagendra Thapa and John Bossler, Accuracy of Spatial Data Used in Geographic Information Systems.Thierry Toutin, Yves Carbonneau, and Louiselle St-Laurent, An Integrated Method to Rectify Airborne Radar Imagery Using DEM.Paul M. Treitz, Philip J. Howarth, and Peng Gong, Application of Satellite and GIS Technologies for Land-Cover and Land-Use
Mapping at the Rural-Urban Fringe: A Case Study.William S. Warner and 0ystein Andersen, Consequences of Enlarging Small-Format Imagery with a Color Copier.Zhuoqiao Zeng and Xibo Wang, A General Solution of a Closed Form Space Resection.