through the looking glass: can classroom observation...
TRANSCRIPT

Through the looking glass: can classroom observation and coaching improve teacher performance in Brazil?
[Version May 13th, 2016]
Barbara Bruns (Center for Global Development, Visiting Fellow) Leandro Costa (World Bank, Economist) Nina Cunha (Stanford University, PhD Candidate)
Abstract
This study evaluated a program in the northeast Brazilian state of Ceará designed to improve teachers’ effectiveness by using an information “shock” (benchmarked feedback) and expert coaching to promote increased professional interaction among teachers in the same school. We show that the program significantly increased teachers’ use of class time for instruction (.29 - .35 SD), by reducing the time spent on classroom management (-.25 - -.28 SD) and time off-task (-.21 - -.24 SD). The program also increased teachers’ use of questions during their lessons, consistent with the coaching program’s goal of encouraging more interactive teaching practice. The treatment schools also registered an increase in student engagement. Finally, consistent with the program’s strategy of promoting greater interaction among teachers, the improvements in schools’ average results were achieved by reducing the variation in teacher practice. These preliminary results are probably confounded due to the likely Hawthorne effect; thus, when would be able to measure a sizeable effect on the students test scores, we can confirm the effectiveness of this intervention. Contents
1. Introduction ................................................................................................................................................... 2 2. Intervention and experiment design ............................................................................................................. 4
2.1 The intervention ................................................................................................................................ 4 2.2 Research questions .................................................................................................................................. 6
3. Instruments and Data .................................................................................................................................... 6 3.1 The Stallings Instrument .................................................................................................................... 6 3.2 Sample ..................................................................................................................................................... 7 3.3 Balance checks ......................................................................................................................................... 9
4. Results ......................................................................................................................................................... 12 4.1 Descriptive statistics .............................................................................................................................. 12 4.2 Intention to treat effects ....................................................................................................................... 14 4.3 Intent to treat effects– restricted sample ............................................................................................. 18 4.4 Intent to treat effect – intra-school variation ....................................................................................... 21 4.5 Intent to treat - heterogeneous effects................................................................................................. 22 4.6 Partial Compliance ................................................................................................................................. 24
5. Experiment Threats and Robustness checks ............................................................................................... 26 5.1 Attrition ........................................................................................................................................... 26 5.2 Spillover ................................................................................................................................................. 29 5.3 Treatment Contamination ..................................................................................................................... 32 5.4 Evaluation-Driven Effects ...................................................................................................................... 32
6. Conclusions .................................................................................................................................................. 33
1

1. Introduction
A central education policy question is how to improve teachers' classroom effectiveness. Research in the United States (Jackson et al, 2014; Chetty et al, 2014; Hanushek and Rivkin, 2010; Rockoff, 2004) on teacher value-added and in Latin America (Araujo et al, 2016; Bruns and Luque 2014) on observed classroom practice has consistently documented large variations in teachers’ practice and classroom-level results, even among teachers in the same school teaching the same grade and subject.
There is new research interest in observing teachers’ classroom practice and unpacking what affects it. First, there is growing evidence over the past five years that the quality of teachers’ classroom practice, as measured through classroom observations, is important for student learning and other key outcomes, such as students’ socio-emotional skills. The influential, large-scale Measures of Effective Teaching study in the US found that classroom observations, using three different instruments, could predict differences in individual teachers’ ability to produce classroom-level learning gains (MET, Kane and Staiger, 2012). Other US researchers have also found that children exposed to teachers with better scores on the CLASS classroom observation instrument have higher learning gains, better self-regulation and fewer behavioral problems (Howes et al, 2008; Grossman et al, 2010). The only research to date in a developing country, by Araujo et al (2016) in Ecuador, has produced similar findings. By randomly assigning pre-school students to different teachers, Araujo and colleagues found that a one standard deviation increase in teachers’ classroom quality, measured using the CLASS observation instrument, resulted in 0.11, 0.11 and 0.07 standard deviation (SD) higher student test scores in language, math and executive function.
Beyond these studies, which have directly linked teachers’ classroom practice to classroom level outcomes, there is a larger body of research that has not measured teachers’ classroom practice, but which has linked classroom-level outcomes to individual teachers. This literature has established convincingly that individual teachers have large impacts on their students and that impacts on students’ socio-emotional development and life outcomes may be even longer-lasting than impacts on learning (Chetty et al, 2014; Jackson et al, 2014; Jennings and DiPrete, 2010).
What factors cause some teachers to be so much more effective than others? There is substantial US research that “observable” teacher characteristics, such as age, education, qualifications, and contract status do not explain differences in individual teachers’ ability to produce classroom level learning gains – except for a consistent finding that all teachers tend to be less effective during their first three-to-five years of teaching. (Kane and Staiger, 2012) Araujo et al (2016) found, similarly, that differences in teachers’ classroom practice are not explained by teacher background and status. Except for “rookie” teachers with less than three years of service, the quality of teachers’ classroom practice was not correlated with teachers’ tenure status, salary, and age, or even an unusually rich set of data the researchers were able to collect, such as teacher IQ, Big Five personality traits, and executive function.
The accumulating evidence that teachers’ classroom practice varies widely, has important impacts on student learning and socioemotional skills development, and cannot be predicted by the observable characteristics commonly used to hire and promote teachers implies at least two major policy challenges. First, school systems need better ways of identifying candidates with the potential for excellence and/or weeding out lower-potential teachers early in their careers. Second, school systems need effective strategies for improving the classroom practice of the existing stock of teachers.
This paper focuses on the second challenge: improving the effectiveness of teachers in service. We evaluate a program in the northeast Brazilian state of Ceará designed to improve teachers’ effectiveness by using an information “shock” (benchmarked feedback) and expert coaching to promote increased professional interaction among teachers in the same school. This is the first study we know of in a developing country context that rigorously measures the impact of a training program both on teachers’ classroom practice and their students’ learning outcomes. It contributes to the very scant evidence base on the impact and cost-effectiveness of teacher training programs in developing countries as well as the growing global research base on how teachers’ classroom practice affects student learning.
2

The design of the program was inspired by the research evidence that there exist large variation in teacher quality within schools. In the US, Hanushek and Rivkin (2010) have documented that value-added learning gains of different classroom teachers in the same school can range from 0.5 to 1.5 years of curriculum mastery. In studies of teachers’ use of class time across six different countries in Latin America and the Caribbean, Bruns and Luque (2014) found that the average variation within schools in the share of total class time different teachers spend on instruction is consistently very large, irrespective of the average level of teacher performance in the school or even in the school system. Around a mean of roughly 65 percent of class time spent teaching in school at the median of the distribution in a Latin American country, the lowest-performing teachers in that school spend on average less than 50% of class time on instruction and the best-performing over 80%. This is a striking degree of classroom level heterogeneity given the fact that within a given school all teachers serve a roughly homogenous student population, deliver the same curriculum, and work under the same set of management and institutional conditions. Gaps of this magnitude in the instructional time different students experience can be expected to affect learning outcomes at the classroom level.
One positive implication of the Latin America research is the scope for school-level performance gains through greater diffusion of the best teaching practices within schools. Indeed, the exchange of practice among teachers in a school is a core strategy in high-performing East Asian systems, such as Japan’s lesson study (Easton, 2008; Lewis et al 2004), Singapore (OECD, 2013) and Shanghai (Liang, 2016). Sustained school-level learning improvements are also reported in Ontario, Canada through a program which provided schools with feedback on their teachers’ classroom-level learning outcomes and external coaches who encouraged school personnel to work together to share practice and improve instruction (OECD, 2011; Mourshed et al. 2010; Fullan, 2013). Fullan calls this the creation of a "professional learning community" within the school.
A hypothesized theory of action is that promoting and supporting school-level professional interaction among teachers may improve results through four channels. First, by increasing the amount of transparency about differential teacher performance within a school it can create “lateral accountability” or peer pressures on teachers to exert more effort towards improving their performance. Second, it can provide teachers with “curated” pedagogical or classroom management techniques (used effectively by their peers) that are clearly relevant to their school context. Third, it can transfer knowledge through modeled practice, which may be inherently more effective in supporting the adoption of new practices and behaviors than off-site, lecture-based training. Fourth, it can guarantee continuous support and reinforcement for the new behaviors from the school director and peers if the “whole school” is engaged in and committed to achieving improved classroom practice. Countervailing factors include possible unwillingness among teachers to acknowledge differences in classroom effectiveness and weak extrinsic (salary, promotion, managerial oversight) incentives to reward improvements. A final issue may be that even if teachers are able to improve their classroom practice by, for example, devoting more time to instruction, weaknesses in teachers’ content mastery could limit the impacts on student learning.
This paper presents the initial results of a randomized evaluation of the Ceará program. We show that the program significantly increased teachers’ use of class time for instruction, by reducing the time spent on classroom management and time off-task. The program also increased teachers’ use of questions during their lessons, consistent with the coaching program’s goal of encouraging more interactive teaching practice. The treatment schools also registered an increase in student engagement. Finally, consistent with the program’s strategy of promoting greater interaction among teachers, the improvements in schools’ average results were achieved by reducing the variation in teacher practice. Across the treatment sample, the program helped the schools with the lowest average performance improve most. All of this represents important progress.
The key question is whether these improvements in teacher practice translate into higher student learning. Test score data for the end of the 2015 school year will be available by June 2016, and the final version of this paper will address the full set of research questions outlined in Section 2. The team also plans a focus group analysis of how the program affected teachers’ attitudes towards observing their colleagues at work in the classroom, being observed themselves, and being presented with performance metrics that exposed variations in the effectiveness of their schools’ teachers.
3

Section 2 describes the context, the intervention, and the research questions. Section 3 describes the instruments used and the sample. Section 4 presents the results. Section 5 analyzes threats to the experiment and analysis we carried out to check the robustness of our sample and our results. Section 6 summarizes our conclusions and their implications for education policy in Brazil and other settings.
2. Intervention and experiment design
The Northeast state of Ceará, with 8.9 million people, is the 8th most populous in Brazil. With a GDP per capita estimated at $2,500, it is also one of Brazil’s poorest states. While municipalities manage the provision of primary education (including pre-school and grades 1-9) in Brazil, states are responsible for the three-year cycle of secondary education. Ceará state’s education secretariat manages 621 schools with a total of 340,766 students1. Despite its poverty, Ceará has enjoyed a reputation within Brazil for progressive and effective government and in 2013, Ceará’s secondary schools ranked 13th of 27 Brazilian states2 on the Ministry of Education’s IDEB index of basic education quality (a combined index of national assessment test scores and promotion rates).
Over the 2015 school year, the state implemented an experimental program designed to test whether improvements in teacher practice can be stimulated by providing schools with performance feedback based on classroom observations and practical suggestions and coaching support for more effective pedagogy. Classroom observation research supported by the World Bank in Brazil and elsewhere (Bruns and Luque, 2014) suggests that teachers’ failure to use class time effectively, heavy reliance on traditional “chalk and talk” teaching methods, and inability to keep students engaged may be important factors in repetition, dropout and low learning outcomes. A 2014 federal government policy mandating that schools free up significant teacher time (1/3 of total working hours) in the school week to enable them to engage in professional interaction has created an opportunity for technical assistance or coaching programs to help schools maximize the utility of this extra time.
2.1 The intervention
Just treatment schools received an intervention with four components: • Performance feedback on teacher practice. At the beginning of the 2015 school year,
treatment schools each received a two-page info-graphic “Bulletin” (Annex figures A1 and A2), providing key results from classroom observations undertaken at the end of the prior school year, in November 2014. For each variable, the Bulletin compared the school average to the best school in its district, the state average, the average for Brazil, and to US benchmarks for good practice. The bulletins also included a table with results for individual teachers, to help schools understand the range in practice that exists in their school, and to identify which teachers exhibited the best practices. Teachers were not identified by name, only by the class hour and subject. As a result, we were not able to collect any specific identification of teachers because we committed with the government that we would assure the confidentiality of teachers. This would avoid the teachers misunderstanding the classroom observation as a teacher’s evaluation. In early 2016, all schools (treatment and control) received an updated Bulletin which compared their results for the two (baseline and endline) rounds of classroom observations. (Annex figure A3)
• Self-help materials. Each school’s principal, pedagogical coordinator, and teachers received a book on “high-impact” teaching practices that stimulate student learning. 4680 books were distributed in 175 schools. The book was the Portuguese translation (Aula Nota 10) of Teach Like A Champion by US educator Douglas Lemov. The book includes practical descriptions of useful techniques, plus video examples and exercises.
• Face-to-face interaction with high-skill coaches. Three different one day workshops were delivered by an experienced coaching team from Sao Paulo. The workshops exposed school
1 Instituto Nacional de Estudos e Pesquisas Educacionais Anisio Teixeira – INEP/MEC 2 Secretaria da Educação do Ceará – SEDUC/CE
4

directors and pedagogical coordinators to the goals of the program and how to understand the feedback bulletins and use the results. The pedagogical coordinators were trained on how to film teachers in the classroom and hold individual coaching sessions with teachers to go over the videos and provide specific feedback on their teaching practice. They were also trained to film themselves providing feedback to teachers and to share these videos with their coaches, for additional feedback. The workshops stressed pedagogical coordinators’ responsibility for using an online log book to report weekly on the implementation of the program in their school.
• Expert coaching support via Skype - An expert trainer from the Sao Paulo team interacted regularly with each school’s pedagogical coordinator via Skype. Each coach supported 31-36 schools and was responsible for delivering four coaching sessions over the period to each school. Treatment schools accessed a private website with good practice videos, their own uploads and other materials. The website required weekly online feedback from every pedagogical coordinator about the number of classroom observation and feedback activities implemented in the school, specific issues identified and addressed, and an assessment of progress. The site encouraged teachers and pedagogical coordinators to post video examples of good teacher practices in their school – both classroom teaching examples and pedagogical coordinators giving teachers specific feedback after observing their classes. The total time spent on teacher observation, coaching and feedback over the 2015 school year was estimated at about 111 hours per school.
The estimated costs of the program and the evaluation are shown in Table 1. The largest program cost elements were the logistics costs of the baseline classroom observations, which furnished the basis for the information shock to schools and of the four one-day face to face training sessions, each carried out in three different locations across the state. Other costs were the time of the coaches, and the training materials shared with schools’ pedagogical coordinators. Skype communications costs were minimal, and all of the participating schools either had functioning internet and computers at school, or the pedagogical coordinator had a computer and internet access at home to facilitate the interaction with the coaches.
We did not cost the time that teachers and pedagogical coordinators spent working together within schools, as a new federal government policy mandates that teachers spend part of their existing contract hours on collaborative planning. Thus, the total costs of the feedback and coaching program are estimated as R$ 1,729,000.00 (US$ 432250.00), or R$ 14.1 (US$ 3.5) per student in the treatment schools. The Lemann Foundation contributed R$ 624.858,39 (US$ 156,000) to the program costs. The main costs of the evaluation were the logistics costs of the classroom observations at baseline and endline in the sample of 292 schools. These are estimated as R$ 992.000 (US$ 248.000), or R$ 4.8 (US$ 1.2) per student in the treatment and control schools.
As student learning outcomes are not yet available, we have not yet generated an estimate of the program’s cost-effectiveness. If the program of classroom observation feedback and ITC-based coaching does prove effective, it would have important advantages over most traditional models of in-service teacher development. It has lower unit costs, as it avoids the logistics expenses of off-site programs and it leverages skills already present in schools. It also permits gradual and continuous reinforcement of improved teaching techniques, given the reality that changing adult behavior is difficult.
Table 1 – Estimated costs for Ceará teacher feedback and coaching program (R$ /US$ = 4.0)
Cost Element R$ US$ R$/Student US$/student
Program Costs Classroom observations in 165 treatment schools – Nov 2014 536000 134000 4.4 1.1 Transport, lodging, subsistence for 400 participants at 4 face-to-face training sessions 152000 38000 1.2 0.3
Aula Nota 10 book for 175 schools (4680 books) 117000 29250 1.0 0.2
5

ELOS training team in 175 schools 468000 117000 3.8 1.0 SUBTOTAL 1273000 318250 10.3 2.6 Evaluation Costs Classroom observations in 132 control schools in Nov 2014 and 292 schools in Nov 2015 456000 114000 3.7 0.9
SUB TOTAL 456000 114000 3.7 0.9 GRAND TOTAL 1729000 432250 14.1 3.5
2.2 Research questions
The Ceará education secretariat agreed to randomize the implementation of the program across approximately half of its schools during the 2015 school year, in order to evaluate rigorously the following research questions:
1. Can providing schools with individualized feedback based on classroom observations plus support materials and coaching stimulate measurable changes in teacher practice in a relatively short period (a single school year)?
2. Can providing classroom observation feedback and coaching for pedagogical coordinators reduce variation in teacher practices within a school?
3. Can providing classroom observation feedback and coaching for pedagogical coordinators improve student test performance? Is the combined program developed in Ceará (classroom observation feedback and school-level coaching) cost-effective in producing learning results when compared with alternative teacher training programs?
3. Instruments and Data
3.1 The Stallings Instrument
Teachers’ classroom practice was measured using the Stallings “classroom snapshot” method, technically called the Stanford Research Institute Classroom Observation System, developed by Professor Jane Stallings for research on the efficiency and quality of basic education teachers in the United States in the 1970s. (Stallings, 1977; Stallings and Mohlman, 1988). The Stallings instrument generates robust quantitative data on the interaction of teachers and students in the classroom, with a high degree of inter-rater reliability (0.8 or higher) among observers with relatively limited training, in contrast to instruments such as CLASS, which require a high degree of observer training and skill to apply reliably. The Stallings instrument’s relative simplicity makes it suitable for large scale samples in developing country settings (Jukes, 2006; Abadzi, 2007; DeStefano et al, 2010; Schuh-Moore et al, 2010; World Bank 2015). The instrument is language and curriculum-neutral, so results are directly comparable across different types of schools and country contexts, and a growing body of comparative country data -- from more than 18,000 teachers in six developing countries as of end-2015 -- is available on the World Bank open data website for benchmarking.
The strength of the Stallings method is that it is a way of converting the qualitative activities and interactions between a teacher and students that occur during a class into robust quantitative data on teachers’ instructional practice and students’ engagement. Observations are coded at ten different moments in every class, at exact intervals whose spacing depends on the length of the class; every 3 minutes in a 30-minute class, every 5 minutes in a 50-minute class, etc. It is essential that the observer be present in the classroom before the first official moment of class and stay through the official end time of the class, whether or not the teacher is present. Each observation consists of a 15 second scan of the classroom, starting with the teacher and proceeding clockwise around the room. Observers code what the teacher is doing; what materials s/he is using and what the students are doing.
6

For the purposes of generating quantitative estimates of time on task, student engagement, and core pedagogical practices, the coded activities are grouped into four categories: 1. Instruction: Reading Aloud; Demonstration/Lecture; Discussion/Debate/Question and Answer; Practice & Drill; Assignment/Class Work; Copying 2. Classroom Management: Verbal Instruction; Disciplining students; Classroom Management with Students; Classroom Management Alone 3. Teacher Off-Task: Teacher in Social Interaction with Students; Teacher in Social Interaction with Outsiders or Teacher Uninvolved; Teacher out of the classroom 4. Students Off-Task: Students being disciplined; students in Social Interaction; Student(s) Uninvolved
For the purposes of generating quantitative estimates of the intensity of teachers’ use of available learning materials, the coding options are: No Materials; Textbooks; Workbooks; Blackboard or whiteboard; Learning aids (maps, blocks, calculators); ITC (LCD projectors, computers, TV/radio).
The original Stallings instrument is a one-page coding grid with classroom materials listed across the top and activities down the left side. Within each resulting cell, there is one row labeled “T”, for coding what the teacher is doing and what materials s/he is using at the moment of observation and one row labeled “P” for marking what the pupils are doing and what materials they are using. Each 15 second observation is coded on a single sheet, thus each class observed generates 10 coding sheets. As the paper-based version has no in-built consistency checks to guard against mistaken double-coding or inconsistent coding (for example, if a student is being disciplined, both the teacher row and the student row must be coded with this activity), a full week (40 hour) training course with substantial time practicing in schools has typically been required to achieve .80 inter-rater reliability among observers.
The November 2014 round of observations in Ceará was conducted using the paper coding sheets, with subsequent data entry by a survey research firm. In August 2015, the research team conducted a pilot study in ten schools of observers sitting side by side (but not able to see each other’s coding instruments) to compare the paper based method with a newly-available version of the Stallings instrument on electronic tablet, using ODK software. The team found high consistency in coding across the two instruments and lower error rates with the tablet, which is much more intuitive and where the sequence of questions permits in-built consistency checks. The November 2015 observations were conducted on tablets.
3.2 Sample
Ceará has 573 secondary schools that offer the complete three-year cycle. Of these, a sample of 400 schools was stratified by size, geographic area and quartile of learning results. We randomly assigned the 400 schools into 4 groups, with the first 175 assigned to the treatment group, a second group of 25 assigned to a no-observation group, the next 175 schools assigned to the control group, and the last 25 schools also assigned to the no-observation group.
A late start to the baseline round of classroom observations and a limited budget led to a reduction in the sample to 350 schools (175 treatments and 175 controls), which were selected through simple randomization to keep the sample balance. We did not observe any classroom in the group of 50 schools that were randomly assigned to a no-observation group of the study, but we will be able to analyze the students’ assessments results afterwards.
The baseline round of classroom observations was conducted over a period of five weeks in November and early December 2014. Schools were visited without advance notice, although all schools were informed by the Secretariat in October that a research study involving school visits would be implemented in November and December, and their cooperation was requested. When observation teams arrived at the schools, they informed school directors and teachers that the classroom observations were for research purposes only and that teachers would remain anonymous. School directors were advised that they could decline to participate in the study, and individual teachers could decline as well. In the end, no schools declined to participate and the full number of teachers planned to be observed in each school was in fact observed; the only substitutions were for teacher absence, following the protocol described below.
Within schools, a schedule of classrooms for observation was pre-identified in order to give priority to observing math and Portuguese language classes, since standardized tests are applied in these subjects. Other
7

core curriculum subjects observed were biology, chemistry, physics, history and geography. Among classrooms offering these subjects, the selection of teachers to be observed was random. In case the teacher for a class and period originally programmed was absent, observers had a list of two acceptable alternatives.
Depending on school size (Type A, B, or C) and whether or not it was a vocational school (EP, Educacao Profissional), teams of 1-4 observers visited the school and fanned out to observe between 6 and 24 classrooms. 3 The goal was to observe at least one-third of the teachers in the school. Six classrooms were observed in vocational schools (EP) and type C schools, 12 classrooms in type B schools, and 18 classrooms in type A schools, as shown in Table 2.
Table 2 – Protocol for classroom observations, November 2014
Since a significant share of Ceará’s secondary school classes are 100 minute double classes (called “twin
classes” in Portuguese), both these and regular classes of 50 minutes were observed. The objective was to conduct the endline observations in the same classrooms observed at baseline;
since individual teachers were guaranteed anonymity, the protocol was to observe classrooms with the same three characteristics: grade, subject and shift. As some schools changed their schedules between baseline and endline, only 75% of the classrooms were “matched”, following the same criteria, at endline.
The observers were state pedagogical coordinators who had received a 40-hour training course in the Stallings method and scored 80% or higher on a certification test. They were all from schools identified for the treatment sub-sample, to avoid any contamination of control schools from having someone at the school familiar with the Stallings observation method and/or the training program. However, having the treatment school pedagogical coordinators trained on Stallings mean that we couldn’t separate the effects of this training and practice observing teachers in other schools from all the other parts of the program. Observers were organized by district and assigned to districts other than their own, to avoid any familiarity with the schools they observed. Each team was coordinated by a supervisor with advanced expertise in the Stallings method. Supervisors conducted at least two observations side by side with each observer to check consistency, and reviewed the coding sheets submitted by observers for inconsistencies. In the cases of major inconsistencies, supervisors were responsible for making a repeat visit to the school to conduct new observations.
Out of the 350 schools of the randomization, with 175 each planned for treatment and controls, 292 schools were observed in November 2014 and in November 2015. The full initial sample could not be observed due to disruptions in the school calendar in November 2014 (standardized tests and holidays) and a shortage of observers in the Fortaleza district. The 292 school final sample includes 156 schools in the treatment group and 136 in the control group. This difference in the attrition of treatment and control schools is due to the data collection firm focused their efforts on making up for the schools of the treatment group that would benefit from the classroom observation and the intervention. As a result, Because the loss of schools from the treatment and control groups was uneven, we conducted a series of balance checks to test the randomization. In the treatment sample, the 19 schools that were not observed could not receive the information treatment (benchmarked classroom observation feedback for the teachers in their school). But these schools were given
3 Type C schools have less than 600 students, type B have 600-1000 students, type A have over 1000 students. The vocational (EP) schools typically have less than 600 students.
8

access to the other three components of the program -- self-help materials, face to face training and coaching, and were observed again at endline.
3.3 Balance checks
To ensure that our final 292-sample was balanced, we perform three sets of tests. First, we compare summary statistics for available outcome variables at baseline for the initially defined treatment and control groups in the 350-school sample. Second, we compare the same statistics for the final sample of 292 schools. Third, we check for balance in data from the baseline round of classroom observations collected in November 2014 for the 292 schools.
The randomization was based on 2013 data on school demographics and outcomes. When 2014 data became available, we performed a new balance check. All variables represent school averages.
Table 3 presents results for the first two sets of tests, along with the results of t tests of mean differences across the treatment and control groups for each variable, as well as joint significance tests. The first set of balancing tests (random sample) shows that the treatment and the control groups are well balanced, although the treatment schools present a higher average math proficiency. A joint test for the joint significance of the variables in predicting treatment fails to reject that they are jointly equal to zero, supporting the notion of baseline balance in these outcome variables.
9

Table 3 - Pre-treatment covariate balance
10

Table 4 - Pre-treatment classroom dynamics balance
The second set of columns (baseline sample) shows that despite the reduction in the number of
schools, characteristics of the treatment and control groups remained balanced. Although some of the
11

differences between treatment and control schools are significant at a 5% level (enrollments, proportion of female teachers, Portuguese and Math proficiency, and student-teacher ratio), a joint test for significance of the full set of variables in predicting treatment fails to reject that they jointly equal zero, suggesting that our treatment and control groups are equal in expectations on both observed and unobserved characteristics. We nevertheless control for demographic characteristics in the analysis to account for any potential differences between the different groups.
Results for the third set of balance checks, on the classroom dynamics variables observed at baseline, are presented in table 4. Although the control schools spend more time on classroom management, less time on instructional activities with all students engaged, and have a higher share of time with students off-task, a joint significance test yields a p-value of 0.81, suggesting that the randomization is collectively balanced along the full set of classroom dynamics indicators we consider.
4. Results
4.1 Descriptive statistics
Table 5 presents key indicators of classroom practice that are captured by the Stallings instrument: i) teacher time on instruction; ii) teacher time on classroom management; iii) teacher time off-task; iv) teacher time on instruction with all students engaged; and v) time with a large group of students (six or more) off-task, meaning visibly not engaged in the activity being led by the teacher. The first four variables are expressed as a percentage of total official class time, while the last two variables are expressed as a percentage of total time the teacher was engaged in instructional activities.
Teachers’ time on instruction increased significantly in the treatment schools, to 77% of class time, compared with 70% in the control schools, implying 10% more time on instruction in every class hour. Teachers in the program schools gained more time for instruction by significantly reducing time spent on classroom management, which fell to 18% of class time vis a vis 21% in control schools, and time off task, which fell to 5.8% in schools exposed to the program, compared with 8.4% in the control schools. The biggest driver of this change was a decline in the share of class time that teachers were out of the room. In treatment schools, this fell to 3%, compared to 5% in the control schools.
Table 5: Change in classroom dynamics from Nov. 2014 to Nov. 2015
Figures 1-5 illustrate the distribution across schools of these changes in classroom dynamics. The box
plots show schools’ average values with the median value (the horizontal line within the box), the lower and upper quartiles (the two edges of the box) and the extreme values (the two whiskers extending from the box).4
First, benchmarked, individualized feedback should help focus teachers on the importance of maximizing instructional time and coaching support should help improve teachers’ capacity for planning lessons and conducting routine administrative processes as efficiently as possible, as well as minimizing time
4 Kernel and cumulative distributions are presented in Annex, figures A4 and A5, as well as statistics for classroom dynamic characteristics at baseline and endline, at the class observation level, table A1.
12

off task. Second, the coaching program’s emphasis on keeping students engaged with well-paced and more interactive (question and answer) lesson plans should be reflected in a lower share of class time with a large group (six or more) of students visibly tuned out or in social interaction (off-task). Third, promoting greater interaction among teachers in a school should reduce the variation within schools in teaching practices and Stallings measures.
It is particularly encouraging that there was a clear improvement in the bottom-performing treatment schools. As can be seen from Figures 1 and 2, all treatment schools were able to raise the average time on instruction to 55% or more of class time, compared to the control group, where some schools continued to average only 40% of class time on instruction. All treatment schools were able to average less than 33% of class time on administrative activities and 15% or less of class time with teachers completely off task. In contrast, the lower tail of control schools showed no improvement from the baseline; some schools continued average up to 40% of teacher time on administrative activities and up to 25% of total class time completely off-task (with teachers either out of the classroom or in social interaction with students or visitors). The progress registered in treatment schools, shifting teacher time from classroom management and off-task activities towards increased instruction, is an important gain.
Figures 1 and 2– Box plot distribution for teacher time on instruction and classroom management
Figure 3– Box plot distribution for teacher time off task
13

Figure 4 and 5 – Box plot distribution for students off-task and time on instruction with all students engaged
Treatment schools also showed some improvement in student engagement. The Stallings instrument
has two measures for this: i) the share of class time that a large group of students (defined as six or more) is not engaged with the teacher, either chatting with other students (in social interaction) or visibly tuned out (texting, sleeping, gazing out the window, etc) and ii) the share of time that a teacher is able to keep the entire class engaged in the activity she is leading. The former captures the degree to which the teacher is able to minimize the number of students drifting off; in classes of typically 25 students, letting one-quarter of them tune out can compromise the lesson, especially if groups of students are chatting and raises the noise level in the classroom. The latter is quite challenging; teachers must either organize the class into groups working in parallel on assignments that keep them engaged, or manage to keep the entire class focused on material she is presenting, questions, or a discussion that draws in all students.
At baseline, a large group of students was off-task, on average, 20% of class time in treatment schools and 24% in control schools. Treatment schools brought this down to 14%, while in control schools it fell to 19%. As Figure 4 shows, at the end of the program, there were no treatment schools averaging more than 40% of class time with six or more students tuned out or in social interaction, while some control schools continued to average more than 50% of time with a large group off task. The feedback and coaching appears to have helped teachers in treatment schools adopt instructional practices that engage more students and achieve less disruptive classroom environments.
Treatment schools made less progress in raising the share of class time with all students engaged. Figure 5 shows that, while at baseline, no schools in the entire sample averaged more than 65% of time with all students engaged, at endline, the positive tail of treatment schools averaged over 80% of time on instruction with all students engaged; the best performing control schools averaged only 60%. However, the low tail of the distribution in both treatment and control schools at endline continued to include schools averaging less than 10% of time on instruction with all students engaged and the sample mean for treatment schools at endline was no better than for control schools. Finding instructional strategies that manage to engage all students in relatively large and diverse classrooms is clearly a challenge in Ceará’s schools.
4.2 Intention to treat effects
To confirm that the feedback plus coaching intervention caused the observed impacts on teachers’ classroom practices we first estimate intent-to-treat effects (ITT), i.e. differences between treatment and control group means for each treatment arm. In other words, ITT provides an estimate of the impact of being offered a chance to participate in a given arm of the experiment. We use a parsimonious set of controls to aid in precision and correct for any potential imbalance between treatment and control. The ITT effect is estimated from the equation below:
𝑦𝑦𝑖𝑖 = 𝛽𝛽0 + 𝛽𝛽1𝑦𝑦𝑖𝑖,𝑡𝑡−1 + 𝑿𝑿′𝒊𝒊𝛽𝛽2 + 𝛼𝛼0𝑍𝑍𝑖𝑖 + 𝜀𝜀𝑖𝑖 (1) where 𝑦𝑦𝑖𝑖 is the dependent variable for classroom observation i; 𝑦𝑦𝑖𝑖,𝑡𝑡−1 is the baseline classroom dynamic variable collected in November of 2014; 𝑿𝑿𝒊𝒊 represents a vector of pre-intervention characteristics at the school level; 𝑍𝑍𝑖𝑖 is an indicator for whether the classroom observation was in school that was offered participation in the intervention; and 𝜀𝜀𝑖𝑖 if the error term, clustered at the school level. The coefficient of interest is 𝛼𝛼0.
14

We estimate (1) using four sets of control variables: “no controls,” i.e., excluding the baseline control and the 𝑿𝑿𝒊𝒊 variables; “baseline controls”, including only control for the baseline observation; “student, teacher and classroom controls” including the Xi variables at the school level for students and teachers and Xi variables at the classroom 5; and “all controls” which includes all Xi controls.6
Results are presented in Table 6. Outcome variables (𝑦𝑦𝑖𝑖) are normalized to have a mean of zero and a standard deviation (std.) of one within the full sample. Treatment effects are reported in standard deviation units and standard errors clustered at the school level are presented in parentheses below each estimate.
Table 6: Mean effect sizes on summary measures of classroom observation
The intervention increased the amount of time teachers spend on instructional activities, decreased
the amount of time spent on classroom administration and off-task activities, and decreased the amount of time a large group of students is off-task while the teacher is teaching. Except for instructional activities with all students engaged, results are strong and significant in all four specifications, and they range from 0.261 to 0.311 standard deviations for instructional time; from -0.227 to -0.177 for classroom management activities; from -0.221 to -0.208 for teacher off-task activities; and from -0.158 to -0.114 for a big group of students off-task. The estimates of 𝛼𝛼0 change little as the list of control variables changes, which is to be expected since treatment and control were randomly assigned. We noticed that as the number of controls increases, the impact of the treatment systematically decreases. The estimates decreases by 20 percent as more and more controls are added. This mean the experiment did not occurred as planned. As a result, we carried out a wide range of robustness checks to ensure that results are not driven by attrition, contamination, or other threats to the experiment.
1. Figures 6 – 10 unpack results for each of the five summary measures using specification (4) - OLS results with baseline and all covariates as control.7 The figure displays coefficients and 90% confidence intervals for summary measures and for all individual outcomes under each category. The black line crosses at zero; results to the right of the zero line represent positive effects of the treatment and results to the left
5 Controls for students include: Math and Portuguese proficiency in 2013 and 2014, pass rate, failure rate, dropout rate, mother’s education below middle school, mothers with a graduate degree, age-grade distortion. Controls for teachers include: proportion of female teachers, proportion of temporary teachers, teacher’s age, teacher’s experience, teacher salary low, teacher salary high, proportion of black or brown teachers. Controls for classroom include: discipline (Portuguese, Math, Social Sciences and Sciences), grade and tween classroom. 6 Besides student, teacher and classroom controls, all controls include: high school enrollment, high school vocational enrollment, rural area, average number of student per class, proportion of female principals, principal experience, principal with graduate degree, student-teacher ratio. 7 Regression tables unpacking each of the summary measures using the four specifications are shown in the appendix, tables A2 to A6.
15

represent negative effects of the treatment. The results of the estimates do not add up to zero because we standardized the outcome variables to get the impact estimated in terms of standards deviation.
Figure 6 – Decomposition of effects on instructional time - all controls (90% confidence interval)
Results for the impact of the program on teacher time on instruction, Figure 6, show that the positive
effect is driven by statistically significant increases in time spent on “discussion/debate/Q&A” (0.15 SD) and “copying” (0.15 SD). “Reading aloud” and “demonstration/lecture” showed statistically significant but smaller increases, 0.08 and 0.09 standard deviations, respectively.
The use of more interactive teaching techniques, and especially the importance of using questions to probe students’ understanding of the material being taught and to stimulate discussion are key elements of the coaching program and the Teach Like A Champion book. However, despite the increase, teachers in treatment schools still used discussion/question and answer only 10.5% of the time at endline, and only 8.4% of time in control schools. Lecturing from the blackboard remained the dominant teaching mode – used on average 38% of the time in treatment schools and 34% of time in control schools. There was a statistically significant increase in copying in the treatment schools relative to control schools, but it still absorbed less than 10% of the time. Time spent on “practice and drill” and doing assignments in class also declined. Although these declines were not statistically significant, they are consistent with the content of the coaching program, which encouraged teachers to use class time for interaction with students, rather than doing seat work which could be assigned as homework.
Figure 7 presents the average treatment effects for the four underlying activities that constitute classroom management. The improvement was driven by a sharp, -0.20 SD reduction in teacher time spent on classroom management alone (eg, teacher at his/her desk grading papers). Declines in time spent on verbal instruction (teacher discussing non-academic matters, such as plans for school activities or dates for upcoming tests, etc.), discipline, and classroom management with students (typically taking attendance, passing out papers, collecting homework, etc.) were not statistically significant.
16

Figure 7 – Decomposition of effects on classroom management - all controls (90% confidence interval)
Figure 8 shows that the reduction in the share of time teachers in the treatment schools are off-task
was entirely due to the large decline in time spent out of the classroom: the coefficient of -0.24 standard deviation is strong and significant. There were no significant impacts on teacher in social interaction with students and teacher uninvolved.
Figure 8 – Decomposition of effects on teacher off-task activities - all controls (90% confidence interval)
The treatment schools’ improvement in the share of time teachers are able to keep the entire class
engaged was entirely associated with the increased time teachers spent on “discussion/debate/Q&A”. The positive and significant result of 0.1 standard deviation in this variable is consistent with goals of the coaching program and, in a sense, validates the program’s emphasis on more interactive teaching practices to keep students engaged. Time spent on doing assignments in class declined by 0.1 standard deviation, also consistent with the content of the coaching program.
17

Figure 9 – Decomposition of effects on instructional activities with all students engaged - all controls (90% confidence interval)
The effect on students off-task, Figure 10, is driven by a decrease in the share of class time that a large
group of students is in social interaction, which presents a coefficient of -0.11. Having numerous students chatting in a classroom creates noise and distraction for other students and can undermine learning. An improvement in teachers’ ability to maintain classroom discipline and reduce or eliminate student socializing is a potentially important change. Figure 10 – Decomposition of effects on student time off-task - all controls (90% confidence interval)
Appendix Table A7 shows the program impacts on materials used by teachers. There was an increase in the amount of time teachers in the treatment schools led the class using no materials—0.1 standard deviation—and using the blackboard—0.162. The use of other materials—textbooks, notebooks, learning aides, ITC, and cooperative activities among students--was not significantly affected by the intervention. 4.3 Intent to treat effects– restricted sample
In the endline data collection in November 2015, efforts were made to return to the same classrooms observed at baseline, with the understanding that the teacher might have changed, since our protocol did not
18

allow for collecting teachers’ names, codes or other identifying information. If in 2014 a 3rd year math class was observed during the sixth period of the day, the most precise measure of program impact on teaching practice would come from observing the same classroom, subject and time of day exactly one year later, in the expectation that in the majority of cases we would be observing the same teacher. In practice, observers were only able to make matched repeat observations in 2,399 classrooms, 75% of those observed at baseline. Variations in the school calendar and logistical issues resulted in 25% of the 2015 observations being conducted in grades and subjects in the school that had not been observed at baseline.
Arguably, results for the whole sample of 3121 classes may underestimate the real effects, since 25% of the observations were in classrooms not observed at baseline. By analyzing the 75% of classrooms where the full protocol was followed, we may expect measured impacts to be closest to the real impacts.
To test this, we first check the extent to which the restricted 75% sample is different from the main sample. Table 7 shows balance tests for the restricted sample, for pre-treatment covariates and for the classroom observation variables collected at baseline. The balance is quite similar to the baseline sample. Treatment and control schools present some differences in enrollments, proportion of female teachers, student-teacher ratio, classroom management activities, instructional activities with all students engaged, and students off-task, but a joint test for the joint significance of the variables in predicting treatment fails to reject that they are jointly equal to zero, supporting that the randomization is balanced for this restricted subsample.
19

Table 7: Pre-treatment covariates and classroom dynamics balance - Restricted Sample Table 8 - Pre-treatment covariates and classroom dynamics balance - Restricted Sample
20

Table 8: Mean effect sizes on summary measures of classroom observation – restricted sample
Table 8 shows ITT estimates for the restricted sample, using the same model presented in equation (1).
Results are quite similar to the analysis for the whole sample, but slightly stronger. The treatment increased teachers’ time on instruction between 0.280 and 0.334 standard deviations across specifications, and reduced time on classroom management and time off-task -0.243 to -0.204, and -0.240 to -0.202 SD, respectively. The share of time that a large group of students was off task went down in the range of -0.188 to -0.140. Except for instructional time with all students engaged, coefficients are strong and significant at a 5% level. As we would expect, estimates of 𝛼𝛼0 change little as the list of control variables changes.
4.4 Intent to treat effect – intra-school variation
Given the program’s emphasis on promoting diffusion of good practices within schools, an expected result is a decrease in the variations in teacher practice within treated schools. To test this impact, we calculate the standard deviation of each of the main summary variables at the school level and use it as a dependent variable.
The ITT effect is then estimated from the equation below: 𝜇𝜇𝑖𝑖 = 𝛽𝛽0 + 𝛽𝛽1𝜇𝜇𝑖𝑖,𝑡𝑡−1 + 𝑿𝑿′𝒊𝒊𝛽𝛽2 + 𝛼𝛼0𝑍𝑍𝑖𝑖 + 𝜀𝜀𝑖𝑖 (2)
where 𝜇𝜇𝑖𝑖 is the standard deviation of the classroom observation variable for school i; 𝜇𝜇𝑖𝑖,𝑡𝑡−1 is the baseline standard deviation of the classroom observation variable collected in November of 2014; 𝑿𝑿𝒊𝒊 represents a vector of pre-intervention characteristics at the school level; 𝑍𝑍𝑖𝑖 is an indicator for whether the classroom was in a treatment school; and 𝜀𝜀𝑖𝑖 is the error term, clustered at the school level. The coefficient of interest is 𝛼𝛼0. We estimate (2) using the same four sets of control variables described above. Results are reported in Table 9.8
8 Regression tables unpacking intra-school variation for each of the summary measures using the four specifications are shown in the appendix, tables A8 to A12.
21

(3)
(4)
Table 9: Intra-school variation in summary measures of classroom observation
The intervention reduced the variation in teacher practice within schools for all three key measures of
teacher time allocation. Results are strong and significant in most specifications. The variation in time on instruction fell from -0.342 to -0.222 across specifications. For classroom management activities, the variation fell from -0.301 to -0.196 (not significant in specification 4), and for teacher off-task it fell from -0.342 to -0.394. However, results are not significant for time on instruction with all students engaged. For the share of teaching time with a big group of students off-task, results are only significant in the two first specifications -- the coefficient is -0.293 for specification (1) and -0.191 for specification (2).
4.5 Intent to treat - heterogeneous effects
To assess heterogeneity in treatment effects across the distribution of teachers observed, we use the baseline data to create quartiles for each of the five key measures. It is plausible that the intervention will affect teachers differently according to where they stand in the distribution of our main variables. For example, if a teacher already achieves high time on instruction, it may be hard to improve further. Positive changes may be easier at the bottom of the distribution, where there is large room for improvement. Conversely, if being at the bottom of the distribution is a proxy for low capacity and/or motivation, achieving measurable change in teacher practice – particularly in the space of a single school year – may be more difficult. We also analyze if the intervention affected teacher differently according to the size of the school where they teach. The Ceará state’s education secretariat classifies their schools in 3 size groups: group A includes schools with more than 1.000 students; group B is 601-1,000 students; group C is schools with less than 601 students. Vocational schools are not part of this classification and for this exercise they were defined as group C, as they are usually relatively small.
We use the following equations to estimate heterogeneous effects: 𝑦𝑦𝑖𝑖 = 𝛽𝛽0 + 𝛽𝛽1𝑦𝑦𝑖𝑖,𝑡𝑡−1 + 𝑿𝑿′𝒊𝒊𝛽𝛽2 + 𝛼𝛼1𝑍𝑍𝑖𝑖𝑄𝑄1𝑖𝑖,𝑡𝑡−1 + 𝛼𝛼2𝑍𝑍𝑖𝑖𝑄𝑄2𝑖𝑖,𝑡𝑡−1 + 𝛼𝛼3𝑍𝑍𝑖𝑖𝑄𝑄3𝑖𝑖,𝑡𝑡−1 + 𝛼𝛼4𝑍𝑍𝑖𝑖𝑄𝑄4𝑖𝑖,𝑡𝑡−1
+ 𝛽𝛽3𝑄𝑄1𝑖𝑖,𝑡𝑡−1 + 𝛽𝛽4𝑄𝑄2𝑖𝑖,𝑡𝑡−1 + 𝛽𝛽5𝑄𝑄3𝑖𝑖,𝑡𝑡−1 + 𝜀𝜀𝑖𝑖
𝑦𝑦𝑖𝑖 = 𝛽𝛽0 + 𝛽𝛽1𝑦𝑦𝑖𝑖,𝑡𝑡−1 + 𝑿𝑿′𝒊𝒊𝛽𝛽2 + 𝛼𝛼1𝑍𝑍𝑖𝑖𝑆𝑆𝑆𝑆𝑆𝑆𝑆𝑆𝑆𝑆𝑗𝑗 + 𝛼𝛼2𝑍𝑍𝑖𝑖𝑀𝑀𝑀𝑀𝑀𝑀𝑀𝑀𝑀𝑀𝑆𝑆𝑗𝑗 + 𝛼𝛼3𝑍𝑍𝑖𝑖𝐵𝐵𝑀𝑀𝐵𝐵𝑗𝑗 + 𝛽𝛽3𝑀𝑀𝑀𝑀𝑀𝑀𝑀𝑀𝑀𝑀𝑆𝑆𝑗𝑗 + 𝛽𝛽4𝐵𝐵𝑀𝑀𝐵𝐵𝑗𝑗 + 𝜀𝜀𝑖𝑖
where 𝑦𝑦𝑖𝑖 is the dependent variable for classroom observation i; 𝑦𝑦𝑖𝑖,𝑡𝑡−1 is the baseline classroom dynamic variable collected in November of 2014; 𝑿𝑿𝒊𝒊 represents a vector of pre-intervention characteristics at the school
22

level; 𝑍𝑍𝑖𝑖 is an indicator for whether the classroom observed was in a school offered treatment; 𝑄𝑄1𝑖𝑖,𝑡𝑡−1, 𝑄𝑄2𝑖𝑖,𝑡𝑡−1,𝑄𝑄3𝑖𝑖,𝑡𝑡−1, and 𝑄𝑄4𝑖𝑖,𝑡𝑡−1 are the quartiles (0-25%; 25-50%; 50-75%; and 75-100%) of the baseline classroom dynamic variables 𝑦𝑦𝑖𝑖,𝑡𝑡−1; 𝑆𝑆𝑆𝑆𝑆𝑆𝑆𝑆𝑆𝑆𝑗𝑗, 𝑀𝑀𝑀𝑀𝑀𝑀𝑀𝑀𝑀𝑀𝑆𝑆𝑗𝑗, and 𝐵𝐵𝑀𝑀𝐵𝐵𝑗𝑗 indicate the school (j) size (C, B and A); and 𝜀𝜀𝑖𝑖 is the error term, clustered at the school level. The coefficients of interest are 𝛼𝛼1, 𝛼𝛼2, 𝛼𝛼3 and 𝛼𝛼4 in model (3) and 𝛼𝛼1, 𝛼𝛼2 and 𝛼𝛼3 in model (4). Variables 𝑄𝑄2𝑖𝑖,𝑡𝑡−1 and 𝑆𝑆𝑆𝑆𝑆𝑆𝑆𝑆𝑆𝑆𝑗𝑗 are omitted due to colinearity. Results using specification (4)—OLS results with baseline and all covariates as controls—are presented in the tables 10 and 11.
Overall, the results in Table 10 show no observable heterogeneity connected with teachers’ starting performance, in the measures of time on classroom management, teacher time off-task, and time on instruction with all students engaged. For time on instruction, we find that the strongest effect is concentrated in the second quartile (0.42 SD.), while results for the other 3 quartiles are homogeneous. There is a strong effect on the share of time a large group of students is off-task in treatment classrooms at the 4th quartile (-0.273 std.), indicating that the intervention had strongest impacts in classrooms where students were off-task a very high 75-100% of total class time. A test for the joint significance of the interaction of treatment with each quartile variable fails to reject heterogeneous effect for all variables, except instructional activities.
Table 10: Effect sizes across the main summary variables distribution
For school size, Table 11 shows some differences. For small schools, the results are only significant for
the variable teacher off-task. For medium-sized schools, results are always significant, except for instructional activities with all students engaged. For large schools, results are significant for instructional and management activities. Although there is some evidence that medium-sized schools might have benefitted most from the intervention, we cannot reject the joint significance test that effects were different across schools of different size.
23
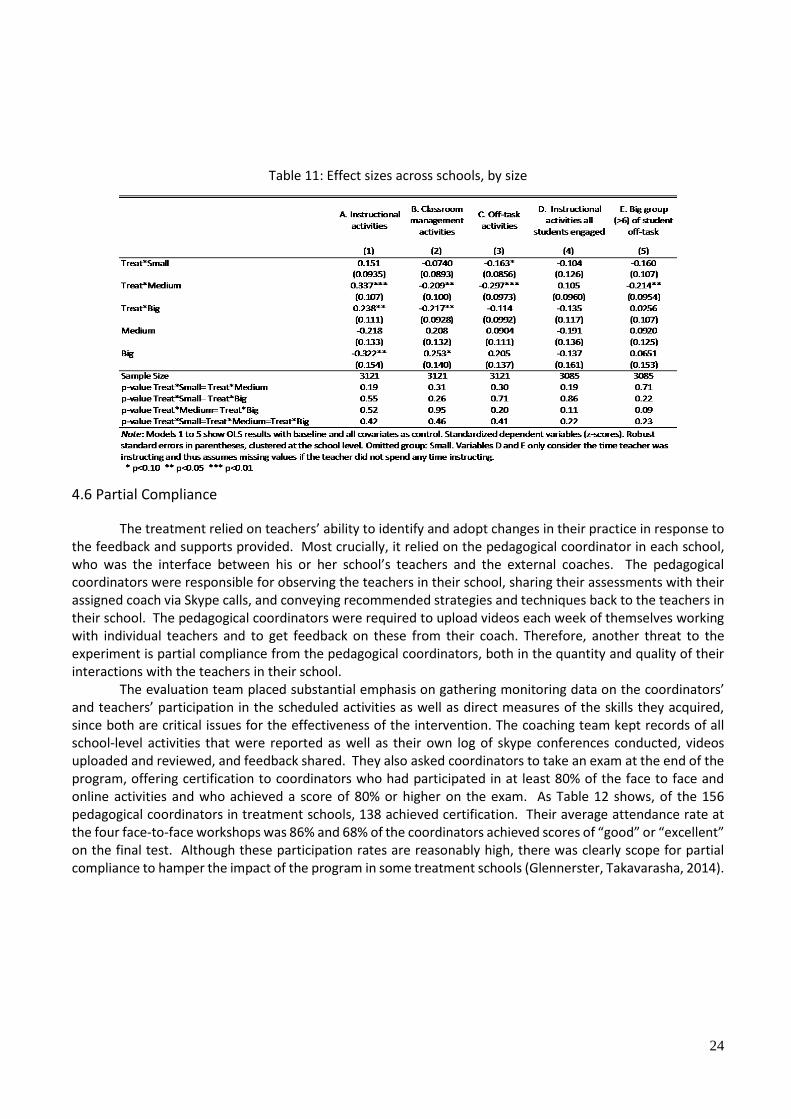
Table 11: Effect sizes across schools, by size
4.6 Partial Compliance
The treatment relied on teachers’ ability to identify and adopt changes in their practice in response to the feedback and supports provided. Most crucially, it relied on the pedagogical coordinator in each school, who was the interface between his or her school’s teachers and the external coaches. The pedagogical coordinators were responsible for observing the teachers in their school, sharing their assessments with their assigned coach via Skype calls, and conveying recommended strategies and techniques back to the teachers in their school. The pedagogical coordinators were required to upload videos each week of themselves working with individual teachers and to get feedback on these from their coach. Therefore, another threat to the experiment is partial compliance from the pedagogical coordinators, both in the quantity and quality of their interactions with the teachers in their school.
The evaluation team placed substantial emphasis on gathering monitoring data on the coordinators’ and teachers’ participation in the scheduled activities as well as direct measures of the skills they acquired, since both are critical issues for the effectiveness of the intervention. The coaching team kept records of all school-level activities that were reported as well as their own log of skype conferences conducted, videos uploaded and reviewed, and feedback shared. They also asked coordinators to take an exam at the end of the program, offering certification to coordinators who had participated in at least 80% of the face to face and online activities and who achieved a score of 80% or higher on the exam. As Table 12 shows, of the 156 pedagogical coordinators in treatment schools, 138 achieved certification. Their average attendance rate at the four face-to-face workshops was 86% and 68% of the coordinators achieved scores of “good” or “excellent” on the final test. Although these participation rates are reasonably high, there was clearly scope for partial compliance to hamper the impact of the program in some treatment schools (Glennerster, Takavarasha, 2014).
24

Table 12: Participation and certification rates for Pedagogical Coordinators engaged in Ceará Teacher
Coaching Program, 2015
To assess the degree to which partial compliance affected program results, we estimated the effects
of the program on compliers using an Instrumental Variables model. This estimate tells us the impact of the program on those schools that received the complete intervention (eg, their pedagogical coordinator acquired the key skills imparted by the training) instead of the Section 4 Intent-to-Treat estimates that show the impact of a school being offered participation in the program. The IV estimation uses the randomized assignment into the program (eg, offered participation) as an instrument to predict the expected degree of full engagement in the program.
The IV estimate is conducted in a two stage least-squares (2SLS) setup as initially used to adjust partial compliance in experiments by Angrist and Imbens (1996)9. In the first stage regression we predict the degree of full engagement in the program from the random assignment. In the second stage, we regress our outcome variables on the predicted full engagement that we found in the first stage. The assumption is that a pedagogical coordinator receiving certification satisfies the exclusion restriction in an instrumental variables (IV) setup. This leads to the 2SLS estimation of the equation:
𝑦𝑦𝑖𝑖 = 𝛽𝛽0 + 𝛽𝛽1𝑦𝑦𝑖𝑖,𝑡𝑡−1 + 𝑿𝑿′𝒊𝒊𝛽𝛽2 + 𝛼𝛼0𝑐𝑐𝑖𝑖 + 𝜏𝜏𝑖𝑖 (5) where ci is a dummy for being certified, and Xi is the vector of covariates. The associated first-stage relationship using Zi as an instrument is
𝑐𝑐𝑖𝑖 = 𝑿𝑿′𝒊𝒊𝛾𝛾1 + 𝜋𝜋𝑍𝑍𝑖𝑖 + 𝜇𝜇𝑖𝑖 (6) The estimate of 𝜋𝜋 is statistically significant about 0.88 (Annex Table A.13). This can leads us to expect
a second-stage estimates about 10 percent larger than the corresponding reduced-form estimates. Table 13 confirms that the effects of the intervention are consistent with the regression estimates
presented in section 3. The program had a significant and positive impact on the share of class time teachers’ devoted to instruction, increasing in the treatment schools by 0.30 - 0.36 SD. The program helped teachers reduce the time spent on classroom management by -0.26 to -0.20 SD, and time off-task from - 0.26 to -0.23 SD. The results were insignificant for the variable “time on instruction with all students engaged” and smaller for the variable “large group of students off-task”, from -0.18 to -013 SD. These results shows that partial compliance did not compromise the integrity of our experiment or change the results of the program significantly.
9 Angrist et al (2002) is an example of using IV models to adjust for partial compliance in an RCT of a voucher program in Colombia.
25

Table 13: 2SLS estimates of the effect on summary measures of classroom observation
5. Experiment Threats and Robustness checks
5.1 Attrition The evaluation was designed to measure key elements of classroom dynamics in a representative
sample of secondary schools spread across all 21 regional administration units of the Ceará state education system. Data collection posed significant technical and logistical challenges, from the need to train 60 of the state’s pedagogical coordinators in the Stallings observation method to the logistics of reaching remote rural schools for one or more days of observations. Principals and teachers were allowed to decline participation; thus the experiment relied on schools and teachers’ willingness to be observed by outsiders, something the schools had never experienced before. Pedagogical coordinators were always assigned to school districts other than their own, so they were unfamiliar to the directors and teachers of the schools they observed.
Due to time and transportation constraints during fieldwork, 58 schools from the original sample could not be observed in the baseline. The 19 schools that were originally assigned for treatment but were not observed still participated in the coaching program, but without the school-level feedback from classroom observations.
The loss of data for 58 schools at baseline meant an overall attrition rate of 16% that could be a source of bias, because the rates of attrition were different in the treatment and control groups, 33% and 67%, respectively. Attrition was most concentrated in the state’s capital city, Fortaleza, with 16 treatment and 38 control schools which could not be observed. The two major reasons were actions by the teachers’ union to mobilize against the classroom observations, which caused several pedagogical coordinators from that district to decline participation in the program, and the refusal of some of the observers that remained to travel to schools in dangerous slum areas. Fortaleza’s population is 4 million and most of its public high schools are located in high risk neighborhoods. The correlation between low school socioeconomic status and probability of not being observed constitutes a clear potential source of selection bias for the key classroom observation indicators. A possible additional source of bias would be differential school closures in the treatment and control groups, if this was associated with quality issues in the schools that closed. However, in fact there were no school closures from 2014 to 2015.
26

We carried out three strategies for dealing with attrition. First, we used Heckman’s strategy for modeling the sample selection under very strong assumptions in order to adjust for selection bias (Heckman, 1979). This approach estimates a two-stage model in which the first stage predicts selection into the program based on observed variables. The second stage regresses outcomes on the predicted selection into the program. As shown in Table 14, this approach also produces results consistent with our initial intent-to-treat estimates when we control for covariates of students, teachers and schools. This suggests that our sample attrition did not introduce any significant selection bias that could invalidate the experiment.
Table 14: Heckman model to adjust for Selection Bias due to Attrition
A second strategy to check the robustness of the results in the presence of attrition is to estimate
bounds for the average treatment effects based on weaker assumptions about the sample selection process. We estimated the bounds using the Lee trimming method that relies on the monotonicity of the outcomes if the individuals participate in the treatment (Lee, 2002 and 2009). These bounds involve excluding a fraction of the observations from the part of the sample had less attrition (in this case, the treatment group) to equalize its size with that of the control group. In other words, the Lee bounds are generated by trimming the sample to equalize attrition rates between the treatment and control groups (Fryer, 2013). The excluded observations are the ones most likely to bias the results. The Lee bounds estimates are only possible at the school level because we have to exclude a fraction of the observations from the part of the sample had less attrition (in this case, schools of the treatment group).
Table 15: Results for sample trimmed with Lee bounds
27

Table 15 presents the lower and upper bounds results for two specification of the Lee bounds,
without any covariate and with dummy or categorical covariates that allows for tightening the bounds of the estimate at the school level (Lee, 2002). The results at the school level were presented in columns (1) and (2). We used the quintile of students’ performance in the previous year. In the model with no tightening, columns (3) and (4), the lower bounds are significant for instructional activities (0.35 SD), for classroom management (-0,68 SD), off-task activities (-0.66 SD). The upper bounds are significant for instructional activities (0,76 SD), for off-task activities (-0.30 SD), and for big group of students off-task (-0.63 SD). All of the ITT estimates are within the interval of the Lee bounds; therefore, there is no reason to expect the selection bias due to attrition affected our impact estimates.
Regarding the model with tight bounds, columns (5) and (6), the estimates were positive for instructional activities and negative for classroom management, off-task activities, and big group of students off-task. In a few of the model specifications, the ITT estimates are not within the bounds intervals. However, all of the bounds estimates have the same sign effect and are close to the ITT estimates. In summary, the bounds result shows that our sample attrition did not reduce significantly the comparability of treatment and control groups, mainly because we can control for such a large range of observable covariates.
Finally, we conducted a more intuitive exercise to adjust for attrition. In the balance check analysis in Section 2, we showed that the treatment and control groups are balanced across covariates. However, 20 more schools were observed in the treatment group when compared to the control group. The fact that a higher share of our initially-defined treatment sample was observed (89% of the original treatment sample against 78% of the original control sample) could lead to a bias in unobservable characteristics. To test for this, we perform a simple exercise: instead of looking to the total of 58 schools not observed, we focus on the difference in the participation rate (the 20 school or 11% differential) and we make a series of assumptions about the possible distribution of our core variables if the 20 schools had been part of the sample. This enables us to set some bounds on how our results might have been impacted.
First, we suppose that the 20 missing schools had perfect teaching and the variable for teacher time on instruction was at the 90% point of the distribution in all cases. In this case, the mean difference between treatment and control would have been 0.15 and with the standard deviation of 0.06—from specification (4) in table 4—we would still have found a significant effect at the 5% level. On the other hand, if we assume a more chaotic scenario, with time on instruction at the 10% point of the distribution in these 20 schools, we would have found a large effect of 0.41 at a 1% level of significance.
We perform this exercise for the 5 summary variables, playing with the different assumptions about where the average values for these 20 schools could have fallen in the distribution – 90%, 75%, 50%, 25% and 10%. Table 14 shows the results considering specification four of our models (OLS results with baseline and all covariates as controls).
Overall, the exercise confirms the robustness of our results: we would have still found sizeable and significant effect in most of the scenarios. For teacher time on instruction, coefficients range from 0.14 to 0.39
28

and are always significant at the 5% level. Classroom management results range from -0.34 to -0.01 and would be significant in all cases except the assumption of baseline performances at the low 25% and 10% point in the distribution. However, it is quite unlikely that the 20 schools would all rest at either extreme of the distributions (either 10% or 90%).
Results for teacher off-task range from -0.34 to -0.12 SD and are always significant. For instructional activities with all students engaged we would actually have a negative and significant effect if these schools had been above the 75% point in the initial distribution. Finally, for student off-task, results would only have remained significant if the missing schools were above the (very high) 75% in the distribution; the effect of the program would range between -0.31 and -0.15 SD.
Table 16: Robustness check exercise
5.2 Spillover
Since the treatment was allocated at the school level, and the sample was drawn across different municipalities state-wide, teachers in the control schools were not likely to know about or participate in any part of the treatment. Only pedagogical coordinators from treatment schools were trained in the Stallings method and participated in the data collection. The online website for the coaching program could only be accessed with a school code.
Nevertheless, there is a chance that some regional supervisors, who were aware of the intervention, may have conveyed information about the program to principals of control schools, even though they were informed about the need to avoid this. If this happened, it could create spillover effects that reduced the quality of the counterfactual because their outcomes were also affected by the program.
Data from a questionnaire applied to principals at baseline and endline provides mixed evidence on the possibility that some control schools became aware of the program. Principals were asked to identify the single most important of six possible strategies (including the option of doing nothing) to improve teachers’ effectiveness (Table 17). On the one hand, the share of principals in treatment schools that identified “feedback based on classroom observation” as most important rose from 11% to 22%, compared to an increase among control school principals of only 3.5 percentage points. However, the increase in the number of control school principals who named “coaching of teachers” as the most important strategy was as large as the increase among treatment school principals. As discussed in the next section on contamination, there was in fact
29

another teacher coaching program implemented in Ceará in 2014 and 2015, which we believe is a more likely explanation for this result.
Table 17: Which one of these instruments is most important for raising teacher quality?
A final source of potential spillover is the fact that 8% of teachers in the control group and 10% in the
treatment group work in more than one school. As most secondary schools run morning and afternoon and sometimes evening shifts, teachers may work the different shifts in two different schools. If a teacher in a treatment school also works in a control school, it would have been very natural to share information about the program, including teaching practices recommended by the coaches, with the control school’s pedagogical coordinator.10 However, we were able to verify the school assignments of teachers in our sample. Only 3% of our control school teachers and 1.7% of our treatment schools have teachers that work in both treatment and control schools.
Table 18: Possibility of spillover from teachers working in more than one school
We implemented two strategies to check the robustness of our impact estimates in the context of likely
spillover. First, we assumed that the municipalities with the largest number of classrooms observed, whether from treatment or control schools, are more susceptible to spillover. The larger the number of teachers (in treatment schools) participating in the program, the higher the chance that some of these may know teachers in control schools in the same municipality. They might understandably think these colleagues could also benefit from the coaching advice and training materials imparted by the program, such as the Aula Nota 10 (Teach Like a Champion) book. Therefore, we can test the impact of between-school spillover if we include in our regression a variable on the number of classrooms in the municipality and a variable on the number of treated classrooms in the same municipality.11
Table 19: Test for spillovers in municipalities with high concentrations of teachers in the program
10 Regarding the pedagogical coordinators, they are usually only assigned to work in one school. 11 We adapted this strategy based on the work of Miguel and Kremer (2004).
30

The results presented in table 19 show that the additional variables we used to test for spillovers were
not significant. The intervention effect was greater than the mean effect size in all specifications of the model. In the model with full controls, the effect of the program on time spent on instructional activities is 0.29 SD and significant at the 1% level. The effect on classroom management activities was - 0.20 SD, also at the 1% level, and the effect on teacher time off task was -0.22 SD, also at the 1% level. We take this as evidence that while spillovers may have occurred, their effects were not significant enough to threaten our conclusions about the impact of the intervention.
Our second strategy relied on information from the principals’ questionnaire about their perceptions of the most important tool for raising teacher quality. Two of the key options offered related to our program – feedback on classroom observations and coaching teachers. Our assumption here is that regional supervisors might share information about the main elements of the program with principals in the control schools and these principals might try to implement similar activities for their schools. We tested this hypothesis by adding to our regressions a dummy variable related to principals’ responses about these key instruments and testing their interaction with the treatment variables.
The results, shown in table 20, are similar to those of Table 19, on the spillover threat linked to the number of classrooms in a municipality. First, the additional variables are not significant. Second, the intervention still shows strong and statistically significant effects in all of the model specifications. This provides additional evidence that, while information about the program may have spilled over to principals in control schools, its effects were not significant enough to change our conclusions about the impact of the intervention.
Table 20: Test for possible spillover of program elements to control school principals
31

5.3 Treatment Contamination
The Ceará government is known for putting strong emphasis on education, and in addition to the Teacher Feedback and Coaching program, the Secretariat implemented three other important programs aimed at raising secondary school quality over the 2015 school year. A “socioemotional learning program” supported school administrators and teachers in delivering a special curriculum designed to strengthen the socioemotional skills of both teachers and students. It was offered to 80 secondary schools; 23 of these fell in our control group and 18 in our treatment group.12
A second program, called Tutoria Pedagogica, has very similar objectives to the Teacher Feedback and Coaching program. Tutoria Pedagogica aims at developing professional learning communities, based on models in New York City and Ontario Canada. However, this program was in a pilot phase during 2015 and was only implemented in 10 schools; two of these fell in our treatment group, but none were among our control schools.
The third program, Jovem do Futuro, aims at improving school management and accountability. JF has much wider coverage; it has been going on for 4 years and has reached 216 secondary schools. Waves 1 to 3 of the program cannot contaminate our treatment group because they were implemented before our randomization assigned treatment and control schools.13 However, the 2015 wave of the program could contaminate our results, as it was rolled out at the same time as the Teacher Feedback program. The 4th wave of Jovem do Futuro covered 22 schools, 14 in our control group and 8 in our treatment group.
Table 21: Overlap in education quality programs implemented in Ceará secondary schools, 2015
To adjust for possible treatment contamination, we ran the main regressions controlling for each
program and the interaction with our treatment. We did not find differences, as shown in Annex Table A.14. However, statistical power was low, because the degree of crossover between the treatment and the other programs was very low. This implies large standard errors for estimation of the interaction effect. We are therefore unable to reject any hypotheses about the interaction.
5.4 Evaluation-Driven Effects
Social experiments are often exposed to the risk of evaluation-driven effects that can hinder the identification of program impacts. The mere fact of being part of an evaluation can motivate individuals to change their behavior. In the case of the Teacher Feedback and Coaching program, there is clear scope for Hawthorne effects because data collection requires the presence of an outside observer in the classroom, which is out of the ordinary in Brazilian schools.
Teachers in both the treatment and control schools are likely to try to exhibit their best teaching practice, perhaps moreso during the endline round of observations if they believe they are being compared to an earlier observation. Teachers in the treatment schools were especially susceptible to evaluation-drive
12 This intervention was designed by University of Sao Paulo researchers and was financed by the Itau Social Foundation. 13 The Unibanco Institute developed this program. The 4 different waves of the program have slightly different designs.
32

effects. Over the 2015 school year, they were observed several times and received feedback from their pedagogical coordinators. At endline, they had a much better idea than teachers in control schools of why someone is coming to observe them and what things the observer will measure. They were also more knowledgeable about what good classroom practice is and how important it is to use class time effectively and keep students engaged.
Observer teams did report multiple instances where students commented after class that the teacher had repeated the previous day’s lesson. On the other hand, observers trained in the Stallings method generally concur that it is difficult for any teacher to sustain unfamiliar teaching practices for a full class hour or 100 minutes. Indeed, the results show that even where teachers improved the efficiency of classroom administrative processes and freed up more time for instruction, they were not able to sustain interactive question and answer/discussion activities during all of this incremental time. Treatment schools also increased the share of class time that students spent “copying”, either from the blackboard or textbooks.
Hawthorne effects can be expected to introduce some upward bias into the Stallings measures of classroom dynamics at any point. Nevertheless, while there is no reason to suppose a differential effect on control and treatment schools at baseline, we can clearly expect differential effects at the endline. This would imply, at least, a boundary expansion of the treatment group’s improvement in classroom practice due to the upward bias. 14
On the other hand, we do not expect any Hawthorne effects on key student outcome measures. It is implausible that any change in students’ test scores could be the result of one day during the school year when the teacher was observed and changed her practice. Since there are other teachers characteristics that can affect teacher-students interaction, such as teachers’ content mastery and lack of incentives to improve teaching, we have to be cautious about the interpretation of the effect of the program on student learning. In the final version of this paper, we will be able to compare student learning outcomes for treatment and control groups and also for the 50 schools from the original randomization that were never observed and thus can be considered a pure control group.
6. Conclusions
Middle-income developing countries in Latin America such as Brazil are investing heavily in education but face big challenges in raising student learning. The eight Latin American countries that participated in the 2012 PISA exam defined the bottom of the performance distribution for the 65 country-sample and were outscored by some countries with much lower per capita income. Brazilian 15 year olds scored 100 points below the OECD average in math, implying a lag of two full years in math skills.
A compelling body of global evidence now shows that teachers’ effectiveness is the key in-school determinant of student learning and Brazil, like other countries, is looking for strategies to raise teacher effectiveness. Several studies have documented the low academic caliber of Brazilian teachers and the prevalence of ineffective classroom practice. On PISA, 15-year olds who describe themselves as future teachers score 50 points below the national average and 100 points below future engineers in math; on the University of Sao Paulo entrance exams, the highest scoring teacher-education candidates perform below the lowest-scoring medical school entrants. Classroom observation research supported by the World Bank in Brazil (Bruns and Luque, 2014) suggests that teachers’ failure to use class time effectively, heavy reliance on traditional “chalk and talk” teaching methods, and inability to keep students engaged may be important factors in repetition, dropout and low learning outcomes.
The Northeast state of Ceará is one of Brazil’s poorest states, but it has a tradition of progressive experimentation in education that has led its education outcomes (student learning and graduation rates) to rank 13th out of 27 states in 2014 on the Brazilian national index of education quality. To improve the effectiveness of its almost 20,000 secondary school teachers – and to build evidence on the cost-effectiveness of a novel training approach – Ceará’s education secretariat in 2015 implemented a randomized trial of a
14 Muralidharan and Sundararaman (2011) found a significant Hawthorne effect on teacher behavior in a bonus pay program in India, but no Hawthorne effect on student learning. The authors assumed that - due to teachers’ knowledge that they were in a study; they temporary increased their classroom activity when under observation by enumerators.
33

program that combined benchmarked feedback to teachers about their classroom practice with access to high-quality coaching support throughout the school year.
The design of the program was inspired by the research evidence, both from classroom observations of teacher practice and research on teacher value-added, of large variations in teacher quality within schools. Leveraging the teaching skills that exist within schools by promoting greater collaboration and exchange of practice among teachers offers a low-cost strategy for raising teachers’ effectiveness. The Ceará program had two core elements: providing an “information shock” to schools, by giving teachers benchmarked feedback about their teaching practice from standardized classroom observations using the Stallings instrument, and access to a one-year coaching program, delivered through ongoing skype interactions with a high skill team of trainers. The information shock was intended to show schools they had room for improvement as well as to identify some of the individual teachers (identified by the subject and hour of the class they taught rather than by name) who managed class time most effectively, used interactive (question and answer) teaching practices, and kept students engaged. The coaching program aimed at turning the pedagogical coordinator in each school into a stronger resource for school improvement, by developing her ability to observe teachers’ classroom practice and provide useful feedback, and to promote collaboration and exchange of practice among teachers.
Because the Secretariat was not interested in a small pilot program, the first year implementation plan was designed to reach about one-third of the state secondary schools, with the expectation that if evaluation results were positive, it would be extended to remaining schools in the 2016 and 2017 school years. Implementation of the program at scale (in over 150 schools) was possible because of the its relatively low costs, as the high-skill coaching support is delivered via skype calls.
To assess program impact rigorously, a stratified representative sample of 350 schools was randomly assigned into treatment and control groups of 175 schools each. Because of a shortage of observers and the reluctance of some observers to visit schools in Fortaleza’s slum areas, the final number of schools observed was 156 treatment and 136 control schools. Despite the uneven attrition, a full set of school, student and teacher demographic and background characteristics, as well as student outcomes, as well as baseline classroom observation variables showed that the final treatment and control groups were balanced on observables. A set of additional tests described in Section 4, to check for possible bias on unobservables, provided reassurance that bias in the sample was unlikely.
Monitoring data show that pedagogical coordinators in the program schools did increase the amount of time they spent observing teachers and giving them feedback. At baseline, coordinators reported that they did not do this routinely; reports compiled by the coaches shows that all 175 pedagogical coordinators in the program conducted at least 03 observations and 03 feedback sessions with every teacher in the school. A test applied at endline showed that 88% of the pedagogical coordinators had a good understanding of the importance of maximizing instructional time, as well as specific techniques for planning effectively paced lessons and keeping students engaged, such as “cold calling”.
The feedback and coaching program produced a statistically significant .26 SD increase in time on instruction. Program schools’ teachers increased time on instruction to 77% of each class, compared with 70% in control schools. This may not sound large, but it implies 21 more minutes of instruction across six classes per day and 70 more hours – close to three additional weeks of teaching – per year. Differences of this magnitude, all other things equal, can be expected to have consequences for student learning.
Teachers in the program schools freed up time for instruction by reducing the time they spent on routine classroom administrative processes (taking attendance, cleaning the blackboard, passing out papers) and especially by reducing their time off task. Time spent on classroom management fell to 17% of class time in program schools, compared with 21% in control schools, a -.17 SD larger change. Time off-task fell from to 5.5% of total time, a -.21 SD larger decline than in control schools. The biggest driver was less time absent from the classroom. Teachers in the program schools also increased their use of questions during their lessons, consistent with the coaching program’s goal of encouraging more interactive teaching practice, although lecture/demonstration continued to be the dominant teaching mode. They also kept students more engaged. Program schools achieved a -.11 SD larger decline in the share of time that a large group of students (six or more) was visibly off-task while the teacher was teaching. The only dimension in which treatment schools’
34

improvement was not statistically significant was the share of time on instruction with all students engaged. Although the data show that a few program schools achieved some impressive gains in this indicator (see box plot Figure 5), many schools, both treatment and control, continued to average less than 20% of class time with the entire class engaged. Positive changes in teacher practice were slightly more pronounced for the 77% of classrooms where the November 2015 repeat observation “matched” – in terms of subject, grade and time of day -- the November 2014 one. Because teachers remained anonymous, this does not guarantee that the same teacher was observed both times, but that may be the case for a high share of the classrooms. Teachers in the matched subsample showed a .28 SD increase in time on instruction vis a vis control schools, a -.20 SD reduction in classroom management, and a -.14 SD decline in time with a big group of students off task. (Table 7, p. 29) Finally, consistent with the core goal of getting teachers within the school to learn from each other, the program reduced the variation in teacher practices within schools. Compared with the control schools, the program schools saw a -.22 SD larger decline in the variation in time on instruction, meaning that teachers within schools began achieving more consistent practice. In conclusion, the evidence thus far suggests that providing schools with concrete, benchmarked feedback about their teaching practice plus access to high quality coaching support can produce significant improvements in teachers’ time on instruction and ability to keep students engaged over the course of just one school year. The program appears to have helped schools achieve more consistent teacher practice and increase teachers’ use of more interactive pedagogical techniques, such as question and answer. However, the possibility that the changes measured in the program schools are inflated by Hawthorne effects cannot be discounted. Over the course of the 2015 school year, teachers in the program schools learned about the Stallings instrument, the behaviors that it measures, and what an external observer visiting in the classroom would be looking for, while control schools gained none of this perspective. More substantively, teachers in the treatment schools learned, from the coaches and resource materials such as the Aula Nota 10 book, about the importance of maximizing instructional time and keeping students engaged, and were encouraged to try a wide range of specific techniques for planning and delivering more effective lessons. It is likely that both factors contributed to the ability of teachers in the program schools to demonstrate markedly better time on task, student engagement and pedagogical practice in the endline round of observations, but it is impossible to disentangle them. Pedagogical coordinators working in Ceará, like those who have conducted Stallings classroom observations in other settings, tend to agree that it is not easy for teachers to sustain an unfamiliar teaching technique for an entire class hour. However, the Ceará data show that teachers used their increased time on instruction largely for familiar practices, such as lecture/demonstration and copying. Even though the increase in these program teachers’ use of question and answer was significantly higher than in control schools, it was relatively small in absolute terms. Student test scores for the 2015 school year (expected by June 2016) will provide critical evidence on the extent to which the program generated changes in teachers’ practice that were significant enough and sustained enough to have an impact on their students’ learning. It is highly encouraging that schools responded to the Stallings feedback they received at the start of the 2015 school year with universal uptake of the coaching program. It is also encouraging that unmistakable changes in critical dimensions of teachers’ practice vis a vis the control schools are confirmed in the endline observations. This evaluation is the first developing country study to generate rigorous evidence on the impact of a teacher development program aimed at improving teachers’ classroom practice. Prior to this experiment, it was unknown how much variation in the measures of classroom dynamics captured by the Stallings instrument was even possible over the course of a single school year. If student learning outcomes in the program schools show improvement vis a vis the control schools, it will indicate that the feedback and coaching produced genuine improvements in teachers’ instructional time and practice and that these had an impact on students’ learning. The absence of learning gains will leave open two hypotheses: i) teacher practice observed at endline was largely or wholly evaluation-induced and not sustained enough during the school year to affect students’ learning; or ii) even if the improvements in teacher practice observed at endline were genuine, teachers’ use of time for instruction – at least in this range – is not the binding constraint on learning outcomes. Either way, the evaluation will make an important contribution
35

to the almost non-existent experimental evidence base on teacher effectiveness in middle-income developing countries.
36

References
Abadzi, H. (2009). Instructional Time Loss in Developing Countries: Concepts, Measurement, and Implications. World Bank Research Observer, 24(2).
Angrist, J. D., G. W. Imbens, and D. B. Rubin (1996). Identification of Causal Effects Using Instrumental Variables," Journal of the American Statistical Association, 91, 444{455.
Angrist, J., Bettinger, E., Bloom, E., King, E., & Kremer, M. (2002). Vouchers for Private Schooling in Colombia: Evidence from a Randomized Natural Experiment. American Economic Review, 92(5), 1535-1558.
Araujo, M. C., Carneiro, P., Cruz-Aguayo, Y., & Schady, N. (2014). A helping hand? Teacher quality and learning outcomes in kindergarten. Banco Interamericano de Desarrollo, Washington, DC. Inédito.
Bruns, B., & Luque, J. (2014). Great teachers: How to raise student learning in Latin America and the Caribbean. World Bank Publications.
Chetty, R, J. N. Friedman, and J. E. Rockoff. (2014). “Measuring the Impacts of Teachers I: Evaluating Bias in Teacher Value-Added Estimates.” American Economic Review, vol. 2014, nº 9, p. 2593-2632.
DeStefano, J., E. Adelman, and A.-M. Schuh Moore. (2010). Using Opportunity to Learn and Early Grade Reading Fluency to Measure School Effectiveness in Nepal. Washington, DC: EQUIP2, AED, and USAID.
Easton, L. B. (2008). From professional development to professional learning.Phi Delta Kappan, 89(10), 755.
Fryer Jr, R. G. (2013). Information and student achievement: evidence from a cellular phone experiment (No. w19113). National Bureau of Economic Research.
Fullan, M., N. Watson, and S. Anderson. (2013). Ceibal: Next Steps. Toronto: Michael Fullan Enterprises, http://www.ceibal.org.uy/docs/FULLAN-Ceibal-English.pdf.
Glennerster, R., & Takavarasha, K. (2013). Running randomized evaluations: A practical guide. Princeton University Press.
Grossman, P., and S. Loeb, J. Cohen, K. Hammerness, J. Wyckoff, D. Boyd, and H. Lankford. (2010). “Measure for Measure: The Relationship between Measures of Instructional Practice in Middle School English Language Arts and Teachers’ Value Added Scores.” NBER Working Paper 16015.
Boyd, D., P. Grossman, H. Lankford, S. Loeb, and J. Wyckoff. (2008). “Who Leaves? Teacher Attrition and Student Achievement”. Working Paper 14022, National Bureau of Economic Research, Cambridge, MA.
———. (2009). “Teacher Preparation and Student Achievement”. Educational Evaluation and Policy Analysis 31 (4): 416–40.
Boyd, D., P. Grossman, H. Lankford, S. Loeb, and J. Wyckoff. (2006). “How Changes in Entry Requirements Alter the Teacher Workforce and Affect Student Achievement.” Education Finance and Policy 1 (2): 176-216.
Hanushek, E., and S. Rivkin. (2010). “Using Value-Added Measures of Teacher Quality.” Policy Brief 9, National Center for Analysis of Longitudinal Data in Education Research, Washington, DC.
Hanushek, E. A., and S. G. Rivkin. (2006). “Teacher Quality.” In vol. 2. of Handbook of the Economics of Education, edited by F. Welch, 1051–78. Amsterdam: North-Holland.
Heckman, J. J. (1979), “Sample Selection Bias as a Specification Error,” Econometrica, 47, 153-161.
Howes, C., and M. Burchinal, R. Pianta, R., D. Bryant, D. Early, R. M. Clifford, and O. Barbarin. (2008). “Ready to Learn? Children’s pre-academic achievement in pre-kindergarten programs.” Early Childhood Research Quarterly, 23, 17-50.
37

Jackson, C. Kirabo, J. Rockoff and D. O. Staiger. (2014). “Teacher Effects and Teacher-Related Policies.” Annual Review of Economics 6:34. 1-34.
Jennings, J. L., and T. A. DiPrete. (2010). “Teacher Effects on Social and Behavioral Skills in Early Elementary School.” Sociology of Education, April 2010 83: 135-159.
Jukes, M., S.B. Vagh, and Y.S. Kim. (2006). “Development of Assessments of Reading Ability and Classroom Practice”. Unpublished manuscript. World Bank, Washington, D.C.
Kane, T. J., J. E. Rockoff, and D. O. Staiger. (2008). “What Does Certification Tell Us about Teacher Effectiveness? Evidence from New York City.” Economics of Education Review 27 (6): 615–31.
Kane, T. J., and D. O. Staiger. (2008). “Estimating Teacher Impacts on Student Achievement: An Experimental Evaluation.” Working Paper 14607, National Bureau of Economic Research, Cambridge, MA.
Lee, D. S. (2009). Training, wages, and sample selection: Estimating sharp bounds on treatment effects. The Review of Economic Studies, 76(3), 1071-1102.
Lee, D. S. (2002). Trimming for Bounds on Treatment Effects with Missing Outcomes, Working Paper 51.
Lemov, D. (2010). Teach Like a Champion. San Francisco: Josey Bass.
Lemov, D. (2011). Aula Nota 10. Sao Paulo. Fundacao Lemann.
Mourshed, M., C. Chijioke, and M. Barber. (2011). How the World’s Most Improved School Systems Keep Getting Better. Londres: McKinsey.
Muralidharan, K., & Sundararaman, V. (2010). The Impact of Diagnostic Feedback to Teachers on Student Learning: Experimental Evidence from India*. The Economic Journal, 120(546), F187-F203.
Miguel, E., & Kremer, M. (2004). Worms: identifying impacts on education and health in the presence of treatment externalities. Econometrica, 72(1), 159-217.
OECD (Organisation for Economic Co-operation and Development). (2005). Teachers Matter: Attracting, Developing and Retaining Effective Teachers. Paris: OECD Publishing.
———. (2009). “Teaching Practices, Teachers’ Beliefs and Attitudes.” In Creating Effective Teaching and Learning Environments: First Results from TALIS, 88–120. Paris: OECD Publishing.
———. (2010). Vol. 1 of PISA 2009 Results: What Students Know and Can Do—Student Performance in Reading, Mathematics and Science. Paris: OECD Publishing.
———. (2013a). Education at a Glance 2013: OECD Indicators. Paris: OECD Publishing.
http://dx.doi.org/10.1787/eag-2013-en.
———. (2013b). Vol. I of PISA 2012 Results: What Students Know and Can Do—Student Performance in Mathematics, Reading and Science. Paris: OECD Publishing. http://www.oecd-ilibrary.org/education/pisa-2012-results-what-
Rivkin, S. G., E. A. Hanushek, and J. F. Kain. (2005). “Teachers, Schools, and Academic Achievement.” Econometrica 73 (2): 417–58.
Rockoff, J. E. (2004). “The Impact of Individual Teachers on Student Achievement: Evidence from Panel Data.” American Economic Review 94 (2): 247–52.
Rockoff, J. E., B. A. Jacob, T. J. Kane, and D. O. Staiger. (2011). “Can You Recognize an Effective Teacher When You Recruit One?” Education Finance and Policy 6 (1): 43–74.
38

Schuh Moore, A.-M., J. DeStefano, and E. Adelman. (2010). Using Opportunity to Learn and Early Grade Reading Fluency to Measure School Effectiveness in Ethiopia, Guatemala, Honduras, and Nepal. Washington, DC: EQUIP2, AED, and USAID.
Stallings, J. A. (1977). Learning to look: A handbook on classroom observation and teaching models. Belmont, CA: Wadsworth Publishing.
Stallings, J. A., e Mohlman, G. G. (1990). Issues in qualitative evaluation research: Observation techniques. In H. J. Walberg & G. D. Haertel (Eds.), The international encyclopedia of educational evaluation (pp. 639-644). New York: Pergamon Press.
Liang, X. (2015). How Shanghai Does It: Scoring Highest in the Programme for International Student Assessment. World Bank.
World Bank. (2014). Conducting Classroom Observations Using the Stallings Classroom Snapshot Method: Manual and User Guide. Washington, DC: World Bank.
39

Appendix
Figure A1: Classroom dynamics info-graphic “Bulletin” – 1st Round – Page 1
Figure A2: Classroom dynamics info-graphic “Bulletin” – 1st Round – Page 2
40

41

42

Table A1: Classroom dynamics characteristics at baseline and endline
Figure A4: Kernel density – Main summary variables
43

Figure A5: Cumulative distribution – Main summary variables
44

Table A2: Mean effect sizes on instructional activities
45

Table A3: Mean effect sizes on classroom management activities
Table A4: Mean effect sizes on teachers off-task activities
46

Table A5: Mean effect sizes on instructional activities with all students engaged
Table A6: Mean effect sizes on big group (>6) of student off-task
Table A7: Mean effect sizes on the use of materials
47

Table A8: Intra-school variation on instructional activities
Table A9: Intra-school variation on classroom management activities
48

Table A10: Intra-school variation on teachers off-task activities
Table A11: Intra-school variation on instructional activities with all students engaged
Table A12: Intra-school variation on big group (>6) of student off-task
49
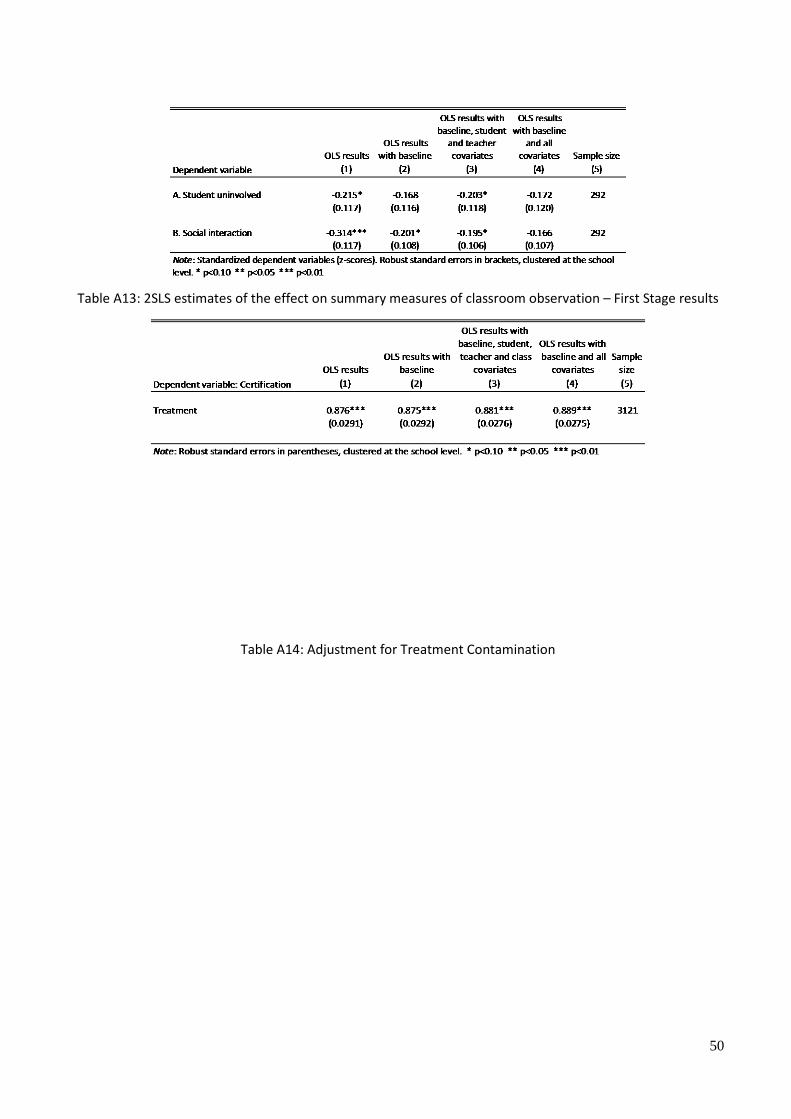
Table A13: 2SLS estimates of the effect on summary measures of classroom observation – First Stage results
Table A14: Adjustment for Treatment Contamination
50

ANNEX
ACTIVITIES IN CLASS
Reading aloud: The teacher or one or more students are reading aloud. One or more students are reading from a textbook, the Blackboard, your own wording or reproduced material. The teacher or student can also read aloud while the rest of the class follows him in his own texts.
Exhibition and demo: In general, the / the teacher is introducing new material of study to students.
Questions and answers, Debate/discussion: Students and/or the / the teacher interacting in an academic discussion is, a verbal exchange of ideas or opinions or a discussion about something academic as the exercises assigned by the teacher.
Practice and memory: Activities that are undertaken with the aim of memorizing material as the multiplication tables, spelling or vocabulary.
Task/homework: One or more students are writing essays, solving mathematical exercises, doing an activity in their notebooks, or are engaged in other work of writing in their seats or on the Board.
51

Copying: Students are copying from the Blackboard, textbook, or other material.
Verbal instruction: The teacher is verbally assigning work expected for the next activity to develop in class or as a task for the home.
Not involved student: If a student is looking out the window, resting his head on desk or sleeping, this category is registered as a student not involved.
Discipline: One or more students are disciplined for their behavior or are sent outside the classroom for disciplinary reasons.
The class management: The / the teacher and/or students participating in the management of class: passing roles, changing activities, keeping materials, preparing to depart.
Management of the class if only: Only the teacher is engaged in the activity of classroom management: distributing tasks, changing activities, keeping materials, preparing output.
Social teaching or teacher involved no interaction: Teacher and another person (director, community members, other teachers, parents, a visitor) are interacting.
Teacher outside the classroom: The teacher is not present in the classroom during the 'snapshot'.
MATERIALS USED IN CLASS
Without material: No type of material is not being used in the classroom.
Text book: This category refers to printed material that students don't write on directly. Includes textbooks, anthologies and periodicals, photocopies, magazines or newspapers.
Notebooks/elements of writing: This category refers to the materials with which students work and write. For example: notebooks; workbooks; worksheets; libretti of sheets of blank paper in which students solve problems, written answers or write essays and stories.
Black Board: Blackboards, White boards or similar.
Teaching materials: This category includes Visual aids and manipulables which use teachers to accompany the teaching and improve student understanding. Teaching materials include presentation in Power Point, maps, films, graphics, photos, posters, transparencies in projector and slides, and other materials such as those used in experiments, instruments, rules, bars, blocks, cards with drawings or phrases, sticks, ribbons, or models of human bodies.
ICT (information and communication technology): Electronic components used to support learning such as radios, televisions, videos and computers are included in this category.
Cooperative: This category is logged when students work together in small and large groups to produce a common or shared product. Does not constitute a material in strict sense.
52