tif overview - rochester, mn
TRANSCRIPT

What is TIF?
• TIF is a method of financing public and qualifying improvements from the increased property taxes generated from new development that would not occur “but for” the assistance provided.
• The difference between the existing property taxes on a parcel of land which are divided among the county, city, and school district and the increased property taxes generated from the new development, which is used exclusively by the authority (City) for a term of years to finance public or qualifying improvements is known as the tax increment.
TIF Overview


For What Purposes can TIF revenues be used?
There are limitations on their use by the Statutes governing TIF. Revenues can generally be used for the following :
1. Acquisition of land and buildings.2. Site improvements or preparation costs such as demolition and abatement.3. Installation of public utilities or other improvements, such as parking, streets and
sidewalks, storm sewers, skyways.4. Interest on TIF Notes / Bonds5. Administrative costs6. Outstanding principal amount of bonds issued to finance the project costs.
TIF Overview

Why Use TIF?
• Stimulates development and may be used to encourage development types
(i.e. affordable housing, redevelopment, economic development).
• Facilitates infrastructure improvements.
• Enhance the City tax base.
• The projects create many short-term construction jobs and long-term jobs.
• Coordinate new development with existing plans
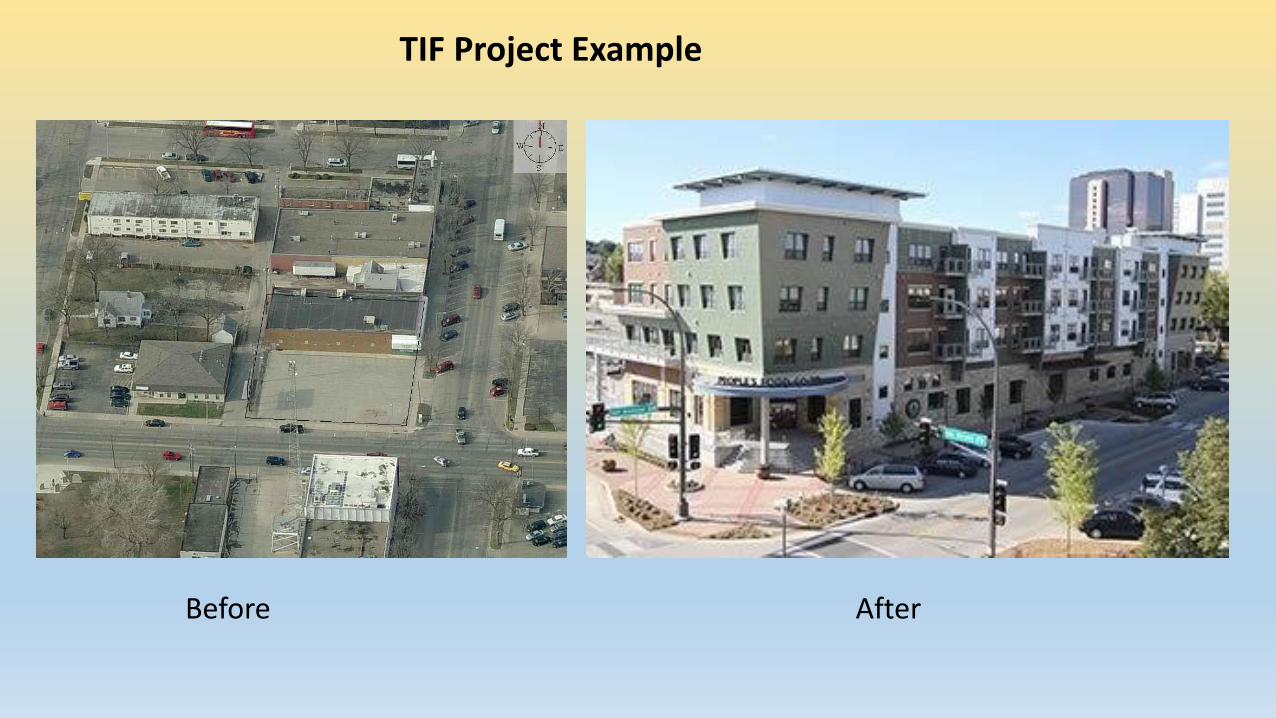
TIF Project Example
Before After

YEAR CITY TAX CAPACITY
CAPTURED TAX
INCREMENT
% OF CAPTURED TIF
TAX CAPACITY
2004 69,990,826$ 3,138,517$ 4.48%
2005 79,210,426$ 1,106,216$ 1.40%
2006 86,117,454$ 1,134,097$ 1.32%
2007 91,771,403$ 1,204,141$ 1.31%
2008 96,482,698$ 1,405,611$ 1.46%
2009 103,866,962$ 1,561,049$ 1.50%
2010 106,415,330$ 1,754,288$ 1.65%
2011 106,709,654$ 1,713,705$ 1.61%
2012 100,470,797$ 2,299,148$ 2.29%
2013 100,881,956$ 2,299,148$ 2.28%
2014 103,677,566$ 2,050,400$ 1.98%
2015 108,477,905$ 1,755,583$ 1.62%
2016 113,735,871$ 1,764,449$ 1.55%
2017 124,901,503$ 1,936,107$ 1.55%
2018 133,995,166$ 2,042,663$ 1.52%
NOTE: 2004 WAS LAST YEAR OF DOWNTOWN TIF DISTRICT COLLECTIONS
SOURCE: ANNUAL CITY COMPREHENSIVE ANNUAL FINANCIAL REPORT
ROCHESTER % ANNUAL CAPTURED TIF TAX CAPACITY

4.48%
1.40%1.32% 1.31% 1.46% 1.50%
1.65%1.61%
2.29% 2.28%1.98%
1.62% 1.55% 1.55% 1.52%
0.00%
0.50%
1.00%
1.50%
2.00%
2.50%
3.00%
3.50%
4.00%
4.50%
5.00%
2004 2005 2006 2007 2008 2009 2010 2011 2012 2013 2014 2015 2016 2017 2018
% OF CAPTURED TIF TAX CAPACITY

CITY
2015 % CAPTURED TIF TAX
CAPACITY
2016 % CAPTURED TIF TAX
CAPACITY
Minneapolis 7.79% 8.12%
St. Paul 9.07% 9.24%
Duluth 3.11% 2.27%
St. Cloud 1.32% 1.32%
Bloomington 12.37% 14.52%
Rochester 1.61% 1.55%
Source: League of Minnesota Cities 2016 Property Tax Data Report
Comparison of Other Minnesota Cities % of Captured TIF Tax Capacity

Future Estimates of City’s Tax Capacity in TIF Districts

2019 Est. TIF Tax Capacity
1st Avenue Flats 22,069$
Flats on 4th 144,814$
Lofts @ Mayo Park 45,498$
Valleyhigh Flats 35,400$
247,781$
2020 Est. TIF Tax Capacity
River Glen Apts. 155,762$
Miracle Market 217,974$
373,736$
2021 Est. TIF Tax Capacity
Eastgate Apts. 53,244$
Alatus (Berkman Apts.) 962,250$
Urban on 1st 369,750$
Riverwalk Apts. 239,700$
Residences @ Discovery Square 281,866$
Mortenson Discovery Square Project 340,100$
Armory project 29,000$
Harvestview Apts. 42,916$
Hyatt House (Legion property) 495,250$
Hotel Indigo 257,354$
Wells Fargo Renovation 167,266$
3,238,696$
2023 Est. TIF Tax Capacity
Bloom Riverfront Project 1,943,530$
Total Estimated TIF Tax Capapcity 5,803,743$
Future Years Estimate of TIF Tax Capacity Increase

TIF Policies• Prior to 1990, the City’s TIF Policies related only to downtown development. In 1990, the TIF Policies were
amended to include non-downtown development. Those policies included a private to public investment ratio guideline of 4-8:1. The policies were more focused on economic development projects with job creation and also contained payback provisions related to the job creation.
• In 1999, the TIF Policies were amended to further expand the housing related goals of the City. The policies also emphasized the “PAYGO” financing vs. “up front” assistance to projects.
• In 2007, the Policies were updated to include language related to the use of tax abatements and emphasized an 8:1 private to public investment ratio.
• In 2017, the TIF Policies were amended to more specifically prioritize the use of TIF, better define goals for the level of assistance for Housing TIF Districts and Redevelopment private to public investment ratio ( 10:1 guideline). The 2017 amendments also includes language on inclusion of affordable units in mixed use Redevelopment projects or a set aside of 5% of the increments for affordable housing purposes. Also includes requirements related to relocation assistance.

LOOKING AHEAD
• TIF Use & Prioritization• Are current TIF priorities still valid?• Further refinement for targeting specific types of uses, i.e Bioscience?
• Other Potential TIF Policy Changes• Sustainability Requirements consistent with DMC on a Citywide basis?
• Based upon certain level of assistance?
• Others?