tijeras/roosevelt mid school ambient air monitoring project
TRANSCRIPT
Tijeras/Roosevelt Mid School Ambient
Air Monitoring Project
Fiscal Year 2004 Special Project
City of Albuquerque Environmental Health Department
Air Quality Division November 2004
Prepared by Louis Jaramillo MS, MPH
EOTA Section [email protected]
505-767-5621

Final Draft
2
Executive Summary
In February of 2002 the Air Quality Division of the City of Albuquerque’s Environmental Health Department received a request from a parent to investigate the air quality around Roosevelt Middle School. The parent alleged that the emissions from a nearby cement plant were exacerbating the child’s asthma. The village of Tijeras, NM is located in close proximity to Grupo Cementos de Chihuahua (Cement Plant). Roosevelt Middle School and A. Montoya Elementary School are located in the village and are within ½ mile northwest of the plant. The village and schools are located in a canyon between the Sandia and Manzano Mountain ranges. The village of Tijeras and schools are also located in close proximity to a major freeway with heavy diesel truck traffic. During the course of numerous public meetings, parents, staff and some Tijeras residents expressed concerns that emissions from the plant were making them sick. School employees and parents of students attribute many respiratory and dermal illnesses occurring in the school to the plant. The schools and village are also located in a narrow valley. Parents and school staff are concerned about any toxics the plant may be emitting and a possibility that cement dust is being emitted in large enough amounts to cause health problems. The community consensus was that more comprehensive studies be conducted to address their concerns about the health burden related to their exposure to ambient pollutants. With the communities backing the City’s Air Quality Division received special funding from the EPA to conduct an ambient air monitoring assessment on the Roosevelt mid-school campus.
Although the plant contributes emissions to the ambient air, the ambient air monitoring data collected at Roosevelt did not measure elevated levels of criteria pollutants. Inter-data comparisons with other City of Albuquerque ambient air monitoring network stations indicated that the overall criteria and non-criteria pollutant levels measured in Tijeras were much less. The amount and type of pollutants appear to be more consistent with those from automotive traffic.

Final Draft
3
Table of Contents
Problem Description…………………………………………………………………………………………4
Project Collaborators………………………………………………………………………………………..5
Monitoring Site Description…………………………………………………………………………………5
Monitoring Plan objectives………………………………………………………………………………….6
Monitoring Results…………………………………………………………………………………………..7 NO…………………………………………………………………………………………7 CO………………………………………………………………………………………….8 Particulate Matter…………………………………………………………………………9 Black Carbon……………………………………………………………………………13 Hazardous Air Pollutants……………………………………………………………….14 Heavy Metals……………………………………………………………………………16
Discussion of findings……………………………………………………………………………………..17
Acronyms and definitions used in this report…………………………………………………… …….19
Figures Figure 1: Tijeras overview…………………………………………………………………….………...4 Figure 2: Potential Monitoring Sites…………………………………………………………..………..5 Figure 3: Monitoring Station and External Equipment…………………………………….….………6 Figure 4: Monitoring station in relation to plant………………………………………….…...…….…6 Figure 5: Monitoring equipment……………………………………………………………….………..7 Figure 6: One hour NOx………………………………………………………………….….….……….7 Figure 7: CO Raw Data…………………………………………………………………….…...……….8 Figure 8 CO Max value Comparison…………………………………………………….……..……...8 Figure 9: 2002 PM10 Study………………………………………………………………….……….…9 Figure 10: PM10 Comparison ……………………………………………………………….……...…..9 Figure 11:East Mountain High PM 10 Days…………..……………………………………..………...10 Figure 12: Wind Rose for High PM 10 Days…………………………………………………………..10 Figure 13: Roosevelt Mid School 2002 Wind Speed and PM 10 …………………….………….…11 Figure 14: March 2004 Wind Speed and PM10………………………………………………………12
Figure 15: PM2.5 Comparison…………………….………………………………………..……….…12 Figure 16: Network sites 24 hr comparison for PM 2.5 …………………………………..…………13 Figure 17: One hour Black Carbon…………….………………………………………………………13 Figure 18: Black Carbon Daily Comparison…………………………………………………….….…14
Figure 19 HAPs measurement 3/04/04…………..…………………………………………………...14 Figure 20 HAPS measurement 3/16/04…………..………………………………………….………15 Figure 21: HAP’s Comparison 4/9/04……….…………………………………………………….….15 Figure 22: Heavy Metals……….………………………………………………………………….……16 Figure 23: Heavy Metal Comparison……………………………………………………….…………17

Final Draft
4
Report of Tijeras/ Roosevelt Mid School Ambient Air Monitoring Project
This project was funded by the U.S. Environmental Protection Agency (EPA) Region 6 as part of the fiscal year (FY) 2004 Clean Air Act (CAA) funds allocation.
PROBLEM DESCRIPTION The village of Tijeras, NM is located in close proximity to a cement plant (Plant) owned by Groupo
Cementos de Chihuahua (GCC). Roosevelt Middle School and A. Montoya Elementary School are located in the village and are approximately ½ mile northwest of the plant. The village and schools are located in a canyon between the Sandia and Manzano Mountain ranges. The village of Tijeras and the schools are also located in close proximity to Interstate 40, a major freeway with heavy diesel truck traffic. The vegetation is mostly pinon, juniper, and riparian flora around a stream flowing through the canyon. During the winter months, many residents use wood burning stoves and fireplaces for heat. An overview of the area is shown below:
Figure 1
Cement Plant
South 14 A. Montoya Elem.
Roosevelt Mid School
Mining area
Interstate-40
School and Community Concerns
Roosevelt parents and school staff approached the City of Albuquerque’s Air Quality Division (AQD) in March of 2002 alleging that emissions from the plant were causing illness among the staff and children. School employees and parents of students attribute many respiratory and dermal illnesses occurring at the school to the Plant. The schools and village are also located in a narrow valley that is subject to inversions that could concentrate pollutants. Parents and school staff are concerned about any toxics the plant may be emitting and a possibility that cement dust is causing skin rashes and respiratory illnesses. The pollutants of concern provided by the parents and school staff are as follows: Pollutants from the Cement Plant Hydrogen chloride; Benzene; Sulfur Di- and Tri-Oxide; Ammonia , Manganese ; Methylene chloride; Chloromethane; Chromium ; Silica; Oxides of Nitrogen (NOx); Carbon Monoxide (CO); Dioxin; Aluminum Pollutants from Diesel vehicles Benzene ; Hexane; Formaldehyde ; Mercury; Arsenic ; Chromium; Furans To date, a few studies have been done to assess select criteria air pollutants in the area, other than primarily particulate matter (PM10 and 2.5). After a series of public meetings, the community requested that more comprehensive studies be conducted to address their concerns about the potential health burden related to their exposure to ambient pollutants. Data acquisition was a first step in determining if there is an ambient air pollution problem around the schools and the Tijeras Community.

Final Draft
5
Project collaborators EPA Region 6 This monitoring project is the result of a grant from the U.S. EPA Region 6 through the State and Tribal Operations Section. Also participating in the project is the Region 6 Toxics Coordinator. The EPA Air Quality Analysis Section is in charge of reviewing and approving quality assurance documents, evaluating project methods and system performance, and making available relevant technical and quality assurance information to the AQD and the Scientific Laboratory Division (SLD). Air Quality Division (AQD) The AQD’s Ambient Air Monitoring Section set up, calibrated, and maintained monitoring equipment in a trailer in the vicinity of the schools. Staff also utilized canister sampling for toxics and delivered the samples to the SLD. The AQD updated and submitted an appropriate Quality Assurance Project Plan (QAPP’s) that were approved by Region 6 staff. The AQD’s Quality Assurance staff is responsible for validating the data and finally uploading the acquired data to the Air Quality Subsystem. New Mexico Department of Health Scientific Laboratory Division The AQD and SLD have an established working relationship. The Organics Section performed US EPA Organic Compendium Method 15 (TO-15 for volatile hazardous air pollutants) sample analysis for compounds listed by US EPA Pilot Toxics Assessment. The Air and Heavy Metals Section was responsible for filter preconditioning and weighing of the 47mm PM2.5 filters and the 8” X 10” Total Suspended Particulate filters. The Air and Heavy Metals Section also analyzed the exposed filters using the US EPA Inorganic Compendium Method 3 for metals as conducted in the Pilot Toxics Assessment. Albuquerque Public Schools (APS) APS provided electrical power and a chain link fence enclosure on the school premises to secure the monitoring trailer and equipment. Other Collaborators Other collaborators include the environmental manager at the cement plant (Grupo Cementos de Chihuahua) and the staff and parents of children at Roosevelt Middle School (RMS).
Monitoring Site Description The major criteria for site location was accessibility for servicing equipment and location on the school grounds that would best assess the concentrations the students are exposed to. Four locations were identified as potential ambient air monitoring stations locations. An overview of the potential sites is shown in Figure 2: Figure 2
1
2
4
3
Site 1: South Fence line of School Property Site 2: Previous monitoring site by industrial arts building Site 3: Bus drop off between A. Montoya and RMS Site 4: City of Albuquerque sewer-lift station The consensus of all parties involved was that Site 1 was the preferred monitoring location

Final Draft
6
Monitoring Plan Objectives
Pollutants of concern and corresponding monitoring equipment are listed as follows:
Carbon Monoxide – Help with understanding combustion related sources and patterns. Oxides of Nitrogen – Help with understanding combustion related sources and patterns. Aethalemeter – Help understand Black Carbon and Organic Carbons Contributions Nephelometer – Help with visibility impairment correlations to Particulate Matter PM10 – Continuous Direct measure of PM10 (Coarse Particulate) PM2.5 – Continuous Direct measure of PM2.5 (Fine Particulate) IO3 – Speciation of Hazardous Air Pollutants (HAP) metals TO15 – Speciation of HAP Volatiles TO11A – Speciation of carbonyl HAP PM2.5 – Filter Based Total 24-hour fine particulate matter concentration. This record is intended for initial
archiving and possible secondary-PM speciation.
The continuous real-time measurements from the applicable instruments were integrated with wind speed and direction to potentially correlate spikes with the potential sources of pollutants. An aethelometer was used to measure black carbon and UV absorption (organic carbon indicator). Carbon is often linked to motor vehicles, but it also comes from several other air pollution sources, including wood smoke, vegetative detritus and in the case of the cement plant, combustion from coal. Ambient air monitoring data from the East Mountains area was compared to data from an existing network site located in the Albuquerque urban area in this report. The site (AIRS 35-001-0023) is designated as “Del Norte” and was used because it has an equipment equivalent to that being used at the East Mountains (site “EM”). The inter-network comparison is an important component of this project because it allows for a long-term monitoring reference to be utilized as a control. Pictures of the monitoring site and equipment are shown below:
Figure 3 Figure 4
Monitoring station and Ancillary Equipment Monitoring station in Relation to Plant

Final Draft
7
Figure 5 Equipment Setup in Monitoring Station
Timeline for Completion: The Air Quality Division monitored and sampled the ambient air over the course of six weeks during February and March of 2004. With the cooperation of the parties involved the continuous criteria and meteorological monitoring was extended through June 2004.
Monitoring Results
Figure 6 below shows the first through the fourth maximum values for Oxides of Nitrogen (NOX) at the EM site and the comparison site at Del Norte. The Federal allowable standard is 0.053 ppm annual arithmetic mean. The measurements at the East Mountains were only taken for 4 months, so there is no way to determine an annual mean. For comparison purposes the four highest one hour peak values were compared with the Del Norte site. The annual mean at Del Norte approaches 25% of the 0.053 ppm standard.
Figure 6
1 Hour Nitrogen Dioxide1st - 4th Max Values
3/3/04 - 4/6/04
0.53 0.530.5
0.47
0.35
0.29 0.28 0.28
0
0.6
1st Max 2nd Max 3rd Max 4th Max
Site
Con
cent
ratio
n in
PPM
Del Norte High (350010023) East Mountains (350015010)

Final Draft
8
The one hour concentration for NOx was lower in the East Mountain area than at the urban area surrounding Del Norte.
Figure 7 below shows an overview of the raw carbon monoxide (CO) data (hourly means) from both monitoring sites. Overall the CO levels for the East Mountains were lower, and after the first few weeks, just above the detection level of the instrument. The higher levels seen in the first few weeks may have been due to possible temperature inversions. Each of the peaks in the chart may be attributed to an increase in vehicular traffic i.e. “rush hour” during that time of the day.
Figure 7
One Hour Carbon Monoxide Comparison 3/1/04 to 4/7/04
0
1
2
3
1 19 37 55 73 91 109
127
145
163
181
199
217
235
253
271
289
307
325
343
361
379
397
415
433
451
469
487
505
523
541
559
577
595
613
631
649
667
685
703
721
739
757
775
793
811
829
847
865
883
901
Hours
CO
Con
cent
ratio
n (p
pm)
EM CO Del Norte High CO
The CO levels of the East mountain area were also compared to other monitoring sites in the Albuquerque urban area, as shown in figure 8. Based on the EPA criteria of 2nd max value, the East Mountain value is slightly higher than the Del Norte Comparison site but lower than other sites in the City. The Federal standard for CO averaged over an 8 hour time period is 9 ppm. When compared to the overall limit of 9.0 ppm the differences do not appear to be that significant.
Figure 8

Final Draft
9
Particulate Matter After the Division was approached with the air quality concerns in the spring of 2002, a short term study was done to determine if there was a significant dust issue around the school. The monitoring was done at site 2 (Figure 2) from June to Early August 2002. Figure 9 shows the PM levels from the 2002 short study.
Figure 9
Roosevelt 24-Hour PM 10 Data
May 10, 2002 to August 7, 2002
0
50
100
150
200
5/10
/200
2
5/17
/200
2
5/24
/200
2
5/31
/200
2
6/7/
2002
6/14
/200
2
6/21
/200
2
6/28
/200
2
7/5/
2002
7/12
/200
2
7/19
/200
2
7/26
/200
2
8/2/
2002
Day
PM 1
0 C
once
ntra
tion
(ug/
m^3
)
US EPA 24-Hour Standard, 150 ug/m 3̂
D at a M issing D ue t o M anual D at a R et r ieval Pro cess( N o Land o r C ellular Pho ne C o mmunicat io n, 8 5 o f 8 9 D ays - 9 6 % D at a C ap t ure)
**no t e** Lo o king int o p o ssib li t y o f ret r ieval
20
Study Period AveragePM 10 Concentration 20 ug/m 3̂
** See Addit ional GraphsFor Wind and PM 10 Prof iles
*
Figure 10 below shows the average PM10 concentration as measured over the course of the recent study. The combined average for EM was 17.44 ug/m3. In this case the East Mountain PM levels were also compared to existing monitoring sites with in the city. The Jefferson Corridor and North Valley monitoring stations are located near businesses such as sand and gravel mining operations that may contribute to the higher PM levels. The East Mountain PM levels overall were the lowest measured levels, including higher peak levels. None of the East Mountain results exceeded the 24-hour standard of 150 ug/m3.
Figure 10

Final Draft
10
PM10 Comparison 24 Hour Averages of East Mountains toOther PM10 data sites in Bernalillo County
3/1/04 to Present(non-validated data)
0.0
50.0
100.0
150.0
200.0
250.0
3/1/
2004
3/8/
2004
3/15
/200
4
3/22
/200
4
3/29
/200
4
4/5/
2004
4/12
/200
4
4/19
/200
4
4/26
/200
4
5/3/
2004
5/10
/200
4
5/17
/200
4
5/24
/200
4
5/31
/200
4
6/7/
2004
6/14
/200
4
6/21
/200
4
Date
Con
cent
ratio
n (u
g/m
3)
East Mountains Uptown Zuni Park Jefferson Corridor North Valley
Figure 11 below shows the series of days around which a high concentration of PM 10 was measured. Figure 12 show the associated wind rose data (1 Knot = 1.15 mph) Although the results did not exceed the 24-hour Federal standard, an hourly spike in the 2nd day approached the 150ug/m3 level. Spikes can easily be detected with continuous monitoring equipment because of the measurement frequency.
Figure 11
High PM10 Days3/19/2004 to 3/21/2003
020406080
100120140160
0 3 6 9 12 15 18 21 0 3 6 9 12 15 18 21 0 3 6 9 12 15 18 21
Time of Day (24 hr)
ug/m
Figure 12: Wind Rose Data

Final Draft
11
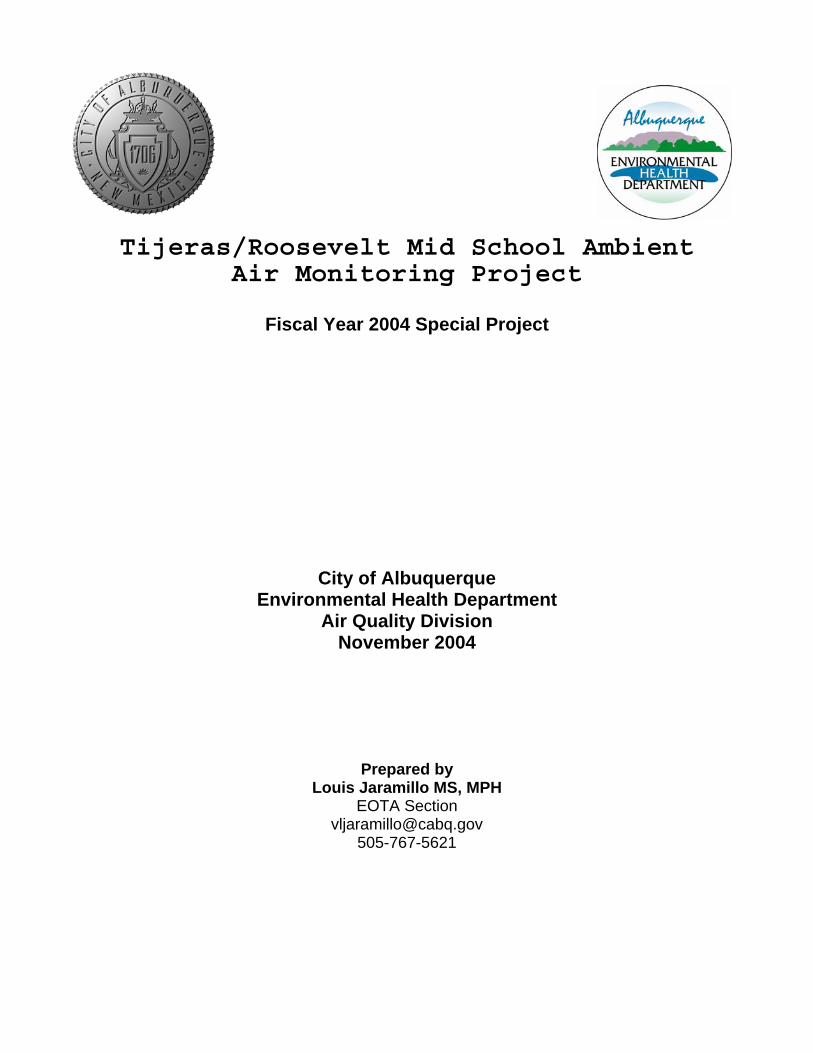
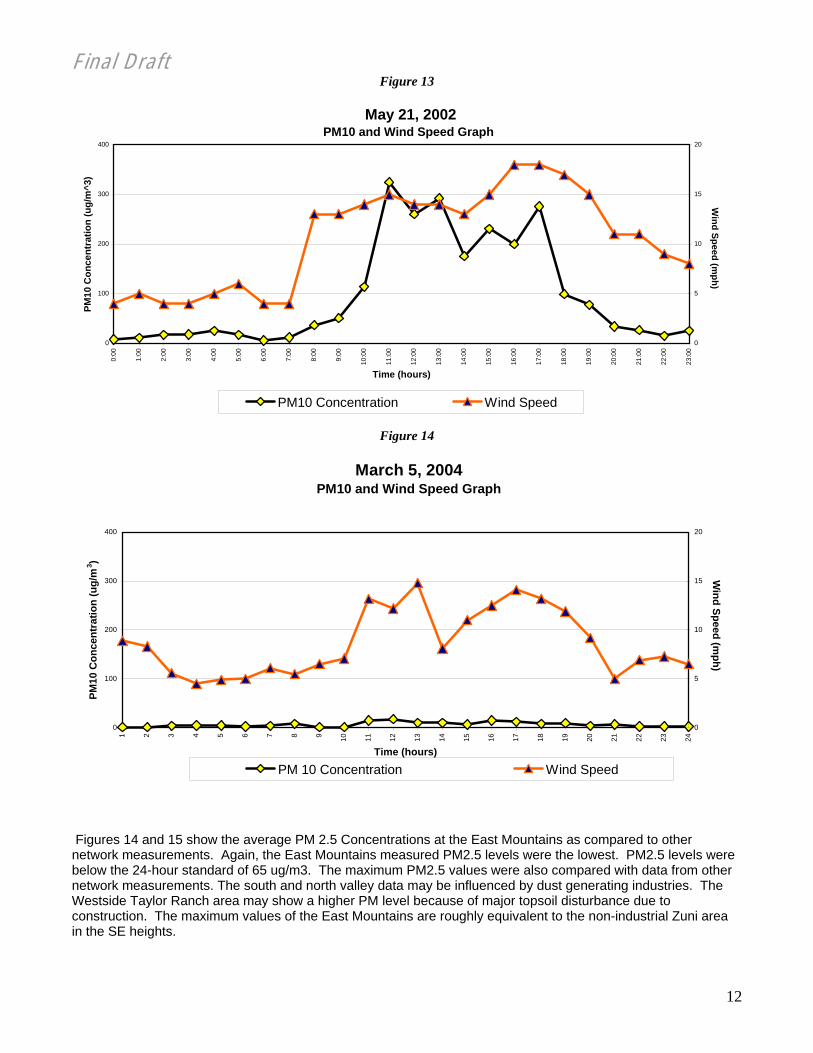
Figure 12 shows the wind speed and PM 10 concentration from a “high wind” day from the 2002 study. Figure 13 shows the comparison of a high wind day and PM 10 concentration from the 2004 study. It is notable that although the wind speeds were approximately the same, the PM 10 levels for the 2004 were considerably lower.
Final Draft
12
Figure 13
May 21, 2002 PM10 and Wind Speed Graph
0
100
200
300
400
0:00
1:00
2:00
3:00
4:00
5:00
6:00
7:00
8:00
9:00
10:0
0
11:0
0
12:0
0
13:0
0
14:0
0
15:0
0
16:0
0
17:0
0
18:0
0
19:0
0
20:0
0
21:0
0
22:0
0
23:0
0
Time (hours)
PM10
Con
cent
ratio
n (u
g/m
^3)
0
5
10
15
20
PM10 Concentration Wind Speed
Wind Speed (m
ph)
Figure 14
March 5, 2004PM10 and Wind Speed Graph
0
100
200
300
400
1 2 3 4 5 6 7 8 9 10 11 12 13 14 15 16 17 18 19 20 21 22 23 24
Time (hours)
PM10
Con
cent
ratio
n (u
g/m
3 )
0
5
10
15
20
PM 10 Concentration Wind Speed
Wind Speed (m
ph)
Figures 14 and 15 show the average PM 2.5 Concentrations at the East Mountains as compared to other network measurements. Again, the East Mountains measured PM2.5 levels were the lowest. PM2.5 levels were below the 24-hour standard of 65 ug/m3. The maximum PM2.5 values were also compared with data from other network measurements. The south and north valley data may be influenced by dust generating industries. The Westside Taylor Ranch area may show a higher PM level because of major topsoil disturbance due to construction. The maximum values of the East Mountains are roughly equivalent to the non-industrial Zuni area in the SE heights.

Final Draft
13
Figure 15
Figure 16
PM2.5 Comparison 24-HR Averages of East Mountains to other PM2.5 data sites in Bernalillo County 3/1/04 to 6/23/04
0.00
5.00
10.00
15.00
20.00
25.00
30.00
35.00
40.00
45.00
3/1/20
04
3/8/20
04
3/15/2
004
3/22/2
004
3/29/2
004
4/5/20
04
4/12/2
004
4/19/2
004
4/26/2
004
5/3/20
04
5/10/2
004
5/17/2
004
5/24/2
004
5/31/2
004
6/7/20
04
6/14/2
004
6/21/2
004
Date
Con
cent
ratio
n (u
g/m
3)
East Mountains (350015010) Uptown Zuni Park (350010019) North Valley (350011013)
Westside Taylor Ranch (350010027) South Valley (350010029)
Black Carbon

Final Draft Figure 16 shows the raw data for the black carbon levels. Overall the levels in the East Mountain area
appear to be lower, although on occasion the peak level was higher at the East Mountains. Since a major source of black carbon is combustion, one might speculate that colder temperatures in the mountains could have caused an inversion that trapped combustion products, this would include wood stoves and fireplaces as well as the cement plant and automotive traffic.
Figure 17
One Hour Black Carbon Com parison of East Mountains toDel Norte High School Black Carbon data
3/2/04 to 5/19/04(non-validated data)
0
1000
2000
3000
4000
5000
6000
7000
Hours
Con
cent
ratio
n (u
g/m
3)
EM BC Del Norte High School BC
Figure 17 shows black carbon data from 6 days during the monitoring time period. The peaks between 6 and 10 am may be associated with increased traffic and use of heating devices. The same pattern occurred between 18:30 (6:30 pm) and 22:00 (10 pm). This may be further enhanced by the occurrence of inversions in the early morning and evening. The Sat 3-03-04 data shows a large peak that might be indicative of an inversion. The meteorological data for that day indicated very low wind speed and temperatures. In addition, during the week, school busses drop off the children and are left idling during the drop off time. This could also contribute to the morning peaks.
Figure 18
24 Hour Daily Comparison
0
200
400
600
800
1000
1200
1400
1600
1800
2000
1 2 3 4 5 6 7 8 9 10 11 12 13 14 15 16 17 18 19 20 21 22 23 24
Time of day
BC
in n
g/m
3
Thur 4-8-27 Sat 4-10-04 Weds 4-14-04 Sat 3-03-04 Mon 5-17-2004 Sun 5-16-2004
Temperatures in OC High Low Avg. 03-03-04 7.0 -1.4 3.2 5-16-04 25 7.7 18.6 4-18-04 10.9 4.1 7.8
14

Final Draft
15
Hazardous Air Pollutants (HAPS) Figures 18, 19, and 20 show representative data from the air toxics monitoring utilizing the TO-15 US EPA Compendium Method for US EPA Pilot target pollutants. The compounds are benzene, chloromethane, and dichloromethane are of concern to the staff and citizens. These were detected at very low levels or not at all at the EM site. Freon 11 and Freon 12 were also detected, but these were a result of gases used for nephelometer equipment calibration.
Figure 19
Figure 20

Final Draft
16
Figure 21

Final Draft
17
All the results were in the part per billion by volume range (ppbv). Although most of the chemicals were
detected at the Del Norte site, they were generally lower or not detected at the East Mountain site. The one exception was the higher level of dichloromethane seen on 03/04/04. Although considering the scale at ppbv, this may not be significant. In general the amounts detected were very low. To put the exposure into perspective, when a person fills their automobile up at a service station, they are exposed to between 1.48 ppb to 1.29 ppm (1290ppb) of benzene (Daniel Galarneau, Health Protection Branch, Canada) Heavy Metals Figure 21 Summarizes the Heavy metal concentrations at the EM monitoring site. Manganese appeared to be the predominant metal seen. It should be noted that amounts detected were in very small amounts and that the data was scaled to show the comparative amounts.
Figure 22
Heavy Metals
0
0.005
0.01
0.015
0.02
0.025
0.03
0.035
2/27/2004 3/1/2004 3/4/2004 3/7/2004 3/10/2004 3/13/2004 3/16/2004 3/19/2004 3/22/2004 3/25/2004 3/28/2004 4/3/2004
Part
s pe
r Bill
ion
Arsenic(As) Beryllium(Be) Cadnium(Cd) Cromium(Cr) Manganese(Mn) Nickle(Ni) Lead(Pb)
Figure 22 shows a three day average comparison (3/4, 3/16, 3/28) with at city site (Del Norte). Again the amount of metals was very low. There did not appear to be a significant difference in concentration of metals between the two sites

Final Draft
18
Figure 23
Comparison of Metals
0
0.002
0.004
0.006
0.008
0.01
0.012
0.014
As Be Cd Cr Mn Ni Pb
Part
s pe
r Bill
ion
East Mountains 2zl
ugAs (Arsenic); Be (Beryllium; Cd (Cadnium); Cr (Cromium); Mn (Manganese); Ni (nickel); Pb (Lead)
Discussion of Findings Overall the measured criteria pollutants that were monitored were well below the standards. Generally the monitoring results were lower in Tijeras than two areas within the City where industrial processes are located. It appears that the standards were comparable to two residential areas located with in the city. One of the major standards of concern was the PM10 and PM 2.5, yet the average measured amounts were the lowest of all the City network measurements. The measured PM amounts would spike depending on the meteorological conditions. This raises the issue of the effect of the “spikes “ on health, especially in regards to triggering an asthma attack or some other allergic response. The black carbon component also showed similar results when compared to the rest of the City’s network. There are no enforceable standards for black carbon, but it can serve as a good indicator of combustion sources. Overall the amount of black carbon found in Tijeras was less than the comparative site (2zm) in the City. During discussions of the monitoring plan with the stakeholders, there was concern that potential higher pollution levels could be attributed to inversion conditions. However, the general case seems to be the average levels in Tijeras were considerably lower than at sites in the City. The review of the monitoring data at this point does not give clear indication of how the cement plants’ emissions affect the ambient air quality. The plant operates year-round with two kilns operating 24 hours a day except when they are shut down for maintenance. Since the plant burns coal, it would contribute some CO, NOx, and HAPS. These emissions have been measured directly and modeled at the applicable points. These measurements are well below the permit conditions. Automotive emissions and wood fires may be a larger contributor to the air quality. There is no strong evidence that the ambient air quality conditions in Tijeras Canyon contributes to reported health issues at the schools. An epidemiological investigation would help establish any possible correlation between reported illnesses and exposure to indoor and ambient air quality conditions. Nonetheless, early community involvement resulted in intervention by the school and cement plant to address potential dust issues. When the process first started, the cement plant was undergoing a major

Final Draft
19
construction project and had unstabilized tailings piles that were contributing to a visible dust problem during windy days. During the preceding months the plant finished its construction project and started reclamation procedures that mitigated the dust coming from tailings piles as well as the mining areas. The construction project was a pollution prevention project that lowered the emission stack temperatures and reduces the amounts of hazardous air pollutants forming. The success of this project might possibly be correlated with the fact that only very low levels of HAPS were detected. In the same time period, APS did a maintenance evaluation and cleaning of the HVAC system. A large amount of dust that had accumulated over an undetermined period in the HVAC system was cleaned out. APS officials mentioned at public meetings that they were going to keep a more aggressive maintenance schedule and use more effective filters on the HVAC system. This report only provided a summary analysis of the most salient data. Samples of the actual data are shown in the following appendix. The complete data set gathered by the Air Quality Division is available in electronic form (pdf).

Final Draft
20
Acronyms and Definitions Used in this Report
ACRONYMS
cc- cubic centimeters CO- Carbon Monoxide NAAQS-National Ambient Air Quality Standards O3- Ozone PM- Particulate Matter Ppb- parts per billion Ppbv- parts per billion volume/volume (1ppbv is equivalent to 1cc of compound in 1000 cubic meters of air). Ppm- parts per million µg/m3- micrograms per cubic meter
DEFINITIONS 98th Percentile- 98th percentile (used for PM2.5) means the daily value out of a year of monitoring data below which 98 percent of all the values in the group fall. 99th Percentile- 99th percentile (used for PM10) means the daily value out of a year of monitoring data below which 99 percent of all the values in the group fall. Average- Average and mean refer to an arithmetic mean Daily Daily value for PM refers to the 24-hour average concentration of PM calculated or measured from midnight to midnight. PM2.5- Particulate matter with an aerodynamic diameter less than or equal to a nominal 2.5 micrometers. PM10- Particulate matter with an aerodynamic diameter less than or equal to a nominal 10 micrometers. Year- Year refers to calendar year.
OZONE NAAQS STANDARDS 1-hr Ozone National 1-hour primary and secondary ambient air quality standard for ozone is 0.12 ppm. The third decimal place of the computed value is rounded, with values equal to or greater than 5 rounding up. 8-hr Ozone National 8-hour primary and secondary ambient air quality standard for ozone is 0.08 ppm. The 3-year average annual fourth-highest daily maximum 8-hour average ozone concentration is used to compare to the Federal Standard. The third decimal place of the computed value is rounded, with values equal to or greater than 5 rounding up. Thus, a computed 3-year average ozone concentration of 0.085 ppm is the smallest value that is greater than 0.08 ppm.
CARBON MONOXIDE NAAQS STANDARDS 1-hr CO 35 ppm. Comparison of the data with the levels of the standards in parts per million shall be made in terms of integers with fractional parts of 0.5 or greater rounding up. 8-hr CO 9 ppm. The highest of the 2nd Maximum value for the most recent two years is used for comparison with the NAAQS. Comparison of the data with the levels of the standards in parts per million shall be made in terms of integers with fractional parts of 0.5 or greater rounding up.
PARTICULATE MATTER NAAQS STANDARDS Annual PM10- The annual PM10 standard is met when the 3-year average of the annual mean PM10 concentrations at each monitoring site is less than or equal to 50 µg/m3. The 3-year average of the annual

Final Draft
21
means is determined by averaging quarterly means to obtain annual mean PM10 concentrations for 3 consecutive, complete years at each monitoring site. 24-hr PM10- The 24-hour PM10 standard is met when the 3-year average of the 99th percentile values at each monitoring site is less than or equal to 150 µg/m3. This comparison shall be based on 3 consecutive, complete years of air quality data. Annual PM2.5- The annual PM2.5 standard is met when the 3-year average of the spatially averaged annual means is less than or equal to 15.0 µg/m3. The 3-year average of the spatially averaged annual means is determined by averaging quarterly means at each monitor to obtain the annual mean PM2.5 concentrations at each monitor, then averaging across all designated monitors, and finally averaging for 3 consecutive years. 24-hr PM2.5- The 24-hour PM2.5 standard is met when the 3-year average of the 98th percentile values at each monitoring site is less than or equal to 65 µg/m3. This comparison shall be based on 3 consecutive, complete years of air quality data.

Final Draft
22
Appendix The data for this project was quite voluminous, therefore it will be available in electronic format (pdf). Most of the data gaps were usually due to equipment down time that can be verified by station logs kept by the monitoring staff. The Division is open to discussion on any data integrity issues