timber mapping for site-specific forest management
TRANSCRIPT

The authors are solely responsible for the content of this technical presentation. The technical presentation does not necessarily reflect the official position of the American Society of Agricultural and Biological Engineers (ASABE), and its printing and distribution does not constitute an endorsement of views which may be expressed. Technical presentations are not subject to the formal peer review process by ASABE editorial committees; therefore, they are not to be presented as refereed publications. Citation of this work should state that it is from an ASABE meeting paper. EXAMPLE: Author's Last Name, Initials. 2007. Title of Presentation. ASABE Paper No. 07xxxx. St. Joseph, Mich.: ASABE. For information about securing permission to reprint or reproduce a technical presentation, please contact ASABE at [email protected] or 269-429-0300 (2950 Niles Road, St. Joseph, MI 49085-9659 USA).
An ASABE Meeting Presentation Paper Number: 071093
Timber Mapping for Site-Specific Forest Management
Christian Brodbeck Auburn University, 200 Tom Corley Building, Auburn, AL 36849, [email protected]
John Fulton Auburn University, 200 Tom Corley Building, Auburn, AL 36849, [email protected]
Joey Shaw Auburn University, 202 Funchess Hall, Auburn, AL 36849, [email protected]
Timothy McDonald Auburn University, 200 Tom Corley Building, Auburn, AL 36849
Donn Rodekohr Auburn University, 202 Funchess Hall, Auburn, AL 36849
Written for presentation at the 2007 ASABE Annual International Meeting
Sponsored by ASABE Minneapolis Convention Center
Minneapolis, Minnesota 17 - 20 June 2007
Abstract. The adoption of precision agriculture technologies and site-specific management has been limited in the forest industry. Geographic information systems (GIS) and remote sensed imagery have been used in forest management, but at a landscape scale, typically to prescribe and schedule treatments for a diverse collection of relatively large tracts. Individual stands have traditionally been treated uniformly based on their most prevalent characteristics. Sub-stand variability has most often been studied as something for which an efficient inventory sampling strategy can compensate, not as being suggestive of a treatment regime to maximize revenue or ecological benefits. This paper develops a method to generate a site-specific database

The authors are solely responsible for the content of this technical presentation. The technical presentation does not necessarily reflect the official position of the American Society of Agricultural and Biological Engineers (ASABE), and its printing and distribution does not constitute an endorsement of views which may be expressed. Technical presentations are not subject to the formal peer review process by ASABE editorial committees; therefore, they are not to be presented as refereed publications. Citation of this work should state that it is from an ASABE meeting paper. EXAMPLE: Author's Last Name, Initials. 2007. Title of Presentation. ASABE Paper No. 07xxxx. St. Joseph, Mich.: ASABE. For information about securing permission to reprint or reproduce a technical presentation, please contact ASABE at [email protected] or 269-429-0300 (2950 Niles Road, St. Joseph, MI 49085-9659 USA).
using ground-based and LiDAR data to estimate individual tree volume to create a timber yield map. Tree diameter at breast height (DBH) was hand measured for each tree across a 3.6 ha site and then LiDAR data was used to estimate individual tree height. Tree location and elevation across the site were determined using a total station. Random tree height measurements were collected and correlated to the LiDAR data (R2=0.57) while the DBH and height for each tree were then used to compute individual tree volume. Finally, management zones were developed based upon the timber yield map to illustrate how database could be used for site-specific management.
Keywords. Forest management, GIS, Precision forestry, Site-specific, Remote sensed imagery

2
Introduction In an agricultural setting, producers have always known that variability existed within each field that impacted yields from pass-to-pass. Due to the development and adoption of global positioning system (GPS) and yield monitors for agriculture, producers can now measure this variability and use the data as an aide in creating management zones that are used to make decisions, not on a farm scale, but on a within field scale (Casady et. al., 1998). Using this information in a geographic information system (GIS), producers are able to pin-point areas of high yields versus low yields and manage for this, on a site-specific scale, in hope of increasing overall yields. Applying these technological concepts in a forest setting is a process that the forest industry has been very slow to adopt.
The forest industry has started to utilize GIS and remote sensed imagery as a management tool; however, it is applied at the landscape scale. Treatments are scheduled and prescribed uniformly on a tract-to-tract scale based on the most prevalent stand characteristics without the knowledge of what may be occurring on a site-specific scale. Attempting to put numbers on sub-stand variability (stem volume variation) has not been viewed as a method for suggesting treatment regimes in the effort of maximizing revenues or ecological benefits.
The use of LiDAR to determine individual tree parameters is a technique that scientists have recently started to study within the last decade. Lim et. al. (2001) used LiDAR to relate laser tree height estimates with for individual tree heights on a local scale. In this study the architecture of individual tree crowns, primarily deciduous trees, were delineated using a LoG filter. A LoG filter is a combination of Gaussian and Laplacian filters which uses the image to calculate the second spatial derivative. By knowing the individual crowns, Lim et. al. were able to determine if the trees were slanted or identified as a sub-canopy tree. In this study it was found that LiDAR can be used effectively to determine individual tree heights on a small-scale, however the possibility of tree height underestimation and overestimation, as was also observed in this study, is a possibility. A similar study (Falkowski et. al., 2006) used LiDAR data to estimate tree heights and crown diameters by applying a different, more unique, set of algorithms to the data. In this study a 2D spatial wavelet analysis (SWA) method was utilized to automatically determine the location, height, and crown diameter of individual trees. Falkowski et al. (2006) discuss’ the fact that LiDAR data does have the potential of providing high-precision data at the sub-canopy scale, however it remains difficult to accurately identify individual tree attributes in closed or multistory stands. Due to these difficulties, this study compared the wavelet analysis and a LiDAR-based tree extraction and measurement technique developed by Popescu et al. (2003), which implements variable window filters (VFW) to detect and measure individual trees, are utilized to measure individual trees and then compared to field reference measurements. This study found that both VFW and SWA underestimated the height of individual trees and there was a negative bias of 6% and 4%, respectively. However, it was also concluded that low-density LiDAR data can augment traditional forest inventories in open forest stands by providing reliable remote measures of individual tree heights. The goal of this study is to develop site-specific data on a tract of timber than can be used for timber management. The first objective of this study was to develop the site-specific database by collecting information for individual trees. The second objective was to compare two new strategies that utilize site-specific information and remote sensed imagery, in particular LiDAR, to develop stand volume to a traditional sampling strategy known as a timber cruise. Finally, this paper suggests a method to practically collect and utilize site-specific data in creating a timber yield map that may be used as a management tool for future decision making.

3
Methods
Study Site
The site selected for this study was a 3.6 hectare tract located 9.6 km north of Auburn, AL at the Caterpillar Training Center. The site is a 25-year old conifer tract composed of planted loblolly pine (Pinus taeda) with an average of 638 trees/ha (Figure 1). During site preparation the tract received an herbicide treatment and has since been thinned once. The tract has been managed for timber production with a single commercial fifth-row thinning at age 16. Soil types found on the site consist of 8 types of sandy clay loam soils and one type of a sandy loam soil with slopes ranging from 1-17% across the varying soil types.
Figure 1. Study site boundary overlaid onto an aerial image.
Development of Site-Specific Database
The field data collected in order to meet the first objective of developing a site-specific database included measuring individual tree positions (x,y,z), tree diameter at breast height (DBH), total tree height, and elevation. Every tree greater than or equal to 12 cm within the 3.6-ha site was measured.
Initially, all trees were labeled and assigned an identification number in order to treat each tree uniquely. The position of each tree was measured utilizing a three step process in order to eliminate potential errors associated with using GPS under a forest canopy. First, in an open field about 100 meters south of the study site, a Trimble 5700 RTK GPS was used to establish two sub-centimeter accurate control survey points. Next, a Trimble 5600 Robotic direct reflex total station was set-up over one control point and used the second control point as a back sight. Using the total station and a prism, 14 control points were established within the 3.6 ha tract, all with sub-centimeter accuracy. Finally, moving the total station from control point-to-control point and the prism from tree-to-tree, every tree location was measured with sub-centimeter accuracy in the x, y, and z directions. Within the tract, 2302 trees were identified, measured, and health and deformation characteristics recorded for each stem. Since the tree locations were all measured with sub-centimeter accuracy, the elevation data across the site was taken from the z measurement of each tree position.
The diameters (DBH) and heights of individual trees across the study site were measured using conventional methods and recorded based on the individual identification numbers. The diameter of each tree was measured using calipers with two measurements (separated by 90º)

4
and then averaged to the nearest ¼ cm. Tree heights were measured on just over 20% (494) of the trees selected at random using a Contour XLR laser rangefinder set at 3-point height measurement. The tree heights were measured within the same week as the Light Detection and Ranging (LiDAR) data was aerially collected in order to eliminate any error related to growth.
Conducting a Typical Timber Cruise
A typical cruise is the traditional method used to estimate stand volume. A cruise was initially conducted across the study site to calculate the tract volume of the pine stand. A typical timber cruise is a statistical sample taken by measuring tree DBH and height on plots that are of predetermined size and distribution (Avery and Burkhart, 1994). The typical approach for cruising is the line-plot system which consists of 0.08 ha (1/5 ac) to 0.04 ha (1/10 ac.) circular plots distributed in a square or rectangular pattern. For this study, it was determined that the nominal cruising percentage would be 10%, meaning that 10% of the total area of the tract would be measured using .04 ha (1/10 ac) plots. The plots were distributed in a rectangular pattern as show in Figure 2 with each plot radius being 11.3 m (37.2 ft).
Figure 2. Illustration of the traditional timber cruise plot locations established for this site.
All trees within each plot had their DBH and total height measured. The DBH used was that which was measured during the development of the site-specific database. Since not all heights were measured during the development of the site-specific database, the heights for all the trees on the plots were measured (Figure 2). Total height was used for the typical timber cruise so that the same volume equations could be used in all three methods of developing stand volume. Once all the plots had been measured, the volume of each tree on each plot was calculated and summed to determine the volume of all the trees on a plot. The volume equation and coefficients (Clark and Souter, 1996) used were as follows:
Volume = B0 * DBH² * Height (1)
where: B0 = Coefficient for pulpwood or sawtimber
B0 = 0.0023233 (Pulpwood)
B0 = 0.0020521 (Sawtimber)
This value was then extrapolated to the entire 3.6 ha tract to develop a total tract volume.

5
Linear Regression Height Model
The second method for estimating stand volume included developing a linear regression height model to calculate individual stem height and then total stand volume. To accomplish this, the 20% (494) trees with known heights were plotted as DBH vs. Height. A best-fit straight line was added and set to display the linear equation y = m*DBH + Height as well as an R² in order to determine the reliability of the linear equation. Next, all DBH values were used in the linear equation to calculate the unknown heights, y for all stems across the site. Using the volume equation (1), individual stem volume was calculated and then summed for the tract.
LiDAR Assigned Height
The third method used to calculate stem and stand volume was by using LiDAR data to assign heights to individual stems. The LiDAR data was purchased from a commercial company and provided as two datasets, Bare Earth and First Returns. The Bare Earth dataset represented the ground surface and the First Return dataset represented the canopy surface. The first step in this process was to create a bare earth digital elevation model (DEM) that would remain constant throughout the entire LiDAR analysis. Using the 3D Analyst extension of ArcToolbox within ArcGIS v9.2, the “Topo to Raster” function was utilized to convert point data to a raster. The defaults were used for output cell size, output extents, and margin in cells while the Drainage Enforcement was set to “No Drainage” and the Primary Type of Input Data was set to “Spot”. From this, a DEM of the ground surface was created and used for all remaining LiDAR height analysis.
The second step of the process included developing a method of assigning heights to the individual stems based on the LiDAR’s First Return dataset. Heights based on LiDAR analysis (from varying approaches) were compared to individual trees with known heights to determine the effectiveness of the scenarios and approaches used. This method was approached by utilizing two different scenarios. The first scenario utilized the true x and y position of each tree and the individual LiDAR points within the vicinity of the tree to assign a height. The second step utilized the LiDAR data to create a Canopy Surface Model (CSM) to assign each tree, based on its x and y position, a height based on the CSM and a ground value based on the DEM.
Assigning heights for the first scenario lead to difficulties in determining which of the 30,000+ LiDAR points represented the actual height of the 2302 trees in the tract. Three different approaches were used in determining which LiDAR values to assign to individual trees and then checked by plotting the LiDAR predicted height against the actual measured height. In all three approaches, the first step was to place a 1.5 m buffer around all 494 trees with known heights and delete any LiDAR data not within this buffer. The three approaches used in assigning LiDAR based height values were to assign a height based on the LiDAR point closest the actual tree position, assign a height based on the LiDAR point with the largest z-value within the buffer, and finally, to average the z-values for all LiDAR points within the buffer and assign the averaged value as the actual tree height. LiDAR predicted heights were then plotted against actual measured heights and R² values calculated to determine the effectiveness of each approach.
The second scenario was to create a model representing the canopy surface and use this model to assign heights to the trees. Three different algorithms were used to develop the CSM and, as before, the height values assigned to each tree were compared to their actual heights. The first step was to create a Bare Earth column in the First Return dataset and assign each LiDAR point a bare earth value. Subtracting the Bare Earth z-value from the First Return z-value gave a value that related to individual tree heights. It was assumed that all trees were

6
over 9 m tall, so all values less than 9 m were deleted from the First Return dataset. Next, using raster interpolation in the 3D Analyst extension of ArcToolbox, the three algorithms were used to develop the CSM. The first algorithm used was Kriging with the semivariogram model set to Gaussian. The second algorithm used was the Inverse Distance Weighed (IDW) with all parameters set to default. The third algorithm used in creating the CSM was the Natural Neighbor with the default parameters once again used. With three different CSM’s, the next step was to assign heights to individual trees. This assignment was accomplished by using the Extract Values to Points feature within the Spatial Analyst extension of ArcToolBox. The first step was to extract a Bare Earth z-value based on the DEM for each of the 494 trees. Secondly, z-values were extracted from each CSM and assigned to each tree. Taking the difference between each CSM z-value and Bare Earth z-value, individual tree heights were calculated and then compared to the actual measured heights. Effectiveness of each CSM was determined by calculating and comparing R² values.
With R² values calculated for all six approaches within the two scenarios, comparisons were made as to which approach was the most effective. The approach with the largest R² value was selected and its methodology applied in assigning tree heights to all 2302 trees. With all tree heights estimated, stem volumes were calculated using equation (1).
Results
Development of Site-Specific Database
On the 3.6 ha tract, 2,356 trees were identified and their DBH, location, and any non-ordinary parameter recorded. Of the 2,356 trees, 54 were identified as dead, leaving a 2302 to be used for the study. The DBH for the trees ranged from 11 cm to 51 cm with the heights (20% or 494 trees) ranging from 9 m up to 25 m. The trees were separated into classes based on DBH and timber market classes (Figure 3).
Figure 3. Map of individual tree DBH by market class.

7
Typical Cruise
On the nine 0.04 ha plots, there was an average 27 trees/plot which was calculated to average 664 trees/hectare. Using equation 1, the calculated volume per hectare was 209.4 m³ with a total volume for the tract equal to 753.8 m³ (Table 1).
Linear Regression Height Model
The plot to determine a linear relationship between DBH and height consisted of 494 trees all with diameters above 12 centimeters. Plotting DBH on the x-axis and Heights on the y-axis and fitting a best-fit straight line to it (Figure 4) returned a R² value of 0.40 for the following regression equation:
y = 0.253x + 12.689 (2)
Class > 12y = 0.253x + 12.689
R2 = 0.3971
5
10
15
20
25
10 15 20 25 30 35 40 45
DBH (cm)
Mea
sure
d H
eigh
t (m
)
Class > 12
Class > 12
Figure 4. Plot of measured heights versus measured DBH for all trees greater than 12
centimeters.
The linear regression indicated a poor relationship but the slope is statistically significant. The diameters for trees with known heights were used in equation (2) to calculate predicted heights. The calculated individual stem heights ranged from 15 m to 25 m. These predicted heights were plotted against the actual heights determining a model effective R² value of 0.40 (Figure 5). Using the model predicted heights and DBH, the calculated volume (using equation 1) per hectare was 209.0 m³ and the sum of the individual stem volumes was 752.4 m³ (Table 1).

8
y = 0.3971x + 11.164R2 = 0.3971
10
15
20
25
5 10 15 20 25 30
Actual Height (m)
Reg
ress
ion
Pred
icte
d H
eigh
t (m
)
Figure 5. Plot of measured heights versus regression predicted heights.
Table 1. Summary of volumes by method. -------------- Volume (m³) --------------
Method Average per Stem
Average per Ha. Total
Typical Cruise NA 209.4 753.8
Model Predicted Heights
0.35 209.0 752.4
LiDAR Predicted Heights
0.33 224.4 807.8
LiDAR Assigned Height
The heights calculated utilizing the three approaches of the first scenario were compared to the known heights. The first two approaches of assigning heights based on the LiDAR point closest the actual tree position and assigning heights based on the LiDAR point with the largest z-value within the buffer had R² values of 0.43 and 0.40, respectively. The third approach, averaging the z-values for all LiDAR points within the buffer and assigning this value as the actual tree height, had the largest R², 0.53, of the three approaches in the first scenario (Figure 6).
9
y = 0.5621x + 9.3306R2 = 0.5349
10.00
15.00
20.00
25.00
30.00
5.00 10.00 15.00 20.00 25.00 30.00
Acutal Height (m)
Lida
r Hei
ght (
m)
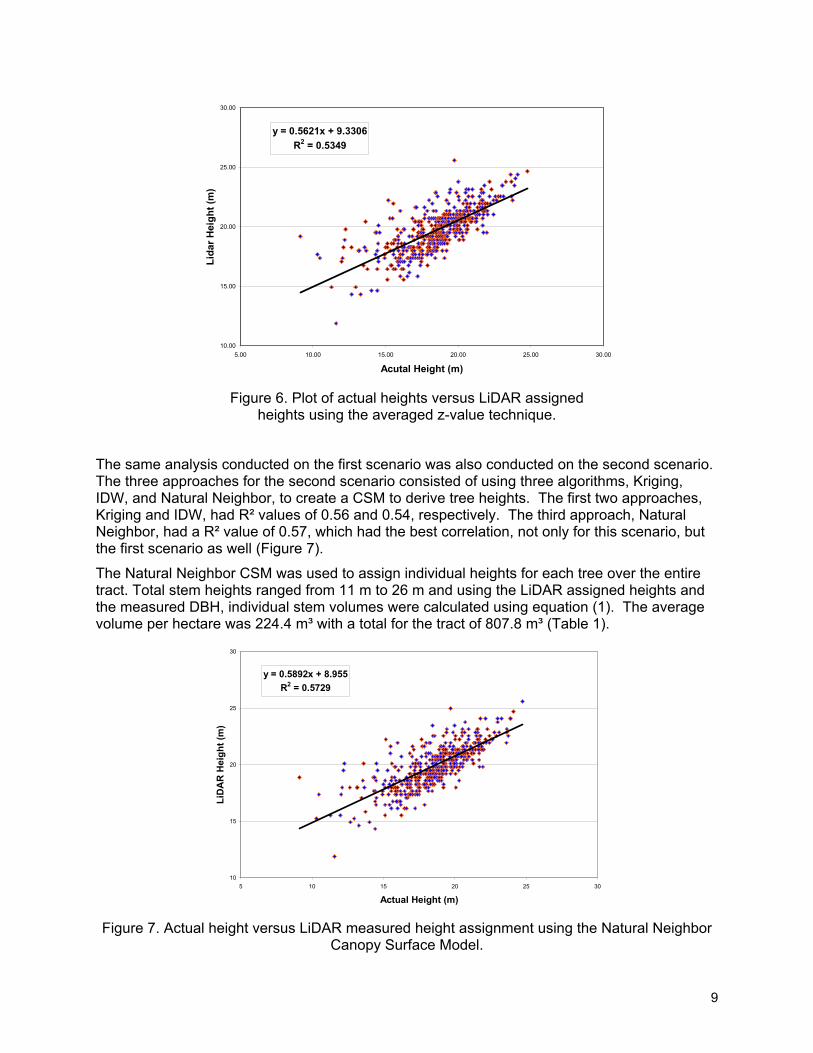
Figure 6. Plot of actual heights versus LiDAR assigned
heights using the averaged z-value technique.
The same analysis conducted on the first scenario was also conducted on the second scenario. The three approaches for the second scenario consisted of using three algorithms, Kriging, IDW, and Natural Neighbor, to create a CSM to derive tree heights. The first two approaches, Kriging and IDW, had R² values of 0.56 and 0.54, respectively. The third approach, Natural Neighbor, had a R² value of 0.57, which had the best correlation, not only for this scenario, but the first scenario as well (Figure 7).
The Natural Neighbor CSM was used to assign individual heights for each tree over the entire tract. Total stem heights ranged from 11 m to 26 m and using the LiDAR assigned heights and the measured DBH, individual stem volumes were calculated using equation (1). The average volume per hectare was 224.4 m³ with a total for the tract of 807.8 m³ (Table 1).
y = 0.5892x + 8.955R2 = 0.5729
10
15
20
25
30
5 10 15 20 25 30
Actual Height (m)
LiD
AR
Hei
ght (
m)
Figure 7. Actual height versus LiDAR measured height assignment using the Natural Neighbor
Canopy Surface Model.

10
Discussion At first glance, the R² values that ranged from 0.40 to 0.57 appeared to be very low resulting in poor correlations. Using remotely sensed data to estimate tree heights is a very difficult task because of the large variation in natural tree and tract parameters. Individual tree parameters such as lean, dominance, and overtopping, and tract parameters such as species and basal area vary within a tract and from tract-to-tract. This variation was difficult to model when the manipulation of data, such as removing suppressed and intermediate trees as well as compensating for lean, was minimized.
In this study, an acquired a R² value of 0.57 using the Natural Neighbor algorithm to create a CSM and determine individual tree heights was a more than satisfactory achievement, with results of high enough quality to calculate volumes. In many studies LiDAR tended to underestimate tree heights (Lim et. al., 2001), however in this study, that was not the case. In this study, 56% of the tree heights were within 2 m of the actual height of the tree, with 16% being underestimated by up to 2 m. Overestimation occurred in a few cases with trees being overestimated by as much as 9 m. Tree heights that were largely overestimated tended to be trees that were classified as suppressed or intermediate. The overestimation of heights for suppressed and intermediate trees in a dense stand, such as this one, is expected because of LiDAR data captured the limbs of dominant and codominant trees that were overtopping the shorter trees. If all trees classified as suppressed or intermediate were removed from the data set and the LiDAR data only applied to dominant and codominant trees, then a much higher R² value would be expected. However, without removing the natural variability of the stand, an R² value of 0.57 is acceptable
The LiDAR data was used to calculate volumes and were compared to volumes calculated using a linear regression model and typical cruise and it was found that all three methods returned values that were very similar. The fact that the volume calculated using LiDAR measured heights was very similar to the cruise estimated volume was encouraging. It was encouraging because it signified that using LiDAR to aide in calculating volumes is a viable option.
Using the individual stem volumes, a yield map was created of the 3.6 ha site (Figure 8). The map delineated within stand variability and could be used as a basis for future management decisions. For example, on the east side of the stand (zone 4), the hardwood competition was rather high, out-competing some of the pine trees. While in the center of the stand (zone 3), there appeared to be too much with-in pine competition meaning that a second thinning or a heavier first thinning may have been required. On the west side of the tract (zone 1), the productivity was poor, probably resulting from poor soils due to erosion. Finally, there was acceptable growth in the north part (zone 2) of the stand.

11
Figure 8. Individual tree volume map along with delineated management zones.
Currently, conducting a timber cruise is the traditional and commercially accepted method for estimating stand volume and value. The downside to utilizing this method is that the resulting volumes are on a per tract/stand basis (a single number) thereby not capturing site-specific or within-stand variability. As of now, the application of LiDAR in this study would not replace the traditional timber cruise. The reason for this speculation is because the individual tree DBH that is required to complete the analysis is a parameter that is very labor intensive to acquire and on a larger scale is uneconomical due to the high costs that would be incurred collecting this data. However, in the near future, some technological breakthroughs in the machine industry may allow this site-specific information to be collected in a timely and economical manner allowing it to be a possibility.
Practical Application Using LiDAR data to assist in determining individual tree volumes, large amounts of data must be collected. For this approach to be successful, the location (x and y) and DBH of each tree must be measured. The only time each mature tree within a stand is visited is during harvest signifying that the necessary data would have be acquired at this time in order to make within stand variability determination feasible. So, the question arises as to how this data can be collected during harvest and utilized to calculate volumes. Current research on a partner project is focusing on mounting a GPS on a feller-buncher that has been outfitted with a diameter sensor and on-board computer, pre-loaded with a LiDAR based DEM and CSM, allowing the volume calculations to be made as each tree is harvested. The computer, based on location (x and y from the GPS) and DBH (from the sensor) can then use the LiDAR DEM and CSM to calculate a tree height to use for volume calculation. By inputting market figures, the computer could also calculate value per stem, hectare, or tract. Using this process, a accurate volume map could be generated allowing the landowner to delineate existing spatial patterns within a stand, such as high yield and low yielding areas. This project is still in the preliminary phases with hopes of commencing testing in the near future.

12
Conclusion Development of a site-specific database can have benefits for the forest industry. Using LiDAR to measure tree heights and compute individual stem volumes to create a site-specific database can be a tool that impacts future within stand management decisions in hopes of maximizing timber growth and ultimately volume. Results indicated that the development a site-specific database was a quick and efficient way of noting stand density and uniformity. The LiDAR estimated heights demonstrated a good correlation (R2=0.57) to field measured heights using the Natural Neighbor algorithm to calculate the canopy surface model. This method of using LiDAR to compute individual tree volume yielded similar results to that of a traditional timber cruise for the stand volume estimate. Utilizing LiDAR as a management aide is currently possible on small-scale forest applications, however for it to be beneficial and economical on a larger scale further research will have to be conducted. Areas of further research should focus on the practical application, primarily on the data collection and data processing side, in an attempt at developing an effortless method of acquiring and processes large datasets.
References ArcGIS. 2006. ArcMap-ArcInfo. Ver 9.2. Charlotte, NC: ESRI, Inc. Avery, T. E., and Burkhart, H. E. 1994. Forest Measurements. 4th ed. Boston, Massachusetts:
McGraw-Hill. Cassady, W., Ellis, C., and Shannon, K. 1998. Precision agriculture: yield monitors. Water
Quality 451. University Extension, University of Missouri-System. Clark, Alexander Ill and Souter. Ray A. 1996. Stem cubic-foot volume tables for tree species in
the Gulf and Atlantic Coastal Plain. Research Paper. SE-294. Asheville, NC: U.S. Department of Agriculture, Forest Service. Southern Research Station. 105 p.
Lim, K., P. Treitz, A. Groot, and B. St-Onge. 2001. Estimation of individual tree heights using LiDAR remote sensing. Proceedings of the Twenty-Third Annual Canadian Symposium on Remote Sensing, Quebec, QC, August 20-24, 2001.
Falkowski, M.J., Smith, A.M.S., Hudak, A.T., Gessler, P.E., Vierling, L.A., Crookston, N.L. 2006. Automated estimation of individual conifer tree height and crown diameter via two-dimensional spatial wavelet analysis of LiDAR data. Canadian Journal of Remote Sensing. Vol. 32, No. 2, pp.153-161.
Popescu, S.C. and Wynne, R.H. 2003. Measuring Individual tree crown diameter with LiDAR and assessing its influence on estimating forest volume and biomass. Canadian Journal of Remote Sensing, Vol. 29, No. 5, pp. 322-334.